THE SILSDEN CROSSED FIELD ANTENNA . Extracts from … · 6.CDL /KAT Graph of VSWR versus ... For...
17
THE SILSDEN CROSSED FIELD ANTENNA . Extracts from the report on the performance of an elevated 8 Metre CFA constructed and tested at Silsden in West Yorkshire.
Transcript of THE SILSDEN CROSSED FIELD ANTENNA . Extracts from … · 6.CDL /KAT Graph of VSWR versus ... For...

THE
SILSDEN
CROSSED
FIELD
ANTENNA .
Extracts from the report on the performance of
an elevated 8 Metre CFA constructed and tested
at Silsden in West Yorkshire.

Extracts from Silsden CFA Report
Schedule of Contents.
1. Introduction.
2. CDL/KAT and Arqiva Ltd. Test results.
3. Interpretation of results.
4. Comparison of Results and Conclusions.
APPENDICES.
3a. Ground Wave Attenuation Curves.
4.CDL/KAT Table of Field Strength Measurements.
5.CDL Graphs of Field Strength versus Distance (10 mS/s)
5a.CDL Graphs of Field Strength versus distance ( 7 mS/s)
6.CDL /KAT Graph of VSWR versus Frequency (CFA)
7.CDL /KAT Smith Chart 7& Impedance Graphs. (CFA)
8. ArQiva Table of Field Strength Measurements
9.Arqiva graphs of Field Strength versus Distance (10mS/s)
9a. Arqiva graphs of Field strength versus distance (7mS/s)
10. Arqiva Smith Chart. (CFA)
11. Arqiva Graph showing VSWR versus Frequency.(CFA)
Note:- All the graphs and charts were prepared by CDL, to be in the same format,
using the results of measurements made by CDL/KAT and Arqiva Ltd.

CFA Report Extracts
A. INTRODUCTION
During the period August 2008 to September 2009 Communications
Dynamics (I.o.M.) Limited and Kabbary Antenna Technology ( Egypt) cooperated
in the construction and testing of a number of crossed field antennas at Silsden in
West Yorkshire. The purpose of these test was to establish :-
1.1 The Bandwidth and Relative Emission Efficiency of CFA’s when
positioned on the ground and when elevated to simulate mounting above a
transmitter or other building.
1.2 To determine the size versus frequency ratios for efficient operation.
1.3 To investigate and record near and far field emission characteristics with a
view to confirming Field strength versus Distance characteristics
1.4 To confirm omni-directional emission characterstics.
On conclusion of the CDL/KAT tests a company called ARQIVA Ltd.
(recommended by OFCOM ) was invited to conduct tests on an 8 metre elevated
CFA in the expectation of independent confirmation of the CDL/KAT results.
B. “CDL/KAT “ and “ Arqiva Ltd.” Test Results.
The recorded results of the tests conducted by the are reproduced in graphic
and table form .
For CDL/Kat Results refer to Appendices 4,5,5a, 6 and 7.
For Arqiva Limited Results refer to Appendices 8,9,9a,10 and 11.
Also Refer to Appendix 3a.

C. Interpretation of results.
When comparing the performance of a real antenna with that of a
theoretically perfect antenna it is important to take into account all the factors
which may affect the real antenna and apply these to the theoretical model.
To enable this comparison and take into account the effects of ground
conductivity and distance Appendix 3a was prepared to show Inverse Distance
attenuation and attenuation due ground conductivities of !0mS/s and 7 mS/s.
The relative emission efficiency is determined by comparing the actual field
strength readings for the antenna under test with those which would be obtained
for the theoretically perfect antenna suffering the same ground wave
attenuation. Both the CDL/KAT and Arqiva results are plotted on this basis.
D. Comparison of Results and Conclusions.
Tests were conducted by CDL/KAT between 23rd
and 26th September 2009
to confirm earlier results prior to the tests conducted by Arqiva on 28th
September 2009. The results of tests at 1,593 kHz. are shown in the indicated
appendices.
Whilst there are slight differences in the settings for the CFA on the two
dates it is immediately evident that the Arqiva results are a clear confirmation
of those obtained by CDL/KAT.
The conclusions reached from examination of these verified results are :-
1. The elevated 8 metre CFA has a Relative Emission Efficiency at 1,593 kHz.
which is at least equal to that of of a full size Lambda / 4 Vertical monopole
.(At 1,593kHz Lambda/4 is 47 metres)
2. The CFA performance complies easily with VSWR and Bandwidth
requirements set by the OFCOM engineering code. (VSWR must be less
than 1.5 for f carrier + or- 4.5 kHZ. )
Note . The results of CFA Size versus Frequency and the near field
measurements are confidential to CDL/KAT but it is evident from the reported
signal strengths that close to a 1/d characteristic was achieved.
For more information refer to the full 28 page report on the KAT Web site.
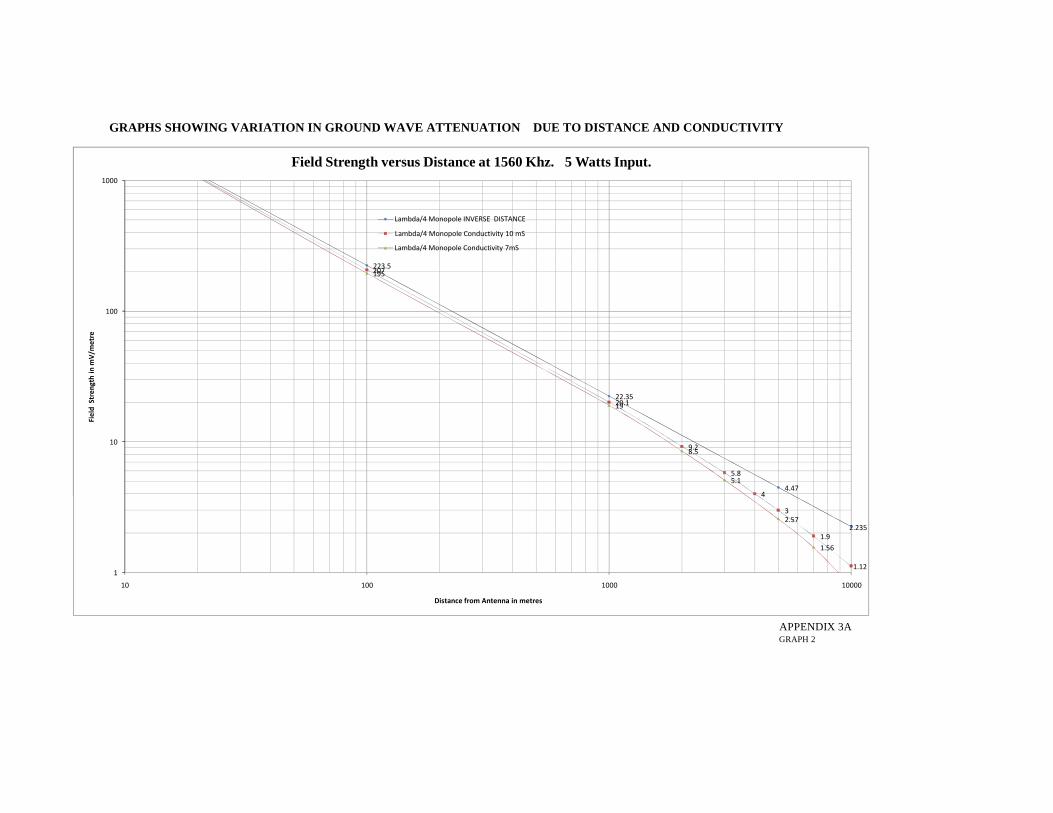
GRAPHS SHOWING VARIATION IN GROUND WAVE ATTENUATION DUE TO DISTANCE AND CONDUCTIVITY
223.5
22.35
4.47
207
20.1
9.2
5.8
4
195
19
8.5
5.1
10
100
1000
Fie
ld S
tre
ng
th i
n m
V/m
etr
e
Field Strength versus Distance at 1560 Khz. 5 Watts Input.
Lambda/4 Monopole INVERSE DISTANCE
Lambda/4 Monopole Conductivity 10 mS
Lambda/4 Monopole Conductivity 7mS
APPENDIX 3AGRAPH 2
223.5
22.35
4.47
2.235
207
20.1
9.2
5.8
4
3
1.9
1.12
195
19
8.5
5.1
2.57
1.56
1
10
100
1000
10 100 1000 10000
Fie
ld S
tre
ng
th i
n m
V/m
etr
e
Distance from Antenna in metres
Field Strength versus Distance at 1560 Khz. 5 Watts Input.
Lambda/4 Monopole INVERSE DISTANCE
Lambda/4 Monopole Conductivity 10 mS
Lambda/4 Monopole Conductivity 7mS

CDL/KAT~ FIELD STRENGTH MEASUREMENTS~ TABLE OF RESULTS
26th September 2009. 8 metre Elevated Crossed Field Antenna. Frequency 1,593 KiloHertz.Input Power to Antenna 5Watts RMS (Unmoduted Carrier) Nominal Input Impdance 50 Ohms.
Field Strength Measurements with Potomac FIM 41 Serial No. 622.
Generally to South and West of CFA
Point No. Description of Location Map Reference Field Strength mV/m Distance from CFA metres
1 CFA Position 53/56'06.90"N-1/55'54'14"W Not Applicable 02 1st Probe Stake CFA Field 53/56'07.96"N-1/55'52.84"W 560 403 CFA Field Gate 53/56'08.84"N-1/55'51.07"W 320 714 Middle Adjacent Field 53/56'09.182N-1/55'48,74"W 155 1405 Side Lawn Cringles House 53/55'57.49"N-1/55'39.21"W 54 4006 Entrance Schoolmaster Lane 53/55'38.19"N-1/55'35.20"W 20 10307 Silsden RLWY Station Lay-by 53/53'59.37"N-1/56'41.30"W 3.8 40208 Steeton Hill Top South 53/53'31.22"N-1/57'13.10"W 2.7 5010
Other measurements made on ealier occasion .Generally to North and West of CFA
Point No.9 Nominal 1Km Test Point 53/57'51.80"N-1/56'47.67"W 20 1030
10 Draughton Moor Lane 53/56'50.58"N-1`/55'54.82"W 9.5 202010 Junct A65 Draughton Lane 53.56'07.25"N-1/56'07.90"W 5.6 302511 Farfield House 53/57'40.48"N-1/53.03.94"W 3.6 430012 Junction A65, A59 RNDABT 53/58'11.31"N-1/58'51.44"W 2.6 5000
APPENDIX 4.
Page 15

CDL/KAT ~ 8 METRE CROSSED FIELD ANTENNA ~ FIELD STRNGTH PLOT 10 mS/s
CROSSED FIELD ANTENNA TESTS 26 th SEPTEMBER 2009Measurements f Ground Wave Field Strength at known distances from the CFA were made by CDL KAT prior to the tests
to be made by ARQIVA on 28th September.2009 The results of these measurements confirmed the earlier findings of CDL.
The measured values of Field Strength are plotted below together with a curve showing the results which would be
obtained with a Lambda/4 Vertical monopole antenna for a ground conductivity of 10mS.
These measurements were made with an input power of 5 Watts at 1,593KiloHertz .
560
320
155
54
20
9.510
100
1000
Fie
ld
Str
en
gth
in
mV
/me
tre
Field Strength versus Distance ~ Frequency 1593 KiloHertz
CFA 1593 KHz CDL (Measured)
Lambda/4 Monopole Conductivity 10 mS (Theoretical)
It is clear from the plotted results that, with a ground conductivity of 10 mS the Crossed Field Antenna yields virtually the same level of ground wave Field Strength than from a theoretically perfect Lambda/4 which must suffer the same ground wave attenuation. From these results the Relative Emission Efficiency of the tested CFA compared with the monopole is 100 %.
Elevated Crossed Field Antenna .8metre CFA on 5 metre platform.26 thSeptember 2009. CDL /KAT Plot.
Page 16 APPENDIX 5 (10mS/s)
560
320
155
54
20
9.5
5.5
3.6
2.7
1
10
100
1000
10 100 1000 10000
Fie
ld
Str
en
gth
in
mV
/me
tre
Distance from Antenna in metres
Field Strength versus Distance ~ Frequency 1593 KiloHertz
CFA 1593 KHz CDL (Measured)
Lambda/4 Monopole Conductivity 10 mS (Theoretical)
It is clear from the plotted results that, with a ground conductivity of 10 mS the Crossed Field Antenna yields virtually the same level of ground wave Field Strength than from a theoretically perfect Lambda/4 which must suffer the same ground wave attenuation. From these results the Relative Emission Efficiency of the tested CFA compared with the monopole is 100 %.
Elevated Crossed Field Antenna .8metre CFA on 5 metre platform.26 thSeptember 2009. CDL /KAT Plot.

COMMUNICATIONS DYNAMICS LIMITED ~ 8 METRE CROSSED FIELD ANTENNA Field Strength Plot
CROSSED FIELD ANTENNA TESTS 26 th SEPTEMBER 2009Measurements f Ground Wave Field Strength at known distances from the CFA were made by CDL prior to the tests
to be made by ARQIVA on 28th September.2009 The results of these measurements confirmed the earlier findings of CDL.
The measured values of Field Strength are plotted below together with a curve showing the results which would be
obtained with a Lambda/4 Vertical monopole antenna for a ground conductivity of 7 mS/s.
These measurements were made with an input power of 5 Watts at 1,593KiloHertz .
560
320
155
54
20
9.510
100
1000
Fie
ld S
tre
ng
th i
n m
V/m
etr
e
Field Strength versus Distance ~ Frequency 1593 KiloHertz
CFA 1593 KHz CDL (Measured)
Lambda/4 Monopole Conductivity 7 mS (Theoretical)
It is clear from the plotted results that, with a ground conductivity of 7 mS the Crossed Field Antenna yields a slightly level of ground wave Field Strength than from a theoretically perfect Lambda/4 which must suffer the same ground wave attenuation. From these results the Relative Emission Efficiency of the tested CFA compared with the monopole is more than 100 %.
Elevated Crossed Field Antenna .8metre CFA on 5 metre platform.26 thSeptember 2009. CDL Plot.Input Power 5Watts , Zo 50 Ohms
APPENDIX 5A page17
560
320
155
54
20
9.5
5.5
3.6
2.7
1
10
100
1000
10 100 1000 10000
Fie
ld S
tre
ng
th i
n m
V/m
etr
e
Distance from Antenna in metres
Field Strength versus Distance ~ Frequency 1593 KiloHertz
CFA 1593 KHz CDL (Measured)
Lambda/4 Monopole Conductivity 7 mS (Theoretical)
It is clear from the plotted results that, with a ground conductivity of 7 mS the Crossed Field Antenna yields a slightly level of ground wave Field Strength than from a theoretically perfect Lambda/4 which must suffer the same ground wave attenuation. From these results the Relative Emission Efficiency of the tested CFA compared with the monopole is more than 100 %.
Elevated Crossed Field Antenna .8metre CFA on 5 metre platform.26 thSeptember 2009. CDL Plot.Input Power 5Watts , Zo 50 Ohms

Created 26.09.2009
CFA Voltage Standing Wave Ratios ~ CDL/KATMeasurements made with ARRAY SOLUTIONS Antenna Impedance AnalyserType AIM 4170C Serial No.3077. Calibrated June 2009. VSWR DATAFreq(MHz) SWR
1.580002 2.1284031.581002 2.0165071.582002 1.9429531.583002 1.8157721.584002 1.7234391.585002 1.6248481.586002 1.5348291.587002 1.4438361.588002 1.3628051.589002 1.2821211.590002 1.2143361.591002 1.1460371.592002 1.0788951.593002 1.0177121.594002 1.0516781.595003 1.1178911.596003 1.1897291.597003 1.2682281.598003 1.3404071.599003 1.4244591.600003 1.5237181.601003 1.612411.602003 1.721909 0
0.5
1
1.5
2
2.5
Vo
lta
ge
Sta
nd
ing
Wa
ve
Ra
tio
CFA VSWR versus Frequency
1.602003 1.7219091.603003 1.8305981.604003 1.9465041.605003 2.064371
The VSWR of the CFA for the frequency range f carrier + /- 6.0 KHZ. Is 1.5.This confirms that the Bandwidth /VSWR comply with the Ofcom Engineering Codei.e. An upper limit of VSWR at 1.5 for fcarrier +/- 4.5 KHZ.
APPENDIX 6
Page 18
0
0.5
1
1.5
2
2.5
1.58 1.585 1.59 1.595 1.6 1.605
Vo
lta
ge
Sta
nd
ing
Wa
ve
Ra
tio
Frequency in MHz.
CFA VSWR versus Frequency

8 METRE CROSSED FIELD ANTENNA ~ CDL/KAT~ SMITH CHART + Rs, Xs and Z GRAPHS.
SMITH CHARTand GRAPHS of Rs, Xs & Z mag.
Measurments with Array Solutions Antenna Analyzer Type 4170C Ser.N0.3077 APPENDIX 7Created: 09-26-2009 12:22:18
ANALYZER DATA Page 19
f MHz Rs Xs Z mag1.571001 140.6154 -55.9147 158.4621
1.572001 132.8388 -54.6786 150.8723 Smith Chart1.573002 126.5494 -52.8746 142.975 Data from ARRAY SOLUTIONS Antnna Impedance Analyser 26th September 20091.574002 120.0211 -51.2537 136.53461.575002 113.8438 -49.3848 129.78411.576002 107.9653 -46.607 123.0147 Point No.1 1,581 kHz.1.577002 103.2179 -44.5697 116.80311.578002 97.67417 -42.5325 111.6376 Point No.2 1,593 kHz.1.579002 92.74521 -39.1829 105.24041.580002 88.50876 -36.4262 99.64206 Point No.3 1,604.5 kHz.1.581002 84.221 -34.1254 94.859611.582002 80.64716 -31.4122 89.888281.583002 76.89939 -28.6979 85.525631.584002 73.50378 -26.1842 81.235011.585002 70.21735 -23.7409 77.242731.586002 67.12532 -20.8539 73.248631.587002 64.07126 -18.227 69.555951.588002 61.31448 -15.4622 65.910581.589002 58.60324 -12.9648 62.670191.590002 56.48497 -10.3867 59.516591.591002 54.34945 -8.04924 57.055611.592002 51.97458 -5.62604 54.639861.593002 50.06082 -3.3307 52.08119
VSWR=1.02 1.594002 48.0842 -0.87626 50.068491.595003 46.26825 1.560412 48.109511.596003 44.65162 3.851708 46.42831.597003 42.61274 6.240599 45.085611.598003 41.58231 8.14241 43.383691.599003 39.95652 10.43457 42.871531.600003 38.33226 12.32127 41.813121.601003 37.33715 14.45228 40.966211.602003 35.96097 16.54939 40.840481.603003 34.78488 18.63067 40.500531.604003 33.66325 20.5904 40.422181.605003 31.84255 23.00333 40.34224
VSWR=2 1.606003 30.02265 24.55151 39.8733
150
Rs ,Xs & Zmag versus Frequency ~ 8 metre CFA
-100
-50
0
50
100
150
1.57 1.575 1.58 1.585 1.59 1.595 1.6 1.605 1.61
Rs,
Xs
& Z
ma
g.
In O
hm
s
Freguency in MHz.
Rs ,Xs & Zmag versus Frequency ~ 8 metre CFA
Value o RS versus Frequency
Value of CS versus Frequency
Value of Z mag.versus Frequency
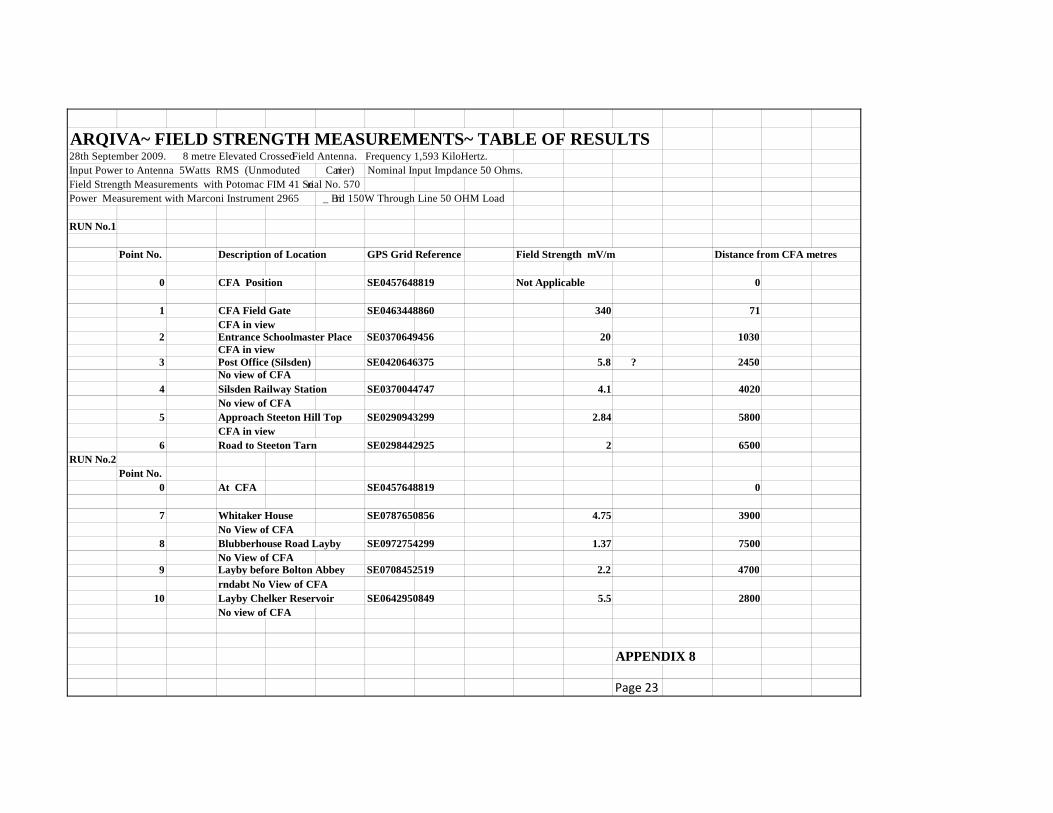
ARQIVA~ FIELD STRENGTH MEASUREMENTS~ TABLE OF RESULTS28th September 2009. 8 metre Elevated Crossed Field Antenna. Frequency 1,593 KiloHertz.Input Power to Antenna 5Watts RMS (Unmoduted Carrier) Nominal Input Impdance 50 Ohms.Field Strength Measurements with Potomac FIM 41 Serial No. 570Power Measurement with Marconi Instrument 2965 _ Bird 150W Through Line 50 OHM Load
RUN No.1
Point No. Description of Location GPS Grid Reference Field Strength mV/m Distance from CFA metres
0 CFA Position SE0457648819 Not Applicable 0
1 CFA Field Gate SE0463448860 340 71CFA in view
2 Entrance Schoolmaster Place SE0370649456 20 1030CFA in view
3 Post Office (Silsden) SE0420646375 5.8 ? 2450No view of CFA
4 Silsden Railway Station SE0370044747 4.1 4020No view of CFA
5 Approach Steeton Hill Top SE0290943299 2.84 5800CFA in view
6 Road to Steeton Tarn SE0298442925 2 6500RUN No.2
Point No.0 At CFA SE0457648819 0
7 Whitaker House SE0787650856 4.75 3900No View of CFA
8 Blubberhouse Road Layby SE0972754299 1.37 7500No View of CFA
9 Layby before Bolton Abbey SE0708452519 2.2 4700rndabt No View of CFA
10 Layby Chelker Reservoir SE0642950849 5.5 2800No view of CFA
APPENDIX 8
Page 23

8 METRE CROSSED FIELD ANTENNA ~ THE ARQIVA FIELD STRENGTH MEASUREMENTS ARQIVA FIELD TESTS RUN NO.1 ON 28th September 2009.
Measurements of Field Strength at known distances from the CFA were made by K.Thorley of ARQIVAThe measured values of Field Strength are plotted below together with a curve showing the results which would be
obtained with a Lambda/4 Vertical monopole antenna for a ground conductivity of 10mS/m. These measurements were made with an input power of 5 Watts at 1,593KiloHertz . ARQIVA Run No, 1 Results.
340
20
215
20.1
10
100
1000
Fie
ld S
tre
ng
th in
mV
/me
tre
Field Strength versus Distance 1593 KiloHertz
CFA 1593 KHz ARQIVA
Lambda/4 Monopole Conductivity 10 mS
It is clear from the plotted results that, with a ground conductivity of 10 mS/m the Crossed Field Antenna yields a slightly higher level of ground wave Field Strength than a from theoretically perfect Lambda/4which suffers the same ground wave attenuation. From these results the Relative Emission Efficiency of the tested CFA compared with the monopole is approx. 100 %.
Page 24 APPENDIX 9
340
20
5.8
4.1
2.85
2
215
20.1
9
5.8
4
3
1.9
1.121
10
100
1000
10 100 1000 10000
Fie
ld S
tre
ng
th in
mV
/me
tre
Distance from Antenna in metres
Field Strength versus Distance 1593 KiloHertz
CFA 1593 KHz ARQIVA
Lambda/4 Monopole Conductivity 10 mS
It is clear from the plotted results that, with a ground conductivity of 10 mS/m the Crossed Field Antenna yields a slightly higher level of ground wave Field Strength than a from theoretically perfect Lambda/4which suffers the same ground wave attenuation. From these results the Relative Emission Efficiency of the tested CFA compared with the monopole is approx. 100 %.

8 METRE CROSSED FIELD ANTENNA ~ THE ARQIVA FIELD STRENGTH MEASUREMENTS ARQIVA FIELD TESTS RUN NO.1 ON 28th September 2009.
Measurements of Field Strength at known distances from the CFA were made by K.Thorley of ARQIVAThe measured values of Field Strength are plotted below together with a curve showing the results which would be
obtained with a Lambda/4 Vertical monopole antenna for a ground conductivity of 7 mS/s. These measurements were made with an input power of 5 Watts at 1,593KiloHertz . ARQIVA Run No, 1 Results.
340
20
1000
207
19
8.510
100
1000
Fie
ld S
tren
gth
in m
V/m
etre
Field Strength versus Distance 1593 KiloHertz
CFA 1593 KHz ARQIVA
Lambda/4 Monopole Conductivity 7 mS
It is clear from the plotted results that, with a ground conductivity of 7 mS/s the Crossed Field Antenna yields a slightly higher level of ground wave Field Strength than a from theoretically perfect Lambda/4 which suffers the same ground wave attenuation. From these results the Relative Emission Efficiency of the tested CFA compared with the monopole is MORE than 100 %.
APPENDIX 9A
Page 25
340
20
5.8
4.1
2.85
2
1000
207
19
8.5
5.1
2.51
1.56
1
10
100
1000
10 100 1000 10000
Fie
ld S
tren
gth
in m
V/m
etre
Distance from Antenna in metres
Field Strength versus Distance 1593 KiloHertz
CFA 1593 KHz ARQIVA
Lambda/4 Monopole Conductivity 7 mS
It is clear from the plotted results that, with a ground conductivity of 7 mS/s the Crossed Field Antenna yields a slightly higher level of ground wave Field Strength than a from theoretically perfect Lambda/4 which suffers the same ground wave attenuation. From these results the Relative Emission Efficiency of the tested CFA compared with the monopole is MORE than 100 %.

Reproduction of Arqiva Antenna System Impedance Measurements.
The measurements were taken on 28th September 2009 with the equipments listed in theSchedule of Apparatus used in the ARQIVA Field Tests. Page 26
The Smith Chart was prepard by CDL/KAT using data supplied by Arqiva Ltd.
Antenna System Impedancemeasured at Tx.
Frequency Rs Xs
1,583.0 kHz 64.6 -j 30.4
1,588.5 kHz 57.9 -j 18.0
1,,593.0 kHz 50.3 -j 4.5
1,597.5 kHz 43.8 +j 8.0
1,603.0 kHz 38.5 +j 21.3
POINT 1 VSWR = 2.0 at 1,579. kHz
POINT 2 VSWR =1.09 at 1,593 kHZ.
POINT 3 VSWR = 2.0 at 1,605 kHz.
APPENDIX 10

Created 28-09-2009
CFA Voltage Standing Wave Ratios ~ ARQIVACARRIER CENTRE FREQUENCY 1,593 KiloHertz.
The VSWR versus Frequency graph was prepared by CDL using data supplied by Arqiva.and is in the same format as the CDL/KAT graphs.
Measurements made with Hewlet PackardNetwork Analyzer HP87531D VSWR DATAFreq(MHz) SWR
1.58 1.95 *1.583 1.78
1.5885 1.451.593 1.09
1.5943 1.03 **1.5975 1.24
1.603 1.781.605 2 *
The above data was derived from the Frequency versus Impedance data used to produce the Smith Chart shown in Appendix 10Points * and ** are from extrapolation and iterpolation of the Arqiva data.
0
0.5
1
1.5
2
2.5
1.58 1.585 1.59 1.595 1.6 1.605 1.61
Vo
lta
ge
Sta
nd
ing
Wa
ve
Ra
tio
8 metre CFA ~ VSWR versus Frequency
VSWR versus Frequency
The VSWR of the CFA in the frequency range f carrier +/- 5.0 KHz. Is less than 1.5.
This is well within the limit set in the OFCOM Engineering Code which sets a lower limit of +/- 4.5 KHz. at VSWR of 1.5.
Page 27 APPENDIX 11
0
0.5
1
1.5
2
2.5
1.58 1.585 1.59 1.595 1.6 1.605 1.61
Vo
lta
ge
Sta
nd
ing
Wa
ve
Ra
tio
Frequency in MHz.
8 metre CFA ~ VSWR versus Frequency
VSWR versus Frequency