The short-run impact of using lotteries for school admissions: early results from Brighton and...
18
The short-run impact of using lotteries for school admissions: early results from Brighton and Hove’s reforms Rebecca Allen 1 , Simon Burgess 2 and Leigh McKenna 2 We analyse the initial impact of a major school admission reform in Brighton and Hove. The new system incor- porated a lottery for oversubscribed places and new catchment areas. We examine the post-reform changes in school composition. We locate the major winners and losers in terms of the quality of school attended. We match similar cities and conduct a difference-in-difference analysis of the policy change. The results are com- plex: we see an increase in student sorting but we also see a significant weakening of the dependence of school attended on student’s prior attainment. Key words school lottery; segregation; school admissions reforms; school access; education inequality 1 Institute of Education, University of London, London WC1H 0AL 2 CMPO, University of Bristol, Bristol BS8 1TX Email: [email protected] Revised manuscript received 27 January 2012 Introduction In February 2007, the city of Brighton and Hove, UK, announced plans for a complete reform of their sec- ondary school admissions system. The newly proposed system was unique in England because it incorporated widespread use of a lottery, or random allocation, as a tie-breaker for oversubscribed places instead of using the distance from home to school. This lottery was introduced alongside the drawing of new catch- ment areas (or priority zones), and also a national reform from a First Preference First (or priority) matching mechanism to an equal preferences system. These reforms are likely to influence school composi- tion, residential sorting, house prices and pupil move- ments to private schooling and other local authorities (LAs). Some of these are likely to be processes taking a number of years and some are likely to be more immediate. In this paper we analyse the initial impact of the reforms on the distribution of pupils to schools; in subsequent papers we plan to address the other issues. The Coalition Government’s Social Mobility Strat- egy 1 highlights (p. 8) the large education inequalities in England: only 31 per cent of disadvantaged chil- dren 2 achieve at least 5 GCSEs 3 at grade C or above including English and Maths, compared with 58 per cent of non-disadvantaged children. Clearly the sources of this gap are many and related in complex ways. 4 But one important source is the academic quality of the school attended. Schools matter and schools differ, and Burgess and Briggs (2010) have shown that on average pupils from disadvantaged families only have half the chance of attending a high-scoring school as more affluent families. Persis- tent residential social segregation is part of the back- ground to unequal opportunities for poor and rich families to access high-quality schools. In England there has actually been little change in the levels of segregation of disadvantaged pupils over the past two decades, despite policies to facilitate greater parental choice and several major changes in the school admis- sions code (Allen and Vignoles 2007; Gibbons and Telhaj 2007; Gorard et al. 2003). This means that school admissions procedures are central to determining access to high-performing schools. We describe these in some detail below and in particular the over-subscription criteria that deter- mine how places at popular schools are allocated. The most relevant for this analysis is the ubiquitous role of proximity – those living nearest to the over- subscribed school are given priority. To a substantial degree, this entrenches privilege in access to the high- scoring schools through the mechanism of high house prices. Hamnett and Butler (2011) demonstrate the importance of location, and specifically distance from popular schools, in their analysis of school allocation in East London. Clearly, something has to be used to allocate scarce places, and one alternative to proximity is the use of a lottery to ensure random allocation. This necessarily delivers a school allocation that is not associated with background (or anything else) within the area covered by the lottery. While there is a good Citation: 2012 doi: 10.1111/j.1475-5661.2012.00511.x ISSN 0020-2754 Ó 2012 The Authors. Transactions of the Institute of British Geographers Ó 2012 Royal Geographical Society (with the Institute of British Geographers)
-
Upload
rebecca-allen -
Category
Documents
-
view
213 -
download
1
Transcript of The short-run impact of using lotteries for school admissions: early results from Brighton and...

The short-run impact of using lotteries forschool admissions: early results from Brightonand Hove’s reforms
Rebecca Allen1, Simon Burgess2 and Leigh McKenna2
We analyse the initial impact of a major school admission reform in Brighton and Hove. The new system incor-porated a lottery for oversubscribed places and new catchment areas. We examine the post-reform changes inschool composition. We locate the major winners and losers in terms of the quality of school attended. Wematch similar cities and conduct a difference-in-difference analysis of the policy change. The results are com-plex: we see an increase in student sorting but we also see a significant weakening of the dependence of schoolattended on student’s prior attainment.
Key words school lottery; segregation; school admissions reforms; school access; education inequality
1Institute of Education, University of London, London WC1H 0AL2CMPO, University of Bristol, Bristol BS8 1TXEmail: [email protected]
Revised manuscript received 27 January 2012
Introduction
In February 2007, the city of Brighton and Hove, UK,announced plans for a complete reform of their sec-ondary school admissions system. The newly proposedsystem was unique in England because it incorporatedwidespread use of a lottery, or random allocation, asa tie-breaker for oversubscribed places instead ofusing the distance from home to school. This lotterywas introduced alongside the drawing of new catch-ment areas (or priority zones), and also a nationalreform from a First Preference First (or priority)matching mechanism to an equal preferences system.These reforms are likely to influence school composi-tion, residential sorting, house prices and pupil move-ments to private schooling and other local authorities(LAs). Some of these are likely to be processes takinga number of years and some are likely to be moreimmediate. In this paper we analyse the initial impactof the reforms on the distribution of pupils to schools;in subsequent papers we plan to address the otherissues.
The Coalition Government’s Social Mobility Strat-egy1 highlights (p. 8) the large education inequalitiesin England: only 31 per cent of disadvantaged chil-dren2 achieve at least 5 GCSEs3 at grade C or aboveincluding English and Maths, compared with 58 percent of non-disadvantaged children. Clearly thesources of this gap are many and related in complexways.4 But one important source is the academicquality of the school attended. Schools matter andschools differ, and Burgess and Briggs (2010) have
shown that on average pupils from disadvantagedfamilies only have half the chance of attending ahigh-scoring school as more affluent families. Persis-tent residential social segregation is part of the back-ground to unequal opportunities for poor and richfamilies to access high-quality schools. In Englandthere has actually been little change in the levels ofsegregation of disadvantaged pupils over the past twodecades, despite policies to facilitate greater parentalchoice and several major changes in the school admis-sions code (Allen and Vignoles 2007; Gibbons andTelhaj 2007; Gorard et al. 2003).
This means that school admissions procedures arecentral to determining access to high-performingschools. We describe these in some detail below andin particular the over-subscription criteria that deter-mine how places at popular schools are allocated.The most relevant for this analysis is the ubiquitousrole of proximity – those living nearest to the over-subscribed school are given priority. To a substantialdegree, this entrenches privilege in access to the high-scoring schools through the mechanism of high houseprices. Hamnett and Butler (2011) demonstrate theimportance of location, and specifically distance frompopular schools, in their analysis of school allocationin East London.
Clearly, something has to be used to allocatescarce places, and one alternative to proximity is theuse of a lottery to ensure random allocation. Thisnecessarily delivers a school allocation that is notassociated with background (or anything else) withinthe area covered by the lottery. While there is a good
Citation: 2012 doi: 10.1111/j.1475-5661.2012.00511.xISSN 0020-2754 � 2012 The Authors.
Transactions of the Institute of British Geographers � 2012 Royal Geographical Society (with the Institute of British Geographers)

deal of evidence on the effects of lotteries in the US,there is no such evidence for the UK simply becausethere have been no area-wide lotteries. The policychange by Brighton and Hove Council therefore pro-vides an excellent opportunity to gather such evi-dence. This is the aim of this paper: in the context ofthe current political debates on social mobility andeducation reform, to document and assess the impactof the introduction of the lottery on the allocation ofplaces in high-scoring schools.
These reforms in Brighton and Hove have takenplace amid widespread political and public debateabout social mobility. The Coalition Government hasemphasised that ‘social mobility is the principal goalof our social policy’ in its Social Mobility Strategyand this issue is heralded as one of the main planksin the Coalition’s programme. The long-term aim isto reduce the dependence of an individual’s lifechances on her ⁄ his family background, such as thewealth, human capital and connections of her ⁄ his par-ents. One key channel through which this dependenceoperates is education. Private (fee-paying) educationis one aspect, but is not central: only around seven percent of pupils in England attend fee-paying schools.The most important elements of any decisive changewill have to come about in state schools. Much of thepolitical debate about education policy also focuseson the chances of disadvantaged children doing well.Policies such as the pupil premium, the championingof new ‘free’ schools and the re-focusing and expan-sion of the academies programme are presented asaiding social mobility and reducing the extent towhich background influences attainment at school.
A geographical approach to the school assignmentproblem is central because school and neighbourhoodare so tightly intertwined, and because of the key tie-breaker rule of proximity. Geography shapes families’choices and is part of the package they choose whencontemplating school decisions (see, for example, thesummary in Butler and Hamnett 2007). Other spatialmodels approach the schools and space from theother end and consider how well geographical classifi-cations of pupils predict performance in school(Webber and Butler 2007). Data-based modelling ofthe de facto school catchment areas is becoming evermore sophisticated (Harris and Johnston 2008; Single-ton et al. 2011), and this permits deeper analysis ofthe consequent spatial inequalities in school access(Singleton et al. 2011).
The theoretical framework for this paper is basedon an analysis of school admissions rules. We canthink of this as an assignment problem. A set ofpupils with particular characteristics, including cru-cially their location, have to be assigned to a set ofschool places, also described by a set of characteristics(see Burgess et al. 2006). The outcome of the assign-
ment depends on the rules of the game, the mecha-nism and the preferences of parents (and schools insome cases; see Abdulkadiroglu and Sonmez 2003;Abdulkadiroglu et al. 2005). The most commonassignment mechanisms include choice-based assign-ment, neighbourhood assignment, test-basedassignment and random assignment. In England,choice-based assignment starts with parents expressinga preference for schools; these preferences are aggre-gated and implemented using an algorithm designedto treat all preferences equally (Gale and Shapley1962). The key component of this process for the pur-poses of this paper is that places in over-subscribedschools are typically allocated by proximity – thoseliving nearest to the school are granted the places(West et al. 2009). A neighbourhood assignment sys-tem would allocate students to their nearest school(Allen 2007). The implications of this mechanismdepend on the degree of mobility families undertakebefore the school assignment date (Allen et al. 2010).In the US, students’ default option is to attend aschool in their home school district; families exercisechoice beforehand by picking a school district to livein. This has been the subject of a great deal of analy-sis and controversy (for example, Hoxby 2000 2005;Rothstein 2004). Modelling the outcome of such com-plex systems requires either computable equilibriummodels (Epple and Romano 1998 2003) or structuralmodels identifying neighbourhood and school choice(Bayer et al. 2007). Test-based assignment – the gram-mar school system – was once universal in England,but now remains in only a few LAs. Random assign-ment is the subject of this paper: the students to begranted a place at an over-subscribed school are cho-sen at random from all those who applied.
This paper focuses on the admissions reform inBrighton and Hove, which incorporated a lottery, orrandom allocation, as a tie-breaker for oversubscribedplaces instead of using the distance from home toschool. This lottery was introduced alongside thedrawing of new catchment areas (or priority zones).By itself, we would expect the abandonment of prox-imity as a tie-breaker for admission to the most popu-lar school to lead to lower student sorting. A lotteryprovides equal chances of admission and removes thelink with immediate neighbourhood and the depen-dence on income via house prices. But the newadmission system in Brighton and Hove does not giveequal chances to all pupils in the city because it prior-itises those who live within catchment areas. Thismeans that the design of the catchment areas is cru-cial to the outcome, and so overall the reform mayincrease or decrease the degree of school segregation.It is the interaction between the lottery and theboundaries of the catchment areas that is key to theoutcome of this admissions reform.
2 Rebecca Allen et al.
Citation: 2012 doi: 10.1111/j.1475-5661.2012.00511.xISSN 0020-2754 � 2012 The Authors.Transactions of the Institute of British Geographers � 2012 Royal Geographical Society (with the Institute of British Geographers)

We carry out three analyses. First, we simply exam-ine the post-reform changes in school composition inBrighton relative to pre-reform trends. These changesare well explained by the interaction of the use of thelottery and the detail of the catchment area bound-aries. Second, we locate the neighbourhoods of themajor winners and losers in terms of the quality ofschool attended; again most of these derive clearlyfrom the reforms. Third, we identify a small numberof LAs similar to Brighton and Hove and use these toconduct a difference-in-difference analysis of the pol-icy change, using the long spell of data in the beforeperiod and the first two years after. The results arecomplex: there is a small but significant increase insocio-economic segregation. But we also see a signifi-cant weakening of the dependence of school attendedon student’s prior attainment. This derives fromdependence on neighbourhood, and is concentratedat the top of the distribution. Specifically, some stu-dents with high prior tests scores living in the wealth-ier neighbourhoods of Brighton and Hove gainadmission to schools of lower quality after the reformthan they might have expected to. These are the pri-mary group losing out from the reform, identified inour spatial analysis, and balanced by a more diffusegroup of winners who did gain access to the higherperforming schools.
In the following section we describe the nature ofthe policy change, and provide an overview of thecharacteristics of the schools and neighbourhoodspre-reform. In the third section, we sketch out theeconomic framework of our analysis and the empiricalapproach. The data are described in the fourth sec-tion, followed by a section that presents the results,and finally some conclusions.
Nature of the reform
Brighton and Hove is a relatively small but denselypopulated unitary authority of about a quarter of amillion residents on the south coast of England. Likemany areas of England, places at secondary schoolswere previously allocated giving priority to pupils liv-ing closest to schools. Social segregation betweenschools across the city (measured using the dissimilar-ity index) was significantly lower in Brighton and Hovethan across the rest of England, though there havebeen modest rises in socio-economic segregation inschools from 2005 ⁄ 6 onwards with the dissimilarityindex rising from 0.18 to 0.23 by 2007 ⁄ 8. The large dif-ferences in attainment of pupils in the best and worstperforming schools can largely be explained by theclustering of deprived neighbourhoods in the east andthe far west of the city. For example, in 2007 ⁄ 8 64 percent of pupils who attended the top performing schoolachieved 5 or more good GCSEs at grades A* to C
(including English and Maths) compared with just 19per cent in the lowest performing school. There wereperceived to be specific problems relating to variationin the amount of choice that parents had across thecity, which result from the clustered location ofschools in particular residential areas, particularly inthe northern part of Brighton (illustrated in the mapin Figure 1). This meant that some parents had a guar-anteed place at more than one school, while other par-ents had no de facto neighbourhood school. Theclosure of one secondary school – the East BrightonCollege of Media and Arts (COMART) – in 2007exacerbated problems of the supply of places in theeast of the city (see Figure 2 for a timeline of eventsaffecting secondary education in Brighton and Hove).
Changes in the admissions processSecondary school admissions follow a similar processin all LAs across England. Parents are able to expresspreferences for any state-maintained school andschools must admit pupils up to a published capacity.Under the old regime in Brighton and Hove, parentswere invited to list up to three schools in order andthese preferences were considered using a First Pref-erence First or priority matching mechanism (fordetails of alternative algorithms, see Roth 1984; forexamples of algorithm reforms in the US, seeAbdulkadiroglu et al. 2005). First Preference Firstconsidered only the parent’s first choice of school andattempted to meet these preferences using oversub-scription criteria to rank pupils where necessary. Thiswas a problem to the extent that it required strategicaction on the part of parents because second andthird choice schools would often be filled by otherpupils who ranked it as their first choice. The moveto Equal Preferences (technically this is a Gale-Shapley school-deferring mechanism as described inGale and Shapley 1962), where all listed preferenceswere simultaneously considered, was mandatorilyintroduced in Brighton and Hove and other LAs in2008 as part of the 2007 Admissions Code.
The move from a proximity oversubscription crite-rion to catchment area priorities (marked in Figure 1)represents a significant change in the probability ofhouseholds achieving a place at a particular school.The catchment zones are unusual because there aretwo dual catchment zones. The large zone in Hovegives all parents inside the zone equal opportunity ofaccess to Hove Park and Blatchington Mill schools,with an ‘almost’ guarantee of a place at one of thetwo schools.5 The large zone in central Brightonworks in the same manner for Dorothy Stringer andVarndean schools.
A random allocation, or lottery, tie-breaker isapplied twice in the new system: firstly, to rank appli-cants who live within the catchment zones and
Lotteries for school admissions 3
Citation: 2012 doi: 10.1111/j.1475-5661.2012.00511.xISSN 0020-2754 � 2012 The Authors.
Transactions of the Institute of British Geographers � 2012 Royal Geographical Society (with the Institute of British Geographers)

secondly, in the event of spare remaining places, torank any applicants who are applying from outsidethe zone. This process is seen as being more equitableand removes the long-standing creation of ‘goldenhalos’ of expensive housing that guaranteed schoolaccess around popular schools.
As a voluntary aided school, Cardinal Newman isresponsible for its own admissions procedures andchose not to change them as part of the reforms. Aswith most state-maintained Roman Catholic schools,Cardinal Newman gives priority to Catholic families,followed by other Christian, then other non-CatholicChristian families followed by any other applicants.6
At an aggregate level, the percentage of parentsbeing offered a place at their most preferred school
for September 2009 was 83 per cent over England asa whole, and 82 per cent in Brighton and Hove; thepercentage being offered a place at one of their top-three choices was 95 per cent nationally and 97 percent in Brighton and Hove. So Brighton and Hove isright on the national average. Intriguingly, the per-centage of parents being offered their first preferencewas 77 per cent in the previous year in Brighton andHove (no earlier figures are available). However,given a national range of 41 per cent to 97 per cent,this change of 5 percentage points is unlikely to besignificant and still less straightforwardly attributableto the policy change.7
Changes to the admissions process are summarisedin Table I.
Brighton and Hovesplit from East Sussex LA
Marina High closed, givena fresh start as COMART
COMART comes outof special measures
Admissions reformsannounced
First children of the newregime start school
Stanley Deason closed COMART goes into COMART is closed Reforms upheld afteras part of "fresh start" special measures Judicial Reviewreopened as MarinaHigh on same premises
April 1997 Sept. 1999 Jan. 2002 Feb. 2007 Sept. 2008
Sept. 1997 2000 August 2005 July 2007
Figure 2 Brighton and Hove timeline
Figure 1 Catchment areas and the 2004 Index of Multiple DeprivationNote: SOA denotes Super Output Area, a spatial unit of the Census
Source: Brighton and Hove Council
4 Rebecca Allen et al.
Citation: 2012 doi: 10.1111/j.1475-5661.2012.00511.xISSN 0020-2754 � 2012 The Authors.Transactions of the Institute of British Geographers � 2012 Royal Geographical Society (with the Institute of British Geographers)

Characteristics of the catchment areas and schoolsUnder the reforms two dual catchment areas and foursingle school catchment areas were introduced acrossBrighton and Hove. As we shall refer to the catch-ment areas and schools by name in this paper it isimportant to have an understanding of the recentattainment and composition of the schools. Table IIgives a summary of the schools composition in 2008for the final intake-year (this is year 7) cohort toenter the schools prior to the reforms, and shows sig-nificant differences in socio-economic composition,for example from Dorothy Stringer with 8 per centstudents eligible for free school meals (FSM) to Fal-mer High with 48 per cent.
Whilst the reforms will have implications for allthe schools in Brighton and Hove, some schools willbe more noticeably affected than others. The use ofrandom allocations in the dual catchment areas willinevitably alter the composition of the schools. TheVarndean ⁄Dorothy Stringer (V ⁄DS) catchment areain the centre of the city is a relatively affluent areawith a strip of more deprived housing along its fareastern edge. Both schools in this catchment are highperforming with above average attainment at GCSE,8
confirmed by the fact that both schools were oversub-scribed prior to the reforms. The Hove Park ⁄Blatch-ington Mill (BM ⁄HP) area in central Hove differsfrom the V ⁄DS area in that only one of its schools
has a pass rate above the national average. WhilstBlatchington Mill was the city’s best-performing stateschool in 2008, Hove Park performed significantlyworse, with a pass rate over ten percentage pointsbelow the national average. The two schools differcompositionally with Hove Park having a larger pro-portion of students who are eligible for FSM and asmaller proportion of high-ability students enteringthe school from primary school.
Schools outside these dual catchment areas in thecentre of the city are less likely to experience signifi-cant changes in pupil intake following the reformsbecause they have been assigned distinct catchmentzones: Falmer High has always served the north-eastcatchment area with Longhill serving the south-east;Portslade will still be the school most pupils living onthe western edge of the city attend. Because thesethree schools traditionally serve more deprived hous-ing areas, they are unlikely to attract large numbersof applicants from other areas. By contrast, however,Patcham High is likely to see an increase in academicability of their pupil intakes because a set of house-holds who were previously guaranteed access to Dor-othy Stringer and Varndean have been assignedPatcham High as their catchment area school.
It is worth noting that the disparities between theattainment levels of the schools can largely beexplained by the differing qualities of the students
Table I Overview of admission reforms in Brighton and Hove
Pre Sept 2008 entry Sept 2008 entry onwards
Number of preferences 3 3Matching mechanism First preference first
(priority matching mechanism)Equal preferences (Gale-Shapley school-deferring)
Priority I Compelling medical or other reasons Children in care; medical and other reasonsPriority II Sibling currently at the school Sibling currently at the school (only for households
within catchment from 2012)Priority III Home to school distance Within catchment area, with a random allocation tie-breakerPriority IV Outside catchment area, with a random allocation tie-breaker
Table II School characteristics 2007 ⁄ 8
School% 5 A*–C GCSEs(inc. English and Maths)
% FSM eligiblein year 7
Numberof year 7s
Post reformcatchment type
Falmer High 19 48.4 126 SinglePatcham High 28 21.3 168 SinglePortslade CC 29 18.4 126 SingleLonghill High 36 15.8 242 SingleHove Park 36 18.8 294 Dual (HP ⁄ BM)Cardinal Newman 55 9.38 341 None (Catholic)Varndean 57 17.4 241 Dual (V ⁄ DS)Dorothy Stringer 63 8.22 331 Dual (V ⁄ DS)Blatchington Mill 64 12.3 304 Dual (HP ⁄ BM)Brighton average 44.5 13.4 250England average 47.6 12.6 189
Lotteries for school admissions 5
Citation: 2012 doi: 10.1111/j.1475-5661.2012.00511.xISSN 0020-2754 � 2012 The Authors.
Transactions of the Institute of British Geographers � 2012 Royal Geographical Society (with the Institute of British Geographers)

they admit. For example, less than 10 per cent of theyear 7s who entered Falmer High in September 2007were in the top quartile of the KS2 score distribution,whilst over 40 per cent of those entering DorothyStringer were in the top quartile. When the contex-tual value added9 (CVA) measure of school quality isused, Falmer scores as highly as Blatchington Milland Dorothy Stringer. This does not imply top stu-dents who attend Falmer High would have the samerealised outcome as they would if they attended Dor-othy Stringer, but that Falmer High cannot bedeemed to be failing its students simply because ithas the lowest GCSE pass rate in the city.
Modelling framework
The Brighton and Hove school admission reforms arestill relatively new and so in this paper we are onlyable to analyse whether the admissions reforms inBrighton and Hove have altered the distribution ofpupils across schools over a two-year period. We doexpect these reforms to have a significant impact onresidential house prices and sorting, and we plan toreturn to these issues in later work.
Economic model of school and household loca-tionThe formation of pupil intakes at schools has beenextensively studied in theoretical models and empiricaldata. A central feature of the models is that peergroups, and thus school quality and the value of hous-ing, are endogenously determined, with most modelsdirectly building on hedonic pricing models that matchconsumers to locations and find prices that separatepeople based on willingness to pay for locational qual-ity, of which local school quality is one dimension(Sattinger 1980; Tinbergen 1959). The general equilib-rium models of Epple and Romano (1998) and Nechyba(2000) show location choice where school assignment isdecided strictly via a residence requirement restrictionand thus households purchase homes and school accessas bundles. This is the traditional means by which par-ents ‘choose’ schools in the United States and is similarin nature to catchment areas or proximity oversubscrip-tion criterion in the English context.
Econometric studies have consistently shown thatparents are willing to pay for school quality throughthe housing market (Black 1999; Bogart and Cromwell1997 2000; Cheshire and Sheppard 1995; Gibbons andMachin 2003; Goodman and Thibodeau 1998; Leechand Campos 2003; Rosenthal 2003; Sieg et al. 1999).For example, Black (1999) examines the differentialhouse prices for those residences either side of ele-mentary school attendance zone boundaries, in anattempt to resolve the problem of unobservable neigh-bourhood characteristics. She estimates that families
are willing to pay 2.5 per cent higher house prices fora school quality increase of 5 per cent. Bayer et al.(2007) estimate a mean marginal willingness to pay fora standard deviation increase in average test scores ofapproximately 2 per cent of house value in San Fran-cisco, with strong heterogeneity around this mean.Gibbons and Machin (2003) find similar results forEnglish primary schools. The analysis of Rothstein(2006) suggests that this willingness to pay is related topeer, rather than school, characteristics.
There are developments on the basic general equi-librium models of household location that explore thepotential impact of different types of school choiceprogrammes. Some models adapt scenarios wherebypublic schools make places available for non-neighbourhood families and these are allocated bylottery, with transportation costs providing an impor-tant disutility to travelling outside the neighbourhood(Brunner and Imazeki 2008; Epple and Romano2003). The winners and losers from this type ofchoice system (relative to strict neighbourhoodschooling) are complex, especially where poor familiescannot benefit due to high transportation costs. Otherchoice models introduce a voucher programme forprivate schools into a neighbourhood school system(Epple and Romano 1998; Nechyba 1999; Ferreyra2007). However, no existing theoretical models cur-rently combine the complexities of a typical Englishsecondary school admissions system, where catchmentareas are usually fairly porous and state-funded faithschools do not prioritise proximity.
Difference-in-difference approachEmpirical framework We adopt a simple linear modelto summarise the allocation of students to schools.Whilst in principle this allocation has many dimen-sions, we aim to describe in a straightforward waythe relationship between the academic quality of theschool attended and the socio-economic status of thestudent. Denoting the academic quality of school s asqs and the characteristic of pupil i as zi, we summarisethe assignment mechanism as E(qs(i)|zi), interpreted asthe likelihood of a student with characteristic z beingassigned to a school of quality q. This is a purelydescriptive relationship and has the advantage that itis independent of any specific location; for example, itis not based on the chance of being assigned to a spe-cific named school. We can therefore use it across anumber of LAs, allowing us to contrast the experienceof Brighton and Hove with other control LAs. Assum-ing a linear relationship, our model is:
qsðiÞ ¼ aþ ba0zi þ la þ ei ð1Þ
where subscript a denotes the area, in this case anLA. The outcome of the assignment mechanism is
6 Rebecca Allen et al.
Citation: 2012 doi: 10.1111/j.1475-5661.2012.00511.xISSN 0020-2754 � 2012 The Authors.Transactions of the Institute of British Geographers � 2012 Royal Geographical Society (with the Institute of British Geographers)

summarised by ba, varying by LA. The inclusion ofLA fixed effects takes out any mean differences inschool quality.
Our research question is whether and how b waschanged by the admissions reform in Brighton andHove. To address this we use a difference-in-differ-ence identification strategy, comparing the situationbefore and after the reform date in Brighton with thesame change in a set of matched control LAs.
Matched LAs We select nine LAs to act as our con-trol group. The key factor in the selection is that thecontrol LAs changed from the First Preference First(FPF) system to the Equal Preferences (EP) systemat the same time as Brighton and Hove. This ensuresthat we match any changes in assignment outcomesderiving from that change. We also rule out of consid-eration any LAs with a middle school structure (LAsthat had more than 10 per cent of year 7 studentsattending middle schools). We then ranked each LAby its similarity to Brighton and Hove using a rangeof LA-level variables: population density, percentageof students eligible for FSM, percentage of studentswho are White British, and segregation (using FSMand Ethnicity dissimilarity indices). A summary ofthese variables across Brighton and Hove and thecontrol LAs is shown in Table III. We see that Brigh-ton and Hove is slightly poorer and slightly less whitethan the controls. The distribution of test scoresmatches very well and also happens to match thenational distribution quite closely.
The nine LAs that provide the best matches are:North Somerset, North Tyneside, Peterborough, Plym-outh, Portsmouth, Southampton, Stoke, Suffolk, Swin-don, Telford and Wrekin. We use data from almostall pupils in these LAs, omitting those who attendspecial schools, a small group of less than 1 per centwho attend middle schools in year 7, and the 3 percent of students for whom we could not obtain schoolGCSE pass rates due to schools opening and closing(without acting as parent schools to subsequentschools). As a robustness check we ran all of ourregressions on different groups of control LAs. Usingonly five of our control LAs or increasing our control
group to contain 15 LAs did not change the mainconclusions of our analysis.
Difference-in-difference model The difference-in-dif-ference approach eliminates observed and unobservedfactors that are constant over time in each LA, andalso removes common changes that identically affectall our LAs (such as the shift from FPF to EP assign-ment mechanism). We estimate the following model:
qijk ¼ aþ ðb1 þ b2j þ b3ðBH�fyear ¼ 2009gÞþ b4ðBH�fyear ¼ 2010gÞÞZijk þ lj þ Tk ð2Þ
where i denotes student, j denotes LA (with Brightonand Hove as the baseline), BH specifically denotesBrighton and Hove LA, and k denotes year.
The first set of regressions model school quality asthe dependent variable to explore whether thereforms in Brighton and Hove have changed the rela-tionship between a pupil’s own characteristics and thecharacteristics of the school they attend. The parame-ters of interest are b3 and b4, which measure the year1 and year 2 effects of the policy respectively. Weallow the policy impact to vary over time as the initialeffect is likely to be diluted by the sibling rule forschool admission. We also run the model with theschool socio-economic composition as the dependentvariable. This second set of regressions will allow usto directly measure whether school segregation chan-ged as a result of the reforms.
We run our analysis using various different specifi-cations for the student characteristic Z: a dummymeasuring eligibility for FSM, the Income DeprivationAffecting Children Index (IDACI) score of the stu-dent’s home postcode, whether or not the student isin the top ⁄bottom (separately) quartile of the Key stage2 (KS2) distribution, and the student’s standardisedKS2 score. We also run a specification including sepa-rate dummies for the top and bottom quartiles of theKS2 distribution and the top and bottom quartiles ofthe IDACI (within LA). All regressions cluster stan-dard errors at the school level.
Data
Data on pupilsWe focus on the key years of this transition: the finalyear of primary school (at age 11) is called year 6,and the intake-year of secondary school is known asyear 7. The dataset we use in our analysis is theNational Pupil Database (NPD), an administrativedataset containing data on all pupils in state-main-tained primary and secondary schools in England. Wehave information about each pupil’s previous schools,which enables us to track pupils’ transitions from pri-mary to secondary schools and allows us to follow
Table III Comparison of Brighton and Hove withcontrol LAs
2007 ⁄ 2008 Brighton Control LAs
% Free school meals 17.6 16.8% White British 83.8 87.5Mean IDACI score 0.256 0.237Mean (normalised) KS2 score 0.051 0.007% in national top quartile KS2 26.2 24.5% in national bottom quartile KS2 24.4 24.7
Lotteries for school admissions 7
Citation: 2012 doi: 10.1111/j.1475-5661.2012.00511.xISSN 0020-2754 � 2012 The Authors.
Transactions of the Institute of British Geographers � 2012 Royal Geographical Society (with the Institute of British Geographers)
movements between LAs. We also have data onpupils who were in the state school system in the finalyear of primary school but absent in the intake-yearof secondary school, enabling us to examine whetherBrighton and Hove experienced an increase in pupilsentering the private system as a result of the reforms.
The NPD includes characteristics such as ethnicity,age, FSM eligibility (an indicator of poverty, recognis-ing its drawbacks as a proxy for low income; Hobbsand Vignoles 2010), indicators of special educationalneeds, as well as linked histories of all previous keystage test scores. The Key Stage 2 tests are taken atage 11 at the end of primary school in Science, Eng-lish and Maths, and these scores serve as a proxy foracademic success to date. We aggregate the underlyingscores in these three subjects and normalise this aggre-gate to create indicators for those who scored in thetop and bottom quartiles of the tests.
Crucially, we have data on pupils’ current and pastpostcodes, which enables us to assign each Brightonand Hove pupil to a catchment area and identifyneighbourhood characteristics. We have a postcodefor every year the child is at school. It is the postcodeof the child in the final year of primary school (year 6)that determines their catchment area, and subse-quently, schools that they will have priority to attend.However, as we suspect parents may not always keepschools informed of house movements, we use thepupils’ year 7 postcodes to assign catchment areasand neighbourhood characteristics, which we believeis a better indication of the pupils’ postcodes at thetime allocations were decided. The postcodes alsoallow us to assign each pupil to the relevant LowerLayer Super Output Area (LLSOA). This is anadministrative geography used for the collection andpublication of small area statistics. LLSOAs containaround 1500 residents on average.10 Based on theLLSOA, we use the IDACI to quantify the level ofdeprivation in pupils’ home neighbourhood. A house-hold is defined as being income deprived if it is
receiving Income Support ⁄ Income based Job SeekersAllowance ⁄ Pension Credits or those not in receipt of thesebenefits but in receipt of Working Tax Credit ⁄ Child TaxCredits with an equivalised income below 60 per cent ofthe national median before housing costs.11
This is one of our key variables: using the IDACI scoreto characterise the level of deprivation in a small areawill allow us to investigate how the quality of schoolsattended by pupils in the most deprived areas haschanged relative to those in more affluent areas.
Data on schoolsWe characterise secondary school quality in variousways in order to see exactly how school composition,segregation and assignments change for various
groups. Social profiles are aggregated from the pupil-level data for each cohort. We calculate the propor-tion of students who are eligible for FSM and themean IDACI score for each school, two measures ofthe deprivation in each cohort, with a view to observ-ing how these change for the subgroups after thereforms. To characterise the academic quality ofschools we use the widely quoted measure of the pro-portion of a school’s pupils achieving grades A* to Cin at least 5 GCSE exams at age 16 including Englishand Maths (%5A*–C). We use data from the mostrecent exams at the time the school applications aremade. For example, a child who starts school inSeptember 2008 will submit their application in Octo-ber 2007; we therefore use the May ⁄ June 2007 exampass rate as the indication of school quality. TheGCSE exams are important, nationally set, and comeat the end of compulsory schooling in the state sys-tem. Whilst quality measures such as contextual valueadded attempt to control for the quality of studentsschools intake (as measured by prior attainment) andadjust for the social composition of the school, GCSEpass rates are easy to interpret, making it easy forparents to compare schools.
Results
We first describe the changes in composition schoolsexperience in the first two years of the reform; wealso examine how movements to the neighbouringLAs and the private sector were affected. Second, wepresent a spatial analysis that enables us to locate the‘winners’ and ‘losers’ of the reforms. Third, we usethe difference-in-difference approach to test for anychanges in the pattern of assignment of students toschools.
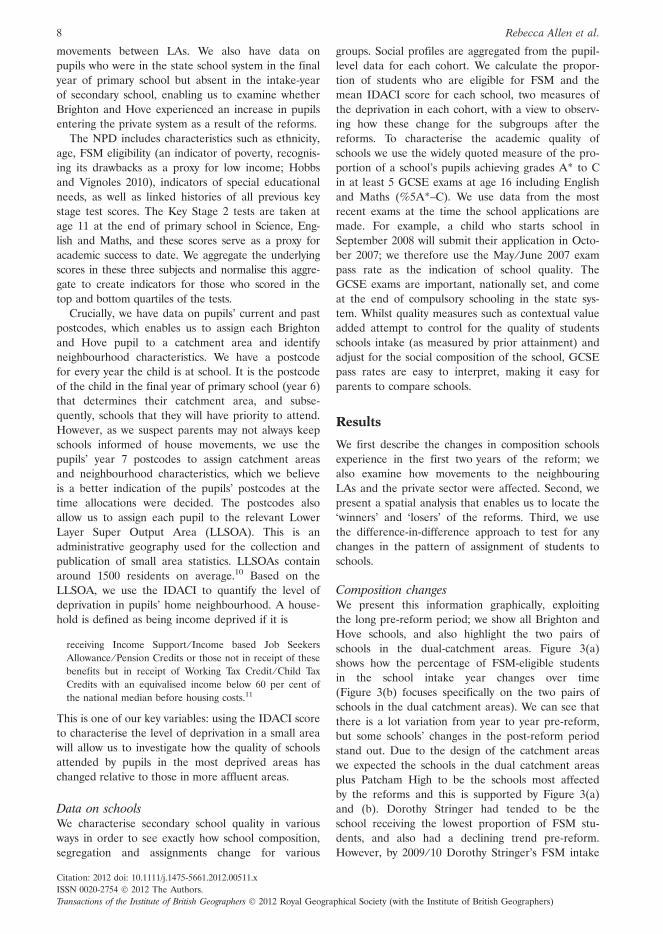
Composition changesWe present this information graphically, exploitingthe long pre-reform period; we show all Brighton andHove schools, and also highlight the two pairs ofschools in the dual-catchment areas. Figure 3(a)shows how the percentage of FSM-eligible studentsin the school intake year changes over time(Figure 3(b) focuses specifically on the two pairs ofschools in the dual catchment areas). We can see thatthere is a lot variation from year to year pre-reform,but some schools’ changes in the post-reform periodstand out. Due to the design of the catchment areaswe expected the schools in the dual catchment areasplus Patcham High to be the schools most affectedby the reforms and this is supported by Figure 3(a)and (b). Dorothy Stringer had tended to be theschool receiving the lowest proportion of FSM stu-dents, and also had a declining trend pre-reform.However, by 2009 ⁄ 10 Dorothy Stringer’s FSM intake
8 Rebecca Allen et al.
Citation: 2012 doi: 10.1111/j.1475-5661.2012.00511.xISSN 0020-2754 � 2012 The Authors.Transactions of the Institute of British Geographers � 2012 Royal Geographical Society (with the Institute of British Geographers)

percentage had doubled from the 2007 ⁄ 8 figure of 6per cent to just over 13 per cent. Similarly, Varndeansaw its FSM intake percentage increase from justover 16 per cent to almost 27 per cent – the secondhighest rate in the city. In the opposite direction wesee Patcham High, which is just north of Varndean,and Dorothy Stringer reduce its FSM intake percent-age from 25 per cent to 18 per cent. The BM ⁄HPcatchment area also experienced falls; BlatchingtonMill’s FSM intake fell slightly from 14 per cent to 11per cent while Hove Park’s fell by over a third from22 per cent to 14 per cent. These changes do notsimply reflect macro conditions: during this periodBrighton and Hove’s FSM rate remained constant at17.6 per cent.
Figure 4(a) shows the proportion of year 7s in eachschool who were in the top quartile of the KS2 scoredistribution, in their cohort (Figure 4(b) focuses spe-cifically on the two pairs of schools in the dual catch-ment areas). We would expect the proportion of top
quartile students attending a school to move in theopposite direction to the proportion of FSM studentsand this is indeed the case. Dorothy Stringer was notonly the school with the lowest FSM intake in 2007 ⁄ 8but also had the highest proportion of students whowere in the top quartile of the KS2 distribution; inthe years preceding the reforms it had seen anupwards trend in the proportion of its intake whowere in the top quartile, peaking at 44 per cent in theyear before the reforms were implemented. The twoyears following the reform saw this fall to 31 per centin 2009 ⁄ 10. Conversely, Hove Park increased its pro-portion of top quartile students from just over 20 percent to just under 30 per cent, almost converging withBlatchington Mill which had consistently (in each ofthe seven pre-reform years we have data for) had amuch higher proportion of top quartile students. Wedo not see much of a change in the other schools andperhaps surprisingly Patcham High only experiencedsmall gains. Figure 5(a) and (b) perform the equiva-
10
20
30
40
50
60
02001/2 2002/3 2003/4 2004/5 2005/6 2006/7 2007/8 2008/9 2009/10
Yea
r 7s
elig
ible
fo
r F
SM
(%
)
YearCOMART Varndean School
Dorothy Stringer High School Longhill High School
Falmer High School Portslade Community College
Blatchington Mill School and Sixth Form College Hove Park School and Sixth Form Centre
Patcham High School Cardinal Newman Catholic School
5
10
15
20
25
30
02001/2 2002/3 2003/4 2004/5 2005/6 2006/7 2007/8 2008/9 2009/10
YearVarndean School
Blatchington Mill School and Sixth Form College
Dorothy Stringer High School
Hove Park School and Sixth Form Centre
Yea
r 7s
elig
ible
fo
r F
SM
(%
)
(a)
(b)
Figure 3 Percentage of pupils eligible for free school meals by year 7 cohort in (a) school and (b) dual catchmentschools
Lotteries for school admissions 9
Citation: 2012 doi: 10.1111/j.1475-5661.2012.00511.xISSN 0020-2754 � 2012 The Authors.
Transactions of the Institute of British Geographers � 2012 Royal Geographical Society (with the Institute of British Geographers)
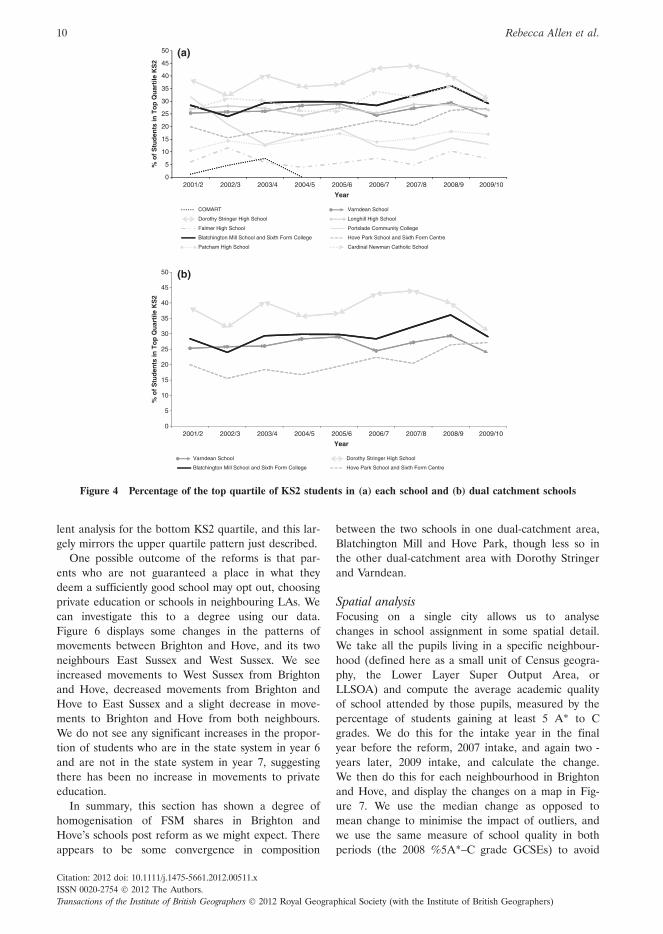
lent analysis for the bottom KS2 quartile, and this lar-gely mirrors the upper quartile pattern just described.
One possible outcome of the reforms is that par-ents who are not guaranteed a place in what theydeem a sufficiently good school may opt out, choosingprivate education or schools in neighbouring LAs. Wecan investigate this to a degree using our data.Figure 6 displays some changes in the patterns ofmovements between Brighton and Hove, and its twoneighbours East Sussex and West Sussex. We seeincreased movements to West Sussex from Brightonand Hove, decreased movements from Brighton andHove to East Sussex and a slight decrease in move-ments to Brighton and Hove from both neighbours.We do not see any significant increases in the propor-tion of students who are in the state system in year 6and are not in the state system in year 7, suggestingthere has been no increase in movements to privateeducation.
In summary, this section has shown a degree ofhomogenisation of FSM shares in Brighton andHove’s schools post reform as we might expect. Thereappears to be some convergence in composition
between the two schools in one dual-catchment area,Blatchington Mill and Hove Park, though less so inthe other dual-catchment area with Dorothy Stringerand Varndean.
Spatial analysisFocusing on a single city allows us to analysechanges in school assignment in some spatial detail.We take all the pupils living in a specific neighbour-hood (defined here as a small unit of Census geogra-phy, the Lower Layer Super Output Area, orLLSOA) and compute the average academic qualityof school attended by those pupils, measured by thepercentage of students gaining at least 5 A* to Cgrades. We do this for the intake year in the finalyear before the reform, 2007 intake, and again two -years later, 2009 intake, and calculate the change.We then do this for each neighbourhood in Brightonand Hove, and display the changes on a map in Fig-ure 7. We use the median change as opposed tomean change to minimise the impact of outliers, andwe use the same measure of school quality in bothperiods (the 2008 %5A*–C grade GCSEs) to avoid
0
10
15
20
25
30
35
40
45
50
5% o
f S
tud
ents
in T
op
Qu
arti
le K
S2
Year
COMART Varndean School
Dorothy Stringer High School Longhill High School
Falmer High School Portslade Community College
Blatchington Mill School and Sixth Form College Hove Park School and Sixth Form Centre
Patcham High School Cardinal Newman Catholic School
2001/2 2002/3 2003/4 2004/5 2005/6 2006/7 2007/8 2008/9 2009/10
% o
f S
tud
ents
in T
op
Qu
arti
le K
S2
10
15
20
25
30
35
40
45
50
0
5
2001/2 2002/3 2003/4 2004/5 2005/6 2006/7 2007/8 2008/9 2009/10
Year
Varndean School Dorothy Stringer High School
Blatchington Mill School and Sixth Form College Hove Park School and Sixth Form Centre
(a)
(b)
Figure 4 Percentage of the top quartile of KS2 students in (a) each school and (b) dual catchment schools
10 Rebecca Allen et al.
Citation: 2012 doi: 10.1111/j.1475-5661.2012.00511.xISSN 0020-2754 � 2012 The Authors.Transactions of the Institute of British Geographers � 2012 Royal Geographical Society (with the Institute of British Geographers)

differences caused by grade inflation. The differencebetween the average quality of school attended isplotted for each LLSOA using a graduated scale withwhite representing small or no effect, and black rep-
resenting the largest effects. The striped areas indi-cate the median change was negative with solidcolours representing the areas that experienced posi-tive changes.
0
10
20
30
40
50
60
70
% o
f S
tud
ents
in B
ott
om
Qu
arti
le K
S2
Year
COMART Varndean School
Dorothy Stringer High School Longhill High School
Falmer High School Portslade Community College
Blatchington Mill School and Sixth Form College Hove Park School and Sixth Form Centre
Patcham High School Cardinal Newman Catholic School
2001/2 2002/3 2003/4 2004/5 2005/6 2006/7 2007/8 2008/9 2009/10
% o
f S
tud
ents
in B
ott
om
Qu
arti
le K
S2
10
15
20
25
30
35
0
5
2001/2 2002/3 2003/4 2004/5 2005/6 2006/7 2007/8 2008/9 2009/10
Year
Varndean School Dorothy Stringer High School
Blatchington Mill School and Sixth Form College Hove Park School and Sixth Form Centre
(a)
(b)
Figure 5 Percentage of the bottom quartile of KS2 students in (a) each school and (b) dual catchment schools
30
40
50
60
70
80
90
100
Nu
mb
er o
f M
ove
rs
0
10
20
2001/2002 2002/2003 2003/2004 2004/2005 2005/2006 2006/2007 2007/2008 2008/2009 2009/2010
YearBN to East Sussex BN to West Sussex West Sussex to BN
East Sussex to BN East Sussex to West Sussex West Sussex to East Sussex
Figure 6 Movements between Brighton and Hove (BN) and neighbouring LAs
Lotteries for school admissions 11
Citation: 2012 doi: 10.1111/j.1475-5661.2012.00511.xISSN 0020-2754 � 2012 The Authors.
Transactions of the Institute of British Geographers � 2012 Royal Geographical Society (with the Institute of British Geographers)

Figure 7 shows that a minority of areas in Brightonexperienced major changes in school quality as aresult of the reforms. As noted earlier, the Longhill,Falmer and Portslade catchments were largelyunaffected by the reforms, with only a small numberof neighbourhoods in those areas experiencing sub-stantial increases or decreases in the quality of schoolattended; pupils in the southern part of the Portsladearea who were now unable to attend Hove Park expe-rienced the most visible change of these areas.12
The areas that experienced the biggest medianchange in the quality of school attended were thosein the south of the Patcham catchment area. Pupils inthese areas are very close to Dorothy Stringer andVarndean, and attended these high-performing andpopular schools. Post-reform, pupils in these areasgenerally attend Patcham High unless they have a sib-ling link elsewhere, or are able to get a place inCardinal Newman. The northern part of the Patchamarea was largely unaffected by the reforms. Con-versely, the southern parts of both dual catchmentareas appear to be the biggest beneficiaries, with the
majority of the gains experienced in these two areas.The ‘almost’ guarantee of a place of one of the twocatchment schools in the V ⁄DS area means that thosepupils in the southern areas who previously wouldhave been unlikely to get into any of the oversub-scribed schools are now effectively guaranteed a placeat one of the top schools in the city; equally theincreased probability of a place in Blatchington Millfor those on the southern coast of HP ⁄BM area meansuch gains were not unexpected. However, samplesize becomes an issue in the southern coast of theHP ⁄BM area, with some of the LLSOAs having asfew as two children in each cohort. The areas imme-diately surrounding Blatchington Mill also see somelosers as many living there have seen their almost cer-tain access to that school replaced by a lotterybetween Blatchington Mill and Hove Park.
Table IV gives an overview of the school destina-tions of pupils from the various catchment areas bothbefore the catchments were designed and post-reform. Table IV clearly shows the decline in pupilsfrom the Patcham area attending Varndean and
Figure 7 Graduated quality change by neighbourhood (Lower Layer Super Output Area, LLSOA)
12 Rebecca Allen et al.
Citation: 2012 doi: 10.1111/j.1475-5661.2012.00511.xISSN 0020-2754 � 2012 The Authors.Transactions of the Institute of British Geographers � 2012 Royal Geographical Society (with the Institute of British Geographers)

Dorothy Stringer, with both schools accepting farfewer students from the area; we expect to see furtherdecreases when the cross-catchment sibling links arephased out from 2012. We see a similar story for theFalmer catchment, which previously had some of itswestern edge students relatively close to Varndean.The percentage of students attending their designatedcatchment school(s) increases in every area.
Summarising this evidence, the distinct winners andlosers from the reform relate very strongly to the newcatchment areas, and the abolition of proximity as thetie-breaker for over-subscribed schools.
Regression analysisWe now report our findings from the pupil-level dif-ference-in-difference regressions in equation (2), pre-sented in Tables V and VI. The treatment groupcomprises all pupils who attended a school in Brigh-
ton and Hove. In all regressions we include LA-leveldummies to control for mean differences in schoolquality, LA-variable interactions to capture differ-ences in the mean allocation patterns and year dum-mies to control for any macro time trend. Thestandard errors are clustered at the LA level in allregressions, as this is the level of the policy change.
To measure the expected quality of the assignedschool for a student of a given type, we regress aschool-level characteristic (on the left hand side) onan individual characteristic on the right. This providesa summary description of the assignment of studentsto schools, measuring the expected school characteris-tic for a student of a given individual type. We usetwo different school characteristics, academic qualityand socio-economic composition, and the two mea-sures of the student’s circumstances. Thus the modelswith academic quality as the school characteristic are
Table IV Transition table showing the percentage of catchment area which attended each school
Catchment name N VarndeanDorothyStringer Longhill
FalmerHigh Portslade
BlatchingtonMill
HovePark Patcham
CardinalNewman Other
BM ⁄ HP2008BM ⁄ HP2010
637712
2.201.54
8.162.53
0.320.14
0.160.14
2.980.98
41.9240.03
21.3530.90
0.941.26
19.1520.65
2.821.83
Falmer2008Falmer2010
205218
16.1012.84
4.882.29
1.950.46
39.5249.08
0.490.46
00.46
2.932.29
15.6116.97
9.268.26
9.266.89
Longhill2008Longhill2010
331341
3.324.11
1.210.88
63.7568.33
3.322.93
0.600.59
1.210.29
6.341.17
3.631.76
12.0812.9
4.547.04
Patcham2008Patcham2010
177205
20.9013.66
18.088.29
0.560.49
3.953.41
00
00
0.560.49
45.263.41
9.046.83
1.713.42
Portslade2008Portslade2010
221236
0.450
00
00
0.450.42
38.4659.32
5.883.39
37.1023.73
00.42
11.768.05
5.904.67
Varn ⁄ DS2008Varn ⁄ DS2010
503542
25.9234.87
42.9447.97
3.681.29
3.091.85
0.390.18
00.37
2.900.55
5.612.03
10.838.86
4.642.03
Total2008Total2010
20932260
10.9911.99
15.2913.45
11.4210.80
5.646.02
5.216.68
13.5713.14
12.5212.83
7.648.58
13.3312.92
4.393.6
Table V Socio-economic characteristics and school allocation
Outcome
%5A*-C %FSM %5AC School mean IDACI score
(1) (2) (3) (4)
Specification FSM FSM IDACI IDACI
Variable )4.348*** 3.513*** – –(0.286) (0.111)
IDACI score – – )19.47*** 0.151***(0.738) (0.000928)
Policy in year 1 )1.867*** 3.064*** )4.853*** 0.00120(0.529) (0.373) (1.226) (0.00309)
Policy in year 2 )4.460*** 0.578 )7.753** 0.00223(1.155) (0.471) (2.996) (0.00263)
N 108 813 111 759 108 829 111 775R2 0.121 0.194 0.220 0.442
Notes: Unit is a pupil; ‘Policy in year 1’ means the interaction of: the main variable (FSM in columns 1 and 2), location in Brightonand Hove LA, ‘after’ year 1; standard errors in parentheses and standard errors are clustered at LA level; significance levels are* p < 0.1, ** p < 0.05, *** p < 0.01; all regressions include LA*main variable interactions, LA and year dummies
Lotteries for school admissions 13
Citation: 2012 doi: 10.1111/j.1475-5661.2012.00511.xISSN 0020-2754 � 2012 The Authors.
Transactions of the Institute of British Geographers � 2012 Royal Geographical Society (with the Institute of British Geographers)

measuring the chances of poor and non-poor studentsaccessing high-quality schools; the models with socio-economic composition as the school characteristic aremeasuring segregation, that is, the relative chances ofpoor and non-poor of attending high-poverty schools.These regressions are run over the treated LA andthe controls to implement the difference-in-differenceanalysis; the model also includes interactions of thesewith all the LA dummies to allow the structure of theallocation to vary by place. The key terms are the pol-icy variables, which are the interaction of the individ-ual characteristic (FSM or IDACI) and the treatment,namely being in Brighton and Hove after the policychange.
In Table V we examine school allocation by stu-dents’ socio-economic status, measured by first indi-vidual poverty (FSM) and then (very small)neighbourhood poverty (IDACI). Column 1 showsthat FSM eligible students attended schools thatachieved around 4.3 percentage points lower 5 A*–CGCSEs on average than non-FSM students, about aquarter of a standard deviation. The coefficients onthe policy variables are significantly negative in bothof the after periods, increasing the average schoolquality gap to nearly half of a standard deviation forFSM eligible students in the second year of the pol-icy. Column 3 shows how the relationship betweenIDACI scores and school quality changes after thereforms. The negative coefficient in the second year
of the policy shows that the gap increases post-reform: students at the median attended schools withpass rates 0.29 of a standard deviation lower thanthose in the most affluent areas. The policy changecoefficients are both significantly different fromzero.13
Turning to the segregation results, column 2 showsthat FSM-eligible students on average attend schoolswith around 3.5 per cent (0.30 of a standard devia-tion) more FSM students. This is obviously not sur-prising given socio-economic sorting, and we haveshown elsewhere (Allen et al. 2009) that in this con-text the OLS regression coefficient is equivalent tothe eta-squared measure of segregation. The policyeffect is positive (implying schools are becoming moresegregated) in both years, but the effect is only signifi-cant in the first year. The IDACI score is a finer mea-sure of the deprivation experienced in a pupil’s localarea, with a score of 1 indicating 100 per cent of chil-dren aged between 0 and 15 in the area are deprivedand a score of 0 indicating none are deprived. InBrighton and Hove the IDACI scores range between0.02 and 0.74 in Brighton with a median value of 0.2.Column 4 shows that, on average, students fromdeprived areas attend schools that have more studentsfrom deprived areas; this is expected due to the loca-tion of schools and clustering of deprivation in Brigh-ton. The policy coefficients are close to zero in bothpost-reform periods; both regressions have policy
Table VI Prior test score and school allocation (outcome is % of students scoring 5 A*–C in destination school)
NormalisedKS2 score
KS2 topquartile
KS2 bottomquartile
KS2 top andbottom quartiles
IDACI top andbottom quartiles
(1) (2) (3) (4) (5)
Level 3.990*** 6.688*** )5.456***(0.0220) (0.310) (0.314)
Policy in year 1 )0.507*** )2.281*** )1.914***(0.0557) (0.512) (0.517)
Policy in year 2 )1.284*** )4.002*** )0.929(0.0806) (1.178) (1.194)
Bottom quartile level )4.118*** )6.458***(0.312) (0.282)
Policy in year 1 )1.970*** )0.0179(0.508) (0.483)
Policy in year 2 )1.034 )2.221*(1.199) (1.106)
Top quartile level 5.200*** 3.984***(0.312) (0.284)
Policy in year 1 )2.322*** )2.906***(0.509) (0.483)
Policy in year 2Level
)4.014*** )5.461***(1.199) (1.108)
N 107 761 107 761 107 761 107 761 108 829adj. R2 0.196 0.187 0.125 0.202 0.204
Notes: Unit is a pupil; ‘Policy in year 1’ means the interaction of: the main variable (KS2 score in column 1), location in Brighton andHove LA, ‘after’ year 1. Standard errors in parentheses and standard errors are clustered at LA level. Significant levels are * p < 0.1,** p < 0.05, *** p < 0.01; All regressions include LA*main variable interactions, LA and year dummies
14 Rebecca Allen et al.
Citation: 2012 doi: 10.1111/j.1475-5661.2012.00511.xISSN 0020-2754 � 2012 The Authors.Transactions of the Institute of British Geographers � 2012 Royal Geographical Society (with the Institute of British Geographers)

effects that were not significantly different from zero,suggesting the reforms have not had much of aneffect in terms of overall segregation.
Table VI looks at school allocation by students’KS2 scores, using the same measure of school aca-demic quality, the GCSE pass rate (%5A*–C) of thepupils’ destination school at the time of applying. Col-umn 1 uses the student’s normalised KS2 score, andthe estimates show a strong positive relationshipbetween the level of this and the quality of schoolattended. This reflects neighbourhood clustering, notacademic selection; see below. The difference-in-difference variables show that this gradient is signifi-cantly reduced, indicating some degree of homogeni-sation. By the second year, this is quantitatively aswell as statistically significant.
To understand where in the distribution this is hap-pening, column 2 focuses on the top quartile of KS2.Pre-reform, students in the top quartile of the KS2distribution attended schools that were an average ofover a third of a standard deviation better than otherstudents. The reforms reduced this gap to a quarterand then a sixth of a standard deviation in the firstand second post-reform years respectively, both statis-tically significant results. Given the results of our spa-tial analysis, it seems likely that a significant part ofthe relative deterioration in school quality for highKS2 students in Brighton and Hove is located in thearea that lost access to Dorothy Stringer and Varn-dean. Column 3 shows a fall for the bottom quartiletoo, though smaller and insignificant by the secondyear. Column 4 includes the two quartiles togetherand the results are confirmed: the policy variables forboth the top and the bottom students remain similarin size – and remain significant for the top quartile –and imply that the policy benefited the students inthe middle of the KS2 distribution the most. Column5 repeats this analysis for quartiles of neighbourhooddeprivation rather than prior scores. We haverepeated the analysis in this table using instead theschool mean KS2 score as the dependent variable,14
and these results (available from the authors) tell avery similar story to that in Table VI: the associationwith the student’s own KS2 score remains, but weak-ens after the policy change, the effect stronger in thefirst year than the second.
In Figure 8 we display the average school qualityby KS2 decile before and after the policy change. Thisis just for Brighton and Hove and is an unconditionalplot, so will not exactly replicate the results inTable VI. It shows a degree of homogenisation: theallocation line is somewhat flatter after the reform,with much of the gap happening at the higher KS2scores.15
Summarising the regression results, Table V suggeststhat the policy tended to increase socio-economic
segregation and allocate disadvantaged children tolower performing schools in Brighton and Hove.Table VI provides evidence of some significanthomogenisation of school allocation by KS2 score:the policy reduced the differential school quality ofhigh KS2 students in Brighton and Hove.
Conclusion
Educational inequalities are a central part of the over-all picture of inequality in Britain (National EqualityPanel 2010). There are substantial differences ingrades achieved at GCSE between poor and non-poorstudents. Part of this difference arises from the qualityof school attended. In general it is hard to quantify theimpact of school effectiveness on test scores becauseof selection issues (Allen and Burgess 2010). However,Sacerdote (2010) for example provides convincing evi-dence that schools matter, by exploiting an exogenousreallocation of students. If schools matter, theninequalities in access to high-performing schools mat-ters. Burgess and Briggs (2010) and Singleton et al.(2011) show that these are substantial. Burgess andBriggs (2010) report that students from poor familieshave approximately half the chance of attending high-performing schools of non-poor families. They alsoshow that this is mostly due to location, rather thanmore affluent families ‘working the system’.
One policy proposed to deal with this unequal accessis to use lotteries rather than proximity as a tie-breakerfor over-subscribed schools. Brighton and Hove’simplementation of the use of lotteries within distinctcatchment areas is a major school admissions reform,the first of its kind in England. This study is the firstanalysis of the early impacts of the reforms in Brightonand Hove. The introduction of a lottery of schoolplaces has led to widespread interest across thenational media and from policymakers in other cities.
Figure 8 Academic quality of school attended by KS2decile in Brighton and Hove
Lotteries for school admissions 15
Citation: 2012 doi: 10.1111/j.1475-5661.2012.00511.xISSN 0020-2754 � 2012 The Authors.
Transactions of the Institute of British Geographers � 2012 Royal Geographical Society (with the Institute of British Geographers)

Although it had largely been assumed that the lotterywould lower social segregation, we have shown that there-drawing of catchment areas in the city, introduced atthe same time as part of the lottery system, has consid-erably complicated the patterns of winners and losers.
Under some conditions we would expect to seesome homogenisation of intakes within the dual-catchment areas using lotteries. This is clearlyreflected in the data for one of these areas (Blatch-ington Mill, Hove Park). In the other (DorothyStringer, Varndean), there is convergence between thepair of schools and the rest of the city, but no realconvergence between the two schools. This is becausethe boundary drawn around the first area was a lotcloser to the de facto pre-existing catchment areas forthose schools, and so the major effects were internalto the area, whereas the boundary drawn around thesecond pair cut right across the pre-existing catch-ments and so the adjustments involved other schoolsas well. This degree of homogenisation is alsoreflected in our difference-in-difference results. Wefind after the reform a weakening of the dependenceof the quality of school attended on the student’sprior test score, reflecting a weakening of the depen-dence on location. However, when we analyse segre-gation directly we find increased segregation, alsoarising from the design of the catchment areas. Thesefindings are not contradictory. There are two distinctissues here, both outcomes of the process assigningstudents to schools. The concept of sorting or segre-gation relates to the degree to which alike people areassigned to the same school, but does not considerthe quality of that school. A separate question is theassignment of students with particular characteristicsto schools of particular quality. Logically, these aredistinct issues, and the findings are not contradictory.They illustrate the complex interactions of place andbehaviour generating the observed school allocation.
There are clearly winners and losers from thesereforms: some students are attending less academi-cally successful secondary schools than they mighthave expected to; for others the reverse is true. Thelocation of these winners and losers largely derivefrom the design of the catchment areas rather thanthe impact of the lottery where it applies. So, thelargest group who see a deterioration in academicquality of school they attend are those who lived closeenough to access Dorothy Stringer under the oldproximity allocation, but now have Patcham High des-ignated as their catchment area school. Similarly, thelargest group of winners are those who live on the fareast of the newly created Varndean ⁄Dorothy Stringercatchment area that did not live close enough to gaina place at either school under the old allocation. Onereason why the impact of the reform has followedcatchment area boundaries so closely has been that
school capacity is relatively constrained within thecity. This means that, although the allocation doesprovide for a lottery to take place between out-of-catchment applicants, in reality there have beenfew spaces available at the most popular schools oncepriority to those living within the catchment zone hasbeen accounted for.
It will be several more years before the long-runimpact of the school admission reforms in Brightonand Hove become apparent because we do expectfamilies to relocate and house prices to adjust inresponse to the re-drawing of the catchment bound-aries. Nevertheless, it seems unlikely that the reformsare likely to substantially lower social segregationacross schools even in the long-run in this city, wheredifferences in the quality of housing stock acrossareas are deeply entrenched and the boundaries ofthe new catchment areas mean that families living inthe most deprived neighbourhoods have little chanceof accessing the most popular schools in the centre ofthe city. A major decline in social segregation inBrighton and Hove schools requires a lottery systemwith catchment boundaries significantly different fromthose actually implemented to date. One of the mes-sages of our study is therefore that while lotteries doindeed produce greater equality of access to high-performing schools within catchments areas, the draw-ing of those catchment areas is crucial in determiningthe overall change in educational inequality. This isan issue we are pursuing in further research.
Acknowledgements
Thanks are due to Brighton and Hove Local Author-ity for provision of the secondary school admissiondata and to the Department of Education for accessto the National Pupil Database. Thanks to the Editorand referees for some excellent suggestions, and alsoto seminar participants at the Institute of Educationfor helpful comments, and to the ESRC for fundingthis project through CMPO.
Notes
1 See http://download.cabinetoffice.gov.uk/social-mobility/opening-doors-breaking-barriers.pdf (accessed 7 Novem-ber 2011).
2 Defined as pupils eligible for free school meals (FSM).3 GCSE stands for General Certificate in Secondary Edu-
cation, and these are the final exams taken at the end ofcompulsory schooling in England. Students typically takeabout eight of these courses.
4 See, for example, the background reports to theNational Equality Panel’s final report: http://www.equalities.gov.uk/national_equality_panel/publications/research_reports.aspx (accessed 10 May 2010)
16 Rebecca Allen et al.
Citation: 2012 doi: 10.1111/j.1475-5661.2012.00511.xISSN 0020-2754 � 2012 The Authors.Transactions of the Institute of British Geographers � 2012 Royal Geographical Society (with the Institute of British Geographers)

5 Secondary School Admissions in Brighton and Hove2010 ⁄ 11 booklet (http://www.brighton-hove.gov.uk/down-loads/bhcc/schools/Secondary_Admissions_Booklet_2010-11.pdf (page 22, accessed 3 May 2010): ‘if a school isoversubscribed with applicants who live within the catch-ment area, we will negotiate with the school in questionto try to secure additional places’. ‘If your child’s homeaddress is within a catchment area which applies to twoschools (i.e. Varndean and Dorothy Stringer or HovePark and Blatchington Mill) we will do our best toensure that you are offered a place at one of theseschools, as long as you list preferences for both of theschools in your catchment area.’
6 Secondary School Admissions in Brighton and Hove2009 ⁄ 10 (http://www.brighton-hove.gov.uk/downloads/bhcc/education/school_admissions_2006_07/1935_Secondary_Admission_booklet_09-10%28final%29.pdf) page 34, acces-sed 20 April 2010.
7 See http://www.education.gov.uk/rsgateway/DB/STR/d000833/index.shtml for 2009, and for 2008 see http://www.education.gov.uk/rsgateway/DB/STA/t000791/index.shtml (both accessed 4 July 2011).
8 In 2008 48.1 per cent of year 11 pupils achieved 5 A*–Cgrades including English and Maths nationally.
9 CVA attempts to control for personal characteristics suchas free school meal status and ethnicity, as well as abilityusing previous test scores. This is currently the mostwidely quoted measure of value-added. For more informa-tion on what is included in the CVA measure visit http://www.standards.dfes.gov.uk/performance/1316367/CVAinPAT2005/ (accessed 12 July 2010)
10 See http://www.neighbourhood.statistics.gov.uk/dissemination/Info.do?page=aboutneighbourhood/geography/superoutputareas/soafaq/soa-faq.htm (accessed 12 July 2010)
11 See http://www.communities.gov.uk/documents/communities/pdf/733520.pdf (accessed 12 July 2010)
12 The south east of Falmer has two peculiar LLSOAs, onethat experiences big gains and one that appears to be a bigloser; this can be explained by changes in the number ofyear 7s in these areas. The ‘winner’ experienced a declinein the number of year 7s, whilst the number attending thetop schools increased. The ‘loser’ experienced an increasein students from 23 to 33 and whilst the number attendingschools other than Falmer High remained constant at 19,the median school quality decreased as a result of this.These serve as an example of how our spatial analysis issensitive to changes in the number of pupils over time.
13 If we cluster standard errors at school level, our estimatesare much less precise and significance levels fall; perhapsthis is asking too much of a dataset with only nine schools.
14 Thanks to a referee for this idea.15 The higher school quality for low KS2 students in the
figure does not match the results in Table VI becausethe latter estimates differential changes in Brighton andHove relative to the control LAs.
References
Abdulkadiroglu A and Sonmez T 2003 School choice: amechanism design approach American Economic Review93 729–47
Abdulkadiroglu A, Pathak P A, Roth A E and Sonmez T2005 The Boston public school match The American Eco-nomic Review 95 368–71
Allen R 2007 Allocating pupils to their nearest school: theconsequences for ability and social stratification UrbanStudies 44 751–70
Allen R and Burgess S 2010 ‘Evaluating the provision ofschool performance information for school choice’ Work-ing paper 10 ⁄ 241 CMPO, Bristol
Allen R and Vignoles A 2007 What should an index of schoolsegregation measure? Oxford Review of Education 33 643–68
Allen R, Burgess S and Key T 2010 ‘Choosing secondaryschool by moving house: school quality and the formationof neighbourhoods’ Working paper 10 ⁄ 238 CMPO, Bristol
Allen R, Burgess S and Windmeijer F 2009 More reliableinference for segregation indices Working paper 09 ⁄ 216CMPO, Bristol
Bayer P, Fernando F and McMillan R 2007 A unified frame-work for measuring preferences for schools and neighbor-hoods Journal of Political Economy 115 588–638
Black S 1999 Do better schools matter? Parental evaluationof elementary education Quarterly Journal of Economics114 577–99
Bogart W T and Cromwell B A 1997 How much more is agood school district worth? National Tax Journal 50 215–32
Bogart W T and Cromwell B A 2000 How much is a neigh-bourhood school worth? Journal of Urban Economics 47280–305
Brunner E J and Imazeki J 2008 Tiebout choice and universalschool vouchers Journal of Urban Economics 63 253–79
Burgess S and Briggs A 2010 School assignment, schoolchoice and social mobility Economics of Education Review29 639–49
Burgess S, McConnell B, Propper C and Wilson D 2006 Theimpact of school choice on sorting by ability andsocio-economic factors in English secondary education inWoessmann L and Peterson P eds Schools and the equalopportunity problem MIT Press, Cambridge MA 273–92
Butler T and Hamnett C 2007 The geography of educationUrban Studies 44 1161–74
Cheshire P C and Sheppard S C 1995 On the price of landand the value of amenities Economica 62 247–67
Epple D and Romano R E 1998 Competition between pri-vate and public schools, vouchers and peer-group effectsAmerican Economic Review 88 33–62
Epple D and Romano R E 2003 Neighbourhood schools,choice, and the distribution of educational benefits inHoxby C M eds The economics of school choice Universityof Chicago Press, Chicago IL 227–86
Ferreyra M M 2007 Estimating the effects of private schoolvouchers in multidistrict economies The American Eco-nomic Review 97 789–817
Gale D and Shapley L S 1962 College admissions and thestability of marriage The American Mathematical Monthly69 9–15
Gibbons S and Machin S 2003 Valuing English primaryschools Journal of Urban Economics 53 197–219
Gibbons S and Telhaj S 2007 Are schools drifting apart?Intake stratification in English secondary schools UrbanStudies 44 1281–305
Lotteries for school admissions 17
Citation: 2012 doi: 10.1111/j.1475-5661.2012.00511.xISSN 0020-2754 � 2012 The Authors.
Transactions of the Institute of British Geographers � 2012 Royal Geographical Society (with the Institute of British Geographers)

Goodman A C and Thibodeau T G 1998 Housing marketsegmentation Journal of Housing Economics 7 121–43
Gorard S, Taylor C and Fitz J eds 2003 Schools, markets andchoice policies RoutledgeFalmer, London
Hamnett C and Butler T 2011 ‘Geography matters’: the roledistance plays in reproducing educational inequality inEast London Transactions of the Institute of British Geogra-phers 36 479–500
Harris R and Johnston R 2008 Primary schools, markets andchoice: studying polarization and the core catchment areasof schools Applied Spatial Analysis and Policy 1 59–84
Hobbs G and Vignoles A 2010 Is children’s free school meal‘eligibility’ a good proxy for family income? British Educa-tional Research Journal 36 673–90
Hoxby C M 2000 Does competition among public schoolsbenefit students and taxpayers? American EconomicReview 90 1209–38
Hoxby C M 2005 ‘Competition among public schools:A reply to Rothstein (2004)’ Working paper 11216National Bureau for Economic Research, Cambridge, MA
Leech D and Campos E 2003 Is comprehensive educationreally free? A case study in the effect of secondary schooladmissions policies on house prices in one local area Jour-nal of the Royal Statistical Society Series A 166 135–54
National Equality Panel 2010 An anatomy of economic inequal-ity in the UK: report of the National Equality Panel Govern-ment Equalities Office, London (http://www.equalities.gov.uk/national_equality_panel/publications.aspx) Accessed10May 2011
Nechyba T J 1999 School finance-induced migration andstratification patterns: the impact of private school vouch-ers Journal of Public Economic Theory 1 5–50
Nechyba T J 2000 Mobility, targeting and private schoolvouchers American Economic Review 90 130–46
Rosenthal L 2003 The value of secondary schooling OxfordBulletin of Economics and Statistics 65 329–55
Roth A E 1984 The evolution of the labor market for medi-cal interns and residents: a case study in game theory Jour-nal of Political Economy 92 991–1016
Rothstein J 2005 ‘Does competition among public schoolsbenefit students and taxpayers? A Comment on Hoxby2000’ Working paper 11215 National Bureau for EconomicResearch, Cambridge, MA
Rothstein J M 2006 Good principals or good peers? Parentalvaluation of school characteristics, Tiebout equilibrium,and the incentive effects of competition among jurisdic-tions American Economic Review 96 1333–50
Sacerdote B 2010 ‘When the saints go marching out: canhurricanes Katrina and Rita teach us about closing unsuc-cessful schools?’ Mimeo Dartmouth College
Sattinger M 1980 Capital and the distribution of labor earn-ings North-Holland, Amsterdam
Sieg H, Smith V K, Banzhof H S and Walsh R 1999 The roleof optimizing behavior in willingness-to-pay estimates forair quality American Journal of Agricultural Economics 811112–7
Singleton A, Longley P, Allen R and O’Brien O 2011 Esti-mating secondary school catchment areas and the spatialequity of access Computers, Environment and Urban Sys-tems 35 241–9
Tinbergen J 1959 On the theory of income distribution inKlaassen L H, Koyck L M and Witteveen H J eds Selectedpapers of Jan Tinbergen North-Holland, Amsterdam243–63
Webber R and Butler T 2007 Classifying pupils by wherethey live: how well does this predict variations in theirGCSE results? Urban Studies 44 1229–54
West A, Barham E and Hind A 2009 Secondary school admis-sions in England: policy and practice Research and Infor-mation on State Education Trust
18 Rebecca Allen et al.
Citation: 2012 doi: 10.1111/j.1475-5661.2012.00511.xISSN 0020-2754 � 2012 The Authors.Transactions of the Institute of British Geographers � 2012 Royal Geographical Society (with the Institute of British Geographers)