The sequential aerosol technique - Home | Food and ... · The Sequential Aerosol Technique: ......
9
The Sequential Aerosol Technique: A Major Component in an Integrated Strategy of Intervention against Riverine Tsetse in Ghana Yahaya Adam 1 , Giuliano Cecchi 2 , Patrick M. Kgori 3 , Tanguy Marcotty 4,5 , Charles I. Mahama 1 , Martin Abavana 1 , Benita Anderson 6 , Massimo Paone 2 , Raffaele Mattioli 2 , Je ´ re ´ my Bouyer 7,8 * 1 Veterinary Services Department of the Ministry of Food and Agriculture, Pong-Tamale, Ghana, 2 Food and Agriculture Organization of the United Nations, Animal Production and Health Division, Rome, Italy, 3 Ministry of Agriculture, Department of Veterinary Services, Maun, Botswana, 4 Department of Biomedical Sciences, Institute of Tropical Medicine, Antwerpen, Belgium, 5 Department of Veterinary Tropical Diseases, Faculty of Veterinary Science, University of Pretoria, Pretoria, South Africa, 6 Veterinary Services Department of the Ministry of Food and Agriculture, Accra, Ghana, 7 Unite ´ Mixte de Recherche Contro ˆ les des Maladies Animales et Emergentes, Centre de Coope ´ ration Internationale en Recherche Agronomique pour le De ´veloppement, Montpellier, France, 8 Institut Se ´ne ´galais de Recherches Agricoles, Laboratoire National d’Elevage et de Recherches Ve ´te ´rinaires, Dakar, Se ´ne ´gal Abstract Background: An integrated strategy of intervention against tsetse flies was implemented in the Upper West Region of Ghana (9.62u–11.00u N, 1.40u–2.76u W), covering an area of <18,000 km 2 within the framework of the Pan-African Tsetse and Trypanosomosis Eradication Campaign. Two species were targeted: Glossina tachinoides and Glossina palpalis gambiensis. Methodology/Principal Findings: The objectives were to test the potentiality of the sequential aerosol technique (SAT) to eliminate riverine tsetse species in a challenging subsection (dense tree canopy and high tsetse densities) of the total sprayed area (6,745 km 2 ) and the subsequent efficacy of an integrated strategy including ground spraying (<100 km 2 ), insecticide treated targets (20,000) and insecticide treated cattle (45,000) in sustaining the results of tsetse suppression in the whole intervention area. The aerial application of low-dosage deltamethrin aerosols (0.33–0.35 g a.i/ha) was conducted along the three main rivers using five custom designed fixed-wings Turbo thrush aircraft. The impact of SAT on tsetse densities was monitored using 30 biconical traps deployed from two weeks before until two weeks after the operations. Results of the SAT monitoring indicated an overall reduction rate of 98% (from a pre-intervention mean apparent density per trap per day (ADT) of 16.7 to 0.3 at the end of the fourth and last cycle). One year after the SAT operations, a second survey using 200 biconical traps set in 20 sites during 3 weeks was conducted throughout the intervention area to measure the impact of the integrated control strategy. Both target species were still detected, albeit at very low densities (ADT of 0.27 inside sprayed blocks and 0.10 outside sprayed blocks). Conclusions/Significance: The SAT operations failed to achieve elimination in the monitored section, but the subsequent integrated strategy maintained high levels of suppression throughout the intervention area, which will contribute to improving animal health, increasing animal production and fostering food security. Citation: Adam Y, Cecchi G, Kgori PM, Marcotty T, Mahama CI, et al. (2013) The Sequential Aerosol Technique: A Major Component in an Integrated Strategy of Intervention against Riverine Tsetse in Ghana. PLoS Negl Trop Dis 7(3): e2135. doi:10.1371/journal.pntd.0002135 Editor: Jesus G. Valenzuela, National Institute of Allergy and Infectious Diseases, United States of America Received March 20, 2012; Accepted February 9, 2013; Published March 14, 2013 Copyright: ß 2013 Adam et al. This is an open-access article distributed under the terms of the Creative Commons Attribution License, which permits unrestricted use, distribution, and reproduction in any medium, provided the original author and source are credited. Funding: The work was funded by the Pan-African Tsetse and Trypanosomosis Eradication Campaign/Ghana and the International Fund for Agricultural Development (IFAD) (project GCP/RAF/442/IFA). The funders had no role in study design, data collection and analysis, decision to publish, or preparation of the manuscript. Competing Interests: The authors have declared that no competing interests exist. * E-mail: [email protected] Introduction In sub-Saharan Africa the tsetse fly (Genus: Glossina) is the cyclical vector of trypanosomosis, a disease of livestock and humans, caused by unicellular parasites of the genus Trypanosoma. Whilst the human form of the disease no longer appears to be a major public health issue in Ghana [1–3], animal trypanosomosis is still widely reported and causes considerable losses in the livestock sector resulting in major impacts on agricultural production, livelihoods and food security [4,5]. In Ghana, Glossina species have raised concern from the beginning of the colonial period [6]. Since then, different techniques have been used in a number of control efforts [7–9]. In Ghana, these techniques included, inter alia, the removal of tsetse habitat by bush clearing, the destruction of wildlife, as well as the use of insecticide treated targets (ITT) and insecticide treated cattle (ITC) [5,10–12]. These techniques, albeit successful in suppressing tsetse populations, failed to eliminate the tsetse fly from Ghana [5]. In this paper, the term ‘elimination’ is used to designate a local eradication. PLOS Neglected Tropical Diseases | www.plosntds.org 1 March 2013 | Volume 7 | Issue 3 | e2135
Transcript of The sequential aerosol technique - Home | Food and ... · The Sequential Aerosol Technique: ......
The Sequential Aerosol Technique: A Major Componentin an Integrated Strategy of Intervention againstRiverine Tsetse in GhanaYahaya Adam1, Giuliano Cecchi2, Patrick M. Kgori3, Tanguy Marcotty4,5, Charles I. Mahama1,
Martin Abavana1, Benita Anderson6, Massimo Paone2, Raffaele Mattioli2, Jeremy Bouyer7,8*
1 Veterinary Services Department of the Ministry of Food and Agriculture, Pong-Tamale, Ghana, 2 Food and Agriculture Organization of the United Nations, Animal
Production and Health Division, Rome, Italy, 3 Ministry of Agriculture, Department of Veterinary Services, Maun, Botswana, 4 Department of Biomedical Sciences, Institute
of Tropical Medicine, Antwerpen, Belgium, 5 Department of Veterinary Tropical Diseases, Faculty of Veterinary Science, University of Pretoria, Pretoria, South Africa,
6 Veterinary Services Department of the Ministry of Food and Agriculture, Accra, Ghana, 7 Unite Mixte de Recherche Controles des Maladies Animales et Emergentes,
Centre de Cooperation Internationale en Recherche Agronomique pour le Developpement, Montpellier, France, 8 Institut Senegalais de Recherches Agricoles, Laboratoire
National d’Elevage et de Recherches Veterinaires, Dakar, Senegal
Abstract
Background: An integrated strategy of intervention against tsetse flies was implemented in the Upper West Region ofGhana (9.62u–11.00u N, 1.40u–2.76u W), covering an area of <18,000 km2 within the framework of the Pan-African Tsetseand Trypanosomosis Eradication Campaign. Two species were targeted: Glossina tachinoides and Glossina palpalisgambiensis.
Methodology/Principal Findings: The objectives were to test the potentiality of the sequential aerosol technique (SAT) toeliminate riverine tsetse species in a challenging subsection (dense tree canopy and high tsetse densities) of the totalsprayed area (6,745 km2) and the subsequent efficacy of an integrated strategy including ground spraying (<100 km2),insecticide treated targets (20,000) and insecticide treated cattle (45,000) in sustaining the results of tsetse suppression inthe whole intervention area. The aerial application of low-dosage deltamethrin aerosols (0.33–0.35 g a.i/ha) was conductedalong the three main rivers using five custom designed fixed-wings Turbo thrush aircraft. The impact of SAT on tsetsedensities was monitored using 30 biconical traps deployed from two weeks before until two weeks after the operations.Results of the SAT monitoring indicated an overall reduction rate of 98% (from a pre-intervention mean apparent densityper trap per day (ADT) of 16.7 to 0.3 at the end of the fourth and last cycle). One year after the SAT operations, a secondsurvey using 200 biconical traps set in 20 sites during 3 weeks was conducted throughout the intervention area to measurethe impact of the integrated control strategy. Both target species were still detected, albeit at very low densities (ADT of0.27 inside sprayed blocks and 0.10 outside sprayed blocks).
Conclusions/Significance: The SAT operations failed to achieve elimination in the monitored section, but the subsequentintegrated strategy maintained high levels of suppression throughout the intervention area, which will contribute toimproving animal health, increasing animal production and fostering food security.
Citation: Adam Y, Cecchi G, Kgori PM, Marcotty T, Mahama CI, et al. (2013) The Sequential Aerosol Technique: A Major Component in an Integrated Strategy ofIntervention against Riverine Tsetse in Ghana. PLoS Negl Trop Dis 7(3): e2135. doi:10.1371/journal.pntd.0002135
Editor: Jesus G. Valenzuela, National Institute of Allergy and Infectious Diseases, United States of America
Received March 20, 2012; Accepted February 9, 2013; Published March 14, 2013
Copyright: � 2013 Adam et al. This is an open-access article distributed under the terms of the Creative Commons Attribution License, which permitsunrestricted use, distribution, and reproduction in any medium, provided the original author and source are credited.
Funding: The work was funded by the Pan-African Tsetse and Trypanosomosis Eradication Campaign/Ghana and the International Fund for AgriculturalDevelopment (IFAD) (project GCP/RAF/442/IFA). The funders had no role in study design, data collection and analysis, decision to publish, or preparation of themanuscript.
Competing Interests: The authors have declared that no competing interests exist.
* E-mail: [email protected]
Introduction
In sub-Saharan Africa the tsetse fly (Genus: Glossina) is the
cyclical vector of trypanosomosis, a disease of livestock and
humans, caused by unicellular parasites of the genus Trypanosoma.
Whilst the human form of the disease no longer appears to be a
major public health issue in Ghana [1–3], animal trypanosomosis
is still widely reported and causes considerable losses in the
livestock sector resulting in major impacts on agricultural
production, livelihoods and food security [4,5].
In Ghana, Glossina species have raised concern from the
beginning of the colonial period [6]. Since then, different
techniques have been used in a number of control efforts [7–9].
In Ghana, these techniques included, inter alia, the removal of
tsetse habitat by bush clearing, the destruction of wildlife, as well as
the use of insecticide treated targets (ITT) and insecticide treated
cattle (ITC) [5,10–12]. These techniques, albeit successful in
suppressing tsetse populations, failed to eliminate the tsetse fly
from Ghana [5]. In this paper, the term ‘elimination’ is used to
designate a local eradication.
PLOS Neglected Tropical Diseases | www.plosntds.org 1 March 2013 | Volume 7 | Issue 3 | e2135
In the control area, located in the Upper West Region, G.
tachinoides and G. palpalis gambiensis are the sole species present
[5,13]. G. morsitans submorsitans is absent, but found at 30 km only
north-east to the target area, in the Sissili protected forest. Both G.
tachinoides and G. palpalis gambiensis are riverine species, for which
riparian vegetation represents the typical habitat [14–16]. In the
study area, this type of habitat is mainly found along the rivers
Black Volta, Kulpawn and Sissili. All of these rivers flow
southwards into Lake Volta, but parts of their catchment basins
are located to the North, in neighbouring Burkina Faso. Along the
tributaries of the three main rivers, the habitat appears unsuitable
for tsetse flies in the dry season (December–May), during which
bush fires and the absence of rain seriously limit the availability of
appropriate vegetation [13]. At this time of year, tsetse flies retreat
from tributaries to the main rivers, where permanent water and
dense vegetation mitigate the harsh ambient macroclimatic
conditions (e.g. temperatures often rising above 40uC).
Large-scale aerial spraying of insecticide was adopted as the
main intervention tool against tsetse flies in the Upper West
Region of Ghana within the frame work of the African Union’s
Pan-African Tsetse and Trypanosomosis Eradication Campaign
(PATTEC), whose ultimate goal is to eradicate African trypano-
somosis through the progressive and sustainable creation of tsetse-
and trypanosomosis-free areas [17]. In Ghana, an integrated
strategy of intervention was adopted, whereby the sequential
aerosol technique (SAT) was complemented by ground spraying,
insecticide treated targets (ITT) and insecticide treated cattle
(ITC). To promote sustainability and limit the risk of post-
operation reinvasion, the integrated intervention strategy was
based on regional collaboration. Contrary to previous control
campaigns conducted at a local scale, SAT operations were
conducted jointly in Ghana and Burkina Faso. The impact of the
integrated interventions on non-target aquatic, terrestrial and
insectivorous fauna was monitored and will be presented
elsewhere.
The present study aimed at evaluating the potentiality of SAT
to achieve elimination of the riverine tsetse species in a particularly
challenging subsection (dense tree canopy and high tsetse densities
as revealed by the baseline survey) and the subsequent efficacy of
the integrated strategy including ground spraying, ITT and ITC to
sustain the results of tsetse suppression in the Upper West Region
of Ghana.
Materials and Methods
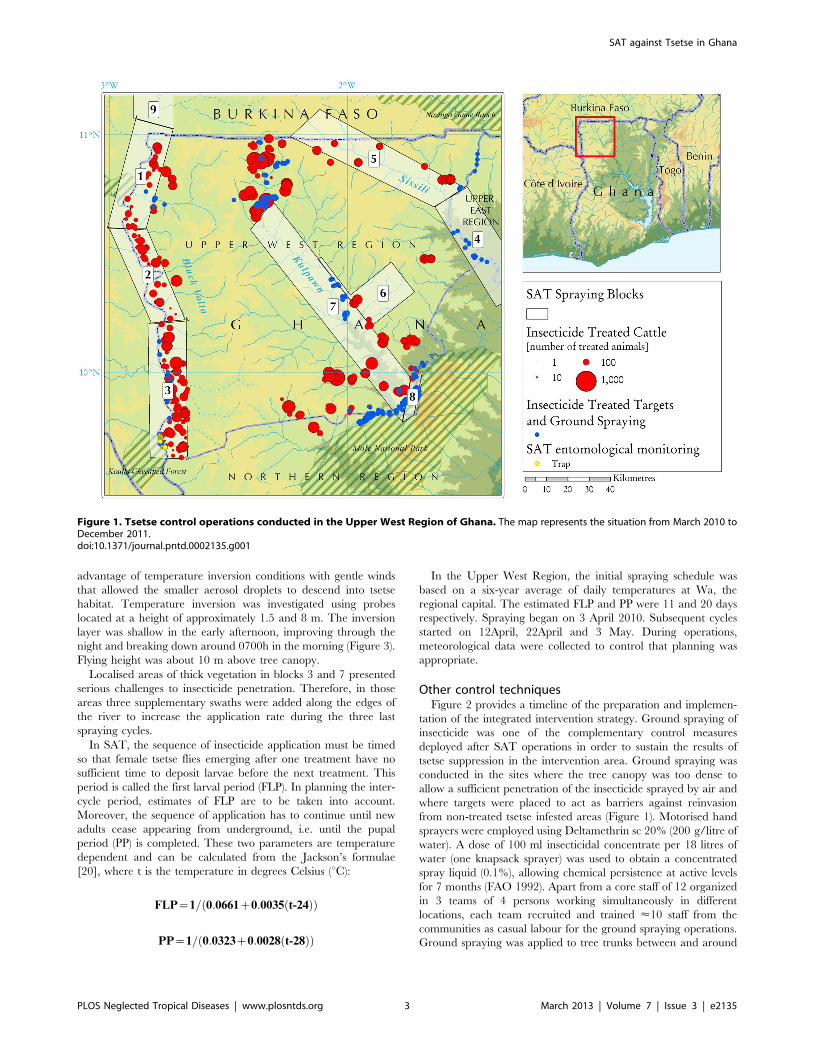
Study area and sequential aerosol techniqueThe study area is located in north-western Ghana (from lat. 9.62
to 11.00 N and from long. 1.40 to 2.76 W), and it covers a surface
of <18,000 km2 (Figure 1).
SAT, consisting of repeated spraying of non-residual insecticide
aerosols from the air [18],was applied to the three main rivers
(Black Volta, Sissili and Kulpawn). Eight spraying blocks of
different size were defined (Figure 1), covering a total area of
6,745 km2. A ninth block of 1,940 km2 was located across the
border in Burkina Faso. A 15 km blocks’ width assured the
coverage of the tsetse-infested riparian vegetation, whilst the block
lengths were selected to allow parallel flying lines.
The aerial application of low-dosage insecticide aerosols was
conducted following the principles described by Kgori et al. (2006).
The insecticide application rates were adjusted to suit local
climatic conditions, and 4 cycles were used (as opposed to the 5
conducted in Botswana in the operations described by Kgori et al.
(2006)). Air-spraying was conducted at night, along swaths of
275 m width. Occasionally, daytime spraying was carried out
under stable and cool overcast weather conditions when suitable
temperature inversion was recorded. Such modification of the
standard SAT procedure was necessary to maintain continuity of
the spraying programme following, for instance, unavoidable
interruptions due to inappropriate weather conditions. The
operation was carried out by Orsmond Aviation (Bethlehem,
South Africa), using five custom designed fixed-wing Turbo thrush
aircraft – fitted with navigation and spray management equip-
ment.
The applied insecticide was Deltamethrin (0.35% (w/v), ultra-
low volume (ULV) (Deltanex formulation, Avima, Johannesburg,
South Africa).The insecticide dispersal units, fitted to each aircraft
were made of two boom-mounted, wind-driven Micron-air AU
4000 rotary atomisers (Micron Sprayers Ltd., Bromyard. UK)
operated with cage speed of 11,000rpm and average flow rate of
9.7 l/km2. The micron-airs were fitted with shut-off valves to
prevent spillage in the event of damage to the atomizers. Each
aircraft was also fitted with the upgraded GPS-based guidance
system - SATLOC M3 (CSI Wireless, Calgary, Canada), to
provide precision controlled spray application aided by a moving
map display that guided the pilot using an external light-bar. Flight
and spraying statistics were captured automatically using the
system’s integrated data logger [19].
The spectrum of aerosol droplets was assessed using magnesium
oxide coated glass slides. While rotating at 330 rpm, the Numerical
and Volume Median Diameter values were 17.70 and 35.50 mm
respectively. As the insecticide had been stored locally for about
one year before usage, samples of the formulation were sent to a
laboratory (Pesticide Analytical Technology, Pretoria, South
Africa) for potency testing. Despite storage at high temperatures,
both the physical and chemical properties of the product were
confirmed to be within the expected ranges.
SAT operations were conducted between 3 April and 5 May
2010 (Figure 2). For the first spraying cycle, the application rate
was at 0.33 g active ingredient (a.i)/ha in all the sprayed blocks.
Subsequent treatments of blocks 3 and 7 used 0.35 g a.i/ha.
The choice of the spraying period, i.e. late dry season, as well as
the timing, i.e. from dusk to dawn, aimed at optimising the
Author Summary
We document the impact of an integrated strategy ofintervention against riverine tsetse flies in the Upper WestRegion of Ghana within the framework of the Pan-AfricanTsetse and Trypanosomosis Eradication Campaign, in anarea of <18,000 km2. The strategy included a sequentialaerosol technique (SAT) component, i.e. four applicationsof low-dosage deltamethrin aerosols, conducted along thethree main rivers. The impact of SAT on tsetse densitieswas monitored in a challenging subsection (dense treecanopy and high tsetse densities) from two weeks beforeuntil two weeks after the operations. The SAT operationssucceeded in reducing tsetse populations by 98% withinone month but fell short of achieving elimination.Insecticide ground spraying, deltamethrin-treated targetsand cattle were used as complementary tools to maintaintsetse suppression in the intervention area. An entomo-logical survey conducted one year after SAT operationsshowed that both target species were still present, albeitat drastically reduced densities as compared to thebaseline levels. This integrated strategy of interventionwill contribute to improving animal health, increasinganimal production and fostering food security in the targetarea.
SAT against Tsetse in Ghana
PLOS Neglected Tropical Diseases | www.plosntds.org 2 March 2013 | Volume 7 | Issue 3 | e2135
advantage of temperature inversion conditions with gentle winds
that allowed the smaller aerosol droplets to descend into tsetse
habitat. Temperature inversion was investigated using probes
located at a height of approximately 1.5 and 8 m. The inversion
layer was shallow in the early afternoon, improving through the
night and breaking down around 0700h in the morning (Figure 3).
Flying height was about 10 m above tree canopy.
Localised areas of thick vegetation in blocks 3 and 7 presented
serious challenges to insecticide penetration. Therefore, in those
areas three supplementary swaths were added along the edges of
the river to increase the application rate during the three last
spraying cycles.
In SAT, the sequence of insecticide application must be timed
so that female tsetse flies emerging after one treatment have no
sufficient time to deposit larvae before the next treatment. This
period is called the first larval period (FLP). In planning the inter-
cycle period, estimates of FLP are to be taken into account.
Moreover, the sequence of application has to continue until new
adults cease appearing from underground, i.e. until the pupal
period (PP) is completed. These two parameters are temperature
dependent and can be calculated from the Jackson’s formulae
[20], where t is the temperature in degrees Celsius (uC):
FLP~1= 0:0661z0:0035 t-24ð Þð Þ
PP~1= 0:0323z0:0028 t-28ð Þð Þ
In the Upper West Region, the initial spraying schedule was
based on a six-year average of daily temperatures at Wa, the
regional capital. The estimated FLP and PP were 11 and 20 days
respectively. Spraying began on 3 April 2010. Subsequent cycles
started on 12April, 22April and 3 May. During operations,
meteorological data were collected to control that planning was
appropriate.
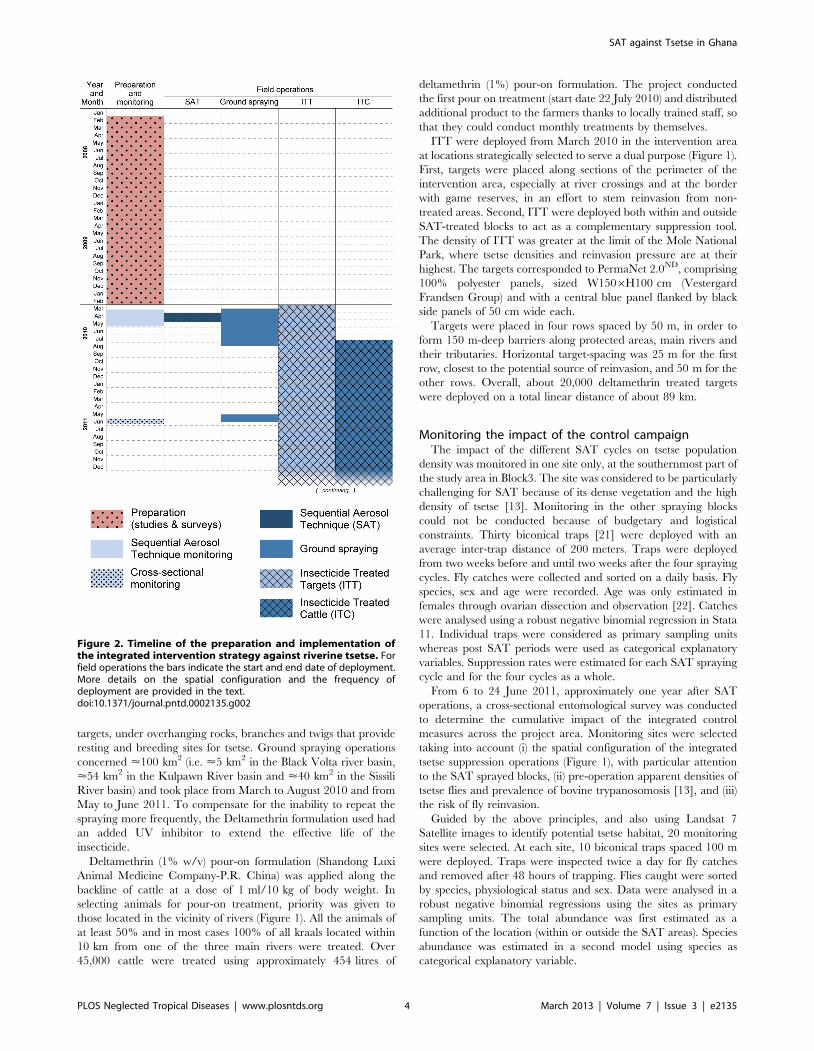
Other control techniquesFigure 2 provides a timeline of the preparation and implemen-
tation of the integrated intervention strategy. Ground spraying of
insecticide was one of the complementary control measures
deployed after SAT operations in order to sustain the results of
tsetse suppression in the intervention area. Ground spraying was
conducted in the sites where the tree canopy was too dense to
allow a sufficient penetration of the insecticide sprayed by air and
where targets were placed to act as barriers against reinvasion
from non-treated tsetse infested areas (Figure 1). Motorised hand
sprayers were employed using Deltamethrin sc 20% (200 g/litre of
water). A dose of 100 ml insecticidal concentrate per 18 litres of
water (one knapsack sprayer) was used to obtain a concentrated
spray liquid (0.1%), allowing chemical persistence at active levels
for 7 months (FAO 1992). Apart from a core staff of 12 organized
in 3 teams of 4 persons working simultaneously in different
locations, each team recruited and trained <10 staff from the
communities as casual labour for the ground spraying operations.
Ground spraying was applied to tree trunks between and around
Figure 1. Tsetse control operations conducted in the Upper West Region of Ghana. The map represents the situation from March 2010 toDecember 2011.doi:10.1371/journal.pntd.0002135.g001
SAT against Tsetse in Ghana
PLOS Neglected Tropical Diseases | www.plosntds.org 3 March 2013 | Volume 7 | Issue 3 | e2135
targets, under overhanging rocks, branches and twigs that provide
resting and breeding sites for tsetse. Ground spraying operations
concerned <100 km2 (i.e. <5 km2 in the Black Volta river basin,
<54 km2 in the Kulpawn River basin and <40 km2 in the Sissili
River basin) and took place from March to August 2010 and from
May to June 2011. To compensate for the inability to repeat the
spraying more frequently, the Deltamethrin formulation used had
an added UV inhibitor to extend the effective life of the
insecticide.
Deltamethrin (1% w/v) pour-on formulation (Shandong Luxi
Animal Medicine Company-P.R. China) was applied along the
backline of cattle at a dose of 1 ml/10 kg of body weight. In
selecting animals for pour-on treatment, priority was given to
those located in the vicinity of rivers (Figure 1). All the animals of
at least 50% and in most cases 100% of all kraals located within
10 km from one of the three main rivers were treated. Over
45,000 cattle were treated using approximately 454 litres of
deltamethrin (1%) pour-on formulation. The project conducted
the first pour on treatment (start date 22 July 2010) and distributed
additional product to the farmers thanks to locally trained staff, so
that they could conduct monthly treatments by themselves.
ITT were deployed from March 2010 in the intervention area
at locations strategically selected to serve a dual purpose (Figure 1).
First, targets were placed along sections of the perimeter of the
intervention area, especially at river crossings and at the border
with game reserves, in an effort to stem reinvasion from non-
treated areas. Second, ITT were deployed both within and outside
SAT-treated blocks to act as a complementary suppression tool.
The density of ITT was greater at the limit of the Mole National
Park, where tsetse densities and reinvasion pressure are at their
highest. The targets corresponded to PermaNet 2.0ND, comprising
100% polyester panels, sized W1506H100 cm (Vestergard
Frandsen Group) and with a central blue panel flanked by black
side panels of 50 cm wide each.
Targets were placed in four rows spaced by 50 m, in order to
form 150 m-deep barriers along protected areas, main rivers and
their tributaries. Horizontal target-spacing was 25 m for the first
row, closest to the potential source of reinvasion, and 50 m for the
other rows. Overall, about 20,000 deltamethrin treated targets
were deployed on a total linear distance of about 89 km.
Monitoring the impact of the control campaignThe impact of the different SAT cycles on tsetse population
density was monitored in one site only, at the southernmost part of
the study area in Block3. The site was considered to be particularly
challenging for SAT because of its dense vegetation and the high
density of tsetse [13]. Monitoring in the other spraying blocks
could not be conducted because of budgetary and logistical
constraints. Thirty biconical traps [21] were deployed with an
average inter-trap distance of 200 meters. Traps were deployed
from two weeks before and until two weeks after the four spraying
cycles. Fly catches were collected and sorted on a daily basis. Fly
species, sex and age were recorded. Age was only estimated in
females through ovarian dissection and observation [22]. Catches
were analysed using a robust negative binomial regression in Stata
11. Individual traps were considered as primary sampling units
whereas post SAT periods were used as categorical explanatory
variables. Suppression rates were estimated for each SAT spraying
cycle and for the four cycles as a whole.
From 6 to 24 June 2011, approximately one year after SAT
operations, a cross-sectional entomological survey was conducted
to determine the cumulative impact of the integrated control
measures across the project area. Monitoring sites were selected
taking into account (i) the spatial configuration of the integrated
tsetse suppression operations (Figure 1), with particular attention
to the SAT sprayed blocks, (ii) pre-operation apparent densities of
tsetse flies and prevalence of bovine trypanosomosis [13], and (iii)
the risk of fly reinvasion.
Guided by the above principles, and also using Landsat 7
Satellite images to identify potential tsetse habitat, 20 monitoring
sites were selected. At each site, 10 biconical traps spaced 100 m
were deployed. Traps were inspected twice a day for fly catches
and removed after 48 hours of trapping. Flies caught were sorted
by species, physiological status and sex. Data were analysed in a
robust negative binomial regressions using the sites as primary
sampling units. The total abundance was first estimated as a
function of the location (within or outside the SAT areas). Species
abundance was estimated in a second model using species as
categorical explanatory variable.
Figure 2. Timeline of the preparation and implementation ofthe integrated intervention strategy against riverine tsetse. Forfield operations the bars indicate the start and end date of deployment.More details on the spatial configuration and the frequency ofdeployment are provided in the text.doi:10.1371/journal.pntd.0002135.g002
SAT against Tsetse in Ghana
PLOS Neglected Tropical Diseases | www.plosntds.org 4 March 2013 | Volume 7 | Issue 3 | e2135

Ethical statementAll necessary permits were obtained by the PATTEC/Ghana
project, which is a national project of the Ministry of Food &
Agriculture. For the observance of good ethics, the project
collaborated with the Ghana Environmental Protection Agency,
Wild Life Division and the Ghana Wild Life Society who
monitored the exercise throughout the operational period. All
individuals, communities and local authorities within the project
area were sensitised and permission granted for the execution of
the project.
Figure 3. Temperatures inversion layer measured from Wa airport on 2 April 2010.doi:10.1371/journal.pntd.0002135.g003
Figure 4. Course of larval and pupal developments durations during the SAT operations in Ghana. The thin solid lines present the larvaldevelopment and the thick solid line the pupal development, estimated using Jackson’s formulae (see (Hargrove, 2003)). Mean daily temperature ispresented as a dashed line. A second pupal period (thick dashed line), starting at the beginning of the second cycle, shows the potentialdevelopment of pupae produced by females surviving to the first treatment. Vertical bars indicate the periods of the four SAT applications.doi:10.1371/journal.pntd.0002135.g004
SAT against Tsetse in Ghana
PLOS Neglected Tropical Diseases | www.plosntds.org 5 March 2013 | Volume 7 | Issue 3 | e2135

Results
SAT scheduleAccording to local meteorological data measured during field
operations, the SAT schedule fitted exactly the predicted FLP
(Figure 4). More precisely, each cycle was conducted one to two
days before the predicted days of larviposition of primipares.
Moreover, the whole treatment period lasted much more than the
maximum PP.
Efficacy of the SAT cyclesIn the densely vegetated site chosen for SAT monitoring, the
mean apparent density per trap per day (ADT) dropped from 16.7
(95%CI10.4–26.8) before spraying to 1.4 (0.7–1.7), 3.6 (1.8–6.8),
1.3 (0.6–3.0) and 0.3 (0.1–0.5) during the two days immediately
after spraying cycles 1 to 4 respectively. This corresponded to
reduction rates of 92% (85–95%, p,0.001), 0% (a significant
increase was even observed, p = 0.001), 64% (46–76%, p,0.001)
and 78% (76–86%, p,0.001) respectively (Figure 5). The resulting
overall reduction rate was 98% (97–99%, p,0.001). ADT further
dropped to 0.04 (0.01–0.11) on the last observation week (12 to 19
days after the last spraying).
Tsetse dissection indicated a continuous reduction of non-
teneral female flies from 1,223 flies before spraying to 8 flies after
cycle 4 (Table 1). The percentage of non teneral flies declined from
63%(s.d5%) before SAT operations to 61%(s.d.6%), 41% (s.d.5%),
14%(s.d.6%) and 33%(s.d.14%) after cycles 1 to 4 respectively (X-
squared = 34, df = 4, p,1023). However, the amounts of non
teneral flies proved that at least 22% of the adult females dissected
after each cycle were survivors or immigrants. The emerging
juveniles also declined from 726 to 17 after the last cycle.
Efficacy of the integrated tsetse control campaignOne year after SAT operations, the apparent density of tsetse
flies was still very low throughout the project area (Figure 6), with
average ADT of 0.27 (95% CI: 0.1–0.7) inside the sprayed blocks,
and 0.10 (95% CI: 0.02–0.5) outside the sprayed blocks. The
difference was not significant (p = 0.35).
Rigorous comparisons with pre-intervention densities are
difficult to make because of differences in the design of the
baseline and post-intervention cross-sectional surveys. In terms of
species relative abundance, post-intervention entomological data
were in line with pre-operation surveys, in that G. tachinoides was
more abundant and much more widespread than G. palpalis
gambiensis (p = 0.18), with ADT of 0.17 (95% CI: 0.06–0.47) and
0.03 (95% CI: 0.005–0.2) respectively. Even after a year of the
beginning of the integrated tsetse control, G. tachinoides was
captured in all three river basins in the project area, and all along
the Black Volta. The highest density was detected in one site along
the river Sissili, where the complementary pressure from ITC,
ITC and ground spraying was comparatively lower. G. palpalis
gambiensis was captured in two sites within the Kulpawn river basin
Figure 5. Mean daily catch of tsetse before and during the SAT operation in Ghana. Vertical bars indicate the periods of SAT applications.doi:10.1371/journal.pntd.0002135.g005
Table 1. Tsetse catches during SAT operations.
Dissected females
Period Total catch Teneral Non-teneral Total
Before spraying 1949 35 59 94
Cycle 1 219 30 47 77
Cycle 2 271 57 39 96
Cycle 3 90 32 5 37
Cycle 4 25 8 4 12
The data correspond to the total tsetse catches, teneral, non-teneral and totaldissected female flies before (2 weeks) and after each SAT cycle (2–3 days forcycles 1 to 3 and 2 weeks after cycle 4).doi:10.1371/journal.pntd.0002135.t001
SAT against Tsetse in Ghana
PLOS Neglected Tropical Diseases | www.plosntds.org 6 March 2013 | Volume 7 | Issue 3 | e2135
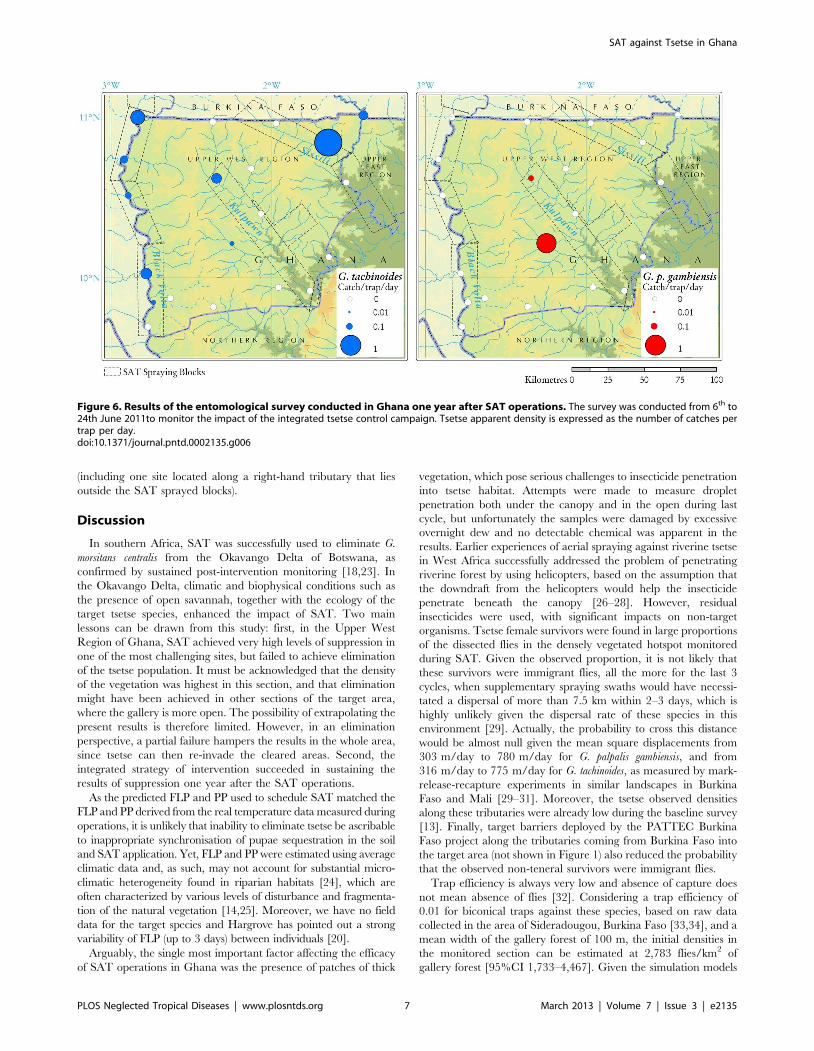
(including one site located along a right-hand tributary that lies
outside the SAT sprayed blocks).
Discussion
In southern Africa, SAT was successfully used to eliminate G.
morsitans centralis from the Okavango Delta of Botswana, as
confirmed by sustained post-intervention monitoring [18,23]. In
the Okavango Delta, climatic and biophysical conditions such as
the presence of open savannah, together with the ecology of the
target tsetse species, enhanced the impact of SAT. Two main
lessons can be drawn from this study: first, in the Upper West
Region of Ghana, SAT achieved very high levels of suppression in
one of the most challenging sites, but failed to achieve elimination
of the tsetse population. It must be acknowledged that the density
of the vegetation was highest in this section, and that elimination
might have been achieved in other sections of the target area,
where the gallery is more open. The possibility of extrapolating the
present results is therefore limited. However, in an elimination
perspective, a partial failure hampers the results in the whole area,
since tsetse can then re-invade the cleared areas. Second, the
integrated strategy of intervention succeeded in sustaining the
results of suppression one year after the SAT operations.
As the predicted FLP and PP used to schedule SAT matched the
FLP and PP derived from the real temperature data measured during
operations, it is unlikely that inability to eliminate tsetse be ascribable
to inappropriate synchronisation of pupae sequestration in the soil
and SAT application. Yet, FLP and PP were estimated using average
climatic data and, as such, may not account for substantial micro-
climatic heterogeneity found in riparian habitats [24], which are
often characterized by various levels of disturbance and fragmenta-
tion of the natural vegetation [14,25]. Moreover, we have no field
data for the target species and Hargrove has pointed out a strong
variability of FLP (up to 3 days) between individuals [20].
Arguably, the single most important factor affecting the efficacy
of SAT operations in Ghana was the presence of patches of thick
vegetation, which pose serious challenges to insecticide penetration
into tsetse habitat. Attempts were made to measure droplet
penetration both under the canopy and in the open during last
cycle, but unfortunately the samples were damaged by excessive
overnight dew and no detectable chemical was apparent in the
results. Earlier experiences of aerial spraying against riverine tsetse
in West Africa successfully addressed the problem of penetrating
riverine forest by using helicopters, based on the assumption that
the downdraft from the helicopters would help the insecticide
penetrate beneath the canopy [26–28]. However, residual
insecticides were used, with significant impacts on non-target
organisms. Tsetse female survivors were found in large proportions
of the dissected flies in the densely vegetated hotspot monitored
during SAT. Given the observed proportion, it is not likely that
these survivors were immigrant flies, all the more for the last 3
cycles, when supplementary spraying swaths would have necessi-
tated a dispersal of more than 7.5 km within 2–3 days, which is
highly unlikely given the dispersal rate of these species in this
environment [29]. Actually, the probability to cross this distance
would be almost null given the mean square displacements from
303 m/day to 780 m/day for G. palpalis gambiensis, and from
316 m/day to 775 m/day for G. tachinoides, as measured by mark-
release-recapture experiments in similar landscapes in Burkina
Faso and Mali [29–31]. Moreover, the tsetse observed densities
along these tributaries were already low during the baseline survey
[13]. Finally, target barriers deployed by the PATTEC Burkina
Faso project along the tributaries coming from Burkina Faso into
the target area (not shown in Figure 1) also reduced the probability
that the observed non-teneral survivors were immigrant flies.
Trap efficiency is always very low and absence of capture does
not mean absence of flies [32]. Considering a trap efficiency of
0.01 for biconical traps against these species, based on raw data
collected in the area of Sideradougou, Burkina Faso [33,34], and a
mean width of the gallery forest of 100 m, the initial densities in
the monitored section can be estimated at 2,783 flies/km2 of
gallery forest [95%CI 1,733–4,467]. Given the simulation models
Figure 6. Results of the entomological survey conducted in Ghana one year after SAT operations. The survey was conducted from 6th to24th June 2011to monitor the impact of the integrated tsetse control campaign. Tsetse apparent density is expressed as the number of catches pertrap per day.doi:10.1371/journal.pntd.0002135.g006
SAT against Tsetse in Ghana
PLOS Neglected Tropical Diseases | www.plosntds.org 7 March 2013 | Volume 7 | Issue 3 | e2135
[23], and for a 4-cycle treatment, the kill rate should be over 95%
to warrant elimination, a suppression rate that was never attained
here.
The spatial coverage of operations is another important factor
to be considered when analysing the overall impact of interven-
tions. Neither SAT nor the ancillary tools were applied across the
whole project area. Operations, including aerial spraying, focused
on the three main rivers, where suitable habitat for tsetse abounds.
Whilst it is arguably a cost-effective approach to target interven-
tions where they will have the largest impact on the tsetse
populations, small pockets of flies located away from the main
rivers may go untreated. The existence of these small pockets was
not ruled out by the baseline data collection, which was limited to
the main river systems [13]. The capture of both G. tachinoides and
G. palpalis gambiensis in a right-hand tributary of the Kulpawn
during the post-intervention survey supports the notion that small
pockets of flies may be sustained through the dry season also in
areas far from the main rivers. A similar situation was observed for
G. palpalis gambiensis in dryer zones of its distribution area 2 for
example in Senegal [35].
Although SAT failed to eliminate tsetse flies, the operations did
reduce significantly tsetse abundance in a very short period of
time. Considering the temperature in the study area (mean day
temperature around 30uC), 4 cycles were required to cover the
estimated PP. It was decided to limit SAT operations to a 4-cycle
schedule because SAT-monitoring data (i.e. reduction rates and
survival of mature females) showed that not even a fifth cycle
would have achieved elimination, and it would have only
increased the cost of suppression.
Importantly, suppression was achieved with few environmental
side-effects. The impact of SAT operations on non-target aquatic,
terrestrial and insectivorous fauna was studied and it will be
presented in detail elsewhere. In essence, this environmental
monitoring showed that the majority of non-target species were
broadly unaffected [36].
If we consider the integrated control strategy as a whole, a
number of factors must be called upon to explain the results of the
post-intervention entomological survey. First, despite the deploy-
ment of barriers, possible re-invasion of flies from neighbouring
areas may have occurred. In the absence of reinvasion barrier, G.
palpalis gambiensis was estimated to reinvade at a speed of about
7.5 km/year along the Mouhoun river [30]. Moreover, both
riverine tsetse species, and particularly G. tachinoides, are probably
able to move between river basins [29,37]. This is all the more of a
preoccupation for G. tachinoides, which disperse <3 times faster
than G. palpalis gambiensis in these fragmented landscapes. In the
project area, not all barriers were in place before SAT operations
started, and many were deployed during the spraying period.
Models have shown that efficiency substantially increases if
barriers are set up before the spraying cycles [23].
As far as ITC is concerned, the technique is efficient in reducing
riverine tsetse populations [7,38,39] but arguably less so to achieve
elimination, because a large proportion of riverine tsetse flies feed
on alternative hosts [40,41]. Theoretical models have shown that a
daily mortality of 3% would eliminate a tsetse population [20], a
results that would be obtained if only <10% of tsetse fed on ITC.
However, Bauer et al. (1999) demonstrated in similar settings and
using blood meal analyses, that small pockets of G. tachinoides were
able to survive by feeding mainly on reptiles [38]. In fact, learning
behaviour tends to protect flies that first fed on reptiles because
they tend to feed repeatedly on the same host thereafter [40]. ITT,
which can partially overcome this problem, could not be uniformly
deployed within the project area, thus possibly contributing to the
survival of pockets of tsetse. Moreover, these two techniques are
very efficient at high tsetse densities, but less so when the
abundance is low [8]. In the Loos Islands in Guinea, it was
recently observed that, using the same techniques, decrease in
tsetse density was sharp during the first months of the control
campaign, but it required several years to obtain further sizable
reductions in tsetse densities [9]; elimination has still not been
achieved to date [42]. Looking at the overall integrated strategy
implemented in Ghana by the ‘‘Multinational Project for the
Creation of Sustainable Tsetse and Trypanosomosis Free Areas in
East and West Africa’’, we can conclude that it achieved a high
level of suppression of tsetse populations using SAT as a key
component. Baseline surveys had shown an average ADT of 6.51
(s.d. 26.59) and 0.14 (s.d. 0.69) for G. tachinoides and G. p. gambiensis
respectively inside the spray blocks [13]. If we compare this with
the data collected inside the spray blocks one year after SAT
operations, we obtain relative reductions of <96% for both
species. This result is interesting given the different ecologies of the
flies in the target area, G. tachinoides favouring open riverine tickets
whereas G. p. gambiensis preferring closed gallery forests, which are
scarce in the study area [14]. Moreover, G. tachinoides feed more
readily on cattle than G. palpalis gambiensis do [41], and might have
been more impacted by ITC.
Further epidemiological and socio-economic studies are needed
to assess the extent to which suppression of the tsetse populations
resulted in a lower AAT risk and in a more conducive
environment for livestock production.
Regarding the field costs for the operations, excluding salaries
and depreciation of vehicles and equipment, they were
$3,633,979, corresponding to $202/km2, including $3,000,000
for SAT operations (i.e. $445/km2 for suppressing tsetse in the
6,745 km2 sprayed), $200,000 for ground spraying, $133,890 for
pour on treatments and $300,089 for impregnated targets (i.e.
35$/km2 for the integrated strategy used to maintain suppression
during two years in the whole 18,000 km2 area). These costs are
broadly in line with available estimates on the costs of tsetse and
trypanosomosis control [43].
Tsetse suppression is being sustained in the Upper West Region,
and schemes will be implemented to recover part of the cost from
farmers who will be encouraged to use cost-effective techniques to
protect their animals [44]. At the same time, suppression is
planned to be extended to neighbouring Upper East and Northern
regions. The regional strategy also foresees that on-going
interventions in Western Burkina Faso will progressively expand
their scope, targeting the areas at the border with Ghana, and thus
reducing the cost of barriers.
Acknowledgments
We wish to thank the management and the staff of PATTEC Ghana for
providing the needed logistic and human resources to conduct this research
work. The Veterinary Services Directorate of MOFA is acknowledged for
releasing the technical manpower to support the execution of the various
field surveys. We also acknowledge the contribution of PATTEC Burkina
Faso in this collaborative regional project aiming at systematic tsetse
suppression across our common borders. FAO provided technical
assistance to PATTEC Ghana in the framework of the Programme against
African Trypanosomosis (PAAT).
Author Contributions
Conceived and designed the experiments: YA GC PMK CIM MA RM JB.
Performed the experiments: YA PMK CIM MA. Analyzed the data: YA
GC PMK TM BA MP JB. Contributed reagents/materials/analysis tools:
YA GC PMK TM CIM MA JB. Wrote the paper: YA GC PMK TM CIM
RM JB.
SAT against Tsetse in Ghana
PLOS Neglected Tropical Diseases | www.plosntds.org 8 March 2013 | Volume 7 | Issue 3 | e2135

References
1. Cecchi G, Courtin F, Paone M, Diarra A, Franco JR, et al. (2009) Mapping
sleeping sickness in Western Africa in a context of demographic transition andclimate change. Parasite 16: 99–106.
2. Simarro PP, Cecchi G, Paone M, Franco JR, Diarra A, et al. (2010) The Atlas ofhuman African trypanosomiasis: a contribution to global mapping of neglected
tropical diseases. Int J Health Geogr 9: e57.
3. Simarro PP, Cecchi G, Franco JR, Paone M, Fevre EM, et al. (2012) Estimatingand mapping the population at risk of sleeping sickness. PloS Negl Trop Dis 6:
e1859.4. Ramatu MA, Seidu A (2008) Socio-Economic Baseline survey report of the
Upper West Region for the PATTEC project coordination Unit. Pong-Tamale,
Ghana: Veterinary Services Department.5. Mahama CI, Mohammed HA, Abavana M, Sidibe I, Kone A, et al. (2003)
Tsetse and Trypanosomoses in Ghana in the Twentieth Century: a Review. RevElev Med vet Pays trop 56: 27–32.
6. Simpson JJ (1914) Entomological Research in British West Africa. V. GoldCoast. Bull Entomol Res 5: 1–36.
7. Bouyer J, Stachurski F, Kabore I, Bauer B, Lancelot R (2007) Tsetse control in
cattle from pyrethroid footbaths. Prev Vet Med 78: 223–238.8. Bouyer J, Solano P, Cuisance D, Itard J, Frezil J-L, et al. (2010) Trypanosomosis:
Control methods. In: Lefevre P-C, Blancou J, Chermette R, Uilenberg G,editors. Infectious and parasitic diseases of livestock. Paris: Editions Lavoisier
(Tec & Doc). pp. 1936–1943.
9. Kagbadouno MS, Camara M, Bouyer J, Courtin F, Morifaso O, et al. (2011)Tsetse control in Loos islands, Guinea. Parasites & Vectors 4: 18.
10. Morris KRS (1946) The control of trypanosomiasis (of man and animal) byentomological means. Bull Entomol Res 37: 201–250.
11. Stewart J (1937) Report on the eradication of tsetse flies of the G. palpalis groupfrom the Pong Tamale area, Northern Territories, Gold Coast. Pong Tamale,
Ghana: Veterinary Services Department.
12. Morris KRS, Morris MG (1949) The use of traps against tsetse flies in WestAfrica. Bull Entomol Res 39: 501–531.
13. Adam Y, Marcotty T, Cecchi G, Mahama CI, Solano P, et al. (2012) Bovinetrypanosomosis in the Upper West Region of Ghana: Entomological,
parasitological and serological cross-sectional surveys. Res Vet Sci 92: 462–468.
14. Bouyer J, Guerrini L, Cesar J, de la Rocque S, Cuisance D (2005) A phyto-sociological analysis of the distribution of riverine tsetse flies in Burkina Faso.
Med Vet Entomol 19: 372–378.15. Cecchi G, Mattioli RC, Slingenbergh J, De La Rocque S (2008) Land cover and
tsetse fly distributions in sub-Saharan Africa. Med Vet Entomol 22: 364–373.16. Bouyer J, Guerrini L, Desquesnes M, de la Rocque S, Cuisance D (2006)
Mapping African Animal Trypanosomosis risk from the sky. Vet Res 37: 633–
645.17. Kabayo JP (2002) Aiming to eliminate tsetse from Africa. Trends Parasitol 18:
473–475.18. Allsopp R, Phillemon-Motsu TK (2002) Tsetse control in Botswana - a reversal
in strategy. Pesticide Outlook 13: 73–76.
19. Kgori PM, Orsmond G, Phillemon-Motsu TK (2009) Integrating GIS and GPS-assisted navigation systems to enhance the execution of an SAT -based tsetse
elimination project in the Okavango delta (Botswana). In: Cecchi G, MattioliRC, editors. Geospatial datasets and analyses for an environmental approach to
African trypanosomiasis Technical and Scientific Series, 9. Rome, Italy: Foodand Agriculture Organization of the United Nations. pp. 61–67.
20. Hargrove JW (2003) Tsetse eradication: sufficiency, necessity and desirability;
DFID Animal Health Programme, editor. Edinburgh: Centre for TropicalVeterinary Medicine. 134 p.
21. Challier A, Laveissiere C (1973) Un nouveau piege pour la capture des glossines(Glossina: Diptera, Muscidae): description et essais sur le terrain. Cah ORSTOM,
ser Ent Med et Parasitol 10: 251–262.
22. Laveissiere C, Grebaut P, Herder S, Penchenier L (2000) Les glossines vectricesde la Trypanosomiase humaine africaine; IRD, editor. Yaounde: IRD and
OCEAC. 246 p.23. Kgori PM, Modo S, Torr SJ (2006) The use of aerial spraying to eliminate tsetse
from the Okavango Delta of Botswana. Acta Trop 99: 184–199.
24. Hargrove JW, Torr SJ, Kindness HM (2003) Insecticide-treated cattle againsttsetse (Diptera: Glossinidae): what governs success? Bull Entomol Res 93: 203–
217.25. Guerrini L, Bord JP, Ducheyne E, Bouyer J (2008) Fragmentation analysis for
prediction of suitable habitat for vectors: the example of riverine tsetse flies inBurkina faso. J Med Entomol 45: 1180–1186.
26. Baldry DAT, Everts J, Roman B, Boon von Ochssee GA, Laveissiere C (1981)
The Experimental Application of Insecticides from a Helicopter for the Control
of Riverine Populations of Glossina tachinoides in West Africa. Part VIII: The
Effects of Two Spray Applications of OMS-570 (endosulfan) and of OMS-1998
(decamethrin) on G. tachinoides and Non-Target Organisms in Upper Volta.
Trop Pest Manage 27: 83–110.
27. Baldry DAT, Kulzer H, Bauer S, Lee CW, Parker JD (1978) The Experimental
Application of Insecticides from a Helicopter for the Control of Riverine
Populations of Glossina tachinoides in West Africa. III. Operational Aspects and
Application Techniques. Trop Pest Manage 24: 423–434.
28. Lee CW, Parker JD, Baldry DAT, Molyneux DH (1978) The Experimental
Application of Insecticides from a Helicopter for the Control of Riverine
Populations of Glossina tachinoides in West Africa. II. Calibration of Equipment
and Insecticide Dispersal. Trop Pest Manage 24: 404–422.
29. Kone N, Bouyer J, Ravel S, Vreysen MJB, Domagni KT, et al. (2011)
Contrasting Population Structures of Two Vectors of African Trypanosomoses
in Burkina Faso: Consequences for Control. PLoS Negl Trop Dis 5: e1217.
30. Bouyer J, Balenghien T, Ravel S, Vial L, Sidibe I, et al. (2009) Population sizes
and dispersal pattern of tsetse flies: rolling on the river? Mol Ecol 18: 2787–2797.
31. Vreysen M, Balenghien T, Saleh KM, Maiga S, Koudougou Z, et al. (2013)
Release-recapture studies confirm dispersal of Glossina palpalis gambiensis between
river basins in Mali. PLoS Negl Trop Dis. In press.
32. Barclay HJ, Hargrove JW (2005) Probability models to facilitate a declaration of
pest-free status, with special reference to tsetse (Diptera: Glossinidae). Bull
Entomol Res 95: 1–11.
33. Cuisance D, Politzar H, Merot P, Tamboura I (1984) Les lachers de males
irradies dans la campagne de lutte integree contre les glossines dans la zone
pastorale de Sideradougou, Burkina Faso. Rev Elev Med vet Pays trop 37: 449–
468.
34. Politzar H, Cuisance D (1984) An integrated campaign against riverine tsetse
flies Glossina palpalis gambiensis and Glossina tachinoides by trapping and the release
of sterile males. Insect Sci Applic 5: 439–442.
35. Bouyer J, Seck MT, Sall B, Guerrini L, Vreysen MJB (2010) Stratified
entomological sampling in preparation of an area-wide integrated pest
management programme: the example of Glossina palpalis gambiensis in the
Niayes of Senegal. J Med Entomol 47(4): 543–552.
36. Grant IF (2010) Assessment of the impact of sequential applications of
deltamethrin aerosols for the suppression of tsetse populations in the Upper
West Region of Ghana. London: Multinational Project for the creation of
sustainable tsetse and trypanosomiasis free areas in east and west Africa: Ghana.
24 p.
37. Bouyer J, Ravel S, Guerrini L, Dujardin JP, Sidibe I, et al. (2010) Population
structure of Glossina palpalis gambiensis (Diptera: Glossinidae) between river basins
in Burkina-Faso: consequences for area-wide integrated pest management. Inf
Gen Evol 10: 321–328.
38. Bauer B, Amsler-Delafosse S, Kabore I, Kamuanga M (1999) Improvement of
cattle productivity through rapid alleviation of African Trypanosomosis by
integrated disease management practices in the Agropastoral zone of Yale,
Burkina Faso. Trop Anim Health Prod 31: 89–102.
39. Bouyer J, Stachurski F, Gouro A, Lancelot R (2009) Control of bovine
trypanosomosis by restricted application of insecticides to cattle using footbaths.
Vet Parasitol 161: 187–193.
40. Bouyer J, Pruvot M, Bengaly Z, Guerin PM, Lancelot R (2007) Learning
influences host choice in tsetse. Biol Let 3: 113–116.
41. de La Rocque S, Michel JF, Bouyer J, De Wispelaere G, Cuisance D (2005)
Geographical Information Systems in parasitology: a review of potential
applications using the example of animal trypanosomosis in West Africa.
Parassitologia 47: 97–104.
42. Kagbadouno MS, Camara M, Bouyer J, Courtin F, Onikoyamou MF, et al.
(2011) Eradication of tsetse from the loos islands, Guinea: where we are?; 2011
September 12–16; Bamako. Proceedings of the 31th ISCTRC conference,
African Union.
43. Shaw APM, Torr SJ, Waiswa C, Cecchi G, Wint W, et al. (2013) Estimating the
costs of tsetse control options: an example for Uganda. Prev Vet Med. In press.
44. Bouyer F, Hamadou S, Adakal H, Lancelot R, Stachurski F, et al. (2011)
Restricted application of insecticides: a promising tsetse control technique, but
what do the farmers think of it? PLoS Negl Trop Dis 5: e1276.
SAT against Tsetse in Ghana
PLOS Neglected Tropical Diseases | www.plosntds.org 9 March 2013 | Volume 7 | Issue 3 | e2135