The sensitivity of sows to stressors throughout...
34
Established and supported under the Australian Government’s Cooperative Research Centres Program The sensitivity of sows to stressors throughout gestation 1C-108 Report prepared for the Co-operative Research Centre for High Integrity Australian Pork By Jean-Loup Rault 1 , Kate Plush 2 , and Pieter Langendijk 3 1 Alice Hoy building 162, room 003, Animal Welfare Science Centre, Faculty of Veterinary and Agricultural Sciences, University of Melbourne, Parkville, VIC 3010 2 University of Adelaide 3 South Australia Research and Development Institute (SARDI) December 2014
-
Upload
truongnhan -
Category
Documents
-
view
222 -
download
3
Transcript of The sensitivity of sows to stressors throughout...

Established and supported under the Australian Government’s Cooperative Research Centres
Program
The sensitivity of sows to stressors
throughout gestation
1C-108
Report prepared for the Co-operative Research Centre for High Integrity Australian
Pork
By
Jean-Loup Rault1, Kate Plush2, and Pieter Langendijk3
1Alice Hoy building 162, room 003, Animal Welfare Science Centre, Faculty of Veterinary and Agricultural Sciences, University of Melbourne, Parkville, VIC 3010 2University of Adelaide 3South Australia Research and Development Institute (SARDI)
December 2014
i
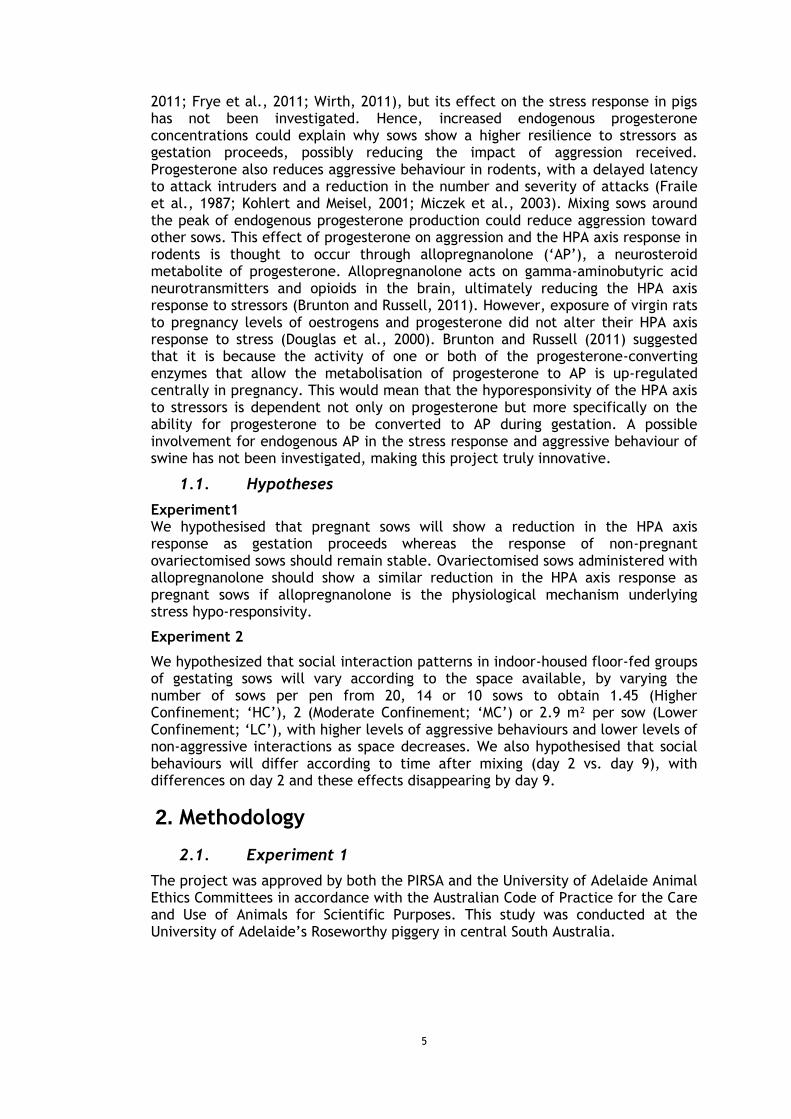
Executive Summary
The best timing and method to mix gestating sows is still controversial. Sows may habituate to different housing conditions based on their physiological stress-response. Pregnancy hormones secreted during gestation may explain this hyporesponsivity to stressors through physiological adaptation. Alternatively, sows may habituate through behavioural adaptation by changing their social strategies. These hypotheses carry different implications for the management of group-housed sows. If sows become hyporesponsive to stressors at a particular stage in gestation, this may represent the best time to mix. If sows habituate to other sows in the group and less space, providing increased space to allow for the hierarchy to settle before moving them to smaller pens could be an adequate mixing strategy. This project investigated the behavioural and physiological mechanisms regulating the stress response of sows during gestation and its implications for stress-coping ability and reproductive performance.
Experiment 1 investigated if allopregnanolone, a hormone metabolite from progesterone acting at brain level, explained the stress hyporesponsivity of sows observed during gestation, i.e. through physiological adaptation. Twenty five gilts were allocated to three treatments: pregnant gilts, ovariectomised gilts, and ovariectomised gilts administered daily with 3.5 mg of alfaxan IV as a synthetic analogue of allopregnanolone. On days 5, 12 and 19, all gilts were subjected to social stress by submitting them individually to a resident-intruder test, with the gilts acting as the intruder and an older sow being the resident. On day 26, 10 gilts across the three treatments were subjected to a dexamethasone suppression test followed by a corticotrophin-releasing hormone administration to test the functionality of their hypothalamo-pituitary-adrenal axis, one of the main components of the stress response. Experiment 1 could not confirm that sows become hypo-responsive to stressors in the first trimester of gestation. However, the results of the resident-intruder test showed that pregnant gilts experienced aggressive encounters quicker than ovariectomised gilts. We found weak evidence that the hormone allopregnanolone may be involved in some components of social interaction, with allopregnanolone concentrations positively correlated with lower aggressiveness. Nonetheless, the alfaxan treatment as an allopregnanolone agonist could not explain most of the differences between pregnant and ovariectomised gilts.
Experiment 2 investigated if sows habituated to smaller space allowance by changing their social strategies, i.e. through behavioural adaptation. Unacquainted sows were mixed in groups within 5 days of insemination at 1.45, 2.0 or 2.9 m2 per sow by placing 20, 14 or 10 sows in similar sized pens, respectively, with 5 pens per treatment and 10 focal sows per pen. Social behaviours were analysed for 15 min after drop-feeding the day after mixing (day 2) and 1 week later (day 9), with blood samples collected on days 2 and 26 for subsequent analysis of cortisol and progesterone. Sows started and used more high aggressive behaviours such as bites, head knocks, and pushes, at 1.45 m2 on day 2 whereas encounters at 2.0 m2 and especially 2.9 m2 were more frequent but less aggressive, with more nose contacts or threats. Differences between space allowances vanished on day 9. Hence, social interaction patterns differed shortly after mixing, with more aggressive and less frequent interactions at smaller space allowance.
Overall, these experiments support the hypothesis that sows habituate to different housing conditions through behavioural adaptation by changing their social strategies. Offering more space at mixing can increase the frequency of mild or neutral social interactions (e.g. threats and nose contacts) within a group of unacquainted sows while reducing the intensity of aggression (e.g. bites). No differences were apparent on day 9, supporting the results of other studies that have shown that the effect of space on social interactions is

ii
more pronounced within the first days after mixing. However, there is no physiological adaptation to stress during the first trimester of gestation which would suggest a best time to mix.

iii
Table of Contents
Executive Summary .................................................................................... i
1. Introduction ....................................................................................... 4
2. Methodology ...................................................................................... 5
3. Outcomes ......................................................................................... 11
4. Application of Research ....................................................................... 24
5. Conclusion ........................................................................................ 25
6. Limitations/Risks ................................................................................ 25
7. Recommendations .............................................................................. 26
8. References ....................................................................................... 27
9. Appendix 1 ....................................................................................... 30

4
1. Introduction
Mixing unfamiliar sows is a stressful situation for the sows and for the stockperson. The timing of mixing relative to insemination can influence the outcome. Mixing sows soon after insemination but before embryo implantation (days 11–16) can result in pregnancy failure. On the other hand, mixing sows later in gestation may affect litter size or the offspring development. The optimal time and method to mix gestating sows are still controversial. A previous APL-funded research project by Hemsworth et al. (2011) found that, when mixing within 1 week post-insemination, increasing floor space from 1.4 m2 per sow to 3 m2 per sow reduced aggression and cortisol concentrations as measured 2 days after mixing. However, cortisol differences disappeared by day 9 and 59 post-mixing. The mechanism involved and the role of pregnancy in this effect are unknown but could help determine the best time to mix pregnant sows.
One possibility is that sows habituate to small space allowances over time. Hierarchy within a group of unfamiliar sows is settled within a few hours to a few days after mixing (Arey and Edwards, 1998). Space at that time is important to allow subordinate sows to escape threats (Marchant-Forde et al., 2011). Once hierarchy is settled, it is possible that sows need less space. Alternatively, subordinate sows may adapt their social strategy to cope with this reduced space, by avoiding proximity to dominant sows, changing their feeding pattern or altering other behaviours. Weng et al. (1998) is one of the only studies to have looked in details at the frequency and type of social interactions between sows at different space allowances. They found that social encounters and aggressive interactions increased as space allowance decreased from 4.8m2 to 2m2 per sow, which resulted in higher skin lesions. They also noticed that sows may not have been able to retreat or avoid conspecifics at the smaller space allowance of 2m2. However, this experiment was performed on groups of sows fed in individual stalls and they only observed aggression between 5 to 7 days after mixing, both possibly minimizing aggression as compared to more common systems like floor-fed systems and looking at aggression right after mixing. One aim of this project was to investigate the type of social behaviours displayed by sows across different space allowances, and at different times post-mixing (i.e. overtime) in floor-fed group of sows.
An alternative explanation is that the stress response of sows is modified during pregnancy. As gestation proceeds, pregnant females seem to possess some buffering mechanisms against stressors, a type of ‘hyporesponsivity’ to stressors. This phenomenon has been reported in other species such as rodents in which the hypothalamo-pituirary-adrenal (HPA) axis is less reactive during gestation, hypothetically to protect the foetus (Lightman et al., 2001). We know that basal cortisol concentrations increase during gestation and that sows in late gestation show resistance to glucocorticoid negative feedback (Hay et al., 2000), supporting the theory that sows also experience a modification of the HPA axis during pregnancy. The exact mechanism underlying stress hyporesponsivity during gestation remains unknown. Progesterone is an obvious candidate. Progesterone is critical for the establishment and the maintenance of pregnancy, being secreted by the corpus luteum of the ovary and then the placenta throughout gestation. In sows, progesterone concentrations peak around day 16 of pregnancy and remain elevated thereafter (Duncan et al., 1960; Robertson and King, 1974). Natural levels of progesterone secreted during pregnancy can dampen the stress response in other species, partly by reducing HPA axis activation (Brunton and Russell,
5
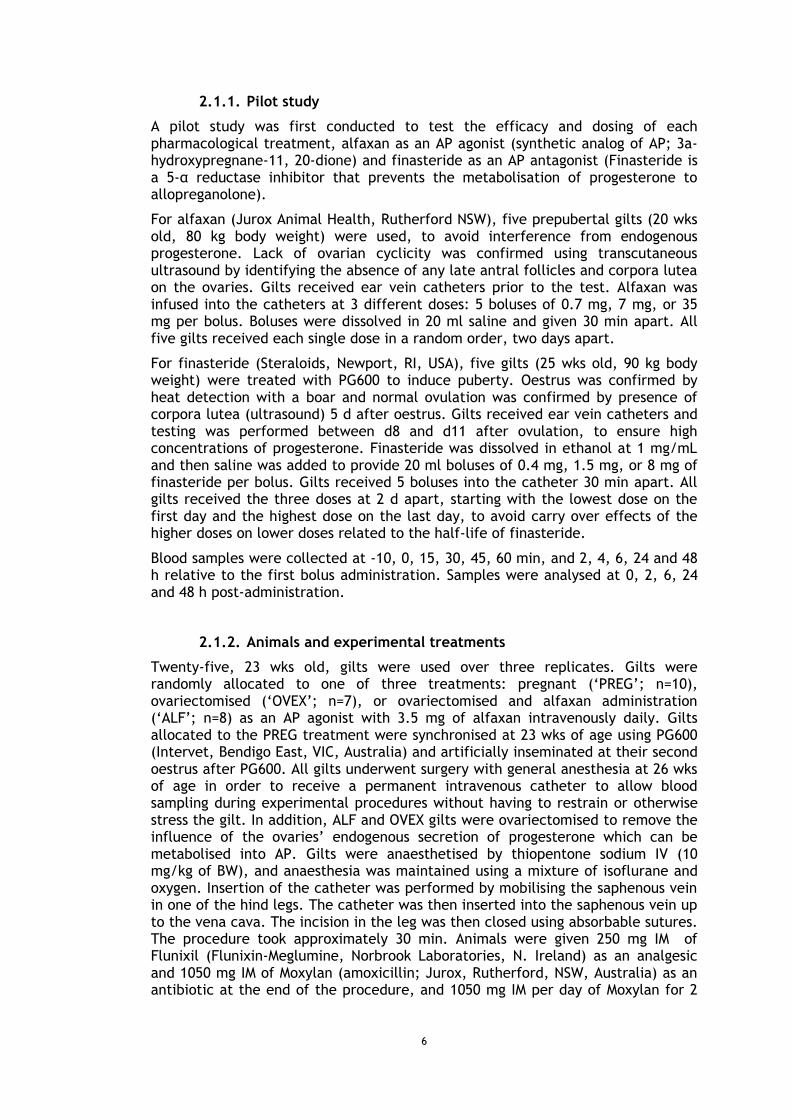
2011; Frye et al., 2011; Wirth, 2011), but its effect on the stress response in pigs has not been investigated. Hence, increased endogenous progesterone concentrations could explain why sows show a higher resilience to stressors as gestation proceeds, possibly reducing the impact of aggression received. Progesterone also reduces aggressive behaviour in rodents, with a delayed latency to attack intruders and a reduction in the number and severity of attacks (Fraile et al., 1987; Kohlert and Meisel, 2001; Miczek et al., 2003). Mixing sows around the peak of endogenous progesterone production could reduce aggression toward other sows. This effect of progesterone on aggression and the HPA axis response in rodents is thought to occur through allopregnanolone (‘AP’), a neurosteroid metabolite of progesterone. Allopregnanolone acts on gamma-aminobutyric acid neurotransmitters and opioids in the brain, ultimately reducing the HPA axis response to stressors (Brunton and Russell, 2011). However, exposure of virgin rats to pregnancy levels of oestrogens and progesterone did not alter their HPA axis response to stress (Douglas et al., 2000). Brunton and Russell (2011) suggested that it is because the activity of one or both of the progesterone-converting enzymes that allow the metabolisation of progesterone to AP is up-regulated centrally in pregnancy. This would mean that the hyporesponsivity of the HPA axis to stressors is dependent not only on progesterone but more specifically on the ability for progesterone to be converted to AP during gestation. A possible involvement for endogenous AP in the stress response and aggressive behaviour of swine has not been investigated, making this project truly innovative.
1.1. Hypotheses
Experiment1 We hypothesised that pregnant sows will show a reduction in the HPA axis response as gestation proceeds whereas the response of non-pregnant ovariectomised sows should remain stable. Ovariectomised sows administered with allopregnanolone should show a similar reduction in the HPA axis response as pregnant sows if allopregnanolone is the physiological mechanism underlying stress hypo-responsivity.
Experiment 2
We hypothesized that social interaction patterns in indoor-housed floor-fed groups of gestating sows will vary according to the space available, by varying the number of sows per pen from 20, 14 or 10 sows to obtain 1.45 (Higher Confinement; ‘HC’), 2 (Moderate Confinement; ‘MC’) or 2.9 m² per sow (Lower Confinement; ‘LC’), with higher levels of aggressive behaviours and lower levels of non-aggressive interactions as space decreases. We also hypothesised that social behaviours will differ according to time after mixing (day 2 vs. day 9), with differences on day 2 and these effects disappearing by day 9.
2. Methodology
2.1. Experiment 1
The project was approved by both the PIRSA and the University of Adelaide Animal Ethics Committees in accordance with the Australian Code of Practice for the Care and Use of Animals for Scientific Purposes. This study was conducted at the University of Adelaide’s Roseworthy piggery in central South Australia.
6
2.1.1. Pilot study
A pilot study was first conducted to test the efficacy and dosing of each pharmacological treatment, alfaxan as an AP agonist (synthetic analog of AP; 3a-hydroxypregnane-11, 20-dione) and finasteride as an AP antagonist (Finasteride is a 5-α reductase inhibitor that prevents the metabolisation of progesterone to allopreganolone).
For alfaxan (Jurox Animal Health, Rutherford NSW), five prepubertal gilts (20 wks old, 80 kg body weight) were used, to avoid interference from endogenous progesterone. Lack of ovarian cyclicity was confirmed using transcutaneous ultrasound by identifying the absence of any late antral follicles and corpora lutea on the ovaries. Gilts received ear vein catheters prior to the test. Alfaxan was infused into the catheters at 3 different doses: 5 boluses of 0.7 mg, 7 mg, or 35 mg per bolus. Boluses were dissolved in 20 ml saline and given 30 min apart. All five gilts received each single dose in a random order, two days apart.
For finasteride (Steraloids, Newport, RI, USA), five gilts (25 wks old, 90 kg body weight) were treated with PG600 to induce puberty. Oestrus was confirmed by heat detection with a boar and normal ovulation was confirmed by presence of corpora lutea (ultrasound) 5 d after oestrus. Gilts received ear vein catheters and testing was performed between d8 and d11 after ovulation, to ensure high concentrations of progesterone. Finasteride was dissolved in ethanol at 1 mg/mL and then saline was added to provide 20 ml boluses of 0.4 mg, 1.5 mg, or 8 mg of finasteride per bolus. Gilts received 5 boluses into the catheter 30 min apart. All gilts received the three doses at 2 d apart, starting with the lowest dose on the first day and the highest dose on the last day, to avoid carry over effects of the higher doses on lower doses related to the half-life of finasteride.
Blood samples were collected at -10, 0, 15, 30, 45, 60 min, and 2, 4, 6, 24 and 48 h relative to the first bolus administration. Samples were analysed at 0, 2, 6, 24 and 48 h post-administration.
2.1.2. Animals and experimental treatments
Twenty-five, 23 wks old, gilts were used over three replicates. Gilts were randomly allocated to one of three treatments: pregnant (‘PREG’; n=10), ovariectomised (‘OVEX’; n=7), or ovariectomised and alfaxan administration (‘ALF’; n=8) as an AP agonist with 3.5 mg of alfaxan intravenously daily. Gilts allocated to the PREG treatment were synchronised at 23 wks of age using PG600 (Intervet, Bendigo East, VIC, Australia) and artificially inseminated at their second oestrus after PG600. All gilts underwent surgery with general anesthesia at 26 wks of age in order to receive a permanent intravenous catheter to allow blood sampling during experimental procedures without having to restrain or otherwise stress the gilt. In addition, ALF and OVEX gilts were ovariectomised to remove the influence of the ovaries’ endogenous secretion of progesterone which can be metabolised into AP. Gilts were anaesthetised by thiopentone sodium IV (10 mg/kg of BW), and anaesthesia was maintained using a mixture of isoflurane and oxygen. Insertion of the catheter was performed by mobilising the saphenous vein in one of the hind legs. The catheter was then inserted into the saphenous vein up to the vena cava. The incision in the leg was then closed using absorbable sutures. The procedure took approximately 30 min. Animals were given 250 mg IM of Flunixil (Flunixin-Meglumine, Norbrook Laboratories, N. Ireland) as an analgesic and 1050 mg IM of Moxylan (amoxicillin; Jurox, Rutherford, NSW, Australia) as an antibiotic at the end of the procedure, and 1050 mg IM per day of Moxylan for 2

7
days post-surgery. Ovariectomy on non-mated gilts was performed during the same surgery when catheters were placed, by mid-ventral laparotomy to access the ovaries. Prior to ovariectomy, blood supply to the ovaries was sutured off by a double ligature around the ‘ovarian stalk’, which contains all blood vessels leading to and from the ovaries. The ligature was secured to the ovarian stalk to prevent slipping off. Subsequently, the ovaries were resected, and the midventral incision was closed using vicryl absorbable sutures. Gilts were allowed at least 5 days to recover prior to the start of testing. At the start of the testing period all gilts were 27 wks of age. Gilts allocated to the ALF treatment were administered 3.5 mg of alfaxan daily through the intravenous catheter in a single administration, starting on d0 (d0 was the first day of pregnancy for the PREG gilts) for the duration of the testing period. Confirmation of pregnancy for PREG gilts was performed using ultrasonography on day 28 of pregnancy. All gilts were housed in 0.6 x 2.4 m stalls adjacent to each other and fed 2.5 kg in two portions daily.
2.1.3. Social stress: Resident-Intruder test
On days 5, 12 and 19, gilts were subjected to social stress by submitting them individually to a resident-intruder test. Days 5, 12 and 19 of gestation were chosen as testing days for the social stress paradigm because sows are often mixed within 5 days of mating, day 12 because we expected changes concomitant of embryonic implantation, and day 19 as the expected peak of progesterone secretion.
For the resident-intruder test, two resident mature (Parity 3+, BW approx. 250kg) sows were selected for each replicate, based on their high aggressiveness in a previous social mixing experiment. Resident sows were used evenly across treatments and rotated for 1 or 2 confrontations a day with intruder gilts. Individual gilts were introduced to the same resident sow on each testing day, acting as the intruder. A baseline blood sample was collected from the experimental gilt 15 min prior to the test. The gilt’s catheter was protected by covering it with tape so as to minimise the risk of removal or displacement during the confrontation. Another baseline blood sample was collected immediately prior to the test. The intruder gilt was then moved to an adjacent room 25 m away and introduced into the pen of the resident sow for a maximum of 15 min. If the animals engaged in physical contact prior to the end of the 15 minute test, including biting of the intruder (i.e. fight), the experimental gilt was removed to avoid injuries and brought back to its stall. If no aggression was observed after 15 min, the experimental gilt was brought back to her pen. Blood samples were collected 15 min, 30 min, and 2 h after the start of the test.
Videos were analysed by one single observer blind to treatments. The behavioural variables recorded included the number of interactions, total duration of interaction, number of bites delivered, latency to the first contact, and whether the resident dominant sow or the intruder experimental gilt initiated that first contact.
2.1.4. Dexamethasone suppression test and corticotropin-releasing hormone administration
On day 26, 10 gilts (4 PREG, 3 OVEX, 3 ALF) were subjected to a dexamethasone suppression test followed by a corticotrophin-releasing hormone (CRH) administration to test the pituitary-adrenal function (i.e. negative feedback loop of the HPA axis) and the adrenocortical reactivity (i.e. descending pathway of the HPA axis), respectively, using a validated procedure (Rault et al., 2013). Day 26 was chosen for the dexamethasone-CRH test because it corresponds to late returns, thought to be attributed to high stress.

8
A blood sample was collected at 2000 h to measure baseline cortisol concentrations. Each gilt was then immediately injected intravenously with 20 μg/kg of dexamethasone, a synthetic glucocorticoid (Colvasone, Provet, Australia), to suppress endogenous corticosteroid production. At 0800 h the next morning, 12 h after dexamethasone injection, a second blood sample was collected to measure cortisol concentrations and the gilt was immediately injected intravenously with 1 μg/kg of bovine CRH (Bovine CRH C2671, Sigma Aldrich, Castle Hill, NSW, Australia). A third blood sample was collected 30 min after the CRH injection to measure cortisol concentrations.
2.1.5. Physiological analyses
All blood samples were collected in 10 mL EDTA-coated tubes (BD vacutainer, North Ryde, NSW, Australia) and subsequently stored on ice before being centrifuged for 15 min at 2,500 rpm with the plasma fraction transferred to microtubes for long-term storage at -20ºC. Physiological assays were conducted on the blood samples collected on days 5, 12, 19 and 26 to analyse progesterone, AP, plasma cortisol, and adrenocorticotropic hormone (ACTH) concentrations. Plasma concentrations of cortisol were quantified using a commercial ELISA kit (Enzo Life Sciences, Farmingdale, NY, USA). Samples were diluted to 1:8 to fall within the standard curve and the sensitivity of the assay was 156 pg/mL. The area under the curve (AUCi) was calculated according to Fekedulegn et al. (2007), by comparing the evolution of cortisol concentrations relative to baseline over the 120 min after the start of the social encounters. Plasma concentrations of progesterone were quantified using a commercial ELISA kit (Enzo Life Sciences, Farmingdale, NY, USA). Samples were diluted to 1:16 (for OVEX gilts) or 1:32 (for PREG and ALF gilts) to fall within the standard curve and the sensitivity of the assay was 15.62 pg/mL. Plasma concentrations of ACTH were quantified by an external laboratory using a commercial ELISA kit for the sample collected 15 min after the start of the RI test. The sensitivity of the assay was 5 pg/mL. Allopregnanolone was extracted from plasma as previously described (Yawno et al., 2007). Recovery of AP was 84.0 ± 4.0%, and assay results were corrected for this extraction loss in the final calculation of AP concentrations. AP was quantified with an in-house assay using a polyclonal antibody (Agrisera, Sweden). The assay limit of detection for AP was 52.7 ± 2.7 pg/tube and the intra-assay coefficients of variance was 8%. All samples were discarded from the analysis if the coefficient of variation between duplicates was greater than 10%. Standard solutions of alfaxan as administered to the sows were found to cross-react with the AP assay in a linear fashion.
2.1.6. Statistical analyses
All continuous data was checked for normality and homogeneity of variance, and subsequently analysed using a mixed model (PROC MIXED) with the SAS statistical software. For AP, progesterone and ACTH, the model included the fixed effects of treatment, day and their interaction if significant, replicate, with day as a repeated measure and gilt as random factor. For cortisol, the model also included time relative to the start of the test (0, 15, 30 or 120 min), whereas for resident-intruder test variables, ACTH and the area under the curve, the identity of the resident sow and the length of the RI test were added to the model. For the dexamethasone suppression test and CRH administration, the model included the fixed effects of treatment, time and replicate with time as a repeated measure. When significant interactions (P < 0.05) were detected, adjustments to the level of significance of the P-value were used to account for the number of pairwise
9
comparisons using the Bonferroni method. Data are presented as least square means ± SE unless otherwise stated.
2.2. Experiment 2
The project fitted within a larger Pork CRC project (1C-105) and was approved by Rivalea Animal Ethics Committee in accordance with the Australian Code of Practice for the Care and Use of Animals for Scientific Purposes. This study was conducted in a gestation unit of a large commercial piggery in southern New South Wales, Australia.
2.2.1. Animals and experimental treatments
Unacquainted Landrace × Large White sows were mixed in groups of mixed parities within five days of insemination at 1.45, 2 or 2.9 m2 per sow by placing 20, 14 or 10 sows per pen. The Australian Model Code of Practice for pigs (2008) which guides farming practices states that a minimum of 1.4 m2 per sow should be provided. For each space allowance, five pens were studied with ten randomly chosen focal sows per pen, for a total of 150 sows. Each pen measured 9.6 m × 3.02 m and had half concrete floor and half slatted floor. Three drop feeders, evenly suspended across the width of each pen, delivered feed on the solid floor four times daily (0700, 0800, 0900, and 1000h) to provide a total of 2.5 kg per sow PER DAY of a commercial diet (13.1 MJ DE/kg, and 12.8% of crude protein).
2.2.2. Behavioural observations
Behaviours were recorded using three 3.6 mm infrared closed circuit television cameras per pen installed overhead and covering the whole floor area. Ten focal sows per pen were marked using livestock spray paint. Social behaviours between focal sows were recorded continuously for 15 min on the first drop-feeding of the day after mixing (day 2) and 1 week later (day 9). Interactions with non-focal sows were not recorded. The identity of the initiator and the receiver involved in each interaction were recorded. If the interaction stopped for more than 5 sec, any new behaviour displayed was considered part of a new interaction. Within each interaction, the series of behaviours displayed by the initiator and the receiver was recorded in a sequential manner. Videos were played at one-quarter the real-time playback speed in order to enhance the accuracy of analysis. A detailed ethogram of 19 social behaviours was developed (Table 1), adapted from Jensen (1980) and Marchant-Forde et al. (2011), and included approach, ano-genital nosing, nose to body, nose to head, threat, attempts to bite, bite to head, bite to body, head to head knock, head to body knock, parallel pressing, head to head push, head to body push, head over body, chase, pause (< 5 sec), no reaction, retreat, or switch (a third pig gets involved). All observations were conducted by a single individual.
From all interactions observed on day 2 and day 9, an aggression index was calculated for each sow as the ratio of aggression delivered to the total number of aggressive interactions (i.e. aggression delivered/(aggression delivered + aggression received)), varying from 0 to 1. Sows were then classified as ‘Dominant’ if they delivered more aggression than they received (aggression index > 0.5), ‘Subdominant’ if they received more aggression than they delivered (aggression index >0.05, ≤ 0.5) and ‘Submissive’ if they delivered very little or no aggression (aggression index ≤ 0.05). This aggression index is similar to that devised by Mendl et al. (1992).
10
2.2.3. Physiological analyses
On day 2 and day 26 after mixing, blood samples were collected via jugular venipuncture from three focal sows within each group at 1200h. Within 2 min of restraint by snaring, blood samples were collected in 10mL lithium heparin tubes, subsequently centrifuged with the plasma stored at -20ºC. Plasma samples were assayed in duplicate. Cortisol concentration was measured using a radioimmunoassay kit (Cortisol Diasorin Ltd., New South Wales, Australia), with a limit of detection of 1.35 ng/mL. Mean intraassay coefficient of variations for low (8 ng/mL) and high (60 ng/mL) plasma samples were 3.2% and 6.8%, respectively. Progesterone concentration was measured using a radioimmunoassay kit (Immunotech RIA Progesterone kit IM1188, Beckman Coulter Gladesville, New South Wales, Australia), with a limit of detection of 0.11 ng/ml. The intra-assay coefficient of variation was 1.9% for the quality control included in the kit (1.06 ng/ml).
2.2.4. Statistical analyses
Some behaviours were rare, hence behaviours were pooled in categories based on similarities: non-aggressive (ano-genital nosing, nose to body, nose to head), bite (bite to head, bite to body), knock or push (head to head knock, head to body knock, parallel pressing, head to head push, head to body push), leading to a consolidated ethogram of 12 behaviours. All continuous data was checked for normality and homogeneity of variance, and subsequently analysed using a mixed model (PROC MIXED) with the SAS statistical software. The model included the fixed effects of space, day, and their interaction if significant, with the random effect of pen nested within space to account for pen as the experimental unit. Some pens were not visible during the first feeding of the day because of sunrise interference with the camera so behaviour recording was done on a subsequent feeding time (0800 or 0900h), and kept consistent between day 2 and day 9. This happened once in each treatment and the effect of feeding time was tested but not included in the model since it had no effect on any of the variables (all P > 0.1). The physiological data (cortisol and progesterone) were analysed using the mixed model accounting for repeated measures. For categorical data, Chi-square test of SAS was used (PROC FREQ), and Fisher’s test if some of the cells had a frequency of 5 or less. Data are presented as least square means ± SE unless otherwise stated.

11
Table 1 - Ethogram used for behavioural observations1, adapted from Jensen (1980) and Marchant-Forde et al. (2011). If the interaction stopped for more than 5 s, any new behaviour displayed was considered part of a new interaction.
Behaviour Description
Approach Initiator walks directly up to a stationary sow, just before making contact
Ano-genital nosing Initiator touches with nose the ano-genital region of recipient
Nose to body Initiator touches with nose the recipient’s body, from shoulders to rear and excluding the ano-genital region
Nose to head Initiator touches with nose the head of the recipient Threat Initiator, mouth closed, makes a sudden head movement
towards recipient, but no contact is made due to recipient evading
Attempt to bite Initiator, mouth open, makes a sudden head movement towards recipient, but no contact is made due to recipient evading
Bite to head Initiator has open mouth contact with recipient’s head region Bite to body Initiator has open mouth contact with recipient’s body region Head to head knock Initiator strikes with head recipient’s head, mouth closed, ≤
2 sec Head to body knock Initiator strikes with head recipient’s body, mouth closed, ≤
2 sec Parallel pressing Initiator presses body against recipient’s body, > 2 sec;
includes parallel and inverse parallel Head to head push Initiator pushes with head on recipient’s head, mouth closed,
> 2 sec Head to body push Initiator pushes with head recipient’s body, mouth closed, >
2 sec Head over body Initiator places head on top of the recipient’s body for > 2
sec Chase Initiator chases after, but is not in contact with, a sow that
has retreated Pause Interruption of sow interaction for < 5 sec before next
behaviour No reaction Recipient does not move away or responds to initiator for < 5
sec Retreat Recipient takes at least one step away from initiator Switch Third sow becomes involved
3. Outcomes
3.1. Pilot experiment
A few samples from sows at different stages of gestation were included in the assay to estimate normal allopregnanolone (AP) concentrations in pigs. Values fell in the range of 0.9 to 20.0 pmol/mL, with an apparent increase in AP concentrations as gestation progressed, although inter-individual variation was apparent (Table 2).
The administration of alfaxan increased plasma allopregnanolone concentrations over the subsequent 24h (Figure 1). The low dose of 3.5 mg/day appeared sufficient to mimic endogenous gestation levels of AP, and consequently was chosen for Experiment 1.

12
Finasteride did not appear to have any influence on allopregnanolone concentration (Figure 2), and therefore its potential use as an AP antagonist was judged insufficient to warrant further use in Experiment 1.
Table 2 – Allopregnanolone concentrations (pmol/mL) at different stages of gestation, using individual samples from other experiments.
Sample ID d2 d5 d10 d15 d26 d51
1
6.27 8.97
2
6.86 3 2.41
6.56
4 3.69
11.34
5 0.90
7.48
6 1.40
7.63 7
6.66
8 8.54
15.41
20.00
Figure 1 – Allopregnanolone concentrations following alfaxan administration. The low dose corresponded to 3.5 mg, medium dose 35 mg, and high dose 175 mg of alfaxan.
Figure 2 – Allopregnanolone concentrations following finasteride administration. The low dose corresponded to 2 mg, 7.5 mg, or 40 mg of finasteride.
0.00
5.00
10.00
15.00
20.00
25.00
30.00
35.00
0h 2h 6h 24h
Allo
pre
gnan
olo
ne
co
nce
ntr
atio
n (
pm
ol/
mL)
Time after administration
Alfaxan
Low (1)
Med (3)
High (2)
0.00
5.00
10.00
15.00
20.00
25.00
0h 2h 6h 24h 48h
Allo
pre
gnan
olo
ne
co
nce
ntr
atio
n
(pm
ol/
mL)
Time after administration
Finasteride
Low (1)
Med (2)
High (3)

13
3.2. Experiment 1
Pregnancy losses occurred for 3 out of the 10 PREG gilts as identified using ultrasonography on d28 of pregnancy. Pregnancy loss effects could be seen based on changes in both AP and progesterone (n = 4 samples) concentrations between d12 and d19, and therefore the data from d19 and d26 from these 3 sows have been removed for the analysis since it cannot be considered representative of the PREG treatment after pregnancy loss.
3.2.1. Allopregnanolone
Plasma AP concentrations differed according to treatment (P < 0.0001), but also tended to differ according to day (P = 0.09), and tended to differ according to the interaction of treatment × day (P = 0.08; Table 3 and Figure 3). Gilts in the ALF treatment had AP concentrations that varied between days (P = 0.0007), with a peak in AP concentrations on day 19 compared with d5 (P = 0.002), and d26 (P = 0.007). Gilts from the PREG or OVEX treatment did not differ in AP concentrations across days (P = 0.95 and P = 0.99, respectively). Treatments differed in AP concentrations on d12 and d19 (P = 0.004 and P < 0.0001), with ALF gilts having higher AP concentrations than OVEX and PREG gilts (d12: P = 0.003 and P = 0.08, respectively; d19: both P < 0.0001). Treatments did not differ on d5 or d26 (P = 0.29 and P = 0.87).
3.2.2. Progesterone
Plasma progesterone concentrations differed according to treatment (P < 0.001), did not differ according to the day (P = 0.95), but differed according to the treatment × day interaction (P = 0.003; Table 4 and Figure 4).
Both PREG and ALF gilts had progesterone concentrations that varied between days (P = 0.05 and P = 0.005, respectively), but not OVEX sows (P = 0.95). For ALF gilts, progesterone increased between d5 and d19 (P = 0.006) and tended to be higher on d 19 as compared to d12 and d26 (P = 0.07 and P = 0.10, respectively). For PREG gilts, progesterone concentrations decreased between d12 and d 19 (P = 0.04).
Treatments differed in progesterone concentrations across all days (all P < 0.01). On d5, PREG gilts had higher progesterone concentrations than OVEX and ALF gilts (P < 0.0001 and P = 0.0006, respectively). On d12, PREG gilts had higher progesterone concentrations than ALF gilts (P = 0.009), which in turn were higher than OVEX gilts (P = 0.02). On d19, both PREG and ALF gilts had higher progesterone concentrations than OVEX gilts (P = 0.002 and P < 0.001). On d26, PREG had higher progesterone concentrations than OVEX gilts (P = 0.005) and tended to be higher than ALF gilts (P = 0.09), but ALF and OVEX did not differ (P = 0.69).
Allopregnanolone concentration correlated positively with progesterone concentrations when considering all treatments (r = 0.27, P = 0.02), but was not significant for any of the three treatments (P > 0.10).
3.2.3. Cortisol
The baseline cortisol concentration prior to the resident-intruder test did not differ according to treatment (P = 0.51) or day (P = 0.99).
Plasma cortisol concentrations did not differ according to treatment (P = 0.60) or day (P = 0.25) but differed according to the interaction of treatment × day (P = 0.04; Figure 5 and Table 5), with ALF gilts varying across days (P = 0.01) but with no significant post-hoc differences, and no differences for PREG or OVEX gilts

14
across days (P = 0.66 and P = 0.10, respectively). There were no significant post-hoc effects on specific days between treatments (d5: P = 0.43, D12: P = 0.18; d19: P = 0.92). Time relative to the start of the test had an effect (P < 0.0001), and the duration of the resident-intruder test tended toward significance (P = 0.06).
The area under the curve (AUCi) did not differ according to treatment or the day (P = 0.13 and P = 0.20, respectively; Table 6), although PREG gilts had a much lower response than OVEX or ALF gilts. Resident sow had a significant effect (P = 0.05), and the duration of the resident-intruder test tended toward significance (P = 0.06). A sample size calculation revealed that 11 animals per treatment would have been required instead of the current 8 to 9 per treatment to reach statistical significance set at an α power of of 0.1 and a β power of 0.1. The sample size may also have been too low in order to overcome the variation in cortisol concentration observed between individuals (see Appendix 1).
3.2.4. ACTH
Adrenocorticotropin hormone concentration 15 min after the start of the RI test did not differ according to treatment (PREG gilts: 30.1 ± 9.0 ng/mL; OVEX gilts: 40.5 ± 9.8 ng/mL; ALF gilts: 32.4 ± 8.8 ng/mL; P = 0.73) or day (d 5: 29.5 ± 8.4 ng/mL; d 12: 39.0 ± 7.2 ng/mL; d19: 34.4 ± 7.8 ng/mL; P = 0.64).
3.2.5. Dexamethasone suppression test and Corticotrophin Releasing Hormone (CRH) administration, d 26
Treatment had no effect on the response of the gilts to the dexamethasone suppression test and CRH administration (P = 0.23). Time had an effect (P = 0.003). Gilts had similar cortisol concentrations at 2000h and at 0800h the next morning, 12h after dexamethasone concentration (0.7 ± 0.5 ng/mL and 0.9 ± 0.5 ng/mL, respectively, P = 0.93). Gilts showed an increase in cortisol concentration 30 min after CRH administration at 0830h as compared to 0800h (3.2 ± 0.5 ng/mL, P = 0.005).
3.2.6. Resident-intruder test duration
The duration of the resident-intruder test tended to differ according to treatment (P = 0.10; Table 6), with shorter duration for PREG gilts compared with OVEX (P = 0.05), but ALF gilts being intermediate and not different from either (P = 0.11 with PREG, P = 0.64 with OVEX), out of the 900 sec maximum duration of the test. The duration of the resident-intruder test did not differ according to the day (P = 0.18; d5: 403 ± 47 sec; d12: 462 ± 44 sec; d19: 517 ± 47 sec). The identity of the resident sow had an effect (P < 0.0001), as did the replicate with resident-test for gilts from the 1st replicate showing shorter test than gilts from the 2nd replicate, which in turn had shorter latency than the 3rd replicate (1st replicate: 93 ± 57 sec, 2nd replicate: 450 ± 52 sec, 3rd replicate: 853 ± 52 sec; all P < 0.001).
In 80% of the test, the resident sow started the interaction rather than the experimental intruder gilt, but this did not differ between treatments (Chi-square test, P = 0.83).
The latency to the first attack and the number of bites received did not differ according to treatment or day (all P > 0.1).
The duration of the test was positively correlated with the number of interaction (r = 0.42, P = 0.0003), total interaction time (r = 0.37, P = 0.002), and tended to be correlated with the latency to the first attack (r = 0.22, P = 0.007).
In terms of physiological responses, the duration of the resident-intruder test was positively correlated with the area under the curve for cortisol concentrations (r =

15
0.32, P = 0.008). The duration of the resident-intruder test was positively correlated with allopregnanolone concentrations (r = 0.29, P = 0.02), and when broken down by treatments, was found to be correlated with allopregnanolone concentrations in PREG and OVEX gilts (r = 0.66, P = 0.0003; r = 0.47, P = 0.03) but not ALF gilts (r = 0.25, P = 0.24).
Table 3 – Allopregnanolone concentrations (pmol/mL; LS-means ± SEM). Subscripts with different letters differ within a row (a,b) or within a column (x,y) (P < 0.05).
Day 5 12 19 261
Pregnant 0.7 ± 0.4 0.9 ± 0.4x 0.8 ± 0.4 x 0.4 ± 0.8
Ovariectomised 0.2 ± 0.4 0.1 ± 0.4x 0.1 ± 0.4x 0.1 ± 0.7
Alfaxan-administered 1.1 ± 0.4a 2.1 ± 0.4y 3.3 ± 0.4by 0.7 ± 0.7a
1n= 9 sows Table 4 – Progesterone concentrations (ng/ml; LS-means ± SEM). Subscripts with different letters differ within a row (a,b) or within a column (x,y,z) (P < 0.05).
Day 5 12 19 261
Pregnant 8.0 ± 0.8abx 8.6 ± 0.7ax 5.4 ± 0.9bx 8.2 ± 1.7abx
Ovariectomised 1.6 ± 0.9 y 0.9 ± 0.9y 0.9 ± 0.9y 1.0 ± 1.4y
Alfaxan-administered 3.3 ± 0.8ay 4.3 ± 0.8abz 7.4 ± 0.8bx 3.4 ± 1.4abxy
1n= 9 sows Table 5 – Cortisol concentrations (ng/mL; data were analysed using the log transformation log(x+1) and is presented as back transformed with the 95% CI in
parenthesis and the non-transformed LS-means ± SEM in brackets). Day 5 12 19
Pregnant 2.6 (2.0-3.4) [28.1 ± 8.1]
2.9 (2.2-3.7) [34.3 ± 7.6]
2.7 (2.0-3.6) [26.4 ± 8.2]
Ovariectomised 2.8 (2.0-3.8) [32.0 ± 9.1]
2.2 (1.6-3.0) [22.0 ± 9.0]
2.6 (1.8-3.5) [33.7 ± 9.0]
Alfaxan-administered 3.4 (2.5-4.4) [38.2 ± 8.4]
3.3 (2.5-4.3) [48.7 ± 8.4]
2.5 (1.9-3.4) [25.7 ± 8.4]
Table 6 – Area under the curve for cortisol concentrations and resident-intruder test (LS-means ± SEM).
Treatment PREG OVEX ALF P-value
Area under the curve (arbitrary units, thousands)
-14.7 ± 52.5* 123.4 ± 59.0 132.3 ± 53.3 0.13
Duration of the resident-intruder test (sec)
370 ± 51 532 ± 57 494 ± 53 0.10

16
*A negative value indicates that the cortisol concentration returned below baseline concentrations with a time and amplitude spent below baseline greater that the time spend above baseline concentration.
Figure 3 – Allopregnanolone concentrations per treatment on each day.
Figure 4 – Progesterone concentrations per treatment on each day.
0
0.5
1
1.5
2
2.5
3
3.5
4
5 12 19 26
Allo
pre
gnan
olo
ne
co
nce
ntr
atio
ns
(pm
olm
L)
Days of gestation
Pregnant
Ovariectomised
Alfaxan-administered
0
2
4
6
8
10
12
5 12 19 26
Pro
gest
ero
ne
co
nce
ntr
atio
ns
(ng/
mL)
Days of gestation
Pregnant
Ovariectomised
Alfaxan-administered
*
*

17
Figure 5 – Cortisol concentrations per treatment on each day (non-transformed LS-means).
3.3. Experiment 2
3.3.1. Overall interactions
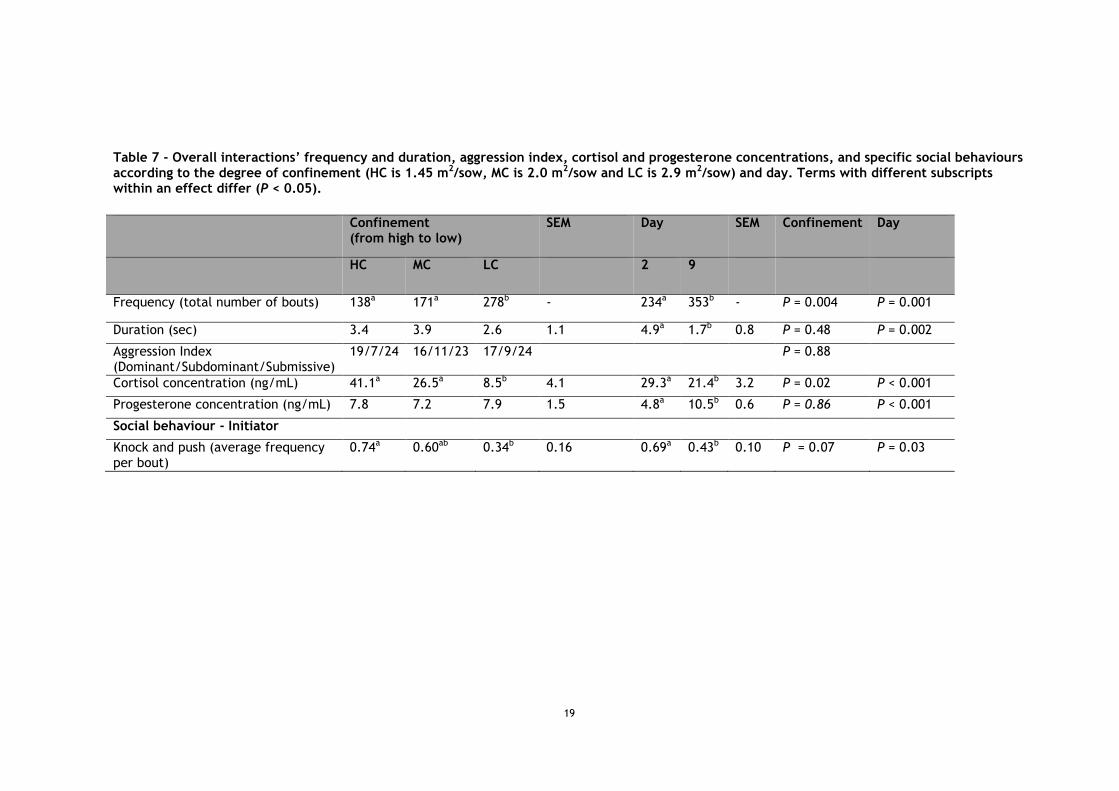
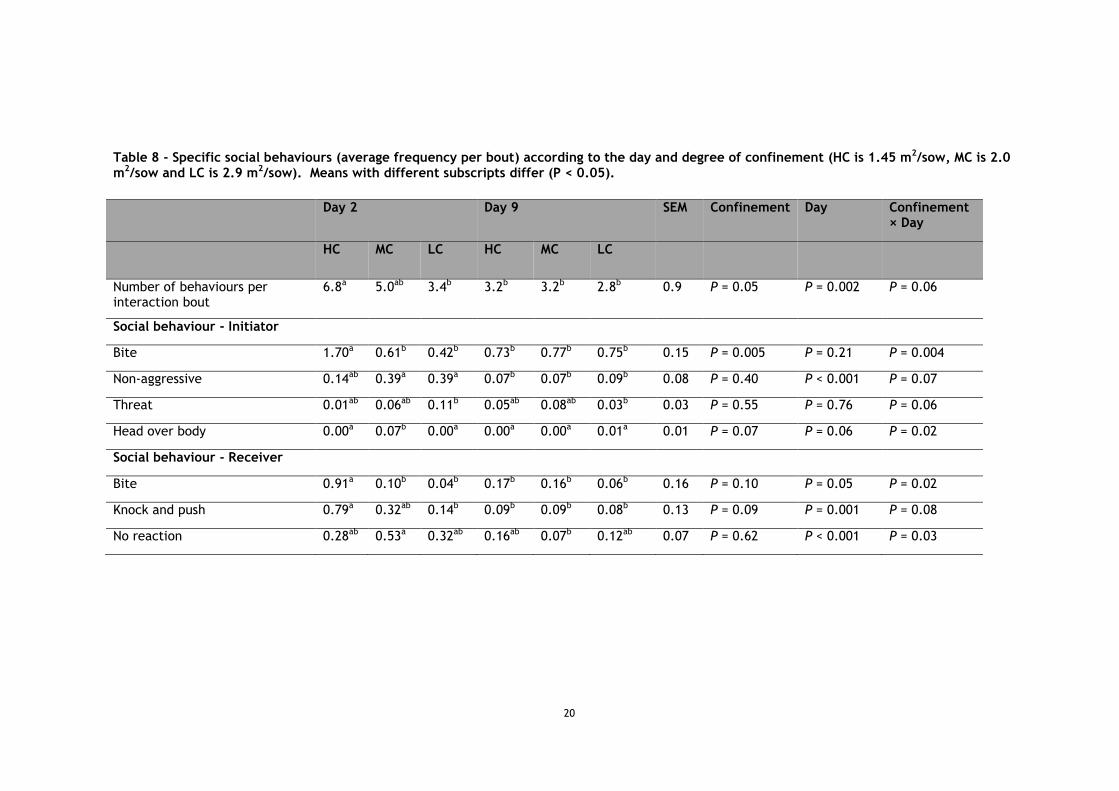
A total of 587 interactions were observed. The frequency of interactions differed according to space (P = 0.004), with more frequent interactions at 2.9 m2 than 2 and 1.45 m2 (P = 0.02 and P = 0.004), and according to the day (P = 0.001), with less frequent interactions on day 2 than on day 9 (Table 7). The duration of interactions did not differ according to space (P = 0.48), but differed according to the day (P = 0.002), with longer interactions on day 2 than on day 9. Of all interactions, 58.8% were brief exchanges composed of 1 reciprocal action and 83.0% consisted of 1 or 2 reciprocal actions. The number of behaviours within those interactions differed according to space (P = 0.05), day (P = 0.002), and with a trend for the interaction of space × day (P = 0.06; Table 8). The number of behaviour exchanged decreased between day 2 and day 9 at 1.45 m2 (P = 0.003), and tended to decrease at 2 m2 (P = 0.06), but did not change at 2.9 m2 (P = 0.64), which was already lower than 1.45 m2 on day 2 (P = 0.005).
The aggression index, i.e. whether a sow classified as a dominant, subdominant, or submissive, did not differ according to space (Chi-square test P = 0.88, Table 7), nor did the aggression ratio used to classify the sows in each category (P = 0.80).
3.3.2. Specific behavioural components
Initiators’ knocks and pushes tended to differ according to space (P = 0.06, Table 7), being more frequent at 1.45 m2 than at 2.9 m2 (P = 0.03). Initiator also displayed more knocks and pushes on day 2 than on day 9 (P = 0.03).
Some of the behaviours within these interactions differed according to the interaction of space × day (Table 8). Both initiators and receivers displayed more bites at 1.45 m2 than at 2 and 2.9 m2 on day 2 (all P < 0.01), and this decreased for 1.45 m2 between day 2 and day 9 (P = 0.003 and P = 0.004), with no more difference between spaces on day 9 (all P > 0.1). Receivers also responded with more knocks and pushes at 1.45 m2 than at 2.9 m2 on day 2 (P = 0.01), and it tended to occur more often at 1.45 m2 than 2 m2 (P = 0.06), but this decreased for
0
10
20
30
40
50
60
5 12 19
Co
rtis
ol c
on
cen
trat
ion
(n
g/m
L)
Days of gestation
Pregnant
Ovariectomised
Alfaxan-administered

18
1.45 m2 between day 2 and day 9 (P = 0.01), with no more difference between spaces on day 9 (all P > 0.1).
In contrast, initiators tended to perform more non-aggressive social behaviours at 2 and 2.9 m2 than at 1.45 m2 on day 2 (P = 0.07 and P = 0.06), but both treatments decreased between day 2 and day 9 (both P < 0.001), with no more difference between spaces on day 9 (all P > 0.1). Initiators also tended to display more threats at 2.9 m2 than at 1.45 m2 on day 2 (P = 0.07), but those threats at 2.9 m2 decreased between day 2 and day 9 (P = 0.02), with no more differences between spaces on day 9 (all P > 0.1).
Initiators performed more head over receiver’s body at 2 m2 compared to 1.45 and 2.9 m2 on day 2 (P = 0.01 and P = 0.005), but this decreased for 2 m2 between day 2 and day 9 (P = 0.003), with no more difference between spaces on day 9 (all P > 0.1). Receivers tended to show higher levels of no reaction at 2 m2 than at 1.45 and 2.9 m2 on day 2 (P = 0.06 and P = 0.08), but this decreased for 2 m2 between day 2 and day 9 (P < 0.001), with no more differences between spaces on day 9 (all P > 0.1).
Chasing by receiver and pause behaviours by initiator and receiver differed according to day, decreasing between day 2 and day 9 (Chasing by receiver: 0.01 and 0.00 occurrences per bout, SEM: 0.01, P = 0.04; Pause by initiator: 0.04 and 0.01 occurrences per bout, SEM: 0.01, P = 0.02; Pause by receiver: 0.02 and 0.00 occurrences per bout, SEM: 0.01, P = 0.05, respectively). Attempts to bite, approach, retreat, switch did not differ according to space or day (initiator and receiver combined, means ± SE: 0.07 ± 0.01, 0.01 ± 0.00, 0.60 ± 0.03, 0.02 ± 0.00 occurrences per bout, respectively, all P > 0.1).
3.3.1. Initiating and finishing behaviours
The type of initating behaviour that started an interaction differed according to space (Fisher’s test P = 0.005). Interactions started most often with a bite to the head (47.8, 42.7 and 38.5% for 1.45, 2 and 2.9 m2, respectively), or head to head knock (32.6, 21.6 and 21.9% for 1.45, 2 and 2.9 m2, respectively). Yet, ano-genital nosing, attempt to bite and threat were more frequent at 2 and 2.9 m2 than 1.45 m2 (ano-genital nosing: 7.25, 14.0 and 15.8%; attempt to bite: 5.1, 10.5 and 11.9%; and threat: 3.6, 6.4 and 6.1% for 1.45, 2 and 2.9 m2, respectively). Initiating behaviours also differed according to the day (Fisher’s test P < 0.001), with an increase in bite to head and head to head knock and a decrease in ano-genital nosing between day 2 and day 9 (34.2% vs. 47.0%, 21.4% vs. 26.4% and 22.7% vs. 7.1%, respectively).
Of the 587 interactions, 89.3% of the interactions were terminated by the recipient sow and the rest by the initiator. There was no difference in the type of finishing behaviour according to space (Fisher’s test P = 0.43), or day (Fisher’s test P = 0.81), which consisted in 82.9% of the cases in retreat and in 10.8% of showing no reaction.
19
Table 7 - Overall interactions’ frequency and duration, aggression index, cortisol and progesterone concentrations, and specific social behaviours according to the degree of confinement (HC is 1.45 m2/sow, MC is 2.0 m2/sow and LC is 2.9 m2/sow) and day. Terms with different subscripts within an effect differ (P < 0.05).
Confinement (from high to low)
SEM Day SEM Confinement Day
HC MC LC 2 9
Frequency (total number of bouts) 138a 171a 278b - 234a 353b - P = 0.004 P = 0.001
Duration (sec) 3.4 3.9 2.6 1.1 4.9a 1.7b 0.8 P = 0.48 P = 0.002
Aggression Index (Dominant/Subdominant/Submissive)
19/7/24 16/11/23 17/9/24 P = 0.88
Cortisol concentration (ng/mL) 41.1a 26.5a 8.5b 4.1 29.3a 21.4b 3.2 P = 0.02 P < 0.001
Progesterone concentration (ng/mL) 7.8 7.2 7.9 1.5 4.8a 10.5b 0.6 P = 0.86 P < 0.001
Social behaviour - Initiator
Knock and push (average frequency per bout)
0.74a 0.60ab 0.34b 0.16 0.69a 0.43b 0.10 P = 0.07 P = 0.03
20
Table 8 - Specific social behaviours (average frequency per bout) according to the day and degree of confinement (HC is 1.45 m2/sow, MC is 2.0 m2/sow and LC is 2.9 m2/sow). Means with different subscripts differ (P < 0.05).
Day 2 Day 9 SEM Confinement Day Confinement × Day
HC MC LC HC MC LC
Number of behaviours per interaction bout
6.8a 5.0ab 3.4b 3.2b 3.2b 2.8b 0.9 P = 0.05 P = 0.002 P = 0.06
Social behaviour - Initiator
Bite 1.70a 0.61b 0.42b 0.73b 0.77b 0.75b 0.15 P = 0.005 P = 0.21 P = 0.004
Non-aggressive 0.14ab 0.39a 0.39a 0.07b 0.07b 0.09b 0.08 P = 0.40 P < 0.001 P = 0.07
Threat 0.01ab 0.06ab 0.11b 0.05ab 0.08ab 0.03b 0.03 P = 0.55 P = 0.76 P = 0.06
Head over body 0.00a 0.07b 0.00a 0.00a 0.00a 0.01a 0.01 P = 0.07 P = 0.06 P = 0.02
Social behaviour - Receiver
Bite 0.91a 0.10b 0.04b 0.17b 0.16b 0.06b 0.16 P = 0.10 P = 0.05 P = 0.02
Knock and push 0.79a 0.32ab 0.14b 0.09b 0.09b 0.08b 0.13 P = 0.09 P = 0.001 P = 0.08
No reaction 0.28ab 0.53a 0.32ab 0.16ab 0.07b 0.12ab 0.07 P = 0.62 P < 0.001 P = 0.03

21
3.3.2. Physiology
Cortisol concentration differed according to space (P = 0.02), with lower cortisol concentration at 2.9 m2 than 2 and 1.45 m2 (8.5 ± 5.1 ng/mL, 26.5 ± 4.1 ng/mL and 41.1 ± 5.1 ng/mL, respectively, P = 0.02 and P < 0.001, respectively), and a trend for lower cortisol concentration at 2 m2 compared to 1.45 m2 (P = 0.07). Cortisol concentrations also decreased between day 2 and day 26 (29.3 ± 3.2 ng/mL and 21.4 ± 3.2 ng/mL, respectively, P < 0.001). However, cortisol concentrations did not differ according to the space × day interaction (P = 0.47). Progesterone did not differ according to space (means ± SE: 7.8 ± 0.5 ng/mL, P = 0.86), but increased between day 2 and day 26 (4.8 ± 0.6 ng/mL and 10.5 ± 0.7 ng/mL, respectively, P < 0.001).
3.4. Discussion
3.4.1. Experiment 1
Allopregnanolone Pregnancy was expected to result in increasing concentrations of allopregnanolone. However, PREG gilts remained stable, and no different from OVEX gilts. The relative difference in concentrations between samples from the pilot and those from the main experiment may be due to the fact that multiparous sows and gilts were used, respectively, or due to an aging antibody with reduced binding potential between the 6 months separating the two analyses. The experiment did confirm that daily alfaxalone administration raised plasma allopregnanolone circulation levels with a progressive increase until d19 followed by a decrease. The time dynamics of this effect is unclear, but the increased concentrations by d12 and d19 suggest that sows may become more sensitive to the administration overtime. Based on the concentrations observed, the daily doses could probably be reduced by half (1.75mg daily) to obtain concentrations closer to pregnancy levels. Because alfaxalone was found to cross-react with the allopregnanolone assay, it cannot be determined whether the allopregnanolone concentrations measured in the ALF gilts were of endogenous or exogenous origin. Progesterone
The higher progesterone concentrations in PREG gilts compared with OVEX gilts was expected because the ovaries are the main source of progesterone production. Furthermore, the drop in progesterone concentrations at d19 of gestation for PREG gilts was expected. Progesterone normally increases to a peak around d12-15, and then slowly decreases to a steady level, so we expected d19 and d26 to be lower than d12. Although d26 was equivalent to d12, it was not significantly different from d12 or d19 and may be an artefact due to the small sample size for d 26.
Progesterone concentrations for the ALF gilts increased by d19 in a similar pattern to the allopregnanolone concentrations. We did not test whether the alfaxan administered cross-reacted with the progesterone assay. It remains a possibility given the fact that we measured some level of progesterone in the ALF gilts, more so than for the OVEX controls.
Resident-intruder test paradigm
The resident-intruder test was used as a controlled paradigm of social stress. The fact that the duration of the resident-intruder test was positively correlated with the area under the curve for cortisol concentrations validated the use of that test to stimulate a social stress response in experimental settings. Furthermore, the

22
test had to be interrupted in average about half-way through the 15 min duration, even on d19, suggesting that the gilts did not appear to habituate to this test or habituated to each other since the same resident animal were used for each experimental gilt. As expected, in 80% of the cases, the dominant sow chosen as resident initiated interactions. Nevertheless, variables such as the duration of the test or the identity of the dominant sow used influenced the stress response, and therefore highlight the difficulty of simulating controlled social stress encounters. Furthermore, the duration of the test increased across replicates, possibly due to the subjectivity of the criteria leading to stoping the test based on physical aggression, or complacency of the handlers.
Pregnant gilts tended to have shorter test than OVEX gilts. However, PREG gilts did not initiate more fights than ALF or OVEX gilts, therefore the reason for this difference remains unclear, but suggests that pregnant gilts somehow get more involved in aggressive encounters than non-pregnant gilts. Alfaxan-administered gilts did not differ from either treatment in their response to the test. The correlation between duration of the resident-intruder test and allopregnanolone concentrations for PREG and OVEX gilts was interesting, but this effect could not be emphasised by the ALF treatment which had experimentally high AP concentrations. It may be that hormones other than allopregnanolone act during pregnancy.
Cortisol and ACTH The HPA axis response was a central aspect of this study investigating the stress responsivity of sows at different stages of gestation, in the range of day 5 and day 26 of gestation. However, cortisol differences were very weak. Treatments did not differ in their cortisol baseline concentrations, but the area under the curve, representing the magnitude of the overall cortisol response felt short of significance, possibly because of insufficient sample size. The marginal differences suggested that pregnant gilts have a less pronounced response to social stress, but this may be confounded with the lower duration of test since shorter test correlated with lower cortisol concentrations. Furthermore, ACTH did not differ according to treatment or day. Dexamethasone-CRH administration Treatments did not differ either with the dexamethasone suppression test followed by CRH administration, as a test of the HPA axis responsivity. As expected with this test, all gilts responded to the dexamethasone by reducing cortisol release which remained stable between 2000h and 0800h, instead of the normal circadian increase in the morning, and all gilts showed substantial release of cortisol after CRH administration. Conclusions Overall, this experiment could not confirm that sows become hypo-responsive to stressors in the first trimester of gestation. Limited data exist about the variation in cortisol concentrations throughout pregnancy in pigs, and other studies have not reported any detectable changes until week 14 or 15 of gestation (e.g. Hay et al., 2000). Hence, it is likely that the HPA axis does not undergo sensitivity changes until much later in gestation. However, the resident-intruder test showed that pregnant gilts somehow get involved in aggressive encounters sooner than non-pregnant gilts, although they rarely were the ones initiating the fight. We found weak evidence that allopregnanolone may be involved in some components of social interaction, with allopregnanolone concentrations positively correlated

23
with longer test duration, hence lower aggressiveness, although this could not be replicated by our experimentally-administered alfaxan treatment as an allopregnanolone agonist. Many effects in this experiment were weak, often appearing as trends. The sample size was limited by the size of this project, as an innovation project. Replication on a larger sample size and using multiparous sows could allow more rigorous testing of these effects.
3.4.2. Experiment 2
A detailed analysis of social interactions in group-housed sows demonstrated that the social behaviours composing those interactions differed depending on the space available, with more physical aggressive behaviours and a possible inhibition or avoidance of social encounters at smaller spaces shortly after mixing. No differences were apparent on day 9, supporting the hypothesis that the effects of space on social interactions are more pronounced within the first days after mixing unacquainted sows.
Aggression in a group is usually assessed in two ways: by measuring the frequency of agonistic interactions or by recording the outcome of those interactions (Jensen, 1982). However, the intensity of those interactions or the type of behaviours comprising those interactions are rarely studied, and remain generally difficult to quantify (Jensen, 1982).Our results provide evidence that the type of social behaviours exchanged differ according to space. Sows housed at 1.45 m2 displayed more physical aggressive behaviours such as head knocks, pushes and bites. Sows housed at 2 and 2.9 m2 tended to display more non-aggressive social behaviours through nose contacts and sometimes threats. Weng et al. (1998) also reported more bites and head knocks as space decreased, whereas Jensen (1984) reported more nose contacts as space increased. Nose to nose has been considered as a mild threat by Jensen (1982), since it was mainly performed by dominant sows and lead most often to no reaction from the receiver. Threats are often defined as agonistic interactions without physical contact (Meese and Ewbank, 1973). Threats may help to sort hierarchy at lower cost than engaging in a physical agonistic interaction, since bites and head knocks can result in injuries (Weng et al., 1998). In fact, most pigs’ agonistic interactions rely on passive aggression such as displacements and threats (Randolph et al., 1981). Retreat was quite frequently observed as a mean to terminate an interaction, but did not differ across space suggesting that sows could escape in any settings, although Jensen (1982) suggested that retreat does not necessarily inhibit further aggression. The event of a third sow getting involved was rare, suggesting that pen-mates could avoid ongoing interactions. Despite the observed differences between the types of social behaviours displayed, it remained difficult to rank those behaviours in terms of intensity or significance for the sows.
Interactions most often started with a bite to the head or head to head knock, which undoubtedly constitute intense aggression. Although less frequent, ano-genital nosing, attempt to bite and threat still represented a third of the initiating behaviours at 2 and 2.9 m2 as compared to only a sixth of those at 1.45 m2. Hence, the start of an interaction was more often less aggressive at larger spaces. Of the 587 interactions, 89.3% were terminated by the recipient sow, which most often retreated. Hence, aggressors appear unwilling to flee an interaction they started, or they may assess their chances before engaging into it or learn from past encounters (van de Poll et al., 1982). Most interactions were brief: 60% were composed of only one reciprocal action and 83.0% consisted of two reciprocal actions. Hence, the results suggest that observing the initiating or the finishing behaviour would capture most types of social interactions.
24
Those socio-behavioural differences according to space were not seen on day 9. This reduction in aggression overtime is well known (Lindberg, 2001). Hierarchy within a group of unacquainted sows is usually settled within a few hours to a few days after mixing (Marchant-Forde, 2009; Meese & Ewbank, 1973). Space at that time is important to allow subordinate sows to escape threats (Jensen, 1982; Marchant-Forde et al., 2011). Once hierarchy is settled, it is possible that sows need less space, since hierarchy or other dominance systems operate primarily to reduce aggression within the group in the long term. Domestic species may also have developed alternative strategies to cope with these social conditions within confined groups (Estevez et al., 2007).
The more frequent interactions at larger spaces and on day 9 seem counter-intuitive. Higher frequency of aggression is usually reported at smaller spaces and on the days following mixing (Hemsworth et al., 2013; Marchant-Forde, 2009; Meese and Ewbank, 1973). However, it is consistent with Jensen (1984) who compared similar space allowances to this study and observed decreased social interactions at smaller spaces. Barnett et al. (1992) similarly reported reduced interactions and higher cortisol concentrations at 1 m2 compared to 2 m2 per sow. One explanation may be that sows actively avoid encounters at smaller spaces, since those interactions are likely to be more aggressive, whereas neutral interactions such as sniffing and low agonistic behaviours such as threats predominate at larger spaces. In semi-natural environments, aggression is rare and groups maintain a 50 m distance with each other (Stolba and Wood-Gush, 1989). However, comparative studies between sows housed in (extensive) outdoor and indoor confinement systems do not report consistent socio-behavioural differences, maybe due to variations in the indoor space studied (Jensen & Wood-Gush, 1984; Marchant-Forde et al., 2011; Meese and Ewbank, 1973). Sows may also adapt their social strategy to cope with reduced space, by avoiding proximity to dominant sows, changing their feeding pattern or altering other behaviours. Avoidance behaviour was not recorded here. A previous study (Ho & Rault, unpublished) showed that subordinate sows will skip the first feedings of the day when fed four times daily.
Space was confounded with group size in this study, but the literature indicates that group size has a negligible effect on pig aggression in comparison to space (Hemsworth et al., 2013; Taylor et al., 1997; Turner et al., 2000). Numerous factors influence aggression, most notably genetics, feeding system, mixing strategies and previous experience. Therefore, those particular findings cannot be generalised to all group-housing systems for pigs.
4. Application of Research
The interpretations from these findings are:
As space allowance increases (1.45 to 2.9 m2), aggression is less intense after mixing sows in unacquainted groups, with more threats and nose contacts rather than bites.
Sows seem to adapt to lower space allowance, as differences seen on day 2
vanished on day 9, suggesting social adaptation to restricted space.
Social interactions were less frequent at small space allowance than at large space allowance, and on day 2 compared to day 9, suggesting that sows avoid each other at small space and early after mixing and display more frequent but less aggressive interactions at larger space and on day 9.

25
There does not appear to be any substantial physiological hyporesponsivity to stress that developed during the first four weeks of gestation, hence no best time to mix in early pregnancy can be suggested based on the physiological stress responses observed in this study.
5. Conclusion
Experiment 1 could not confirm that sows become hypo-responsive to stressors in the first trimester of gestation. Limited data exist about the variation in cortisol concentrations throughout pregnancy in pigs, and other studies have not reported any detectable changes until week 14 or 15 of gestation. Hence, it is likely that the HPA axis does not undergo sensitivity changes until much later in gestation. However, the resident-intruder test showed that pregnant gilts engaged in aggressive encounters more quickly than ovariectomised gilts or alfaxan-treated, ovariectomised gilts. We found weak evidence that the hormone allopregnanolone may be involved in some components of social interaction, with allopregnanolone concentrations positively correlated with longer test duration, and therefore lower aggressiveness. Nonetheless, the alfaxan treatment as an allopregnanolone agonist could not explain most of the differences between pregnant and ovariectomised gilts. Many effects in this experiment were weak, often appearing as trends. The sample size was limited by the size of this project, as an innovation project. Replication on a larger sample size and using multiparous sows could allow more rigorous testing of these effects.
Experiment 2 showed that social interactions are important in newly formed
groups as means to assess each other, develop social recognition and establish a
hierarchy. Nonetheless, animals should be able to fight or flight at any time.
Hence, resources should be offered in confined settings to enable the display of
adequate social behaviours and minimize the intensity of agonistic encounters. No
differences were apparent on day 9, supporting that the effect of space on social
interactions are more pronounced within the first days after mixing unacquainted
sows. These findings suggest that offering more space can increase the frequency
of mild or neutral social interactions within a group of unacquainted animals while
reducing the intensity of aggression seen within the first few days after mixing.
Similar results may be obtained by manipulating the quality of space to offer the
ability to avoid or escape dominant animals, for instance by adding visual
partitions or spreading resources.
6. Limitations/Risks
Experiment 1
Only gilts were available for this trial, and they may differ from sows in
their social behaviour and stress physiology.
A small sample size was used because this study represented a proof-of-
concept as an innovation project composed of two experiments. Further
replication of this result in commercial group settings may be warranted.
26
Experiment 2
Space was confounded with group size in this study, but the literature
indicates that group size has a negligible effect on pig aggression in
comparison to space.
Numerous factors influence aggression, most notably genetics, feeding
system, mixing strategies and previous experience. Therefore, those
particular findings cannot be generalised to all group-housing systems for
pigs.
7. Recommendations
As a result of the outcomes in this study the following recommendations are
made:
There does not appear to be any critical period to mix sows based on their physiological response to stress in early gestation.
Providing more space (2 m2 and in particular, 2.9 m2 per sow, based on the treatments studied here) at mixing will reduce the occurrence of aggressive encounters, and instead encourage much milder interactions (e.g. threats and nose contacts instead of bites) which are less damaging for sows.
Effects on aggression are short-lived, and sows appear to adapt to smaller space allowances with no difference in aggression (1.45 m2 vs. larger) by day 9.
Acknowledgements
The authors thank Jurox Animal Health for providing Alfaxan, and Rebecca Woodhouse, Maxine Rice, Tracie Storey, Emmy Bouwman, Diana Turpin, Carina Go, Rachel Taylor, Tamara Yawno, and the staff from Rivalea for their help with conducting this project.
27
8. References
Arey D.S., Edwards S.A. (1998). Factors influencing aggression between sows after mixing and the consequences for welfare and production. Livestock Production Science, 56, 61–70.
Barnett, J.L., Hemsworth, P.H., Cronin, G.M., Newman, E.A., McCallum, T.H., Chilton, D. (1992). Effects of pen size, partial stalls and method of feeding on welfare related behavioural and physiological responses of group-housed pigs. Applied Animal Behaviour Science, 34, 207–220.
Brunton P.J., Russell J.A. (2011). Allopregnanolone and suppressed hypothalamo-pituitary-adrenal axis stress responses in late pregnancy in the rat. Stress, 14, 6-12.
Douglas, A.J., Johnstone, H., Brunton, P., Russell, J.A. (2000). Sex-steroid induction of endogenous opioid inhibition on oxytocin secretory responses to stress. Journal of Neuroendocrinology, 12, 343–350.
Duncan, G.W., Bowerman, A.M., Hearn, W.R., Melampy, R.M. (1960). In vitro synthesis of progesterone by swine corpora lutea. Experimental Biology and Medicine, 104, 17-19.
Estevez, I., Andersen, I.-L., Nævdal, E. (2007). Group size, density and social dynamics in farm animals. Applied Animal Behaviour Science, 103, 185-204.
Fekedulegn, D.B., Andrew, M.E., Burchfiel, C.M., Violanti, J.M., Hartley, T.A., Charles, L.E., Miller, D.B. (2007) Area under the curve and other summary indicators of repeated waking cortisol measurements. Psychosomatic Medicine, 69, 651-659.
Fraile, I.G., McEwen, B.S., Pfaff, D.W. (1987). Progesterone inhibition of aggressive behaviors in hamsters. Physiology and Behaviour, 39, 225-229.
Frye, C.A., Paris, J.J., Osborne, D.M., Campbell, J.C., Kippin, T.E. (2011). Prenatal stress alters progestogens to mediate susceptibility to sex-typical, stress-sensitive disorders, such as drug abuse: a review. Frontier Psychologist, 2, p.52.
Hay, M., Meunier-Salaun, M.C., Brulaud, F., Monnier, M., Mormede, P. (2000). Assessment of hypothalamic-pituitary-adrenal axis and sympathetic nervous system activity in pregnant sows through the measurement of glucocorticoids and catecholamines in urine. Journal of Animal Science, 78,420–428
Hemsworth, P.H., Morrison, R., Cakebread, P., Tilbrook, A.J., Karlen, M.G., Rice, M., Nash, J., Butler, K.L. and Giri, K. (2011). The effects of group housing during gestation on sow welfare and reproduction. Final report to the Australian Pork Limited (Project 2193), April 2011.
Hemsworth, P.H., Rice, M., Nash, J., Giri, K., Butler, K.L., Tilbrook, A.J., Morrison, R.S. (2013). Effects of group size and floor space allowance on grouped sows: Aggression, stress, skin injuries, and reproductive performance. Journal of Animal Science, 91, 4953-4964.
28
Jensen, P. (1980). An ethogram of social interaction patterns in group-housed dry sows. Applied Animal Ethology, 6, 341-350.
Jensen, P. (1982). An analysis of agonistic interaction patterns in group-housed dry sows - aggression regulation through an “avoidance order”. Applied Animal Ethology, 9, 47-61.
Jensen, P. (1984). Effects of confinement on social interaction patterns in dry sows. Applied Animal Behaviour Science, 12, 93-101.
Kohlert, J.G., Meisel, R.L. (2001). Inhibition of aggression by progesterone and its metabolites in female Syrian hamsters. Aggressive Behaviour, 27, 372-381.
Lightman, S.L., Windle, R.J., Wood, S.A., Kershaw, Y.M., Shanks, N., Ingram, C.D. (2001). Peripartum plasticity within the hypothalamo-pituitary-adrenal axis. Progress in Brain Research, 133, 111-129.
Lindberg, A.C. (2001). Group life. In: Keeling, L.J., Gonyou, H.W. Social Behaviour in Farm Animals. Oxfordshire, UK: CABI . p 37-58.
Marchant-Forde, J.N., Garner, J.P., Lay, D.C., Johnson, A.K. (2011). Action-reaction: using Markov analysis to elucidate social behaviour when unacquainted sows are mixed. Proceedings of the 45th International Congress of the International Society of Applied Ethology, Indianapolis, IN, USA. p.71.
Marchant-Forde, J.N. (2009). Welfare of dry sows. In: Marchant-Forde, J.N. The Welfare of Pigs. The Netherlands: Springer Publishing . p95-139.
Miczek, K.A., Fish, E.W., De Bold, J.F. (2003). Neurosteroids, GABAA receptors, and escalated aggressive behavior. Hormones and Behaviour, 44, 242–257.
Meese, G.B., Ewbank, R. (1973). The establishment and nature of the dominance hierarchy in the domesticated pig. Animal Behaviour, 21, 326-334.
Mendl, M., Zanella, A.J., Broom, D.M. (1992). Physiological and reproductive correlates of behavioural strategies in female domestic pigs. Animal Behaviour, 44, 1107-1121.
Randolph, J.H., Cromwell, G.L., Stahly, T.S., Kratzer, D.D. (1981). Effects of group size and space allowance on performance and behaviour of swine. Journal of Animal Science, 53, 922-927.
Rault, J-L., Carter, C.S., Garner, J.P., Marchant-Forde, J.N., Richert, B.T., Lay, D.C. (2013). Repeated intranasal oxytocin administration in early life dysregulates the HPA axis and alters social behavior. Physiology and Behavior 112-113: 40–48.
Robertson, H.A., King, G.J. (1974). Plasma concentrations of progesterone, oestrone, oestradiol-17β and of oestrone sulphate in the pig at implantation, during pregnancy and at parturition. Journal of Reproduction & Fertility, 40, 133-141.
Rosner, W., (1990). The functions of corticosteroid-binding globulin and sex hormones-binding globulin: Recent advances. Endocrine Reviews, 11, 80–91.
29
Stolba, A., Wood-Gush, D.G.M. (1989). The behaviour of pigs in a semi-natural environment. Animal Production, 48, 419-425.
Taylor, I.A., Barnett, J.L., Cronin, G.M. (1997). Optimum group size for pigs. In: Bottcher, R.W., Hoff, S.J., Livestock Environment V, Volume II. Proceedings of the 5th International Symposium of the American Society of Agricultural Engineers: Bloomingham, Michigan, pp. 965–971.
Turner, S.P., Ewen, M., Rooke, J.A., Edwards, S.A. (2000). The effect of space allowance on performance, aggression and immune competence of growing pigs housed on straw deep-litter at different group sizes. Livestock Production Science, 66, 47–55.
Van de Poll, N.E., De Jonge, F., Van Oyen, H.G., Van Pelt, J. (1982). Aggressive behaviour in rats: effects of winning or losing on subsequent aggressive interactions. Behavioural Processes, 7, 143-155.
Weng, R.C., Edwards, S.A., English, P.R. (1998). Behaviour, social interactions and lesion score of group-housed sows in relation to floor space allowance. Applied Animal Behaviour Science, 59, 307-316.
Wirth, M. (2011). Beyond the HPA axis: progesterone-derived neuroactive steroids in human stress and emotion. Frontiers in Endocrinology, 2, p.19.
Yawno, T., Yan, E.B., Walker, D.W., Hirst, J.J. (2007). Inhibition of neurosteroid synthesis increases asphyxia-induced brain injury in the late gestation fetal sheep. Neuroscience 146, 1726-1733.
30
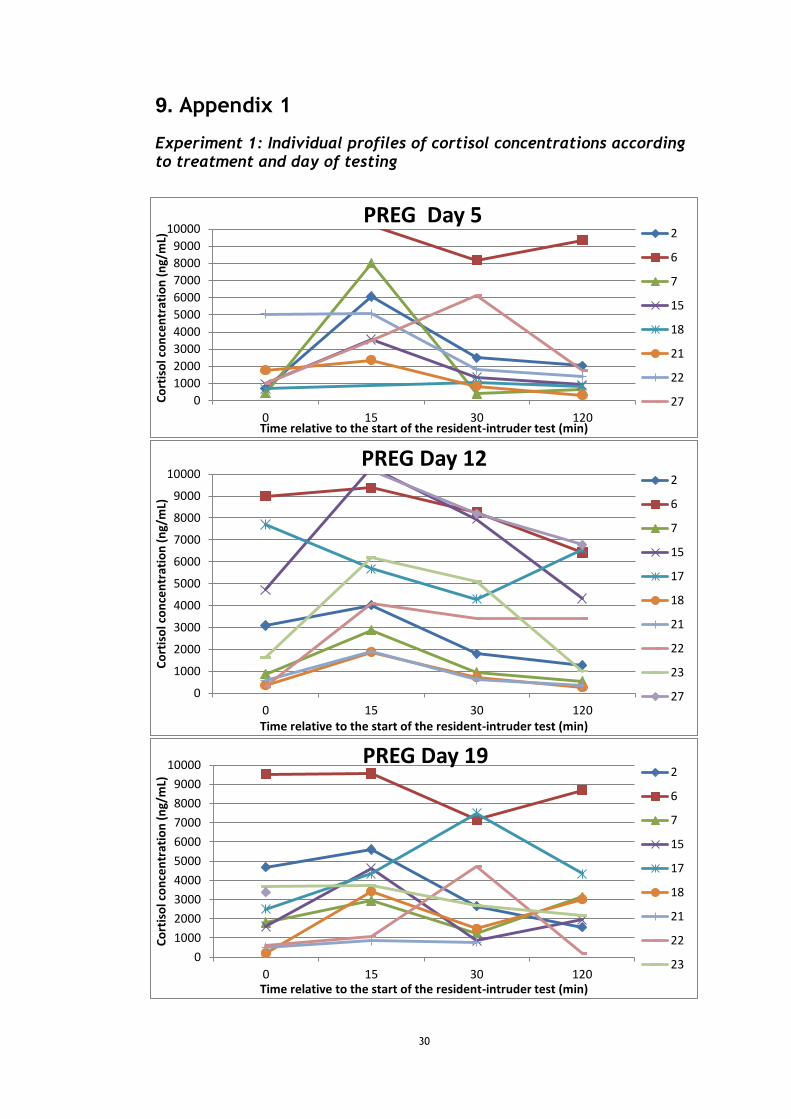
9. Appendix 1
Experiment 1: Individual profiles of cortisol concentrations according to treatment and day of testing
0
1000
2000
3000
4000
5000
6000
7000
8000
9000
10000
0 15 30 120
Co
rtis
ol c
on
cen
trat
ion
(n
g/m
L)
Time relative to the start of the resident-intruder test (min)
PREG Day 5 2
6
7
15
18
21
22
27
0
1000
2000
3000
4000
5000
6000
7000
8000
9000
10000
0 15 30 120
Co
rtis
ol c
on
cen
trat
ion
(n
g/m
L)
Time relative to the start of the resident-intruder test (min)
PREG Day 12 2
6
7
15
17
18
21
22
23
27
0
1000
2000
3000
4000
5000
6000
7000
8000
9000
10000
0 15 30 120
Co
rtis
ol c
on
cen
trat
ion
(n
g/m
L)
Time relative to the start of the resident-intruder test (min)
PREG Day 19 2
6
7
15
17
18
21
22
23

31

32
0
1000
2000
3000
4000
5000
6000
7000
8000
9000
10000
0 15 30 120
Co
rtis
ol c
on
cen
trat
ion
(n
g/m
L)
Time relative to the start of the resident-intruder test (min)
Ovex D5
5
8
12
13
19
26
29
0
1000
2000
3000
4000
5000
6000
7000
8000
9000
10000
0 15 30 120
Co
rtis
ol c
on
cen
trat
ion
(n
g/m
L)
Time relative to the start of the resident-intruder test (min)
Ovex D12
5
8
12
13
19
26
29
0
1000
2000
3000
4000
5000
6000
7000
8000
9000
10000
0 15 30 120
Co
rtis
ol c
on
cen
trat
ion
(n
g/m
L)
Time relative to the start of the resident-intruder test (min)
Ovex D19
5
8
12
13
19
26
29

33
0
1000
2000
3000
4000
5000
6000
7000
8000
9000
10000
0 15 30 120
Co
rtis
ol c
on
cen
trat
ion
(n
g/m
L)
Time relative to the start of the resident-intruder test (min)
Alfalaxan D5
3
9
11
14
16
24
25
28
0
1000
2000
3000
4000
5000
6000
7000
8000
9000
10000
0 15 30 120
Co
rtis
ol c
on
cen
trat
ion
(n
g/m
L)
Time relative to the start of the resident-intruder test (min)
Alfalaxan D12
3
9
11
14
16
24
25
28
0
1000
2000
3000
4000
5000
6000
7000
8000
9000
10000
0 15 30 120
Co
rtis
ol c
on
cen
trat
ion
(n
g/m
L)
Time relative to the start of the resident-intruder test (min)
Alfalaxan D19
3
9
11
14
16
24
25
28