The sensation of groove engages motor and reward networks
13
University of Birmingham The sensation of groove engages motor and reward networks Matthews, Tomas; Witek, Maria; Lund, Torben; Vuust, Peter; Penhune, Virginia DOI: 10.1016/j.neuroimage.2020.116768 License: Creative Commons: Attribution-NonCommercial-NoDerivs (CC BY-NC-ND) Document Version Publisher's PDF, also known as Version of record Citation for published version (Harvard): Matthews, T, Witek, M, Lund, T, Vuust, P & Penhune, V 2020, 'The sensation of groove engages motor and reward networks', NeuroImage, vol. 214, 116768, pp. 1-12. https://doi.org/10.1016/j.neuroimage.2020.116768 Link to publication on Research at Birmingham portal General rights Unless a licence is specified above, all rights (including copyright and moral rights) in this document are retained by the authors and/or the copyright holders. The express permission of the copyright holder must be obtained for any use of this material other than for purposes permitted by law. • Users may freely distribute the URL that is used to identify this publication. • Users may download and/or print one copy of the publication from the University of Birmingham research portal for the purpose of private study or non-commercial research. • User may use extracts from the document in line with the concept of ‘fair dealing’ under the Copyright, Designs and Patents Act 1988 (?) • Users may not further distribute the material nor use it for the purposes of commercial gain. Where a licence is displayed above, please note the terms and conditions of the licence govern your use of this document. When citing, please reference the published version. Take down policy While the University of Birmingham exercises care and attention in making items available there are rare occasions when an item has been uploaded in error or has been deemed to be commercially or otherwise sensitive. If you believe that this is the case for this document, please contact [email protected] providing details and we will remove access to the work immediately and investigate. Download date: 23. Nov. 2021
Transcript of The sensation of groove engages motor and reward networks

University of Birmingham
The sensation of groove engages motor and rewardnetworksMatthews, Tomas; Witek, Maria; Lund, Torben; Vuust, Peter; Penhune, Virginia
DOI:10.1016/j.neuroimage.2020.116768
License:Creative Commons: Attribution-NonCommercial-NoDerivs (CC BY-NC-ND)
Document VersionPublisher's PDF, also known as Version of record
Citation for published version (Harvard):Matthews, T, Witek, M, Lund, T, Vuust, P & Penhune, V 2020, 'The sensation of groove engages motor andreward networks', NeuroImage, vol. 214, 116768, pp. 1-12. https://doi.org/10.1016/j.neuroimage.2020.116768
Link to publication on Research at Birmingham portal
General rightsUnless a licence is specified above, all rights (including copyright and moral rights) in this document are retained by the authors and/or thecopyright holders. The express permission of the copyright holder must be obtained for any use of this material other than for purposespermitted by law.
•Users may freely distribute the URL that is used to identify this publication.•Users may download and/or print one copy of the publication from the University of Birmingham research portal for the purpose of privatestudy or non-commercial research.•User may use extracts from the document in line with the concept of ‘fair dealing’ under the Copyright, Designs and Patents Act 1988 (?)•Users may not further distribute the material nor use it for the purposes of commercial gain.
Where a licence is displayed above, please note the terms and conditions of the licence govern your use of this document.
When citing, please reference the published version.
Take down policyWhile the University of Birmingham exercises care and attention in making items available there are rare occasions when an item has beenuploaded in error or has been deemed to be commercially or otherwise sensitive.
If you believe that this is the case for this document, please contact [email protected] providing details and we will remove access tothe work immediately and investigate.
Download date: 23. Nov. 2021

NeuroImage 214 (2020) 116768
Contents lists available at ScienceDirect
NeuroImage
journal homepage: www.elsevier.com/locate/neuroimage
The sensation of groove engages motor and reward networks
Tomas E. Matthews a,1,*, Maria A.G. Witek b,1, Torben Lund c, Peter Vuust d,e,Virginia B. Penhune a
a Department of Psychology, Concordia University, 7141 Sherbrooke St W, Montreal, Quebec, H4B 1R6, Canadab Department of Music School of Languages, Cultures, Art History and Music, University of Birmingham, Birmingham, B15 2TT, United Kingdomc Center of Functionally Integrative Neuroscience, Department of Clinical Medicine, Aarhus University Hospital, Nørrebrogade 44, Building 1A, 8000, Aarhus C, Denmarkd Center for Music in the Brain, Department of Clinical Medicine, Aarhus University Hospital, Nørrebrogade 44, Building 1A, 8000, Aarhus C, Denmarke Royal Academy of Music, Skovgaardsgade 2C, DK-8000, Aarhus C, Denmark
A R T I C L E I N F O
Keywords:GroovefMRIBeatRhythmic complexityBasal gangliaReward
* Corresponding author.E-mail addresses: [email protected] (T
com (P. Vuust), [email protected] (V1 Shared first authorship
https://doi.org/10.1016/j.neuroimage.2020.11676Received 10 November 2019; Received in revised fAvailable online 23 March 20201053-8119/© 2020 The Authors. Published by Elsenc-nd/4.0/).
A B S T R A C T
The sensation of groove has been defined as the pleasurable desire to move to music, suggesting that both motortiming and reward processes are involved in this experience. Although many studies have investigated rhythmictiming and musical reward separately, none have examined whether the associated cortical and subcorticalnetworks are engaged while participants listen to groove-based music. In the current study, musicians and non-musicians listened to and rated experimentally controlled groove-based stimuli while undergoing functionalmagnetic resonance imaging. Medium complexity rhythms elicited higher ratings of pleasure and wanting tomove and were associated with activity in regions linked to beat perception and reward, as well as prefrontal andparietal regions implicated in generating and updating stimuli-based expectations. Activity in basal ganglia re-gions of interest, including the nucleus accumbens, caudate and putamen, was associated with ratings of pleasureand wanting to move, supporting their important role in the sensation of groove. We propose a model in whichdifferent cortico-striatal circuits interact to support the mechanisms underlying groove, including internal gen-eration of the beat, beat-based expectations, and expectation-based affect. These results show that the sensation ofgroove is supported by motor and reward networks in the brain and, along with our proposed model, suggest thatthe basal ganglia are crucial nodes in networks that interact to generate this powerful response to music.
1. Introduction
The sensation of groove, defined as the pleasurable desire to move tomusic (Janata et al., 2012), is one of the most powerful sources ofmusic-derived pleasure. One way in which music is thought to elicitpleasure is through the interplay between the violation and fulfillment ofmusical expectations (Cheung et al., 2019; Huron, 2006; Juslin andV€astfj€all, 2008; Meyer, 1956; Salimpoor et al., 2015). Musicians andcomposers can manipulate the expectations of a listener by altering thecomplexity or predictability of the rhythms, melodies, harmonies, orother factors that make up a piece of music. For example, listeners prefermelodies that are moderately complex (i.e., moderately unpredictable)compared to very simple or very complex melodies (Pearce and Wiggins,2012). Similarly, groove is thought to rely predominantly on rhythmicexpectations, with moderately complex rhythms leading to greater
.E. Matthews), [email protected]. Penhune).
8orm 17 March 2020; Accepted 1
vier Inc. This is an open access ar
pleasure and wanting to move (Matthews et al., 2019; Sioros et al., 2014;Witek et al., 2014).
Rhythmic expectations are closely tied to the metre, which is thepattern of alternating strong and weak beats (London, 2012; Vuust andWitek, 2014). For example, in a waltz metre which consists of a strongbeat followed by two weak beats, listeners will expect a note to fall on thestrong beat. When notes fall between beats, or on weak beats rather thanstrong beats, they create syncopations which violate expectations andchallenge the metre (Fitch and Rosenfeld, 2007; Vuust and Witek, 2014).Very simple rhythms with no syncopations are highly predictable, butboring, as most, if not all rhythmic expectations are confirmed. Highlycomplex rhythms, with many syncopations, are unpredictable and hardto follow as it is difficult for the listener to perceive a metre, and thusgenerate rhythmic expectations. Medium complexity rhythms, with somesyncopations, strike a balance allowing for both the formation and
m.ac.uk (M.A.G. Witek), [email protected] (T. Lund), petervuust@gmail.
9 March 2020
ticle under the CC BY-NC-ND license (http://creativecommons.org/licenses/by-

Table 1Participant demographic data.
Non-Musicians Musicians
N (male/female) 25 (13/12) 29 (17/12)Age (SD) 23.20 (2.46). 23.76 (2.84)Years of musical training (SD) 0.16 (0.31) 11.5 (3.27)Hours of music practice per week (SD) 11.67 (10.20)
T.E. Matthews et al. NeuroImage 214 (2020) 116768
violation of rhythmic expectations. As the metre is challenged by syn-copations, rhythmic expectations need to be assessed and updated. It hasbeen proposed that this continuous engagement of rhythm expectationprocesses drives the pleasure associated with groove (Koelsch et al.,2019; Vuust et al., 2018; Vuust and Witek, 2014). One way of assessingrhythmic expectations is through movement (Patel and Iversen, 2014),which may account for the desire to move associated with groove(Koelsch et al., 2019).
The link between rhythmic expectations and wanting to move sug-gests that motor regions of the brain may be involved in processinggroove-based music such as funk, Afro-Cuban, and hip-hop (Danielsen,2006; Greenwald, 2002). There have been no previous neuroimagingstudies investigating the brain regions involved in the sensation ofgroove. However, studies of beat perception show activity in brain net-works associated with auditory-motor integration and motor timing(Araneda et al., 2016; Bengtsson et al., 2009; Burunat et al., 2017; Chapinet al., 2010b; Chen et al., 2008; Grahn and Brett, 2007; Grahn and Rowe,2013, 2009; Kung et al., 2013; Schubotz et al., 2000; Thaut et al., 2014).The basal ganglia (BG) seem to be particularly important for beatperception as they are crucial nodes in a core timing network proposed tounderlie beat-based timing (Matell and Meck, 2004; Merchant et al.,2015; Teki et al., 2011). The BG also form distinct cortico-striatal circuitsthat may support different motor and motivational functions relevant togroove (Alexander et al., 1986; Haber, 2003). Recent studies havedemonstrated that the putamen and supplementary motor area (SMA),which are parts of the cortico-striatal ‘motor circuit’, show selective re-sponses to beat and metre (Araneda et al., 2016; Li et al., 2019). Thecaudate forms circuits with both prefrontal and parietal regions (Jarboand Verstynen, 2015) and has been implicated in both rhythmic (Trostet al., 2014) and harmonic expectations (Seger et al., 2013).
Premotor, prefrontal, and parietal regions are also often activated inresponse to a strong beat (Bengtsson et al., 2009; Danielsen et al., 2014;Grahn and Schuit, 2012; Grahn et al., 2011; Grahn and McAuley, 2009;Grahn and Rowe, 2009; McAuley et al., 2012; Schubotz et al., 2000;Schubotz and von Cramon, 2001). These regions are part of the dorsalauditory stream (Hickok and Poeppel, 2004; Rauschecker, 2011), whilepremotor and parietal regions together form the dorsal fronto-parietalnetwork (Ptak et al., 2017). These networks are believed to underlieabstract motor representations that allow for integration of sensory in-formation over time (Ptak et al., 2017; Rauschecker, 2011). Furthermore,rhythmic expectations can be thought of as temporal predictions whichare thought to originate in the motor and premotor cortices (Morillonand Baillet, 2017; Rimmele et al., 2018) and may reflect covert actionsimulation (Arnal, 2012; Patel and Iversen, 2014; Ross et al., 2016;Schubotz, 2007). Therefore, groove may activate motor regions of thebrain via both the motor processes underlying rhythmic expectations andthe overt or covert movement preparation purportedly involved intesting these expectations. Consistent with this, motor cortical excit-ability has been found to be greater for high compared to low groovemusic (Stupacher et al., 2013).
In addition to their role in beat-based timing, the BG, particularly thecaudate and nucleus accumbens (NAcc), are associated with the antici-pation and experience of music-derived pleasure (Blood et al., 1999;Blood and Zatorre, 2001; Koelsch, 2014; Salimpoor et al., 2013, 2011).Activity in the NAcc has been associated with the experience of pleasureincluding from primary (e.g., food and sex) and secondary (e.g., money)rewards (Sescousse et al., 2013). During music-listening, the NAcc isactive during moments of peak pleasure, while the caudate is active inthe period just before peak pleasure, suggesting that the caudate isinvolved in the anticipation of pleasure (Salimpoor et al., 2011). Themedial orbitofrontal cortex (mOFC) also plays a role in assigning,maintaining and monitoring the value of a stimulus (Kringelbach, 2005;O’Doherty, 2004), including music (Koelsch, 2014). A network formedby the NAcc, mOFC, and auditory cortex has been linked to the enjoy-ment of music as shown by both structural (Martinez-Molina et al., 2019)and functional (Salimpoor et al., 2013) connectivity measures.
2
Taken together, the sensation of groove can be framed as the inter-section of reward processing and the motor processes that underlie beatperception, with rhythmic expectations as the driving mechanism.Therefore, to test the role of both reward and motor networks in theexperience of groove, we asked participants to listen to rhythms withmedium and high levels of complexity (i.e., degree of syncopation), andrate both their desire to move and pleasure while undergoing functionalmagnetic resonance imaging (fMRI). Stimuli were drawn from a previousbehavioural study showing that medium complexity rhythms were ratedas more pleasurable and elicited a greater desire to move compared tolow and high complexity rhythms (Matthews et al., 2019). Because wealso found that harmonic complexity modulated the affective componentof groove, this factor was included here. Finally, we tested both musi-cians and non-musicians based on evidence that training can affect boththe sensation of groove (Matthews et al., 2019; Senn et al., 2018) andneural processing in both auditory-motor (Alluri et al., 2017; Grahn andBrett, 2007; Grahn and Rowe, 2009) and reward networks (Alluri et al.,2015; Chapin et al., 2010a).
We expected medium complexity stimuli to elicit activation in brainnetworks involved in the processing of musical beat, as well as in corticaland striatal regions linked to reward,with stronger effects inmusicians thannon-musicians. Given the roles of the putamen, caudate, and NAcc in beat-based timing and reward, we focused analysis on these regions of interest.
2. Material and methods
2.1. Participants
Fifty-seven participants were recruited into two groups (musiciansand non-musicians). Musicians had a minimum of eight years of trainingand were currently practicing. Non-musicians had less than one year oftraining and were not currently practicing. Informed consent was ob-tained, and the study was approved by the Central Denmark RegionCommittees on Health Research Ethics. Participants received 200 DKKremuneration. Two non-musicians were excluded from the scanningsession due to technical problems. Another non-musician was excludedas their ratings showed no variability. Demographic data for the finalsample are provided in Table 1.
2.2. Stimuli
The stimuli were a subset of those developed and validated in apreviously reported online study (Matthews et al., 2019). The stimuliconsisted of short musical sequences with two levels of both rhythmicand harmonic complexity. There were three rhythms and three chords foreach level of complexity resulting in 36 unique stimuli of four differentcategories: medium rhythm/medium harmony (Mr-Mh), mediumrhythm/high harmony (Mr-Hh), high rhythm/medium harmony(Hr-Mh), and high rhythm/high harmony (Hr-Hh). These levels ofcomplexity were chosen since, in the previous study, medium levels ofrhythmic and harmonic complexity elicited the highest ratings andshowed the greatest difference in ratings compared to high complexityrhythms and chords. In addition, two rather than three levels ofcomplexity were chosen in order to maximize the number of trials foreach level. The stimuli were created using Cubase Pro version 8.0.30(Steinberg Media Technologies).
The sequences consisted of piano chords organized into rhythmicchord patterns in a piano timbre presented at 96 beats per minute. Each

Fig. 1. Example of a stimulus with medium levels of rhythmic and har-monic complexity.
T.E. Matthews et al. NeuroImage 214 (2020) 116768
sequence was 10 s long and contained four repeats of a five-onset rhythmpattern with a single chord repeating throughout each sequence plus anisochronous eighth-note hi-hat pattern (see Fig. 1 for musical notation ofa medium complexity rhythm and SFig. 1 for a schematized representa-tion of all rhythm patterns). The medium complexity rhythms consistedof two Afro-Cuban rhythms known as the son clave and rumba clave, andone experimenter-created rhythm. The high complexity rhythms had allbut the first onsets shifted to be early or late relative to the mediumcomplexity patterns, thus increasing their rhythmic complexity. Rhyth-mic complexity was quantified using the syncopation index (Fitch andRosenfeld, 2007). As the hi-hat pattern was identical for all stimuli, it wasnot included when calculating the syncopation index. C-scores – a mea-sure of counter-evidence to the metre – (Povel and Essens, 1985) werealso calculated for each rhythm and were consistent with the syncopationindex within each level of complexity (see SFig. 2A and 2B).
All chords were in the key of D major and included six notes spanningfour octaves (D2 to D#5; see Fig. 1 for musical notation of a mediumcomplexity chord and Table S1 for a list of notes and correspondingfrequencies for all chords). In musical terms, the medium complexitychords consisted of four-note chords with extensions. High complexitychords included a flat ninth interval between chord note and extensionwhich is considered highly dissonant, when not specifically occurring asa flat 9th on a major 7th chord, according to contemporary harmonictheory (Freeman and Pease, 1989; Levine, 2011; Nettles and Ulanowsky,1987). In lay terms, the high complexity chords contained notes withfrequencies, or multiples of frequencies, that were very close to eachother, thus creating an unpleasant sense of roughness or dissonance,while the medium complexity chords did not. Harmonic complexity wasquantified using measures of peak roughness and inharmonicity, calcu-lated using the MIRtoolbox version 1.6.1 (Lartillot et al., 2007; seeSFig. 1D and 1C;).
2.3. Procedure
Before arriving for the study, participants filled out a questionnaireabout their musical background and demographic information. Uponarrival, participants were familiarized with the stimuli and rating taskwith four familiarization trials using stimuli that were not included in themain study. There were two sessions during which participants listenedto and rated all 36 stimuli, one inside the fMRI scanner and one outsidethe scanner. In order to avoid having ratings of wanting to move andpleasure influence each other, participants rated wanting to move in thescanner then pleasure and beat strength outside of the scanner, always inthis order. Ratings of beat strength were collected in order to substantiatethe rhythmic complexity manipulation and to investigate the associationbetween the sensation of groove and perception of beat strength. In thescanning session, participants underwent three fMRI runs, each lastingaround 11 min, during which they listened to all 36 stimuli in a pseudo-random order. A randomly selected subset of 12 stimuli were rated in
3
each scanning run so that all 36 stimuli were rated over the three runs.Rating trials were randomly distributed within each run and participantswere not aware that a given sequence would be rated until after it waspresented, thus avoiding rating-specific activations. Participants selectedtheir rating on a five-point visual scale by pressing two buttons on abutton box to move a cursor right or left along the rating scale. Partici-pants had 7 s to make their rating and non-rated trials had inter-stimulusintervals of five, 7.5, or 10 s. Participants were instructed to look at afixation cross while sequences were presented.
In order to reduce the effect of scanner noise, stimuli were presentedwith noise reduction headphones (Opto-Active, OptoAcoustics, Mazor,Israel, http://www.optoacoustics.com/me dical/optoactive/features). Inaddition, participants wore earplugs inside the headphones. In order tocompensate for the low-pass filter effect of the earplugs, the stimuli werecompared with and without earplugs and then altered so that they sub-jectively matched. This resulted in a 10–20 dB increase for frequenciesgreater than 1500 Hz. This adjustment was identical for all stimuli andparticipants.
After the scanning, participants listened to the stimuli again whileseated at a computer. After each sequence participants had 10 s to ratethe degree of pleasure they experienced and the beat strength of thesequence, both on a five-point visual scale, using a computer mouse toselect their rating.
2.4. Behavioural data analysis
Correlations between rating types were tested on participants’ aver-aged ratings (one value per participant). Confidence intervals aroundcorrelation coefficients were calculated via bootstrapping with 5000 it-erations. Analysis of the effects of rhythmic and harmonic complexityand group on ratings of pleasure, wanting to move, and beat strengthwere conducted on trial-level ratings using linear mixed effects regres-sion with the lme4 package (Bates et al., 2014) in R (version 3.4.1, R coreteam, 2017). A linear mixed effects approach was used to account forinter-individual differences in ratings and in the effects of rhythmic andharmonic complexity as well as differences in effects across the threerhythms and chords (referred to as items) within each level ofcomplexity. Starting with the maximal random structure, includingby-participant and by-item random slopes and intercepts, this structurewas then reduced to the optimal structure that could be supported by thedata following the steps of Bates et al. (2015) and using their RePsych-Ling package. This led to by-participant random slopes and intercepts forrhythmic and harmonic complexity in all three models and by-itemrandom intercepts for the models with wanting to move and beat rat-ings as outcome variables.
For the effects of interest, a forward hierarchical approach was usedwhereby regressors were added incrementally to an intercept-onlymodel, then tested for increases in fit using the likelihood ratio test.Regressors that significantly contributed to model fit were included in afinal model (fit with restricted maximum likelihood criterion) which wasused to get parameter estimates of these regressors. For interactions,estimates of means and mean differences were calculated using emmeans(Lenth et al., 2018). Confidence intervals around the parameter estimateswere calculated via parametric bootstrapping with 5000 iterations.Diagnostic plots of the residuals from all models were inspected for vi-olations of the assumptions of normality and homoscedasticity. No vio-lations were detected.
2.5. MRI data acquisition
Scanning took place at Aarhus University Hospital on a 3T SiemensTIM Trio scanner with a 32-channel coil. Each participant underwentthree runs of whole-brain echo-planar imaging (EPI) using a multi-echosequence which involved acquiring two whole brain volumes at twodifferent echo times (TE1¼ 12.4 ms, TE2¼ 27.92ms) per repetition time(TR ¼ 2000 ms and voxel size ¼ 2.35 � 2.53 � 2.50 mm, number of

T.E. Matthews et al. NeuroImage 214 (2020) 116768
slices ¼ 54, flip angle ¼ 78�). Using the multi-echo sequence reducessignal drop out in regions near sinuses such as the orbitofrontal cortex.The two EPI images within each TR were combined using a signal-to-noise ratio weighted average. This resulted in 326 images per run, witha total of 978 images per participant. T1 structural images were collectedfor each participant at the start of each session (TR ¼ 2420 ms, TE ¼ 3.7ms, voxel size ¼ 1 mm iso, flip angle ¼ 9�).
2.6. MRI preprocessing and statistical analysis
Statistical Parametric Mapping software (SPM12 Wellcome TrustCentre for Neuroimaging, University College London; www.fil.ion.ucl.ac.uk/spm/) was used for preprocessing and statistical analysis. Stan-dard preprocessing steps were followed, including slice timing correc-tion, unwarping, motion correction, coregistration to an MNI template,segmentation, spatial normalization, and spatial smoothing with an 8mm FWHM kernel.
First-level analysis used the general linear model with four conditionregressors corresponding to the four types of stimuli (Mr-Mh, Mr-Hh, Hr-Mh, Hr-Hh) as well as twenty-four regressors accounting for motion pa-rameters, and an additional regressor accounting for rating responseswhich were modeled as events time-locked to button presses. Silent inter-stimulus intervals were unmodeled, thus acting as an implicit baseline.All regressors were then convolved with a canonical hemodynamicresponse function. Four contrast images were calculated per participant,corresponding to the four stimuli conditions. These were then enteredinto a second level analysis where group-level contrasts for each maineffect and interaction were generated. All results are reported at a falsediscovery rate (FDR; peak-level) corrected p < .05. In a mixed design,SPM uses the same error term and degrees of freedom for main effects ofboth within and between-subject factors (Chen et al., 2014; McLarenet al., 2011). Therefore, a confirmatory analysis was implemented inGLM Flex (http://mrtools.mgh.harvard.edu/index.php/GLM_Flex) withthe same contrasts and FDR correction (see Tables S2–S4 for results).
2.7. Region of interest analyses
Parameter estimates (betas) for each participant, for each conditionwere extracted from the putamen and caudate (left and right combined)as well as the left and right nucleus accumbens usingMarsbar (Brett et al.,2002; http://marsbar.sourceforge.net/) with anatomical masks from aprobabilistic atlas (Hammers et al., 2003). Effects of rhythmic and har-monic complexity and musical training were then assessed using thesame approach as the analysis of the ratings. Only by-participant randomeffects were included since parameter estimates were extracted fromgroup level contrast images which did not contain item (i.e., trial) levelactivations.
An additional analysis was implemented to investigate the relationbetween subjective ratings and ROI activity. This analysis also used hi-erarchical linear mixed effects regression, with parameter estimates fromthe ROIs as outcome measures, and group, beat strength ratings, pleasureratings, and wanting to move ratings, as well as interactions betweengroup and the three types of ratings, as predictors. As in the aboveanalysis, only by-participant random effects were included. In order toassess the degree of overlap in variance accounted for by pleasure andwanting to move ratings, and whether they accounted for variance overand above beat strength ratings and group differences, the hierarchicalregression was implemented with two different orders: 1. Group, beatstrength ratings, pleasure ratings, and wanting to move ratings, and 2.Group, beat strength ratings, wanting to move ratings, and pleasureratings. The interactions between group and the ratings were enteredafter the main effects and followed the same orders. In addition to thefinal models including only the significant predictors from each hierar-chical analysis, models with only pleasure ratings, only wanting to moveratings, and both together as predictors, were assessed.
Based on the findings of the whole brain analysis, a post hoc analysis
4
was implemented to investigate the effect of rhythmic and harmoniccomplexity as well as the three ratings types on mOFC activity. ThemOFC ROI was generated from the any effect whole brain F-contrast(thresholded at p< 0.05, FDR) and included two clusters on the left withpeaks at x ¼ �18, y ¼ 28, z ¼ -18 and x ¼ �14, y ¼ 42, z ¼ �20 and onecluster on the right with two peaks at x¼ 24, y¼ 32, z¼�12, and x¼ 26,y ¼ 32, z ¼ �22. The parameter estimates from this ROI were submittedto two analyses identical to those carried out on the BG ROIs.
The subjective ratings, background data, relevant t-maps, extractedROI activations that support these findings, as well as the python code forgenerating stimuli orders, presenting stimuli, and recording responses,are available in the Open Science Framework with identifier link:https://doi.org/10.17605/osf.io/z2sy9.
3. Results
3.1. Behavioural results
All three types of ratings were strongly correlated yet independentenough to be analyzed separately: Pleasure and wanting to move ratings(r ¼ 0.62, 95% CI[0.36, 0.81]); pleasure and beat strength ratings (r ¼0.55, 95% CI[0.27, 0.77]); Wanting to move and beat strength ratings (r¼ 0.42, 95% CI[0.19, 0.61]).
For both musicians and non-musicians, pleasure ratings decreased asrhythmic and harmonic complexity increased (Fig. 2A). However, asignificant interaction between rhythmic and harmonic complexity(χ2(1) ¼ 8.98, p < .003) showed that the difference in ratings betweenMr-Mh and Mr-Hh (mean difference (MD) ¼ 0.696) was greater than thedifference between Hr-Mh and Hr-Hh (MD ¼ 0.440; b ¼ 0.250, 95% CI[0.090, 0.409]). This suggests that medium complexity chords increasedpleasure to a greater degree when combined with medium complexityrhythms compared to high complexity rhythms. The rhythm by groupinteraction improved model fit (χ2(1) ¼ 4.69, p ¼ .030) and showed thatthe difference in ratings between medium and high complexity wasgreater for non-musicians (MD ¼ 1.53) than musicians (MD ¼ 1.17; b ¼�0.364, 95% CI[-0.679, �0.035]).
For wanting to move ratings, there was a three-way interaction withrhythm, harmony, and group (χ2(1) ¼ 5.84, p ¼ .016; Fig. 2B). Musiciansshowed a greater difference in ratings between Mr-Mh and Mr-Hh (MD¼0.521) compared to Hr-Mh and Hr-Hh (MD ¼ 0.226) whereas for non-musicians, the differences between Mr-Mh and Mr-Hh (MD ¼ 0.116)and Hr-Mh and Hr-Hh (MD ¼ 0.151) were similarly small (b ¼ 0.331,95% CI[0.062, 0.601]). This suggests that musicians’ wanting to moveratings were increased by the combination of medium complexityrhythms and chords whereas non-musicians’ ratings were increased bymedium complexity rhythms alone.
For beat strength, the main effect of rhythmic complexity signifi-cantly improved model fit (χ2(1) ¼ 74.83, p < .001), with mediumcomplexity rhythms rated as having a stronger beat than high complexityrhythms (b ¼ 1.672, 95% CI[1.408, 1.933]). The rhythm by harmonyinteraction also improved model fit (χ2(1)¼ 4.08, p¼ .043) showing thatHr-Mh were rated as having higher beat strength than Hr-Hh (MD ¼0.207), whereas Mr-Mh and Mr-Hh were rated more similarly (MD ¼0.077; b ¼ �0.130, 95% CI[-0.254, 0.002]; Fig. 2C). This suggests thathigh complexity rhythms combined with medium complexity chords arerated as having higher beat strength than high complexity rhythms withhigh complexity chords. However, the confidence interval contains zerosuggesting that this effect may be unstable. There was no significant maineffect of group nor a significant interaction between group and rhythmicand/or harmonic complexity.
3.2. Whole-brain fMRI results
Whole-brain contrast images were used to assess the effects ofrhythm, harmony, and musical training (group). Contrasting mediumversus high complexity rhythms (medium > high complexity) revealed

Fig. 2. Subjective ratings as a function of rhythmic complexity, harmonic complexity and group. A. Pleasure ratings. B. Wanting to move ratings. C. Ratings of beatstrength. Center line, median; white dots, means; box limits, upper and lower quartiles; whiskers, 1.5x interquartile range; black dots, outliers.
Table 2Stereotaxic Locations of Peak Voxels in the Medium > High RhythmicComplexity Contrast. Peak activations thresholded at p < 0.05, FDR corrected atthe whole-brain level.
Brain region Clustersize
t(208) pFDR x y z
L putamen 345 5.53 0.004 �14 10 �2L thalamus 3.61 0.026 �2 �2 8R putamen 344 5.32 0.004 22 4 8L inferior parietal lobule 681 4.72 0.007 �42 �48 44
4.57 0.008 �28 �58 404.35 0.01 �36 �54 40
L SMA 321 4.57 0.008 �6 20 484.31 0.01 �4 12 52
L inferior temporal gyrus 153 4.53 0.008 �58 �40 �18R angular gyrus 557 4.34 0.01 38 �58 50R superior parietal lobule 4.32 0.01 34 �66 56R angular gyrus 4.16 0.011 36 �50 38L superior frontal gyrus 59 4.32 0.01 �24 14 68L SMA 210 4.27 0.01 �8 �10 60R SMA 3.64 0.025 8 �4 68R middle frontal gyrus 95 4.2 0.011 34 6 52R inferior temporal 50 3.97 0.015 58 �36 �16L cerebellum, Crus1 74 3.93 0.015 �14 �92 �22L inferior frontal parstriangularis
272 3.87 0.017 �40 26 28
L middle frontal gyrus 3.81 0.019 �38 36 16R cerebellum, Crus 2 22 3.71 0.022 38 �68 �46R pons 1 3.57 0.028 6 �20 �44Calcarine sulcus 18 3.54 0.029 0 �82 �12L superior frontal gyrus 8 3.51 0.03 �20 64 0L middle frontal gyrus 13 3.47 0.032 �28 0 50L superior parietal lobule 16 3.46 0.032 �32 �60 62L medial orbital gyrus 18 3.46 0.033 �14 26 �22L anterior orbital gyrus 3.36 0.039 �22 24 �22L anterior cingulum 3 3.41 0.036 �12 32 28L precentral gyrus 8 3.4 0.036 �16 �18 72R mid cingulum 21 3.34 0.039 4 �4 30L precentral gyrus 31 3.34 0.04 �46 8 32R cerebellum, Crus 2 5 3.33 0.04 12 �88 �28L frontal superior gyrus 1 3.27 0.044 �16 66 2R inferior temporal 2 3.27 0.044 42 �50 �8L precentral gyrus 3 3.26 0.045 �36 6 46L frontal operculum 1 3.21 0.048 �46 14 2
T.E. Matthews et al. NeuroImage 214 (2020) 116768
activations in the bilateral BG including the putamen, caudate, and pal-lidum, with activation in the left BG bordering the NAcc. This contrastalso revealed activation in a network of cortical regions associated withbeat perception including the left SMA (including pre-SMA), bilateraldorsal premotor regions, and bilateral parietal regions (see Table 2 andFig. 3). In addition, this contrast revealed significant activation in the leftprefrontal cortex, left mOFC, the bilateral inferior temporal cortex, andcrus 1 in the right cerebellum. The opposite contrast (high > medium
5
complexity rhythms) revealed no significant activations. Contrastingmusicians versus non-musicians (musicians > non-musicians; averagingover all stimuli conditions) revealed activations in the bilateral caudate,bilateral motor cortex (extending into dorsal premotor cortices), bilateralSMA, right prefrontal cortex, right Heschl’s gyrus, and left posterior su-perior temporal gyrus (see Table 3 and Fig. 4). There were no significantactivations in the reverse contrast (non-musicians > musicians), nor ac-tivations related to harmonic complexity, nor interactions betweenrhythmic and harmonic complexity or group.
3.3. ROI results
Activity in the right NAcc showed a rhythm by harmony interaction(χ2(1) ¼ 6.50, p ¼ .011). The difference between activation for Mr-Mhversus Mr-Hh (MD ¼ 0.132) was greater than Hr-Mh versus Hr-Hh(MD ¼ �0.063; b ¼ 0.195, 95% CI[0.048, 0.343]; Fig. 5B) showingthat the largest activation was for stimuli with medium complexityrhythms combined with medium complexity chords. Activity in the leftNAcc showed a main effect of rhythmic complexity (χ2(1) ¼ 3.99, p ¼.046) with greater activation for medium compared to high complexityrhythms (b ¼ 0.074, 95% CI[0.001, 0.148]; Fig. 5C). Activity in thecaudate showed main effects for both rhythmic complexity (χ2(1) ¼12.43, p < .001) and group (χ2(1) ¼ 5.48, p ¼ .019), with greater acti-vation for medium compared to high complexity rhythms (b ¼ 0.083,95% CI[0.038, 0.129]; Fig. 5D) and greater activation in musicianscompared to non-musicians (b ¼ 0.184, 95% CI[0.030, 0.337]). Activityin the putamen also showed a main effect of rhythmic complexity (χ2(1)¼ 5.93, p ¼ .015), with greater activation for medium compared to highcomplexity rhythms (b¼ 0.073, 95% CI[0.015, 0.129]; Fig. 5E). In a post-hoc analysis, activity in the mOFC also showed a main effect of rhythmiccomplexity (χ2(1) ¼ 6.67, p ¼ .01), with greater activation for mediumcompared to high complexity rhythms (b ¼ 0.063, 95% CI[0.015,0.111]).
In order to assess the overlap in variance accounted for in the ROIactivations by pleasure and wanting to move ratings, the hierarchicalregression was implemented twice per ROI, once with pleasure added tothe model first and once with wanting to move ratings added first (seeTable 4 for results). In addition, final models with both the significantpredictors from the hierarchical analyses as well as models with bothwanting to move and pleasure as predictors, both alone and together,were assessed (see Table 5 for results and Fig. 6 for summary).
Analyses on the right NAcc activations showed that pleasure andwanting to move ratings accounted for overlapping variance, but onlypleasure ratings accounted for variance over and above that of beatstrength ratings. For the left NAcc activations, both pleasure and wantingto move ratings accounted for variance over and above beat strength

Fig. 3. Results of the medium > high rhythmic complexity contrast. dPMC, dorsal premotor cortex; mOFC, medial orbitofrontal cortex; PFC, prefrontal cortex; SMA,supplementary motor area. Images are thresholded at p < 0.05, FDR corrected at the whole-brain level.
Table 3Stereotaxic Locations of Peak Voxels in the Musicians > Non-Musicians Contrast.Peak activations thresholded at p < 0.05, FDR corrected at the whole-brain level.
Brain region Clustersize
t(208) pFDR x y z
L precentral gyrus 162 6.1 0 �46 �4 54White matter 89 4.84 0.004 �38 �42 20White matter 4.44 0.015 �40 �44 12R precentral gyrus 105 4.33 0.018 46 �6 48L SMA 101 4.24 0.023 �2 2 64R inferior frontal parstriangularis
63 4.19 0.024 44 18 24
R Heschl’s gyrus 8 4.16 0.025 56 �8 6L caudate 55 4.04 0.031 �4 12 4L superior temporal gyrus 43 4.01 0.032 �58 �48 18White matter 15 3.98 0.033 22 �12 32R supramarginal gyrus 3 3.73 0.045 56 �36 26
T.E. Matthews et al. NeuroImage 214 (2020) 116768
ratings, but the variance they accounted for was strongly overlapping.For activity in the caudate, wanting to move but not pleasure ratings,accounted for variance over and above beat strength ratings. A near-significant trend showed that wanting to move ratings accounted formarginally unique variance compared to pleasure ratings. Analyses onthe putamen activations showed that wanting to move ratings accountedfor unique variance over and above that accounted for by both beatstrength and pleasure ratings. In addition, there was an interaction be-tween group by beat strength ratings, however, due to overlappingvariance accounted for, the nature of this interaction depended on theinclusion of wanting to move ratings. Finally, in the mOFC, results
Fig. 4. Results of the musician > non-musician contrast. M/dPMC, motor/dorsal premthresholded at p < 0.05, FDR corrected at the whole-brain level.
6
showed that wanting to move ratings accounted for variance over andabove pleasure ratings. In the final models, wanting to move ratingsaccounted for unique variance, however, this affect only approachedsignificance.
4. Discussion
In this study we set out to understand the brain networks involved inthe sensation of groove. Consistent with previous findings, participantsexperienced a stronger sensation of groove for medium compared to highlevels of both rhythmic and harmonic complexity, with higher ratings ofpleasure and wanting to move (Matthews et al., 2019). This was coupledwith greater activity for medium complexity rhythms in reward-relatedregions including the NAcc, caudate, and mOFC, and in regions associ-ated with beat-based timing including the putamen, SMA, as well asprefrontal and parietal cortices. In addition, in both the left and rightNAcc, pleasure and wanting to move ratings predicted activity to asimilar degree, largely accounting for the same variance. In the mOFC,there was overlap in variance accounted for by wanting to move andpleasure, however, wanting to move was a stronger predictor. In theputamen, wanting to move ratings accounted for variance over and abovethat accounted for by both pleasure and beat strength ratings. In thecaudate, wanting to move ratings and beat strength ratings accounted foroverlapping variance. Finally, musicians showed overall greater activityin regions associated with beat perception.
Together, these findings suggest that the sensation of groove is drivenby a combination of motor and reward regions in the brain. We interpretthese results in the context of rhythmic expectations, suggesting that thegeneration of these expectations based on a regular beat, and their
otor cortex; PFC, prefrontal cortex; SMA, supplementary motor area. Images are

Fig. 5. Results of ROI analysis. A. Coronal viewof a single subject MNI template showing BGmasks from probabilistic anatomical atlas used inregion of interest analyses (Hammers et al.,2003). Blue, caudate; Green, putamen; Orange,nucleus accumbens. B. Right nucleus accumbensactivation as a function of rhythmic and har-monic complexity. C. Left nucleus accumbensactivation as a function rhythmic complexity. D.Caudate activation as a function of rhythmiccomplexity. E. Putamen activation as a functionof rhythmic complexity. F. Medial orbitofrontalcortex activation as a function of rhythmiccomplexity. NAcc, nucleus accumbens; mOFC,medial orbitofrontal. Center line, median; whitedots, means; box limits, upper and lower quar-tiles; whiskers, 1.5x interquartile range; blackdots, outliers.
T.E. Matthews et al. NeuroImage 214 (2020) 116768
violation via syncopations, are core drivers of groove (Matthews et al.,2019; Vuust and Witek, 2014). Based on this formulation, we propose atheoretical model of the brain mechanisms underlying groove that iscentered on the cortico-striatal circuits thought to underlie predictivetiming and reward processing.
4.1. Medium complexity rhythms drive the sensation of groove
Behavioural results showed that medium complexity rhythms led tohigher ratings of pleasure, wanting to move, and beat strength. Only themedium and high complexity conditions were included in order tomaximize the number of trials per condition. Therefore, we could notconfirm an inverted U-shaped pattern of ratings here. However, ratingsfor the medium and high complexity rhythms are consistent with thoseobtained in our previous study which included the low complexity con-dition (Matthews et al., 2019). Therefore, the current results providefurther evidence that medium complexity rhythms strongly contribute tothe sensation of groove.
Consistent with previous results, medium complexity chords incombination with medium complexity rhythms increased pleasure rat-ings, providing further evidence that harmony enhances the affectivecomponent of groove (Matthews et al., 2019). Intriguingly, ratings ofbeat strength were also enhanced by medium complexity chords, sup-porting previous work showing that beat and metre perception are notdriven by rhythmic factors alone (Dawe et al., 1993; Hannon et al.,2004). Finally, for musicians, the combination of medium complexityrhythms and chords enhanced the desire to move, suggesting that forthose with musical training, the sensation of groove is more affected bynon-rhythmic factors.
4.2. The sensation of groove involves reward regions of the brain
fMRI results showed that medium complexity rhythms were associ-ated with greater activity in the left NAcc and left mOFC. Convergingevidence from neuroimaging studies suggests that the NAcc and mOFC
7
are important for the experience of music-derived pleasure (Koelsch,2014; Martinez-Molina et al., 2019; Martínez-Molina et al., 2016; Sal-impoor et al., 2013). Here, activity in both left and right NAcc alsoshowed a positive association with both pleasure and wanting to moveratings, suggesting an association with groove overall rather than thepleasure component alone. One explanation may be that the NAcc is notonly involved in the experience of music-derived pleasure, but also in theprocessing of expectations that can lead to such pleasure (Gebauer et al.,2012; Koelsch, 2014; Salimpoor et al., 2015). For example, NAcc acti-vation has recently been associated with musical uncertainty (Cheunget al., 2019) and musical surprise (Shany et al., 2019), and has also beenshown to track reward prediction errors associated with harmonic vio-lations (Gold et al., 2019). In the current study, the right NAcc showedgreater activation in response to the combination of medium complexityrhythms and chords, which was the condition that elicited the highestpleasure and wanting to move ratings. Interestingly, this was the onlyregion to show an effect of harmonic complexity, which might relate tothe right-dominance of regions involved in tonal processing (Zatorreet al., 2002).
Activity in the mOFC has been associated with assigning affectivevalue to stimuli, including music (Zatorre and Salimpoor, 2013). How-ever, in the current results mOFC activity showed a stronger associationwith wanting to move ratings than with pleasure ratings. A more recenthypothesis suggests that OFC involvement in value assignment iscontingent on whether this process involves mental simulation ofbehavioural outcomes (Stalnaker et al., 2015). This is consistent with thecurrent results as wanting to move ratings, in contrast to pleasure ratings,may involve action simulation. Therefore, one possibility is that the NAccencodes the positive affective state of groove, while the mOFC encodesthe association between the music and the desire to move.
4.3. The sensation of groove involves motor regions of the brain
Our results also showed greater activation in bilateral putamen andcaudate as well as the SMA (including pre-SMA) and bilateral dorsal

Table 4Results of Hierarchical Analysis Testing the Association between ROI Activationsand Subjective Ratings.
Region Order Predictor χ2(1) p value
R NAccGroup 2.165 0.141Beat 0.868 0.352
Pleasure First Pleasure 4.501 0.034Move 0.084 0.772
Move first Move 2.534 0.111Pleasure 2.050 0.152
L NAccGroup 0.487 0.485Beat 2.649 0.104
Pleasure First Pleasure 4.172 0.041Move 1.751 0.186
Move first Move 5.389 0.020Pleasure 0.534 0.465
CaudateGroup 5.481 0.019Beat 4.956 0.026
Pleasure First Pleasure 2.812 0.094Move 3.636 0.057
Move first Move 6.448 0.011Pleasure 0.000 0.984
PutamenGroup 0.863 0.353Beat 1.607 0.205
Pleasure First Pleasure 3.499 0.061Move 3.913 0.048Group:beat 9.922 0.002
Move first Move 7.401 0.007Pleasure 0.011 0.917
mOFCGroup 2.510 0.113Beat 3.329 0.068
Pleasure First Pleasure 0.630 0.427Move 4.414 0.036
Move first Move 4.499 0.034Pleasure 0.546 0.460
Beat, beat strength ratings; Move, wanting to move ratings.Pleasure, pleasure ratings; NAcc, nucleus accumbens.mOFC, medial orbitofrontal cortex.
Table 5Results of Final Models Testing the Association between ROI Activations andSubjective Ratings.
Region Model Predictor β 95% CI
R NAccPleasure 0.047 [0.004, 0.089]Move 0.042 [-0.004, 0.090]Pleasure and Move Pleasure 0.055 [-0.026, 0.137]
Move �0.010 [-0.104, 0.082]L NAcc
Pleasure 0.053 [0.015, 0.092]Move 0.062 [0.018, 0.107]Pleasure and Move Pleasure 0.021 [-0.053, 0.094]
Move 0.042 [-0.040, 0.123]Caudate
Group and Beat Group 0.182 [0.035, 0.335]Beat 0.026 [0.003, 0.049]
Group, Beat, and Pleasure Pleasure 0.035 [-0.006, 0.075]Group, Beat, and Move Move 0.064 [0.014, 0.113]Group, Beat, Pleasure, andMove
Pleasure �0.001 [-0.056, 0.053]
Move 0.064 [-0.000, 0.132]Putamen
Group:Beat �0.073 [-0.120,�0.026]
Group:Beat, and Pleasure Pleasure 0.022 [-0.020, 0.063]Group:Beat, and Move Move 0.061 [0.013, 0.109]Group:Beat, Pleasure, andMove
Pleasure �0.023 [-0.080, 0.031]
Move 0.079 [0.014, 0.145]mOFC
Pleasure 0.028 [0.000, 0.057]Move 0.045 [0.016, 0.077]Pleasure and Move Pleasure �0.015 [-0.067, 0.036]
Move 0.060 [-0.000, 0.119]
Beat, beat strength ratings; Move, wanting to move ratings.Pleasure, pleasure ratings; NAcc, nucleus accumbens.mOFC, medial orbitofrontal cortex. Group:Beat, a group by beatstrength ratings interaction from models that also includes the main effect ofeach.
T.E. Matthews et al. NeuroImage 214 (2020) 116768
premotor cortices for medium complexity rhythms. The putamen and theSMA are part of the cortico-striatal ‘motor circuit’ (Alexander et al.,1986) and together with the caudate are suggested to be crucial nodes inboth the striatal beat-frequency and pacemaker-accumulator models oftiming (Coull et al., 2011; Matell and Meck, 2004; Merchant et al., 2013).In addition, recent theories suggest that temporal predictions aregenerated in the motor system via covert and unconscious action simu-lation (Arnal, 2012; Patel and Iversen, 2014; Rimmele et al., 2018; Rosset al., 2016; Schubotz, 2007). This is supported by a recent study showingthat temporal predictions in the context of regular auditory stimuli aredriven by motor signals to the auditory cortex (Morillon and Baillet,2017). In the context of beat perception, the efferent signals of thesecovert actions may act as an internal representation of the beat, or ‘pacingsignal’ (Kotz et al., 2016), informing beat-based expectations.
Converging evidence suggest that the putamen, SMA and dorsalpremotor cortices are crucial for generating an internal representation ofa beat (Araneda et al., 2016; Grahn and Brett, 2007; Grahn and Rowe,2009; Merchant et al., 2015), with the putamen seeming particularlyimportant (Grahn and Rowe, 2013). Studies with both Parkinson’s dis-ease (Grahn and Brett, 2009) and lesion patients (Nozaradan et al., 2017)also support the importance of the BG in beat perception. Furthermore,oscillatory activity in the SMA and putamen has been shown to entrain tofrequencies denoting the beat and metre, respectively (Li et al., 2019).However, two recent studies using transcranial magnetic stimulation(TMS) support the role of the dorsal premotor cortex (Ross et al., 2018a)but not the SMA (Ross et al., 2018b) in beat perception.
Interestingly, the caudate was the only region of interest whose
8
activity showed a main effect of beat strength ratings. However, furtheranalysis revealed strong overlap between the effects of beat strength andwanting to move ratings in this region. Beat strength ratings did show arelation to putamen activity via an interaction with group, the nature ofwhich also depended on the inclusion of wanting to move ratings in themodel. Together these results provide further evidence that beatperception and motor activation are strongly linked, both in terms ofsubjective experience and neural underpinnings.
4.4. The sensation of groove involves frontoparietal networks
Medium complexity rhythms also elicited increased activation inbilateral parietal (with peaks in inferior and superior parietal lobules)and left prefrontal cortical regions. Parietal and prefrontal regions arecomponents of both the dorsal auditory (Hickok and Poeppel, 2004;Rauschecker, 2011) and the fronto-parietal networks (Ptak et al., 2017),which are thought to underlie the motor representations of stimuliallowing for the processing of sensory input that evolves over time (Ptaket al., 2017; Rauschecker, 2011). These regions have also been impli-cated in the cognitive aspects of temporal and rhythmic processingincluding temporal attention (Bolger et al., 2014; Coull and Nobre, 2008;Coull et al., 2011; Davranche et al., 2011; Nobre and van Ede, 2017),encoding and retrieval of beat-based time intervals (Konoike et al., 2015,2012), and rhythmic deviant detection (Lappe et al., 2016, 2013). Arecent TMS study showed that down-regulating parietal activity disruptsperception of phase shifts of the beat (Ross et al., 2018b). These resultsare consistent with the parietal cortices purported role as the interfacebetween motor-driven temporal predictions and sensory input (Rau-schecker, 2011; Rimmele et al., 2018).
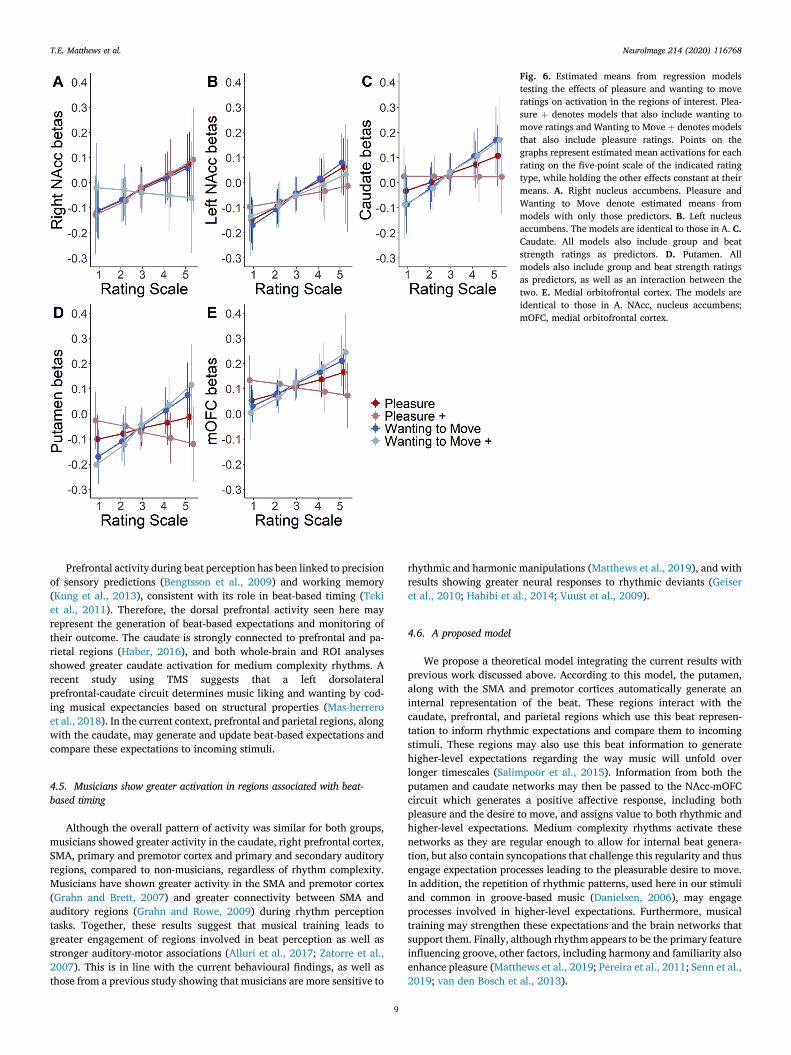
Fig. 6. Estimated means from regression modelstesting the effects of pleasure and wanting to moveratings on activation in the regions of interest. Plea-sure þ denotes models that also include wanting tomove ratings and Wanting to Move þ denotes modelsthat also include pleasure ratings. Points on thegraphs represent estimated mean activations for eachrating on the five-point scale of the indicated ratingtype, while holding the other effects constant at theirmeans. A. Right nucleus accumbens. Pleasure andWanting to Move denote estimated means frommodels with only those predictors. B. Left nucleusaccumbens. The models are identical to those in A. C.Caudate. All models also include group and beatstrength ratings as predictors. D. Putamen. Allmodels also include group and beat strength ratingsas predictors, as well as an interaction between thetwo. E. Medial orbitofrontal cortex. The models areidentical to those in A. NAcc, nucleus accumbens;mOFC, medial orbitofrontal cortex.
T.E. Matthews et al. NeuroImage 214 (2020) 116768
Prefrontal activity during beat perception has been linked to precisionof sensory predictions (Bengtsson et al., 2009) and working memory(Kung et al., 2013), consistent with its role in beat-based timing (Tekiet al., 2011). Therefore, the dorsal prefrontal activity seen here mayrepresent the generation of beat-based expectations and monitoring oftheir outcome. The caudate is strongly connected to prefrontal and pa-rietal regions (Haber, 2016), and both whole-brain and ROI analysesshowed greater caudate activation for medium complexity rhythms. Arecent study using TMS suggests that a left dorsolateralprefrontal-caudate circuit determines music liking and wanting by cod-ing musical expectancies based on structural properties (Mas-herreroet al., 2018). In the current context, prefrontal and parietal regions, alongwith the caudate, may generate and update beat-based expectations andcompare these expectations to incoming stimuli.
4.5. Musicians show greater activation in regions associated with beat-based timing
Although the overall pattern of activity was similar for both groups,musicians showed greater activity in the caudate, right prefrontal cortex,SMA, primary and premotor cortex and primary and secondary auditoryregions, compared to non-musicians, regardless of rhythm complexity.Musicians have shown greater activity in the SMA and premotor cortex(Grahn and Brett, 2007) and greater connectivity between SMA andauditory regions (Grahn and Rowe, 2009) during rhythm perceptiontasks. Together, these results suggest that musical training leads togreater engagement of regions involved in beat perception as well asstronger auditory-motor associations (Alluri et al., 2017; Zatorre et al.,2007). This is in line with the current behavioural findings, as well asthose from a previous study showing that musicians are more sensitive to
9
rhythmic and harmonic manipulations (Matthews et al., 2019), and withresults showing greater neural responses to rhythmic deviants (Geiseret al., 2010; Habibi et al., 2014; Vuust et al., 2009).
4.6. A proposed model
We propose a theoretical model integrating the current results withprevious work discussed above. According to this model, the putamen,along with the SMA and premotor cortices automatically generate aninternal representation of the beat. These regions interact with thecaudate, prefrontal, and parietal regions which use this beat represen-tation to inform rhythmic expectations and compare them to incomingstimuli. These regions may also use this beat information to generatehigher-level expectations regarding the way music will unfold overlonger timescales (Salimpoor et al., 2015). Information from both theputamen and caudate networks may then be passed to the NAcc-mOFCcircuit which generates a positive affective response, including bothpleasure and the desire to move, and assigns value to both rhythmic andhigher-level expectations. Medium complexity rhythms activate thesenetworks as they are regular enough to allow for internal beat genera-tion, but also contain syncopations that challenge this regularity and thusengage expectation processes leading to the pleasurable desire to move.In addition, the repetition of rhythmic patterns, used here in our stimuliand common in groove-based music (Danielsen, 2006), may engageprocesses involved in higher-level expectations. Furthermore, musicaltraining may strengthen these expectations and the brain networks thatsupport them. Finally, although rhythm appears to be the primary featureinfluencing groove, other factors, including harmony and familiarity alsoenhance pleasure (Matthews et al., 2019; Pereira et al., 2011; Senn et al.,2019; van den Bosch et al., 2013).

T.E. Matthews et al. NeuroImage 214 (2020) 116768
5. Conclusion
The current study sought to investigate the brain networks underlyingthe pleasurable desire to move to music, known as the sensation ofgroove. Medium complexity rhythms led to greater activity in brain re-gions associated with both motor timing and reward. Subjective ratingsof pleasure and wanting to move were associated with activity in BGregions of interest supporting their crucial role, not only in processingrhythmic complexity, but also in the subjective experience of groove.These results provide novel evidence supporting the formulation ofgroove as the intersection of motor timing and reward processes. Basedon this formulation, we propose a model in which different cortico-striatal networks support the generation and affective valuation ofbeat-based expectations. Future studies will test the interactions betweenthese networks, leading to a better understanding of how prediction andreward-based mechanisms work together.
Author contributions
Tomas E. Matthews: Conceptualization, Methodology, Software,Formal analysis, Investigation, Data Curation, Writing – Original Draft,Visualization, Project administration Maria A. G. Witek: Conceptualiza-tion, Methodology, Software, Formal analysis, Investigation, Data Cura-tion, Writing - Review & editing, Project administration Torben Lund:Methodology, Software, Formal analysis, Resources, Data Curation PeterVuust: Conceptualization, Methodology, Writing - Review & editing,Supervision Virginia B. Penhune: Conceptualization, Methodology,Writing - Review & editing, Supervision.
Declaration of competing interest
None.
Acknowledgements
This work was supported by Erasmus Mundus Student ExchangeNetwork in Auditory Cognitive Neuroscience, the Fonds de Recherche duQuebec – Nature et Technologies [198489], the Natural Sciences andEngineering Research Council of Canada [2015-04225], and the DanishResearch Foundation [DNRF 117]. The authors would like to thankJessica Thompson for technical support, David Ricardo Quiroga-Martinezfor help with data collection, and Robert Zatorre, along with two anon-ymous reviewers, for helpful comments on this manuscript.
Appendix A. Supplementary data
Supplementary data to this article can be found online at https://doi.org/10.1016/j.neuroimage.2020.116768.
References
Alexander, G., DeLong, M.R., Strick, P.L., 1986. Parallel organization of functionallysegregated circuits linking basal ganglia and cortex. Annu. Rev. Neurosci. 9,357–381. https://doi.org/10.1146/annurev.neuro.9.1.357.
Alluri, V., Brattico, E., Toiviainen, P., Burunat, I., Bogert, B., Numminen, J., Kliuchko, M.,2015. Musical expertise modulates functional connectivity of limbic regions duringcontinuous music listening. Psychomusicology 25, 443–454.
Alluri, V., Toiviainen, P., Burunat, I., Kliuchko, M., Vuust, P., Brattico, E., 2017.Connectivity patterns during music listening: evidence for action-based processing inmusicians. Hum. Brain Mapp. 38, 2955–2970. https://doi.org/10.1002/hbm.23565.
Araneda, R., Renier, L., Ebner-Karestinos, D., Dricot, L., De Volder, A.G., 2016. Hearing,feeling or seeing a beat recruits a supramodal network in the auditory dorsal stream.Eur. J. Neurosci. 45, 1439–1450. https://doi.org/10.1017/CBO9781107415324.004.
Arnal, L.H., 2012. Predicting “when” using the motor system’s beta-band oscillations.Front. Hum. Neurosci. 6, 1–3. https://doi.org/10.3389/fnhum.2012.00225.
Bates, D., Kliegl, R., Vasishth, S., Baayen, H., 2015. Parsimonious Mixed Models. arXivpreprint 1–21.
Bates, D., M€achler, M., Bolker, B., Walker, S., 2014. Fitting Linear Mixed-Effects ModelsUsing Lme4. https://doi.org/10.18637/jss.v067.i01 eprint arXiv:1406.5823 51.
10
Bengtsson, S.L., Ullen, F., Henrik Ehrsson, H., Hashimoto, T., Kito, T., Naito, E.,Forssberg, H., Sadato, N., 2009. Listening to rhythms activates motor and premotorcortices. Cortex 45, 62–71. https://doi.org/10.1016/j.cortex.2008.07.002.
Blood, A.J., Zatorre, R.J., 2001. Intensely pleasurable responses to music correlate withactivity in brain regions implicated in reward and emotion. Proc. Natl. Acad. Sci.U.S.A. 98, 11818–11823. https://doi.org/10.1073/pnas.191355898.
Blood, A.J., Zatorre, R.J., Bermudez, P., Evans, A.C., 1999. Emotional responses topleasant and unpleasant music correlate with activity in paralimbic brain regions.Nat. Neurosci. 2, 382–387.
Bolger, D., Coull, J.T., Schon, D., 2014. Metrical rhythm implicitly orients attention intime as indexed by improved target detection and left inferior parietal activation.J. Cognit. Neurosci. 26, 593–605. https://doi.org/10.1162/jocn.
Brett, M., Anton, J.-L., Valabregue, R., Poline, J.-B., 2002. Region of interest analysisusing an SPM toolbox. In: 8th International Conferance on Functional Mapping of theHuman Brain. https://doi.org/10.1007/978-3-540-75387-2_17.
Burunat, I., Tsatsishvili, V., Brattico, E., Toiviainen, P., 2017. Coupling of action-perception brain networks during musical pulse processing: evidence from region-of-interest-based independent component analysis. Front. Hum. Neurosci. 11 https://doi.org/10.3389/fnhum.2017.00230.
Chapin, H., Jantzen, K., Kelso, J.A.S., Steinberg, F., Large, E., 2010a. Dynamic emotionaland neural responses to music depend on performance expression and listenerexperience. PloS One 5, 1–14. https://doi.org/10.1371/journal.pone.0013812.
Chapin, H.L., Zanto, T., Jantzen, K.J., Kelso, S.J. a, Steinberg, F., Large, E.W., 2010b.Neural responses to complex auditory rhythms: the role of attending. Front. Psychol.1, 224. https://doi.org/10.3389/fpsyg.2010.00224.
Chen, G., Adelman, N.E., Saad, Z.S., Leibenluft, E, Cox, R.W., 2014. Applications ofmultivariate modeling to neuroimaging group analysis: A comprehensive alternativeto univariate general linear model. NeuroImage 99, 571–588. https://doi.org/10.1038/jid.2014.371.
Chen, J.L., Penhune, V.B., Zatorre, R.J., 2008. Listening to musical rhythms recruits motorregions of the brain. Cerebr. Cortex 18, 2844–2854. https://doi.org/10.1093/cercor/bhn042.
Cheung, V.K.M., Harrison, P.M.C., Meyer, L., Pearce, M.T., Haynes, J.-D., Koelsch, S.,2019. Uncertainty and surprise jointly predict musical pleasure and Amygdala,Hippocampus, and auditory cortex activity. Curr. Biol. 1–9 https://doi.org/10.1016/j.cub.2019.09.067.
Coull, J., Nobre, A., 2008. Dissociating explicit timing from temporal expectation withfMRI. Curr. Opin. Neurobiol. 18, 137–144. https://doi.org/10.1016/j.conb.2008.07.011.
Coull, J.T., Cheng, R.-K., Meck, W.H., 2011. Neuroanatomical and neurochemicalsubstrates of timing. Neuropsychopharmacology 36, 3–25. https://doi.org/10.1038/npp.2010.113.
Danielsen, A., 2006. Presence and pleasure. In: The Funk Grooves of James Brown andParliament. Wesleyan University Press, Middletown, CT.
Danielsen, A., Otnæss, M.K., Jensen, J., Williams, S.C.R., Østberg, B.C., 2014.Investigating repetition and change in musical rhythm by functional MRI.Neuroscience 275, 469–476. https://doi.org/10.1016/j.neuroscience.2014.06.029.
Davranche, K., Nazarian, B., Vidal, F., Coull, J., 2011. Orienting attention in timeactivates left intraparietal sulcus for both perceptual and motor task goals. J. Cognit.Neurosci. 23, 3318–3330.
Dawe, L.A., Platf, J.R., Racine, R.J., 1993. Harmonic accents in inference of metricalstructure and perception of rhythm patterns. Percept. Psychophys. 54, 794–807.https://doi.org/10.3758/BF03211804.
Fitch, W.T., Rosenfeld, A.J., 2007. Perception and production of syncopated rhythms.Music Percept. 25, 43–58.
Freeman, B., Pease, T., 1989. Arranging 2 Workbook. Berklee College of Music, Boston,MA.
Gebauer, L., Kringelbach, M.L., Vuust, P., 2012. Ever-changing cycles of musical pleasure:the role of dopamine and anticipation. Psychomusicology Mus. Mind Brain 22,152–167. https://doi.org/10.1037/a0031126.
Geiser, E., Sandmann, P., Jancke, L., Meyer, M., 2010. Refinement of metre perception –
training increases hierarchical metre processing. Eur. J. Neurosci. 32, 1979–1985.https://doi.org/10.1111/j.1460-9568.2010.07462.x.
Gold, B.P., Mas-herrero, E., Zeighami, Y., Benovoy, M., Dagher, A., 2019. Musical rewardprediction errors engage the nucleus accumbens and motivate learning. Proc. Natl.Acad. Sci. Unit. States Am. 1–6. https://doi.org/10.1073/pnas.1809855116.
Grahn, J.A., Schuit, D., 2012. Individual differences in rhythmic ability: behavioral andneuroimaging investigations. Psychomusicology Mus. Mind Brain 22, 105–121.https://doi.org/10.1037/a0031188.
Grahn, J.A., Brett, M., 2009. Impairment of beat-based rhythm discrimination inParkinson’s disease. Cortex 45, 54–61. https://doi.org/10.1016/j.cortex.2008.01.005.
Grahn, J.A., Brett, M., 2007. Rhythm and beat perception in motor areas of the brain.J. Cognit. Neurosci. 19, 893–906. https://doi.org/10.1162/jocn.2007.19.5.893.
Grahn, J.A., Rowe, J.B., 2013. Finding and feeling the musical beat: striatal dissociationsbetween detection and prediction of regularity. Cerebr. Cortex 23, 913–921. https://doi.org/10.1093/cercor/bhs083.
Grahn, J.A., Henry, M.J., McAuley, J.D., 2011. FMRI investigation of cross-modalinteractions in beat perception: audition primes vision, but not vice versa.Neuroimage 54, 1231–1243. https://doi.org/10.1016/j.neuroimage.2010.09.033.
Grahn, J.A., McAuley, J.D., 2009. Neural bases of individual differences in beatperception. Neuroimage 47, 1894–1903. https://doi.org/10.1016/j.neuroimage.2009.04.039.
Grahn, J.A., Rowe, J.B., 2009. Feeling the beat: premotor and striatal interactions inmusicians and nonmusicians during beat perception. J. Neurosci. 29, 7540–7548.https://doi.org/10.1523/JNEUROSCI.2018-08.2009.

T.E. Matthews et al. NeuroImage 214 (2020) 116768
Greenwald, J., 2002. Hip-Hop drumming: the rhyme may define, but the groove makesyou move. Black Music Res. J. 22, 259–271.
Haber, S., 2016. Corticostriatal circuitry. Dialogues in Clinical Neuroscience 18 (1), 7–21.Haber, S.N., 2003. The primate basal ganglia: parallel and integrative networks. J. Chem.
Neuroanat. 26, 317–330. https://doi.org/10.1016/j.jchemneu.2003.10.003.Habibi, A., Wirantana, V., Starr, A., 2014. Cortical activity during perception of musical
rhythm; comparing musicians and non-musicians. Psychomusicology 24, 125–135.https://doi.org/10.1037/pmu0000046.Cortical.
Hammers, A., Allom, R., Koepp, M.J., Free, S.L., Myers, R., Lemieux, L., Mitchell, T.N.,Brooks, D.J., Duncan, J.S., 2003. Three-dimensional maximum probability atlas ofthe human brain, with particular reference to the temporal lobe. Hum. Brain Mapp.19, 224–247. https://doi.org/10.1002/hbm.10123.
Hannon, E.E., Snyder, J.S., Eerola, T., Krumhansl, C.L., 2004. The role of melodic andtemporal cues in perceiving musical meter. J. Exp. Psychol. Hum. Percept. Perform.30, 956–974. https://doi.org/10.1037/0096-1523.30.5.956.
Hickok, G., Poeppel, D., 2004. Dorsal and ventral streams : a framework forunderstanding aspects of the functional anatomy of language. Cognition 92, 67–99.https://doi.org/10.1016/j.cognition.2003.10.011.
Huron, D., 2006. Sweet Anticipation: Music and the Psychology of Expectation. MITPress, Cambridge, MA. https://doi.org/10.1525/mp.2007.24.5.511.
Janata, P., Tomic, S.T., Haberman, J.M., 2012. Sensorimotor coupling in music and thepsychology of the groove. J. Exp. Psychol. Gen. 141, 54–75. https://doi.org/10.1037/a0024208.
Jarbo, K., Verstynen, T.D., 2015. Converging structural and functional connectivity oforbitofrontal, dorsolateral prefrontal, and posterior parietal cortex in the humanstriatum. J. Neurosci. 35, 3865–3878. https://doi.org/10.1523/JNEUROSCI.2636-14.2015.
Juslin, P.N., V€astfj€all, D., 2008. Emotional responses to music: the need to considerunderlying mechanisms. Behav. Brain Sci. 31, 559–621. https://doi.org/10.1017/S0140525X08005293.
Koelsch, S., 2014. Brain correlates of music-evoked emotions. Nat. Rev. Neurosci. 15,170–180. https://doi.org/10.1038/nrn3666.
Koelsch, S., Vuust, P., Friston, K., 2019. Predictive processes and the peculiar case ofmusic. Trends Cognit. Sci. 23, 63–77. https://doi.org/10.1016/j.tics.2018.10.006.
Konoike, N., Kotozaki, Y., Jeong, H., Miyazaki, A., Sakaki, K., Shinada, T., Sugiura, M.,Kawashima, R., Nakamura, K., 2015. Temporal and motor representation of rhythmin fronto-parietal cortical areas: an fMRI study. PloS One 10, 1–19. https://doi.org/10.1371/journal.pone.0130120.
Konoike, N., Kotozaki, Y., Miyachi, S., Miyauchi, C.M., Yomogida, Y., Akimoto, Y.,Kuraoka, K., Sugiura, M., Kawashima, R., Nakamura, K., 2012. Rhythm informationrepresented in the fronto-parieto-cerebellar motor system. Neuroimage 63, 328–338.https://doi.org/10.1016/j.neuroimage.2012.07.002.
Kotz, S.A., Brown, R.M., Schwartze, M., 2016. Cortico-striatal circuits and the timing ofaction and perception. Curr. Opin. Behav. Sci. 8–11. https://doi.org/10.1016/j.cobeha.2016.01.010.
Kringelbach, M.L., 2005. The human orbitofrontal cortex: linking reward to hedonicexperience. Nat. Rev. Neurosci. 6, 691–702. https://doi.org/10.1038/nrn1748.
Kung, S.-J., Chen, J.L., Zatorre, R.J., Penhune, V.B., 2013. Interacting cortical and basalganglia networks underlying finding and tapping to the musical beat. J. Cognit.Neurosci. 25, 401–420. https://doi.org/10.1162/jocn_a_00325.
Lappe, C., Lappe, M., Pantev, C., 2016. Differential processing of melodic, rhythmic andsimple tone deviations in musicians -an MEG study. Neuroimage 124, 898–905.https://doi.org/10.1016/j.neuroimage.2015.09.059.
Lappe, C., Steinstr€ater, O., Pantev, C., 2013. Rhythmic and melodic deviations in musicalsequences recruit different cortical areas for mismatch detection. Front. Hum.Neurosci. 7, 260. https://doi.org/10.3389/fnhum.2013.00260.
Lartillot, O., Toiviainen, P., Eerola, T., 2007. A matlab toolbox for music informationretrieval. Data Anal. Mach. Learn. Appl. 261–268. https://doi.org/10.1007/978-3-540-78246-9_31.
Lenth, R., Singmann, H., Love, J., Buerkner, P., Herve, M., 2018. Package “Emmeans.https://doi.org/10.1080/00031305.1980.10483031>.License.
Levine, M., 2011. The Jazz Theory Book. O’Reilly Media, Inc.Li, Q., Liu, G., Wei, D., Liu, Y., Yuan, G., Wang, G., 2019. Distinct neuronal entrainment to
beat and meter: revealed by simultaneous EEG-fMRI. Neuroimage 194, 128–135.https://doi.org/10.1016/j.neuroimage.2019.03.039.
London, J., 2012. Hearing in Time. Oxford University Press, New York.Martinez-Molina, N., Mas-Herrero, E., Rodríguez-fornells, A., Zatorre, R.J., Marco-
pallar�es, J., 2019. White matter microstructure reflects individual differences inmusic reward sensitivity. J. Neurosci. 39, 5018–5027.
Martínez-Molina, N., Mas-Herrero, E., Rodríguez-Fornells, A., Zatorre, R.J., Marco-Pallar�es, J., 2016. Neural correlates of specific musical anhedonia. Proc. Natl. Acad.Sci. https://doi.org/10.1073/PNAS.1611211113. E7337–E7345.
Mas-herrero, E., Dagher, A., Zatorre, R.J., 2018. Modulating musical reward sensitivity upand down with transcranial magnetic stimulation. Nat. Hum. Behav. 2, 27–32.https://doi.org/10.1038/s41562-017-0241-z.
Matell, M.S., Meck, W.H., 2004. Cortico-striatal circuits and interval timing: coincidencedetection of oscillatory processes. Brain Res. Cogn. Brain Res. 21, 139–170. https://doi.org/10.1016/j.cogbrainres.2004.06.012.
Matthews, T.E., Witek, M.A.G., Heggli, O.A., Penhune, V.B., Vuust, P., 2019. Thesensation of groove is affected by the interaction of rhythmic and harmoniccomplexity. PloS One 14. https://doi.org/10.1371/journal.pone.0204539.
McAuley, J.D., Henry, M.J., Tkach, J., 2012. Tempo mediates the involvement of motorareas in beat perception. Ann. N. Y. Acad. Sci. 1252, 77–84. https://doi.org/10.1111/j.1749-6632.2011.06433.x.
McLaren, D.G., Schultz, A.P., Locascio, J.J., Sperling, R.A., 2011. Repeated-measuresdesigns overestimate between-subject effects in fMRI packages using one error term.
11
17th Annual Meeting of Organization for Human Brain Mapping. Quebec City,Canada.
Merchant, H., Grahn, J., Trainor, L., Rohrmeier, M., Fitch, W.T., Merchant, H., 2015.Finding the beat : a neural perspective across humans and non-human primates.Philos. Trans. R. Soc.
Merchant, H., Harrington, D.L., Meck, W.H., 2013. Neural basis of the perception andestimation of time. Annu. Rev. Neurosci. 36, 313–336. https://doi.org/10.1146/annurev-neuro-062012-170349.
Meyer, L.B., 1956. Emotion and Meaning in Music. University of Chicago Press, Chicago.Morillon, B., Baillet, S., 2017. Motor origin of temporal predictions in auditory attention.
Proc. Natl. Acad. Sci. 114, E8913–E8921. https://doi.org/10.1073/pnas.1705373114.
Nettles, B., Ulanowsky, A., 1987. Harmony 1-4. Berklee College of Music, Boston, MA.Nobre, A.C., van Ede, F., 2017. Anticipated moments: temporal structure in attention. Nat.
Rev. Neurosci. 19, 34–48. https://doi.org/10.1038/nrn.2017.141.Nozaradan, S., Schwartze, M., Obermeier, C., Kotz, S.A., 2017. Specific contributions of
basal ganglia and cerebellum to the neural tracking of rhythm. Cortex 95, 156–168.https://doi.org/10.1016/j.cortex.2017.08.015.
O’Doherty, J.P., 2004. Reward representations and reward-related learning in the humanbrain: insights from neuroimaging. Curr. Opin. Neurobiol. 14, 769–776. https://doi.org/10.1016/j.conb.2004.10.016.
Patel, A.D., Iversen, J.R., 2014. The evolutionary neuroscience of musical beat perception:the Action Simulation for Auditory Prediction (ASAP) hypothesis. Front. Syst.Neurosci. 8, 1–14. https://doi.org/10.3389/fnsys.2014.00057.
Pearce, M.T., Wiggins, G.A., 2012. Auditory expectation: the information dynamics ofmusic perception and cognition. Top. Cogn. Sci. 4, 625–652. https://doi.org/10.1111/j.1756-8765.2012.01214.x.
Pereira, C.S., Teixeira, J., Figueiredo, P., Xavier, J., Castro, S.L., Brattico, E., 2011. Musicand emotions in the brain: familiarity matters. PloS One 6, e27241. https://doi.org/10.1371/journal.pone.0027241.
Povel, D., Essens, P., 1985. Perception of temporal patterns. JSTOR 2, 411–440.Ptak, R., Schnider, A., Fellrath, J., 2017. The dorsal frontoparietal network: a core system
for emulated action. Trends Cognit. Sci. 21, 589–599. https://doi.org/10.1016/j.tics.2017.05.002.
Rauschecker, J.P., 2011. An expanded role for the dorsal auditory pathway insensorimotor control and integration. Hear. Res. 271, 16–25. https://doi.org/10.1016/j.heares.2010.09.001.
Rimmele, J.M., Morillon, B., Poeppel, D., Arnal, L.H., 2018. Proactive sensing of periodicand aperiodic auditory patterns. Trends Cognit. Sci. 22, 870–882. https://doi.org/10.1016/j.tics.2018.08.003.
Ross, J.M., Iversen, J.R., Balasubramaniam, R., 2018a. Dorsal Premotor Contributions toAuditory Rhythm Perception: Causal Transcranial Magnetic Stimulation Studies ofInterval, Tempo, and Phase bioRxiv 1–16.
Ross, J.M., Iversen, J.R., Balasubramaniam, R., 2018b. The role of posterior parietalcortex in beat-based timing perception: a continuous theta burst stimulation study.J. Cognit. Neurosci. 1–10 https://doi.org/10.1162/jocn.
Ross, J.M., Iversen, J.R., Balasubramaniam, R., 2016. Motor simulation theories ofmusical beat. Neurocase.
Salimpoor, V.N., Benovoy, M., Larcher, K., Dagher, A., Zatorre, R.J., 2011. Anatomicallydistinct dopamine release during anticipation and experience of peak emotion tomusic. Nat. Neurosci. 14, 257–262. https://doi.org/10.1038/nn.2726.
Salimpoor, V.N., van den Bosch, I., Kovacevic, N., McIntosh, A.R., Dagher, A.,Zatorre, R.J., 2013. Interactions between the nucleus accumbens and auditorycortices predict music reward value. Science 340, 216–219. https://doi.org/10.1126/science.1231059.
Salimpoor, V.N., Zald, D.H., Zatorre, R.J., Dagher, A., McIntosh, A.R., 2015. Predictionsand the brain: how musical sounds become rewarding. Trends Cognit. Sci. 19, 86–91.https://doi.org/10.1016/j.tics.2014.12.001.
Schubotz, R.I., 2007. Prediction of external events with our motor system: towards a newframework. Trends Cognit. Sci. 11, 211–218. https://doi.org/10.1016/j.tics.2007.02.006.
Schubotz, R.I., Friederici, A., von Cramon, D.Y., 2000. Time perception and motor timing:a common cortical and subcortical basis revealed by fMRI. Neuroimage 11, 1–12.https://doi.org/10.1006/nimg.1999.0514.
Schubotz, R.I., von Cramon, D.Y., 2001. Interval and ordinal properties of sequences areassociated with distinct premotor areas. Cerebr. Cortex 11, 210–222.
Seger, C. a, Spiering, B.J., Sares, A.G., Quraini, S.I., Alpeter, C., David, J., Thaut, M.H.,2013. Corticostriatal contributions to musical expectancy perception. J. Cognit.Neurosci. 25, 1062–1077. https://doi.org/10.1162/jocn_a_00371.
Senn, O., Bechtold, T.A., Hoesl, F., Kilchenmann, L., 2019. Taste and familiarity affect theexperience of groove in popular music. Music. Sci. https://doi.org/10.1177/1029864919839172.
Senn, O., Kilchenmann, L., Bechtold, T., Hoesl, F., 2018. Groove in drum patterns as afunction of both rhythmic properties and listeners’ attitudes. PloS One 13, 1–33.
Sescousse, G., Caldú, X., Segura, B., Dreher, J., 2013. Processing of primary and secondaryrewards: a quantitative meta-analysis and review of human functional neuroimagingstudies. Neurosci. Biobehav. Rev. 37, 681–696.
Shany, O., Singer, N., Gold, B.P., Jacoby, N., Tarrasch, R., Hendler, T., Granot, R., 2019.Surprise-related activation in the nucleus accumbens interacts with music-inducedpleasantness. Soc. Cognit. Affect Neurosci. 1–12 https://doi.org/10.1093/scan/nsz019.
Sioros, G., Mirron, M., Davies, M., Gouyon, F., Madison, G., 2014. Syncopation creates thesensation of groove in synthesized music examples. Front. Psychol. 5, 1–10. https://doi.org/10.3389/fpsyg.2014.01036.
Stalnaker, T.A., Cooch, N.K., Schoenbaum, G., 2015. What the orbitofrontal cortex doesnot do. Nat. Neurosci. 18, 620–627. https://doi.org/10.1038/nn.3982.

T.E. Matthews et al. NeuroImage 214 (2020) 116768
Stupacher, J., Hove, M.J., Novembre, G., Schütz-Bosbach, S., Keller, P.E., 2013. Musicalgroove modulates motor cortex excitability: a TMS investigation. Brain Cognit. 82,127–136.
Teki, S., Grube, M., Kumar, S., Griffiths, T.D., 2011. Distinct neural substrates of duration-based and beat-based auditory timing. J. Neurosci. 31, 3805–3812. https://doi.org/10.1523/JNEUROSCI.5561-10.2011.
Thaut, M., Trimarchi, P., Parsons, L., 2014. Human brain basis of musical rhythmperception: common and distinct neural substrates for meter, tempo, and pattern.Brain Sci. 4, 428–452. https://doi.org/10.3390/brainsci4020428.
Trost, W., Frühholz, S., Sch€on, D., Labb�e, C., Pichon, S., Grandjean, D., Vuilleumier, P.,2014. Getting the beat: entrainment of brain activity by musical rhythm andpleasantness. Neuroimage 103, 55–64. https://doi.org/10.1016/j.neuroimage.2014.09.009.
van den Bosch, I., Salimpoor, V.N., Zatorre, R.J., 2013. Familiarity mediates therelationship between emotional arousal and pleasure during music listening. Front.Hum. Neurosci. 7, 534. https://doi.org/10.3389/fnhum.2013.00534.
Vuust, P., Ostergaard, L., Pallesen, K.J., Bailey, C., Roepstorff, A., 2009. Predictive codingof music -Brain responses to rhythmic incongruity. Cortex 45, 80–92. https://doi.org/10.1016/j.cortex.2008.05.014.
12
Vuust, P., Witek, M., Dietz, M., Kringelbach, M.L., 2018. Now You Hear It: a novelpredictive coding model for understanding rhythmic incongruity. Ann. N. Y. Acad.Sci. 1–11 https://doi.org/10.1111/nyas.13622.
Vuust, P., Witek, M.A.G., 2014. Rhythmic complexity and predictive coding: a novelapproach to modeling rhythm and meter perception in music. Front. Psychol. 5, 1–14.https://doi.org/10.3389/fpsyg.2014.01111.
Witek, M.A.G., Clarke, E.F., Wallentin, M., Kringelbach, M.L., Vuust, P., 2014.Syncopation, body-movement and pleasure in groove music. PloS One 9, 1–12.https://doi.org/10.1371/journal.pone.0094446.
Zatorre, R.J., Belin, P., Penhune, V.B., 2002. Structure and function of auditory cortex:music and speech. Trends Cognit. Sci. 6, 37–46.
Zatorre, R.J., Chen, J.L., Penhune, V.B., 2007. When the brain plays music: auditory-motor interactions in music perception and production. Nat. Rev. Neurosci. 8,547–558. https://doi.org/10.1038/nrn2152.
Zatorre, R.J., Salimpoor, V.N., 2013. From perception to pleasure: music and its neuralsubstrates. Proc. Natl. Acad. Sci. U.S.A. 110, 10430–10437. https://doi.org/10.1073/pnas.1301228110.