Manuscript SCILLs as selective catalysts for the oxidation ...
Upload
nguyennhanCategory
view
219download
1
The Selective Oxidation of Bio-derived Platform
Chemicals over Supported Gold Catalysts
Thesis submitted in accordance with the requirements of Cardiff
University for the degree of Doctor of Philosophy
January 2016
Mark Douthwaite

(i)
Acknowledgements
I have learnt a great deal during the course of my PhD and developed as a person both
professionally and personally. I have thoroughly enjoyed my time at the Cardiff Catalysis
Institute and have many fond memories of my time here. Work colleagues have developed
into great friends over the past three years and will undoubtedly continue to be in the years
to come. That said, there have also been tough times and I have a lot of people to thank for
their help and moral support in getting me though these.
First and foremost, I would like to thank the EPRSC and my PhD supervisor Professor
Graham Hutchings for the opportunity to study at such a prestigious institution. Regular
meetings with him helped keep me on track and provided me the moral support and
motivation to succeed and flourish at Cardiff University. In addition, his generosity
allowed me to attend and present my work at a number of high profile conferences across
Europe. I would also like to thank Professor Kenneth Harris and Professor Stanislaw
Golunski for their help and support in fulfilling their roles as internal supervisor and
internal examiner respectively.
I would like to thank my post-doctoral supervisors; namely Dr Peter Miedziak, Dr Gemma
Brett, Dr Jennifer Edwards and Dr Sarwat Iqbal. Their excellent knowledge of the subject
area helped with the planning and implementation of my research. In addition, they always
made time to help and support me during the tough times. I must also express my thanks
to Professor David Knight and Professor Donald Bethell who gave up a lot of their own
time to help advise me with the organic chemistry problems I faced. A great thanks to
Professor Stuart Taylor and Dr Thomas Davies who supervised my BSc project and first
opened my eyes the exciting field of heterogeneous catalysis.
Finally, I would like to thank my family, friends (you know who you are) and of course
my girlfriend Julia, for all their emotional support and ability to deal with me during the
stressful times.

(ii)
Abstract
A fundamental limitation effecting the exploitation of bio-fuels is that they are not
currently economically competitive with conventional fossil fuels. The development of
novel chemical processes to convert bi-products from these reactions into high value
chemicals could be one method to reduce the economic deficit between these two
industries. Glycerol and furfural are produced as bi-products in the production of 1st and
2nd generation bio-fuels. This thesis explores the potential of using supported Au catalysts
for the oxidation of these bio-derived compounds for the synthesis of high value chemicals.
The reaction conditions were found to significantly affect the product distribution and the
reaction rate for the aerobic, liquid phase oxidation of glycerol over a AuPt/TiO2 catalyst.
Mechanistic studies suggested that glyceric acid and tartronic acid are primary products in
this reaction. This study also implied that C-C scission leading to the unfavourable
formation of C1 and C2 products occurred from glyceraldehyde, dihydroxyacetone and
glyceric acid. Au nanoparticles supported on hydrophobic supports were found reduce
C-C scission, and the incorporation of Pd and Pt to a Au/BN catalyst was found to further
increase desirable C3 selectivity. Additional work confirmed that the in-situ formation of
H2O2 was primarily responsible for C-C cleavages, which led to the postulation that Dakin
oxidation was the mechanistic process by which it proceeds. Supported trimetallic AuPdPt
nanoparticles were found to be active for the oxidation of glycerol under base free
conditions. The catalyst was found to significantly influence the activity of these particles.
It was determined that a Au/TiO2 catalyst could selectively oxidise furfural to produce
reasonable yields of furoic Acid. Polymerisation of the substrate was found to inhibit
catalytic performance which was suggested to be a result of the polymers binding
irreversibly to the catalyst. Optimisation of the catalyst and experimental procedure was
found to reduce this unfavourable polymerisation, which led to the production of furoic
acid yields in excess of 89 % using a AuPd/Mg(OH)2 catalyst. Further tests indicated that
the size of the metal nanoparticles and the Au:Pd ratio significantly affected catalytic
performance for this reaction. Mechanistic studies identified the presence of three
reactions; the direct oxidation of furfural, the oxidative dehydrogenation of furfuryl alcohol
and the Cannizzaro reaction. A kinetic study allowed for the determination of the activation
energies corresponding to each of these pathways, which ultimately highlighted the
potential of using a catalyst for this reaction on an industrial scale.

(iii)
Glossary
βHA β-hydroxy pyruvic acid
CMB / C.M.B. Carbon mass balance
DAD Diode array detector
DFT Density functional theory
DHA Dihydroxy acetone
Ea Activation Energy
EDX Energy-dispersive X-ray spectroscopy
FA Furoic acid
FDCA 2, 5-Furandicarboxyllic acid
FF Furfural
FOH Furfural alcohol
FOA Formic acid
FWHM Full width half maximum
GA Glyceric acid
GLA Glycolic acid
GLAD Glyceraldehyde
HAADF High-angle annular dark-field imaging
HMF 5-Hydroxymethyl-2-furfural
HPA Heteropolyacid
HPLC High performance liquid chromatography
HT Hydrotalcite
IMP-CON Conventional impregnation
IMP-MOD Modified impregnation
KE Kinetic energy
LA Lactic acid
MA Mesoxalic acid
MEA Maleic acid

(iv)
MP-AES Microwave plasma atomic emission spectroscopy
OA Oxalic acid
PET Polyethylene terephthalate
PSD Particle size distribution
PVA Polyvinyl alcohol
RDS Rate determining step
RID Refractive index detector
SA Succinic acid
SOL-CON Conventional sol-immobilisation
TA Tartronic acid
TEM Transmission electron microscopy
TPA Terephthalic acid
TOF Turnover frequency
TS-1 Titanosilicate zeolite
XPS X-ray photoelectron spectroscopy
XRD X-ray diffraction

(v)
1.0 Introduction 1
1.1 A Background in Catalysis 1
1.2 The Kinetics and Thermodynamics of Catalytic Systems 3
1.3 A Brief History in Catalysis 6
1.4 Reaction over Heterogeneous Gold Catalysts 7
1.4.1 The Direct Synthesis of Hydrogen Peroxide 8
1.4.2 The Selective Epoxidation of Olefins 10
1.4.3 The Selective Oxidation of Alcohols and Aldehydes 12
1.4.3.1 Benzyl Alcohol Oxidation 12
1.4.3.2 The Selective Oxidation of 1,2-Propane Diol 14
1.4.3.3 The Selective Oxidation of 5-Hydroxymethyl-2-Furfural 16
1.5 The Selective Oxidation of Bio-derived Feedstocks 18
1.6 The Energy Crisis 18
1.6.1 Bio-renewables for the Production of Fuels and Fine Chemicals 19
1.6.2 The Selective Oxidation of Glycerol 21
1.6.3 The Selective Oxidation of Furfural 25
1.7 Organic Mechanisms 30
1.7.1 Dakin Oxidation 30
1.7.2 The Diels-Alder Reaction 31
1.7.3 The Cannizzaro Reaction 31
1.8 References 32
2.0 Experimental 44
2.1 Chemicals – Source and Purity 44
2.2 Definitions 45
2.3 Catalyst Preparation 46
Table of Contents

Table of Contents | 2016
(vi)
2.3.1 The Sol –Immobilisation Technique 46
2.3.2 Conventional Sol-immobilisation 47
2.3.3 Modified Sol-Immobilisation 47
2.3.4 Impregnation (IMP) 48
2.3.5 Modified Impregnation (Mod-IMP) 48
2.4 Catalyst Evaluation 49
2.4.1 Selective Oxidation of Glycerol 49
2.4.2 Glycerol Product Inhibition Studies 49
2.4.3 Radical Testing in the Oxidation of Glycerol 50
2.4.4 The Selective Oxidation of Furfural 50
2.4.5 The Selective Oxidation of Furfural Alcohol 51
2.4.6 Short Term Sampling Experiments 51
2.5 Catalyst Stability 51
2.5.1 Microwave Plasma Atomic Emission Spectroscopy (MP-AES) 52
2.5.2 Catalyst Re-usability Tests 53
2.6 Product Analysis 53
2.6.1 High Performance Liquid Chromatography (HPLC) 53
2.7 Catalyst Characterisation 56
2.7.1 X-ray photoelectron Microscopy (XPS) 56
2.7.2 Powder X-ray Diffraction (XRD) 58
2.7.3 Transmission Electron Microscopy (TEM) 60
2.7.4 Thermogravimetric Analysis (TGA) 62
2.8 References 63
3.0 The Selective Catalytic Oxidation of Glycerol 65
3.1 Introduction 65
3.2 Aims and Objectives of the Project 67
3.2.1 Objective 67
3.2.2 Aims 67
3.3 A Benchmark Catalyst for the Selective Oxidation of Glycerol 68
3.4 A Mechanistic Overview of the Reaction Profile 78
3.5 Base Free Oxidation of Glycerol 84
3.6 The Selective Oxidation of Glycerol to Tartronic Acid 96

Table of Contents | 2016
(vii)
3.7 Conclusions 111
3.8 References 114
4.0 The Selective Catalytic Oxidation of Furfural 118
4.1 Introduction 118
4.2 Aims and Objectives 119
4.2.1 Objectives 119
4.2.2 Aims 119
4.3 Oxidation of Furfural Over a 1 wt.% Au/TiO2 Catalyst 120
4.4 Optimisation of the Catalyst 124
4.5 A mechanistic Overview 132
4.5.1 The Oxidation of Furfural 132
4.5.2 The Cannizzaro Reaction 136
4.5.3 The Oxidation of Furfuryl Alcohol 140
4.5.4 Derivation of the Reaction Profile 144
4.6 Investigation into the Reusability of the AuPd/Mg(OH)2 Catalyst 146
4.7 The Effect of Preparation Technique 148
4.8 The Effect of the Au-Pd Ratio 151
4.9 Application of Kinetics to the Reaction System 155
4.9.1 Determination of the Reaction Orders 156
4.9.2 Determination of Reactions Rate Constants 162
4.9.3 Determination of the Activation Energies (Ea) 163
4.10 Conclusions 166
4.11 References 168
5.0 Conclusions and Future Work 172
5.1 The Selective Catalytic Oxidation of Glycerol 172
5.2 The Selective Catalytic Oxidation of Furfural 177
5.3 References 181
6.0. Appendix 183
6.1 Calibrations for the Selective Oxidation of Glycerol 183
6.2 Calibrations for the Selective Oxidation of Furfural 188

1
1.1. A Background in Catalysis
Over the last century, industrial science has flourished. Scientific developments have
enabled the scientific community to produce new and innovative materials that have shaped
the face of the modern world. Historically, the objectives of industrial science were to
satisfy the growing thirst of consumers and as a consequence, very little attention was given
to the impact of these practices on the environment. The emphasis of modern science is to
satisfy the needs of consumers through methods which are sustainable and economical.
Catalysis is a key field in the development and maintenance of such an infrastructure.
Without effective catalysts, the manufacture of many materials, pharmaceuticals and
foodstuffs would not be possible1.
The development of the principles of green chemistry has now placed emphasis on the
formation of chemical products and processes, that reduces or eliminates the generation
and application of hazardous chemicals2. A dramatic progression in catalysis science in
recent years is considered to have and remains to play a pivotal role in this ethical
transformation3. Today, catalysts act as a lynchpin in some of the biggest industries in
existence4-6 and it is believed that over 90 % of all industrial processes in the chemical
industry currently employ catalysts. Although the progress made is encouraging, it is clear
that with the increasing influence of climate change and ongoing damage to and extinction
of ecosystems, further development is required7.
By definition, a catalyst increases the rate of a reaction as it approaches equilibrium by
offering an alternative reaction pathway. This is not always the case however, as enzymes
are often used to stabilise transition states in bio-catalytic processes. It is important to note
that the catalyst is unchanged as a result of this process, which as a consequence, allows
for its continuous participation in a given reaction.
Chapter 1 Introduction

Chapter 1 | Introduction
2
Catalysts can be divided into two fundamental groups determined by the phase of the
catalyst and reagent. Catalysts are considered to be homogeneous in nature when the
catalyst and reagents are in the same phase. In contrary, catalysts are considered to be
heterogeneous in nature when the catalyst and reagent exist in different phases. Within
these two groups further methods of classification exist. For instance, photocatalysis is a
relatively new concept and relies on the activation of a catalyst through the application of
light. This type of catalysis is displaying excellent potential for the production of hydrogen
through water splitting8, as well as the decomposition of pollutants in waste streams9. In
addition, the design and synthesis of new enzymes for participation in chemical reactions
is fast becoming a suitable method for industrial application10.
Homogeneous catalysts can provide an excellent degree of atom efficiency and reaction
selectivity. Typically, these catalysts consist of ligand bound metal centres with a specific
co-ordination number. The metal oxidation state and the stereoelectronic properties of the
ligands are fundamental factors which must be considered during the synthesis of these
catalysts. It is the ability of a rationally designed catalytic complex to control these
parameters which gives the required site specificity to achieve exceptional product
selectivity. Catalysts of this nature have proven to be applicable for a range of industrial
applications such as hydroformylation11, hydrogenation12 and hydrosilylation13 along with
many more. In addition, the ubiquitous application of Pd complexes for C-C cross coupling
reactions was recognised when Heck, Negishi and Suzuki were awarded the 2010 Nobel
Prize for chemistry14. Despite the clear merits associated with this type of catalysis, it is
not yet considered economically viable for the majority of industrial processes. This is due
to numerous factors including product extraction together with financial and time cost
associated with the synthesis of these materials. That said, recent innovations in the
heterogenisation of homogeneous catalysts and the application of biphasic reaction systems
is paving the way for further industrial application15.
Heterogeneous catalysts are predominantly solid materials, used to catalyse reagents in the
gas or liquid phase. The difference in phases between the catalyst and reagents means that
the post reaction extraction of the product(s) is far easier, which is beneficial from an
industrial perspective. Typically, these catalysts consist of either a metal oxide or mixed
metal oxides16, 17. The performance of these catalysts can be enhanced by the deposition of
additional nanoparticles18, promoters19 or combinations of both20. Single site catalysis is
more difficult to control in this field, which can ultimately lead to poorer reaction

Chapter 1 | Introduction
3
selectivity than that observed with homogeneous catalysts. Despite this, the favoured
industrial viability of these catalysts has allowed for the incorporation of heterogeneous
catalysis in numerous major industrial processes including the direct synthesis of NH3 from
H2 and N221, the oxidation of SO2 to SO3
22, steam reforming23, oil cracking and reforming24
as well as many more. The complexity and ambiguity of the mechanistic processes
surrounding heterogeneous catalysis means that there is room for development in this field.
1.2. The Kinetics and Thermodynamics of Catalytic Systems
Figure 1.1 illustrates how a catalyst can offer an additional pathway from reactant to
product with a reduced activation energy.
It is important to note that the addition of a catalyst to any given reaction does not change
the free energy of the system, as it has no effect on the energy of the reactant(s) and
product(s). Equally, the laws of thermodynamics suggest that a catalyst can have no effect
on the position of the equilibrium. For this to be true, with any given system in equilibrium,
a catalyst must promote the forward and backward reactions equally. Thus, catalysts only
affect the kinetics of a system, not the thermodynamics. As highlighted in Figure 1.1, a
Figure 1.1. An energy level diagram of a reaction which compares the activation energies
of a catalysed (EaCAT) and un-catalysed (EaUNCAT) reaction pathway.

Chapter 1 | Introduction
4
catalyst can provide a reduced activation barrier for a reactant to proceed over. Although
this appears to be fairly straightforward in Figure 1.1, in reality it is far more complex. The
activation barrier represented by EaCAT would actually consist of numerous other activation
barriers, representative of the different intermediate states formed in the catalytic
mechanisms. For instance, in heterogeneous catalysis, these intermediate states could
represent physical obstacles such as the adsorption and desorption of species to and from
the catalysts surface. They could also be representative of chemical features such as bond
formation or destruction.
Derivation of the kinetics associated with a chemical reaction can help gain a further
understanding of a reaction’s surface mechanism. Determining the rate dependencies of
certain stages of the mechanism can assist in the optimisation of the reaction conditions,
reactor and catalyst design. In turn, the optimisation of these variables could allow for
significant enhancements in the process development. Consider a unimolecular
decomposition reaction - the reaction would occur in three fundamental stages and by
monitoring the rate of each stage, it would be possible to identify the rate determining step
(RDS). Let’s assume that a kinetic study is conducted and the RDS was found to be the
initial adsorption of the substrate – through the modification of the catalyst it would be
possible to increase the sticking probability of the substrate which in turn would increase
the rate of this specific step and perhaps increase the rate of the overall reaction.
In reality, most reactions are bimolecular in nature and the rate can be effected by many
different variables such as the adsorption of multiple reactants, possible bond
decomposition(s) / formation(s), surface diffusions of molecular species and of course
product desorption. Additional concerns such as catalyst poisoning adds a further degree
of complexity to the system making kinetic modelling extremely difficult. For instance, let
us consider the oxidation of CO to CO2 over a supported Au catalyst.
Initially, this transformation appears to be very straightforward, yet theories regarding the
catalytic mechanism have expanded decades25-27. It is incredibly difficult to model the
CO + ½ O2 CO2
Scheme 1.1. Stoichiometric equation for the oxidation of CO to CO2

Chapter 1 | Introduction
5
kinetics of a heterogeneously catalysed reaction as the complete control of every variable
is required.
For more complicated reaction systems involving multiple reaction pathways, kinetic
modelling becomes even more difficult. In this situation, it is worth applying kinetics to a
sequence of steps. For instance, rather than applying kinetics to the adsorption,
transformation and desorption, it is worth looking at the kinetics of the transformation from
substrate to product as a whole. This at the very least gives an efficient method of
comparing catalysts. Information regarding the stoichiometry of each reactant is also
derivable using this method. The rate constants, reaction orders and reaction rate can be
combined in one mathematical expression, as shown in equation 1.1.
The orders of reaction with respect to A, B and B can easily be determined by monitoring
the reaction rate with respect to the concentration of each reactant. These reaction orders
can also give valuable information regarding the quantity of each required for one
mechanistic transition. For example, in a reaction where two molecules of NaOH are
required in order to convert one molecule of substrate to the desired product, the order of
reaction with respect to the concentration of NaOH would be 2. The rate of the reaction
(K) can be determined simply using the initial rate method. A rearrangement of the equation
would subsequently allow for the derivation of the rate constant, k. If this process is
repeated at multiple temperatures it is possible to derive the activation energy (Ea) by using
the Arrhenius equation (equation 1.2).
K = k. cat. [𝐴]𝑎[𝐵]𝑏[𝐶]𝑐
Equation 1.1. Rate equation for the catalysed reaction between A, B and C. K – Rate of
reaction, k – rate constant, cat – catalyst (constant), indices a, b and c represent the orders
of reaction with respect to the concentrations of A, B and C

Chapter 1 | Introduction
6
1.3. A Brief History in Catalysis
Perhaps the first catalytic process to be used by man, albeit unknowingly, was the
fermentation of sugar to form alcohol. It wasn’t until the late seventeen hundreds that
scientists began to realise that it was possible for reactants to demonstrate non-
stoichiometric behaviour in reactions. Homogeneously catalysed reactions were first to be
considered, when questions were raised regarding the role of H2O in the oxidation of CO
to CO228 and the role of dilute acids in the hydrolysis of starch29. The first known
observation of heterogeneous catalysis was determined when Sir Humphrey Davy recorded
that combustible gases could react violently in the presence of O2 and heated platinum30.
This led a host of studies exploring the role of platinum metal in other chemical
transformations30-33. The sudden boom in new innovative methods for the synthesis of
chemicals caught the attention of Berzelius, who classified these non-stoichiometric
reactants as catalysts30, 34.
The industrial revolution led to an exponential increase in population size and industrial
processing. During this period, contributions from Faraday35 and Lemoine36 in addition to
many more led to a substantial increase in the understanding of catalysis and how it affected
chemical kinetics. Soon, catalysts were being utilized in numerous large-scale industrial
processes such as the preparation of nitric acid37, the contact process30 and the synthesis of
NH3 from H2 and N230. A growing global demand for petroleum in the early 20th century
led to extensive research in oil refining and methods for the development of new raw
materials. Perhaps the highlight of this era was the development of Fischer-Tropsch
catalysis, which made it possible to obtain hydrocarbons from coal gasification with
excellent efficiency30, 38. The technological advances accomplished during the remainder
of the 20th century allowed for the development of new tools for the study of catalysts.
k = Ae−EaRT
Equation 1.2. Arrhenius equation used to derive the activation energy (Ea) of a chemical
reaction. k – rate constant, A - pre-exponential factor, R – gas constant, K – temperature
in Kelvin

Chapter 1 | Introduction
7
Today, catalysts are employed in over 90 % of industrial chemical processes and the
diminishing stocks of fossil fuels has led to the investigation of alternative sources of fuels.
1.4. Reaction over Heterogeneous Gold Catalysts
Until fairly recently, gold was considered to be catalytically inert39. It wasn’t until 1973
that Bond40 demonstrated that the impregnation of aurochloric acid onto metal oxides
served as an active catalyst for the hydrogenation of alkenes. Well over a decade later,
Haruta41 and Hutchings42 observed that gold supported catalysts were extremely active for
the oxidation of CO and the hydrochlorination of ethyne to vinyl chloride. Subsequent work
by Haruta and co-workers revealed that Au supported on TiO2 was highly effective for the
selective epoxidation of propene43. Later, work by Prati and Rossi revealed the potential of
Au catalysts for the selective oxidation of alcohols and carbohydrates44. These works
provided a foundation for the study of heterogeneous gold catalysis in which scientific
interest has continued to grow. As such, there have been numerous reviews published
documenting development in this field39, 45-49.
The reasoning behind why gold nanoparticles are so active for certain catalytic
transformations is still not fully understood. The activity of supported Au nanoparticles has
been linked with a number of different phenomena50, including, quantum size effects51-53,
the Au oxidation state54-56, the low co-ordination of Au atoms in nanoparticles57, 58 in
addition to various support effects such as charge transfer59, 60 and oxygen spill-over61, 62.
It is likely that the highly active nature of these nanoparticles is attributed to a collection
of these features.
The activity of supported metal catalysts has long be associated with the size of supported
nanoparticles18. The Au particle size in supported gold catalysts is undoubtedly critical to
the overall performance of the catalyst63-65. The catalyst preparation method can
significantly influence the size and distribution of these particles which can consequentially
impact the catalytic performance. It is now commonly known that Au nanoparticles must
exhibit a diameter less than 5 nm in order to display a significant degree of activity64.
Perhaps the most commonly used preparation technique from an industrial perspective is
the impregnation method. Interestingly, this was the first method used for the preparation
of supported Au nanoparticles as shown by Bond et al.40. This method can produce

Chapter 1 | Introduction
8
nanoparticles within the desired activity region but with little control over the size
distribution. A recent modification of this method proposed by Meenakshisundaram et
al.66, allows for the preparation of sub 5nm Au particles with minimal deviations from the
mean. The relationship between particle size and activity was subsequently demonstrated
when the catalyst prepared by the modified impregnation method was used for the aerobic
oxidation of alcohols67.
Much of the work pioneered by Haruta involved the preparation of supported Au catalysts
by the deposition precipitation method68, 69. This method has shown to consistently give
supported Au catalysts with exceptional metal dispersion within the desired activity region.
More recent work which involved the production of Au/Fe2O3 using the co-precipitation
method was reported to produce a large population of exceptionally small nanoparticles55.
Large quantities of the work investigating the performance of Au catalysts for the oxidation
of alcohols employed the sol-immobilisation technique70. This technique involves the
utilisation of a stabilising ligand to control particle size and impede agglomeration.
Exceptionally small particles with well-defined distributions can be produced in this
manner, the size and shape of which can be controlled through the choice and quantity of
the stabilising ligand71, 72.
The alloying of Au with Cu73, Ag74, Pd75 and Pt76 to form bimetallic nanoparticles can
increase catalytic performance in a range of oxidation reactions. The synergistic interaction
observed between the metals is believed to be a result of numerous possible effects. These
effects include the additional metal being far more easily oxidised than Au resulting in a
greater concentration of adsorbed oxygen in the vicinity of the active site77, electronic
effects – a change in the band structure of the Au through electronic promotion or
demotion76 and geometric effects - the formation of core shell or alloyed structures which
may further enhance the electronic effects of the additional metal78.
1.4.1. The Direct Synthesis of Hydrogen Peroxide
H2O2 is a high value commodity chemical which has applications in industry and in
everyday household cleaning goods. The current industrial method for its production
utilizes the anthraquinone process which was developed by BASF in 1939. Although

Chapter 1 | Introduction
9
reasonably effective, there are concerns regarding the carbon efficiency of the process and
environmental hazards associated with its implementation.
There has been significant scientific interest in the direct synthesis of H2O2 over the last
decade which has been documented in a number of reviews79, 80. Direct synthesis from H2
and O2 would greatly enhance the efficiency of its production and significantly reduces the
carbon footprint of its production and distribution. There are a number of limitations
involved with the direct synthesis which are currently preventing its application on an
industrial scale. Mixtures of H2 and O2 are explosive in certain concentrations and as a
result, must be diluted in an inert carrier gas which can then impact potential productivity79,
81, 82. In addition, the activation of H2 (considered to be the RDS83) is a difficult feat to
achieve effectively. There are also sequential hydrogenation and decomposition pathways
which can cause further issues and reduce the selectivity of the reaction. These
unfavourable sequential transformations are displayed in scheme 1.2. In order for this
process to be consider industrially viable, further development is required.
Scheme 1.2. Reaction profile for the direct synthesis of H2O2 from O2 and H2. The
unfavourable sequential hydrogenation and decomposition of H2O2 are displayed.
Hutchings and co-workers84 were the first to show that supported Au nanoparticles on
Al2O3 were active for the direct synthesis of H2O2. In the same publication, it was
determined that alloying Pd with Au could enhance the activity of the catalyst further.
Subsequent work conducted by this group revealed that these alloys were also active on
additional metal oxide supports with a noticeable increase in activity reported when

Chapter 1 | Introduction
10
supported on sulphated carbon supports85. Ishihara et al.86 developed the idea that greater
catalytic productivity could be achieved using acidic supports (silica and zeolites). Further
work by Hutchings an co-work involved the testing of AuPd supported on Al2O387, Fe2O3
88
and TiO289 for the direct synthesis of H2O2. Through application of extensive microscopy,
it was determined that these systems all exhibited Au[CORE]Pd[SHELL] structures. The
productivity of these catalysts was comparable, with TiO2 appearing to exhibit the highest
performance.
The effect of the reaction medium can also affect the productivity of supported AuPd
catalysts. Choudhary and co-workers have published numerous papers investigating the
nature of the reaction medium90-93. Acidification of the reaction medium and incorporation
of halides into the system can significantly enhance the productivity of hydrogen peroxide
through the suppression of the unfavourable sequential hydrogenation and decomposition
pathways. The efficiency of the halide in suppressing these unfavourable reactions is
believed to be dependent on the oxidation of the active metal94.
A significant leap forward in this field was achieved when active carbon was used as a
support for the AuPd nanoparticles95. It was determined that the acid pre-treatment of the
support prior to metal immobilisation significantly reduced the unfavourable sequential
reactions. It was postulated that this increase in performance was a result of the formation
of a higher population of small nanoparticles which were Pd rich alloys. It was also
determined that these species induced a higher proportion of Pd metal which exhibited a
2+ oxidation state. This was suggested to be crucial to the catalysts performance. This
influenced subsequent work in this field which focussed on the application of exceptionally
acidic supports such as HPA’s96, 97 and zeolites98. It is clear that increasing the isoelectric
point of the support has a huge influence on the productivity of the AuPd catalysts. It is
clear that the direct synthesis of H2O2 requires further development before the process can
be applied in industry.
1.4.2. The Selective Epoxidation of Olefins
Epoxides have long been desirable chemicals from an industrial perspective, with their
application in the manufacture of a range of important commercial products99. The current
industrial method for the production of small chain epoxides involves selective oxidation

Chapter 1 | Introduction
11
from the corresponding olefin over a supported Ag catalyst100. This method can deliver an
exceptional selectivity to the epoxide.
Scheme 1.3. The selective oxidation of olefins to produce epoxides.
Haruta and co-workers were the first to recognise that supported Au nanoparticles were
viable for this selective oxidation43. Subsequent work by this group demonstrated that an
Au/TiO2 catalyst could selectively oxidise propene to propene oxide in the presence of O2
and sacrificial H2. It was determined that the H2 allows for the activation of O2 at low
temperatures68. Subsequent publications revealed that the selectivity could be further
promoted through optimisations of the TiO2 suport101, 102.
Mechanistic studies determined that the propene adsorbs to the TiO2 to form a bidentate
propoxy species103. The simultaneous production of a peroxy species on the Au
nanoparticle interacts with this species allowing for the reactive desorption of the epoxide.
Additional work by this group revealed that the Au nanoparticles merely facilitate the
production of these peroxy species and that the epoxidation of the substrate takes place
only in active sites located on the Ti104 . The catalyst preparation conditions are considered
to be crucial in controlling the reaction selectivity, as the active Au particle size is
considered to be < 2 nm in diameter68.
More recent work conducted by Hughes et al.105 revealed that the sacrificial H2 is not
crucial. Instead, catalytic quantities of peroxides were used and high epoxide selectivity
was achieved for the epoxidaton of a series of unsaturated cyclic substrates. This is perhaps
further evidence in support of the role of the surface bound peroxy species mentioned
previously103.
From an industrial perspective, the hydrogen selectivity is far too low in order to make the
process cost effective. For this reason, the use of water as a possible hydrogen source for
the epoxidation of propene over Au/TiO2 was investigated by Ojeda et al.106. As
anticipated, a significant reduction in the conversion and epoxide selectivity was observed.

Chapter 1 | Introduction
12
This work was subsequently followed with contributions from Haruta and co-workers, who
determined that the inclusion of alkali ions in the system could promote both epoxide
selectivity and activity when using an Au-TS1 catalyst107, 108. It was determined that the
cationic halides stabilise the O2- species over the Au clusters facilitating the production of
Au bound peroxy species.
1.4.3. The Selective Oxidation of Alcohols and Aldehydes
The selective oxidation of alcohols and aldehydes is of significant interest from both
industrial and research perspectives. With the growing importance of utilization of green
routes for chemical synthesis, new methods for the synthesis of high value chemicals from
by-products and platform chemicals are being investigated. Current industrial applications
rely on the use of stoichiometric equivalents of various reagents. The reagents are often
considered to be hazardous, hereby allowing for an alternative method of oxidation using
heterogeneous catalysts and molecular O2. Prati and Rossi were the first to discover that
supported gold nanoparticles were highly active for the oxidation of alcohols109, which
subsequently has led to increased interest in the field. Many different substrates have been
investigated in the literature110-113. For the purpose of the work in this thesis, only a few of
these reactions will be discussed.
1.4.3.1. Benzyl Alcohol Oxidation
Scheme 1.4. The oxidative dehydrogenation of benzyl alcohol to benzaldehyde

Chapter 1 | Introduction
13
The desired product from the selective oxidation of benzyl alcohol is benzaldehyde which
has applications in both the cosmetic and pharmaceutical industries. Hutchings and co-
workers were the first to demonstrate that supported gold nanoparticles were active for the
solvent free liquid phase oxidation of benzyl alcohol114. It was determined that the support
and preparation method could significantly affect the performance of the catalyst.
Choudhary and co-workers115 subsequently investigated the effect of the Au nanoparticle
support. It was observed that U3O8, MgO, Al2O3 and ZrO2 were the most effective supports
for this reaction. It was later determined that supported Au catalysts prepared by the sol-
immobilisation method were highly active for this reaction.116
Once again, synergistic effects created from the incorporation of Pd into Au nanoparticles
were found to improve catalytic performance117. Hou et al.75 subsequently conducted an
in-depth study investigating the effect of the metal ratio on the performance of AuPd
containing sols. A ratio of 1:3 AuPd was observed to give the highest activity and
selectivity to benzaldehyde. The preparation method of supported AuPd catalysts was
found to significantly impact catalytic performance. Supported AuPd alloys prepared by
sol-immobilisation, impregnation and deposition precipitation were compared and it was
determined that the sol-immobilisation method gave the best overall catalytic
performance118. Additional work by Hutchings and co-workers119 revealed that AuPd/C
catalysts prepared by this method were also suitable for this reaction. Interestingly, the
catalysts used in this study were also highly active for the direct synthesis of H2O2, leading
to the postulation that both reactions are catalysed by the same metal active sites.
The complex mechanistic profile of this reaction makes it an interesting model for the study
of catalytic alcohol oxidation. Benzyl alcohol can be oxidised directly to benzaldehyde and
undergo sequential oxidations to the corresponding acid and ester. Another reaction route
involves disproportionation of the surface bound intermediate to form toluene120. Nowicka
et al.121 determined that it is the Pd in the AuPd alloys which facilitates the unfavourable
disproportionation. However, it is the incorporation of Pd which also promotes the catalytic
activity of the AuPd alloys. It was later determined that this unfavourable pathway could
be suppressed through utilization of basic supports such MgO or reaction spiking with
small quantities of base121. This work suggests that the application of more acidic supports
such as TiO2 and carbon may promote the unfavourable disproportionation. Further work
conducted by Hutchings and co-workers investigated the effect of AuPd/TiO2 catalysts
under anaerobic conditions. Stoichiometric quantities of benzaldehyde and Toluene were

Chapter 1 | Introduction
14
observed which implied that both products may arise from a single transition state through
interaction of the catalyst surface with two additional molecules of subsrate120, 122.
Subsequent publications revealed that doping the AuPd alloys with Bi123 and Pt124 could
reduce the disproportionation through the blocking of specific active sites and changing the
co-ordination of the substrate to the catalyst.
An additional complexity of this system is the absence of benzoic acid when reactions are
conducted under aerobic conditions. This is unusual, as benzaldehyde readily undergoes
auto oxidation to benzoic acid in air at room temperature. This paradox was revealed to be
a result of benzyl alcohol suppressing the auto oxidation reaction through the interception
of benzoyl peroxy radicals125. Other publications have postulated that benzoic acid126 and
benzoate127 can reduce the performance of AuPd alloys in this reaction through product
inhibition. The addition of basic potassium salts was also observed to reduce this
inhibition126. It was also suggested that the Au facilitates the desorption of these species.
There are a number of other examples of AuPd alloys supported on interesting materials
such as biomass128 , porous steel fibre129, nanopaper130 and even encapsulated in metal
organic frameworks131. In addition, there are also numerous examples of AuPd alloys
catalysing this reaction in flow 132, 133.
1.4.3.2. The Selective Oxidation of 1,2-Propane Diol
Diols and triols are produced in large quantities as by-products from the industrial
production of bio-diesel. Although they are considered to be waste chemicals in this
process, they have been identified as key platform chemicals for further synthesis134. If
efficient catalytic routes can be derived for the further synthesis of these compounds, it
would ultimately make the synthesis of bio-diesel more economically viable from an
industrial perspective.
Lactic acid (LA) is considered to be the desired product from the selective oxidation of 1,2-
propanediol due to its application as an intermediate in the industrial production of
biodegradable polymers135. The observation that supported Au nanoparticles were suitable
for this selective oxidation was first observed by Prati and Rossi44. This extensive and
informative article revealed that the support, preparation technique and experimental
conditions could have a profound impact on the activity and selectivity of the Au

Chapter 1 | Introduction
15
nanoparticles. It was observed that stoichiometric quantities of base were required in order
to yield a suitable catalytic performance. The authors determined that there were two
possible pathways for the synthesis of LA; (i) oxidation of the primary alcohol species via
lactaldehyde, or (ii) through the simultaneous oxidation of both alcohol species followed
by an intermolecular Cannizzaro reaction of the pyruvaldehyde. It was suggested that the
latter of these reactions was highly dependent on the presence of the sacrificial base. This
reaction profile is displayed in Scheme 1.5.
Scheme 1.5. The two proposed pathways for the synthesis of LA from 1,2-propanediol.
Hutchings and co-workers investigated the effect of incorporating Pd into the supported
Au catalysts134. A synergistic effect on catalyst activity was observed. This study also
compared the preparation technique and determined that catalysts prepared by sol-
immobilisation were more active than catalyst prepared by impregnation. It was postulated
that the enhanced performance was attributed to the higher population of small
nanoparticles in the sol-immobilised catalyst. This observation was confirmed by Ma et
al.136 who noted that the particle size of AuPd alloys supported on Mg(OH)2 effected
catalytic performance. A DFT study revealed that the rate enhancement observed with
AuPd alloys compared with monometallic Pd catalysts was a result of the Au facilitating
the desorption of strongly bound surface species137.
AuPt/C was also found to be effective for this oxidation under ambient conditions (40 ºC,
air) in the presence of a sacrificial base135. Supported AuPd and AuPt have also been
investigated for the oxidation of 1,2-propanediol under base free conditions. Ryabenkova
et al.111 noted that base free oxidation over AuPd sol-immobilised catalysts was possible

Chapter 1 | Introduction
16
but substantial losses in activity and selectivity were observed. This observation was
consistent regardless of the catalyst support. Tongsakul et al.138 prepared ‘green’ AuPt/HT
catalysts by sol-immobilisation where starch was used as both the stabiliser and reducing
agent. The catalysts displayed excellent activity for oxidation under ambient and base free
conditions. It was postulated that this increase in performance was a result of electronic
donation from the Au and starch to the active Pt surface sites.
1.4.3.3. The Selective Oxidation of 5-Hydroxymethyl-2-Furfural (HMF)
Scheme 1.6. Reaction profile for the oxidation of HMF to FDCA.
HMF is produced on a large scale industrially through the hydrolysis of lignocellulose. It
is considered a key platform chemical for the development of derivatives with multiple
applications, such as the preparation of pharmaceuticals and as polymer precursors112, 139.
The desired reaction product from the oxidation of HMF is 2,5-furandicarboxyllic acid
(FDCA) as it has been identified as possible replacement for terephthalic acid (TPA), the
industrial precursor commonly used in the manufacture of polyethylene terephthalate
(PET). An efficient method for the synthesis of FDCA from a bio-renewable route would
be advantageous from an industrial perspective.
Davis and co-workers140 have compared the activity of Au, Pd and Pt nanoparticles
supported on carbon in a basic reaction medium for the oxidation of HMF. The Au
monometallic catalyst was found to be the most active in terms of HMF conversion but
was unable to activate the alcohol. By comparison, the Pd and Pt catalyst were able to
activate the hydroxyl group which ultimately led to a greater desirable reaction selectivity.
A subsequent publication by the same group provided a possible mechanism for the

Chapter 1 | Introduction
17
reaction which was determined using O18 isotopic labelling experiments141. It was
determined that the oxygen in the acid products was sourced only from the water in the
aqueous phase. It was suggested that the gaseous O2 had an indirect yet crucial role in the
reaction mechanism. The authors postulated that the role of the O2 is to scavenge electrons
from surface of the active metals, ultimately liberating the active sites for catalysis.
Bimetallic Au containing catalysts were found to increase catalytic performance through
activation of the hydroxyl species. It is well known that the activation of hydroxyl species
is often the RDS whenever successive aldehyde oxidation is desired56, 112, 142. The
incorporation of Cu143and Pd144 separately into supported Au nanoparticles was found to
increase the reaction selectivity to FDCA by facilitating the activation of the hydroxyl
group. The Pd and Cu were also found to increase the stability of the Au nanoparticles as
they maintained a higher degree of activity upon subsequent uses.
The support can clearly influence the performance of the Au nanoparticles. Cai et al.145
supported Au in HY zeolitic supercage structures. This support significantly outperformed
the other supports tested and gave close to a 100 % yield of the desired FCDA. This
exceptional reaction activity and selectivity was postulated to be a result of the small mean
Au particles size (1 nm) and the high population of acidic hydroxyl groups found in close
proximity to the Au nanoparticles. Similar trends have been observed from the optimisation
of carbon supports. Davis et al.146 revealed that increasing the population of OH species on
carbon nanofiber supports increased the performance of the Au nanoparticles when
compared with conventional carbon supports. Subsequently, Wan et al. revealed that the
surface of carbon nanotubes could be refined in order to promote the performance of the
AuPd nanoparticles in the base free selective oxidation of HMF147. It was observed that
increasing the population of surface bound hydroxyl species increased catalytic
performance by promoting the adsorption of HMF and other reaction intermediates to the
catalysts surface. The presence of carboxyl species was reported to facilitate the opposite.
Wilson and co-workers later published an in-depth discussion on the use of alkali free Mg-
Al hydrotalcites to support Au nanoparticles for this reaction148. It was reported that in the
absence of base, HMF and the other reaction intermediates bind strongly to the catalyst,
ultimately reducing its activity. It was suggested that the addition of base increased the rate
of the reaction by promoting the desorption of these species, thus liberating the Au active
sites. It was also proposed that the aqueous base is involved in the activation of the O-H

Chapter 1 | Introduction
18
species, although Cavani and co-workers have also suggested that it promotes the
production of FDCA by initiating intramolecular Cannizzaro reactions149.
1.5. The Selective Oxidation of Bio-derived Feedstocks
1.5.1. The Energy Crisis
The consumerist outlook adopted by much of the western world has led to a significant
increase in global energy dependence. This has indirectly resulted in the energy industry
playing a crucial role in controlling economic growth. Over the past century, significant
emphasis was placed on the use of fossil fuel feedstocks such as natural gas, coal and oil
to quench the increasing global energy demand. The development of infrastructure for the
refining of these feedstocks has enabled the preparation of many different products from
these materials150, 151. Despite the attributes associated with these feedstocks, numerous
concerns regarding the sustainability and environmental impact of this industry have been
raised151.
The natural stores of these materials are diminishing at a rapid rate. In addition, CO2
emitted from the combustion of these fuels is considered to be a primary contributor to
global warming which has been observed in recent decades151. This increase in the global
temperature is understood to be linked with the recent observations of climate change and
dramatic ecological damage. In addition, the catastrophic industrial disasters in this
industry can have a devastating impact on the localised environment and habitats. The
unfavourable attributes of this industry has led to the search for sustainable and
environmentally benign alternatives for the production of energy.
Numerous alternative technologies have been developed152. Of these, a substantial quadrant
utilize natural energy sources found on earth such as wind, solar and tidal phenomena.
Although these technologies have shown promise in small scale processing, significantly
increased development is required for them to be a feasible replacement to fossil fuels.
Nuclear fission is another alternative for energy production with the potential to fill the
void which will be created by diminishing fossil fuel stocks. Furthermore, a substantial
amount of research is currently being undertaken in the development of infrastructure
which can allow for the utilization of energy from nuclear fusion153-155. If the attempts to

Chapter 1 | Introduction
19
harness this energy source are successful it could almost certainly be a viable replacement
to fossil fuels. The utilization of nuclear energy comes at a cost with radioactive waste
produced and the prospect of catastrophic industrial disasters as seen in Chernobyl in 1986
and Fukushima in 2011 limit its widespread application.
Biofuels produced from bio-renewable feedstocks are another alternative for energy
production. The viability of these materials to replace conventional fossil fuels has potential
which has resulted in significant scientific interest in recent years156-158.
1.5.2. Bio-renewables for the Production of Fuels and Fine Chemicals
The production of bio-fuels from bio-renewable feedstocks is considered to be a promising
alternative to conventional energy processes. Fuels produced in this way offer a method of
harnessing energy with reduced emissions of greenhouse gases and noxious chemicals. The
diversity of available feedstocks allows for new processes to be developed for the synthesis
of fine chemicals.
First generation biofuels are isolated from crops and such as soybean, sugar cane and corn.
These substances can be used as feedstocks for the production of bio-diesel, bio gas and
ethanol. Although these processes are considered fairly efficient and offer an annually
renewable fuel, sourcing these fuels from feedstocks which are fit for human consumption
has led to an ethical dilemma159. The universal development of infrastructure for the
production of biodiesel would lead to severe poverty in some areas of the world as well as
an inevitable rise in the staple food prices. This limits 1st generation bio-fuels as a global
replacement for fossil fuels but is certainly suitable for small scale regional development.
Bio-diesel is predominantly composed of fatty acid methyl esters151. It is produced from
the transesterification of vegetable oils with alcohols in the presence of a homo- or
heterogeneous catalyst6. Bio-diesel has very similar properties to conventional diesel which
is what makes it such a desirable replacement for petroleum derived diesel. Glycerol is
produced as a co-product from this reaction160 which has subsequently sparked extensive
research into its application as a platform chemical.

Chapter 1 | Introduction
20
Scheme 1.7. Triglycerides found in 1st generation feedstocks undergo esterification in the
presence of a primary alcohol to produce fatty acid-esters (biodiesel) and glycerol.
Second generation biofuels are predominantly produced from lignocellulosic materials161,
162. For this reason, it is considered more viable from an ethical and renewable perspective,
as the feedstocks are generally not competitive with food stocks. Fuels produced in this
manner are also considered to exert less of a carbon footprint than first generation biofuels.
The lignocellulosic feedstock consists predominantly of plant cell walls of which,
approximately 75 % is composed of polysaccharides151, 163. The hydrolysis of these
materials can allow for the extraction of numerous sugars from the feedstock which can be
used for the further development of fuels and fine chemicals.
Scheme 1.8. The large distribution of products which can be produced from treatment of
lignocellulose. Figure has been republished164 with permission from the RSC.

Chapter 1 | Introduction
21
Despite the many merits associated with second generation fuels, the extensive treatment
steps and current inefficiency of these processes mean that fuels produced in this way are
not yet cost effective. Further development is required in order to make these processes
more viable industrially.
1.5.3. The Selective Oxidation of Glycerol
The development and utilisation of bio-diesel as an alternative fuel resource appears a
promising alternative to conventional fossil fuels; with many nations opting to invest
heavily in infrastructures to facilitate the development and exploitation of bio-fuels.
Currently, bio fuels are not considered a viable alternative to fossil fuels. A primary
limitation associated with bio fuels is a lack of atom efficiency manifested through the
production of waste chemicals. It is imperative that methods are developed so that these
waste chemicals are recycled for further applications.
Scheme 1.9. Glycerol is considered to be a key platform chemical and can be used for the
synthesis of many other compounds. Scheme republished with permission from the RSC165.
Glycerol is a C3 tri-ol containing three hydroxyl groups. Its primary industrial production
comes as a bi-product of biodiesel production via the transesterification of triglycerides
Chapter 1 | Introduction
22
sourced predominantly from soybean or palm oils. Its three hydroxyl groups mean that it
possess excellent potential for development into other fine chemicals. The EU directive
(2009/28/EC) features renewable energy targets for the countries in the EU and as a result,
the industrial production of glycerol is projected to increase in the coming years. This
projection has left a huge area of research for the exploitation of glycerol as a platform
chemical. Glyceric acid (GA), tartronic acid (TA), LA, dihydroxyacetone (DHA),
mesoxalic acid (MA) and glycolic acid (GLA) are all fine chemicals which can be
synthesised from glycerol. The selective oxidation using heterogeneous catalysts has
proven to be an exceptional method in attaining these fine chemicals from glycerol165, 166.
The first pioneering research on the catalytic oxidation of glycerol involved the use of Bi
doped Pt catalysts for the production of DHA167. The authors showed that the addition of
Bi to a supported Pt catalyst increased the selectivity to DHA from 10% to 80%. A
subsequent publication explained that the role of the Bi was to prevent over oxidation of
the products. Additionally, it was proposed that the Bi ad-atoms selectively oriented the
substrate on the surface to promote the oxidation of the additional hydroxyl group168.
Garcia et al.169 confirmed this work but also revealed that high yields of GA could be
achieved for the oxidation of glycerol over a 5% Pd/C catalyst. It was also determined that
the experimental conditions can significantly alter the selectivity of the catalyst. Rossi and
Prati and co-workers were the first to determine that supported Au catalysts in the presence
of O2 could selectively oxidise glycerol109. In the same publication they showed how the
choice of support and the preparation method can profoundly affect the performance of the
catalyst. Following on from this, Hutchings and co-workers170 showed that Au/Graphite
was an excellent catalyst for the selective oxidation of glycerol to GA. These works
triggered a cascade of additional publications from both the Prati and Hutchings groups
whose contributions to the use of Au in this field of research was summarised in a recent
review166.
The preparation of bimetallic catalysts containing Au can affect both catalyst activity and
selectivity. It has been reported that AuPd bimetallic catalysts can significantly enhance
activity and C3 selectivity when compared to their monometallic counterparts75, 171-174.
Work by Davis and co-workers175 showed that the incorporation of Pd into Au has shown
to increase the C3 selectivity with GA being the predominant product. It is suggested that
the role of Pd is to catalyse the decomposition of H2O2 bi-product which is believed to be
responsible for C-C cleavage and leads to the production of unfavourable C1 and C2

Chapter 1 | Introduction
23
products. Furthermore, metal particle size can also have a huge impact on the performance
of a catalyst for this reaction176 which highlights the importance of the preparation method.
Catalyst preparation and particle size effects have shown to be a crucial feature associated
with catalytic performance in a range of other oxidation reactions; benzyl alcohol
oxidation177, CO oxidation69 and the epoxidation of olefins68.
The reaction conditions can also play a significant role in the selectivity of the catalyst. Gil
et al.178 reported in detail, the significant effect operation conditions can have on the
selective oxidation of glycerol using Au nanoparticles supported on a range of different
carbonaceous materials. It was observed that an increase in oxygen pressure slightly
increased the rate of glycerol consumption but significantly enhanced the selectivity to GA
for all catalysts tested. It was suggested that the increase in GA came predominantly at the
expense of the sequential oxidation to TA. It was postulated that this increase in C3
selectivity was a result of a decrease in the in-situ production of H2O2 which has been
suggested to be responsible for some of the C-C cleavage observed in the oxidation of
glycerol65, 171, 179, 180. H2O2 is believed to be produced as a consequence of O2 reduction
prior to its dissociation179, 181, 182, with the water acting as a sacrificial oxidant toward the
diatomic oxygen. It is not clear in the current literature how the H2O2 interacts with the
substrate/products to instigate the C-C cleavage.
Scheme 1.10. The equations highlights the role of H2O in the activation of oxygen, with
H2O2 being produced as a by-product. * depicts a site on the surface of the metal. Image
courtesy of Davis and co-workers
The temperature in which the reaction is conducted can also have a significant effect on
the selectivity of the reaction. As with most catalytic processes increasing reaction
temperature increases the rate of glycerol consumption which links back to the role of
temperature in basic collision theory. A publication by Valverde and co-workers178
reported that increasing temperature not only increased the rate of glycerol consumption,
O2* + H2O* → OOH* + HO*
OOH* + H2O* → H2O2* + HO*
HO* + e− ↔ HO− + *

Chapter 1 | Introduction
24
but also affected the selectivity of the reaction. With an increasing temperature, a higher
selectivity of GA and oxalic acid (OA) was observed. Another study by Prati and co-
workers 183 also showed that reactions occurring at 50 ºC showed greater selectivity toward
GA than at 30 ºC using bimetallic Au, Pd and Pt catalysts. Valverde and co-workers178
postulated that the reason for this was that glycolic GLA production is directly related to
the presence of H2O2 and pointed out that previous studies investigating the production of
H2O2 have shown that less H2O2 is made with increasing temperature85. This is not the case
as the reason the observed concentration H2O2 at high temperatures decreases is because it
decomposes rapidly at elevated temperatures. This opinion is consistent throughout the
literature as the direct synthesis of H2O2 from H2 and O2 has to be carried out at
temperatures close to 0 ºC to inhibit the subsequent decomposition84, 85, 89, 95. Other
publications suggest that the formation of GLA is attributed to the oxidation of intermediate
species such as DHA and glyceraldehyde (GLAD) proceeding via different mechanistic
pathways170, 184, 185.
It has been well documented that the pH of the aqueous solution drastically affects the rate
of glycerol oxidation and the selectivity of the products168, 179, 181, 186. Prati and Rossi were
the first to postulate the role of NaOH in the oxidation of alcohols when Au supported
catalysts were used for the oxidation of C3 diols44. They suggested that the external
hydroxyl group plays an integral role in the initial dehydrogenation of the alcohol group to
form the carbonyl. In the absence of a sacrificial base, the cleavage of the C-H bond and
subsequent H-abstraction of the hydrogen atom adjacent to the target alcohol group is
incredibly difficult. This theory was later supported by the Hutchings group187.
Furthermore, increasing concentrations of base have shown to enhance C3 selectivity
through the base promoted decomposition of H2O2171
which as discussed previously, is
widely believed to be responsible for the C-C cleavage in the catalytic oxidation of
glycerol. Since this work, significant contributions from Davis and co-workers179, 181, 186
give a more defined and detailed description of the role of external hydroxyl groups in the
oxidation of alcohols. Using density functional theory, Davis and co-workers181 explained
that surface-bound hydroxide intermediates significantly lower the energy barrier for C-H
and O-H bond activation with Au nanoparticles. The formation of the initial alkoxy
intermediate is also possible in solution alone, but the energy barrier for the subsequent C-
H activation is significantly reduced when adsorbed hydroxyl intermediates are involved.

Chapter 1 | Introduction
25
Thus, both the OH ion and the heterogeneous catalyst have pivotal roles in the
dehydrogenation of the alcohol species to form the aldehyde.
A significant amount of recent work has focussed on the oxidation of glycerol in a base
free / neutral aqueous medium. For the industrialisation of such a process, the sacrificial
consumption of NaOH is not favourable. Early work suggested that supported platinum
catalysts displayed great promise with particle size proving an essential attribute for
activity188. Further work and by Brett et al.189 involved the preparation of supported AuPt
alloys. These alloys were found to display high activities in a base free environment. In
addition, this publication highlighted the importance of support selection, which appears to
have a significant impact on a given catalysts activity under base-free conditions. An
additional contribution from Tongsakul et al.190 suggested that the incorporation of Au into
Pt changes the electronic and geometric nature of the Pt, hereby promoting its catalytic
activity. Further work from Villa et al.191 suggested that under base free conditions basic
supports promote activity but also enhance C-C cleavage with acidity promoting the
selectivity to C3 products. It was stated that the performance of these acidic supported
catalyst was not dependent on the type of acidic site, but the quantity.
1.5.4. The Selective Oxidation of Furfural
A fundamental disadvantage for the universal exploitation of biodiesel as an alternative to
fossil fuels is the considerable waste of carbon which is produced as unfavourable bi-
products. One possible method of resolving this problem would be to utilize these waste
materials as platform chemicals. Furfural (FF) is a heterocyclic C5 aldehyde formed from
the acid hydrolysis of lignocellulosic agricultural residues. FF has limited applications but
has significant potential as a platform chemical192-194. To date, the majority of work in this
area has focussed on the hydrogenation of FF to furfuryl alcohol (FOH) and subsequently
tetrahydrofurfuryl alcohol, tetrahydrofuran and 2-methyltetrahydrofuran, which are
considered promising 2nd generation fuels195-200. In addition, FF has also been used to
produce furan by using a supported palladium catalyst through vapour phase
decarbonylation201. Due to the vast amount of research focussing on these transformations,
the potential for the selective oxidation of FF to value added products appears to have been
somewhat overlooked.

Chapter 1 | Introduction
26
Maleic acid (MEA) is one of many products which can be produced from the selective
oxidation of FF. Commercially, MEA is produced from maleic anhydride through vapour
phase oxidation of petroleum derivatives over vanadium phosphate catalysts at
temperatures exceeding 250 ºC202. MEA is a crucial starting material for the formation of
unsaturated polyester resins203. In light of the concerns regarding the depletion of fossil
fuel stocks, it is important to replace the conventional petroleum based starting materials
for MEA formation with something that is renewable. Yin and co-workers204 were the first
to identify that FF could be used as a starting material for the formation of MEA. In their
first publication, they showed that using phosphomolybdic heteropolyacids (HPA) in the
presence of Cu(NO3)2 could give yields of up to 35.3 % with a selectivity of 39.3 %.
Although this was the first publication in this area, significant amounts of carbon are
believed to be lost as a result of resin formation which the Cu(NO3)2 was stated to reduce.
A subsequent publication by the same group showed that similar yields of MEA could be
obtained but with a greater selectivity of 50.3 % using a biphasic system205. It was stated
that the biphasic system allowed for the substrate to be released gradually from the organic
layer. From this it was postulated that the reduction in substrate concentration in the
aqueous layer minimised the formation of resins through intramolecular substrate
interactions. The most recent publication from Yin and co-worker revealed that a further
increase of MEA yield was obtainable through use of phosphomolybdic HPAs in the
presence of copper(II)triflate206. MEA yields of up to 54 % were reported. The triflate
complex was suggested to increase selectivity by both trapping the carbon radicals which
facilitate resin formation and re-oxidising the reduced catalyst in-situ. An alternative
approach was proposed by Granados and co-workers207 who showed that using a
titanosilicate zeolite (TS-1) in the presence of H2O2 could give MEA yields of up to 78 %
after 24 h.
The formation of succinic acid (SA) from bio-renewable FF also appears to be an attractive
target. SA has a range of different applications on a commercial scale including use as an
acidity regulator in the food industry, a foaming agent in surfactants, and as an additive in
the pharmaceutical industry for the production of antibiotics and vitamins208. There are a
number of recent reviews highlighting the potential of SA as a platform chemical for the
synthesis of high value compounds139, 194, 209 which include the formation of specialised
polyesters210. As with MEA, SA is conventionally sourced from maleic anhydride which
is synthesised from petroleum based compounds202. As discussed previously, this is no

Chapter 1 | Introduction
27
longer favourable and an alternative approach from bio-renewable materials would be
much more viable. There is a significant amount of literature showing that SA can be made
directly from lignocellulosic materials211, 212 with reasonable yields, but literature reporting
the direct synthesis of SA from FF is limited. A two-step process was proposed by Kunioka
and co-workers213. The first step involves the liquid phase oxidation of FF in the presence
of sodium chlorate and vanadium pentoxide to form fumaric acid. This was subsequently
hydrogenated using a 5 wt.% Pd/C catalyst to give SA with almost 100 % atom efficiency.
Choudhary and co-workers were the first to propose a method for the one pot synthesis of
SA from FF in the liquid phase 214. A SA yield of 74.2 % was reported after 24 h when
catalysed by amberlyst-15 under relatively mild reaction conditions using H2O2 as the
oxidant. The remaining 25.8 % of carbon was unaccounted for, and it was proposed that
this loss may be attributed to resin formation. A subsequent, paper by the same group
showed that SA could be produced from HMF under the same conditions but with
significantly lower yields215. This paper also showed that the SA selectivity was
considerably higher when lower temperatures were used in the presence of high H2O2
concentrations.
The oxidative esterification of FF to form alkoxy furoates is also a possible option. These
compounds are in high demand for their application as flavour and fragrance components
in the fine chemical industry216. Taarning et al.217 were the first to show that the oxidative
esterification of FF to methyl furoate was possible through the application of specific
reaction conditions and in the presence of a Au supported heterogeneous catalyst. A
subsequent publication by Corma and co-worker showed that higher yields of the product
could be achieved through use of an Au/nano-CeO2 catalyst. High yields of desired product
were obtained when pressurising the reaction vessel with 10 bar of bubbled O2 at 130 ºC.
These reaction conditions were considerably more intensive than those used by Taarning
et al.217. A more recent paper revealed that a Au/ZrO2 could successfully catalyse this
transformation in the absence of a base216. A selectivity in excess of 90 % was achieved
using 6 bar O2 at 120 ºC. Catalysts with varying Au particle sizes were assessed and
increasing Au particle sizes was shown to severely reduce catalytic performance. An
additional publication from Boccuzzi et al.69 followed on from this, showing that the
application of Au/TiO2 in the absence of base was also capable of catalysing the oxidative
esterification of FF with methanol. The important link between Au nanoparticle size and
catalytic performance was reiterated in this work. A subsequent publication by the same

Chapter 1 | Introduction
28
group218 used the same reaction conditions in order to conduct a support study for this
reaction. Au nanoparticles were supported on CeO2, TiO2 and ZrO2 and it was reported that
Au/ZrO2 performed the best. It was postulated that ZrO2 was the superior support as it was
the least likely metal oxide to be poisoned by organic bi-products. Very recent work by
Tong et al.219 reveals that FF can undergo oxidative esterification with propanol in the
presence of Au nanoparticles. It was also determined that a subsequent condensation of the
coupled product could be achieved through the addition of K2CO3.
Furoic acid (FA) is another compound which can be produced directly from FF. FA is
predominantly used as a precursor to form furoyl chloride, which is a key compound in the
pharmaceutical industry for the production of drugs and insecticides220. It is currently
produced on an industrial scale via the Cannizzaro reaction with NaOH. This process
requires the subsequent separation of the corresponding alcohol and acid which may be
considered costly due to the additional time and financial constraints associated with this
process. The direct catalytic oxidation of FF to FA has previously been considered
unfeasible on an industrial scale as the substrate can also take part in a competitive
oxidation process resulting in the formation of other unfavourable bi-products due to ring
cleavage220. Despite this, there have been some promising publications. Parpot et al.
undertook an electrochemical investigation of the oxidation and reduction of FF in an
aqueous medium221. Yields of up to 80 % of FA were obtained using Nickel anodes in a
highly basic aqueous medium. This selectivity was noticeably higher when compared with
the use of Pt and Au anodes. An additional study by Sha and co-workers222 showed that
yields of up to 92 % can be achieved in the presence of an Ag2O/CuO heterogeneous
catalyst under optimised reaction conditions. A temperature of 70 ºC and 30 wt.% of Ag2O
was required in order to obtain these excellent yields. Deviation from these optimised
conditions resulted in significant decreases in FA yield. Furthermore, re-usability tests
showed that catalyst deactivation due to erosion by the FA produced in-situ was a problem
which limits the possible industrialisation of this process.
FF is an extremely reactive compound and can participate in a range of unfavourable
reactions which may impact its use as a platform chemical. These unfavourable
transformations include: self-polymerisation223, oxidative ring opening220 and
degradation224.

Chapter 1 | Introduction
29
Scheme 1.11. Example of acid promoted Diels-Alder reaction between two FF compounds
as proposed by Tanskanan and co-workers225.
The unfavourable polymerisation of FF has been noted in publications attempting to yield
succinic acid and MEA from FF using heterogeneous catalysts. A study by Yin and co-
workers206 proposed a mechanism for this unfavourable polymerisation. It was suggested
that this process is initiated through the abstraction of a hydrogen atom from the furan ring
to leave a radically charged furan species. Additional work by Tanskanen and co-
workers225, 226 involved the derivation of a kinetic model to fit the polymerisation of FF.
Here, FF was exposed to formic acid in an aqueous medium. It was suggested that the
acidity of the aqueous medium promoted the polymerisation pathway and that it occurred
through a Diels-Alder interaction between two of the FF compounds.
Scheme 1.12. The literature suggests that FF can be selectively oxidised to a range of
different products in the presence of heterogeneous catalysts.

Chapter 1 | Introduction
30
It is clear that FF is an exceptionally difficult compound to work with. Almost all of the
publications associated with its selective oxidation have reported the formation of resins or
a significant loss in mass balance.
1.6. Organic Mechanisms
There are a number of organic transformations which will be mentioned during this work.
These are given below.
1.6.1. Dakin Oxidation Reaction
Scheme 1.13. Mechanism for the Dakin Oxidation redox reaction. Typically occurs when
a hydroxylated phenyl aldehyde or ketone reacts with H2O2 in the presence of base to
form a benzenediol and a carboxylate.

Chapter 1 | Introduction
31
1.6.2. Diels-Alder Reaction
Scheme 1.14. Mechanism for the Diels-Alder reaction between a conjugated diene and a
dienophile.
1.6.3. The Cannizzaro Reaction
Scheme 1.15. Mechanism for the Cannizzaro reaction which involves the base induced
disproportionation of two carbonyl species. The disproportionation leads to the
formation of stoichiometric equivalents of the corresponding alcohol and aldehyde. The
concentration of the base determines how the reaction proceeds.
Chapter 1 | Introduction
32
1.7. References
1. M. Bowker, The basis and applications of heterogeneous catalysis, Oxford
University Press, 1998.
2. P. Anastas and N. Eghbali, Chemical Society Reviews, 2010, 39, 301.
3. P. T. Anastas, L. B. Bartlett, M. M. Kirchhoff and T. C. Williamson, Catalysis
Today, 2000, 55, 11.
4. C. A. Busacca, D. R. Fandrick, J. J. Song and C. H. Senanayake, Advanced
Synthesis & Catalysis, 2011, 353, 1825.
5. R. A. Sheldon, Journal of Chemical Technology and Biotechnology, 1997, 68, 381.
6. F. R. Ma and M. A. Hanna, Bioresource Technology, 1999, 70, 1.
7. P. T. Anastas and M. M. Kirchhoff, Accounts of Chemical Research, 2002, 35, 686.
8. A. Kudo and Y. Miseki, Chemical Society Reviews, 2009, 38, 253.
9. E. Pelizzetti and C. Minero, Electrochimica Acta, 1993, 38, 47.
10. H. E. Schoemaker, D. Mink and M. G. Wubbolts, Science, 2003, 299, 1694.
11. M. Beller, B. Cornils, C. D. Frohning and C. W. Kohlpaintner, Journal of
Molecular Catalysis A-Chemical, 1995, 104, 17.
12. R. Noyori and T. Ohkuma, Angewandte Chemie-International Edition, 2001, 40,
40.
13. S. N. Riduan, Y. G. Zhang and J. Y. Ying, Angewandte Chemie-International
Edition, 2009, 48, 3322.
14. T. J. Colacot, Platinum Metals Review, 2011, 55, 84.
15. D. J. Cole-Hamilton, Science, 2003, 299, 1702.
16. I. E. Wachs, Catalysis Today, 1996, 27, 437.
17. I. E. Wachs, Catalysis Today, 2005, 100, 79.
18. A. T. Bell, Science, 2003, 299, 1688.
19. K. Karaskova, L. Obalova, K. Jiratova and F. Kovanda, Chemical Engineering
Journal, 2010, 160, 480.
20. A. C. Gluhoi and B. E. Nieuwenhuys, Catalysis Today, 2007, 119, 305.
21. R. Schlogl, Angewandte Chemie-International Edition, 2003, 42, 2004.
22. G. K. Boreskov, Heterogeneous Catalysis, Nova Science Publishers, New York,
2003.
23. F. Banisharifdehkordi and M. Baghalha, Fuel Processing Technology, 2014, 120,
96.

Chapter 1 | Introduction
33
24. G. Olah, A. Molnar, Hydrocarbon Chemistry, New Jersey, 2003
25. A. Knell, P. Barnickel, A. Baiker and A. Wokaun, Journal of Catalysis, 1992, 137,
306.
26. J. Saavedra, H. A. Doan, C. J. Pursell, L. C. Grabow and B. D. Chandler, Science,
2014, 345, 1599.
27. G. C. Bond and D. T. Thompson, Gold Bulletin, 2000, 33, 41.
28. J. W. Mellor, Journal of Physical Chemistry, 1903, 7, 557.
29. S. Green, Industiral Catalysis, Macmillan Company, New York, 1928.
30. B. Lindstrom and L. J. Pettersson, Cattech, 2003, 7, 130.
31. J. Döbereiner, Schweigger's Journal, 1822, 91.
32. E. Davy, Philosophical Transactions, 1820, 108.
33. W. Henry, Philosophical Magazine, 1825, 269.
34. R. L. Burwell, Heterogeneous Catalysis - Selected American Histories, American
Chemical Society, Washington D.C., 1983.
35. M. Faraday, Philosophical Transactions, 124 (1834) 55, 1834.
36. G. Lemoine, Chemical Physics, 1877, 12, 145.
37. S. A. Topham, Catalysis: Science and Technology, Springer, New York, 1981.
38. 1925.
39. A. S. K. Hashmi and G. J. Hutchings, Angewandte Chemie-International Edition,
2006, 45, 7896.
40. G. C. Bond, P. A. Sermon, G. Webb, D. A. Buchanan and P. B. Wells, Journal of
the Chemical Society-Chemical Communications, 1973, 444.
41. M. Haruta, T. Kobayashi, H. Sano and N. Yamada, Chemistry Letters, 1987, 405.
42. G. J. Hutchings, Journal of Catalysis, 1985, 96, 292.
43. T. Hayasi, L. B. Han, S. Tsubota and M. Haruta, Industrial & Engineering
Chemistry Research, 1995, 34, 2298.
44. L. Prati and M. Rossi, Journal of Catalysis, 1998, 176, 552.
45. M. Haruta and M. Date, Applied Catalysis A-General, 2001, 222, 427.
46. A. Corma and H. Garcia, Chemical Society Reviews, 2008, 37, 2096.
47. R. Sardar, A. M. Funston, P. Mulvaney and R. W. Murray, Langmuir, 2009, 25,
13840.
48. C. Della Pina, E. Falletta and M. Rossi, Chemical Society Reviews, 2012, 41, 350.
49. G. C. Bond and D. T. Thompson, Catalysis Reviews-Science and Engineering,
1999, 41, 319.

Chapter 1 | Introduction
34
50. B. Hvolbaek, T. V. W. Janssens, B. S. Clausen, H. Falsig, C. H. Christensen and J.
K. Norskov, Nano Today, 2007, 2, 14.
51. M. Valden, X. Lai and D. W. Goodman, Science, 1998, 281, 1647.
52. M. Chen, Y. Cai, Z. Yan and D. W. Goodman, Journal of the American Chemical
Society, 2006, 128, 6341.
53. Z. X. Yang, R. Q. Wu and D. W. Goodman, Physical Review B, 2000, 61, 14066.
54. J. Guzman and B. C. Gates, Journal of the American Chemical Society, 2004, 126,
2672.
55. G. J. Hutchings, M. S. Hall, A. F. Carley, P. Landon, B. E. Solsona, C. J. Kiely, A.
Herzing, M. Makkee, J. A. Moulijn, A. Overweg, J. C. Fierro-Gonzalez, J. Guzman
and B. C. Gates, Journal of Catalysis, 2006, 242, 71.
56. P. Haider, J. D. Grunwaldt, R. Seidel and A. Baiker, Journal of Catalysis, 2007,
250, 313.
57. N. Lopez, T. V. W. Janssens, B. S. Clausen, Y. Xu, M. Mavrikakis, T. Bligaard and
J. K. Norskov, Journal of Catalysis, 2004, 223, 232.
58. S. Carrettin, P. Concepcion, A. Corma, J. M. L. Nieto and V. F. Puntes, Angewandte
Chemie-International Edition, 2004, 43, 2538.
59. J. A. van Bokhoven, C. Louis, J. T Miller, M. Tromp, O. V. Safonova and P.
Glatzel, Angewandte Chemie-International Edition, 2006, 45, 4651.
60. A. Sanchez, S. Abbet, U. Heiz, W. D. Schneider, H. Hakkinen, R. N. Barnett and
U. Landman, Journal of Physical Chemistry A, 1999, 103, 9573.
61. M. F. Camellone and S. Fabris, Journal of the American Chemical Society, 2009,
131, 10473.
62. X. Tang, J. Schneider, A. Dollinger, Y. Luo, A. S. Worz, K. Judai, S. Abbet, Y. D.
Kim, G. F. Gantefor, D. H. Fairbrother, U. Heiz, K. H. Bowen and S. Proch,
Physical Chemistry Chemical Physics, 2014, 16, 6735.
63. J. T. Miller, A. J. Kropf, Y. Zha, J. R. Regalbuto, L. Delannoy, C. Louis, E. Bus
and J. A. van Bokhoven, Journal of Catalysis, 2006, 240, 222.
64. M. Haruta, Catalysis Today, 1997, 36, 153.
65. W. C. Ketchie, Y. L. Fang, M. S. Wong, M. Murayama and R. J. Davis, Journal of
Catalysis, 2007, 250, 94.
66. M. Sankar, Q. He, M. Morad, J. Pritchard, S. J. Freakley, J. K. Edwards, S. H.
Taylor, D. J. Morgan, A. F. Carley, D. W. Knight, C. J. Kiely and G. J. Hutchings,
ACS Nano, 2012, 6, 6600.

Chapter 1 | Introduction
35
67. M. Morad, M. Sankar, E. H. Cao, E. Nowicka, T. E. Davies, P. J. Miedziak, D. J.
Morgan, D. W. Knight, D. Bethell, A. Gavriilidis and G. J. Hutchings, Catalysis
Science & Technology, 2014, 4, 3120.
68. T. Hayashi, K. Tanaka and M. Haruta, Journal of Catalysis, 1998, 178, 566.
69. F. Boccuzzi, A. Chiorino, M. Manzoli, P. Lu, T. Akita, S. Ichikawa and M. Haruta,
Journal of Catalysis, 2001, 202, 256.
70. F. Porta, L. Prati, M. Rossi, S. Coluccia and G. Martra, Catalysis Today, 2000, 61,
165.
71. I. Gandarias, P. J. Miedziak, E. Nowicka, M. Douthwaite, D. J. Morgan, G. J.
Hutchings and S. H. Taylor, Chemsuschem, 2015, 8, 473.
72. R. Y. Zhong, X. H. Yan, Z. K. Gao, R. J. Zhang and B. Q. Xu, Catalysis Science &
Technology, 2013, 3, 3013.
73. C. L. Bracey, P. R. Ellis and G. J. Hutchings, Chemical Society Reviews, 2009, 38,
2231.
74. A. Wittstock, V. Zielasek, J. Biener, C. M. Friend and M. Baumer, Science, 2010,
327, 319.
75. W. B. Hou, N. A. Dehm and R. W. J. Scott, Journal of Catalysis, 2008, 253, 22.
76. D. Mott, J. Luo, P. N. Njoki, Y. Lin, L. Y. Wang and C. J. Zhong, Catalysis Today,
2007, 122, 378.
77. A. Wang, X. Y. Liu, C. Y. Mou and T. Zhang, Journal of Catalysis, 2013, 308, 258.
78. H. C. Ham, G. S. Hwang, J. Han, S. W. Nam and T. H. Lim, Journal of Physical
Chemistry C, 2010, 114, 14922.
79. J. K. Edwards, S. J. Freakley, R. J. Lewis, J. C. Pritchard and G. J. Hutchings,
Catalysis Today, 2015, 248, 3.
80. C. Samanta, Applied Catalysis A-General, 2008, 350, 133.
81. J. K. Edwards, A. F. Carley, A. A. Herzing, C. J. Kiely and G. J. Hutchings,
Faraday Discussions, 2008, 138, 225.
82. J. K. Edwards and G. J. Hutchings, Angewandte Chemie-International Edition,
2008, 47, 9192.
83. S. Chinta and J. H. Lunsford, Journal of Catalysis, 2004, 225, 249.
84. P. Landon, P. J. Collier, A. J. Papworth, C. J. Kiely and G. J. Hutchings, Chemical
Communications, 2002, 2058.

Chapter 1 | Introduction
36
85. P. Landon, P. J. Collier, A. F. Carley, D. Chadwick, A. J. Papworth, A. Burrows,
C. J. Kiely and G. J. Hutchings, Physical Chemistry Chemical Physics, 2003, 5,
1917.
86. T. Ishihara, Y. Ohura, S. Yoshida, Y. Hata, H. Nishiguchi and Y. Takita, Applied
Catalysis A-General, 2005, 291, 215.
87. B. E. Solsona, J. K. Edwards, P. Landon, A. F. Carley, A. Herzing, C. J. Kiely and
G. J. Hutchings, Chemistry of Materials, 2006, 18, 2689.
88. J. K. Edwards, B. Solsona, P. Landon, A. F. Carley, A. Herzing, M. Watanabe, C.
J. Kiely and G. J. Hutchings, Journal of Materials Chemistry, 2005, 15, 4595.
89. J. K. Edwards, B. E. Solsona, P. Landon, A. F. Carley, A. Herzing, C. J. Kiely and
G. J. Hutchings, Journal of Catalysis, 2005, 236, 69.
90. V. R. Choudhary, C. Samanta, T. V. Choudhary, Journal of Molecular Catalysis A-
Chemical, 2006, 260, 115.
91. V. R. Choudhary, C. Samanta and T. V. Choudhary, Applied Catalysis A-General,
2006, 308, 128.
92. C. Samanta,V. R. Choudhary, Catalysis Communications, 2007, 8, 2222.
93. C. Samanta, V. R. Choudhary, Catalysis Communications, 2007, 8, 73.
94. V. R. Choudhary and P. Jana, Catalysis Communications, 2008, 9, 2371.
95. J. K. Edwards, B. Solsona, A. F. Carley, A. A. Herzing, C. J. Kiely and G. J.
Hutchings, Science, 2009, 323, 1037.
96. S. Park, D. R. Park, J. H. Choi, T. J. Kim, Y. M. Chung, S.H. Oh and I. K. Song,
Journal of Molecular Catalysis A-Chemical, 2010, 332, 76.
97. E. N. Ntainjua, M. Piccinini, S. J. Freakley, J. C. Pritchard, J. K. Edwards, A. F.
Carley and G. J. Hutchings, Green Chemistry, 2012, 14, 170.
98. N. Gemo, P. Biasi, P. Canu, F. Menegazzo, F. Pinna, A. Samikannu, K. Kordas, T.
O. Salmi and J. P. Mikkola, Topics in Catalysis, 2013, 56, 540.
99. G. Grigoropoulou, J. H. Clark and J. A. Elings, Green Chemistry, 2003, 5, 1.
100. J. R. Monnier, P. J. Muehlbauer, U.S. Patent, 292 589, 1990.
101. A. K. Sinha, S. Seelan, T. Akita, S. Tsubota and M. Haruta, Applied Catalysis A-
General, 2003, 240, 243.
102. A. K. Sinha, S. Seelan, T. Akita, S. Tsubota and M. Haruta, Catalysis Letters, 2003,
85, 223.
103. T. A. Nijhuis, T. Visser and B. M. Weckhuysen, Journal of Physical Chemistry B,
2005, 109, 19309.

Chapter 1 | Introduction
37
104. T. A. R. Nijhuis, T. Visser and B. M. Weckhuysen, Angewandte Chemie-
International Edition, 2005, 44, 1115.
105. M. D. Hughes, Y. J. Xu, P. Jenkins, P. McMorn, P. Landon, D. I. Enache, A. F.
Carley, G. A. Attard, G. J. Hutchings, F. King, E. H. Stitt, P. Johnston, K. Griffin
and C. J. Kiely, Nature, 2005, 437, 1132.
106. M. Ojeda and E. Iglesia, Chemical Communications, 2009, 352.
107. J. Huang, T. Takei, T. Akita, H. Ohashi and M. Haruta, Applied Catalysis B-
Environmental, 2010, 95, 430.
108. J. Huang, T. Takei, H. Ohashi and M. Haruta, Applied Catalysis A-General, 2012,
435, 115.
109. L. Prati and M. Rossi, 3rd World Congress on Oxidation Catalysis, 1997, 110, 509.
110. N. Dimitratos, J. A. Lopez-Sanchez, D. Morgan, A. F. Carley, R. Tiruvalam, C. J.
Kiely, D. Bethell and G. J. Hutchings, Physical Chemistry Chemical Physics, 2009,
11, 5142.
111. Y. Ryabenkova, P. J. Miedziak, N. F. Dummer, S. H. Taylor, N. Dimitratos, D. J.
Willock, D. Bethell, D. W. Knight and G. J. Hutchings, Topics in Catalysis, 2012,
55, 1283.
112. O. Casanova, S. Iborra and A. Corma, Journal of Catalysis, 2009, 265, 109.
113. M. H. Ab Rahim, Q. He, J. A. Lopez-Sanchez, C. Hammond, N. Dimitratos, M.
Sankar, A. F. Carley, C. J. Kiely, D. W. Knight and G. J. Hutchings, Catalysis
Science & Technology, 2012, 2, 1914.
114. D. I. Enache, D. W. Knight and G. J. Hutchings, Catalysis Letters, 2005, 103, 43.
115. V. R. Choudhary, A. Dhar, P. Jana, R. Jha and B. S. Uphade, Green Chemistry,
2005, 7, 768.
116. N. Dimitratos, J. A. Lopez-Sanchez, D. Morgan, A. Carley, L. Prati and G. J.
Hutchings, Catalysis Today, 2007, 122, 317.
117. G. Li, D. I. Enache, J. Edwards, A. F. Carley, D. W. Knight and G. J. Hutchings,
Catalysis Letters, 2006, 110, 7.
118. P. Miedziak, M. Sankar, N. Dimitratos, J. A. Lopez-Sanchez, A. F. Carley, D. W.
Knight, S. H. Taylor, C. J. Kiely and G. J. Hutchings, Catalysis Today, 2011, 164,
315.
119. J. Pritchard, L. Kesavan, M. Piccinini, Q. He, R. Tiruvalam, N. Dimitratos, J. A.
Lopez-Sanchez, A. F. Carley, J. K. Edwards, C. J. Kiely and G. J. Hutchings,
Langmuir, 2010, 26, 16568.

Chapter 1 | Introduction
38
120. S. Meenakshisundaram, E. Nowicka, P. J. Miedziak, G. L. Brett, R. L. Jenkins, N.
Dimitratos, S. H. Taylor, D. W. Knight, D. Bethell and G. J. Hutchings, Faraday
Discussions, 2010, 145, 341.
121. M. Sankar, E. Nowicka, R. Tiruvalam, Q. He, S. H. Taylor, C. J. Kiely, D. Bethell,
D. W. Knight and G. J. Hutchings, Chemistry-A European Journal, 2011, 17, 6524.
122. G. Kovtun, T. Kameneva, S. Hladyi, M. Starchevsky, Y. Pazdersky, I. Stolarov, M.
Vargaftik and I. Moiseev, Advanced Synthesis & Catalysis, 2002, 344, 957.
123. A. Villa, D. Wang, G. M. Veith and L. Prati, Journal of Catalysis, 2012, 292, 73.
124. Q. He, P. J. Miedziak, L. Kesavan, N. Dimitratos, M. Sankar, J. A. Lopez-Sanchez,
M. M. Forde, J. K. Edwards, D. W. Knight, S. H. Taylor, C. J. Kiely and G. J.
Hutchings, Faraday Discussions, 2013, 162, 365.
125. M. Sankar, E. Nowicka, E. Carter, D. M. Murphy, D. W. Knight, D. Bethell and G.
J. Hutchings, Nature Communications, 2014, 5, 6.
126. E. Skupien, R. J. Berger, V. P. Santos, J. Gascon, M. Makkee, M. T. Kreutzer, P. J.
Kooyman, J. A. Moulijn and F. Kapteijn, Catalysts, 2014, 4, 89.
127. A. Villa, D. Ferri, S. Campisi, C. E. Chan-Thaw, Y. Lu, O. Krocher and L. Prati,
Chemcatchem, 2015, 7, 2534.
128. K. Deplanche, I. P. Mikheenko, J. A. Bennett, M. Merroun, H. Mounzer, J. Wood
and L. E. Macaskie, Topics in Catalysis, 2011, 54, 1110.
129. H. Guo, M. Kemell, A. Al-Hunaiti, S. Rautiainen, M. Leskela and T. Repo,
Catalysis Communications, 2011, 12, 1260.
130. Y. Guan, N. Zhao, B. Tang, Q. Q. Jia, X. H. Xu, H. Liu and R. I. Boughton,
Chemical Communications, 2013, 49, 11524.
131. J. Zhu, P. C. Wang and M. Lu, Applied Catalysis A-General, 2014, 477, 125.
132. E. Cao, M. Sankar, E. Nowicka, Q. He, M. Morad, P. J. Miedziak, S. H. Taylor, D.
W. Knight, D. Bethell, C. J. Kiely, A. Gavriilidis and G. J. Hutchings, Catalysis
Today, 2013, 203, 146.
133. H. Alex, N. Steinfeldt, K. Jaehnisch, M. Bauer and S. Huebner, Nanotechnology
Reviews, 2014, 3, 99.
134. N. Dimitratos, J. A. Lopez-Sanchez, S. Meenakshisundaram, J. M. Anthonykutty,
G. Brett, A. F. Carley, S. H. Taylor, D. W. Knight and G. J. Hutchings, Green
Chemistry, 2009, 11, 1209.

Chapter 1 | Introduction
39
135. Y. Ryabenkova, Q. He, P. J. Miedziak, N. F. Dummer, S. H. Taylor, A. F. Carley,
D. J. Morgan, N. Dimitratos, D. J. Willock, D. Bethell, D. W. Knight, D. Chadwick,
C. J. Kiely and G. J. Hutchings, Catalysis Today, 2013, 203, 139.
136. H. Ma, X. Nie, J. Y. Cai, C. Chen, J. Gao, H. Miao and J. Xu, Science China-
Chemistry, 2010, 53, 1497.
137. M. B. Griffin, A. A. Rodriguez, M. M. Montemore, J. R. Monnier, C. T. Williams
and J. W. Medlin, Journal of Catalysis, 2013, 307, 111.
138. D. Tongsakul, S. Nishimura, C. Thammacharoen, S. Ekgasit and K. Ebitani,
Industrial & Engineering Chemistry Research, 2012, 51, 16182.
139. A. Corma, S. Iborra and A. Velty, Chemical Reviews, 2007, 107, 2411.
140. S. E. Davis, L. R. Houk, E. C. Tamargo, A. K. Datye and R. J. Davis, Catalysis
Today, 2011, 160, 55.
141. S. E. Davis, B. N. Zope and R. J. Davis, Green Chemistry, 2012, 14, 143.
142. T. Mallat and A. Baiker, Chemical Reviews, 2004, 104, 3037.
143. S. Albonetti, T. Pasini, A. Lolli, M. Blosi, M. Piccinini, N. Dimitratos, J. A. Lopez-
Sanchez, D. J. Morgan, A. F. Carley, G. J. Hutchings and F. Cavani, Catalysis
Today, 2012, 195, 120.
144. A. Villa, M. Schiavoni, S. Campisi, G. M. Veith and L. Prati, Chemsuschem, 2013,
6, 609.
145. J. Cai, H. Ma, J. Zhang, Q. Song, Z. Du, Y. Huang and J. Xu, Chemistry-A
European Journal, 2013, 19, 14215.
146. S. E. Davis, A. D. Benavidez, R. W. Gosselink, J. H. Bitter, K. P. de Jong, A. K.
Datye and R. J. Davis, Journal of Molecular Catalysis A-Chemical, 2014, 388, 123.
147. X. Y. Wan, C. M. Zhou, J. S. Chen, W. P. Deng, Q. H. Zhang, Y. H. Yang and Y.
Wang, ACS Catalysis, 2014, 4, 2175.
148. L. Ardemani, G. Cibin, A. J. Dent, M. A. Isaacs, G. Kyriakou, A. F. Lee, C. M. A.
Parlett, S. A. Parry and K. Wilson, Chemical Science, 2015, 6, 4940.
149. A. Lolli, S. Albonetti, L. Utili, R. Amadori, F. Ospitali, C. Lucarelli and F. Cavani,
Applied Catalysis A-General, 2015, 504, 408.
150. A. Demirbas, Energy Sources, 2004, 26, 715.
151. S. N. Naik, V. V. Goud, P. K. Rout and A. K. Dalai, Renewable & Sustainable
Energy Reviews, 2010, 14, 578.
152. M. Z. Jacobson, Energy & Environmental Science, 2009, 2, 148.
153. M. Dittmar, Energy, 2012, 37, 35.
Chapter 1 | Introduction
40
154. K. Tokimatsu, J. Fujino, S. Konishi, Y. Ogawa and K. Yamaji, Energy Policy, 2003,
31, 775.
155. S. Lee and S. H. Saw, Journal of Fusion Energy, 2011, 30, 398.
156. P. Kumar, D. M. Barrett, M. J. Delwiche and P. Stroeve, Industrial & Engineering
Chemistry Research, 2009, 48, 3713.
157. D. M. Alonso, J. Q. Bond and J. A. Dumesic, Green Chemistry, 2010, 12, 1493.
158. P. M. Mortensen, J. D. Grunwaldt, P. A. Jensen, K. G. Knudsen and A. D. Jensen,
Applied Catalysis A-General, 2011, 407, 1.
159. P. B. Thompson, Journal of Agricultural & Environmental Ethics, 2008, 21, 183.
160. M. G. Kulkarni, R. Gopinath, L. C. Meher and A. K. Dalai, Green Chemistry, 2006,
8, 1056.
161. L. D. Gomez, C. G. Steele-King and S. J. McQueen-Mason, New Phytologist, 2008,
178, 473.
162. A. Zabaniotou, O. Ioannidou and V. Skoulou, Fuel, 2008, 87, 1492.
163. M. Pauly and K. Keegstra, Plant Journal, 2008, 54, 559.
164. N. Sun, H. Rodriguez, M. Rahman and R. D. Rogers, Chemical Communications,
2011, 47, 1405.
165. B. Katryniok, H. Kimura, E. Skrzynska, J.-S. Girardon, P. Fongarland, M. Capron,
R. Ducoulombier, N. Mimura, S. Paul and F. Dumeignil, Green Chemistry, 2011,
13, 1960.
166. A. Villa, N. Dimitratos, C. E. Chan-Thaw, C. Hammond, L. Prati and G. J.
Hutchings, Accounts of Chemical Research, 2015, 48, 1403.
167. H. Kimura, K. Tsuto, T. Wakisaka, Y. Kazumi and Y. Inaya, Applied Catalysis A-
General, 1993, 96, 217.
168. P. Fordham, R. Garcia, M. Besson and P. Gallezot, 11th International Congress on
Catalysis - 40th Anniversary, Pts A and B, 1996, 101, 161.
169. R. Garcia, M. Besson and P. Gallezot, Applied Catalysis A-General, 1995, 127,
165.
170. S. Carrettin, P. McMorn, P. Johnston, K. Griffin and G. J. Hutchings, Chemical
Communications, 2002, 696.
171. N. Dimitratos, A. Villa and L. Prati, Catalysis Letters, 2009, 133, 334.
172. A. H. A. Nadzri, N. Hamzah, A. Alias, J. Salimon and M. A. Yarmo, X-Ray and
Related Techniques, 2011, 173, 155.
Chapter 1 | Introduction
41
173. A. Villa, N. Janjic, P. Spontoni, D. Wang, D. S. Su and L. Prati, Applied Catalysis
A-General, 2009, 364, 221.
174. N. Dimitratos, J. A. Lopez-Sanchez, J. M. Anthonykutty, G. Brett, A. F. Carley, R.
C. Tiruvalam, A. A. Herzing, C. J. Kiely, D. W. Knight and G. J. Hutchings,
Physical Chemistry Chemical Physics, 2009, 11, 4952.
175. W. C. Ketchie, M. Murayama and R. J. Davis, Journal of Catalysis, 2007, 250, 264.
176. N. Dimitratos, J. A. Lopez-Sanchez, D. Lennon, F. Porta, L. Prati and A. Villa,
Catalysis Letters, 2006, 108, 147.
177. W. H. Fang, J. S. Chen, Q. H. Zhang, W. P. Deng and Y. Wang, Chemistry-A
European Journal, 2011, 17, 1247.
178. S. Gil, M. Marchena, L. Sanchez-Silva, A. Romero, P. Sanchez and J. L. Valverde,
Chemical Engineering Journal, 2011, 178, 423.
179. W. C. Ketchie, M. Murayama and R. J. Davis, Topics in Catalysis, 2007, 44, 307.
180. A. Villa, G. M. Veith, D. Ferri, A. Weidenkaff, K. A. Perry, S. Campisi and L. Prati,
Catalysis Science & Technology, 2013, 3, 394.
181. B. N. Zope, D. D. Hibbitts, M. Neurock and R. J. Davis, Science, 2010, 330, 74.
182. C. Shang and Z.-P. Liu, Journal of the American Chemical Society, 2011, 133,
9938.
183. C. L. Bianchi, P. Canton, N. Dimitratos, F. Porta and L. Prati, Catalysis Today,
2005, 102, 203.
184. S. Demirel-Gulen, M. Lucas and P. Claus, Catalysis Today, 2005, 102, 166.
185. F. Porta and L. Prati, Journal of Catalysis, 2004, 224, 397.
186. M. S. Ide and R. J. Davis, Accounts of Chemical Research, 2014, 47, 825.
187. S. Carrettin, P. McMorn, P. Johnston, K. Griffin, C. J. Kiely and G. J. Hutchings,
Physical Chemistry Chemical Physics, 2003, 5, 1329.
188. D. Liang, J. Gao, J. H. Wang, P. Chen, Z. Y. Hou and X. M. Zheng, Catalysis
Communications, 2009, 10, 1586.
189. G. L. Brett, Q. He, C. Hammond, P. J. Miedziak, N. Dimitratos, M. Sankar, A. A.
Herzing, M. Conte, J. A. Lopez-Sanchez, C. J. Kiely, D. W. Knight, S. H. Taylor
and G. J. Hutchings, Angewandte Chemie-International Edition, 2011, 50, 10136.
190. D. Tongsakul, S. Nishimura and K. Ebitani, ACS Catalysis, 2013, 3, 2199.
191. A. Villa, S. Campisi, K. M. H. Mohammed, N. Dimitratos, F. Vindigni, M. Manzoli,
W. Jones, M. Bowker, G. J. Hutchings and L. Prati, Catalysis Science &
Technology, 2015, 5, 1126.

Chapter 1 | Introduction
42
192. C. M. Cai, T. Y. Zhang, R. Kumar and C. E. Wyman, Journal of Chemical
Technology and Biotechnology, 2014, 89, 2.
193. A. Bohre, S. Dutta, B. Saha and M. M. Abu-Omar, ACS Sustainable Chemistry &
Engineering, 2015, 3, 1263.
194. P. Gallezot, Chemical Society Reviews, 2012, 41, 1538.
195. J.-P. Lange, E. van der Heide, J. van Buijtenen and R. Price, Chemsuschem, 2012,
5, 150.
196. H. Y. Zheng, Y. L. Zhu, B. T. Teng, Z. Q. Bai, C. H. Zhang, H. W. Xiang and Y.
W. Li, Journal of Molecular Catalysis A-Chemical, 2006, 246, 18.
197. S. Sitthisa and D. E. Resasco, Catalysis Letters, 2011, 141, 784.
198. L. R. Baker, G. Kennedy, M. Van Spronsen, A. Hervier, X. J. Cai, S. Y. Chen, L.
W. Wang and G. A. Somorjai, Journal of the American Chemical Society, 2012,
134, 14208.
199. S. G. Wang, V. Vorotnikov and D. G. Vlachos, ACS Catalysis, 2015, 5, 104.
200. S. Iqbal, X. Liu, O. F. Aldosari, P. J. Miedziak, J. K. Edwards, G. L. Brett, A.
Akram, G. M. King, T. E. Davies, D. J. Morgan, D. K. Knight and G. J. Hutchings,
Catalysis Science & Technology, 2014, 4, 2280.
201. W. Zhang, Y. Zhu, S. Niu and Y. Li, Journal of Molecular Catalysis A-Chemical,
2011, 335, 71.
202. G. Centi, F. Trifiro, J. R. Ebner and V. M. Franchetti, Chemical Reviews, 1988, 88,
55.
203. K. J. Zeitsch, in The chemistry and technology of furfural and its many by-products,
Elsevier, 2000, vol. 13, pp. 225-228.
204. S. Shi, H. Guo and G. Yin, Catalysis Communications, 2011, 12, 731.
205. H. Guo and G. Yin, Journal of Physical Chemistry C, 2011, 115, 17516.
206. J. H. Lan, Z. Q. Chen, J. C. Lin and G. C. Yin, Green Chemistry, 2014, 16, 4351.
207. N. Alonso-Fagundez, I. Agirrezabal-Telleria, P. L. Arias, J. L. G. Fierro, R.
Mariscal and M. L. Granados, RSC Advances, 2014, 4, 54960.
208. J. G. Zeikus, M. K. Jain and P. Elankovan, Applied Microbiology and
Biotechnology, 1999, 51, 545.
209. C. Delhomme, D. Weuster-Botz and F. E. Kuehn, Green Chemistry, 2009, 11, 13.
210. C.-J. Tsai, W.-C. Chang, C.-H. Chen, H.-Y. Lu and M. Chen, European Polymer
Journal, 2008, 44, 2339.

Chapter 1 | Introduction
43
211. K. Chen, M. Jiang, P. Wei, J. Yao and H. Wu, Applied Biochemistry and
Biotechnology, 2010, 160, 477.
212. J. M. Yao, M. Jiang, H. Wu and K. Q. Chen, Shengwu Jiagong Guocheng, 2010, 8,
66.
213. Y. Tachibana, T. Masuda, M. Funabashi and M. Kunioka, Biomacromolecules,
2010, 11, 2760.
214. H. Choudhary, S. Nishimura and K. Ebitani, Chemistry Letters, 2012, 41, 409.
215. H. Choudhary, S. Nishimura and K. Ebitani, Applied Catalysis A-General, 2013,
458, 55.
216. M. Signoretto, F. Menegazzo, L. Contessotto, F. Pinna, M. Manzoli and F.
Boccuzzi, Applied Catalysis B-Environmental, 2013, 129, 287.
217. E. Taarning, I. S. Nielsen, K. Egeblad, R. Madsen and C. H. Christensen,
Chemsuschem, 2008, 1, 75.
218. F. Menegazzo, M. Signoretto, F. Pinna, M. Manzoli, V. Aina, G. Cerrato and F.
Boccuzzi, Journal of Catalysis, 2014, 309, 241.
219. X. L. Tong, Z. H. Liu, L. H. Yu and Y. D. Li, Chemical Communications, 2015,
51, 3674.
220. K. J. Zeitsch, in The chemistry and technology of furfural and its many by-
products Elsevier, 2000, vol. 13, pp. 159-163.
221. P. Parpot, A. P. Bettencourt, G. Chamoulaud, K. B. Kokoh and E. M. Beigsir,
Electrochimica Acta, 2004, 49, 397.
222. Q. Y. Tian, D. X. Shi and Y. W. Sha, Molecules, 2008, 13, 948.
223. A. Gandini and M. N. Belgacem, Actualite Chimique, 2002, 56.
224. D. L. Williams and A. P. Dunlop, Industrial and Engineering Chemistry, 1948, 40,
239.
225. K. Lamminpaa, J. Ahola and J. Tanskanen, RSC Advances, 2014, 4, 60243.
226. K. Lamminpaa, J. Ahola and J. Tanskanen, Industrial & Engineering Chemistry
Research, 2012, 51, 6297.

44
2.1. Chemicals – Source and Purity
All chemicals used in my research are given below, along with their corresponding source
and approximate purity.
Water, HPLC grade, Fisher Scientific
Phosphoric Acid (85 wt.% in H2O), ≥ 99.99%, Sigma Aldrich
Palladium Chloride, Johnson Matthey
Chloroauric acid, Johnson Matthey
Chloroplatinic acid, Johnson Matthey
Polyvinylalcohol (MW 9000-10000), 80% hydrolysed, Sigma Aldrich
Tetrakis(hydroxymethyl)phosphonium chloride (THPC), 80% in water, Sigma Aldrich
Sodium borohydride, ≥ 98 %, Sigma Aldrich
Sulphuric Acid, ≥ 95 (w/w) %, Fisher Scientific
Titainia P.25, ≥ 99.5%, Degussa
Magnesium Oxide, BDH
Graphite, Powder (< 20 micron) synthetic, Aldrich
XC-72R, vulcan - powder, CABOT
Glycerol, ≥ 99 %, SigmaUltra
DL-Glyceraldehyde dimer, ≥ 97 %, Sigma-Aldrich
DL-Glyceric acid hemicalcium salt hydrate, ≥ 98 %, Sigma-Aldrich Glycolic acid, ≥ 97 %, Sigma-Aldrich
1,3-Dihydroxyacetone acetone dimer, ≥ 97 %, Sigma-Aldrich
DL-Lactic acid, 85 (w/w) %, Sigma
Tartonic acid, ≥ 97 %, Sigma-Aldrich
β-Hydroxypyruvic acid, ≥ 95 %, Sigma-Aldrich
Oxalic acid, ≥ 98 %, Sigma-Aldrich
Formic acid, ≥ 96 %, Sigma-Aldrich
Chapter 2 Experimental

Chapter 2 | Experimental
45
Furfural, ≥ 99 %, Sigma-Aldrich
Furfuryl Alcohol, ≥ 98 %, Aldrich
Furoic Acid, ≥ 98 %, Aldrich
Hydrogen Peroxide, 60 (w/w) % Aqueous
Sodium Hydroxide, ≥ 97% Powder, Sigma-Aldrich
Na2SO3, ≥ 98 %, Sigma-Aldrich
NaNO3, ≥ 99 %, Sigma
2.2. Definitions
𝐶𝑜𝑛𝑣𝑒𝑟𝑠𝑖𝑜𝑛 (%) = (𝑀𝑜𝑙𝑒𝑠 𝑜𝑓 𝑆𝑢𝑏𝑠𝑡𝑟𝑎𝑡𝑒 𝐶𝑜𝑛𝑣𝑒𝑟𝑡𝑒𝑑
𝑀𝑜𝑙𝑒𝑠 𝑜𝑓 𝑆𝑢𝑏𝑠𝑡𝑟𝑎𝑡𝑒) 𝑥 100
𝑆𝑒𝑙𝑒𝑐𝑡𝑖𝑣𝑖𝑡𝑦 (%) = ( 𝑀𝑜𝑙𝑒𝑠 𝑜𝑓 𝑃𝑟𝑜𝑑𝑢𝑐𝑡
𝑀𝑜𝑙𝑒𝑠 𝑜𝑓 𝑆𝑢𝑏𝑠𝑡𝑟𝑎𝑡𝑒 𝐶𝑜𝑛𝑣𝑒𝑟𝑡𝑒𝑑) 𝑥 100
𝐶𝑎𝑟𝑏𝑜𝑛 𝐵𝑎𝑙𝑎𝑛𝑐𝑒 (%)
= (𝑀𝑜𝑙𝑒𝑠 𝑜𝑓 𝐶𝑎𝑟𝑏𝑜𝑛 𝐷𝑒𝑡𝑒𝑐𝑡𝑒𝑑
𝑀𝑜𝑙𝑒𝑠 𝑜𝑓 𝐶𝑎𝑟𝑏𝑜𝑛 𝑎𝑡 𝑡ℎ𝑒 𝐵𝑒𝑔𝑖𝑛𝑛𝑖𝑛𝑔 𝑜𝑓 𝑡ℎ𝑒 𝑅𝑒𝑎𝑐𝑡𝑖𝑜𝑛) 𝑥 100
𝑇𝑢𝑟𝑛 𝑂𝑣𝑒𝑟 𝐹𝑟𝑒𝑞𝑢𝑒𝑛𝑐𝑦 (𝑇𝑂𝐹) = ( (
𝑀𝑜𝑙𝑒𝑠 𝑜𝑓 𝑆𝑢𝑏𝑠𝑡𝑟𝑎𝑡𝑒 𝐶𝑜𝑛𝑠𝑢𝑚𝑒𝑑𝑀𝑜𝑙𝑒𝑠 𝑜𝑓 𝐴𝑐𝑡𝑖𝑣𝑒 𝑀𝑒𝑡𝑎𝑙
)
𝑇𝑖𝑚𝑒 ) 𝑥 100
𝑅𝑒𝑑𝑢𝑐𝑡𝑖𝑜𝑛 𝑖𝑛 𝑂𝑥𝑖𝑑𝑎𝑡𝑖𝑜𝑛 𝐴𝑐𝑡𝑖𝑣𝑖𝑡𝑦 (%) = (𝑇𝑂𝐹𝑆𝑇𝐴𝑁𝐷𝐴𝑅𝐷 − 𝑇𝑂𝐹𝑁𝐸𝑊
𝑇𝑂𝐹𝑆𝑇𝐴𝑁𝐷𝐴𝑅𝐷 ) 𝑥 100

Chapter 2 | Experimental
46
𝑅𝑎𝑡𝑒 (𝐾) = 𝑘 . 𝑐𝑎𝑡 . [𝐴]𝑎[𝐵]𝑏[𝐶]𝑐
𝑅𝑎𝑡𝑒 𝐶𝑜𝑛𝑠𝑡𝑎𝑛𝑡 (𝑘) = 𝐴𝑒−𝐸𝑎𝑅𝑇
2.3. Catalyst Preparation
The way in which a catalyst is prepared can greatly affect its performance. Typically,
supported Au catalysts exhibit higher activities as particle size decreases1, 2. In addition,
the Au particle size can also affect selectivity of the reaction as different size particles can
promote different reaction pathways3. As a consequence, metal particle size is a key
parameter which, if controlled correctly, has the potential to significantly enhance catalytic
performance. Particle size is greatly affected by the catalyst preparation technique and thus
it is crucial that the appropriate preparation technique is selected in order to obtain optimum
catalyst performance
2.3.1. The Sol –Immobilisation Technique
The sol-immobilisation technique is a modern method for the preparation of highly
dispersed supported metal nanoparticles. It involves the application of a stabilising agent
to control and stabilise particle size. Typically, metal(s) are encapsulated with the
stabilising agents and are subsequently reduced using a powerful reducing agent. In most
cases, acidification of the solution is required in order to reduce the pH to a lower value
than the isoelectric point of the support to ensure full metal immobilisation. This is
generally not required with basic supports such as Mg(OH)2 and ZrO2. This preparation
technique delivers supported metal nanoparticles which are finely dispersed and have
exceptionally small size distributions4-7. A limitation of this technique is that the stabilising
agent is often difficult to remove and can hinder the movement of a substrate in and out of
the active site8.

Chapter 2 | Experimental
47
2.3.2. Conventional Sol-immobilisation
The following details the preparation of 1g of a 1 wt.% Au/TiO2 catalyst by the
conventional sol-immobilisation technique.
HAuCl4.3H2O (0.8 mL, 12.5 g / L) was added to H2O (400 mL) and stirred. To this solution,
polyvinyl alcohol (1 wt.% solution, Aldrich, weight average molecular weight Mw ¼
9000–10 000 g mol-1, 80% hydrolysed) was added. Subsequently, NaBH4 (0.1 M,
NaBH4/Au (mol/mol) = 5) was then introduced. After 30 minutes of sol generation, the
colloid was immobilised by adding TiO2 (0.99 g) and the solution was acidified to pH 1
(0.1 M, H2SO4) under vigorous stirring. After 1 h the slurry was filtered, the catalyst
washed thoroughly with distilled water, and dried at 110 ºC for 16 h.
2.3.3. Modified Sol-Immobilisation
The immobilisation of Au can be problematic with some supports using the conventional
sol-immobilisation technique; namely CeO2 and graphite. For this reason, an alternative
method of immobilising metal sols was created where Tetrakis(hydroxymethyl)
phosphonium chloride (THPC) acts as both the stabilising agent and reducing agent. This
method has also been shown to produce small nanoparticles with narrow particle size
distributions7. The procedure for producing 1 g of a 1 wt.% Au/Graphite catalysts in this
manor is displayed below.
Sodium hydroxide (2.4 mL, 0.2 M) and Tetrakis(hydroxymethyl)phosphonium chloride
(1.427 mL of 10 % vol aqueous solution) were added to H2O (47 mL) and stirred for 3
minutes. HAuCl4.3H2O (0.8 mL, 12.5 g/L) was subsequently added and the solution was
left to equilibriate for 0.5 h. Graphite (0.99 g) was added to the mixture and the solution
was acidified to pH 1 (0.1 M, H2SO4) and left to stir for an additional 1 h. The catalyst was
filtered, washed thoroughly and dried at 110 ºC for 16 h.
The sol-immobilisation technique can also be used to produce bi- and tri-metallic catalysts.
Additional metals are added at the same stage as the Au. Bimetallic and trimetallic catalysts
containing combinations of Au, Pd and Pt prepared this way are reported in the literature4,
6, 9, 10.
Chapter 2 | Experimental
48
2.3.4. Impregnation (IMP)
The impregnation technique is a quick and simple method for supporting metal
nanoparticles. This method gives a reasonably broad particle size distribution. Impregnated
catalysts typically provide their projected metal loadings but often require a post
preparation treatment step in order to increase the support metal interaction. This additional
heat treatment can cause particle agglomeration in some cases. Furthermore, due to the lack
of particle size control, impregnated catalysts can often be difficult to reproduce. The
procedure for producing a 0.5 g of a 1 wt.% Au/TiO2 catalyst is given below.
TiO2 (0.495 g) was inserted into a beaker (10 mL) attached with a magnetic stir bar.
HAuCl4.3H2O (0.4 mL, 12.5 g / L) and H2O (1.6 mL) was subsequently added to the beaker
and the solution was stirred slowly at 80 ºC. The consistency of the mixture is monitored
and the beaker removed when a thick paste is formed. The paste was dried at 110 ºC for 16
h and the subsequent material was finely ground and calcined at 400 ºC under static air for
3 h with a ramp rate of 20 ºC / min.
2.3.5. Modified Impregnation (Mod-IMP)
This technique for preparing AuPd nanoparticles was only recently discovered11. It offers
the ability to prepare small nanoparticles containing Au and Pd, with no stabilising agent.
The impregnation method is modified by using excess chloride during the preparation to
provide more particle size control. This method for the preparation of 1 g of a 1 wt.% AuPd
(molar) /TiO2 is provided below.
To a 50 mL round bottom flask attached with a magnetic stir bar, HAuCl4.3H2O (0.519
mL, 12.5 g / L) and PdCl2 (0.585 mL, 6 g / L) was added. H2O (14.896 mL) was
subsequently added in order to bring the total volume of the flask up to 16 mL. The flask
was immersed in an oil bath at room temperature and stirred vigorously. Over a period of
10 minutes, the temperature of the oil bath was raised to 60 ºC. Once the temperature had
stabilised, TiO2 (0.99 g) was added slowly to the mixture over an additional 10 minutes
with constant stirring. Once this was complete, the slurry was stirred for a further 15
minutes. The temperature was raised to 95 ºC and stirred for an additional 16 h. The solid
powder was subsequently retrieved and ground to a fine powder. Following this, the
catalyst was reduced at 400 ºC for 3 h under a steady flow of 5% H2 in air. The sample was
heated at a ramp rate of 10 ºC / min.

Chapter 2 | Experimental
49
2.4. Catalyst Evaluation
All catalyst testing was conducted for the development in understanding of two reactions:
(i) The oxidation of glycerol
(ii) The oxidation of furfural
Both chemicals are formed as products from the production of biofuels12, 13. Many
modifications of the standard testing was conducted in order to gain further understanding
of catalysts stabilities and the mechanistic features of each reaction. The standard reaction
conditions are detailed below, along with the testing modifications of each reaction.
2.4.1. Selective Oxidation of Glycerol
Reactions were carried out using a 50 mL Colover glass reactor. To this, glycerol (5 mL,
0.6 M in H2O) and NaOH (5 mL, 1.2 M in H2O) was added to the reactor vessel, sealed
and the resulting solution was left for 5 minutes in order to reach the desired temperature
(60 ºC unless stated otherwise). The desired amount of catalyst (stated in the corresponding
caption) was subsequently added to the solution. The reactor was purged three times and
pressurised with O2 (3 bar). The reaction mixture was stirred at 1200 rpm for a stated time.
In some cases, reaction samples were taken from the reactor, after which the reactor was
re-purged three times and pressurised with O2 (3 bar). After the reaction was complete, the
reactor vessel was cooled to room temperature and the final reaction sample was taken. All
reaction samples were diluted 10 fold in H2O, filtered and subsequently analysed by high
performance liquid chromatography (HPLC).
The substrate was often exchanged for reaction products in order to assess how the catalysts
affect them under these reaction conditions. For these tests, the exact same testing
procedure was used with the 0.3 M solution of glycerol being substituted with a 0.3 M of
a different compound.
2.4.2. Glycerol Product Inhibition Studies
Reactions were carried out using a 50 mL Colover glass reactor. To this, 5 mL of a solution
comprising of glycerol (0.6 M in H2O) and the product (0.1 M in H2O) under investigation
was added. NaOH (5 mL, 1.2 M in H2O) was subsequently added and the vessel was sealed
and the resulting solution was left for 5 minutes under vigorous stirring (1200 rpm) in order

Chapter 2 | Experimental
50
to reach the desired temperature (60 ºC unless stated otherwise). The desired amount of
catalyst (stated in the corresponding caption) was subsequently added to the solution. The
reactor was purged three times and finally pressurised with O2 (3 bar pressure). The
reaction mixture was stirred at 1200 rpm for a stated time. In some cases, reaction samples
were taken from the reactor after which, the reactor was re-purged three times and
pressurised with O2 (3 bar). After the reaction was complete, the reactor vessel was cooled
to room temperature and the final reaction sample was taken. All reaction samples were
diluted 10 fold in H2O, filtered and subsequently analysed by HPLC.
2.4.3. Radical Testing in the Oxidation of Glycerol
Reactions were carried out using a 50 mL Colover glass reactor. The glycerol solution (0.3
M in H2O and NaOH–glycerol ratio = 2, mol/mol) was added to the reactor. An additional,
Na2SO3 (10 mg) or NaNO3 (10 mg) was added and the resulting solution was left for 5
minutes in order to reach the desired temperature (60 ºC unless stated otherwise). The
desired amount of catalyst (stated in the corresponding caption) was subsequently added to
the solution. The reactor was purged three times with O2 and finally pressurised to 3 bar.
The reaction mixture was stirred at 1200 rpm for a stated time. In some cases, reaction
samples were taken from the reactor, after which the reactor was re-purged three times and
pressurised with O2 (3 bar). After the reaction was complete, the reactor vessel was cooled
to room temperature and the final reaction sample was taken. All reaction samples were
diluted 10 fold in H2O, filtered and subsequently analysed by HPLC.
2.4.4. The Selective Oxidation of Furfural
Reactions were carried out using a 50 mL Colover glass reactor. An oil bath was heated to
the desired temperature (30 ºC unless stated otherwise) and left to stabilize for 30 minutes.
The desired amount of catalyst (stated in the corresponding caption) was added to the
reactor with NaOH (5 mL, 0.3 M in H2O) and H2O (4.752 mL). The resulting solution was
stirred at 1000 rpm for 5 minutes. Furfural (0.248 mL) was added under continuous stirring
so that the total concentration of furfural in solution equated to approximately 0.3 M.
Subsequently, the reactor was purged three times and pressurized with O2 (3 bar pressure).
In some cases, reaction samples were taken from the reactor, after which the reactor was

Chapter 2 | Experimental
51
re-purged three times and pressurised with O2 (3 bar). All reaction samples were diluted 10
fold in H2O, filtered and subsequently analysed by HPLC.
2.4.5. The Selective Oxidation of Furfural Alcohol
Reactions were carried out using a 50 mL Colover glass reactor. An oil bath was heated to
the desired temperature (30 ºC unless stated otherwise) and left to stabilize for 30 minutes.
The desired amount of catalyst (stated in the corresponding caption) was added to the
reactor with NaOH (5 mL, 0.3 M in H2O ) and H2O (4.74 mL). The resulting solution was
stirred at 1000 rpm for 5 minutes. Furfural (0.260 mL) was added under continuous stirring
so that the total concentration of furfural in solution equated to approximately 0.3 M.
Subsequently, the reactor was purged three times and pressurized with O2 (3 bar pressure).
In some cases, reaction samples were taken from the reactor, after which the reactor was
re-purged three times and pressurised with O2 (3 bar). All reaction samples were diluted 10
fold in H2O, filtered and subsequently analysed by HPLC.
2.4.6. Short Term Sampling Experiments
In order to determine the reaction orders, rate constants and activation energies for the
catalytic oxidations of furfural and furfuryl alcohol, short term reaction sampling was
conducted in order to monitor the reactions progress at low substrate conversions. The
same experimental procedures were used (detailed above), however, samples were taken
every 5 minutes. The reactor was subsequently purged three times and charged with O2 (3
bar) after each sample was taken.
2.5. Catalyst Stability
The stability of a catalyst is a crucial factor to consider when assessing its industrial
viability. Some supported metal nanoparticles are susceptible to leaching, particularly in
the liquid phase14. The preparation technique and post preparation heat treatment of the
catalyst can increase the metal-support interaction and consequently reduce or even prevent
metal leaching.

Chapter 2 | Experimental
52
2.5.1. Microwave Plasma Atomic Emission Spectroscopy (MP-AES)
Atomic Emission Spectroscopy (AES) has been widely used for obtaining quantitative
elemental analysis of liquid phase samples for a number of years. The principle is simple;
as a given element is exposed to an influx of energy, its valence electrons undergo
transitions to higher energy levels. When these excited electrons relax, they emit light and
the spectral lines observed are indicative of the unique electronic transitions of a given
element.
MP-AES utilizes this theory as a method of obtaining quantitative elemental analysis of
liquid phase samples to an exceptional degree of accuracy. Nitrogen is fed through a water
trap and gas filter to the torch, where microwave radiation heats the gas to approximately
5000 ºC. Under these conditions, the nitrogen is broken down and ionised forming a stream
of nitrogen plasma. Upon exposure to this plasma, elements are atomised and their
electrons are excited and subsequently relax emitting photons with defined energies and
wavelengths which are characteristic of each element. Mirrors surrounding the torch
chamber collect and focus the emitted light onto a monochromatic detector.
Excitation Relaxation Energy
hv
E
*
E
Figure 2.1. Diagram representing the process responsible for photon emission.
Chapter 2 | Experimental
53
MP-AES is an exceptionally useful tool for the study of heterogeneous catalyst.
Information regarding metal loadings, elemental ratios, metal leaching and even catalytic
poisons can be determined using this technique.
Experimental
Procedure for the elemental analysis of an Au/TiO2 catalyst is displayed below.
The analysis was conducted using an Agilent 4100 MP-AES. Au content was analysed
using two emission lines. A known mass of Au/TiO2 was added to aqua regia solution (2
% in H2O, 50 mL) and left to digest overnight. The samples were filtered using PTFE filters
(Acrodisc PVDF 0.45 μl). Samples were introduced into a stream of nitrogen plasma via a
single pass spray chamber at a pressure of 120 kPa in the absence of any air injection. The
instrument was calibrated with 2.5 ppm, 5 ppm and 10 ppm of Au standards. Samples were
tested three times and an average of the three results was taken.
2.5.2. Catalyst Re-usability Tests
Reusability experiments were conducted as a method of investigating whether the catalyst
performance changed in subsequent tests. Multiple tests were conducted under standard
reaction conditions and the catalyst was recovered from each reactor. The catalysts were
dried in at 110 ºC for 16 h and subsequently combined and retested under the standard
reaction conditions.
2.6. Product Analysis
There are multiple methods which can be used to analyse the contents of aqueous solutions.
HPLC was the primary method used for analysis of reaction samples in this work.
2.6.1. High Performance Liquid Chromatography (HPLC)
HPLC allows for the separation of poorly volatile samples. The technique is based on the
fundamental principles associated with product separation in organic synthesis; using silica

Chapter 2 | Experimental
54
columns. The technique allows for accurate quantitative analysis of a liquid phase solution
and is made up of two fundamental constituents; the mobile phase and stationary phase. A
schematic diagram shown in Figure 2.2 is a diagrammatic representation of a HPLC
detailing its key components.
The solvent reservoir is where the mobile phase is stored. Multiple solvents may be applied
as the mobile phase and the selection is crucial to obtaining accurate quantitative data.
When multiple solvents are used, the mobile phase can be either gradient (composition of
solvents changes with time) or isocratic (composition of solvents is kept constant) in nature.
The HPLC pump is required to withstand very high pressures and controls the flow of the
mobile phase throughout the system. It is important that the flow rate is controlled to a high
level of accuracy in order to maintain consistent retention factors. The auto-sampler is
responsible for introducing the sample into the mobile phase. The volume injected must be
consistent as it could severely influence the accuracy of results in the absence of an internal
or external standard.
1
2
3
4
5
6
7
8
Figure 2.2. Schematic diagram for the HPLC used to analyse the reaction effluents of the
catalytic reactions. 1. Solvent reservoir, 2. HPLC Pump, 3. Autosampler, 4. Rheodyne
valve, 5. Column, 6. Refractive Index detector, 7. Diode array detector, 8. Data acquisition.

Chapter 2 | Experimental
55
Once the sample is introduced into the mobile phase, it is pumped into the column. There
are many different types of HPLC columns and the selection can be dependent on the given
reaction. The columns consist of the stationary phase which is generally made of silica
based microporous materials, polymers or gels. Interactions between the mobile phase and
the stationary phase play a role in attaining consistent and accurate results. As the mobile
phase is passed into the column, compounds from the sample interact and equilibrate with
the stationary phase, leading to differing retention times. Once, they pass out the column
they are carried in the mobile phase to the detectors.
There are many different detectors used in HPLC. The choice of which, is dependent on
the nature of the samples and mobile phase. The two detectors which were used in this were
work were a refractive index detector (RID) and a diode array detector (DAD). The column
eluent is first fed through to the RID into a sample cell, where it is passed over a beam of
light. The refractive index of the mobile phase is subsequently measured. The greater the
difference in the RI of the sample and mobile phase, the higher the observed sensitivity.
The primary advantage of using an RID is that it has a universal response. Every liquid
phase species will refract light to some extent. Unfortunately, sensitivity can be an issue,
which can limit its accuracy when compared against other detectors. For this reason, it is
better to use RID’s in combination with an additional source of detection.
DAD detectors can detect ultra-violet and visible light at the same time. The detector allows
for the 3-dimensional projection of products. A beam of light from the deuterium and quartz
halogen lamps is passed over a sample in the reference cell. Here, the absorbance of light
is monitored and the greater the absorbance, the higher the sensitivity. DAD detectors give
significantly higher sensitivities than RID’s. However, the samples must consist of
molecular components, which absorb light. For this reason, detection is limited to
compounds containing unsaturated, aromatic or carbonyl compounds.
Sample Cell
Reference Cell Photo Detector
Light Source
Figure 2.3. Schematic representation of a refractive index detector.

Chapter 2 | Experimental
56
To monitor the oxidation of glycerol and furfural a HPLC fixed with RID and DAD
detectors was used. The experimental details are displayed below;
Experimental
The analysis was carried out using HPLC with ultraviolet and refractive index detectors.
Reactants and products were separated using a Metacarb 67 H column. The eluent was an
aqueous solution of H3PO4 (0.01 M) and the flow was 0.25 ml min-1. Samples of the
reaction mixture (0.5 ml) were diluted (to 5 ml) using the eluent. Products were identified
by comparison with authentic samples. For the quantification of the amounts of reactants
consumed and products generated, an external calibration method was used.
2.7. Catalyst Characterisation
There are numerous different analytical and spectroscopic techniques which can provide
qualitative data of a given material. For the study of heterogeneous catalysts, these tools
are crucial in correlating physical properties with activity.
2.7.1. X-ray photoelectron Microscopy (XPS)
The fundamental principles of XPS are based on the photoelectric effect, where photons
are absorbed by atoms resulting in the subsequent ejection if a photoelectron. The kinetic
energy (KE) of the ejected photoelectron can be expressed as a function of the binding
energy of ejected atom (Eb) and the energy of the photon (hv).
𝐾𝐸 = ℎ𝑣 − 𝐸𝑏
XPS can provide the user with information regarding the oxidation states of a given
materials elemental components. It can also provide quantitative data associated with the
elemental makeup of the materials surface.
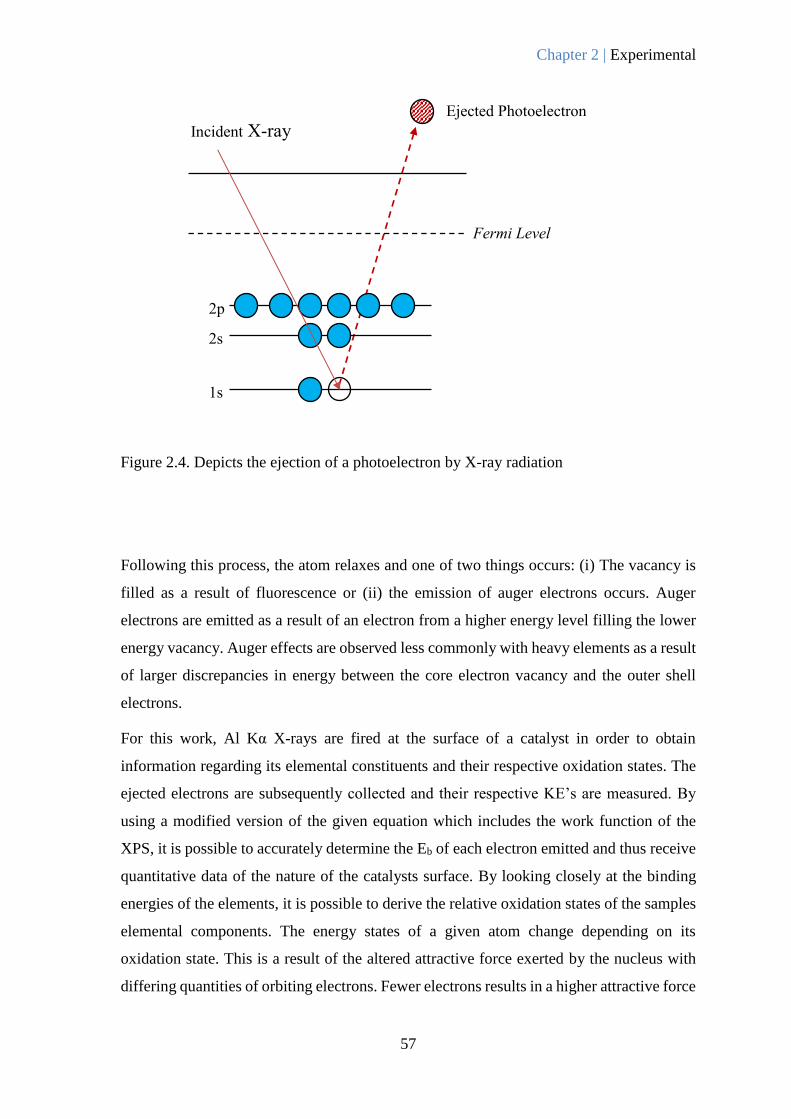
Chapter 2 | Experimental
57
Following this process, the atom relaxes and one of two things occurs: (i) The vacancy is
filled as a result of fluorescence or (ii) the emission of auger electrons occurs. Auger
electrons are emitted as a result of an electron from a higher energy level filling the lower
energy vacancy. Auger effects are observed less commonly with heavy elements as a result
of larger discrepancies in energy between the core electron vacancy and the outer shell
electrons.
For this work, Al Kα X-rays are fired at the surface of a catalyst in order to obtain
information regarding its elemental constituents and their respective oxidation states. The
ejected electrons are subsequently collected and their respective KE’s are measured. By
using a modified version of the given equation which includes the work function of the
XPS, it is possible to accurately determine the Eb of each electron emitted and thus receive
quantitative data of the nature of the catalysts surface. By looking closely at the binding
energies of the elements, it is possible to derive the relative oxidation states of the samples
elemental components. The energy states of a given atom change depending on its
oxidation state. This is a result of the altered attractive force exerted by the nucleus with
differing quantities of orbiting electrons. Fewer electrons results in a higher attractive force
Incident X-ray
Ejected Photoelectron
Fermi Level
1s
2s
2p
Figure 2.4. Depicts the ejection of a photoelectron by X-ray radiation

Chapter 2 | Experimental
58
experienced by the other electrons which ultimately, leads to a shift in the atomic binding
energies.
Experimental
All the catalysts assessed using XPS in this thesis were characterised at the Cardiff
University XPS centre by Dr David Morgan. A VG EscaLab 220i spectrometer equipped
with an AlKα X-ray 300 W source was used for this work. The relative binding energies
were standardised against a C 1 s reference (284.7 Ev).
2.7.2. Powder X-ray Diffraction (XRD)
XRD is a powerful analytical technique, which is primarily used for the identification of
crystalline materials. This technique is typically used as a method of obtaining information
regarding the bulk structure of materials such as phase identification, determination of unit
cell dimensions and crystallite size and quality16.
θ
d
Incident
X-rays Scattered
X-rays
Figure 2.5. As incident X-rays contact a surface they are elastically scattered. The Bragg
law can be used to identify the lattice spacing (d) using the angle (θ) and wavelength (λ) of
the incident radiation.

Chapter 2 | Experimental
59
X-rays are produced through the bombardment of a copper target with high energy
electrons. Electrons within the copper are excited to high energy levels. As they relax,
energy is emitted as Kα and Kβ X-rays. Kβ electrons are omitted using a filter leaving only
the Kα radiation. These X-rays are focussed onto the sample and elastically scattered by
the respective atoms. The scattered radiation can undergo either constructive or destructive
interference. The angle of the X-ray source changes from 10 º to 80 º during the run.
Constructive interference gives high intensity reflections which gives information
regarding the long term order of the crystalline structure. Poorly crystalline samples give
significantly more destructive interference. All the scattered radiation is collected using a
moving detector.
Bragg’s law is used to calculate the lattice spacing (d) within a sample by unifying the
wavelength of X-rays (λ), the order of the reflection (n) and the angle between the incident
x-rays and the normal plane in one equation.
nλ = 2d sin θ
Bragg Law: Method for obtaining lattice parameters of a given powder XRD.
The crystallinity of the sample can be assessed by looking at the full width half max
(FWHM) of the most intense peaks. Highly crystalline solids with good long-term order
will exhibit sharp narrow diffraction peaks whereas solids consisting of poor morphologies
will give less intense, broader peaks. The Scherrer equation is a further tool which can be
used for assessing the morphologies of crystalline solids using XRD. This equation allows
for the accurate determination of the crystallite size (𝜏)
𝜏 =𝐾𝜆
𝛽 𝐶𝑂𝑆 𝜃
Scherrer Equation: Method for the derivation of crystallite sizes in conjunction with
powder XRD.

Chapter 2 | Experimental
60
Experimental
Powder X-ray diffraction (XRD) was conducted using a PANalytical X’Pert Pro system
fitted with a CuKα X-ray source run at 40 kV and 40 mA. An X’Celerator detector was
used in order to assess the scattered media. Each sample was scanned from 2θ = 10 º to 80
º for 30 minutes. Catalysts were ground into a fine powder and loaded onto a silicon wafer.
The corresponding results were compared directly with the data held in the ICDD library.
2.7.3. Transmission Electron Microscopy (TEM)
Electron microscopes are powerful tools which use accelerated electrons to construct 2D
images of small areas with exceptional resolution. Such properties are of great use for
investigating the surface of catalytic materials and can give a significant amount of
information regarding particles size, metal distribution and dispersion. A schematic
diagram of a typical transmission microscope is displayed in Figure 2.6. A schematic
diagram of a conventional electron microscope.
Conventional TEMs provide exceptional magnification and resolution. An extremely high
voltage of electricity is required in order to adequately activate the cathode in the electron
gun. The heated filament generates a high energy beam of electrons which are passed
through electromagnetic coils on their way to the sample. The first electromagnetic coil is
responsible for focussing the electron beam into a thin direct stream of electrons and the
second focussed the beam onto a small selected area of the sample. The sample sits on a
thin copper holder and the electron beam passes straight through both. The electrons
subsequently pass through a projector lens and onto a fluorescent screen which projects the
image of the surface.
There are numerous modifications of conventional TEM’s which are now operational such
as HAADF and TEM-EDX. These modifications have allowed for even greater qualitative
analysis of heterogeneous catalysts.
Experimental
Transmission electron microscopy (TEM) was conducted using an Ieol 2100 fixed with a
LaB6 filament operating at 200 KV. Powdered catalyst samples were dispersed in ethanol
and dropped onto lacey carbon films over a 300 mesh copped grid.

Chapter 2 | Experimental
61
Figure 2.6. A schematic diagram of a conventional electron microscope.
Image
Electromagnetic Coils
Electron Gun
Sample Holder
Projector Lens
Fluorescent Screen

Chapter 2 | Experimental
62
2.7.4. Thermogravimetric Analysis (TGA)
TGA is a useful technique, which monitors the weight of a given sample as a function of
temperature and/or time under controlled atmospheric conditions. It can provide a range of
information regarding phase transitions such as adsorption, desorption, vaporisation and
sublimation. In addition, it can allow for the determination of chemical phenomena such
oxidations/reductions, chemisorptions, decompositions and dehydrations. TGA can be an
exceptionally useful tool for the characterisation of catalytic materials. A schematic
diagram of a typical TGA is displayed below.
Various modifications of TGA are available with additional equipment attached to enhance
its applications. TGA are often fitted with mass spectrometers which aid the determination
of the gasses lost.
Balance
Thermocouple Gas In
Gas Out
Heated
Filaments
Figure 2.7. A schematic diagram of a conventional TGA set-up

Chapter 2 | Experimental
63
Experimental
TGA was conducted using a Setram Labsys TGA/DTA instrument. Catalyst samples were
heated from 30 to 800 ºC under flowing air (15 mL min-1) at a heating rate of 10 ºC per
minute. The change in the mass of the catalyst was monitored with increasing temperature.
2.8. References
1. M. Haruta and M. Date, Applied Catalysis A-General, 2001, 222, 427.
2. A. Wolf and F. Schuth, Applied Catalysis A-General, 2002, 226, 1.
3. S. L. Chen, L. F. Luo, Z. Q. Jiang and W. X. Huang, ACS Catalysis, 2015, 5, 1653.
4. S. A. Kondrat, P. J. Miedziak, M. Douthwaite, G. L. Brett, T. E. Davies, D. J.
Morgan, J. K. Edwards, D. W. Knight, C. J. Kiely, S. H. Taylor and G. J. Hutchings,
Chemsuschem, 2014, 7, 1326.
5. J. A. Lopez-Sanchez, N. Dimitratos, P. Miedziak, E. Ntainjua, J. K. Edwards, D.
Morgan, A. F. Carley, R. Tiruvalam, C. J. Kiely and G. J. Hutchings, Physical
Chemistry Chemical Physics, 2008, 10, 1921.
6. N. Dimitratos, J. A. Lopez-Sanchez, D. Morgan, A. F. Carley, R. Tiruvalam, C. J.
Kiely, D. Bethell and G. J. Hutchings, Physical Chemistry Chemical Physics, 2009,
11, 5142.
7. F. Porta, L. Prati, M. Rossi, S. Coluccia and G. Martra, Catalysis Today, 2000, 61,
165.
8. I. Gandarias, P. J. Miedziak, E. Nowicka, M. Douthwaite, D. J. Morgan, G. J.
Hutchings and S. H. Taylor, Chemsuschem, 2015, 8, 473.
9. Q. He, P. J. Miedziak, L. Kesavan, N. Dimitratos, M. Sankar, J. A. Lopez-Sanchez,
M. M. Forde, J. K. Edwards, D. W. Knight, S. H. Taylor, C. J. Kiely and G. J.
Hutchings, Faraday Discussions, 2013, 162, 365.
10. G. L. Brett, Q. He, C. Hammond, P. J. Miedziak, N. Dimitratos, M. Sankar, A. A.
Herzing, M. Conte, J. A. Lopez-Sanchez, C. J. Kiely, D. W. Knight, S. H. Taylor
and G. J. Hutchings, Angewandte Chemie-International Edition, 2011, 50, 10136.

Chapter 2 | Experimental
64
11. M. Sankar, Q. He, M. Morad, J. Pritchard, S. J. Freakley, J. K. Edwards, S. H.
Taylor, D. J. Morgan, A. F. Carley, D. W. Knight, C. J. Kiely and G. J. Hutchings,
ACS Nano, 2012, 6, 6600.
12. F. R. Ma and M. A. Hanna, Bioresource Technology, 1999, 70, 1.
13. A. Bohre, S. Dutta, B. Saha and M. M. Abu-Omar, ACS Sustainable Chemistry &
Engineering, 2015, 3, 1263.
14. R. Redon, N. G. G. Pena and F. R. Crescencio, Recent Patents on Nanotechnology,
2014, 8, 31.
15. P. Atkins, W. and J. Paula, D., Oxford University Press, 6 edn., 2012.
16. W. Niemantsverdriet J, John Wiley & Sons, 3 edn., 2008.

65
3.1. Introduction
Glycerol is a C3 polyol produced as major co-product from the transesterification of 1st
generation bio-fuel feedstocks1. Each carbon atom is bound to a hydroxyl group which
gives it great potential for exploitation as a platform chemical. For this reason, the selective
oxidation of glycerol over heterogeneous catalysts has long been a subject of scientific
interest2, 3. It has been determined that the choice of catalyst4, the size of the metal
nanoparticles5 and the reaction conditions6, 7 can all significantly influence the selectivity
and the rate of the reaction.
Figure 3.1. A scheme detailing the products which can be formed from the oxidation of
glycerol. This scheme has been republished8 with permission from the RSC.
Chapter 3 The Selective Catalytic Oxidation of Glycerol

Chapter 3 | The Selective Catalytic Oxidation of Glycerol
66
Figure 3.1 shows the large distribution of products which can be formed from the oxidation
of glycerol. The application of heterogeneous catalysts for this process allows for an
additional avenue to control reaction selectivity. Prati and co-workers were the first to
demonstrate that supported Au catalysts were active for the selective oxidation of glycerol9.
Since then, it has been discovered that alloying Pd6, 10, 11 and Pt12, 13 into the supported Au
nanoparticles can significantly enhance catalytic performance. A number of different
products can be formed from the catalytic oxidation of glycerol. C3 products such as lactic
acid (LA), glyceric acid (GA) and tartronic acid (TA) are considered to be the most
desirable oxidation products, and as a consequence, avoiding C-C cleavage is crucial. It is
believed that this unfavourable cleavage is a result of the in-situ production of H2O2 from
the reduction of O2 by H2O on the catalysts surface14-16. The application of hydrophobic
materials as supports for the metal nanoparticles has been shown to reduce this
unfavourable cleavage4, 17.
It has been determined that the reaction conditions can significantly influence the product
selectivity and rate of the reaction. Increasing the reaction temperature has been found to
increase the C3 selectivity7, 18, 19. It was suggested that this was a result of the decreased
stability of H2O2 at elevated temperatures. Increasing the pH of the aqueous reaction
medium was also found to increase the C3 selectivity19. It was postulated that the observed
reduction in C-C cleavage was a result of the base facilitating the decomposition of H2O2.
In addition, the presence of a sacrificial base has also been found to increase the rate of the
reaction. It was proposed that the presence of base significantly increases the initial
deprotonation reaction to produce the corresponding alkoxide14. From an industrial
perspective, base free oxidation is more desirable as it reduces reagent costs and would not
require any additional purification steps. There have been a number of publications
investigating the oxidation of glycerol under base free conditions13, 20-22. It has not yet
however, been possible to replicate the high rates observed under basic reaction
conditions4. O2 is considered to play a pivotal role in the activation of the catalyst23
however it is also believed to be involved in the production of H2O2. Therefore as a result,
varying the O2 concentration could generate a trade-off between reaction rate and C3
product selectivity.
It is clear that there are two fundamental areas in the literature that require attention:
(i) Oxidation of glycerol under base free conditions

Chapter 3 | The Selective Catalytic Oxidation of Glycerol
67
(ii) Determination of the route(s) to the unfavourable C-C cleavage
The research in this chapter is focussed towards resolving these current issues.
3.2. Aims and Objectives of the Project
3.2.1. Objective
Investigate the role of Au supported heterogeneous catalysts for the selective oxidation of
glycerol. Emphasis is placed on the oxidation of the substrate under base free conditions
and for its selective oxidation to produce C3 products.
3.2.2. Aims
Assess how the experimental conditions affect the performance of a 1 wt.% AuPt/TiO2
catalyst for the selective oxidation of glycerol.
Develop a greater understanding of the reaction profile in the presence of a 1 wt.%
AuPt/TiO2 catalyst.
Investigate the oxidation of glycerol under base free conditions using mono-, bi- and
trimetallic heterogeneous catalysts containing Au, Pd and Pt.
Attempt to determine the factor(s) which lead to the unfavourable C-C cleavage.
Investigate whether modification of the catalyst can reduce this unfavourable
transformation.

Chapter 3 | The Selective Catalytic Oxidation of Glycerol
68
3.3. A Benchmark Catalyst for the Selective Oxidation of Glycerol
AuPt alloys have been found to be highly active for the oxidation of glycerol on a range of
different supports18, 24, 25. For this reason, a 1wt.% AuPt/TiO2 catalyst was prepared by the
conventional sol-immobilisation method26 using PVA as the stabiliser. The catalyst was
tested under standard reaction conditions and the corresponding reaction profile is
displayed in Figure 3.2.
Figure 3.2. Time online profile for the oxidation of glycerol over the 1 wt.% AuPt/TiO2
catalyst. Reaction conditions: 10 mL, glycerol (0.3 M), NaOH (0.6 M), substrate:metal
ratio = 2000, 60 ºC, 4 h.
The consumption of glycerol appears to be fairly controlled, the rate of which appears to
slow with its diminishing concentration. GA appears to be the favoured product across the
reaction. The selectivity towards TA gradually increases as the reaction proceeds with time
which is likely a result of the sequential oxidation of GA. It is thought that the formations
of all the above products proceed through either dihydroxy acetone (DHA) or
0
10
20
30
40
50
60
70
80
90
100
0 1 2 3 4
% C
onver
sion /
Sel
ecti
vit
y /
C.M
.B.
Time (h)
Conversion GA TA LA C1 and C2 C.M.B

Chapter 3 | The Selective Catalytic Oxidation of Glycerol
69
glyceraldehyde (GLAD), but these two products have never been observed when reactions
have been carried out in a basic reaction medium. The selectivity to LA and C-C cleavage
products appears to be at a peak at 0.25 h. This may suggest that the formation of these
products comes predominantly from the rapid base catalysed consumption of DHA and
GLAD. It is possible that the C-C cleavage is a result of GLAD undergoing Dakin
Oxidation. These reactions typically involve the elimination of a terminal carbonyl group
with an electron rich migrating group in the presence of H2O2 and base. It is possible that
the catalyst is acting as an electron rich sink, hereby allowing the Dakin Oxidation to
proceed. To my knowledge, the link between C-C cleavage and Dakin Oxidation has never
been made in the catalytic liquid phase oxidation of alcohols.
The 1 wt.% AuPt/TiO2 catalyst was subsequently characterised by XPS and the resulting
spectrum is displayed in Figure 3.3.
Figure 3.3. XPS spectrum of Au 4f and Pt 4f regions for the 1 wt.% AuPt/TiO2 catalyst.
The XPS spectra shown in Figure 3.3 suggests that Au and Pt are present in their metallic
states. This is typical of supported Au and Pt catalyst prepared by the sol-immobilisation

Chapter 3 | The Selective Catalytic Oxidation of Glycerol
70
technique13. The peaks at 83.2 and 87.1 eV correspond to the Au4f7/2 and Au4f5/2 species
associated with Au0. This is unusual as the Au4f7/2 peak associated with Au0 is typically
observed at a binding energy of 84.0 eV27. This downward shift in binding energy has
previously been observed with Au/TiO228 and was attributed to the interaction of metallic
Au clusters with surface Ti3+centres at defects in the TiO228, 29. Other studies have
suggested that the downward shift in binding energy is evidence of AuPt alloy structures30.
The evaluation of the Pt4f spectrum was difficult as the region was partially overlapped by
the Ti3s satellite peak31. Nevertheless, careful extraction of this peak allowed for the
determination of the peaks associated with the Pt0 state. The peaks associated with Pt4f7/2
and Pt4f5/2 were observed at binding energies of 71.0 and 74.4 eV and are typical of the
binding energies associated with Pt0 32, 33.
In order to investigate the metal loading of the catalyst, MP-AES analysis was conducted
to determine the metal loading of Au and Pt.
Table 3.1. The total metal loading and ratio of Au and Pt determined using MP-AES.
Total Metal Loading (%) Au (molar %) Pt (molar %)
AuPt/TiO2 0.77 54.06 45.94
The AES data (Table 3.1) confirms that the Au and Pt content in the catalyst is close to the
expected stoichiometry. The total metal loading is lower than the expected metal loading
which may be attributed to inefficient immobilisation of the metals to the support during
preparation. No TEM was conducted for this catalyst but this preparation method has
previously shown to produce well dispersed nanoparticles with well-defined particle
diameters between 2 and 5 nm13, 26.
As discussed in the introduction, the pH of the aqueous reaction mixture can significantly
influence the rate in which glycerol is consumed. It has been suggested that the presence
of surface-bound hydroxyl groups reduces the energy barrier required for the initial C-H
bond activation14. Table 3.2 shows how the incorporation of base into the system can affect
the performance of the AuPt/TiO2 catalyst in this reaction.

Chapter 3 | The Selective Catalytic Oxidation of Glycerol
71
Table 3.2 Glycerol oxidation under basic and base free conditions over the AuPt/TiO2
catalyst. Reaction conditions: 10 mL, glycerol (0.3 M), NaOH equivalents stated, O2 (3
bar), substrate:metal ratio = 2000, 60 ºC, 4 h.
NaOH
Equivalents
Time
(h)
Con
(%)
Selectivity (%) C.M.B.
(%) GA GLAD TA LA DHA GLA OA FOA
2
0.25 17 61 0 3 17 0 10 1 9 100
0.5 33 61 0 3 18 0 9 1 9 96
1 73 62 0 5 16 0 8 1 8 86
2 96 61 0 10 14 0 8 1 7 81
4 100 62 0 12 14 0 8 1 2 79
0
0.25 1 10 4 1 0 79 2 5 0 100
0.5 1 9 5 2 0 73 3 9 0 99
1 1 11 7 3 0 67 5 6 0 102
2 2 17 11 5 0 45 15 8 0 99
4 3 13 11 3 0 35 11 5 23 99
As anticipated, the catalytic activity decreases significantly under base free conditions.
Furthermore, the selectivity profile is changed. This is a good example of how the reaction
is sensitive to environmental conditions in which it occurs. In order to develop a greater
understanding on how the experimental conditions effect the performance of the AuPt/TiO2
catalyst, parameter mapping experiments need to be conducted.
In order to gain a greater insight into the role of base in this reaction, further tests were
conducted using 0.5, 1, 2 and 4 equivalents of NaOH. The results are shown in Table 3.3.
Interestingly, the NaOH concentration appears to have a non-linear relationship with
substrate conversion. An increase in the catalytic turnover is observed as the NaOH
concentration increases up to two molar equivalents. A decrease in conversion is
subsequently observed at four molar equivalents. This relationship between conversion and
NaOH can be explained by the product distribution.
An increase in LA selectivity and a decrease in selectivity to C1 and C2 products is observed
as the concentration of NaOH is increased. Increasing the hydroxyl concentration appears
to inhibit either the formation of H2O2, or its interaction with the substrate species. It has

Chapter 3 | The Selective Catalytic Oxidation of Glycerol
72
been suggested previously that C-C cleavage occurs as a result of the in-situ formation of
H2O216. It has also been reported that increasing the pH of the aqueous phase promotes the
decomposition of H2O219. It is therefore feasible to suggest that the decrease in C-C
cleavage is a result of the base promoted decomposition of H2O2. The reduction in the
levels of H2O2 in the aqueous phase may be the reason why the substrate conversion
decreases at higher concentrations of NaOH. If this is true, it can be postulated that a
proportional relationship exists between H2O2 concentration and catalytic activity.
Table 3.3. Glycerol oxidation over the AuPt/TiO2 catalyst. The effect of NaOH
concentration on catalyst performance is assessed. Reaction conditions: 10 mL, glycerol
(0.3 M), NaOH equivalents stated, O2 (3 bar), substrate:metal ratio = 2000, 60 ºC, 4 h.
The mechanistic route to form LA from glycerol is somewhat unclear. It has long been
known that base can promote the dehydration-rearrangement-rehydration of polyols to
produce LA34. A likely route involves the initial oxidative dehydrogenation of a terminal
alcohol group to form GLAD. This would then be followed by a dehydration step and
NaOH
Equivalents
Time
(h)
Con
(%)
Selectivity (%) C.M.B.
(%) GA TA LA GLA OA FOA
0.5
0.25 16 51 5 9 21 1 12 96
0.5 23 53 5 9 19 2 12 94
1 26 69 7 3 14 2 5 91
2 32 72 6 2 14 2 4 88
4 42 63 6 4 14 2 12 94
1
0.25 12 59 3 10 15 1 12 95
0.5 23 60 4 9 14 1 13 96
1 29 69 6 2 14 2 8 83
2 50 70 6 5 14 2 3 81
4 58 71 6 5 15 2 1 82
2
0.25 17 61 3 17 10 1 9 100
0.5 33 61 3 18 9 1 9 96
1 73 62 5 16 8 1 8 86
2 96 61 10 14 8 1 7 81
4 100 62 12 14 8 1 2 79
4
0.25 7 55 4 41 0 0 0 94
0.5 16 49 4 43 0 4 0 93
1 40 45 4 45 2 1 3 93
2 87 42 9 45 2 1 3 82
4 100 14 37 45 2 2 2 81

Chapter 3 | The Selective Catalytic Oxidation of Glycerol
73
possibly a rearrangement to form LA. It is known that under reaction conditions GLAD
and DHA are equilibrium35, 36. For this reason, it is difficult to assess which of these
intermediates undergoes the dehydration. A recent article by Crabtree and co-workers
propose a different mechanistic route37. They suggest that a terminal alcohol group of
GLAD is dehydrated to form 2-hydroxyacrylaldehyde. This compound subsequently
undergoes oxidation to produce methylglyoxal which can then be consumed via a base
promoted intermolecular Cannizzaro reaction to produce LA. It is clear that increasing the
NaOH concentration increases the production of LA and it could therefore be postulated
that external hydroxyl groups play a pivotal role in the dehydration of either DHA or
GLAD. This would explain the poor LA selectivity observed for the oxidation of glycerol
under base free conditions38, 39.
LA selectivity appears to have a proportional relationship with C3 selectivity. This suggests
that LA is stable under reaction conditions and that the parallel oxidation reaction which
leads to the formation of GA and TA must therefore facilitate the unfavourable C-C
0
5
10
15
20
25
30
35
40
45
50
0 1 2 3 4
LA
. S
el (
%)
/ C
-C S
ciss
ion (
%)
NaOH : Glycerol Ratio
LA Selectivity (%) C-C Scission (%)
Figure 3.4. LA selectivity appears to have an inversely proportional relationship with C-C
scission. Both are clearly influenced by the NaOH : glycerol ratio.

Chapter 3 | The Selective Catalytic Oxidation of Glycerol
74
cleavages. The relationship between C-C scission and LA selectivity is demonstrated in
Figure 3.4.
The role of oxygen in the catalytic oxidation of glycerol has also been discussed in detail
in the literature19, 23. In order to investigate the effect of O2 pressure on the AuPt/TiO2
catalyst, a series of tests were conducted where the pressure of O2 was varied in the reactor.
Table 3.4. The effect of the O2 pressure on the oxidation of glycerol over the AuPt/TiO2
catalyst under standard reaction conditions is assessed. Reaction conditions: 10 mL,
glycerol (0.3 M), NaOH:substrate = 2, O2 (pressure stated), substrate:metal ratio = 2000,
60 ºC, 4 h. He corresponds to reaction conducted under 3 bar He).
O2 Pressure
(bar)
Time
(h)
Con
(%)
Selectivity (%) C.M.B.
(%) GA TA LA GLA OA FOA
He
0.25 1 46 0 54 0 0 0 100
0.5 1 40 0 60 0 0 0 100
1 2 12 1 27 8 7 46 102
2 2 11 1 40 10 6 32 102
4 2 9 1 47 11 5 26 99
1
0.25 9 46 2 50 0 1 4 98
0.5 17 47 3 46 0 1 4 97
1 34 43 3 49 2 1 4 96
2 70 48 4 43 2 0 2 93
4 100 48 11 36 2 1 3 92
2
0.25 10 53 1 26 10 1 10 99
0.5 16 56 2 24 8 1 9 100
1 43 54 3 30 6 1 7 98
2 90 59 5 26 5 1 5 101
4 98 57 9 24 5 1 5 105
3
0.25 17 61 3 17 10 1 9 100
0.5 33 61 3 18 9 1 9 96
1 73 62 5 16 8 1 8 86
2 96 61 10 14 8 1 7 81
4 100 62 12 14 8 1 2 79
It is evident from Table 3.4 that oxygen has a substantial impact on the performance of the
catalyst in this reaction. As oxygen pressure is increased, the conversion significantly

Chapter 3 | The Selective Catalytic Oxidation of Glycerol
75
increases. This proportional relationship between catalyst turnover and O2 pressure is
typical of oxidation reactions catalysed by heterogeneous catalysts23.
The O2 pressure also appears to have a significant impact on the selectivity profile of the
reaction. There is a noticeable increase in C2 and C1 products with increasing O2 pressure,
particularly in the final stages of the reaction. As discussed previously, H2O2 is a product
of the reduction of O2 by H2O15. It is therefore likely that increasing the oxygen pressure
may be promoting the production of H2O2 in the reaction. Additionally, the selectivity to
GA and LA increase and decrease respectively as the pressure is increased. This suggests
that oxygen may be inhibiting the LA pathway through the promotion of the competitive
direct oxidation pathway.
Under anaerobic conditions, the catalyst still appears to be active. This could suggest that
oxygen from the support or oxygen from the base can also take part in reaction.
50
55
60
65
70
75
80
85
90
95
100
0 1 2 3 4
(%)
Sel
ecti
vit
y
O2 Pressure (Bar)
GA & TA C3
Figure 3.5. The selectivity to GA and TA increases with increasing O2 pressure. In addition,
the unfavourable C-C scission appears to have a proportional relationship with O2 pressure.
Data points reflect samples taken after 4 h of reaction.

Chapter 3 | The Selective Catalytic Oxidation of Glycerol
76
Interestingly, products formed from C-C cleavages are still observed under anaerobic
conditions. This could imply that H2O2 is not only produced from the reduction of O2 by
H2O or that there is an additional mechanistic route which can result in C-C scission. It is
very possible that the C3 acid species may undergo decarboxylation leading to the formation
of a C2 species and CO2.
Increasing the reaction temperature for the oxidation of glycerol has previously shown to
not only promote catalytic activity, but also increase the selectivity to GA in the presence
of supported Au containing catalysts7, 18, 19. For this reason, it was necessary to assess the
effect temperature had on the performance of the 1% AuPt/TiO2 catalyst for this reaction.
The results of these tests are displayed in Table 3.5.
Table 3.4. The effect of reaction temperature on the oxidation of glycerol over the
AuPt/TiO2. Reaction conditions: 10 mL, glycerol (0.3 M), NaOH:substrate = 2, O2 (3 bar),
substrate:metal ratio = 2000, temperature stated, 4 h.
Temperature
(ºC)
Time
(h)
Con
(%)
Selectivity (%) C.M.B.
(%) GA TA LA GLA OA FOA
40
0.25 12 60 3 9 16 1 12 102
0.5 26 60 3 8 16 1 12 99
1 53 62 4 8 14 1 10 97
2 96 63 9 6 12 2 8 87
4 99 64 11 6 12 2 5 85
60
0.25 17 61 3 17 10 1 9 100
0.5 33 61 3 18 9 1 9 96
1 73 62 5 16 8 1 8 86
2 96 61 10 14 8 1 7 81
4 100 62 12 14 8 1 2 79
80
0.25 14 52 2 36 4 1 5 95
0.5 27 49 2 40 4 0 6 90
1 59 49 3 38 4 0 6 91
2 96 49 11 33 4 1 3 77
4 100 46 14 34 4 1 1 76
100
0.25 29 29 1 67 2 0 1 97
0.5 55 28 2 64 2 1 3 93
1 100 29 7 57 2 1 5 81
2 100 21 14 57 2 2 4 84
4 100 16 18 57 2 3 4 91

Chapter 3 | The Selective Catalytic Oxidation of Glycerol
77
As expected, there is a proportional relationship between glycerol conversion and reaction
temperature. This trend can be explained by fundamental collision theory. Interestingly,
substantial changes in the product selectivity is observed as the reaction temperature is
increased. A proportional relationship between the temperature and C3 selectivity is
observed despite the selectivity to GA and TA decreasing. The increase in C3 selectivity
can be explained by the instability of H2O2 at elevated temperatures. There is also a
substantial increase in selectivity to LA observed. Increasing the reaction temperature may
promote the dehydration of a terminal alcohol group; believed to be key step in the
formation of LA from glycerol. This is also further evidence to suggest that LA is
reasonably stable in the reaction medium and that LA is less prone to decarboxylation than
the other C3 organic acids.
0
10
20
30
40
50
60
20 40 60 80 100
(%)
Sel
ecti
vit
y
Temperature ( ºC)
LA
C-C Scission
Figure 3.6. C-C scission decreases as LA selectivity increases as the reaction temperature
is increased. High temperatures may facilitate the dehydration of terminal alcohols and
promote H2O2 decomposition. Data points reflect samples taken after 4 h.

Chapter 3 | The Selective Catalytic Oxidation of Glycerol
78
From the parameter mapping experiments it is clear that the reaction conditions can have a
substantial impact on the performance of the AuPt/TiO2 for the oxidation of glycerol. A
greater understanding of the promotional effects affecting the different reaction pathways
has been established. The knowledge acquired from this investigation will act as a
foundation moving forward.
3.4. A Mechanistic Overview of the Reaction Profile
In order promote desirable reaction selectivity, it is important to consider how the reaction
products are effected by the catalyst and the reaction conditions. For this reason, a series
of tests were constructed where the major products from the oxidation of glycerol were
used as the reaction substrates. These tests were conducted in order to assess how they were
affected by the catalyst under reaction conditions in a basic and base free reaction medium.
Once again, a 1 wt.% AuPt/TiO2 catalyst prepared by conventional sol-immobilisation was
used as the standard catalyst. XPS and MP-AES was conducted on the catalyst to ensure
its reproducibility.
Figure 3.7. XPS spectrum of Au 4f and Pt 4f regions for the 1 wt.% AuPt/TiO2 catalyst.

Chapter 3 | The Selective Catalytic Oxidation of Glycerol
79
The XPS spectra in Figure 3.7 shows that both the Au and Pt is present in their metallic
state. The Au 4f7/2 and 4f5/2 peaks are observed at binding energies of 83.25 and 87.0 eV.
Once again the Au peaks appear at a slightly lower binding energy than expected27. This
could be a result of the Au nanoparticles interacting with defect sites in the Ti28 or indicate
that AuPt alloy structures are present30. The Pt 4f7/2 and 4f5/2 peaks observed at binding
energies of 71.1 and 74.2 eV respectively are characteristic of Pt0 states32, 33. The catalyst
was subsequently assessed for its metal loading by MP-AES and the results are displayed
in Table 3.6.
Table 3.6. The total metal loading and ratio of Au and Pt is determined using MP-AES
Total Metal Loading (%) Au (molar %) Pt (molar %)
1% AuPt/TiO2 0.81 52.36 47.64
Once again, the total metal loading was lower than expected but was consistent with the
catalyst prepared in Section 3.3. The first group of experiments were designed to assess the
reactivity of each product under basic reaction conditions and in the presence of the 1 wt%.
AuPt/TiO2 catalyst. The results from these tests are displayed in Table 3.7.
Under the standard reaction conditions, DHA and GLAD appear to be consumed
immediately, with no traces of the two compounds observed after 0.5 h of reaction. To my
knowledge, no previous studies which have investigated the oxidation of glycerol in a basic
reaction medium have reported observing either of these compounds. Various publications
reporting the oxidation of glycerol under base free conditions have observed both GLAD
and DHA 4, 12, 39, 40. This suggests that in the presence of base, these two products
immediately react in a base catalysed transformation. It is known that the two compounds
are in equilibrium, leaving either the primary or secondary alcohol prone to nucleophilic
attack. Their selectivity profiles after reaction completion are similar, with the DHA
favouring the formation of LA as opposed to the direct oxidation pathway.
There is also significantly less C3 products formed from the oxidation of these two products
when compared with the oxidation of glycerol. It is possible that the sudden transformation

Chapter 3 | The Selective Catalytic Oxidation of Glycerol
80
of these species in solution may make them susceptible to homogeneous intermolecular
interactions, resulting in C-C cleavage. The low C.M.B.’s observed from the oxidation of
these species suggest that there may be additional unidentified products formed. The fact
that similar reaction profiles aren’t observed for the oxidation of glycerol could suggest
that LA and GA are primary oxidation products. Aldol type reactions between GLAD or
DHA and an additional unsaturated product could be occurring which would lead to the
formation of C5 and even C6 compounds. For this reason, even if small quantities of the
substrate and/or product(s) took part in these reaction it may account for a substantial
quantity of the missing carbon.
Table 3.7. Products formed from oxidation of glycerol were used as substrates and their
reactivity was assessed under standard reaction conditions in the presence of a AuPt/TiO2
catalyst. TOF’s are calculated at 0.5 h and conversion, selectivity and mass balance data
reflects samples after 4 h of reaction. Reaction conditions: 10 mL, substrate (0.3 M),
NaOH:substrate = 2, O2 (3 bar), substrate:metal ratio = 2000, 60 ºC 4 h.
When GA is used as the substrate, an unexpected result is observed. Significant quantities
of TA were observed when glycerol was used as the substrate. On the contrary, an
exceptionally small TOF and overall conversion is observed, with selectivity favouring the
production of C2 and C1 compounds. The GA precursor used for these tests was a hemi
calcium salt; perhaps the presence of Ca in the reaction medium had a negative impact on
the performance of the catalyst. Davis and co-workers have reported a similar observation
when they looked into the oxidation of 0.05 M solution of GA over Au/TiO216. Davis
postulated that in order to continue with the subsequent oxidation to TA, the primary
alcohol group needs to be activated by an external hydroxyl group. However, as the
TOF
(h-1)
Con
(%)
Selectivity (%) C.M.B.
(%) GLY DHA GLAD LA GA TA GLA OA FOA
GLY 1649 100 X 0 0 14 62 12 8 1 2 79
DHA 4938 100 0 X 0 37 33 4 7 1 17 47
GLAD 4938 100 0 0 X 29 31 11 13 3 13 57
LA 0 0 0 0 0 X 0 0 0 0 0 100
GA 89 8 0 0 0 0 X 9 24 21 46 93
TA 0 0 0 0 0 0 0 X 0 0 0 100
GLA 79 9 0 0 0 0 0 0 X 100 0 101
OA 0 0 0 0 0 0 0 0 0 X 0 100
FOA 138 17 0 0 0 0 0 0 0 0 X 84

Chapter 3 | The Selective Catalytic Oxidation of Glycerol
81
carboxylic acid group is far more acidic than the terminal alcohol, it inhibits the
deprotonation of the alcohol. Another possible explanation for the poor activity observed
is that TA may be a primary oxidation product.
The GO appeared to oxidise to OA in a fairly controlled fashion but at a low rate which
can also be explained by Davis’ theory. FOA is also consumed under these reaction
conditions. Previous electrochemical studies have suggested that the oxidation of glycerol
can lead to the formation of CO241, 42. No conversion was observed when OA, TA and LA
were used as the substrates.
The next group of experiments assessed the reactivity of each product under base free
conditions and in the presence of the AuPt/TiO2 catalyst. The results from these tests are
displayed in Table 3.8.
Table 3.8. Products formed from the oxidation of glycerol were used as substrates and their
reactivity was assessed under base free conditions in the presence of the AuPt/TiO2
catalyst. TOF’s are calculated at 0.5 h and conversion, selectivity and mass balance data
reflects samples after 4 h of reaction. Reaction conditions: 10 mL, substrate (0.3 M), O2
(3 bar), substrate:metal ratio = 2000, 60 ºC 4 h.
TOF
(h-1)
Con
(%)
Selectivity (%) C.M.B.
(%) GLY DHA GLAD LA GA TA GLA OA FOA
GLY 35 3 X 35 11 0 13 3 11 5 23 99
DHA 128 9 0 X 0 0 0 12 70 18 0 92
GLAD 316 34 0 0 X 0 99 0 0 0 0 100
LA 0 0 0 0 0 X 0 0 0 0 0 100
GA 84 4 0 0 0 0 X 70 20 5 5 96
TA 0 0 0 0 0 0 0 X 0 0 0 100
GLA 0 0 0 0 0 0 0 0 X 0 0 100
OA 509 72 0 0 0 0 0 0 0 X 0 28
FOA 0 0 0 0 0 0 0 0 0 0 X 100
From the TOF’s displayed in Table 3.8, it appears GLAD is more easily consumed than
DHA under base free conditions. The oxidation of GLAD to GA appears to proceed in an
exceptionally controlled fashion as a selectivity close to 100 % is observed. On the
contrary, the oxidation of DHA appears to proceed via a different mechanistic pathway.

Chapter 3 | The Selective Catalytic Oxidation of Glycerol
82
TA and other sequential oxidation products are observed, but no GA is present. Katryniok
et al.8 proposed that TA can be formed from DHA via hydroxypyruvaldehyde and
hydroxymalone intermediate species. This would explain the absence of GA in the reaction
solution. The large quantities of GO and OA observed also support this theory, as it was
suggested that glycolaldehyde can be formed from these two intermediates. Furthermore,
it is postulated that OA can be formed from the oxidative decarbonylation of 2-hydroxy-3-
oxo-propanoic acid 8. The presence of these additional products and intermediates would
account for the poor carbon mass balance observed for the oxidation of DHA. A lack of
external hydroxyl groups appears to shut off the pathway to LA, providing further evidence
that homogeneous hydroxyl groups are essential for the dehydration of primary alcohols in
this reaction.
Once again, extremely poor GA consumption is observed. As mentioned previously, the
terminal alcohol of the GA requires activation from an external hydroxyl group16. It is
likely that the absence of NaOH in the reaction would make this even more unfavourable.
However, the TOF for GA in the presence and absence of NaOH is comparable, which
underlines the negative impact the acidity of the carboxylic acid is having on the activation
of the remaining primary alcohol group. TA appears to be stable under these conditions
which indicates that C-C cleavage must occur prior to TA formation. LA, GO, and FOA
also appear to be stable under these reaction conditions. OA is consumed at a fairly high
rate which could be attributed to the sequential oxidation to other C1 derivatives.
The last set of experiments were constructed to assess the reactivity of each product in a
basic environment and in the absence of a catalyst. The results from these experiments are
displayed in Table 3.9.
In the absence of a catalyst; glycerol, LA, TA, GO, OA and FOA all appear to be stable
under the standard reaction conditions. This underlines the important role of the catalyst in
the oxidation of these compounds. It also suggests that the catalyst is responsible for the
over oxidation of products, and that these unfavourable reactions can be inhibited through
the development of catalyst design. Once again, small quantities of GA are consumed,
predominantly undergoing C-C cleavage to produce C1 and C2 products. This could suggest
that the catalyst is not essential for the production of H2O2 or that there are additional
homogeneous pathways which can lead to the unfavourable C-C scission such as the
possibility of decarboxylation reactions, as discussed previously.

Chapter 3 | The Selective Catalytic Oxidation of Glycerol
83
Table 3.9. Products formed from the oxidation of glycerol were used as substrates and their
reactivity was assessed under basic condition and in the absence of a catalyst. TOF’s are
calculated at 0.5 h and conversion, selectivity and mass balance data reflects samples after
4 h of reaction. Reaction conditions: 10 mL, substrate (0.3 M), O2 (3 bar), NaOH:substrate
= 2, 60 ºC, 4 h.
The TOFs of GLAD and DHA are identical to those observed under standard conditions.
It appears as though the catalyst has very little impact on the reaction selectivity associated
with the oxidation of both DHA and GLAD. Slightly more C-C cleavage is observed in the
absence of catalyst suggesting that the catalyst provides an element of control to the system.
Furthermore, both DHA and GLAD have very similar selectivity profiles, suggesting that
the two molecules can readily interconvert under these reaction conditions. DHA slightly
favours the production of LA where oxidation to TA appears to be more favourable from
GLAD.
These tests have revealed how complex this reaction is. The catalyst and environmental
conditions can affect the reaction intermediates in different ways, adding further
complexities when trying to control the product selectivity. The substantial losses in carbon
from some species suggest that there may be additional products being produced which are
not accounted for. The tests also indicate that there could be multiple catalytic pathways
for the production of the same products. Nevertheless, the oxidation of glycerol under base
free conditions does appear to be possible with a high selectivity to C3 products. As a result,
this research appears to be promising moving forward.
TOF
(h-1)
Con
(%)
Selectivity (%) C.M.B.
(%) GLY DHA GLAD LA GA TA GLA OA FOA
GLY 0 0 X 0 0 0 0 0 0 0 0 100
DHA 4938 100 0 X 0 38.7 26.6 2.7 9.7 1.8 20.4 51.1
GLAD 4938 100 0 0 X 17.6 34.7 2 19.8 0.8 25.1 52.3
LA 0 0 0 0 0 X 0 0 0 0 0 100
GA 54.3 6.4 0 0 0 0 X 5.5 22.6 16.7 55.1 100.5
TA 0 0 0 0 0 0 0 X 0 0 0 100
GLA 14.8 1 0 0 0 0 0 0 X 0 0 99.7
OA 0 0 0 0 0 0 0 0 0 X 0 100
FOA 0 0 0 0 0 0 0 0 0 0 X 100

Chapter 3 | The Selective Catalytic Oxidation of Glycerol
84
Figure 3.8. The reaction selectivity and carbon mass balances are compared for the
oxidation of GLAD and DHA under standard conditions (STD) and in the absence of any
catalyst (NC). These figures correspond to the reaction after 4 h. GD corresponds to
glyceraldehyde. Reaction conditions: 10 mL, substrate (0.3 M), O2 (3 bar),
NaOH:substrate = 2, 60 ºC, 4 h.
3.5. Base Free Oxidation of Glycerol
The ability to selectively oxidise glycerol under base free conditions enhances the potential
for the industrialisation of this reaction. For this reason, there has been a lot of development
in this area of research in recent times13, 22, 38, 40. Supported platinum catalysts have shown
to be fairly active under base free conditions but are also believed to promote the
unfavourable C-C scission39. Prati and co-workers demonstrated that gold containing
catalysts were inactive for this process in the absence of sacrificial base43. On the contrary,
AuPt catalysts supported on Mg(OH)2 have proven to be active, highlighting the
importance in the selection of the support and metal nanoparticles13. Irrespective of this, it
was stated that small amounts of Mg2+ leached from the support forming homogeneous
Mg(OH)2, which could account for the high activity observed.
0
10
20
30
40
50
60
70
LA GA TA GO OA FA C.M.B.
% S
elec
tivit
y /
C.M
.B
DHA(STD) DHA(NC) GD (STD) GD (NC)
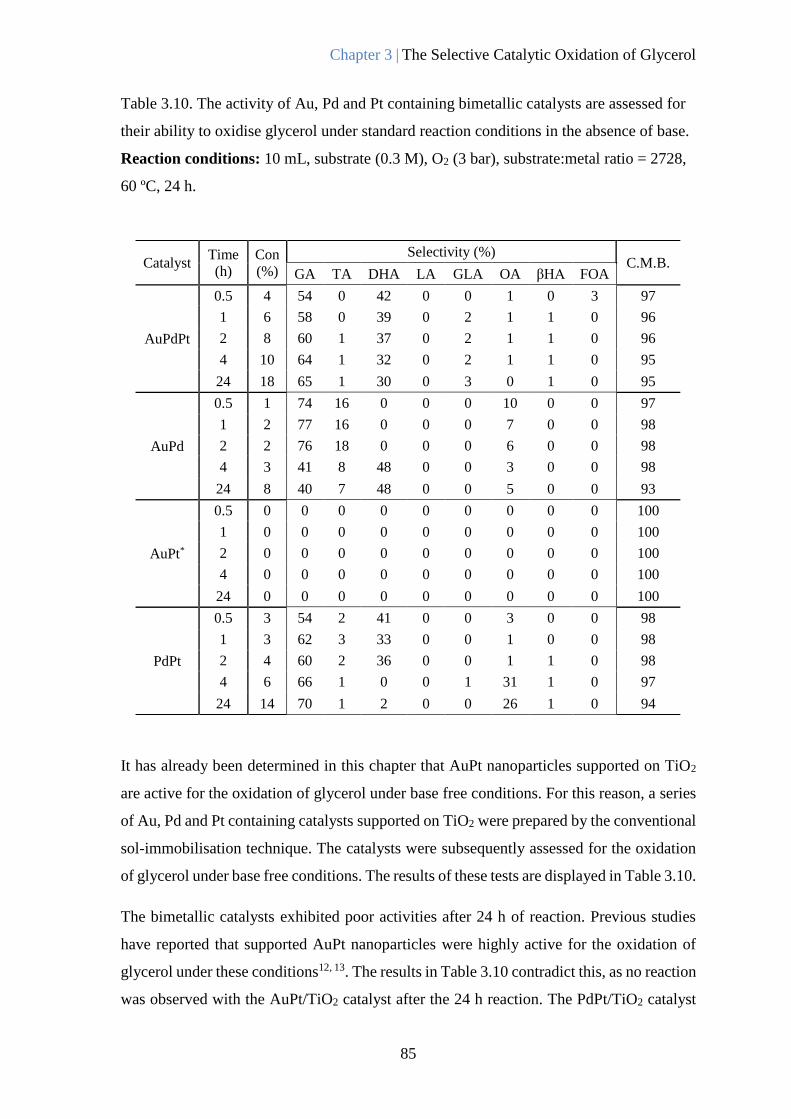
Chapter 3 | The Selective Catalytic Oxidation of Glycerol
85
Table 3.10. The activity of Au, Pd and Pt containing bimetallic catalysts are assessed for
their ability to oxidise glycerol under standard reaction conditions in the absence of base.
Reaction conditions: 10 mL, substrate (0.3 M), O2 (3 bar), substrate:metal ratio = 2728,
60 ºC, 24 h.
It has already been determined in this chapter that AuPt nanoparticles supported on TiO2
are active for the oxidation of glycerol under base free conditions. For this reason, a series
of Au, Pd and Pt containing catalysts supported on TiO2 were prepared by the conventional
sol-immobilisation technique. The catalysts were subsequently assessed for the oxidation
of glycerol under base free conditions. The results of these tests are displayed in Table 3.10.
The bimetallic catalysts exhibited poor activities after 24 h of reaction. Previous studies
have reported that supported AuPt nanoparticles were highly active for the oxidation of
glycerol under these conditions12, 13. The results in Table 3.10 contradict this, as no reaction
was observed with the AuPt/TiO2 catalyst after the 24 h reaction. The PdPt/TiO2 catalyst
Catalyst Time
(h)
Con
(%)
Selectivity (%) C.M.B.
GA TA DHA LA GLA OA βHA FOA
AuPdPt
0.5 4 54 0 42 0 0 1 0 3 97
1 6 58 0 39 0 2 1 1 0 96
2 8 60 1 37 0 2 1 1 0 96
4 10 64 1 32 0 2 1 1 0 95
24 18 65 1 30 0 3 0 1 0 95
AuPd
0.5 1 74 16 0 0 0 10 0 0 97
1 2 77 16 0 0 0 7 0 0 98
2 2 76 18 0 0 0 6 0 0 98
4 3 41 8 48 0 0 3 0 0 98
24 8 40 7 48 0 0 5 0 0 93
AuPt*
0.5 0 0 0 0 0 0 0 0 0 100
1 0 0 0 0 0 0 0 0 0 100
2 0 0 0 0 0 0 0 0 0 100
4 0 0 0 0 0 0 0 0 0 100
24 0 0 0 0 0 0 0 0 0 100
PdPt
0.5 3 54 2 41 0 0 3 0 0 98
1 3 62 3 33 0 0 1 0 0 98
2 4 60 2 36 0 0 1 1 0 98
4 6 66 1 0 0 1 31 1 0 97
24 14 70 1 2 0 0 26 1 0 94

Chapter 3 | The Selective Catalytic Oxidation of Glycerol
86
appeared to be the most active, with 13.8 % of the substrate being consumed after 24 h. It’s
possible that Au may be inhibiting the performance of the catalysts in some way.
Table 3.11. The activity of Au, Pd and Pt containing bimetallic catalysts are assessed for
their ability to oxidise glycerol at 100 ºC and in the absence of base. Reaction conditions:
10 mL, substrate (0.3 M), O2 (3 bar), substrate:metal ratio = 2728, 100 ºC, 4 h.
Catalyst Time
(h)
Con
(%)
Selectivity (%) C.M.B
(%) GA TA GLA LA OA DHA βHA FOA
AuPdPt
0.5 9 55 1 3 0 0 39 1 1 97
1 18 56 1 3 0 0 38 2 0 93
2 22 56 1 5 0 0 36 2 0 95
4 37 55 2 7 0 0 35 1 1 87
AuPd
0.5 0 50 0 0 0 3 47 0 0 100
1 1 42 0 0 0 0 58 0 0 100
2 4 34 1 8 0 0 56 1 0 99
4 8 30 1 10 0 0 58 1 0 97
AuPt*
0.5 0 0 0 0 0 0 0 0 0 100
1 0 0 0 0 0 0 0 0 0 100
2 0 0 0 0 0 0 0 0 0 100
4 0 0 0 0 0 0 0 0 0 100
PdPt
0.5 4 61 1 0 0 0 37 1 0 100
1 12 63 1 0 0 0 34 2 0 96
2 29 63 1 4 0 0 31 2 0 87
4 39 64 1 6 0 0 28 1 0 83
The AuPd/TiO2 catalyst was found to give the highest C3 selectivity. Supported Pt
monometallic catalysts have previously been found to facilitate C-C cleavage. The higher
C1 and C2 selectivity of the PdPt/TiO2 could indicate that monometallic Pt islands are
present on the surface of the catalyst. Interestingly, a recent study found that the addition
of small amounts of Pt to supported clusters of AuPd supressed the hydrogenation and
decomposition of H2O244. H2O2 is believed to be directly responsible for C-C cleavage in
the selective oxidation of glycerol15. It is possible that the Pt is stabilising the H2O2 formed
in the reaction, and as a result, is indirectly responsible for the increased C-C scission
observed with the PdPt/TiO2 catalyst. The trimetallic AuPdPt/TiO2 catalyst displayed the
highest overall activity and maintained a good degree of C3 selectivity; 96 % selectivity at

Chapter 3 | The Selective Catalytic Oxidation of Glycerol
87
18 % conversion. The Au may facilitate the alloying of the three metals, which would
reduce the quantity of monodispersed Pt on the surface of the catalyst.
In order to gain a greater understanding of how these catalysts function, further tests were
conducted under base free conditions at 100 ºC. The results from these tests are displayed
in Table 3.11. Even at elevated temperatures, poor activities were observed for the
AuPt/TiO2 and AuPd/TiO2 catalysts. On the contrary, a significant increase in activity was
observed for the PdPt/TiO2 and tri-metallic AuPdPt/TiO2 catalysts, which displayed
conversions of 39.3 and 36.9 % respectively. Interestingly, a significant reduction in C-C
scission was observed with the PdPt/TiO2 catalyst and a C3 selectivity comparable with the
AuPd/TiO2 catalyst was detected. It has been previously determined that increasing the
reaction temperature can enhance the C3 selectivity of a catalyst19. It was postulated that
this was a result of decreasing H2O2 stability as temperature is increased. This may be the
reason why a higher C3 selectivity is observed at 100 ºC than 60 ºC. A higher C3 selectivity
was also observed with the AuPdPt/TiO2 catalyst at an increased reaction
Once again, no conversion was observed with the AuPt/TiO2 catalyst. In order to gain a
greater understanding as to why this catalyst is not active, MP-AES was used to determine
the specific weight loadings of each catalyst. These results are displayed in Table 3.12.
Table 3.12. The metal weight loadings of each catalyst were determined by MP-AES.
It is clear that the metal weight loadings are not consistent across the series of catalysts.
The PdPt/TiO2 and AuPdPt/TiO2 catalysts appear to be close to the target metal loading of
1 wt.%, whereas the AuPd and AuPt/TiO2 catalysts appear to have significantly lower metal
loadings than anticipated. This data immediately explains why there is such a considerable
different in activity exhibited by the two sets of catalysts. Furthermore, there appears to be
discrepancies in the molar ratios between the metals. All the catalysts were prepared with
Catalyst Total metal
loading (%)
Metal loading (molar %) Adjusted Metal
ratios* Au Pd Pt
AuPd/TiO2 0.31 29.3 70.7 - 1:2 (Au:Pd)
PdPt/TiO2 0.96 - 45.4 54.6 1:1 (PdPt)
AuPt/TiO2 0.17 31.0 - 69.0 1:2 (AuPt)
AuPdPt/TiO2 0.92 23.4 29.4 47.2 1:1:2 (Au:Pd:Pt)

Chapter 3 | The Selective Catalytic Oxidation of Glycerol
88
an intended total weight loading of 1 % with equimolar ratios between the metals.
Nevertheless, the catalysts can still provide an insight into the activity and selectivity
requirements for the base free oxidation of glycerol. Due to the significant differences in
metal loadings between the catalysts, it is difficult to compare their performance directly
from the reaction results. It seems more appropriate to assess them in term of their TOF as
this accounts for the moles of metal involved.
Table 3.13. The Turnover frequencies for the bi- and trimetallic catalysts were determined
at 60 ºC and 100 ºC. The initial rate measurement was conducted after 0.5 h.
Catalyst
TOF (h-1) at 0.5 h reaction time
60 °C reaction
temperature
100 °C reaction
temperature
AuPd/TiO2 86 38
PdPt/TiO2 152 210
AuPt/TiO2 - -
AuPdPt/TiO2 174 378
The turnover frequencies for each of the corresponding catalysts revealed that the
trimetallic AuPdPt/TiO2 catalyst is the most active. This increase in activity is could
indicate that a synergistic interaction between the three metals is observed. Interestingly,
there was a decrease in the TOF for the AuPd/TiO2 catalyst when the temperature was
increased from 60 ºC to 100 ºC. This could be a result of an increase in sintering of the
AuPd nanoparticles at higher reaction temperatures.
The fresh catalysts were subsequently characterised by TEM. The images received and the
corresponding particle size distributions (PSDs) are displayed in figure 3.9. The
AuPd/TiO2, PdPt/TiO2 and AuPdPt/TiO2 catalysts all consisted of small nanoparticles with
mean particle sizes ranging from 2.0 to 2.3 nm. The AuPt/TiO2 catalyst however, consisted
of unusually small nanoparticles with an exceptionally narrow PSD; 1.19 nm average
particle size with a standard deviation from the mean particle size of 0.37 nm. It is likely
that the small well defined PSD observed for this catalyst is a result of its low metal loading.

Chapter 3 | The Selective Catalytic Oxidation of Glycerol
89
The TEM images are in agreement with literature which reports that the conventional sol-
immobilisation technique generates small nanoparticles with well-defined PSDs26. In
addition, it is evident that the particles sizes of these catalysts fall within the required region
in order to be active for alcohol oxidation.
(a)
(b)
(c)
(d)
Figure 3.9. Images and PSD’s retrieved for the catalysts by TEM:
(a) AuPd/TiO2, (b) AuPt/TiO2, (c) PdPt/TiO2 and (d) AuPdPt/TiO2

Chapter 3 | The Selective Catalytic Oxidation of Glycerol
90
XPS was conducted on each of the catalysts in order to determine the oxidation state of the
metallic species and their distribution on the surface of the TiO2. The XPS spectra of the
catalysts are displayed in Figures 3.10 and 3.11.
Pd0
a
b
c
d
e
Figure 3.10. XPS spectra showing the Pd 3d region for each of the catalysts. The spectra
reveal that Pd is only ever present in its metallic state. (a) AuPdPt/TiO2, (b) PdPt/TiO2, (c)
AuPt/TiO2, (d) AuPd/TiO2 and (e) AuPdPt/TiO2 used.

Chapter 3 | The Selective Catalytic Oxidation of Glycerol
91
Figure 3.11. XPS spectra showing the Au 4f and Pt 4f regions for each of the catalysts. The
spectra reveal that both the Pt and Au are only ever present in their metallic state.
(a) AuPdPt/TiO2, (b) PdPt/TiO2, (c) AuPt/TiO2, (d) AuPd/TiO2 and (e) AuPdPt/TiO2 used.
Pt0 Au
0
a
b
c
d
e

Chapter 3 | The Selective Catalytic Oxidation of Glycerol
92
The acquired data suggested that all the metals are present in their metallic states. The
observed binding energies for Au, Pd and Pt were 83.2, 335.0 and 70.7 eV respectively.
The binding energies associated with the Pd 3d5/2 and the Pt 4f7/2 peaks are characteristic
of metallic Pd and Pt species32, 45. Au 4f7/2 peaks are typically observed at 84.0 eV 27. This
downward shift in binding energy is likely a result of the Au particles interacting with Ti3+
centres at defect sites28. The quantity of Au on the surface of the trimetallic catalyst appears
to be lower than the amount determined by MP-AES when compared against Pd and Pt.
This may be a due to the formation of core-shell like structures which have an Au rich core.
Looking at the nanoparticles in closer detail using TEM-EDX could provide further
evidence for this theory.
Table 3.14. The atomic ratios of the elemental constituents associated of each catalyst
was determined using XPS.
Catalyst Atomic weight (%) Atomic ratios
Pd Au Pt O Ti O/Ti Pd/Au Pd/Pt Pt/Au
1% AuPdPt/TiO2 0.27 0.07 0.18 68.84 30.63 2.25 3.19 1.51 2.44
1% PdPt/TiO2 0.41 0.00 0.28 68.35 30.96 2.21 - 1.49 -
1% AuPt/TiO2 0.00 0.08 0.10 68.76 31.05 2.21 - - 1.29
1% AuPd/TiO2 0.42 0.12 0.00 68.38 31.08 2.20 3.00 - -
1% AuPdPt/TiO2
used
0.10 0.05 0.10 69.04 30.71 2.25 1.55 1.03 1.99
From an industrial perspective, the stability of a catalyst is crucially important. For this
reason, re-suability studies were conducted to assess the stability of the trimetallic
AuPdPt/TiO2 catalyst over subsequent uses.
There is evidence to suggest that the catalyst may be undergoing a change upon subsequent
uses. There is very little change in the performance of the catalyst in the 1st re-use test. A
small increase in activity is observed which could indicate that some residual PVA was
washed off during the first test. A previous study has showed that refluxing the catalyst at
90 ºC in H2O can remove large quantities of PVA from the surface of the catalyst46,

Chapter 3 | The Selective Catalytic Oxidation of Glycerol
93
conditions which are not too dissimilar from the reaction conditions used for these tests. It
has previously be shown that stabilisers can cause reductions in catalytic activity due to the
blocking of active sites.47. This could explain the increase in activity of the AuPdPt/TiO2
in the first re-use test. Nevertheless, the slight increase in conversion almost certainly falls
within experimental error and so this theory cannot be supported with such limited
evidence.
Table 3.15. The re-usability of the AuPdPt/TiO2 catalysts for the oxidation of glycerol
under base free conditions is assessed over subsequent runs. Reaction conditions: 10 mL,
substrate (0.3 M), O2 (3 bar), substrate:metal ratio = 2728, 60 ºC, 24 h.
Run Con at 24 h
(%)
Selectivity (%) C.M.B.
(%) GA TA GLA OA DHA βHA FOA
Initial 18 65 1 3 0 30 1 0 95
Re-use 1 18 60 1 2 0 35 1 1 88
Re-use 2 8 50 3 2 1 43 1 1 95
Interestingly, a substantial loss in activity and change in selectivity is observed in the 2nd
reuse test. PSD were determined for the catalysts (Figure 3.12) which were obtained at each
stage of testing shows a dramatic increase in the mean particle size between the 1st and
second reuse tests; from 2.64 to 4.34 nm respectively. This increase in particle size supports
the activity data in Table 3.15, as it is known that smaller nanoparticles are more active for
alcohol oxidation48. There appears to be considerable change in C3 selectivity which
indicates that the formation of H2O2 is not dependent on the particle size. However, the
selectivity to DHA appears to increase at the expense of GLAD which may suggest that
the size of the metal particles could affect the position of the equilibrium between DHA
and GLAD.
Previous studies have shown that the support can significantly affect the performance of
Au nanoparticles for the selective oxidation of glycerol4. For this reason, the trimetallic
AuPdPt complex was supported on a range of different supports and the resulting catalysts
were assessed for their ability to oxidise glycerol under base free conditions. The
corresponding results are displayed in Table 3.16.

Chapter 3 | The Selective Catalytic Oxidation of Glycerol
94
(a)
(b)
The variation in the observed conversions highlights the importance of the support
selection for the base free oxidation of glycerol. Mg(OH)2 appears to be the most active
support for the trimetallic system, displaying conversions of 20.3 and 68.3 at 0.5 h and 24
h respectively. Mg(OH)2 has previously been discarded as a viable support for base free
oxidation as it has been shown that Mg2+ ions can leach from the support, inducing a
homogeneous base catalysed system13. As discussed previously, no DHA or GLAD are
observed when this reaction is conducted in the presence of NaOH. Interestingly, high
quantities of DHA were observed with the Mg(OH)2 after 0.5 h, which could indicate that
the leaching of Mg from the support is minimal. If this is the case, it is likely that the high
activity is attributed to the highly basic nature of the Mg(OH)2. This would also explain the
observed deactivation of the catalyst with time. If OH- species from the support are playing
an active role in the catalysis, it may be difficult to replenish these sites given the base free
reaction medium. A similar deactivation is observed with all the other supports.
Figure 3.12. Images and PSD’s retrieved for the re-use catalysts by TEM:
(a) AuPdPt/TiO2 after first re-use and (b) AuPdPt/TiO2 after the second re-use

Chapter 3 | The Selective Catalytic Oxidation of Glycerol
95
Table 3.16. AuPdPt nanoparticles were immobilised on a range of catalytic supports and
assessed for their performance to oxidise glycerol under base free conditions. (a
corresponds to catalysts prepared by the conventional sol-immobilisation technique and
bcorresponds to catalysts prepared by the modified sol-immobilisation technique).
Reaction conditions: 10 mL, substrate (0.3 M), O2 (3 bar), substrate:metal ratio = 2728,
60 ºC, 24 h.
Support Time
(h)
Con
(%)
Selectivity (%) C.M.B.
(%) GA TA GLA LA OA DHA βHA FOA
TiO2a
0.5 4 54 0 0 0 1 42 0 3 97
1 6 58 0 2 0 1 39 1 0 96
2 8 60 1 2 0 1 37 1 0 96
4 10 64 1 2 0 1 32 1 0 95
24 18 65 1 3 0 0 30 1 0 95
Mg(OH)2a
0.5 20 46 0 0 0 3 50 0 1 97
1 39 54 8 8 0 2 27 0 1 86
2 46 59 10 10 0 4 13 0 1 83
4 55 63 10 12 0 6 7 0 2 75
24 68 52 17 15 0 14 2 0 1 68
Graphitea
0.5 4 47 1 0 0 0 50 1 1 98
1 8 51 0 1 0 1 45 1 0 96
2 16 53 1 1 0 0 43 2 0 91
4 21 55 1 1 0 0 41 3 0 89
24 43 56 1 3 0 0 37 4 0 84
CeO2b
0.5 2 36 0 0 0 3 56 0 6 98
1 3 50 0 0 0 2 46 0 3 98
2 4 48 0 0 0 0 50 0 2 97
4 5 50 0 0 0 1 47 1 2 97
24 16 58 0 3 0 0 38 2 1 90
ZrO2a
0.5 2 34 0 0 0 2 59 59 5 98
1 3 33 0 0 0 2 62 62 3 97
2 5 34 0 10 0 2 53 53 2 97
4 6 33 0 7 0 1 57 57 2 96
24 22 48 0 6 0 0 45 45 1 84
CeZrO4b
0.5 3 24 0 31 0 0 45 0 0 98
1 5 37 0 0 0 2 56 2 4 97
2 6 45 1 0 0 2 47 2 3 96
4 7 47 1 4 0 1 43 2 2 96
24 20 51 0 5 0 1 41 1 1 84

Chapter 3 | The Selective Catalytic Oxidation of Glycerol
96
The C3 selectivity appears to be relatively consistent across all the supports except for the
Mg(OH)2 and ZrO2. There is significantly more glycolic acid (GLA) observed with these
supports which could indicate that these materials are promoting the production of H2O2.
The H2O2 is believed to be formed from the reduction of O2 by H2O, however if this was
the case, the C3 selectivity of all the catalysts would be comparable. This indicates that
there may be additional pathways responsible for the C-C cleavage which are promoted by
surface bound hydroxyl species.
The choice of support also appears to affect the substrates ability to undergo sequential
oxidations reactions. The AuPdPt/graphite catalysts gives a high selectivity to GA and
DHA, even at relatively high conversions; a combined GA and DHA selectivity of 92.9 %
is observed at a conversion of 42.7 %. On the contrary, a combined selectivity of 72.1 %
for GA and DHA is observed at a conversion of 54.6 % with the AuPdPt/Mg(OH)2 system.
The carbon mass balances associated with all the catalysts are relatively low considering
the small quantities of glycerol converted. It has been shown that CO2 can be formed as a
results of sequential oxidations in this reaction41 but considering the fairly low selectivity
to C1 and C2 products, it is likely that products are being produced which are not being
accounted for in the analysis.
To summarise, a trimetallic AuPdPt/TiO2 was found to be more active than corresponding
bimetallic catalysts containing Au, Pd and Pt for the base free oxidation of glycerol. It was
not possible to replicate the high activity observed in the presence of a sacrificial base.
Nevertheless, it was determined that the choice of the support can clearly have a significant
impact on activity which certainly leaves room for further development moving forward.
3.6. The Selective Oxidation of Glycerol to Tartronic Acid
Tartronic acid (TA) can be produced from the oxidation of glycerol in the presence of a
heterogeneous catalyst. It has previously be shown that TA can be used as a precursor for
the formation of mesoxalic acid using bismuth promoted Pt catalysts49. In addition, the use
of TA as a target compound for the selective oxidation of glycerol could act as a model for
the formation of other high value products through the selective catalytic oxidation of
alcohols.
Chapter 3 | The Selective Catalytic Oxidation of Glycerol
97
To my knowledge, there are no current publications whose objective is solely based on the
production of TA from glycerol using a heterogeneous catalyst. The limiting obstacle to
overcome is the C-C cleavage which readily occurs as a result of in-situ H2O2 production
under reaction conditions15, 16. Very recent studies have suggested that hydrophobic
supports can reduce the production of H2O2 during the reaction4. Prati and co-workers50
recently showed that controlling the hydrophobicity of carbon supports can reduce the
unfavourable C-C cleavage. It was revealed that increasing the hydrophobic nature of the
supports led to the formation of less C1 and C2 products.
To determine the influence of the catalyst support on H2O2 production, a series of 1% Au
catalysts were prepared on a range of supports and tested for the oxidation of glycerol under
standard reactions conditions. The corresponding results are displayed in Table 3.17. It is
clear from these tests that the support can significantly influence both the activity and
selectivity of the catalyst. Of the supports tested, TiO2 was found to be the least active for
this reaction with only 48.7 % of the substrate converted after an 8 h reaction. On the
contrary, all the other catalysts gave 100 % conversions, with graphite appearing to be the
most active in the early stages of the reaction. The Au/Graphite gave a conversion 56.2%
after just 0.5 h of reaction.
SnO2 and CeZrO4 were found to favour the production of LA more than the other catalyst
supports. The high LA selectivity of these supports was predominantly observed at the
beginning of the reactions with selectivity appearing to decrease as the reaction proceeds.
It is unlikely that this decrease is a result of LA consumption as it was shown previously
that LA is fairly stable under standard reaction conditions in the presence of a 1%
AuPt/TiO2 catalyst.
Table 3.17. Au nanoparticles were immobilised on a range of supports and tested for the
oxidation of glycerol under standard conditions. Catalyst were prepared by the sol-
immobilisation technique, (catalysts with * prepared by modified sol technique). Reaction
conditions: 10 mL, substrate (0.3 M), O2 (3 bar), substrate:metal ratio = 500:1,
NaOH:substrate = 2, 60 ºC, 4 h.

Chapter 3 | The Selective Catalytic Oxidation of Glycerol
98
Catalyst Time
(h)
Con
(%)
Selectivity (%) TA Yield
(%)
C.M.B.
(%) GA TA LA GLA OA FOA
Au/TiO2
0.5 15 68 3 7 9 3 11 3 93
1 21 66 3 6 8 2 15 6 99
2 36 68 4 7 10 1 11 12 100
4 39 68 4 7 11 1 9 15 103
8 49 69 3 6 10 1 10 16 100
Au/Graphite*
0.5 56 57 17 9 8 4 5 8 93
1 71 57 19 8 8 5 5 12 93
2 88 58 20 7 7 5 4 16 92
4 98 50 27 6 7 5 5 24 92
8 100 36 40 6 7 7 5 37 92
Au/Mg(OH)2
0.5 19 56 26 5 4 3 2 6 102
1 44 58 27 5 5 3 3 11 98
2 82 54 31 3 6 3 3 22 91
4 98 47 37 3 6 4 3 30 84
8 100 38 45 3 6 4 3 26 58
Au/XC72R*
0.5 46 53 13 7 15 4 7 7 103
1 79 52 16 5 14 5 7 12 92
2 93 50 20 5 14 5 7 17 92
4 99 47 24 4 13 5 7 21 91
8 100 44 27 4 13 5 7 25 93
Au/CeZrO4*
0.5 21 61 9 22 4 3 3 2 102
1 70 63 12 15 4 3 3 7 91
2 90 65 12 13 4 3 3 11 98
4 100 62 14 12 4 5 3 14 96
8 100 58 16 12 4 7 4 15 94
Au/BN*
0.5 42 56 21 9 7 4 4 7 90
1 84 52 27 6 7 5 4 20 89
2 99 46 33 5 6 6 4 29 89
4 100 37 41 4 7 7 4 36 90
8 100 32 46 4 7 8 4 42 91
Au/CB4*
0.5 34 56 19 10 7 4 5 5 92
1 57 54 19 9 8 7 6 10 92
2 93 49 25 7 9 5 7 21 93
4 100 42 32 6 8 6 7 27 86
8 100 36 37 6 8 6 7 38 88
Au/SnO2*
0.5 20 57 14 22 3 2 2 2 96
1 41 59 15 21 3 2 2 5 92
2 77 61 16 16 4 2 3 11 92
4 99 59 20 13 4 2 3 18 88
8 100 50 27 13 5 3 3 24 90

Chapter 3 | The Selective Catalytic Oxidation of Glycerol
99
MP-AES was conducted in order to assess the Au loadings associated with each of the
supports. The derived metal loadings corresponding to each catalyst are displayed in Table
3.18.
Table 3.18. MP-AES was used to determine the Au loadings of each of the catalysts.
Catalyst Au Loading
(wt.%) TOF (h-1)
Au/BN 0.69 603
Au/Graphite 0.83 668
Au/TiO2 0.94 163
Au/SnO2 0.73 271
Au/Mg(OH)2 0.93 205
Au/C4B 0.58 576
Au/CeZrO4 0.68 310
In order to determine the supports ability to facilitate C-C cleavage, it is important to
consider the selectivity towards the C1 and C2 products. For this reason, the yields of GA
and TA produced, were used as a means of assessing the selectivity of each catalyst.
Furthermore, as it was difficult to compare the activities of each catalyst after the full
reaction, each catalyst’s activity was assessed in terms of the TOF it exhibited at 0.5 h.
The dashed box in Figure 3.13 shows the highest performing catalysts from both the
perspectives of activity and selectivity. These catalysts were Au/BN, Au/C4B and
Au/Graphite. Interestingly, all these supports are considered to be hydrophobic, which
provides further evidence to support Prati and co-workers, who postulated that hydrophobic
supports reduce C-C cleavage50. As a result, these catalysts were selected for further
assessment moving forward
As TA is a product of the sequential oxidation of GA, it was necessary to conduct some
extended runs in order to determine whether higher yields of TA can be achieved after a
longer reaction time. The extended reaction profiles for the oxidation of glycerol over
Au/BN, Au/C4B and Au/Graphite are displayed in Figures 3.14, 3.15 and 3.16.

Chapter 3 | The Selective Catalytic Oxidation of Glycerol
100
.
All three of the catalysts have similar reactions profiles over 24 h. Each catalyst gives a
similar selectivity to LA, which is predominantly produced within the early stages of the
reaction. The majority of the C3 cleavage appears to take place within the first 8 h, as there
appears to be no further increase in selectivity to C1 and C2 products after that time. At this
point, all the glycerol, DHA and GLAD has been consumed, which could suggest that the
cleavage predominantly occurs from these products. This supports the work by Davis and
co-workers, who suggested that GLAD and DHA form a hydroperoxy adduct in the
presence of supported Au nanoparticles, which in turn, leads to the formation of glycolic
acid via a glycolaldehyde intermediate16.
0
10
20
30
40
50
60
70
80
90
100
0 100 200 300 400 500 600 700 800
GA
+ T
A Y
ield
(%
)
TOF (h-1)
Au/BN Au/Graphite Au/TiO2 Au/SnO2
Au/MgO Au/C4B Au/CeZrO4
Figure 3.13. The combined yields of GA and TA are assessed as a function of TOF for
the Au supported catalysts.

Chapter 3 | The Selective Catalytic Oxidation of Glycerol
101
0
10
20
30
40
50
60
70
80
90
100
0
0.05
0.1
0.15
0.2
0.25
0.3
0 400 800 1200 1600
C.M
.B. (%
)
Conce
ntr
atio
n (
M)
Time (min)
Glycerol Glyceric Acid Tartonic Acid
Lactic Acid C1 and C2 Carbon Balance
0
10
20
30
40
50
60
70
80
90
100
0
0.05
0.1
0.15
0.2
0.25
0.3
0 400 800 1200 1600
C.M
.B. (%
)
Conce
ntr
atio
n (
M)
Time (min)Glycerol Glyceric Acid Tartonic Acid
Lactic Acid C1 and C2 C.M.B.
Figure 3.14. Plot displaying the performance of the Au/BN catalyst over 24 h. Reaction
conditions: 10 mL, substrate (0.3 M), O2 (3 bar), NaOH:substrate = 2, substrate:metal ratio
= 500:1, 60 ºC, 24 h.
Figure 3.15. Plot displaying the performance of the Au/C4B catalyst over 24 h. Reaction
conditions: 10 mL, substrate (0.3 M), O2 (3 bar), NaOH:substrate = 2, substrate:metal ratio =
500:1, 60 ºC, 24 h.

Chapter 3 | The Selective Catalytic Oxidation of Glycerol
102
Figure 3.16. Plot displaying the performance of the Au/Graphite catalyst over 24 h.
Reaction conditions: 10 mL, substrate (0.3 M), O2 (3 bar), NaOH:substrate = 2,
substrate:metal ratio = 500:1, 60 ºC, 24 h.
The purpose of increasing the reaction length was to determine whether greater yields of
TA could be produced. The highest TA yield was observed with the Au/BN catalyst which
gave a yield of 55.3 % after 24 h. This increase however, was fairly insignificant, as a yield
of 41.5 % was originally observed after only 8 h. This trend was observed with all three of
the catalysts, which could suggest that they are being deactivated during the reaction. In
the initial stages of the reaction, GA appears to be converted to TA rapidly when compared
to its conversion in the later stages. As the Au/BN catalyst gave the most favourable results,
it was used for further experimentation and a new batch was produced. The Au weight
loading of the new catalysts was confirmed as 0.893 wt. % by MP-AES. In order to assess
why this deactivation was taking place, product inhibition studies were conducted, where
0.05 M of product was added to the standard reactants at the beginning of the reaction. The
results of these tests are displayed in Table 3.19.
0
10
20
30
40
50
60
70
80
90
100
0
0.05
0.1
0.15
0.2
0.25
0.3
0 400 800 1200 1600
C.M
.B. (%
)
Conce
ntr
atio
n (
M)
Time (min)
C1 and C1 Glyceric Acid Tartronic Acid
Glycerol Lactic Acid C.M.B
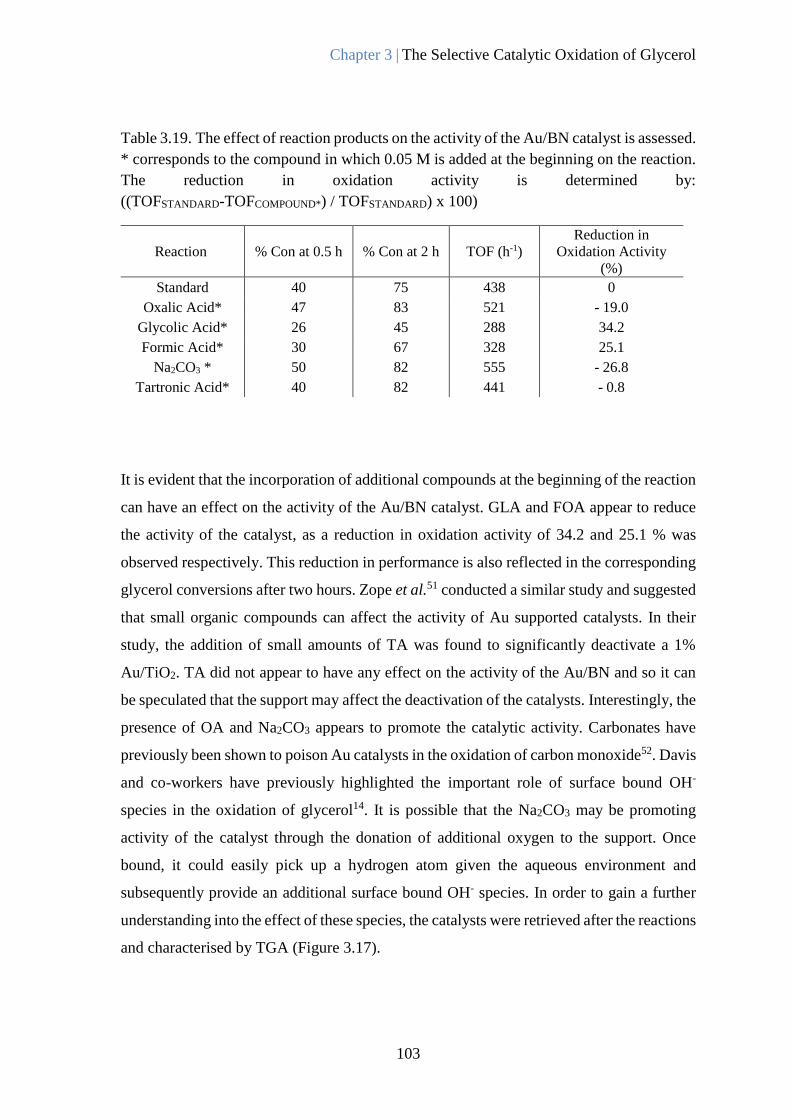
Chapter 3 | The Selective Catalytic Oxidation of Glycerol
103
Table 3.19. The effect of reaction products on the activity of the Au/BN catalyst is assessed.
* corresponds to the compound in which 0.05 M is added at the beginning on the reaction.
The reduction in oxidation activity is determined by:
((TOFSTANDARD-TOFCOMPOUND*) / TOFSTANDARD) x 100)
It is evident that the incorporation of additional compounds at the beginning of the reaction
can have an effect on the activity of the Au/BN catalyst. GLA and FOA appear to reduce
the activity of the catalyst, as a reduction in oxidation activity of 34.2 and 25.1 % was
observed respectively. This reduction in performance is also reflected in the corresponding
glycerol conversions after two hours. Zope et al.51 conducted a similar study and suggested
that small organic compounds can affect the activity of Au supported catalysts. In their
study, the addition of small amounts of TA was found to significantly deactivate a 1%
Au/TiO2. TA did not appear to have any effect on the activity of the Au/BN and so it can
be speculated that the support may affect the deactivation of the catalysts. Interestingly, the
presence of OA and Na2CO3 appears to promote the catalytic activity. Carbonates have
previously been shown to poison Au catalysts in the oxidation of carbon monoxide52. Davis
and co-workers have previously highlighted the important role of surface bound OH-
species in the oxidation of glycerol14. It is possible that the Na2CO3 may be promoting
activity of the catalyst through the donation of additional oxygen to the support. Once
bound, it could easily pick up a hydrogen atom given the aqueous environment and
subsequently provide an additional surface bound OH- species. In order to gain a further
understanding into the effect of these species, the catalysts were retrieved after the reactions
and characterised by TGA (Figure 3.17).
Reaction % Con at 0.5 h % Con at 2 h TOF (h-1)
Reduction in
Oxidation Activity
(%)
Standard 40 75 438 0
Oxalic Acid* 47 83 521 - 19.0
Glycolic Acid* 26 45 288 34.2
Formic Acid* 30 67 328 25.1
Na2CO3 * 50 82 555 - 26.8
Tartronic Acid* 40 82 441 - 0.8

Chapter 3 | The Selective Catalytic Oxidation of Glycerol
104
Figure 3.17. The TGA traces corresponding to Au/BN catalyst after exposure to an
additional 0.05 M of a given compound at the beginning of the reaction. ‘Used’ corresponds
to the Au/BN catalyst after a standard 4 h reaction. ‘Fresh’ corresponds to an unused
sampled of the Au/BN catalyst.
There is a noticeable difference in mass lost as the catalysts are heated. The fresh catalyst
had the smallest loss in mass; 0.8% after being heated to 700 ºC. Interestingly, higher losses
in mass are observed for all the other catalysts, suggesting that the catalysts exposed to the
reaction medium may be accommodating adsorbed organic species. Au/BN which was
tested under standard conditions exhibited a loss in mass of 1.46 % at 700 ºC. This supports
the theory that products produced in the reaction may be inhibiting the performance of the
catalyst. The catalysts which were tested in the presence of additional quantities of CO3
and TA showed almost identical TGA profiles as the used catalyst. This could indicate that
92
93
94
95
96
97
98
99
100
0 100 200 300 400 500 600 700 800
Cat
alyst
Mas
s (%
)
Temperature ºC
CO3 FA GLA OA TA Fresh Used

Chapter 3 | The Selective Catalytic Oxidation of Glycerol
105
these compound neither promote catalyst deactivation themselves, nor lead to the formation
of other catalytic inhibiting species. On the contrary, significant losses of mass were
observed for OA, GLA and FOA of 7.23, 3.94 and 3.48 % respectively at 700 ºC.
The large losses of mass exhibited by the catalyst after exposure to additional quantities
GLA and FOA support the experimental data in Table 3.19. It is evident that GLA and
FOA bind strongly to the catalyst, which could be inhibiting the catalysts activity through
the blocking of active sites. The highest mass loss observed was when Au/BN was exposed
to additional quantities of OA at the beginning of the reaction. Interestingly, the
experimental data in Table 3.19 shows a dramatic increase in catalyst oxidation activity
was observed when additional OA was present in the reaction system. This may suggests
that OA binds strongly to the catalyst, and has a promotional effect on its activity. It is
possible that the OA predominantly adsorbs to the surface of the support, rather than the
metal active sites.
It has been postulated for some time that H2O2 is responsible for the unfavourable C-C
cleavage observed in the oxidation of glycerol. For this reason, a series of tests were
conducted where varied quantities of H2O2 were added at the beginning of the reaction.
The results for these tests are displayed in Table 3.20.
It is clear from the experimental data that H2O2 does have an effect on the C3 selectivity of
the reaction. Increasing the concentration of H2O2 at the beginning of the experiment
appears to result in a decrease in C3 selectivity, most noticeably at the beginning of the
reaction. This relationship is displayed in Figure 3.18. Interestingly, there does not appear
to be any significant decreases in C3 selectivity after this time. This is likely a result of any
excess of H2O2 rapidly breaking down in the reaction medium. H2O2 also appears to
increase the rate of glycerol consumption. A proportional relationship between the quantity
of H2O2 and initial substrate consumption is observed. This suggests that the H2O2 may
play a role in the activation of glycerol.
The reactions run in the absence of catalyst reveal that both the catalyst and H2O2 are
required for the C-C cleavage to occur. The H2O2 is unable to interact with the substrate
independently of the catalyst, which further support the theory that C-C cleavage occurs
through Dakin Oxidation. There does not appear to be any decrease in C3 selectivity when
H2O2 is added at different stages of the reaction which is unexpected. This may be due to

Chapter 3 | The Selective Catalytic Oxidation of Glycerol
106
the majority of reactant having surpassed GLAD and DHA in the oxidation sequence when
the additional H2O2 was added.
Table 3.5. Varying quantities of H2O2 were added to the Au/BN catalyst for the oxidation
of glycerol under standard reaction conditions. *Ratio of H2O2 added at 0, 0.5, 1 and 2 h of
the reaction. b reaction in absence of catalyst but presence of base, bf reaction in absence of
both catalyst and base. Reaction conditions: 10 mL, substrate (0.3 M), O2 (3 bar),
NaOH:substrate = 2, substrate:metal ratio = 500:1, H2O2:metal stated, 60 ºC, 4 h.
H2O2 :
Metal
Time
(h)
Con
(%)
Selectivity (%) C.M.B.
(%)
C3 Sel
(%) GA TA LA GLA OA FOA
0
0.5 40 52 25 8 6 5 4 90 85
1 75 50 28 5 7 5 4 89 83
2 97 46 33 4 7 6 4 87 83
4 100 43 36 4 7 6 4 87 83
106.3
0.5 47 50 26 5 8 6 5 92 81
1 84 48 28 4 8 7 5 91 81
2 98 45 32 4 8 7 5 89 81
4 100 42 36 3 7 7 5 90 81
212.6
0.5 54 49 26 5 9 6 5 94 80
1 85 48 29 4 9 6 5 90 80
2 97 45 32 3 8 7 5 90 80
4 99 42 35 3 8 7 5 91 80
318.9
0.5 60 48 27 4 9 7 5 93 79
1 90 45 31 3 8 8 5 96 79
2 99 41 36 3 8 9 5 105 79
4 100 31 44 3 8 10 5 105 78
212.6 *
0.5 52 51 25 6 9 5 5 90 81
1 81 50 27 5 9 5 5 90 81
2 97 48 30 4 8 5 5 89 82
4 99 46 32 4 8 6 5 88 82
212.6 b
0.5 0 0 0 0 0 0 0 100 -
1 0 0 0 0 0 0 0 100 -
2 0 0 0 0 0 0 0 100 -
4 0 0 0 0 0 0 0 100 -
212.6 bf
0.5 0 0 0 0 0 0 0 100 -
1 0 0 0 0 0 0 0 100 -
2 0 0 0 0 0 0 0 100 -
4 0 0 0 0 0 0 0 100 -

Chapter 3 | The Selective Catalytic Oxidation of Glycerol
107
Figure 3.18. The C3 selectivity appears to decrease as the quantity of H2O2 added at the
beginning of the reaction is increased. The insert corresponds to the H2O2 : metal ratio.
Reaction conditions: 10 mL, substrate (0.3 M), O2 (3 bar), NaOH:substrate = 2,
substrate:metal ratio = 500:1, 60 ºC, 4 h.
Although the addition of external H2O2 does appear to result in additional C-C cleavage, it
does not seem plausible that it could account for the entirety of the cleavage observed. If
this were the case, excessively large quantities of H2O2 would need to be produced in-situ.
It is more likely that peroxy intermediate species formed on the metal nanoparticle adjacent
to adsorbed substrate is what leads to unfavourable cleavage. Peroxy radicals have shown
to have played significant roles in the oxidation of CO to CO2 53, 54. Davis and co-workers
postulated that peroxy intermediate species are formed during the oxidation of glycerol by
the reduction of O2 with H2O15. Na2SO3 and NaNO3 can act as radical quenchers for *OH
and *OOH respectively. Hutchings and co-workers have previously used these reagents in
order to gain a further understanding of the mechanisms associated with methane
activation55. As a result, a series of tests were constructed in order to determine the effect
78
79
80
81
82
83
84
85
86
30 35 40 45 50 55 60 65
(%)
C3 S
elec
tivit
y a
t 0.5
h
(%) Conversion at 0.5 h
0
106.3
212.6
318.9

Chapter 3 | The Selective Catalytic Oxidation of Glycerol
108
*OH and *OOH radicals have on the oxidation of glycerol in the presence of Au/BN. The
results of these tests are displayed in Table 3.21.
Table 3.21. All tests were conducted under standard reactions conditions. Re-use*
corresponds to a reaction where Au/BN has been collected at the end of the Na2SO3
reaction, dried and re-tested. Reaction conditions: 10 mL, substrate (0.3 M), O2 (3 bar),
NaOH:substrate = 2, substrate:metal ratio = 500:1, radical scavenger (10 mg), 60 ºC, 4 h.
The *OOH radical scavenger did not appear to have a significant impact on the reaction
profile when compared to the standard reaction. There is a slight increase in activity but
the selectivity profile is almost identical. From this, it is clear that *OOH radicals do not
play a major role in the C-C cleavage mechanism. On the contrary, the *OH radical
quencher severely inhibited the activity of the catalyst. A drop in conversion from 39.5 %
to 11.9 % is observed at 0.5 h when Na2SO3 was added at the beginning of the reaction.
Reaction Time
(h)
Con
(%)
Selectivity (%) C.M.B.
(%) GA TA LA GLA OA FOA
Standard
0.5 40 52 25 8 6 5 4 90
1 75 50 28 5 7 5 4 89
2 97 46 33 4 7 6 4 87
4 100 43 36 4 7 6 4 87
NaNO3
0.5 50 52 24 5 7 7 4 94
1 86 49 28 4 7 8 4 90
2 100 44 33 3 7 9 4 91
4 100 38 38 3 7 10 4 90
Na2SO3
0.5 12 0 8 0 92 0 0 89
1 15 44 1 0 32 0 22 92
2 19 42 1 5 33 0 19 96
4 30 45 1 4 30 0 20 97
Re-use
*
0.5 44 63 16 7 8 2 5 102
1 68 64 17 6 7 2 5 100
2 82 64 18 5 6 1 5 103
4 94 63 20 5 6 1 6 102
No Cat
Na2SO3
0.5 0 0 0 0 0 0 0 100
1 0 0 0 0 0 0 0 100
2 0 0 0 0 0 0 0 100
4 0 0 0 0 0 0 0 100

Chapter 3 | The Selective Catalytic Oxidation of Glycerol
109
The selectivity profile is also effected. A dramatic increase in selectivity to C1 and C2
products is observed. Interestingly, when this catalyst was re-used in the absence of the
quencher, the catalysts activity and selectivity profile was comparable with the standard
reaction. This shows that the quencher has no poisoning effect on the catalyst, suggesting
that the change in performance can only be attributed to the absence of *OH radicals in the
system
It is clear that the *OH radicals play an important role in the oxidation of glycerol to GA
and TA as this pathway appears to be shut off in the presence of the quencher. A previous
study used theoretical analysis to investigate the interaction of OH* radicals with Au
surfaces56. It was shown that *OH radicals chemisorb onto Au forming a covalent bond. It
has previously been suggested that the oxidation of glycerol to GA is reliant on the presence
of surface bound OH- species16. The decrease in selectivity to GA could be a result of a
reduction of Au-OH species, produced from *OH radicals. Increasing the population of
Au-OH species could therefore reduce the C-C cleavage by instead promoting the favoured
oxidation pathway. On the contrary, the cause of the C-C cleavage still remains unclear as
the relative concentrations of the C1 and C2 products do not appear to have changed
significantly despite significant variations in catalytic activity. Thus, it can be concluded
that *OH radicals do not directly contribute to C-C cleavage but appear to play a pivotal
role in the oxidation of glycerol to GA and TA.
In an attempt to further increase the TA selectivity, small quantities of Pd and Pt were
incorporated into the Au/BN catalyst. The catalysts were prepared by the modified sol-
immobilisation technique and subsequently tested for the oxidation of glycerol. The results
of these tests are displayed in Table 3.22. In order to accurately assess the differences in
activity between the catalysts, the metal weight loadings were determined using MP-AES
and the corresponding TOF’s were calculated.
It was determined that the AuPd/BN catalyst was the most active. Previous studies have
shown that the incorporation of Pd to Au can both promote57 and reduce10 catalytic activity.
This suggests that the support-metal interaction has a significant impact on the activity of
AuPd nanoparticles in this reaction. The AuPt/BN catalyst was also found to be more active
than the monometallic Au/BN catalyst. AuPt catalysts have previously been shown to be
more active than monometallic Au catalysts for this reaction.18, 25. The data in Table 3.23
and table 24 reveals how the addition of small quantities of Pd or Pt can have a significant

Chapter 3 | The Selective Catalytic Oxidation of Glycerol
110
impact on catalytic activity. Interestingly, a noticeable increase in C3 selectivity is also
observed with the AuPd/BN catalyst when compared with the other catalysts. A decrease
in C-C scission has been reported previously when comparing the selectivity of supported
AuPd clusters with monometallic Au catalysts58. It is possible that the decrease in C-C
scission is a result of the Pd facilitating the decomposition of H2O2 formed in the reaction.
Table 3.22. The performance of AuPd/BN and AuPt/BN was assessed for the oxidation of
glycerol under standard reaction conditions. The results are compared against the activity
of the Au/BN catalyst. Reaction conditions: 10 mL, substrate (0.3 M), O2 (3 bar),
NaOH:substrate = 2, substrate:metal ratio = 500:1, 60 ºC, 4 h.
Catalyst Time
(h)
Con
(%)
Selectivity (%) C.M.B.
(%) GA TA LA GLA OX FOA
Au/BN
0.5 40 52 25 8 6 5 4 90
1 75 50 28 5 7 5 4 89
2 97 46 33 4 7 6 4 87
4 100 43 36 4 7 6 4 87
AuPd/BN
0.5 57 66 17 9 3 2 3 98
1 86 65 20 7 3 2 3 96
2 97 63 22 7 3 2 3 94
4 99 62 24 7 3 2 3 94
AuPt/BN
0.5 65 57 10 20 7 1 6 98
1 98 57 14 17 6 1 5 88
2 100 54 17 16 6 2 5 88
4 100 51 20 16 6 2 5 89
Table 3.23. The metal weight loadings of the Au, Pd and Pt containing catalysts were
determined by MP-AES. TOF’s were calculated using the corresponding metal weights.
Catalyst Total Metal
Loading (wt.%)
Metal Content (%) (%) Con
at 0.5 h
TOF
(h-1) Au Pd Pt
Au/BN 0.89 100.0 - - 40 438
AuPt/BN 0.99 90.3 - 9.7 65 656
AuPd/BN 0.80 96.4 3.6 - 56 768

Chapter 3 | The Selective Catalytic Oxidation of Glycerol
111
3.7. Conclusions
The selective oxidation of glycerol was investigated over supported Au containing
heterogeneous catalysts. The work in this chapter was divided into four fundamental
sections.
The first section focussed on the use of a 1 wt.% AuPt/TiO2 catalyst for the oxidation of
glycerol. The reaction parameters were varied in order to assess how they effected the
product distribution and rate of reaction. It was determined that increasing the reaction
temperature and the concentration of NaOH favoured the production of LA. It was
suggested that an increasing reaction temperature promoted the dehydration of a terminal
alcohol species, whereas increasing the NaOH concentration promoted the intermolecular
Cannizzaro reaction of methylglyoxal to produce LA. Both of these steps were recently
hypothesised by Crabtree and co-workers to be key in transformation of glycerol to LA37.
It was also observed that increasing these parameters appeared to increase the overall C3
selectivity. Although this is likely a result of these conditions promoting the LA pathway,
it was also suggested that this may be due to the high temperatures and base promoting the
decomposition of H2O2 formed in the reaction. Increasing the O2 pressure in the reaction
was found to favour the production of GA and TA at the expense of LA. As a conseqeunce
it was suggested that O2 plays a pivitol role in activation of this direct oxidation pathway.
Increasing the O2 pressure was also found to increase the unfavourable C-C scission which
ultimately led to the increased formation of C1 and C2 products. It was postulated that this
was a result of increased H2O2 production, as it is believed that H2O2 is produced through
the reduction of O2 by H2O15. It is clear from this work that the reaction conditions can be
used to tune the reaction selectivity.
The purpose of the work conducted in the second section was to gain a further
understanding of how the reaction products were affected by a 1 wt.% AuPt/TiO2 catalyst
and the reaction conditions. For these tests, reactions were conducted under standard
condtions with the substrate being replaced with different reaction products. It was found
that DHA and GLAD were immediately consumed in base promoted reactions. Exteremely
low activities were observed when reactions were conducted from GA. Interestingly, the
C3 selectivity of these reactions was significantly less when compared with reactions from
glycerol, suggesting that GA and possibly even TA may be terminal reaction products
(glycerol is converted to GA or TA in one asdorption cycle). LA, OA and TA were all

Chapter 3 | The Selective Catalytic Oxidation of Glycerol
112
found to be stable under the reaction conditions and thus, the C-C cleavage can not occur
from these compounds. The studies conducted under base free conditons suggest that the
cleavage occurs predominantly from GLAD, DHA and possibly even GA. This work has
contributed to a further understanding of the reaction profile. GLAD, DHA and GA have
been identified as possible candidates from which the C-C cleavage occurs. Nevertheless,
further work is required in order to confirm this theory.
The third section of this chapter focussed on the use of Au, Pd and Pt catalysts supported
on TiO2 for the oxidation of glycerol under base free conditions. The oxidation of glycerol
under base free conditions would be far more suitable from an industrial perspective but
previous publications determined that high reaction rates were far more difficult to achieve
in the absence of sacrifical base. Of the bimetallic catalysts tested, PdPt/TiO2 was found to
be the most active which was unusual as supported AuPt nanoparticles had previously been
shown to be highly active under base free conidions13. Discrepancies in the metal weight
loadings of the catalysts made it difficult to compare the catalysts and as a result, it was
determined that the best method of comparing catalyst activities was using TOF
calculations. From these calculations, a trimetallic AuPdPt/TiO2 catalyst was found to be
the most active catalyst tested. Synergistic interactions between the three metals were
proposed to be the reason behind the high activity observed for this catalyst. Re-use studies
were conducted on this catalyst and it was determined that the catalyst was not very stable.
A substantial loss in activity was observed when the catalyst was tested for the third time.
TEM confirmed that this was a result of particle agglomeration. AuPdPt nanoparticles were
subsequently immobilised on a range of different supports and tested for the oxidation of
glycerol under base free conditions. It was determined that the support can significantly
affect the activity and selectivity of the catalysts, offering a possible avenue for further
work.
The aim of the final section of work was to gain a further understanding of the causes of
C-C cleavage, and ultimately optimise a catalyst which could provide a good TA yield. To
begin with, Au was immobilised on a range of different supports and the resulting catalysts
were tested for the oxidation of glycerol under standard conditions. Of the supports tested,
BN, graphite and C4B were identified as the most promising as they combined good C3
selectivity with a high catalytic activity. It was postulated that their favourable C3
selectivity was a result of the hydrophobic nature of the supports. These catalysts however,
were found to deactivate over time, limiting the TA yield to only 55.3 % after 24 h for the
Chapter 3 | The Selective Catalytic Oxidation of Glycerol
113
Au/BN catalyst. In order to investigate this deactivation further, product inhibition studies
were carried out using the Au/BN catalyst. It was determined that FOA and GLY inhibited
the catalysts activity by binding irreversibly to the catalysts active sites. The in-situ
formation of H2O2 has long been seen as the culprit responsible for activating the C-C
cleavage. A series of tests were conducted in order to assess whether externally added H2O2
could imitate the peroxide formed inside the reaction. It was found that increasing the H2O2
added at the beginning of the reaction increased the C-C scission. A further study was
designed investigate the role of *OH and *OOH radicals in the reaction. It was determined
that *OH radicals are essential for the production of GA and TA and therefore play an
important role in the mechanism. The incorporation of Pd and Pt into the Au/BN catalyst
substantially increased the catalytic activity. The AuPd/BN catalyst also displayed
enhanced selectivity to TA, which was attributed to the Pd promoting the decomposition
of H2O2.
The conclusions from this chapter support the theory that H2O2 plays a pivotal role in C-C
cleavage. Dakin Oxidation was suggested to be the mechanism by which this occurs, as
this relies on the activation of the substrate by H2O2 in a basic reaction medium. GLAD,
DHA and GA were identified as the compounds which may partake in Dakin Oxidation.
Moving forward, isotopic labelling experiments would be an ideal method of confirming
these postulations. It was also suggested that GA and TA are primary reaction products and
that *OH radical species are crucial in the direct oxidation of glycerol to GA and TA. The
base free oxidation of glycerol still remains to be a challenge. It was suggested that
optimisation of the support could be one method of increasing the reaction rates.
Chapter 3 | The Selective Catalytic Oxidation of Glycerol
114
3.8. References
1. M. G. Kulkarni, R. Gopinath, L. C. Meher and A. K. Dalai, Green Chemistry,
2006, 8, 1056.
2. H. Kimura, K. Tsuto, T. Wakisaka, Y. Kazumi and Y. Inaya, Applied Catalysis A-
General, 1993, 96, 217.
3. R. Garcia, M. Besson and P. Gallezot, Applied Catalysis A-General, 1995, 127,
165.
4. A. Villa, N. Dimitratos, C. E. Chan-Thaw, C. Hammond, L. Prati and G. J.
Hutchings, Accounts of Chemical Research, 2015, 48, 1403.
5. N. Dimitratos, J. A. Lopez-Sanchez, D. Lennon, F. Porta, L. Prati and A. Villa,
Catalysis Letters, 2006, 108, 147.
6. A. Villa, N. Janjic, P. Spontoni, D. Wang, D. S. Su and L. Prati, Applied Catalysis
A-General, 2009, 364, 221.
7. S. Gil, M. Marchena, L. Sanchez-Silva, A. Romero, P. Sanchez and J. L.
Valverde, Chemical Engineering Journal, 2011, 178, 423.
8. B. Katryniok, H. Kimura, E. Skrzynska, J.-S. Girardon, P. Fongarland, M.
Capron, R. Ducoulombier, N. Mimura, S. Paul and F. Dumeignil, Green
Chemistry, 2011, 13, 1960.
9. L. Prati and M. Rossi, 3rd World Congress on Oxidation Catalysis, 1997, 110,
509.
10. W. C. Ketchie, M. Murayama and R. J. Davis, Journal of Catalysis, 2007, 250,
264.
11. N. Dimitratos, J. A. Lopez-Sanchez, J. M. Anthonykutty, G. Brett, A. F. Carley,
R. C. Tiruvalam, A. A. Herzing, C. J. Kiely, D. W. Knight and G. J. Hutchings,
Physical Chemistry Chemical Physics, 2009, 11, 4952.
12. A. Villa, S. Campisi, C. E. Chan-Thaw, D. Motta, D. Wang and L. Prati, Catalysis
Today, 2015, 249, 103.
13. G. L. Brett, Q. He, C. Hammond, P. J. Miedziak, N. Dimitratos, M. Sankar, A. A.
Herzing, M. Conte, J. A. Lopez-Sanchez, C. J. Kiely, D. W. Knight, S. H. Taylor
and G. J. Hutchings, Angewandte Chemie-International Edition, 2011, 50, 10136.
14. M. S. Ide and R. J. Davis, Accounts of Chemical Research, 2014, 47, 825.
15. B. N. Zope, D. D. Hibbitts, M. Neurock and R. J. Davis, Science, 2010, 330, 74.
16. W. C. Ketchie, M. Murayama and R. J. Davis, Topics in Catalysis, 2007, 44, 307.
Chapter 3 | The Selective Catalytic Oxidation of Glycerol
115
17. L. Prati, A. Villa, C. E. Chan-Thaw, R. Arrigo, D. Wang and D. S. Su, Faraday
Discussions, 2011, 152, 353.
18. C. L. Bianchi, P. Canton, N. Dimitratos, F. Porta and L. Prati, Catalysis Today,
2005, 102, 203.
19. N. Dimitratos, A. Villa and L. Prati, Catalysis Letters, 2009, 133, 334.
20. A. Villa, S. Campisi, K. M. H. Mohammed, N. Dimitratos, F. Vindigni, M.
Manzoli, W. Jones, M. Bowker, G. J. Hutchings and L. Prati, Catalysis Science &
Technology, 2015, 5, 1126.
21. D. Tongsakul, S. Nishimura and K. Ebitani, ACS Catalysis, 2013, 3, 2199.
22. D. Liang, J. Gao, H. Sun, P. Chen, Z. Y. Hou and X. M. Zheng, Applied Catalysis
B-Environmental, 2011, 106, 423.
23. C. Della Pina, E. Falletta and M. Rossi, Chemical Society Reviews, 2012, 41, 350.
24. Y. Shen, S. Zhang, H. Li, Y. Ren and H. Liu, Chemistry-A European Journal,
2010, 16, 7368.
25. L. Prati, A. Villa, C. Campione and P. Spontoni, Topics in Catalysis, 2007, 44,
319.
26. F. Porta, L. Prati, M. Rossi, S. Coluccia and G. Martra, Catalysis Today, 2000, 61,
165.
27. M. T. Anthony and M. P. Seah, Surface and Interface Analysis, 1984, 6, 95.
28. J. A. Moma, M. S. Scurrell and W. A. Jordaan, Topics in Catalysis, 2007, 44, 167.
29. A. Golabiewska, W. Lisowski, M. Jarek, G. Nowaczyk, A. Zielinska-Jurek and A.
Zaleska, Applied Surface Science, 2014, 317, 1131.
30. Z. Bastl and S. Pick, Surface Science, 2004, 566, 832.
31. R. Zimmermann, P. Steiner, R. Claessen, F. Reinert, S. Hufner, P. Blaha and P.
Dufek, Journal of Physics-Condensed Matter, 1999, 11, 1657.
32. J. Thiele, N. T. Barrett, R. Belkhou, C. Guillot and H. Koundi, Journal of
Physics-Condensed Matter, 1994, 6, 5025.
33. M. Romeo, J. Majerus, P. Legare, N. J. Castellani and D. B. Leroy, Surface
Science, 1990, 238, 163.
34. P. A. Shaffer and T. E. Friedemann, Journal of Biological Chemistry, 1930, 86,
345.
35. R. W. Nagorski and J. P. Richard, Journal of the American Chemical Society,
2001, 123, 794.

Chapter 3 | The Selective Catalytic Oxidation of Glycerol
116
36. R. K. P. Purushothaman, J. van Haveren, D. S. van Es, I. Melian-Cabrera, J. D.
Meeldijk and H. J. Heeres, Applied Catalysis B-Environmental, 2014, 147, 92.
37. L. S. Sharninghausen, J. Campos, M. G. Manas and R. H. Crabtree, Nature
Communications, 2014, 5.
38. J. Gao, D. Liang, P. Chen, Z. Hou and X. Zheng, Catalysis Letters, 2009, 130,
185.
39. D. Liang, J. Gao, J. H. Wang, P. Chen, Z. Y. Hou and X. M. Zheng, Catalysis
Communications, 2009, 10, 1586.
40. R. Nie, D. Liang, L. Shen, J. Gao, P. Chen and Z. Hou, Applied Catalysis B-
Environmental, 2012, 127, 212.
41. D. Z. Jeffery and G. A. Camara, Electrochemistry Communications, 2010, 12,
1129.
42. Y. Kwon, K. J. P. Schouten and M. T. M. Koper, Chemcatchem, 2011, 3, 1176.
43. A. Villa, G. M. Veith and L. Prati, Angewandte Chemie-International Edition,
2010, 49, 4499.
44. J. K. Edwards, J. Pritchard, L. Lu, M. Piccinini, G. Shaw, A. F. Carley, D. J.
Morgan, C. J. Kiely and G. J. Hutchings, Angewandte Chemie-International
Edition, 2014, 53, 2381.
45. K. S. Kim, A. F. Gossmann and N. Winograd, Analytical Chemistry, 1974, 46,
197.
46. J. A. Lopez-Sanchez, N. Dimitratos, C. Hammond, G. L. Brett, L. Kesavan, S.
White, P. Miedziak, R. Tiruvalam, R. L. Jenkins, A. F. Carley, D. Knight, C. J.
Kiely and G. J. Hutchings, Nature Chemistry, 2011, 3, 551.
47. I. Gandarias, P. J. Miedziak, E. Nowicka, M. Douthwaite, D. J. Morgan, G. J.
Hutchings and S. H. Taylor, Chemsuschem, 2015, 8, 473.
48. P. Haider, B. Kimmerle, F. Krumeich, W. Kleist, J.-D. Grunwaldt and A. Baiker,
Catalysis Letters, 2008, 125, 169.
49. P. Fordham, M. Besson and P. Gallezot, Catalysis Letters, 1997, 46, 195.
50. A. Villa, M. Plebani, M. Schiavoni, C. Milone, E. Piperopoulos, S. Galvagno and
L. Prati, Catalysis Today, 2012, 186, 76.
51. B. N. Zope and R. J. Davis, Green Chemistry, 2011, 13, 3484.
52. J. Saavedra, C. Powell, B. Panthi, C. J. Pursell and B. D. Chandler, Journal of
Catalysis, 2013, 307, 37.
53. D. A. H. Cunningham, W. Vogel and M. Haruta, Catalysis Letters, 1999, 63, 43.

Chapter 3 | The Selective Catalytic Oxidation of Glycerol
117
54. J. Saavedra, H. A. Doan, C. J. Pursell, L. C. Grabow and B. D. Chandler, Science,
2014, 345, 1599.
55. C. Hammond, M. M. Forde, M. H. Ab Rahim, A. Thetford, Q. He, R. L. Jenkins,
N. Dimitratos, J. A. Lopez-Sanchez, N. F. Dummer, D. M. Murphy, A. F. Carley,
S. H. Taylor, D. J. Willock, E. E. Stangland, J. Kang, H. Hagen, C. J. Kiely and
G. J. Hutchings, Angewandte Chemie-International Edition, 2012, 51, 5129.
56. M. Suh, P. S. Bagus, S. Pak, M. P. Rosynek and J. H. Lunsford, Journal of
Physical Chemistry B, 2000, 104, 2736.
57. D. I. Enache, J. K. Edwards, P. Landon, B. Solsona-Espriu, A. F. Carley, A. A.
Herzing, M. Watanabe, C. J. Kiely, D. W. Knight and G. J. Hutchings, Science,
2006, 311, 362.
58. A. H. A. Nadzri, N. Hamzah, N. I. N. Yusoff and M. A. Yarmo, Functional
Materials Letters, 2011, 4, 309.

118
4.1. Introduction
Furfural (FF) is a C5 heterocyclic aldehyde, which can be isolated in large quantities
through the treatment of lignocellulosic feedstocks. FF has potential as a platform
chemical1-3 which can undergo hydrogenation to produce valuable fuels such as
tetrahydrofuran and 2-methyltetrahydrofuran4-9. In addition to the production of fuels, it is
important that alternative methods are developed for the production of fine chemical from
bio-renewable feedstocks. FF can be selectively oxidised into a range of different products
which are either employed in industry1, 10 or can undergo further transformations to form
other high value products3, 11, 12.
The selective oxidation of FF to maleic acid13-16 (MEA) and succinic acid (SA)17, 18 has
generated a lot of scientific interest in recent times. MEA and SA can both be used as
precursors to produce specialised polyester resins19, 20. SA also has a range of other uses
including its use as an acidity regulator in the food industry and as an additive in the
pharmaceutical industry to produce antibiotics and vitamins10. It has also been reported that
FF can undergo oxidative esterification to produce alkyl furoates21-24, which have various
applications in the flavour and fragrance industries25. Au supported heterogeneous catalysts
have been found to be highly active in these transformations. Furoic acid (FA) is an
additional product which can be formed by the selective oxidation of FF. FA is
predominantly used as a precursor to form furoyl chloride, which is widely used in the
pharmaceutical industry to produce drugs and insecticides26. FA is currently produced
industrially via the Cannizzaro reaction with NaOH. It was previously suggested that the
application of a heterogeneous catalyst to improve the efficiency of this process was
unfeasible, due to competitive pathways which lead to the formation of unfavourable by-
products26. Nevertheless, there have been some attempts which have been largely
unsuccessful27, 28.
Chapter 4 The Selective Catalytic Oxidation of Furfural

Chapter 4 | The Selective Catalytic Oxidation of Furfural
119
It is clear from the current literature that the polymerisation of FF in the solution is a
problem, as numerous articles have reported substantial losses of carbon13-16, 18, 29. It is
known that FF can undergo self-polymerisation30 to produce resins. This polymerisation
only appears to be a problem when reactions are conducted in H2O, as losses in carbon did
not appear to be a problem for the oxidative esterification of FF. It is believed that the self-
polymerisation of FF is initiated through the abstraction of a hydrogen atom from the furan
ring, leaving a radical furan species15. Further work conducted by Tanskanen and co-
workers31, 32 determined that the polymerisation is promoted by the acidity of the aqueous
medium. Measures have been taken to reduce this polymerisation by using co-catalysts15
and diluting the concentration of FF through the application of a biphasic system33. These
reaction modifications did lead to some improvements but the extent of the polymerisation
was still substantial.
4.2. Aims and Objectives
4.2.1. Objectives
Design and employ a reaction system whereby FF can be oxidised efficiently to FA using
mild reaction conditions in the presence of a gold supported heterogeneous catalyst.
4.2.2. Aims
Identify a Au supported heterogeneous catalyst which can selectively oxidise FF to
FA
Derive suitable reaction conditions and optimise the catalyst in order optimise
catalytic performance
Propose a suitable reaction profile for the system. Determine the affect each of the
reaction conditions have on the performance of the catalyst in order to gain a further
understanding of the reaction system.
Vary the catalyst preparation method in order to gain an understanding of how the
catalytic properties such as nanoparticle size effect catalytic performance.
Assess the industrial viability of the catalyst. Assign kinetics to the system. Is the
activation energy of the catalytic process competitive with the current industrial
method for the production of FA.

Chapter 4 | The Selective Catalytic Oxidation of Furfural
120
4.3. Oxidation of Furfural over a 1 wt.% Au/TiO2 Catalyst
It has been shown repeatedly in literature that Au nanoparticles supported on TiO2 are
highly effective catalysts for a range of oxidation reactions34, 35. For this reason, a 1 wt.%
Au/TiO2 catalyst was prepared by the conventional sol-immobilisation technique and
subsequently tested for the oxidation of FF. The time online data for this reaction is
displayed in Figure 4.1.
Figure 4.1. Time online reaction for the oxidation of FF over Au/TiO2 under standard
reaction conditions. Reaction conditions: 10 mL substrate (0.3 M), NaOH:substrate = 1,
O2 (3 bar), substrate:metal = 2000, 30 ºC, 4 h.
The Au/TiO2 catalyst gives a high selectivity to the desired FA product but a substantial
decrease in the carbon mass balance is observed. A noticeable reduction in catalytic activity
over time is also detected as the reaction proceed which could suggest that the catalyst is
poisoned during the reaction. These observations could indicate that resins are formed in
the reaction as reported in previous publications investigating the selective oxidation of
0
10
20
30
40
50
60
70
80
90
100
0.0 1.0 2.0 3.0 4.0
% C
onver
sion /
Sel
ecti
vit
y /
C.M
.B.
Time (h)
Conversion Furoic Acid Furfuryl Alcohol C.M.B.

Chapter 4 | The Selective Catalytic Oxidation of Furfural
121
FF13, 15. If this is the case, it is clear that the formation of these species has a negative impact
on the performance of the catalyst. It is believed that the formation of these species is
caused by the interaction of two FF species32. For this reason, a possible method of reducing
this may be to increase the quantity of catalyst in the reaction in order to reduce
intermolecular interactions between the substrate species. Consequentially, further tests
were conducted with higher quantities of catalyst in order to assess how this effected
reaction profile. There results of these tests are displayed in Figure 4.3.
Figure 4.2. The effect of temperature on the performance of a 1% Au/TiO2 catalyst for the
oxidation of FF is displayed. Data reflects samples collected after 4 h of reaction. Reaction
conditions: 10 mL substrate (0.3 M), NaOH:substrate = 1, O2 (3 bar), substrate:metal =
2000, temperature stated, 4 h.
As expected, increasing the quantity of the catalyst had a positive effect on substrate
conversion. Even at high quantities of catalyst, deactivation was still observed although the
extent did appear to decrease. It is likely that the magnitude of resin formation is the same
0
10
20
30
40
50
60
70
80
90
100
20.0 30.0 40.0 50.0 60.0 70.0 80.0
% C
onver
sion /
Sel
ecti
vit
y /
C.M
.B.
Temperature (ºC)
Conversion Furoic Acid Furfuryl Alcohol C.M.B.

Chapter 4 | The Selective Catalytic Oxidation of Furfural
122
with all the catalyst masses and the observed decrease in deactivation may just be attributed
to the increase in active sites present.
In an attempt to gain a further understanding of the polymerisation pathway, further tests
were conducted where the reaction temperature was increased. These tests are displayed in
Figure 4.2.
Figure 4.3. The effect of catalyst mass on the conversion of FF was assessed. A 1%
Au/TiO2 catalyst was used. Reaction conditions: 10 mL substrate (0.3 M),
NaOH:substrate = 1, O2 (3 bar), catalyst mass stated in legend, 30 ºC, 4 h.
Interestingly, substrate conversion and CMB appears to have an inversely proportional
relationship with reaction temperature. The selectivity to FA also appears to decrease at the
expense of FOH. The previous postulation regarding catalyst poisoning appears to be
relevant. Increasing the reaction temperature may have a promotional effect on the
unfavourable polymerisation of FF. If this is the case, it is clear that the resins do poison
the catalyst. In the article by Choudhary and co-workers29 which was discussed previously,
0
10
20
30
40
50
60
70
80
90
100
0 1 2 3 4
% C
onver
sion
Time (h)
117.6 mg 58.8 mg 29.4 mg

Chapter 4 | The Selective Catalytic Oxidation of Furfural
123
higher yields of MEA were achieved when reaction temperature was reduced. Although it
was not stated in the article, it likely that the decreased catalytic performance observed with
higher reaction temperatures was a result of increased resin formation.
It is unlikely that the change in the selectivity profile is a result of increased resin
formation. The increase in selectivity to FOH could indicate that an additional reaction
pathway may be operational. The nature of substrate and the highly basic reaction medium
make it a suitable environment for Cannizzaro reaction to occur between FF molecules.
Given the highly oxidative conditions, it is unlikely that FOH is produced via a catalytic
route. Increasing the reaction temperature would almost certainly promote this reaction
pathway and is likely the reason why selectivity to FOH increases proportionally with
temperature.
Another possible explanation for catalytic deactivation is product inhibition. The drop in
catalytic activity can be correlated with increasing concentrations of FA present in the
reaction. Previous articles have reported that the presence of carboxylic acid groups can
inhibit the activation of alcohols in the presence of a base, as the external OH- species
favour the interaction with acidic COOH groups36. In order to assess whether this was the
case in this reaction, a product inhibition study was conducted. For this, FA was added to
the starting mixture which equated to 0.03 M. Substrate conversion was monitored with
time and compared against the conversion observed under standard reaction conditions.
The result of this test is displayed in Figure 4.4. The presence of additional FA at the
beginning of the reaction does not appear to have any impact on the activity exhibited by
the catalyst. This strengthens the theory that the deactivation observed is a result of resins
poisoning the catalyst.
A 1% Au/TiO2 catalyst can selectively oxidise FF to FA. FOH is produced as a by-product
in the reaction which is likely a result of a base promoted Cannizzaro reaction. Increasing
the temperature appears to promote this reaction as a greater FOH selectivity was observed
as the reaction temperature was increased. The temperature also appears to have a negative
impact on catalytic performance. It was postulated that increasing the temperature
promotes the unfavourable formation of furan based resins which bind irreversibly to the
catalysts active sites. A product inhibition test showed that FA has no detrimental effect on
the activity of the catalyst, hereby strengthening the likelihood that catalyst deactivation is
a result of resin formation.

Chapter 4 | The Selective Catalytic Oxidation of Furfural
124
Figure 4.4. The effect of [FA] on catalytic activity is displayed. Reaction conditions: 10
mL substrate (0.3 M), NaOH:substrate = 1, O2 (3 bar), substrate:metal = 500, 30 ºC, 4 h.
4.4. Optimisation of the Catalyst
The problems associated with the 1 wt.% Au/TiO2 catalyst mean that it is not a suitable
candidate for this process. Despite displaying promising reaction selectivity to FA, the
losses in carbon to the formation of resins and the detrimental impact they appear to have
on the catalyst is unfavourable. Modification of the catalyst is required in order to make
the catalytic process more viable.
MgO has shown to be an exceptionally active support for Au nanoparticles for the oxidation
of alcohols37, 38. For this reason, a 1% Au/MgO catalyst was prepared by the conventional
sol-immobilisation technique and subsequently tested for the oxidation of FF. The results
of this reaction are displayed in Figure 4.5
0
10
20
30
40
50
60
70
80
90
0 1 2 3 4
% C
onver
sion (
%)
Time (h)
Conversion (10% Furoic) Conversion (STD)

Chapter 4 | The Selective Catalytic Oxidation of Furfural
125
It is evident that the support plays a significant role in the activity of the catalyst. An
increase in conversion at 0.5 h from 24.4 % with the Au/TiO2 catalyst to 34.9 % with the
Au/MgO catalyst is observed. The selectivity to FOH is slightly higher suggesting that the
MgO support may be promoting the Cannizzaro pathway. There still appears to be a
significant loss of carbon which suggests that the MgO support does not inhibit the
unfavourable polymerisation pathway; although the activity of the catalyst appears to be
less affected.
The incorporation of Pd into Au supported catalysts has shown to significantly enhance
catalytic activity in the oxidation of benzyl alcohol39. Rather than attempt to design a
catalyst which switches off the polymerisation process it may be more viable to synthesise
a catalyst which suppresses the unfavourable pathway through rapidly promoting the
Figure 4.5. Time online reaction for the oxidation of FF over a 1% Au/MgO catalyst
under standard reaction conditions. Reaction conditions: 10 mL substrate (0.3 M),
NaOH:substrate = 1, O2 (3 bar), substrate:metal = 500, 30 ºC, 4 h.
0
10
20
30
40
50
60
70
80
90
100
0 1 2 3 4
% C
onver
sion /
Sel
ecti
vit
y /
C.M
.B.
Time (h)
Conversion Furoic Acid Furfuryl Alcohol C.M.B.
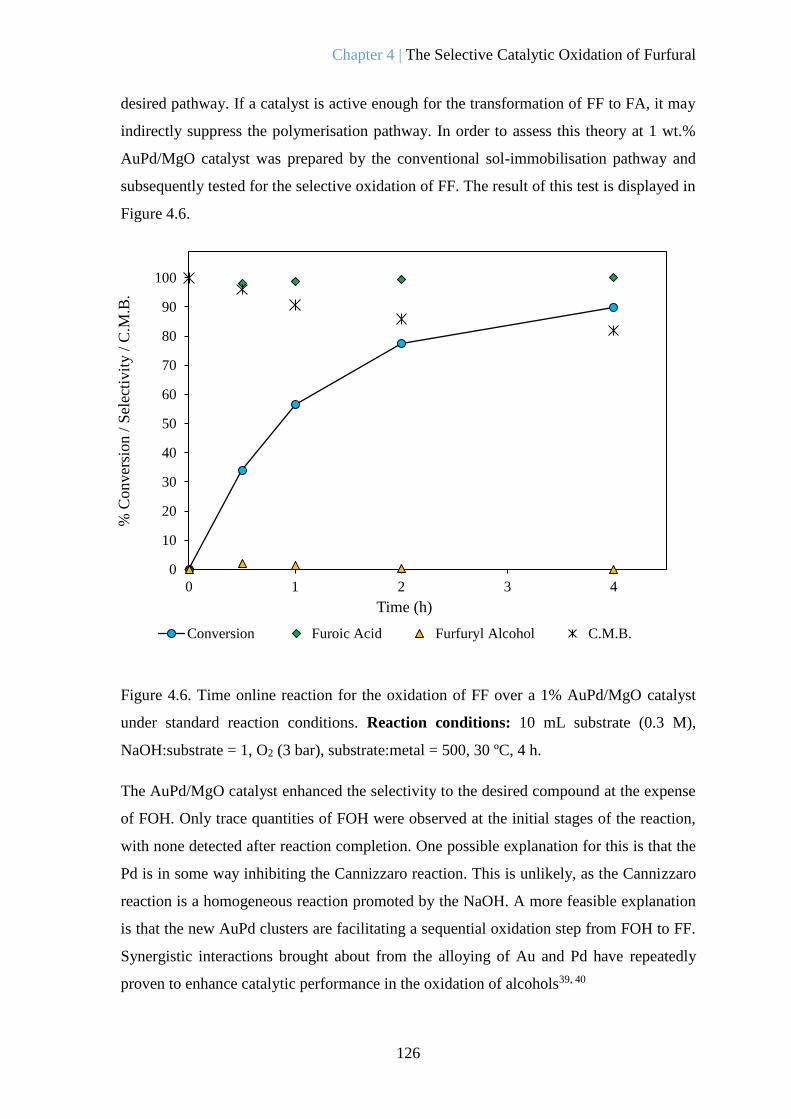
Chapter 4 | The Selective Catalytic Oxidation of Furfural
126
desired pathway. If a catalyst is active enough for the transformation of FF to FA, it may
indirectly suppress the polymerisation pathway. In order to assess this theory at 1 wt.%
AuPd/MgO catalyst was prepared by the conventional sol-immobilisation pathway and
subsequently tested for the selective oxidation of FF. The result of this test is displayed in
Figure 4.6.
Figure 4.6. Time online reaction for the oxidation of FF over a 1% AuPd/MgO catalyst
under standard reaction conditions. Reaction conditions: 10 mL substrate (0.3 M),
NaOH:substrate = 1, O2 (3 bar), substrate:metal = 500, 30 ºC, 4 h.
The AuPd/MgO catalyst enhanced the selectivity to the desired compound at the expense
of FOH. Only trace quantities of FOH were observed at the initial stages of the reaction,
with none detected after reaction completion. One possible explanation for this is that the
Pd is in some way inhibiting the Cannizzaro reaction. This is unlikely, as the Cannizzaro
reaction is a homogeneous reaction promoted by the NaOH. A more feasible explanation
is that the new AuPd clusters are facilitating a sequential oxidation step from FOH to FF.
Synergistic interactions brought about from the alloying of Au and Pd have repeatedly
proven to enhance catalytic performance in the oxidation of alcohols39, 40
0
10
20
30
40
50
60
70
80
90
100
0 1 2 3 4
% C
onver
sion /
Sel
ecti
vit
y /
C.M
.B.
Time (h)
Conversion Furoic Acid Furfuryl Alcohol C.M.B.
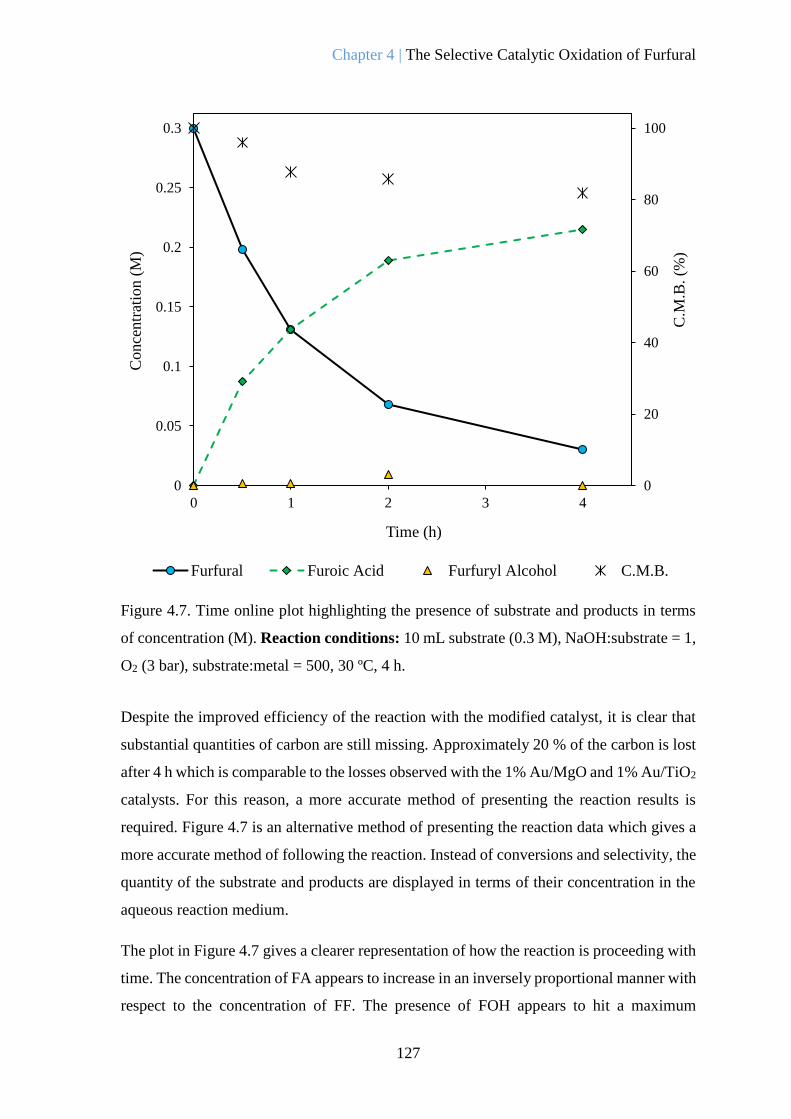
Chapter 4 | The Selective Catalytic Oxidation of Furfural
127
Figure 4.7. Time online plot highlighting the presence of substrate and products in terms
of concentration (M). Reaction conditions: 10 mL substrate (0.3 M), NaOH:substrate = 1,
O2 (3 bar), substrate:metal = 500, 30 ºC, 4 h.
Despite the improved efficiency of the reaction with the modified catalyst, it is clear that
substantial quantities of carbon are still missing. Approximately 20 % of the carbon is lost
after 4 h which is comparable to the losses observed with the 1% Au/MgO and 1% Au/TiO2
catalysts. For this reason, a more accurate method of presenting the reaction results is
required. Figure 4.7 is an alternative method of presenting the reaction data which gives a
more accurate method of following the reaction. Instead of conversions and selectivity, the
quantity of the substrate and products are displayed in terms of their concentration in the
aqueous reaction medium.
The plot in Figure 4.7 gives a clearer representation of how the reaction is proceeding with
time. The concentration of FA appears to increase in an inversely proportional manner with
respect to the concentration of FF. The presence of FOH appears to hit a maximum
0
20
40
60
80
100
0
0.05
0.1
0.15
0.2
0.25
0.3
0 1 2 3 4
C.M
.B. (%
)
Conce
ntr
atio
n (
M)
Time (h)
Furfural Furoic Acid Furfuryl Alcohol C.M.B.
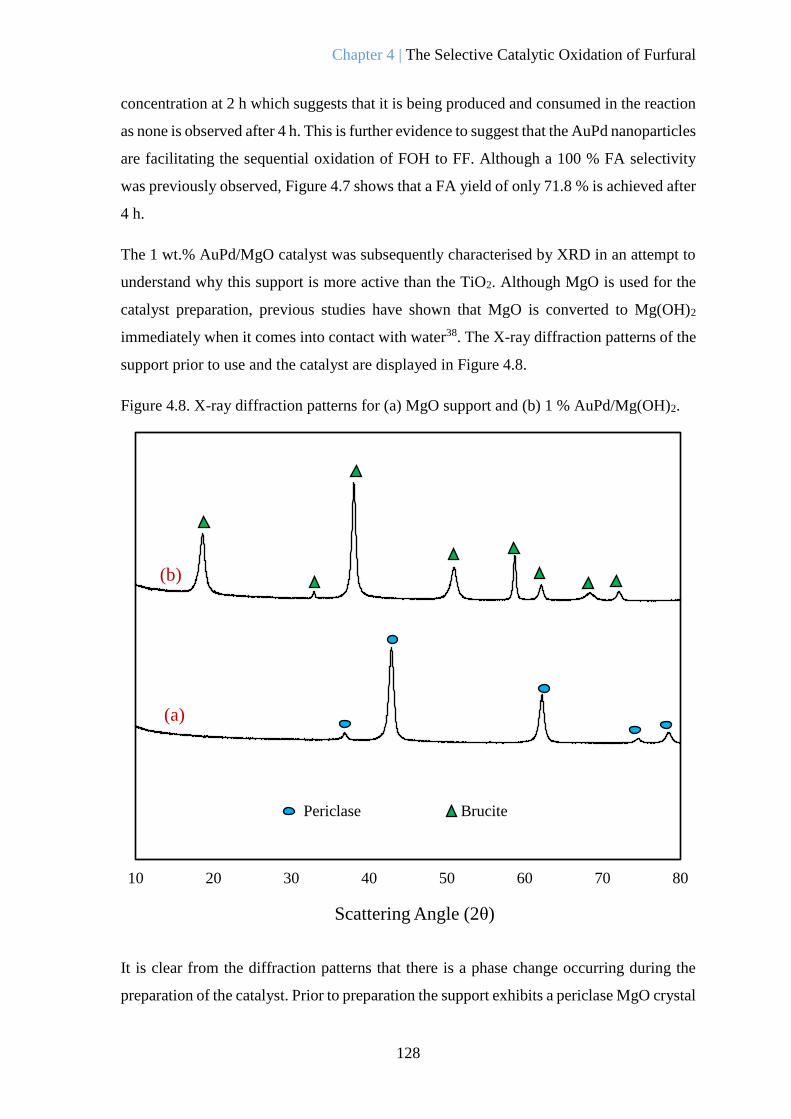
Chapter 4 | The Selective Catalytic Oxidation of Furfural
128
concentration at 2 h which suggests that it is being produced and consumed in the reaction
as none is observed after 4 h. This is further evidence to suggest that the AuPd nanoparticles
are facilitating the sequential oxidation of FOH to FF. Although a 100 % FA selectivity
was previously observed, Figure 4.7 shows that a FA yield of only 71.8 % is achieved after
4 h.
The 1 wt.% AuPd/MgO catalyst was subsequently characterised by XRD in an attempt to
understand why this support is more active than the TiO2. Although MgO is used for the
catalyst preparation, previous studies have shown that MgO is converted to Mg(OH)2
immediately when it comes into contact with water38. The X-ray diffraction patterns of the
support prior to use and the catalyst are displayed in Figure 4.8.
Figure 4.8. X-ray diffraction patterns for (a) MgO support and (b) 1 % AuPd/Mg(OH)2.
It is clear from the diffraction patterns that there is a phase change occurring during the
preparation of the catalyst. Prior to preparation the support exhibits a periclase MgO crystal
10 20 30 40 50 60 70 80
Scattering Angle (2θ)
(a)
(b)
Periclase Brucite

Chapter 4 | The Selective Catalytic Oxidation of Furfural
129
structure. As postulated by Brett et al. H2O appears to have facilitated a phase transition to
brucite Mg(OH)2. The detection of this phase change is important as it reveals that there is
a greater population of hydroxide sites on the surface of the support than previously
thought. Although there are a lot of other factors to consider when comparing catalytic
supports, it is likely that the increase in catalytic performance is a result of the increased
population of hydroxyl groups near the active site. Davis and co-workers have reported the
importance of surface bound hydroxyl species have to the performance of Au supported
heterogeneous catalysts for the oxidation of glycerol36. It was suggested that increasing the
concentration of hydroxyl species on the surface increased the reaction rate as it enhanced
the formation of surface bound peroxy species. It is possible that the formation of these
species promote the catalytic oxidation of FF and FOH.
As discussed previously, there is evidence to suggest that a NaOH promoted Cannizzaro
reaction is competing with the catalytic oxidation of FF to FA. In order to confirm whether
this is the case, a series of tests were conducted and the corresponding results are displayed
in Figure 4.9.
Figure 4.9. AuPd/Mg(OH)2 and Mg(OH)2 are assessed as catalysts for the oxidation of FF
under standard conditions. An additional test in the absence of a catalyst is also displayed.
Data is after a 4 h reaction. Reaction conditions: 10 mL substrate (0.3 M), NaOH:substrate
= 1, O2 (3 bar), substrate:metal = 500 where stated, 30 ºC, 4 h.
0
20
40
60
80
100
0.00
0.05
0.10
0.15
0.20
0.25
0.30
AuPd/Mg(OH)2 Mg(OH)2 No Catalyst
% C
.M.B
.
Conce
ntr
atio
n (
M)
Furfural Furoic Acid Furfuryl Alcohol C.M.B.
AuPd/Mg(OH)2 Mg(OH)2

Chapter 4 | The Selective Catalytic Oxidation of Furfural
130
The formation of FA and FOH in the absence of any catalyst confirms that a Cannizzaro
reaction is taking place. It is also clear how important the presence of the AuPd
nanoparticles are to the performance of the catalyst. Despite the highly basic surface of the
Mg(OH)2, it does not appear to have any promotional effect on the Cannizzaro reaction as
the yields of FOH and FA observed in its presence are comparable with the blank reaction.
Interestingly, the CMB observed for the reaction with Mg(OH)2 is noticeably lower than
that observed in the blank reaction despite there being similar rates of disproportionation.
This may suggest that the support is in fact promoting the polymerisation pathway. It was
previously proposed that the polymerisation of FF is initiated by the abstraction of an H
atom from the furan ring15. It is possible that the high population of hydroxyl groups on the
surface of the support may be promoting this H+ abstraction which would rationalize the
low mass balance observed in the reaction with Mg(OH)2. In the presence of the
AuPd/Mg(OH)2 catalyst, a comparable mass balance is observed to that in the absence of
any catalyst. This could suggest that the AuPd nanoparticles may be inhibiting the
polymerisation pathway through the promotion of the direct oxidation pathway.
Despite optimisation of the catalyst the formation of resins still appears to be a significant
problem in the reaction system. It is clear that FF is incredibly susceptible to intermolecular
interactions and so additional measures are required in order to minimise the extent of FF
polymerisation. For this reason, a different experimental procedure was enforced in order
to limit the contact time between FF compounds in the absence of any catalyst. The new
experimental procedure involves the insertion of pure FF directly into the stirring aqueous
reaction mixture containing the catalyst, NaOH and water. Once added, the reactor is
immediately sealed and pressurised with O2. In previous reactions, a bulk solution of FF
(0.3 M) was made up prior to the reaction. A standard reaction was completed using the
modified procedure and the comparison of the results with the previous method is displayed
in Figure 4.10.
It is clear that the modified oxidation procedure is far more suitable for this process than
the conventional method. Using the modified method an elevated conversion, FA yield and
C.M.B. was achieved. It is likely that this desirable increase in performance is a result of
less polymerisation taking place. Not only does this provide a more effective method of
conducting the reactions but it also provides further evidence to the postulations provided
previously regarding the formation of resins and their role in catalyst deactivation. Other

Chapter 4 | The Selective Catalytic Oxidation of Furfural
131
work has shown how limiting the contact time of FF compounds using a biphasic solvent
system for the formation of MEA reduced resin formation. Despite the significant reduction
in resin formation, a full conversion of the substrate was still not achieved using the
modified experimental procedure.
Figure 4.10. The oxidation of FF over a 1% AuPd/Mg(OH)2 catalyst by conventional and
modified experimental procedures. Reaction conditions: 10 mL substrate (0.3 M),
NaOH:substrate = 1, O2 (3 bar), substrate:metal = 500, 30 ºC, 4 h.
Mg(OH)2 appears to be a more suitable support for Au nanoparticles for this reaction than
TiO2. The nature of this phase was confirmed by XRD. The incorporation of Pd appears to
promote the overall performance of the catalyst with a noticeable increase in the
suppression of the unfavourable polymerisation pathway. A different method of analysis
was determined which gives a more accurate representation of the reaction. The
performance of blank reactions confirmed the occurrence of the Cannizzaro reaction. The
Mg(OH)2 support did not appear to have any promotional effect on this reaction although
there is evidence to suggest that it promoted the polymerisation pathway. A new
experimental method for running the reactions was determined which reduced the loss of
carbon to resins. For this reason, all future testing in this chapter is conducted using this
modified procedure.
0
20
40
60
80
100
0.00
0.05
0.10
0.15
0.20
0.25
0.30
Conventional Modified
C.M
.B. (%
)
Conce
ntr
atio
n (
M)
Furfural Furoic Acid Furfuryl Alcohol C.M.B.

Chapter 4 | The Selective Catalytic Oxidation of Furfural
132
4.5. A Mechanistic Overview
In order to gain a greater understanding of the reaction system, it was necessary to conduct
a full mechanistic study to gain an insight into how the reaction conditions and catalyst
may be optimised to promote catalytic performance.
4.5.1. The Oxidation of Furfural
A time online plot for the oxidation of FF over a 1% AuPd/Mg(OH)2 catalyst is displayed
in Figure 4.11. The catalyst was prepared twice and each batch was tested three times in
order to gage the reproducibility and accuracy of the results. Error margins were applied in
accordance with the standard deviation of the six tests.
Figure 4.11. A time online plot for the oxidation of FF over a 1% AuPd/Mg(OH)2 catalyst.
Error margins were assigned in accordance with the standard deviation of 6 separate tests
with 2 different catalyst batches. Reaction conditions: 10 mL substrate (0.3 M),
NaOH:substrate = 1, O2 (3 bar), substrate:metal = 500, 30 ºC, 4 h.
0
20
40
60
80
100
0.00
0.05
0.10
0.15
0.20
0.25
0.30
0 1 2 3 4
Time (h)
C.M
.B. (%
)
Conce
ntr
atio
n (
M)
Furfural Furoic Acid FurfuraL Alcohol Carbon Balance

Chapter 4 | The Selective Catalytic Oxidation of Furfural
133
The catalytic testing procedure is reproducible as the deviation away from the mean of the
data points appears to be fairly low. This strengthens the industrial viability of this process
as the susceptibility of the substrate to partake in competitive polymerisation reactions does
not appear to be effect the reproducibility of the results.
The effect of base on the performance of the 1% AuPd/Mg(OH)2 catalysts was assessed in
an attempt to understand it’s role on the oxidation of the aldehyde. For this, testing was
conducted where the substrate to base ratio was varied and the catalytic performance
monitored. The results of this set of experiments are displayed in Figure 4.12.
Figure 4.12. The base to substrate ratio is varied in order to assess the effect it has on the
performance of the 1% AuPd/Mg(OH)2 catalyst. Tests were conducted using the modified
experimental procedure. Data reflects samples taken after of 4 h of reaction. Reaction
conditions: 10 mL substrate (0.3 M), NaOH:substrate is stated, O2 (3 bar), substrate:metal
= 500, 30 ºC, 4 h.
0
20
40
60
80
100
0.00
0.05
0.10
0.15
0.20
0.25
0.30
0 0.5 1 2
C.M
.B. (%
)
Conce
ntr
atio
n (
M)
NaOH : FF
Furfural Furoic Acid Furfuryl Alcohol C.M.B.

Chapter 4 | The Selective Catalytic Oxidation of Furfural
134
The activity of the catalyst clearly increases proportionally with the concentration of
NaOH. This suggests that external hydroxide ions play a pivotal role in the catalyst reaction
mechanism. It was previously displayed in Chapter 3 that some aldehydes and ketones are
readily oxidised by NaOH in the absence of a catalyst. The results displayed in Figure 4.9
suggest that this is not the case with FF, as it appears that FA observed in the absence of
the catalyst was produced from a Cannizzaro reaction between two FF compounds. It’s
possible that the adsorption of the substrate to the catalyst is required to weaken the C-H
bond and allow for the subsequent oxidation to take place. The subsequent nucleophilic
attack of the OH ion could occur through co-adsorption or directly from solution.
It was determined that the concentration of FA is at a maximum at a 1:1 base to substrate
ratio. This could suggest that the NaOH may catalyse an additional pathway as well as the
oxidation of the aldehyde to acid. It has already been postulated that base may promote the
polymerisation pathway. The decrease in the C.M.B. observed at a NaOH ratio of 2 could
be further evidence to suggest that the polymerisation of FF is promoted by OH ions. This
is in agreement with work published by Lan et al.15 who suggested that the polymerisation
of FF is initiated through the abstraction of a hydrogen atom from the furan ring. In the
absence of any base, the activity exhibited by the catalyst was comparable with that
observed at a base to substrate ratio of 0.5. There are two possible explanations for this
observation: (i) The surface of the Mg(OH)2 support is highly populated with hydroxide
groups which could be supplying the hydroxide ions required for the mechanism to proceed
and (ii) Mg is leaching from the support, interacting with H2O and to form a weak
homogeneous base. The leaching of Mg from Mg(OH)2 in water has been reported
previously38. MP-AES was conducted on the post reaction effluent of the base free test and
confirmed the presence of substantial quantities of Mg in the solution. This Mg leaching
must be a consequence of the supports erosion by FA which is produced. No Mg was
observed in the reaction effluent of the reactions conducted in the presence of base which
is likely a result of the sodium interchanging with the proton of the acids and thus
quenching their acidity. All these postulations suggest that the similar activity observed at
base to substrate ratios of 0 and 0.5 are likely a result of contributions from both (i) and
(ii).
The effect of oxygen pressure on the reaction system was also assessed. Oxygen has
previously shown to have a significant effect on catalytic performance in oxidation

Chapter 4 | The Selective Catalytic Oxidation of Furfural
135
reactions41, 42. A series of experiments were conducted where the quantity of oxygen was
varied. The results of these tests are displayed in Figure 4.13.
As with so many other oxidation reactions, it is clear that oxygen has a significant
promotional effect on the reaction rate. Increasing the oxygen pressure increases the
substrate consumption, FA yield and the CMB. It has been suggested previously that O2
dissociates on the surface of Au through reduction with H2O, yielding adsorbed OH
species43-45. The importance of OH ions on catalytic performance for this reaction was
previously highlighted in Figure 4.12. The significant promotional effect observed in O2
rich environments further supports the postulation that O2 dissociates to produce surface
Figure 4.13. The quantity of oxygen is varied in order to assess the effect it has on the
performance of the 1% AuPd/Mg(OH)2 catalyst. Tests were conducted using the modified
experimental procedure. He corresponds to the reactor purged 5 times and charged with 3 bar
of Helium. Data reflects samples taken after of 4 h of reaction. Reaction conditions: 10 mL
substrate (0.3 M), NaOH:substrate =1, O2 pressure is stated, substrate:metal = 500, 30 ºC, 4 h.
0
20
40
60
80
100
0.00
0.05
0.10
0.15
0.20
0.25
0.30
He Atmospheric 1.5 bar O2 3 bar O2
C.M
.B. (%
)
Conce
ntr
atio
n (
M)
Furfural Furoic Acid Furfuryl Alcohol C.M.B.

Chapter 4 | The Selective Catalytic Oxidation of Furfural
136
bound hydroxyl species. Furthermore, this may suggest that surface bound hydroxide
species are more likely to interact in the surface oxidation mechanism and that external
hydroxide species must first adsorb to the catalyst prior to involvement in the mechanism.
The proportional relationship between O2 concentration and CMB could also indicate that
O2 inhibits the unfavourable polymerisation mechanism through the promotion of the
catalytic aldehyde oxidation.
Under atmospheric conditions, there is noticeably more FA produced than FOH. This
suggests that even under extremely low levels of O2, the catalyst is still able to adsorb and
dissociate O2. The concentration of FOH observed is comparable with that observed in the
absence of any catalyst which implies that the catalyst has no promotional effect on the
production of FOH. In the absence of any atmospheric oxygen in the reactor, the
polymerisation pathway appears to take complete control as exceptionally low CMBs are
observed. Residual quantities of FA and FOH are also present which likely contributions
from the Cannizzaro reaction. However, the quantities of FA and FOH are significantly
lower than that observed in the absence of any catalyst. Furthermore, there appears to be
no contribution from the catalytic aldehyde oxidation. This highlights the importance of O2
in the catalytic oxidation of the aldehyde and also the importance of surface bound OH
species. Furthermore, the rate of polymerisation appears to increase exponentially in the
absence of O2 which appears to have resulted in the suppression of the Cannizzaro reaction.
4.5.2. The Cannizzaro Reaction
As it has been reported previously, two molecules of FF can interact in the presence of base
to form a stoichiometric ratio of FOH and FA. Figure 4.14 shows how the Cannizzaro
reaction proceeds with time under standard reaction conditions.
It is clear from the small quantities of FA and FOH observed throughout the reaction, that
the rate of the Cannizzaro reaction is significantly slower than the catalytic aldehyde
oxidation. The significant loss in carbon highlights the substantial polymerisation that takes
place in the absence of the catalyst. This supports the statement made previously that the
catalyst restricts the polymerisation through the promotion of the catalytic aldehyde
oxidation. The rate of polymerisation appears to be faster than the rate of the Cannizzaro
reaction. In order to assess how the Cannizzaro reaction and the polymerisation were

Chapter 4 | The Selective Catalytic Oxidation of Furfural
137
effected by base, a series of experiments were constructed where the NaOH to substrate
ratio was varied. The results of these tests are displayed Figure 4.15.
It is clear that as the concentration of NaOH is increased the rate of the Cannizzaro reaction
increases. This trend is expected as sacrificial hydroxyl groups are required for the initial
activation of the substrate molecule. Interestingly, a higher concentration of FA than FOH
is observed for each of the data points. The Cannizzaro reaction typically produces
stoichiometric equivalents of each. This may suggest that FA is in fact more stable than
FOH and that polymerisation can occur from FOH as well as from FF. The CMB appears
0
10
20
30
40
50
60
70
80
90
100
0
0.05
0.1
0.15
0.2
0.25
0.3
0 1 2 3 4
C.M
.B. (%
)
Conce
ntr
atio
n (
M)
Time (h)
Furfural Furfural Alcohol Furoic Acid C.M.B
Figure 4.14. A time online plot for the Cannizzaro reaction in the absence of catalyst. Error
margins were assigned in accordance with the standard deviation of 4 separate tests. Tests
were conducted using the modified experimental procedure. Reaction conditions: 10 mL
substrate (0.3 M), NaOH:substrate =1, O2 (3 bar), substrate:metal = 500, 30 ºC, 4 h.

Chapter 4 | The Selective Catalytic Oxidation of Furfural
138
to decrease as the concentration of NaOH in the reaction increases. This is further evidence
to suggest that polymerisation is instigated through interaction with base.
Figure 4.15. The base to substrate ratio is varied in order to assess the effect it has on the
Cannizzaro reaction. Tests were conducted using the modified experimental procedure in
the absence of any catalyst. Data reflects samples taken after of 4 h of reaction. Reaction
conditions: 10 mL substrate (0.3 M), NaOH:substrate is stated, O2 (3 bar), substrate:metal
= 500, 30 ºC, 4 h.
It is known that oxygen has no direct influence on the Cannizzaro reaction. The results
displayed in Figure 4.16 support this, as the change in the concentrations of FA and FOH
upon increasing the concentration of O2 in the system is negligible. That said, the
concentrations of these products do appear to decrease very slightly with increasing O2
which may be a result of competition from the polymerisation route. The relative CMB of
each data point appear to support this statement as they decrease with increasing O2. This
0
10
20
30
40
50
60
70
80
90
100
0
0.05
0.1
0.15
0.2
0.25
0.3
0.5 1 2 3
Car
bo
n M
ass
Bal
ance
(%
)
Co
nce
ntr
atio
n (
M)
NaOH : Furfural Ratio
Furfural Furoic Acid Furfuryl Alcohol CMB

Chapter 4 | The Selective Catalytic Oxidation of Furfural
139
can be correlated to the earlier postulation that O2 can be reduced in the system to from
*OH and OOH species (although this is generally only considered possible in the presence
of a catalyst). If this reduction is occurring, the extra OH species could be contributing to
the observed increase in polymerisation taking place with increasing O2 concentrations.
It is known that oxygen has no direct influence on the Cannizzaro reaction. The results
displayed in Figure 4.16 support this, as the change in the concentrations of FA and FOH
upon increasing the concentration of O2 in the system is negligible. That said, the
concentrations of these products do appear to decrease very slightly with increasing O2
which may be a result of competition from the polymerisation route. The relative CMB of
0
20
40
60
80
100
0.00
0.05
0.10
0.15
0.20
0.25
0.30
He Atmospheric 1.5 Bar O2 3 Bar O2
C.M
.B. (%
)
Conce
ntr
atio
n (
M)
Furfural Furoic Acid Furfuryl Alcohol C.M.B.
Figure 4.16. The quantity of oxygen is varied in order to assess the effect on the
Cannizzaro reaction. Tests were conducted using the modified experimental procedure.
He corresponds to the reactor purged 5 times and charged with 3 bar of Helium. Data
reflects samples taken after 4 h of reaction. Reaction conditions: 10 mL substrate (0.3
M), NaOH:substrate =1, O2 pressure is stated, substrate:metal = 500, 30 ºC, 4 h.

Chapter 4 | The Selective Catalytic Oxidation of Furfural
140
each data point appear to support this statement as they decrease with increasing O2. This
can be correlated to the earlier postulation that O2 can be reduced in the system to from
*OH and OOH species (although this is generally only considered possible in the presence
of a catalyst). If this reduction is occurring, the extra OH species could be contributing to
the observed increase in polymerisation taking place with increasing O2 concentrations.
4.5.3. The Oxidation of Furfuryl Alcohol
It has been discussed previously in this chapter that the oxidation of FOH may be possible
in the presence of the 1% AuPd/Mg(OH)2 catalyst and under the standard reaction
conditions. For this reason, it was necessary to assess whether this was the case and a
reaction consisting of interval sampling was constructed. As with the oxidation of FF, two
batches of the 1 wt.% AuPd/Mg(OH)2 were tested in order to derive error bars based on
the standard deviation of each data point. The corresponding time online plot is displayed
in Figure 4.17.
It is evident that the oxidation of the FOH does occur in the presence of the catalyst. The
oxidation appears to proceed via FF to FA. The alcohol is initially oxidised to aldehyde
before undergoing a sequential oxidation to the corresponding acid. A loss of carbon is also
observed during this reaction but it is not yet clear whether this is occurring from the FOH
or indirectly from FF. Interestingly, there is a noticeable increase in the loss of carbon when
the concentration of FF in the system is at its maximum. This is evidence that
polymerisation occurs predominantly from FF. FOH appears to be consumed at a slower
rate than FF, which may suggest that oxidation of the alcohol is less thermodynamically
favourable than the oxidation of the aldehyde. This supports work which shows that the
oxidation of benzaldehyde proceeds spontaneously in the absence of any catalyst and under
atmospheric conditions, while benzyl alcohol oxidation requires considerably harsher
conditions and a catalyst46. In order to gain a greater insight into the promotional effect of
NaOH on the alcohol oxidation, tests were conducted where the NaOH to substrate ratio
was varied. The corresponding results are displayed in Figure 4.18

Chapter 4 | The Selective Catalytic Oxidation of Furfural
141
Figure 4.17. A time online plot for the oxidation of FOH over a 1% AuPd/Mg(OH)2
catalyst. Error margins were assigned in accordance with the standard deviation of 4
separate tests with 2 different catalyst batches. Tests were conducted under standard
reaction conditions using the modified experimental procedure. Reaction conditions: 10
mL substrate (0.3 M), NaOH:substrate =1, O2 (3 bar), substrate:metal = 500, 30 ºC, 4 h.
As with the oxidation of FF, increasing the NaOH to substrate ratio clearly increases the
performance of the catalyst for the oxidation of FOH in terms of both selectivity and
activity. The presence of sacrificial hydroxide has been shown to significantly promote the
activity of Au supported catalysts for alcohol oxidation reactions previously41, 47. The
results displayed in Figur 4.18 are in agreement with this work as there is a clear increase
in catalytic activity as the concentration of NaOH increases. Furthermore, an increased
selectivity to the desired acid product with increasing NaOH concentration implies that the
base not only facilitates the initial oxidative dehydrogenation but also the subsequent
oxidation of the aldehyde. The increase in CMB observed with increasing base is further
evidence to suggest that the alcohol can undergo polymerisation to form resins.
0
20
40
60
80
100
0.00
0.05
0.10
0.15
0.20
0.25
0.30
0 1 2 3 4
C.M
.B. (%
)
Conce
ntr
atio
n (
M)
Time (h)
Furfuryl Alcohol Furfural Furoic Acid C.M.B.

Chapter 4 | The Selective Catalytic Oxidation of Furfural
142
The NaOH appears to be promoting the oxidative dehydrogenation pathway through the
suppression of the polymerisation route. Interestingly, the CMB at low concentrations of
base appears to be lower when compared with the mass losses observed for the reaction of
FF. This may suggest that FOH may be more susceptible to undergo polymerisation than
FF. It could also imply that the external hydroxyl groups play a more crucial role in the
mechanism of the oxidative dehydrogenation. Oxygen pressure has also shown to have a
significant impact on the catalytic performance of Au supported catalysts for the oxidation
of alcohols41, 48. For this reason, a series of tests were conducted in order to assess the effect
this variable had on the oxidation of FOH. The results of these tests are displayed in Figure
4.19.
0
20
40
60
80
100
0.00
0.05
0.10
0.15
0.20
0.25
0.30
0 0.5 1 2
C.M
.B. (%
)
Conce
ntr
atio
n (
M)
NaOH : FOH
Furfural Furoic Acid Furfuryl Alcohol C.M.B.
Figure 4.18. The base to substrate ratio is varied in order to assess the effect NaOH has
on the performance of the 1% AuPd/Mg(OH)2 catalyst. Tests were conducted using the
modified experimental. Data reflects samples taken after of 4 h of reaction. Reaction
conditions: 10 mL substrate (0.3 M), NaOH:substrate stated, O2 (3 bar), substrate:metal
= 500, 30 ºC, 4 h.

Chapter 4 | The Selective Catalytic Oxidation of Furfural
143
As with the oxidation of FF, there is a clear increase in catalytic performance as the oxygen
concentration is increased. Increasing the concentration of O2 significantly increases the
rate of FOH consumption at lower concentration. The effect on FOH consumption is less
pronounced at high concentrations. This could suggest that the system is over saturated
with O2 at 1.5 bar, meaning that there is enough O2 in the system at this pressure for the
mechanistic process to be limited. If however we consider the CMB and the overall yield
of FA of these two reactions, there is a notable increase in both data points at 3 bar of O2
pressure. This could suggest that O2 promotes the oxidation of the substrate through the
competitive suppression of the polymerisation pathway. When tests were conducted under
atmospheric conditions and in the presence of 3 bar of He, the activity and desired
selectivity is significantly reduced. The presence of O2 must also have a crucial role in the
0
20
40
60
80
100
0.00
0.05
0.10
0.15
0.20
0.25
0.30
He Atmospheric 1.5 bar O2 3 bar O2
C.M
.B. (%
)
Conce
ntr
atio
n (
M)
Furfural Furoic Acid Furfuryl Alcohol C.M.B.
Figure 4.19. The quantity of oxygen is varied in order to assess the effect it has on the
performance of the 1% AuPd/Mg(OH)2 catalyst. Tests were conducted using the modified
experimental procedure. He corresponds to the reactor purged 5 times and charged with 3
bar of Helium. Data reflects samples taken after 4 h of reaction. Reaction conditions: 10
mL substrate (0.3 M), NaOH:substrate = 1, O2 pressure is stated, substrate:metal = 500,
30 ºC, 4 h.

Chapter 4 | The Selective Catalytic Oxidation of Furfural
144
reaction mechanism. The formation of resins appears to be less effected by oxygen
concentration for the oxidation of FOH than FF. For this reason, it is possible that the route
to the formation of resins is different for both FF and FOH.
4.5.4. Derivation of the Reaction Profile
The tests conducted in this section were designed to give an insight into the mechanistic
profile for the catalytic oxidation of FF. The time online reaction of FF under standard
reaction conditions revealed that trace amounts of FOH could be detected at the early stages
of the reaction. The earlier studies conducted using Au/TiO2 also revealed that the alcohol
can be produced in fairly substantial quantities from FF. It was suggested that this was a
results of a Cannizzaro reaction proceeding between the substrate and the aqueous NaOH.
A time online plot of a reaction from FF in the absence of any catalyst confirmed that the
Cannizzaro reaction is proceeding under the standard reaction conditions. This reaction
does, however, appear to proceed significantly slower than the catalysed FF oxidation.
Interestingly, a time online reaction from FOH under standard reaction conditions revealed
that FA can be produced from the alcohol by a series of oxidations which appear to proceed
via FF. For this reason it can be postulated that the absence of FOH at the end of the
standard FF reaction is a result of the catalysts high affinity to catalyse the oxidation of any
FOH which is produced via the Cannizzaro reaction. A proposed reaction profile is
displayed in Figure 4.20.
A series of tests were also conducted where the concentrations of possible reactants were
varied in order to gain a further understanding of the reaction mechanism. The selective
catalytic oxidation of FF and FOH were clearly promoted by the presence of both NaOH
and O2. Increasing the quantities of both led to increased catalytic activity and favourable
selectivity. Interestingly, both reactions require high levels of both O2 and NaOH in order
to achieve optimal results. Having the maximum quantity of one reactant and none of the
other often led to poor activity and selectivity. This suggests that a synergistic interaction
between the O2 and NaOH could be responsible for achieving favourable results. Davis and
co-workers44, 49 have previously shown that both oxygen and an external hydroxide source
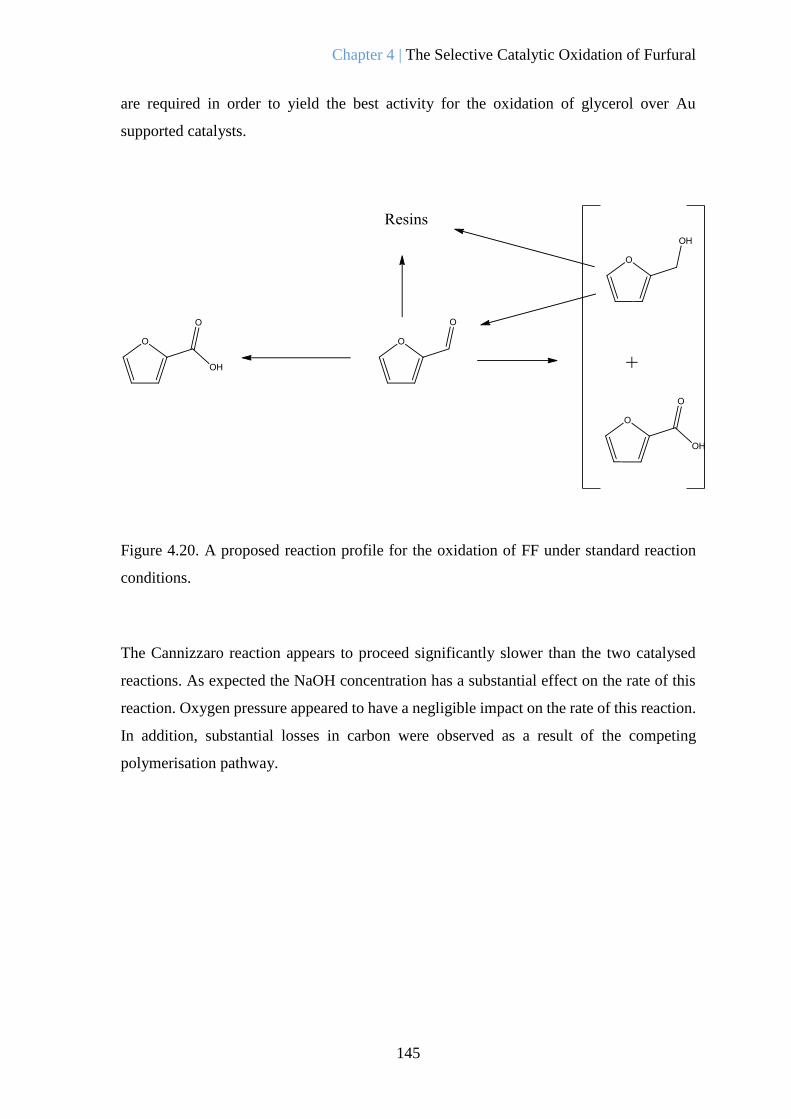
Chapter 4 | The Selective Catalytic Oxidation of Furfural
145
are required in order to yield the best activity for the oxidation of glycerol over Au
supported catalysts.
Figure 4.20. A proposed reaction profile for the oxidation of FF under standard reaction
conditions.
The Cannizzaro reaction appears to proceed significantly slower than the two catalysed
reactions. As expected the NaOH concentration has a substantial effect on the rate of this
reaction. Oxygen pressure appeared to have a negligible impact on the rate of this reaction.
In addition, substantial losses in carbon were observed as a result of the competing
polymerisation pathway.

Chapter 4 | The Selective Catalytic Oxidation of Furfural
146
4.6. Investigation into the Reusability of the AuPd/Mg(OH)2 Catalyst
When conducting academic research it is important to consider the industrial viability of a
given process. A fundamental issue which is often encountered when facilitating the
transfer of lab scale process to an industrial scale is catalyst reusability. For this reason, a
series of experiments were conducted in order to assess the reusability of the 1 wt.%
AuPd/Mg(OH)2 catalyst for this reaction. The catalyst was removed from the reactor post
reaction and subsequently washed, dried and retested under standard reaction conditions.
In some cases, multiple reactions were required to ensure that enough catalyst tested was
available for the subsequent tests. Three re-use tests were conducted and the corresponding
results are displayed in Figure 4.21.
0
20
40
60
80
100
0.00
0.05
0.10
0.15
0.20
0.25
0.30
Fresh One Re-use Two Re-uses Three Re-uses
C.M
.B. (%
)
Conce
ntr
atio
n (
M)
Furfural Furoic Acid Furfuryl Alcohol C.M.B.
Figure 4.21. A re-use study for the oxidation of FF over fresh and used samples of the 1 wt.%
AuPd/Mg(OH)2 catalyst. Tests were conducted using the modified experimental procedure.
Data reflects samples taken after of 4 h of reaction. Reaction conditions: 10 mL substrate (0.3
M), NaOH:substrate = 1, O2 (3 bar), substrate:metal = 500, 30 ºC, 4 h.

Chapter 4 | The Selective Catalytic Oxidation of Furfural
147
From
the reaction data, there is no evidence to suggest that any catalyst deactivation is occurring
Figure 4.22. Images and PSD’s corresponding to some of the catalysts.
(a) Fresh catalyst, (b) used once and (c) used twice.

Chapter 4 | The Selective Catalytic Oxidation of Furfural
148
upon its re-use. The FA yield, FF conversion and CMB remain fairly constant across the
four tests. Particle agglomeration is often associated with catalyst deactivation during
extensive testing protocols. For this reason, TEM was conducted on the samples of the
fresh catalyst and the catalyst tested once and twice. Images of these catalysts along with
their corresponding particle size distributions (PSD’s) are displayed in Figure 4.22.
From the PSD’s it is clear that there is some evidence of particle agglomeration taking
place between each use. Interestingly, this does not appear to have any impact on the
performance of the catalysts which could suggest that particle size may not be crucial to
catalytic performance. It is known that nanoparticles below 5 nm in diameter are active for
alcohol oxidation50, 51. There is no substantial increase in the number of particles above 5
nm which may be why the activity of the catalyst remains constant across the reuse tests.
It is difficult to assess at this point whether the agglomeration is a result of exposure to the
experimental conditions or a result of extended exposure to high temperatures during the
subsequent drying steps. Further work would be required in order to confirm this.
4.7. The Effect of Preparation Technique
In order to assess further the effect of particle size, a series of tests were conducted using
1 wt.% AuPd/Mg(OH)2 catalysts which were prepared using different preparation
techniques. It has been shown previously that the way in which a catalyst is prepared can
significantly influence the performance of Au supported catalysts, which is often a result
of a change in the mean particle size52, 53. AuPd/Mg(OH)2 catalysts prepared by modified-
impregnation and conventional impregnation were prepared and tested for the oxidation of
FF under standard reaction conditions. The results of these tests are displayed in Figure
4.23, along with the results of the standard sol-immobilised AuPd/Mg(OH)2 catalyst.
The catalysts prepared by sol-immobilisation and modified impregnation appear to have
very similar reaction data with both catalysts displaying exceptional activity and selectivity
to FA. Both of these preparation methods are believed to give highly dispersed metal
nanoparticles with a well-defined PSD. These two preparation methods significantly
outperformed the catalyst prepared by the conventional impregnation method. The
conventional impregnation method is known to give a larger, less defined variation in
particle size52. These results suggest that AuPd particle size is a crucial parameter to
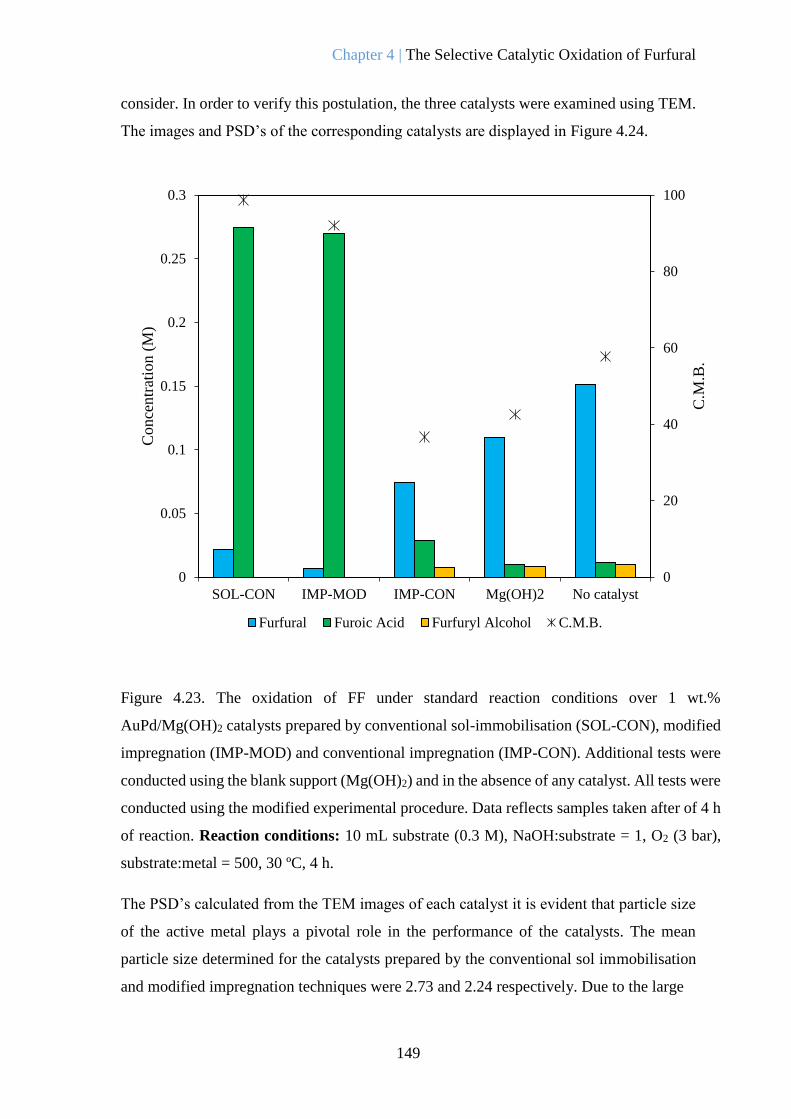
Chapter 4 | The Selective Catalytic Oxidation of Furfural
149
consider. In order to verify this postulation, the three catalysts were examined using TEM.
The images and PSD’s of the corresponding catalysts are displayed in Figure 4.24.
The PSD’s calculated from the TEM images of each catalyst it is evident that particle size
of the active metal plays a pivotal role in the performance of the catalysts. The mean
particle size determined for the catalysts prepared by the conventional sol immobilisation
and modified impregnation techniques were 2.73 and 2.24 respectively. Due to the large
0
20
40
60
80
100
0
0.05
0.1
0.15
0.2
0.25
0.3
SOL-CON IMP-MOD IMP-CON Mg(OH)2 No catalyst
C.M
.B.
Conce
ntr
atio
n (
M)
Furfural Furoic Acid Furfuryl Alcohol C.M.B.
Figure 4.23. The oxidation of FF under standard reaction conditions over 1 wt.%
AuPd/Mg(OH)2 catalysts prepared by conventional sol-immobilisation (SOL-CON), modified
impregnation (IMP-MOD) and conventional impregnation (IMP-CON). Additional tests were
conducted using the blank support (Mg(OH)2) and in the absence of any catalyst. All tests were
conducted using the modified experimental procedure. Data reflects samples taken after of 4 h
of reaction. Reaction conditions: 10 mL substrate (0.3 M), NaOH:substrate = 1, O2 (3 bar),
substrate:metal = 500, 30 ºC, 4 h.

Chapter 4 | The Selective Catalytic Oxidation of Furfural
150
Figure 4.24. TEM images and PSD’s corresponding to the catalysts prepared using
different methods. (a) Conventional sol immobilisation, (b) modified impregnation and
(c) conventional impregnation.

Chapter 4 | The Selective Catalytic Oxidation of Furfural
151
size of the particles in the conventional impregnation technique it was not possible to locate
enough nanoparticles to satisfy the sampling criteria. It was however clear that the mean
particle size of this catalyst was comparably higher than that of the other two catalysts with
particles displaying diameters of up to 80 nm. The performance of this catalyst was poor
when compared to the other two catalysts, and as a result it can be postulated that small
nanoparticles are crucial in order to obtain high catalytic activity, desirable selectivity and
reaction control.
Interestingly, the catalyst prepared by the conventional impregnation has a comparable
reaction profile to that observed for the reaction with Mg(OH)2 and the reaction without a
catalyst. The reaction with the catalyst does appear to yield a higher selectivity towards FA
which suggests that the nanoparticles are functioning at a significantly reduced rate. It is
likely that this is a result of a small proportion of the metal nanoparticles lying within the
active size range.
4.8. The Effect of the Au-Pd Ratio
It has already been shown in this work that the incorporation of Pd into Au supported
catalysts can enhance catalytic performance for the catalytic oxidation of FF. For this
reason, it was important to design a set of experiments in order to investigate the role of
each metal. A series of AuPd/Mg(OH)2 catalysts were prepared using the conventional sol-
immobilisation technique with varied quantities of Au and Pd metal and with a targeted
overall metal loading of 1 wt.%. MP-AES was used in order to precisely identify the metal
loadings of Au and Pd for each of the catalyst. Table 4.1 contains the Au and Pd metal
loadings of each of the catalysts confirmed by MP-AES.
It is clear that the overall metal weight loading fluctuates somewhat. This appears to be a
consequence of higher quantities of Pd loaded onto the support than anticipated. This is
likely a result of the palladium stock solution being higher in Pd concentration than
previously thought. These catalysts were subsequently tested for oxidation of FF to FA. In
order to assure a fair comparison between the catalysts, the mass of catalyst used was varied
in order to satisfy a 500:1 molar substrate to metal ratio. Due to the discrepancies in metal
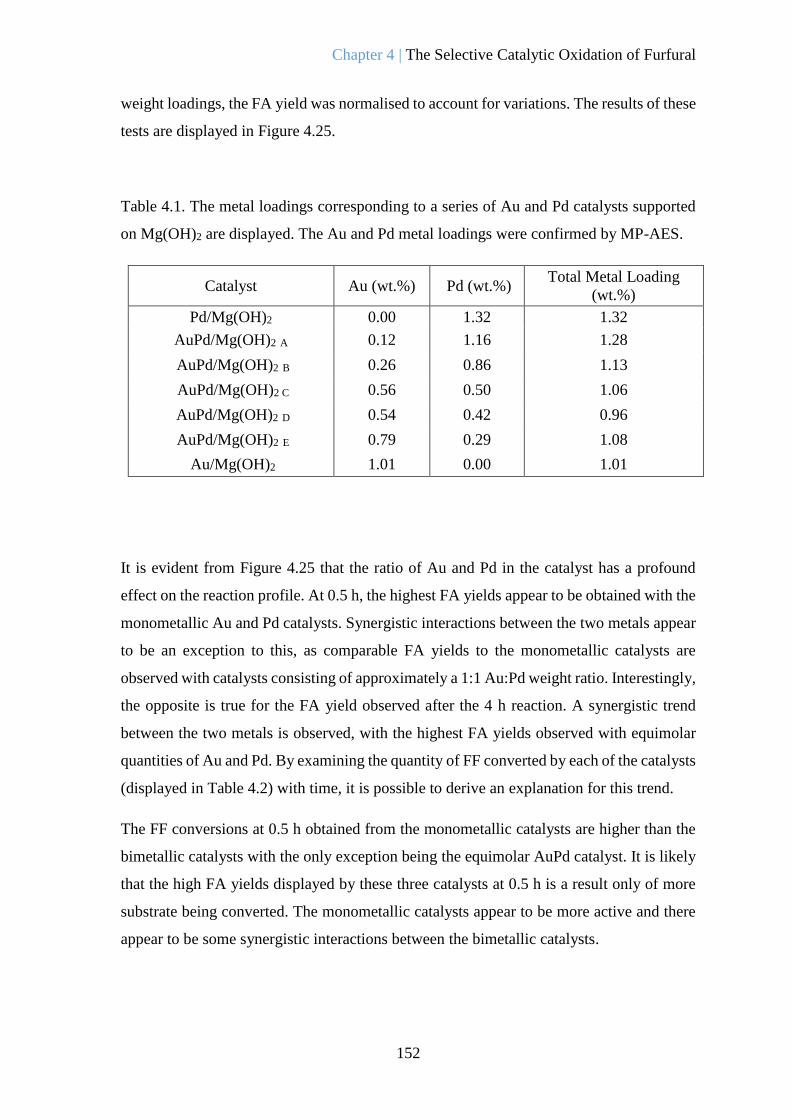
Chapter 4 | The Selective Catalytic Oxidation of Furfural
152
weight loadings, the FA yield was normalised to account for variations. The results of these
tests are displayed in Figure 4.25.
Table 4.1. The metal loadings corresponding to a series of Au and Pd catalysts supported
on Mg(OH)2 are displayed. The Au and Pd metal loadings were confirmed by MP-AES.
Catalyst Au (wt.%) Pd (wt.%) Total Metal Loading
(wt.%)
Pd/Mg(OH)2 0.00 1.32 1.32
AuPd/Mg(OH)2 A 0.12 1.16 1.28
AuPd/Mg(OH)2 B 0.26 0.86 1.13
AuPd/Mg(OH)2 C 0.56 0.50 1.06
AuPd/Mg(OH)2 D 0.54 0.42 0.96
AuPd/Mg(OH)2 E 0.79 0.29 1.08
Au/Mg(OH)2 1.01 0.00 1.01
It is evident from Figure 4.25 that the ratio of Au and Pd in the catalyst has a profound
effect on the reaction profile. At 0.5 h, the highest FA yields appear to be obtained with the
monometallic Au and Pd catalysts. Synergistic interactions between the two metals appear
to be an exception to this, as comparable FA yields to the monometallic catalysts are
observed with catalysts consisting of approximately a 1:1 Au:Pd weight ratio. Interestingly,
the opposite is true for the FA yield observed after the 4 h reaction. A synergistic trend
between the two metals is observed, with the highest FA yields observed with equimolar
quantities of Au and Pd. By examining the quantity of FF converted by each of the catalysts
(displayed in Table 4.2) with time, it is possible to derive an explanation for this trend.
The FF conversions at 0.5 h obtained from the monometallic catalysts are higher than the
bimetallic catalysts with the only exception being the equimolar AuPd catalyst. It is likely
that the high FA yields displayed by these three catalysts at 0.5 h is a result only of more
substrate being converted. The monometallic catalysts appear to be more active and there
appear to be some synergistic interactions between the bimetallic catalysts.

Chapter 4 | The Selective Catalytic Oxidation of Furfural
153
The FF conversions at 0.5 h obtained from the monometallic catalysts are higher than the
bimetallic catalysts with the only exception being the equimolar AuPd catalyst. It is likely
that the high FA yields displayed by these three catalysts at 0.5 h is a result only of more
substrate being converted. What can be said is that the monometallic catalysts appear to be
more active and there appear to be some synergistic interactions between the bimetallic
catalysts.
0
10
20
30
40
50
60
70
80
90
100
0
10
20
30
40
50
60
70
80
90
100
0 20 40 60 80 100
Au content (wt.%)
C.M
.B. (%
)
Norm
alis
ed F
A Y
ield
(%
)
0.5 h 4 h C.M.B
Figure 4.25. A series of catalysts containing varied quantities of Au and Pd supported on
Mg(OH)2 were tested for the oxidation of FF using the modified experimental procedure and
under standard conditions. The normalised FA yield for each catalyst is displayed at 0.5 h and
4 h along with the C.M.B. at 4 h. Reaction conditions: 10 mL substrate (0.3 M),
NaOH:substrate = 1, O2 (3 bar), substrate:metal = 500, 30 ºC, 4 h.

Chapter 4 | The Selective Catalytic Oxidation of Furfural
154
Table 4.2. The FF conversions at 0.5 h for the corresponding catalysts are displayed.
Reaction conditions: 10 mL substrate (0.3 M), NaOH:substrate = 1, O2 (3 bar),
substrate:metal = 500, 30 ºC, 4 h.
There is a clear synergistic trend in the observed FA yield at 4 h. As the active metal content
of the catalysts become more equimolar, the normalised FA yield is greater. A similar trend
is observed for the carbon mass balance. It is possible that the high activity displayed by
the monometallic catalysts is detrimental to their overall performance. The low CMBs
associated with these catalysts suggest that a significant proportion of substrate is being
lost to polymerisation. It is well known that chemical species formed in reaction can reduce
catalytic activity through active site poisoning54
It can be postulated that short surface lifetimes of the substrate may be responsible for their
formation. The low initial conversions associated with the equimolar catalysts may be a
result of synergistic interactions which in turn lead to stronger adsorption of the substrate
to the nanoparticles. Another possibility is that a higher population of desirable active sites
are present in the equimolar catalysts which would lead to higher FA yields. It is difficult
to suggest how plausible these theories are at this point but further work consisting of
adsorption studies could shed more light on the reactivity of these catalysts.
Au (%) Conversion (%)
0.0 54
9.2 40
23.3 35
52.6 52
56.4 35
73.5 45
100.0 77

Chapter 4 | The Selective Catalytic Oxidation of Furfural
155
4.9. Application of Kinetics to the Reaction System
Reaction kinetics are an incredibly useful tool in order to develop a greater understanding
of a reaction system. Determination of the reaction rates and reaction orders can reveal
useful information regarding the reaction mechanism and subsequently assist with catalyst
design.
Due to the complexity of this reaction system, assigning reaction orders and rate constants
is difficult. It has been determined that there are at least three reactions leading to the
formation FA proceeding simultaneously. The first step in obtaining the rate constants for
the three reactions was to determine the reaction orders with respect to each reactant. This
was conducted using the initial rates methodology. Due to the sensitivity of the substrate
to undergo polymerisation, the reaction rates were monitored in terms of FA produced
rather than the traditional method of substrate consumption. In addition, the competitive
nature of the catalytic aldehyde oxidation and the Cannizzaro reaction meant that it was
difficult to derive accurate figures for the FA concentration produced by these pathways.
In order to account for this, the concentration of FA produced from the Cannizzaro reaction
was deducted from the concentration of FA produced in the presence of the catalyst. This
is summarised in equation 1.
[FA]DO = [FA]total – [FA]CAN
Equation 1. An expression used to determine rate in which FF is consumed through the
direct catalytic oxidation to FA. DO - Direct catalytic oxidation, CAN – Cannizzaro
reaction, total – standard reaction from FF in the presence of a catalyst.
Additionally, the oxidative dehydrogenation of alcohol was monitored by the total
concentration of FF and FOH produced. This is summarised in equation 2.
[FOH]Consumed = ([FF] + [FA])
Equation 2. An expression used to determine the rate in which FOH was consumed through
catalytic oxidation.

Chapter 4 | The Selective Catalytic Oxidation of Furfural
156
Finally, the rate of the Cannizzaro reaction is determined by monitoring the concentration
of FA produced in the absence of any catalyst.
This method of determining the rates of each reaction are reliant upon three assumptions.
1. FA is stable in the reaction system.
2. The supported metal nanoparticles do not actively promote the Cannizzaro reaction.
3. FA produced via the Cannizzaro pathway is minimal when monitoring the rate of
the oxidative dehydrogenation pathway.
4.9.1. Determination of the Reaction Orders
The reaction order of each pathway was derived by monitoring the effect [substrate], [O2]
and [NaOH] had on the reaction rate. For each reaction, short term interval sampling was
used to derive reaction rates using the initial rates methodology. Figure 4.26 demonstrates
how the reaction rate of each pathway is affected when the substrate concentration is varied.
The catalytic oxidation of FF appears to follow first order kinetics with respect to the
substrate concentration. Determining the reaction order of the oxidative dehydrogenation
is more difficult. At low FOH concentrations, the reaction appears to follow first order
kinetics. However, as the concentration reaches the standard reaction concentration (0.3
M), it appears to change to follow zero order reaction kinetics. It is likely that this is a result
of active site saturation. As the concentration of the substrate is increased beyond 0.2 M,
the catalytic turnover is limited by the surface lifetime of substrate. This suggests that the
oxidative dehydrogenation reaction obeys zeroth order kinetics under standard reaction
conditions. The Cannizzaro reaction appears to follow second order kinetic with respect to
the substrate. This is expected as two substrate molecules are consumed in each reaction.
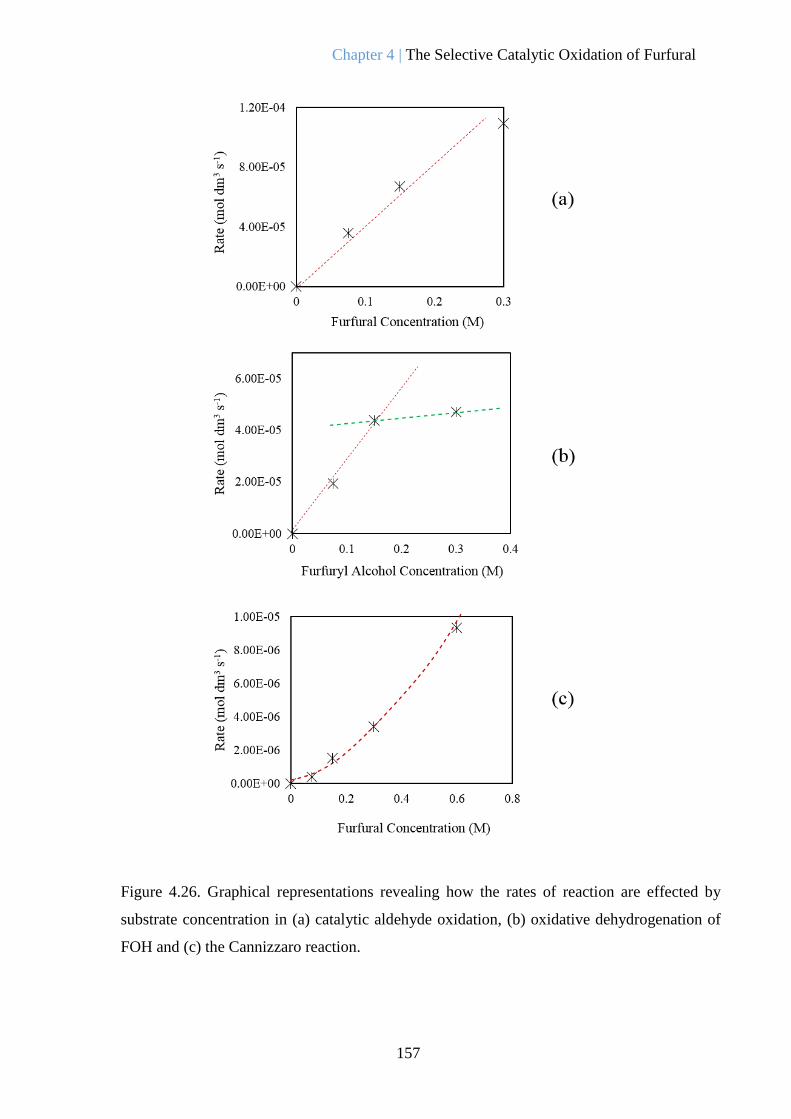
Chapter 4 | The Selective Catalytic Oxidation of Furfural
157
Figure 4.26. Graphical representations revealing how the rates of reaction are effected by
substrate concentration in (a) catalytic aldehyde oxidation, (b) oxidative dehydrogenation of
FOH and (c) the Cannizzaro reaction.

Chapter 4 | The Selective Catalytic Oxidation of Furfural
158
Figure 4.27. Graphical representations revealing how the rates of reaction are effected by
NaOH concentration in (a) catalytic aldehyde oxidation, (b) oxidative dehydrogenation of FOH
and (c) the Cannizzaro reaction.

Chapter 4 | The Selective Catalytic Oxidation of Furfural
159
Figure 4.27 reveals how the rate of each reaction is affected by the concentration of NaOH.
For the catalytic oxidation of FF, a first order trend is observed. This suggests that there is
Figure 4.28. Graphical representations revealing how the rates of reaction are effected
by NaOH concentration in (a) catalytic aldehyde oxidation, (b) oxidative
dehydrogenation of FOH and (c) the Cannizzaro reaction.

Chapter 4 | The Selective Catalytic Oxidation of Furfural
160
a stoichiometric relationship between NaOH and this reaction pathway – one molecule of
NaOH is consumed for each conversion of FF to FA. The catalyst offers an alternative
reaction pathway which involves the nucleophilic attack of the aldehyde by the –OH
species. As this transformation does not appear to take place in the absence of the catalyst,
it must be assumed that the substrate must be bound to the surface of the catalyst for this
to occur. It was postulated previously in this chapter that the binding of the substrate may
weaken the C-H bond of the targeted carbon centre, hereby facilitating the substitution of
the H with the sacrificial OH species. The relationship between the reaction rate and NaOH
strengthens this theory as a possible mechanistic solution.
Interestingly, the rate of the oxidative dehydrogenation pathway does not appear to be
effected by NaOH concentration. This may suggest that NaOH plays no part in the
oxidation of the alcohol species. This is unusual as it is known that hydroxyl groups often
play an important in the activation of the substrate49 in oxidation reactions involving Au
catalysts. Another possible explanation for this result is that the catalyst is saturated with
OH species prior to the first data point. It is likely that if additional reactions were
conducted at lower concentrations of NaOH, a rate dependence on NaOH concentration
would be observed. As it stands, under the standard reaction conditions the NaOH
concentration has a zero order relationship with the reaction rate.
It is well known that the Cannizzaro reaction is initiated through an interaction between the
substrate and base55. From this statement it is obvious that the rate of the Cannizzaro
reaction would be dependent on the concentration of NaOH. Figure 4.27 shows that at low
concentrations of base, the rate of the reaction appears to have a first order relationship
with respect to NaOH concentration. As the NaOH concentration increases, the relationship
appears to become more second order in nature. This observation is not unusual as previous
publications investigating the kinetics of the Cannizzaro reaction have documented the
same trend55. At high concentrations of base it is stated that an interaction between an
R.CHO22- species and FF can occur. Two molecules of NaOH would be required for the
formation of this doubly charged anion. It is unlikely that this secondary pathway is
dominant at a concentration of 0.3 M. For the estimation of the rate constants, it must be
assumed that the rate of the Cannizzaro reaction is first order with respect to NaOH under
standard reaction conditions.

Chapter 4 | The Selective Catalytic Oxidation of Furfural
161
Figure 4.28 reveals how the rate of each reaction is affected by the concentration of O2. In
order to determine the molar concentration of O2 in the system, pressures in bar were
converted to molar concentration using the ideal gas law.
There is a clear first order relationship between the reaction rate and O2 pressure for the
catalytic oxidation of FF to FA. This suggests that O2 must play a pivotal role in the reaction
mechanism. As discussed in Chapter 3, H2O has been found to reduce O2 in other similar
catalytic reactions44, leading to the formation of *OH and *OOH species. It is likely that
these species are responsible for the increase in reaction rate as oxygen concentration is
increased. A first order relationship is also observed for the oxidative dehydrogenation
reaction, which is likely a result of the same species being formed. Interestingly, there is
no change in the rate of the Cannizzaro reaction when the concentration of O2 is varied.
This is expected as O2 is not considered to play a part in previously published derivations
of the Cannizzaro mechanism55. However, if *OH radical species are being produced
through the reduction of O2 by NaOH you may expect to see some dependence on O2. The
fact that no dependence is observed could suggest that *OH radicals are only generated in
small quantities or rapidly decompose under the reaction conditions. If this is the case then
it is likely that the rate of the catalytic oxidation of FF and oxidative dehydrogenation
pathways are more dependent on the *OOH species being produced.
To summarise, under standard conditions the direct oxidation pathway has a first order rate
dependence on substrate, NaOH and O2 concentrations. The oxidative dehydrogenation has
a first order rate dependence on substrate and O2 concentration and a zero order rate
dependence with respect to NaOH. The rate of the Cannizzaro reaction has a second order
relationship with respect to substrate concentration, a first order relationship with respect
to NaOH concentration and a zero order rate dependence with respect to O2.

Chapter 4 | The Selective Catalytic Oxidation of Furfural
162
4.9.2. Determination of Reactions Rate Constants
The rate equations of each reaction were derived from the initial rates study. They are
displayed in Figure 4.29.
From the rate equations in 4.29, it is possible to derive rate constants for each reaction. In
order for this to be possible, the rate (K) of each reaction must be determined. Figure 4.30
contains graphs corresponding to the initial rates measurements of each reaction. Again
using the initial rates methodology, it is possible to extract the relative rates of each
reaction. It was determined that KCAO, KOD and KCAN is 0.0001096, 0.0000639 and
0.00000339 mol dm-3 s-1. By taking these initial rates and inserting them into each rate
equation along with the starting concentrations of each reactant, it is possible to determine
the rate constant for each reaction.
Table 4.3. The rate equations and rate constants derived for each of the reaction pathways.
Pathway Rate Equation Rate constant (k)
Catalytic Aldehyde
Oxidation (CAO) K = k.[FF]1.[O2]
1.[NaOH]1 5.89 x 10⁻³ mol-2 dm6 s-1
Oxidative Dehydrogenation
(DO) K = k.[FF]1.[O2]
1.[NaOH]0 1.33 x 10⁻³ mol-1 dm3 s-1
Cannizzaro Reaction (CAN) K = k.[FF]2.[O2]0.[NaOH]1 8.22 x 10⁻⁵ mol-2 dm6 s-1
Figure 4.29 The rate equations derived from the initial rates experiments for; DO – Catalytic
oxidation of FF to FA, OD – Catalytic oxidative dehydrogenation of FALC and CAN-
intermolecular Cannizzaro reaction.
KDO = k.[FF]1.[O2]1.[NaOH]1
KOD = k.[FF]1.[O2]1.[NaOH]0
KCAN = k.[FF]2.[O2]0 .[NaOH]1

Chapter 4 | The Selective Catalytic Oxidation of Furfural
163
4.9.3. Determination of the Activation Energies (Ea)
Figure 4.30. Initial rates experiments for (a) catalytic aldehyde oxidation, (b) oxidative
dehydrogenation and (c) the Cannizzaro reaction. All reactions were conducted under
standard reaction conditions.

Chapter 4 | The Selective Catalytic Oxidation of Furfural
164
Having systematically determined the reaction orders and rate constants of each reaction
pathway, it was then necessary to determine the activation energy (Ea) of each reaction
pathway in order to give a more complete understanding of the reaction profile. In order to
do this, additional initial rate experiments were conducted for each of the reactions at varied
temperatures. Due to the problems associated with polymerisation experienced at elevated
temperatures, initial rate experiments were conducted at lower temperatures than the
standard reaction temperature. The rate constants were derived for each reaction at each
temperature using the same method shown previously. Once derived, it was possible to use
the rate constants to create Arrhenius plots for each of the reactions. These are displayed
in Figure 4.31. From the Arrhenius plots it was possible to derive activation energies for
each of the reactions.
Table 4.4. Derived data for the kinetics of each reaction pathway observed in the catalytic
oxidation of FF.
Reaction Cannizzaro Oxidative
Dehydrogenation
Catalytic Aldehyde
Oxidation
Catalytic NO YES YES
Rate Equation K = k . [FF]2 . [O2]0
. [NaOH]1
K = k . [FAlc]1 . [O2]1 .
[NaOH]0
K = k . [FF]1 . [O2]1 .
[NaOH]1
Reaction Order Third Second Third
Activation Energy
(Ea) 78.4 KJ mol-1 32.9 KJ mol-1 13.9 KJ mol-1
Activation energies of 13.9 KJ mol-1, 32.9 KJ mol-1 and 78.4 KJ mol-1 were determined for
the catalytic aldehyde oxidation, oxidative dehydrogenation and the Cannizzaro reaction
respectively. The significant increase in activation energy required for the substrate to form
FA via the Cannizzaro pathway compared with the catalytic oxidation of FF. The observed
conversion of substrate to FA via the Cannizzaro pathway is insignificant when compared
to the reaction in the presence of the catalyst. The presence of the catalyst significantly
reduces the activation barrier by offering an alternative reaction pathway. Additionally, the
activation energy determined for FOH oxidation is higher than the aldehyde oxidation
suggesting that the oxidative dehydrogenation to form the aldehyde is a more energy
intensive transformation.

Chapter 4 | The Selective Catalytic Oxidation of Furfural
165
Figure 4.31. Arrhenius plots for (a) catalytic aldehyde oxidation, (b) the oxidative
dehydrogenation of FOH and (c) the Cannizzaro reaction

Chapter 4 | The Selective Catalytic Oxidation of Furfural
166
4.10. Conclusions
The Primary objective of this area of work was to find a catalyst which could selectively
oxide FF to FA efficiently, under mild reaction conditions. It was quickly determined that
the presence of a sacrificial base complicated the system, as it led to the activation of
competitive reaction pathways.
Initial investigations trialled the use of a 1 wt.% Au/TiO2 catalyst for this reaction.
Reasonable results were obtained but significant quantities of carbon were lost which was
suggested to be a result of intermolecular polymerisation of FF in the solution. It was
subsequently discovered that increasing the reaction temperature promoted this
unfavourable polymerisation, which consequentially led to the reactions being conducted
at 30 ºC. Catalyst deactivation appeared to be a problem. Product inhibition studies
confirmed that FA had no effect on catalytic performance. As a result, it was hypothesised
that the loss in catalytic performance over time was a result of the irreversible binding of
resins to the active sites of the catalyst.
The catalyst was subsequently optimised in an attempt to reduce the polymerisation of FF
through the promotion of the desired pathway. Mg(OH)2 (confirmed by XRD) had
previously be found to be a highly active support for Au nanoparticles in the oxidation of
Alcohols38. For this reason, a 1 wt.% Au/Mg(OH)2 catalyst was produced and tested under
the standard reaction conditions. A significant improvement in the conversion of FF was
observed, however, polymerisation still appeared to be a problem as the C.M.B. observed
was comparable with that displayed by the 1 wt.% Au/TiO2 catalyst. Incorporation of Pd
into the Au/Mg(OH)2 catalyst significantly reduced the polymerisation, which ultimately
allowed for higher yields of FA to be generated. Interestingly, the rate of FF consumption
decreased with the AuPd/Mg(OH)2 system despite the reduction in polymerisation. It was
speculated that the incorporation Pd may alter the electronic properties of the active site
and ultimately effected the binding strength of the substrate to the site. This is however,
purely speculation and more work would be required to confirm this hypothesis. The
AuPd/Mg(OH)2 catalyst was subsequently used as the standard catalyst for the remaining
work and reuse tests determined that the catalyst did not appear to deactivate upon
subsequent uses.
Tests conducted in the absence of any catalysed confirmed that a Cannizzaro reaction
producing stoichiometric quantities of FOH and FA was also taking place. This confirmed

Chapter 4 | The Selective Catalytic Oxidation of Furfural
167
a hypothesis made earlier in the chapter as small quantities of FOH were consistently
detected. In order to gain a further understanding of the reaction profile, a mechanistic
study was conducted where the effect of NaOH and O2 on each reaction pathway was
assessed. It was determined that the oxidation rate of FF and FOH was significantly
promoted by both NaOH and O2. NaOH has previously been shown to significantly
promote the oxidation of alcohols36 and work in Chapter 3 revealed that carbonyls could
undergo oxidation through interaction with NaOH in the absence of a catalyst. O2 can be
reduced by H2O to produce surface bound hydroxyl species which are considered to be
crucial in oxidation reactions involving Au nanoparticles44, 49. It was determined that the
Cannizzaro reaction was significantly promoted by NaOH but did not appear to be effected
by O2. This was expected as O2 is not believed to play a part in the Cannizzaro reaction
mechanism55. It was determined that any alcohol produced via the Cannizzaro pathway was
rapidly oxidised back to FF, which explained why only small quantities of FOH were
observed in the standard reaction.
The size of the AuPd particles were found to have a significant effect on the performance
of the catalyst. Additional AuPd/Mg(OH)2 catalysts prepared by Mod-IMP and Con-IMP
were tested. The Mod-IMP has comparable activity to the standard sol-immobilsed
catalyst, whereas the catalyst prepared by Con-IMP has very little influence on the reaction.
Each catalyst was characterised by TEM and it was determined that the catalyst prepared
by Con-IMP consisted of significantly larger metal particles, hence the link between
particle size and activity was derived. It is well known that the particle size of Au
nanoparticles significantly influences catalytic activity in oxidation reactions50, 56. The
relationship between Au and Pd was also addressed. A series of catalysts with varying
Au:Pd ratios were prepared and tested for the oxidation of FF. It was clear that a synergistic
relationship between Au and Pd existed. High activities but poor C.M.B’s were observed
when monometallic Au and Pd catalysts were tested. As the molar ratio between Au and
Pd becomes more stoichiometric, slower reaction rates but higher yields of FA were
observed. This increased reaction control supports the hypothesis made previously;
incorporation of Pd into Au may alter the electronic properties of the nanoparticles, which
could ultimately change to binding strength of the substrate to the active site.
Finally, kinetics was applied to the system in order to assess the efficiency of the catalytic
reaction. The initial rates method was used in order to determine the rate equations for the
oxidation of FF, the oxidation of FOH and the Cannizzaro reaction. These rate equations

Chapter 4 | The Selective Catalytic Oxidation of Furfural
168
were then used to calculate activation energies for each of the reactions which were derived
through the use of Arrhenius plots. Activation energies of 13.9, 32.9 and 78.4 KJ mol-1
were derived for the oxidation of FF, oxidation of FOH and the Cannizzaro reaction
respectively. It is important to mention that the kinetic study was dependent on a number
of assumption and the figures acquired can only really be considered as estimates at this
time. Significantly more data points must be included in the kinetic studies for the acquired
figures to be consider accurate.
It is important to note that the Cannizzaro reaction is the current industrial method used for
the preparation of FA from FF26. A substantially lower activation barrier was calculated for
the oxidation of FF when compared to the Cannizzaro reaction, which clearly underlines
the potential of using a catalyst for this process industrially.
4.11. References
1. C. M. Cai, T. Y. Zhang, R. Kumar and C. E. Wyman, Journal of Chemical
Technology and Biotechnology, 2014, 89, 2.
2. A. Bohre, S. Dutta, B. Saha and M. M. Abu-Omar, ACS Sustainable Chemistry &
Engineering, 2015, 3, 1263.
3. P. Gallezot, Chemical Society Reviews, 2012, 41, 1538.
4. J.-P. Lange, E. van der Heide, J. van Buijtenen and R. Price, Chemsuschem, 2012,
5, 150.
5. H. Y. Zheng, Y. L. Zhu, B. T. Teng, Z. Q. Bai, C. H. Zhang, H. W. Xiang and Y.
W. Li, Journal of Molecular Catalysis A-Chemical, 2006, 246, 18.
6. S. Sitthisa and D. E. Resasco, Catalysis Letters, 2011, 141, 784.
7. L. R. Baker, G. Kennedy, M. Van Spronsen, A. Hervier, X. J. Cai, S. Y. Chen, L.
W. Wang and G. A. Somorjai, Journal of the American Chemical Society, 2012,
134, 14208.
8. S. G. Wang, V. Vorotnikov and D. G. Vlachos, ACS Catalysis, 2015, 5, 104.
9. S. Iqbal, X. Liu, O. F. Aldosari, P. J. Miedziak, J. K. Edwards, G. L. Brett, A.
Akram, G. M. King, T. E. Davies, D. J. Morgan, D. K. Knight and G. J. Hutchings,
Catalysis Science & Technology, 2014, 4, 2280.

Chapter 4 | The Selective Catalytic Oxidation of Furfural
169
10. J. G. Zeikus, M. K. Jain and P. Elankovan, Applied Microbiology and
Biotechnology, 1999, 51, 545.
11. A. Corma, S. Iborra and A. Velty, Chemical Reviews, 2007, 107, 2411.
12. C. Delhomme, D. Weuster-Botz and F. E. Kuehn, Green Chemistry, 2009, 11, 13.
13. S. Shi, H. Guo and G. Yin, Catalysis Communications, 2011, 12, 731.
14. H. Guo and G. Yin, Journal of Physical Chemistry C, 2011, 115, 17516.
15. J. H. Lan, Z. Q. Chen, J. C. Lin and G. C. Yin, Green Chemistry, 2014, 16, 4351.
16. N. Alonso-Fagundez, I. Agirrezabal-Telleria, P. L. Arias, J. L. G. Fierro, R.
Mariscal and M. L. Granados, RSC Advances, 2014, 4, 54960.
17. Y. Tachibana, T. Masuda, M. Funabashi and M. Kunioka, Biomacromolecules,
2010, 11, 2760.
18. H. Choudhary, S. Nishimura and K. Ebitani, Chemistry Letters, 2012, 41, 409.
19. K. J. Zeitsch, in The chemistry and technology of furfural and its many by-products,
Elsevier, 2000, vol. 13, pp. 225-228.
20. C. J. Tsai, W. C. Chang, C.-H. Chen, H. Y. Lu and M. Chen, European Polymer
Journal, 2008, 44, 2339.
21. E. Taarning, I. S. Nielsen, K. Egeblad, R. Madsen and C. H. Christensen,
Chemsuschem, 2008, 1, 75.
22. F. Boccuzzi, A. Chiorino, M. Manzoli, P. Lu, T. Akita, S. Ichikawa and M. Haruta,
Journal of Catalysis, 2001, 202, 256.
23. F. Menegazzo, M. Signoretto, F. Pinna, M. Manzoli, V. Aina, G. Cerrato and F.
Boccuzzi, Journal of Catalysis, 2014, 309, 241.
24. X. L. Tong, Z. H. Liu, L. H. Yu and Y. D. Li, Chemical Communications, 2015,
51, 3674.
25. M. Signoretto, F. Menegazzo, L. Contessotto, F. Pinna, M. Manzoli and F.
Boccuzzi, Applied Catalysis B-Environmental, 2013, 129, 287.
26. K. J. Zeitsch, in The chemistry and technology of furfural and its many by-
products Elsevier, 2000, vol. 13, pp. 159-163.
27. P. Parpot, A. P. Bettencourt, G. Chamoulaud, K. B. Kokoh and E. M. Beigsir,
Electrochimica Acta, 2004, 49, 397.
28. Q. Y. Tian, D. X. Shi and Y. W. Sha, Molecules, 2008, 13, 948.
29. H. Choudhary, S. Nishimura and K. Ebitani, Applied Catalysis A-General, 2013,
458, 55.
30. A. Gandini and M. N. Belgacem, Actualite Chimique, 2002, 56.

Chapter 4 | The Selective Catalytic Oxidation of Furfural
170
31. K. Lamminpaa, J. Ahola and J. Tanskanen, Industrial & Engineering Chemistry
Research, 2012, 51, 6297.
32. K. Lamminpaa, J. Ahola and J. Tanskanen, RSC Advances, 2014, 4, 60243.
33. H. J. Guo and G. C. Yin, Journal of Physical Chemistry C, 2011, 115, 17516.
34. X. Yang, X. Wang, C. Liang, W. Su, C. Wang, Z. Feng, C. Li and J. Qiu, Catalysis
Communications, 2008, 9, 2278.
35. M. Haruta and M. Date, Applied Catalysis A-General, 2001, 222, 427.
36. W. C. Ketchie, M. Murayama and R. J. Davis, Topics in Catalysis, 2007, 44, 307.
37. V. V. Costa, M. Estrada, Y. Demidova, I. Prosvirin, V. Kriventsov, R. F. Cotta, S.
Fuentes, A. Simakov and E. V. Gusevskaya, Journal of Catalysis, 2012, 292, 148.
38. G. L. Brett, Q. He, C. Hammond, P. J. Miedziak, N. Dimitratos, M. Sankar, A. A.
Herzing, M. Conte, J. A. Lopez-Sanchez, C. J. Kiely, D. W. Knight, S. H. Taylor
and G. J. Hutchings, Angewandte Chemie-International Edition, 2011, 50, 10136.
39. D. I. Enache, J. K. Edwards, P. Landon, B. Solsona-Espriu, A. F. Carley, A. A.
Herzing, M. Watanabe, C. J. Kiely, D. W. Knight and G. J. Hutchings, Science,
2006, 311, 362.
40. W. B. Hou, N. A. Dehm and R. W. J. Scott, Journal of Catalysis, 2008, 253, 22.
41. S. Gil, M. Marchena, L. Sanchez-Silva, A. Romero, P. Sanchez and J. L. Valverde,
Chemical Engineering Journal, 2011, 178, 423.
42. N. Dimitratos, A. Villa and L. Prati, Catalysis Letters, 2009, 133, 334.
43. E. Skupien, R. J. Berger, V. P. Santos, J. Gascon, M. Makkee, M. T. Kreutzer, P. J.
Kooyman, J. A. Moulijn and F. Kapteijn, Catalysts, 2014, 4, 89.
44. B. N. Zope, D. D. Hibbitts, M. Neurock and R. J. Davis, Science, 2010, 330, 74.
45. B. N. Zope and R. J. Davis, Green Chemistry, 2011, 13, 3484.
46. M. Sankar, E. Nowicka, E. Carter, D. M. Murphy, D. W. Knight, D. Bethell and G.
J. Hutchings, Nature Communications, 2014, 5, 6.
47. A. Villa, N. Janjic, P. Spontoni, D. Wang, D. S. Su and L. Prati, Applied Catalysis
A-General, 2009, 364, 221.
48. B. N. Zope, S. E. Davis and R. J. Davis, Topics in Catalysis, 2012, 55, 24.
49. M. S. Ide and R. J. Davis, Accounts of Chemical Research, 2014, 47, 825.
50. W. C. Ketchie, Y.-L. Fang, M. S. Wong, M. Murayama and R. J. Davis, Journal of
Catalysis, 2007, 250, 94.
51. N. Dimitratos, J. A. Lopez-Sanchez, D. Lennon, F. Porta, L. Prati and A. Villa,
Catalysis Letters, 2006, 108, 147.

Chapter 4 | The Selective Catalytic Oxidation of Furfural
171
52. N. Dimitratos, J. A. Lopez-Sanchez, J. M. Anthonykutty, G. Brett, A. F. Carley, R.
C. Tiruvalam, A. A. Herzing, C. J. Kiely, D. W. Knight and G. J. Hutchings,
Physical Chemistry Chemical Physics, 2009, 11, 4952.
53. N. Dimitratos, J. A. Lopez-Sanchez, S. Meenakshisundaram, J. M. Anthonykutty,
G. Brett, A. F. Carley, S. H. Taylor, D. W. Knight and G. J. Hutchings, Green
Chemistry, 2009, 11, 1209.
54. M. D. Argyle and C. H. Bartholomew, Catalysts, 2015, 5, 145.
55. J. Clayden, N. Greeves, S. Warren and P. Wothers, Oxford University Press, New
York, 2001, pp. 1081-1082.
56. W. H. Fang, J. S. Chen, Q. H. Zhang, W. P. Deng and Y. Wang, Chemistry-A
European Journal, 2011, 17, 1247.

172
In this thesis, a range of heterogeneous catalysts containg supported Au, Pd and Pt
nanaoparticles were investigated for the selective oxidation of glycerol and the selective
oxidation of furfural. The purpose of this final chapter is to reiterate the conclusions
derived from each body of work and offer additional work which could be conducted to
support the hypotheses drawn.
5.1. The Selective Oxidation of Glycerol
A AuPt/TiO2 was used as a standard catalyst to investigate the effect the reaction conditions
had on the rate and selectivity of the reaction. Increasing the oxygen pressure was found
to promote selectivity to glyceric acid (GA) and tartonic acid (TA) at the expense of lactic
acid (LA). It was suggested that O2 plays a crucial role in this direct oxidation pathway.
Regretably, increasing the pressure of O2 was also found to increase C-C cleavage, which
supports the theory made previously by Davis and co-workers1, 2, that O2 is involved in the
production of H2O2. Perhaps more interestingly, increasing the reaction temperature and
NaOH concentraton was found to siginifcantly promote the production of LA. The
mechanism by which LA is produced from glycerol is somewhat debated in the literature3,
4. Nevertheless, it is agreed that the first two steps involve the oxidation of glycerol to
glyceraldehyde (GD) which is followed by the dehydration of a terminal alcohol group to
produce 2-hydroxyacrylaldehyde. It is possible, that increasing the reaction temperature is
favouring both the oxidation and subsequent dehydration step. An isotopic labelling
experiment involving the use of 18O could be used to prove this, as shown in Figure 5.1.
Figure 5.1. Proposed isotopic labelling experiment. 18O is represented in red.
Chapter 5 Conclusions and Future Work

Chapter 5 | Conclusions and Future Work
173
If the reaction was conducted where the substrate consisted of terminal alcohol groups
containing 18O, it would be possible to determine whether temperature promotes these two
steps. If this is the case, increasing the reaction temperature would lead to higher quantities
of H218O in solution. By running reactions at different temperatures and monitoring the
quantity of H218O in the reaction solution it would theoretically be possible to confirm this
hypothesis.
The next step in the mechanism is debated. It was initially suggested that 2-
hydroxyacrylaldehyde undergoes a rearrangement to produce LA3. A recent publication by
Crabtree and co-workers4 offered a different explanation. They suggested that the 2-
hydroxyacrylaldehyde is first oxidised to methylglyoxal and is subsequently followed by
an intermolecular Cannizzaro reaction to produce LA. An additional isotopic labelling
experiment could be used to confirm this, as shown in Figure 5.2.
Figure 5.2. Isotopic labelling experiment to confirm Cannizzaro reaction. Deuterium is
represented in red.
Starting the reaction from 2-hydroxyacrylaldehyde or methylglyoxal in the presence of
deuterated base (NaOD) would prove that this is the case. This is typically the experimental
method in which Cannizzaro reactions are confirmed5. It would be difficult to conduct this
experiment from glycerol, as it is known that OH plays a crucial role in the activation of

Chapter 5 | Conclusions and Future Work
174
C-H bonds, which could complicate things. An additional complication could arise from
the H atoms in the water interconverting with the deuterated alcohol in LA.
Following this work, experiments were conducted in order to assess how the reaction
products were affected by the catalyst and the reaction conditions. Reactions were
conducted where reactions products such as GA, GD, LA etc. were used as the substrate.
Considerably different reaction rates and product selectivity was observed than expected
when compared to the product distribution and rate of glycerol oxidation. The oxidation of
GA gave exceptionally low reaction rates and poor selectivity to TA was observed for the
oxidation of GA, GD and dihydroxyacetone (DHA). From these results it was suggested
that GA and TA are primary reaction products which would explain why mesoxalic acid
is never observed in the reaction. This observation has been recognised previously, as
Davis and co-workers reported poor activities when oxidising GA in the presence of a 1
wt.% Au/TiO2 catalyst6. It was suggested that this was a result of the external hydroxyl
group (NaOH) favouring interaction with the carboxylic acid group of the substrate rather
than partaking in the activation of the C-H bond. Confirmation that GA and TA are primary
products is exceptionally difficult to prove experimentally. Operando studies using IR, MS
and even the temporal analysis of products (TAP) could be used to assess the identity of
the species and the method in which they bind to the surface of the catalyst.
A lot of emphasis in this thesis was placed on determining the source and mechanism by
which the unfavourable C-C scission occurs. A study was conducted where varied
quantities of H2O2 were added at the beginning of the reaction. Increasing quantities of
H2O2 was found to increase C-C bond cleavage in the initial stages of the reaction. It was
subsequently suggested that H2O2 is directly responsible for the cleavage that occurs in this
reaction which has previously been hypothesised by Davis and co-workers1. The
mechanism by which this occurs however is still unclear. It was proposed in Chapter 3 that
Dakin oxidation was responsible for this cleavage. Dakin oxidation typically involves the
reaction of a hydroxylated phenyl carbonyl with H2O2 in base to produce a benzenediol
and a carboxylate. The high electron density of the hydroxylated phenyl is considered to
have a crucial impact on the kinetics of the reaction and as a result, this reaction is only
really observed when the carbonyl is attached to an ortho- or para- functionalised
hydroxylated phenyl. It was postulated that the high electron density of the nanoparticles
may be able to imitate the hydroxylated phenyl when the substrate is bound to a
nanoparticle. To my knowledge this has never been hypothesised previously. In order to

Chapter 5 | Conclusions and Future Work
175
confirm whether this occurs, isotopic labelling experiments could once again be used. For
proof of concept, it would first be suitable to use a substrate which is known to partake in
Dakin oxidation such as 4-hydroxybenzaldehyde. By conducting a reaction with this
substrate in the presence of a Au supported catalyst and 18O2, it would be possible to
determine whether:
(i) O2 is reduced by H2O to produce H2O2
(ii) Whether H2O2 produced in this way partakes in Dakin Oxidation.
If Dakin oxidation is occurring, you would expect to see a labelled oxygen in the
benzenediol product. A diagrammatic representation of this experiment is displayed in
Figures 5.3 and 5.4.
Figure 5.4. Possible interaction of the labelled H2O2 with the 4-hydroxybenzaldehyde
leading to the formation of the labelled benzene diol. 18O is represented in red.
O2* + H2O* → OOH* + HO*
OOH* + H2O* → H2O2* + HO*
HO* + e− ↔ HO− + *
Figure 5.3. Formation of H2O2 through the reduction of O2 by H2O as proposed by Davis
and co-workers1.
18O is represented in red.
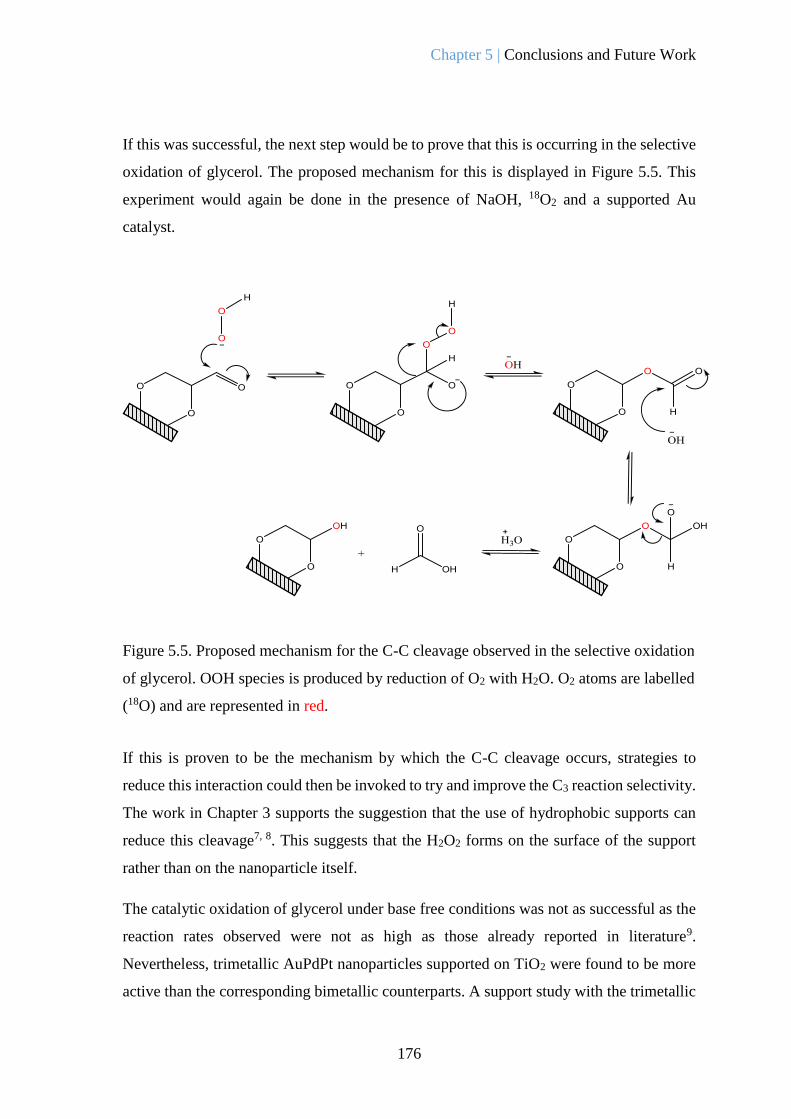
Chapter 5 | Conclusions and Future Work
176
If this was successful, the next step would be to prove that this is occurring in the selective
oxidation of glycerol. The proposed mechanism for this is displayed in Figure 5.5. This
experiment would again be done in the presence of NaOH, 18O2 and a supported Au
catalyst.
If this is proven to be the mechanism by which the C-C cleavage occurs, strategies to
reduce this interaction could then be invoked to try and improve the C3 reaction selectivity.
The work in Chapter 3 supports the suggestion that the use of hydrophobic supports can
reduce this cleavage7, 8. This suggests that the H2O2 forms on the surface of the support
rather than on the nanoparticle itself.
The catalytic oxidation of glycerol under base free conditions was not as successful as the
reaction rates observed were not as high as those already reported in literature9.
Nevertheless, trimetallic AuPdPt nanoparticles supported on TiO2 were found to be more
active than the corresponding bimetallic counterparts. A support study with the trimetallic
Figure 5.5. Proposed mechanism for the C-C cleavage observed in the selective oxidation
of glycerol. OOH species is produced by reduction of O2 with H2O. O2 atoms are labelled
(18O) and are represented in red.

Chapter 5 | Conclusions and Future Work
177
system revealed that the support can significantly influence the reaction rate. With this in
mind, it was postulated that the design and synthesis of base functionalised materials for
use as supports may be a way of promoting the reaction rate further. It has previously been
suggested that hydroxyl species play a crucial role in the activation of C-H bonds which
are required for the initial alcohol oxidations. Wilson and co-workers have recently shown
that Mg-Al solid bases can significantly promote catalytic performance for the base free
oxidation of HMF10. Perhaps materials such as these should be trialled as potential catalysts
supports for this reaction.
Mesoxalic acid has a range of potnetial applications including use as a complexing agent
as well as a precursor to produce 4-chlorophenylhydrazoned mesoxalic acid (MOA), which
has shown to be a promising anti-HIV agent11. For this reason, an efficient method for the
preparation of MOA from glycerol would be desirable. Early work by Gallezot and co-
workers showed that glycerol could be selectively oxidised to MOA over Pt-Bi catalysts12,
13. However, since then there has been very few indications that MOA is produced from
the oxidation of glycerol. As stated earlier in this chapter, this may be a result of hydroxyl
species favouring interaction with the carboxylic acid groups on TA rather than
participating the C-H activation of the remaining alcohol group. It was also suggested
previously that TA may be a primary oxidation product. Using a basic mesoporous material
as the catalyst support could increase the contact time between the substrate and the
catalyst and could allow for the activation of the secondary alcohol group.
5.2. The Selective Oxidation of Furfural
The fundamental objective of this work was to find a catalyst which could selectively
oxidise furfural (FF) to furoic acid (FA). A Au/TiO2 catalyst was initially trialled and was
found to produce adequate yields of FA. Despite this, large quantities of carbon were lost
through the intramolecular polymerisation of FF. The suceptibility of FF to partake in
intramolecular polymerisation reactions had been reported previously14, 15. Time online
reactions revealed that the catalyst appeared to be deactivated over time. Product inhibition
studies involving FA confirmed that it was not the source of the deactivation. It was
postluated that the deactivation was attibuted to the irreversible binding of the polymers to
the catalyst. In order to confirm whether this was the case further work is required.
Identification of the polymer and the spiking of reactions with varying quantities of the

Chapter 5 | Conclusions and Future Work
178
polymeric species could confirm whether this hypothesis is correct. Previous studies
revealed that the use of a biphasic reaction system reduced the extent of the
polymerisation16. It was suggested that this was due to reduced concentration of FF in the
active phase, limiting the interactions between the compounds. For this reason, the
application of this process in a flow reactor or even spinning disk reactors17 could further
improve the selectivity of this process. It would also be interesting to determine whether
the polymerisation is decreased if lower concentrations of FF are used in the reactions.
The use of Mg(OH)2 as a support was found to significantly increase the rate of the
reaction. Mg(OH)2 had previously been shown to be a highly active support for the liquid
phase oxidation of alcohols over gold catalysts9. The enhanced catalytic performance was
attributed to the increased population of hydroxyl groups in close proximity to the active
site. Previous work by Davis and co-workers has highlighted the importance of hydroxyl
species in oxidation reactions involving Au nanoparticles2. Despite the improved reaction
rate, it was evident that polymerisation remained a problem. Pd was subsequently added
to the catalyst in an attempt to reduce the polymerisation through the promotion of the
competative oxidation pathway. Synergistic interactions between Au and Pd have be found
to significantly enhance the reaction rate in the catalytic oxidation of alcohols18, 19.
Interestingly and unexpectedly, a decrease in the reaction rate was observed but an increase
in the FA yield and mass balance was also reported. In order to investigate this further, a
series of AuPd/Mg(OH)2 catalysts were produced with varing metal ratios, and were tested
for the oxidation of FF.
The monometallic Au and Pd catalysts were found to produce the highest reaction rates
but gave the poorest FA yields and a significant quantity of carbon was lost through
polymerisation. Interestingly, as the Au and Pd loading became more stoichiometric, so
too did the reaction rates but signicantly larger yields of FA and higher mass balances were
observed. This trend was suggested to be the result of a synergistic interaction between the
Au and Pd, ultimately leading to a change in the electronic properties of the nanoparticles.
It was hypothesised that this change in the electronic properties of the nanoparticles led to
the formation of higher energy active sites, which in turn, increased the sticking propability
of the substrate and ultimately the binding energy, ultimately leading to a more controled
interaction of the catlyst with the substrate. In order to confirm this theory, further work
investigating the adsorption of FF to the series of the catalysts would be required. One
possible way of doing this would be conduct an isothermic study using temperature

Chapter 5 | Conclusions and Future Work
179
programmed desorption (TPD). This would involve adsorbing a monolayer of FF to the
surface of each catalyst, gradually increasing the temperature and monitoring the
temeprature of desorption. If a trend materialises between the initial rate and the desorption
temperatures of the catalysts, it would provide compelling evidence in support of this
theory.
From an industrial perspective, a catalyst must be able to maintain a high level performance
for extended periods without deactivation. In order to assess the industrial viability of the
AuPd/Mg(OH)2 catalyst, a reusability study was conducted. Three reuse tests were
conducted, where the catalyst was filtered, dried and restestest. There did not appear to be
any reduction in the performance of the catalyst from the experiemental data, however,
TEM indicated that the mean particle size of the AuPd clusters did appear to increase very
slightly after each use. A more comprehensive study involving significantly more reuse
tests would be required in order to truly assess the stability of this catalyst.
Mechanistic studies were used to derive a reaction profle for the system and a complex
reaction profile involving competative reaction pathways emerged (Figure 5.6.)
Figure 5.6. Reaction profile derived for the aerobic oxidation of furfural over a 1 wt.%
AuPd/Mg(OH)2 under basic conditions.

Chapter 5 | Conclusions and Future Work
180
A reaction conducted in the absence of any catalyst produced stoichiometric quantities of
furfuryl alcohol (FOH) and FA which strongly suggested that a NaOH initated Cannizzaro
reaction was taking place. Even in the presence of a catalyst small quantities of FOH were
observed, which suggested that the Cannizzaro reacton was taking place even under
exceptionally oxidising conditions. A deuterated experiment could be conducted to
confirm that the Cannizzaro reaction is operational under these reaction conditions,
although, the experimental results observed in Chapter 4 strongly suggest that the
Cannizzaro reaction is operational in this system. Increasing the concentration of NaOH
and O2 pressure in the reaction was found to significantly promote the catalytic oxidation
of FOH and FF. Various labelling experiments could be used to investigate the role of these
reactants in both the oxidation of FOH and FF. It is likely that NaOH promotes the
activation of C-H bonds, as reported by Davis and co-workers2. The role of O2 is less clear,
but it is likely involved in the formation surface bound OH bonds and the freeing up of
active sites on the metal nanoparticle.
FA is currently produced industrially by the Cannizzaro reaction of FF. This involves the
post reaction seperation of FA from FOH which is both costly and time consuming. It had
previously been stated that the use of a catalyst for this transformation was not viable on
an industrial scale, due to the formation of unfavourable bi-products through competitive
side reactions20. This work has shown that with a highly active heterogeneous catalyst,
these unfavourable side reactions can be suppressed through the promotion of a direct
oxidation pathway. A kinetics study subsequently conducted, primarily to assess how
much more efficient the catalytic process is than the conventional industrial method. Initial
rates tests were conducted in order to determine the rate equations for the oxidative
dehydrogenation of FOH to FF, oxidation of FF to FA and the Cannizzaro reaction. These
rate equations were subsequently used to determine the activation energies of each
reaction. The activation energy for the catalytic oxidation of FF was found to be
substantially lower than that of the Cannizzaro reaction under this set of conditions, which
ultimately highlights the potnetial benefits of using a catalyst for this reaction on an
industrial scale. It is important to mention that this kinetic study was dependent on a
number of different assumptions regarding the reaction profile and significantly more data
points would be required to increase the reliability of this statement. Nevertheless, these
results are exceptionally promising moving forward.

Chapter 5 | Conclusions and Future Work
181
Further optimisation of the catalyst and/or the reaction conditions could completely
irradicate the requirement of an extraction step as no unfavourble by-products are formed.
The next target would be to develop a system capable of yielding 100 % FA yield. It would
also be interesting to see whether this system would work for the oxidation of other similar
substrates such as functionalised pyrroles or thiophenes which are also notoriously difficult
to handle.
5.3. References
1. B. N. Zope, D. D. Hibbitts, M. Neurock and R. J. Davis, Science, 2010, 330, 74.
2. M. S. Ide and R. J. Davis, Accounts of Chemical Research, 2014, 47, 825.
3. P. A. Shaffer and T. E. Friedemann, Journal of Biological Chemistry, 1930, 86,
345.
4. L. S. Sharninghausen, J. Campos, M. G. Manas and R. H. Crabtree, Nature
Communications, 2014, 5.
5. J. Clayden, N. Greeves, S. Warren and P. Wothers, Oxford University Press, New
York, 2001, pp. 1081-1082.
6. W. C. Ketchie, M. Murayama and R. J. Davis, Topics in Catalysis, 2007, 44, 307.
7. L. Prati, A. Villa, C. E. Chan-Thaw, R. Arrigo, D. Wang and D. S. Su, Faraday
Discussions, 2011, 152, 353.
8. A. Villa, N. Dimitratos, C. E. Chan-Thaw, C. Hammond, L. Prati and G. J.
Hutchings, Accounts of Chemical Research, 2015, 48, 1403.
9. G. L. Brett, Q. He, C. Hammond, P. J. Miedziak, N. Dimitratos, M. Sankar, A. A.
Herzing, M. Conte, J. A. Lopez-Sanchez, C. J. Kiely, D. W. Knight, S. H. Taylor
and G. J. Hutchings, Angewandte Chemie-International Edition, 2011, 50, 10136.
10. L. Ardemani, G. Cibin, A. J. Dent, M. A. Isaacs, G. Kyriakou, A. F. Lee, C. M. A.
Parlett, S. A. Parry and K. Wilson, Chemical Science, 2015, 6, 4940.
11. L. Xin, Z. Y. Zhang, Z. C. Wang and W. Z. Li, Chemcatchem, 2012, 4, 1105.
12. P. Fordham, M. Besson and P. Gallezot, Catalysis Letters, 1997, 46, 195.
13. P. Fordham, R. Garcia, M. Besson and P. Gallezot, 11th International Congress on
Catalysis - 40th Anniversary, Pts a and B, 1996, 101, 161.
14. J. H. Lan, Z. Q. Chen, J. C. Lin and G. C. Yin, Green Chemistry, 2014, 16, 4351.
15. H. Guo and G. Yin, Journal of Physical Chemistry C, 2011, 115, 17516.

Chapter 5 | Conclusions and Future Work
182
16. H. J. Guo and G. C. Yin, Journal of Physical Chemistry C, 2011, 115, 17516.
17. X. Feng, D. A. Patterson, M. Balaban and E. A. C. Emanuelsson, Chemical
Engineering Journal, 2014, 255, 356.
18. W. C. Ketchie, M. Murayama and R. J. Davis, Journal of Catalysis, 2007, 250,
264.
19. W. B. Hou, N. A. Dehm and R. W. J. Scott, Journal of Catalysis, 2008, 253, 22.
20. K. J. Zeitsch, in The chemistry and technology of furfural and its many by-
products Elsevier, 2000, vol. 13, pp. 159-163.

Chapter 6 | Appendix
183
This chapter includes the calibration graphs for each compounds analysed in Chapter 3 and
4. In addition to these, the graphs from the initial rates experiments in Chapter 4 are
displayed.
6.1. Calibrations for the Selective Oxidation of Glycerol
Figure 6.1.1. HPLC calibration curve for glycerol. Analysis was conducted using a
refractive index detector.
Chapter 6 Appendix
y = 10,423,989.0428x
R² = 0.9998
0.00 0.01 0.02 0.03 0.04 0.05 0.06 0.07
0
150000
300000
450000
600000
750000
Concentration (M)
Counts

Chapter 6 | Appendix
184
y = 48,728.4376x
R² = 0.9984
0.00 0.01 0.02 0.03 0.04 0.05 0.06
0
500
1000
1500
2000
2500
3000
Concentration (M)
Counts
y = 74,059.7759x
R² = 0.9999
0.000 0.015 0.030 0.045 0.060 0.075
0
1000
2000
3000
4000
5000
Concentration (M)
Counts
Figure 6.1.2. HPLC calibration curve for glyceric acid. Analysis was conducted using a
diode array detector.
Figure 6.1.3. HPLC calibration curve for dihydroxyacetone. Analysis was conducted using
a diode array detector.

Chapter 6 | Appendix
185
y = 24,397.4636x
R² = 0.9984
0.000 0.015 0.030 0.045 0.060 0.075
0
325
650
975
1300
1625
Concentration (M)
Counts
Figure 6.1.4. HPLC calibration curve for glyceraldehyde. Analysis was conducted using a
diode array detector.
y = 79,549.5421x
R² = 0.9980
0.000 0.015 0.030 0.045 0.060
0
1000
2000
3000
4000
5000
Concentration (M)
Counts
Figure 6.1.5. HPLC calibration curve for lactic acid. Analysis was conducted using a diode
array detector.

Chapter 6 | Appendix
186
y = 238,211.7399x
R² = 1.0000
0.000 0.015 0.030 0.045 0.060 0.075
0
3250
6500
9750
13000
16250
Concentration (M)
Counts
Figure 6.1.6. HPLC calibration curve for tartronic acid. Analysis was conducted using a
diode array detector.
y = 907,636.4706x
R² = 0.9981
0.000 0.015 0.030 0.045 0.060 0.075
0
12500
25000
37500
50000
62500
Concentration (M)
Counts
Figure 6.1.7. HPLC calibration curve for oxalic acid Analysis was conducted using a diode
array detector.

Chapter 6 | Appendix
187
y = 36,426.7835x
R² = 0.9940
0.000 0.015 0.030 0.045 0.060 0.075
0
500
1000
1500
2000
2500
Concentration (M)
Counts
Figure 6.1.8. HPLC calibration curve for formic acid Analysis was conducted using a diode
array detector.
y = 256,518.8246x
R² = 0.9998
0
1300
2600
3900
5200
6500
0 0.005 0.01 0.015 0.02 0.025
Counts
Concentration (M)
Figure 6.1.9. HPLC calibration curve for β-hydroxypyruvic acid. Analysis was conducted
using a diode array detector.

Chapter 6 | Appendix
188
6.2. Calibrations for the Selective Oxidation of Furfural
y = 38,349.9496x
R² = 0.9933
0
500
1000
1500
2000
2500
0 0.01 0.02 0.03 0.04 0.05 0.06 0.07
Counts
Concentration (M)
Figure 6.1.10. HPLC calibration curve for glycolic acid. Analysis was conducted using a
diode array detector.
y = 1,359,103.0765x
R² = 0.9998
0
17500
35000
52500
70000
87500
0.000 0.015 0.030 0.045 0.060
Counts
Concentration (M)
Figure 6.2.1. HPLC calibration curve for furfural. Analysis was conducted using a diode
array detector

Chapter 6 | Appendix
189
y = 3,228,100.6115x
R² = 0.9997
0
50000
100000
150000
200000
250000
0.000 0.015 0.030 0.045 0.060 0.075
Counts
Concentration (M)
Figure 6.2.2. HPLC calibration curve for furoic acid. Analysis was conducted using a diode
array detector
y = 893,782.6553x
R² = 0.9973
0
20000
40000
60000
80000
100000
0.000 0.030 0.060 0.090 0.120
Counts
Concentration (M)
Figure 6.2.3. HPLC calibration curve for furfuryl alcohol. Analysis was conducted using a
diode array detector