The Second Wave of Network Extensions of Low Cost … · demand), shows the network changes by...
20
1 The 21st ATRS World Conference 2017 in Antwerp The Second Wave of Network Extensions of Low Cost Carriers in Europe: Background and Trends Peter Berster, Marc. C. Gelhausen, Dieter Wilken German Aerospace Center (DLR) Institute of Air Transport and Airport Research 51147 Cologne, Germany ABSTRACT The objective of the study is to reveal and analyse the recent network extension activities of Low Cost Carriers (LCCs) in European countries. The first wave of introducing new routes in Europe took place from about 2002 to 2008 when LCCs had entered the market and created new services on routes, often bypassing established routes. While the years from 2008 to 2013 showed little growth in LCC networks, more new routes have been introduced since then. Quite in contrast to the first wave the second wave is characterized by new routes from major airports, often in direct competition with other carriers, and by both European and inter- continental routes. In addition, new LCC routes are introduced on short-haul routes by replacing Full Service Network Carrier (FSNC) routes. The analysis, which is based on data of OAG (e. g. routes, flights) and Sabre ADI (passenger demand), shows the network changes by market and airline type over the last years and the demand growth in general and on selected routes, and thus reveals that passengers prefer LCC services in European markets more than FSNC services. LCCs have opened in Europe many more new routes in 2016 than FSNCs did. Ryanair and EasyJet, the two biggest LCCs of Europe, have added over 300 new routes, and most of the new routes opened in Europe are LCC routes. The number of intercontinental LCC routes alone has almost doubled from 20 to 38 routes. The paper is supposed to contribute to a better understanding of the current trend in air transport in Europe: LCCs continue to develop their networks with a new effort to directly compete with FSNCs, both in European and intercontinental traffic, while FSNCs adapt their business model and participate in the LCC business by setting up their own LCC subsidiaries.
Transcript of The Second Wave of Network Extensions of Low Cost … · demand), shows the network changes by...

1
The 21st ATRS World Conference 2017 in Antwerp
The Second Wave of Network Extensions of Low Cost Carriers in Europe: Background and Trends
Peter Berster, Marc. C. Gelhausen, Dieter Wilken
German Aerospace Center (DLR)
Institute of Air Transport and Airport Research
51147 Cologne, Germany
ABSTRACT
The objective of the study is to reveal and analyse the recent network extension activities of Low Cost Carriers (LCCs) in European countries. The first wave of introducing new routes in Europe took place from about 2002 to 2008 when LCCs had entered the market and created new services on routes, often bypassing established routes. While the years from 2008 to 2013 showed little growth in LCC networks, more new routes have been introduced since then. Quite in contrast to the first wave the second wave is characterized by new routes from major airports, often in direct competition with other carriers, and by both European and inter-continental routes. In addition, new LCC routes are introduced on short-haul routes by replacing Full Service Network Carrier (FSNC) routes.
The analysis, which is based on data of OAG (e. g. routes, flights) and Sabre ADI (passenger demand), shows the network changes by market and airline type over the last years and the demand growth in general and on selected routes, and thus reveals that passengers prefer LCC services in European markets more than FSNC services. LCCs have opened in Europe many more new routes in 2016 than FSNCs did. Ryanair and EasyJet, the two biggest LCCs of Europe, have added over 300 new routes, and most of the new routes opened in Europe are LCC routes. The number of intercontinental LCC routes alone has almost doubled from 20 to 38 routes.
The paper is supposed to contribute to a better understanding of the current trend in air transport in Europe: LCCs continue to develop their networks with a new effort to directly compete with FSNCs, both in European and intercontinental traffic, while FSNCs adapt their business model and participate in the LCC business by setting up their own LCC subsidiaries.
2
1. Introduction
Low Cost Carriers (LCCs) form since more than 15 years a well-established part of total air transport supply in Europe and worldwide. Much literature exists meanwhile on the theme of low cost travel by air, and papers dealing with a broad spectrum of LCC related topics have been presented at former ATRC conferences. New developments of air transport demand, as for instance tendencies of saturation of demand in some markets, and of supply factors, as for instance a slower growth – as compared with former years – of networks served with low cost services, however, are reason enough to continue with the analysis of the LCC market segment. While in the late nineties of the last century LCCs began extending networks in Europe it was in the years from about 2002 to 2008 that air travel by LCCs grew fastest, hand in hand with a strong extension of networks, and has lost momentum since then, caused in 2008 by the global economic crisis, but also by the fact that LCC networks in some regions had reached sizes that incorporated by then most routes with strong demand. In some world regions like in Australia and Asia demand for low cost travel continues to grow strongly, however, in other regions like in Germany and Europe, the growth has been slowing down. Since a few years, LCC networks grow again, however, slower than before 2008. A modest, but new wave of growth can be observed in European countries, caused by various factors, one of them being the fact the full service network carriers (FSNCs) entered this market by offering LCC services with their own airlines, like Germanwings or Vueling.
The objective of the paper is to reveal and analyse the recent network extension activities of Low Cost Carriers (LCCs) in Europe, with an emphasis on the development in Germany. The causes of the second wave are more complex than those of the first wave, like new LCC services replacing FSNC Services and more direct competition. The paper is supposed to contribute to a better understanding of the current trend in air transport in Europe. Experience in Europe has shown for instance that the introduction of LCC services on a new route stimulates demand substantially, that this effect, however, lasts only for a short while, after which the demand development continues on a normal growth trend as can be observed on routes of full service network carriers (FSNCs). The demand generation of LCCs depends thus on the opening of new routes, a step that has become more and more difficult to realize as in developed networks most sustainable routes are already served by one or more LCCs. Airlines have gone new ways to participate more in the still growing market for low cost travel.
In the following we recall shortly the main characteristics of LCCs without attempting to define in detail what is meant by a LCC, their business models vary meanwhile too much, at least in detail. In addition, business models of LCCs and FSNCs have changed and approached each other; LCCs offer a wider range of fares while FSNCs lower their fares on competitive routes and/or found new LCCs. We then look into the development of LCC networks, i. e. the number of routes served from main and secondary airports, routes without and with airline competition, and the development of frequencies per route. In addition, we look at the flight and seat development on these routes, at prices and last but not least, at the demand, particularly demand generation as a consequence of the introduction of new LCC services.
3
2. Some general features and developments of LCCs.
The main feature of LCCs is probably best be described by low fares, which are generally available. These fares are typically substantially lower than those of FSNCs, although there is a growing number of routes where the difference in fares between LCCs and FSNCs narrows down. The classical business model is characterized by these main elements (Wilken and Berster, 2013): - Network Structure with point-to-point services of relatively short and medium-haul
routes, with a preference of using secondary airports because of lower charges and general slot availability, allowing high aircraft utilization, quick turnaround times and easier operations.
- Uniform Fleet, with typically one aircraft type, like A 320 or B 737, single class configuration and high seating density.
- Direct Marketing of services, typically via the internet and internet-based booking. - Price Strategy of low fares, incl. very low promotional fares, on a one way base,
however, with increasing fare levels in relation to the time span between booking and flying and the probability of seat availability (which is partly correlated with the time span), incorporating yield management systems, and a strategy of charging additional fees and taxes and for extra services like luggage.
- No Frills preceding, during and after the flight, including services in and infrastructure of the airport terminal.
The commercial success of LCCs has caused traditional network carriers to reconsider their business model and adopt more features of LCCs, i. e. reduce costs in order to be more competitive and regain market penetration. LCCs on the other side have vigorously developed their networks until about 2008/09 when the global economic crisis caused a brake of demand growth. Since then LCC networks have been enlarged substantially slower. In looking for greater market potential LCCs began with new strategies by commencing services from main airports where FSNCs dominated the business so far, while FSNCs responded by founding LCCs or integrating other LCCs and offering LCC services on their part on new routes or substituting former FSNC services with new LCC services (Halpern et al, 2016).
In addition, both independent LCCs like Norwegian Air and FSNC dependent LCCs like Eurowings have entered the intercontinental market. This new development contradicts somehow with the old business model which calls for a high aircraft utilisation with quick turnaround times and easy operations. Even more, FSNC intercontinental flights are typically offered from hub airports where they are fed with transfer passengers from short and medium-haul flights. In contrast, LCCs rely typically on simple operations in point to point networks without any organised hubbing. LCCs will have therefore a smaller advantage vis a vis FSNCs in competing in intercontinental markets. Never the less, since about a year Norwegian Air offers over 300 flights per week on about 35 long-haul routes with B787 aircraft from European airports to destinations primarily in the US and Asia, while Eurowings flies with A330 aircraft on nine routes with almost 100 departures from Cologne to touristic destinations in the Caribbean and the US (OAG, 2016).
As compared with scheduled traffic of full service network carriers (FSNCs) LCC traffic is still a young phenomenon, however, not anymore a new segment of the total air transport system, as can be seen in Fig. 1. The growth of passenger demand for low cost services was
4
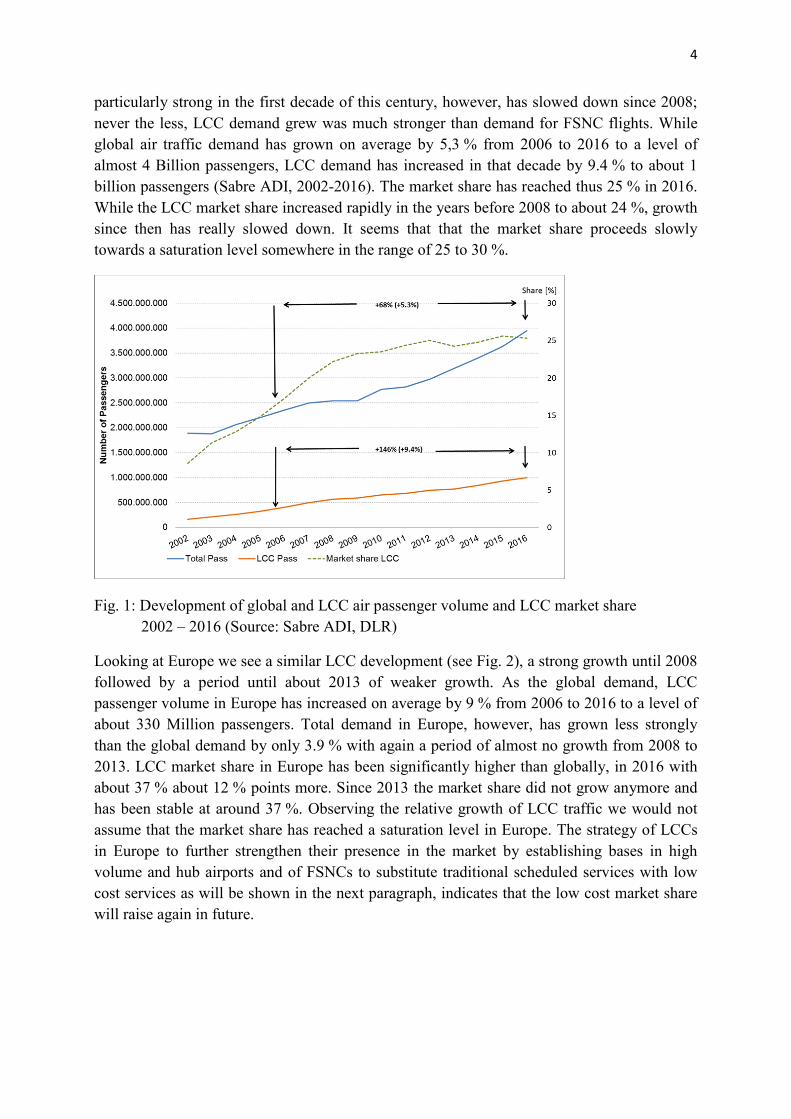
particularly strong in the first decade of this century, however, has slowed down since 2008; never the less, LCC demand grew was much stronger than demand for FSNC flights. While global air traffic demand has grown on average by 5,3 % from 2006 to 2016 to a level of almost 4 Billion passengers, LCC demand has increased in that decade by 9.4 % to about 1 billion passengers (Sabre ADI, 2002-2016). The market share has reached thus 25 % in 2016. While the LCC market share increased rapidly in the years before 2008 to about 24 %, growth since then has really slowed down. It seems that that the market share proceeds slowly towards a saturation level somewhere in the range of 25 to 30 %.
Fig. 1: Development of global and LCC air passenger volume and LCC market share 2002 – 2016 (Source: Sabre ADI, DLR)
Looking at Europe we see a similar LCC development (see Fig. 2), a strong growth until 2008 followed by a period until about 2013 of weaker growth. As the global demand, LCC passenger volume in Europe has increased on average by 9 % from 2006 to 2016 to a level of about 330 Million passengers. Total demand in Europe, however, has grown less strongly than the global demand by only 3.9 % with again a period of almost no growth from 2008 to 2013. LCC market share in Europe has been significantly higher than globally, in 2016 with about 37 % about 12 % points more. Since 2013 the market share did not grow anymore and has been stable at around 37 %. Observing the relative growth of LCC traffic we would not assume that the market share has reached a saturation level in Europe. The strategy of LCCs in Europe to further strengthen their presence in the market by establishing bases in high volume and hub airports and of FSNCs to substitute traditional scheduled services with low cost services as will be shown in the next paragraph, indicates that the low cost market share will raise again in future.

5
Fig. 2: Development of total and LCC air passenger volume and LCC market share in Europe 2002 – 2016 (Source: Sabre ADI, DLR)
3. Development of LCC networks in Europe and Germany
Following the example of Southwest Airlines in the US, LCCs have entered the European market in the late nineties and have achieved a market share of about 37 % by now. Beginning in Ireland and the UK and founding bases in different European countries LCCs formed networks with predominantly point-to-point services. Hubbing was no business objective, although passengers could and can take advantage of transfer routes in those airports where LCCs have concentrated operations, like in Dublin or London Stansted. The transfer process in these airports, however, is not organized by LCCs, passengers have to find their route from trip origin to destination, pay for two sector routes, and take care of the luggage in the transfer airport. Only nowadays LCCs, like Norwegian Air and Ryanair, and airports, like London Gatwick and Cologne, think about offering organized transfer connections of LCC flights, i. e. in the intercontinental market (Maertens et al, 2016).
- Routes
Unlike FSNCs, LCCs have established networks not typically from hub airports, but from main and secondary airports, primarily in North-Western Europe, often to touristic destinations in Southern Europe. Still today the majority of routes can be found between North-Western Europe and Mediterranean countries, although Central and East European and North African destinations are served today, too. Another difference is the fact that LCCs have concentrated from the beginning on international routes between European countries, domestic networks have played a minor role, although domestic hub bypassing routes are served, too, mainly by LCCs in their country of residence. Ryanair has for instance enlarged the network in Germany from 94 routes in January 2008 to171 routes in January 2017, among them just one domestic route from Cologne to Berlin.

6
Due to the fact that LCCs have been serving often touristic routes they have catered more for passengers traveling for private purposes, rather than for business purposes. As will be shown, LCC networks have not grown in the years since 2008 as much as they have grown before that year. One reason for the reduced network extension was certainly the interruption of demand growth due to the global economic crisis in 2008/09 (see Fig. 2), another reason was most likely the fact that the touristic market in Europe was more or less served with the network developed so far and further lucrative routes were more difficult to find. After some years of rather slow extension of networks LCCs changed their strategy and began opening routes since about 2013/14 from more important airports, including slot coordinated airports with high capacity utilization and thus problems of getting free slots so as to minimize turnaround times. The intension was to also participate in the market for business travelers. This often meant direct competing with FSNCs which have served these routes for long.
Fig. 3 shows the development of routes in Europe, which are served by all carriers and by LCCs from 2002 to 2016. Data were retrieved from the OAG database and mirror the supply situation in the third week of July of each year. As can be seen LCC networks grew in particular in the period from 2004 to 2008. With the exception of 2009 the number of routes served has increased steadily then from year to year, in total scheduled traffic from 2008 to 2016 by 2.8 % on average and thus slower than in the LCC segment, which has grown by 5.8 %. In the year 2002, LCC traffic was still in the phase of entering the European market, primarily in Ireland and the UK, and only about 460 routes were served, the following development, however, was very dynamic and six years later already more than 5,350 routes made up the LCC network. Almost 600 new routes were opened year by year in that period, while since 2008 less than 400 new routes were added to the LCC network. In 2016, LCCs achieved a route share of about 50 %, every second route in Europe was thus operated by one or more LCCs.
Fig. 3: Development of routes in total scheduled and LCC traffic in Europe 2002 - 2016 (Source: OAG, DLR)
7
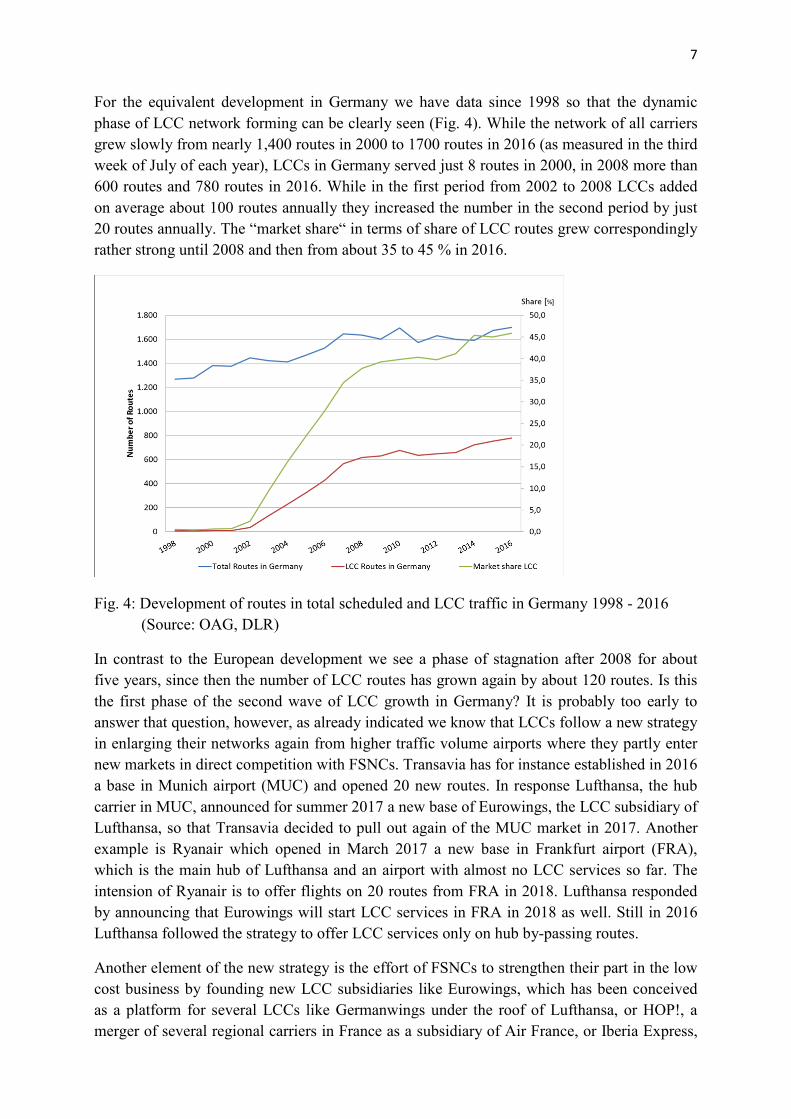
For the equivalent development in Germany we have data since 1998 so that the dynamic phase of LCC network forming can be clearly seen (Fig. 4). While the network of all carriers grew slowly from nearly 1,400 routes in 2000 to 1700 routes in 2016 (as measured in the third week of July of each year), LCCs in Germany served just 8 routes in 2000, in 2008 more than 600 routes and 780 routes in 2016. While in the first period from 2002 to 2008 LCCs added on average about 100 routes annually they increased the number in the second period by just 20 routes annually. The “market share“ in terms of share of LCC routes grew correspondingly rather strong until 2008 and then from about 35 to 45 % in 2016.
Fig. 4: Development of routes in total scheduled and LCC traffic in Germany 1998 - 2016 (Source: OAG, DLR)
In contrast to the European development we see a phase of stagnation after 2008 for about five years, since then the number of LCC routes has grown again by about 120 routes. Is this the first phase of the second wave of LCC growth in Germany? It is probably too early to answer that question, however, as already indicated we know that LCCs follow a new strategy in enlarging their networks again from higher traffic volume airports where they partly enter new markets in direct competition with FSNCs. Transavia has for instance established in 2016 a base in Munich airport (MUC) and opened 20 new routes. In response Lufthansa, the hub carrier in MUC, announced for summer 2017 a new base of Eurowings, the LCC subsidiary of Lufthansa, so that Transavia decided to pull out again of the MUC market in 2017. Another example is Ryanair which opened in March 2017 a new base in Frankfurt airport (FRA), which is the main hub of Lufthansa and an airport with almost no LCC services so far. The intension of Ryanair is to offer flights on 20 routes from FRA in 2018. Lufthansa responded by announcing that Eurowings will start LCC services in FRA in 2018 as well. Still in 2016 Lufthansa followed the strategy to offer LCC services only on hub by-passing routes.
Another element of the new strategy is the effort of FSNCs to strengthen their part in the low cost business by founding new LCC subsidiaries like Eurowings, which has been conceived as a platform for several LCCs like Germanwings under the roof of Lufthansa, or HOP!, a merger of several regional carriers in France as a subsidiary of Air France, or Iberia Express,

8
founded by Iberia. Other European FSNCs have acquired formerly independent LCCs, like Vueling in Spain, which is now part of IAG, or Transavia belonging to Air France /KLM. Norwegian Air International is another example of a new LCC, which was founded as an Irish subsidiary of Norwegian Air Shuttle, a LCC of Norway with both European and intercontinental services.
In order to examine to what degree LCCs have offered new services from high volume airports we have subdivided the airport population into two classes, the high volume airports and other all others. The dividing line has been drawn at a traffic volume of 700 flights per week (corresponding to about 35 Thousand flights per year). In Europe, 62 (equivalent 10 %) out of 630 airports belong to the high volume class, while in Germany the eight top ranking airports (32 %) out of 25 airports form the class of “main” airports.
Fig. 5: Development of routes in total scheduled and LCC traffic of high volume airports in Europe 2002 to 2016, (Source: OAG, DLR)
9
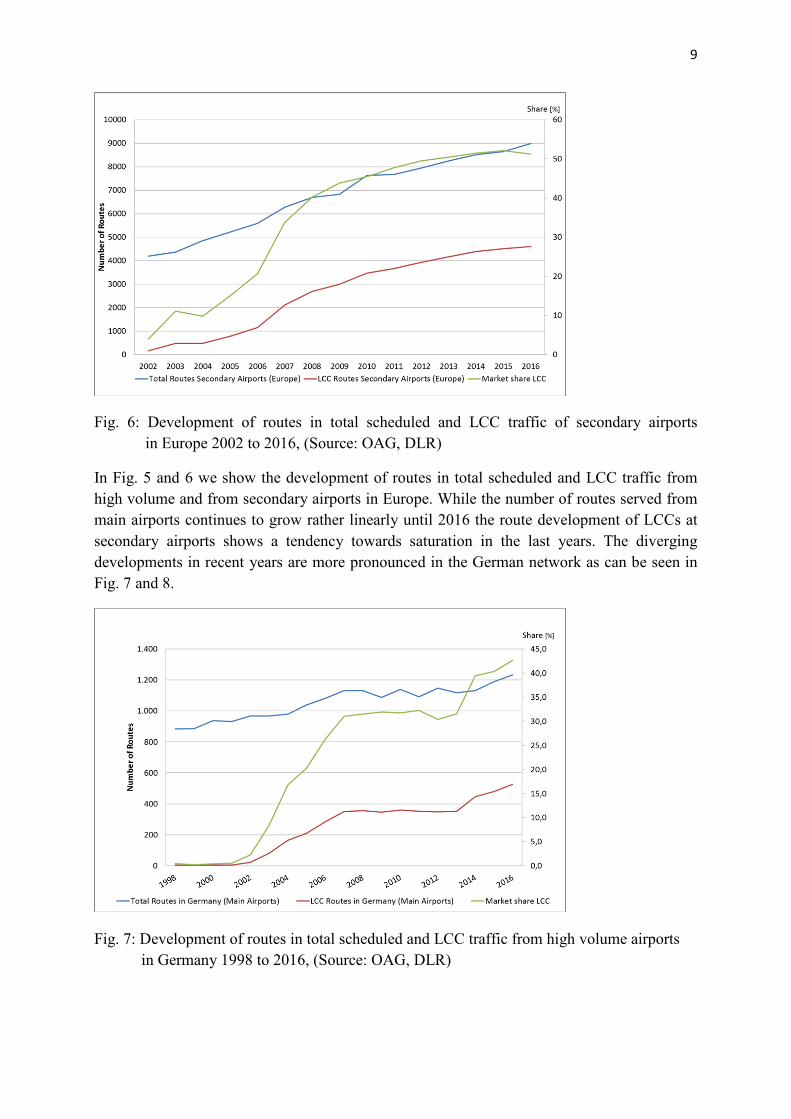
Fig. 6: Development of routes in total scheduled and LCC traffic of secondary airports in Europe 2002 to 2016, (Source: OAG, DLR)
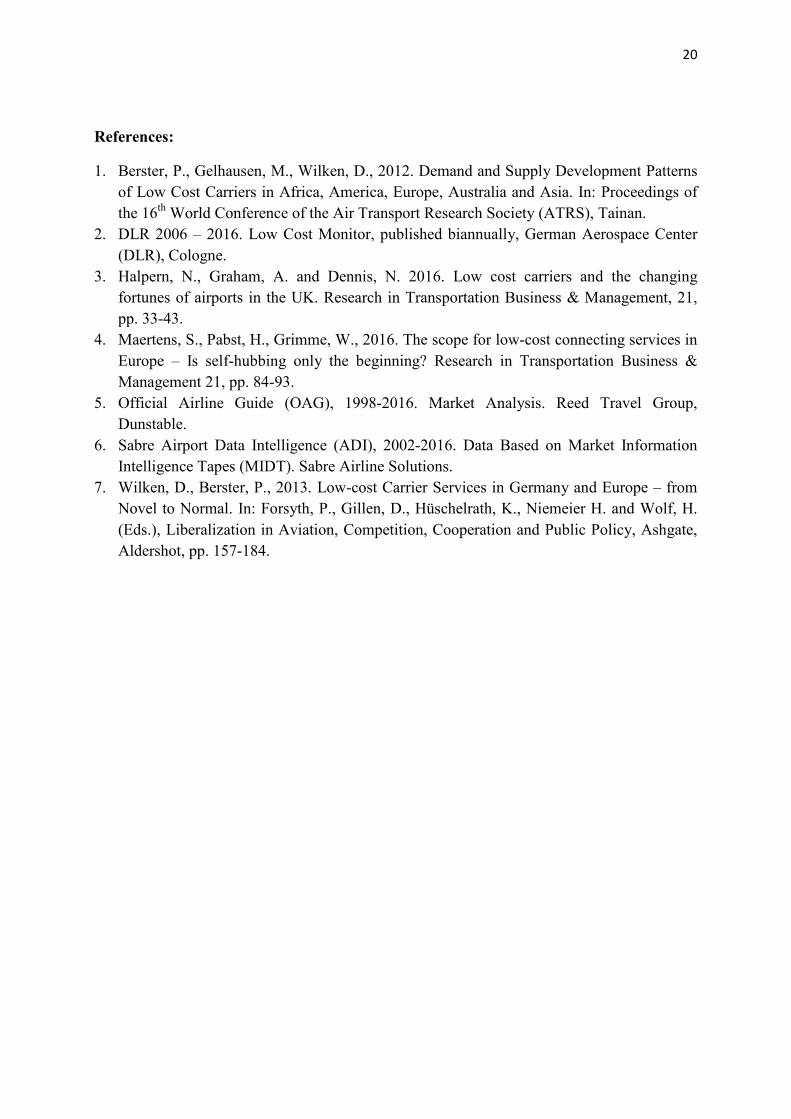
In Fig. 5 and 6 we show the development of routes in total scheduled and LCC traffic from high volume and from secondary airports in Europe. While the number of routes served from main airports continues to grow rather linearly until 2016 the route development of LCCs at secondary airports shows a tendency towards saturation in the last years. The diverging developments in recent years are more pronounced in the German network as can be seen in Fig. 7 and 8.
Fig. 7: Development of routes in total scheduled and LCC traffic from high volume airports in Germany 1998 to 2016, (Source: OAG, DLR)

10
Fig. 8: Development of routes in total scheduled and LCC traffic from secondary airports in Germany 1998 to 2016, (Source: OAG, DLR)
Since 2013, LCCs have enlarged their network by 170 routes almost exclusively from high volume airports, in particular in München (MUC), Berlin-Schoenefeld (SXF), Düsseldorf (DUS), Hamburg (HAM), and Stuttgart (STR), whereas at secondary airports more than 50 LCC routes have been abandoned, in particular in Hahn (HHN), Bremen (BRE) and Niederrhein (NRN). These airports are important Ryanair bases and are primarily served by this LCC. And it is Ryanair more than any other LCC which has altered the old business model to serve only small airports in order to gain from market power and reduce cost like landing fees, and to move to more important airports to gain further market shares, in particular in high yield demand for business travel. Further growth seemed more difficult to gain from smaller airports than from main airports; as can be seen no further routes have been added from smaller airports since 2010. Looking back at the standstill of networks since 2007 at high volume airports and since 2010 at smaller airports one wonders that LCCs had not taken up the initiative to open new routes from major airports already earlier.
One reason may have been the freedom of scheduling at small airports so that slots were no scarce resource as at coordinated airports and operating times of aircraft could be maximized. Another reason may have been the lack of competition at secondary airports as compared with the situation at high volume airports. It has been shown (see DLR, Low Cost Monitor, (DLR, 2006-2016)) that the majority of LCC routes (around 85 %) are served by just one carrier, however, in winter 2017 there have been already around 800 routes with two carriers and 100 with more than two carriers. As can be seen in Fig. 9 and 10, the share of competitive routes is substantially higher at high volume airports than at secondary airports. At major airports in Germany, about 240 out of 520 routes, corresponding to around 45 %, have been served in 2016 by more than one carrier, whereas at smaller airports only on 33 out of 250 routes, equal to 13 %, LCCs competed with one or more other carriers. In spite of the relatively high share of routes with competitors at high volume airports, the number of routes served at these

11
airports has grown by almost 50 % in three years since 2013, whereas at smaller airports networks of both FSNCs and LCCs have become smaller.
Fig. 9: Competitive LCC routes from high volume airports in Germany 2002 – 2016 (Source: OAG, DLR)
Fig. 10: Competitive LCC routes from secondary airports in Germany 2002 – 2016 (Source: OAG, DLR)
- Flights, seats and frequencies
In general we can observe that the development of routes has been similar to the corresponding development of flights and seats, however, with some differences. If we look at the period 2008 to 2016 in Europe, we find that the number of LCC routes (5.8 %) has grown

12
somewhat faster than the number of flights (4.3 %) and seats (4.9 %), indicating that average frequency (flights per week) per route has gone down and seat capacity per flight has increased. In total scheduled traffic in Europe, the number of routes has increased on average by 2.8 % in that period, while the number of flights offered has only grown by 1.4 % and the number of seats by 3.4 %. Here too, average flight frequency has gone down and seat capacity per flight has gone up.
For Germany we can observe the development in the period 2000 to 2008 with the dynamic growth in LCC traffic and the following period of saturation and the implementation of new LCC strategies from 2008 to 2016. The number of routes has grown by 72 % per year on average in the first period, while the number of flights has increased by 60 % and the number of seats by 65 %. The average frequency per route has thus gone down. In contrast to the dynamic LCC growth, the total number of routes of both FSNCs and LCCs has risen by just 2.1 %, the number of flights by 2.2 % and the number of seats by 3.0 % in that period.
The second period from 2008 to 2016 was characterized by a “normal” growth in LCC traffic, the number of routes has gone up by just 5.0 % on average, the number of flights by 2.9 % and the number of seats by 3.3 %, indicating again a reduction in the average frequency per route. As has been shown in Fig. 4, the network of all scheduled carriers has been increased only marginally in the second period by just 65 routes or 0.5 %. The number of flights has gone down by 0.5 % and the number of seats has grown by 2.0 %.
Looking at the LCC networks of high volume and small airports we see that the number of routes from major airports has been increased more (by 75 %) than from smaller airports (by 69 %). In both network types the number of flights and seats has grown somewhat less than the number of routes, meaning that the number of destinations has grown faster than the number of flights and seats per flight offered on these routes.
The development of routes by weekly frequency per route is shown in Fig. 11 for the LCC routes from high volume airports and in Fig. 12 for those from smaller airports in Germany. The spectrum of routes by frequency varies widely over the number of weekly flights from just 2 to 200 at major airports, at smaller airports, however, routes with two and five flights per week dominate the frequency spectrum. At major airports, too, routes with just two and five flights per week can be found most often, followed by routes with 14 flights per week or two daily flights and then by one flight per day. LCC routes are thus characterized by rather low weekly frequencies.
With the increase in the number of LCC routes after 2013 at high volume airports the number of routes with 2, 5 and 14 flights per week has gone up as well, while the number of routes with 7 flights and higher frequencies has increased as much or has even gone down. Since at smaller airports the number of routes has decreased since 2010, there has been no increase of routes by any frequency, except of those with two flights per week from 2012 to 2013 by over 20 routes. Especially at smaller airports, low frequency routes are typically offered in LCC networks, and at high volume airports alike, low frequencies are the typical LCC route frequency.

13
Fig. 11: Development of LCC routes from high volume airports in Germany by average frequency per route 2002 – 2016 (Source: OAG, DLR)
Fig. 12: Development of LCC routes from secondary airports in Germany by average frequency per route 2002 – 2016 (Source: OAG, DLR)
4. Fares of LCC routes of Germany
The main competitive advantage of LCC flights is the relatively low fare as compared with FSNC fares. Since flight prices vary from day to day and from route to route and fare data are not kept in statistics analyses of fares and their changes in relation to influencing factors like competition or advanced booking are cumbersome to carry out and often incomplete. The DLR Low Cost Monitor (DLR, 2006-2016) collects LCC fare data by means of a web-based survey of around 70 representative routes since 2008. Fig. 13 shows the development of

14
average fares on these sample routes by carrier. The fares are calculated as averages of single fares incl. taxes and fees for several points in time over a three month period preceding the date of the flight. They are not identical with fares actually paid for by passengers, however, are fares offered by airlines at the specific dates for each route; average fares representing the average yield may therefore vary from those shown in Fig. 13.
Fig. 13: Development of average fares (incl. taxes and fees) by LCC on 70 selected routes of Germany 2008 – 2016 (Source: DLR)
As can be seen fares vary substantially between carriers. The highest fares have been charged over the whole period of eight years by Air Berlin, followed by Germanwings and Easyjet. Wizz and Ryanair offer in general the lowest fares. While Air Berlin and Germanwings charged with around 105 € the highest average fare in 2016, Wizz offered the lowest average fare with 40 €. Fares have gone up until 2014, in the case of Easyjet for example from 60 to over 90 € for a single route, and have fallen since then, in the case of Easyjet to a level of around 70 € in 2016. One reason for the fare reduction was probably the sinking of Kerosene prices since 2014, another reason possibly the rising number of routes where carriers compete with each other.
Among others average fares vary with the time span between booking and flying date. The fare analysis has shown that the fare difference between a fare of a flight, which is booked one day ahead of flying and a flight, which is realized in three months’ time, may be as much as 100 € or more. Easyjet for example sells a flight within the sample of routes analysed for the following day for an average of 122 € and for a flight in three months’ time 41 €.
As has been stated fares vary also with the fact whether or not carriers compete directly or indirectly on a route. One example shall illustrate such fare relationship. Fig. 14 shows the fare development on the route Cologne – Berlin since 2008. Fares of the LCCs Germanwings and Air Berlin went up until 2011/12. These two carriers were not really competing with each other, because Lufthansa, the third carrier on this route, charged in any case higher prices than the two LCCs. Lufthansa pulled out of the market in 2012, so that the two LCCs faced a direct

15
competition, as a consequence fares went down successively. The lowering of Kerosene prices may have positively influenced this development.
Fig. 14: Fare development on the route Cologne – Berlin 2008 – 2016 (Source: DLR)
5. Demand generation of LCC services
It has been shown in former studies of demand development on new LCC routes in Germany and Europe that LCCs attract substantial new demand when opening new low fare services (see for instance Berster et al, 2012). There have been numerous examples where the effect on demand was in the order of more than 10,000 passengers per month attracted to the new LCC services. The effect has been following immediately after the route introduction and the demand follows then on the higher level the former development trend, in developing markets the demand grows faster than in the past. The demand generation of LCCs depends thus on the opening of new routes, a step that has become more and more difficult to realize as in developed networks many sustainable routes are already served by one or more LCCs. The question is if the demand generation can be observed on new routes that have been opened only recently as part of the new LCC strategy.
Two example routes have been selected in order to demonstrate the demand generation effect in the old and new supply environment. These routes are from the Rhineland airports Cologne (CGN) and Düsseldorf (DUS) to Berlin airports (TXL and SXF) and to London airports (LHR, LGW, LCY, STN). Fig. 15.1 shows the demand development on the Berlin route from 2001 to 2003, when the LCC Germanwings entered the market in November 2012 on the route CGN – TXL. FSNCs, in particular Lufthansa, were serving both markets from DUS and CGN to Berlin. Germanwings offered much lower fares and as a result demand for these low cost services grew by almost 20,000 passengers, while the FSNC route DUS – TXL experienced no demand alteration.

16
The new supply situation since 2013 on the CGN/DUS – Berlin market has been characterized by LCC services of Air Berlin and Germanwings on both routes (see Fig. 15.2). The demand level of around 55,000 passengers on the CGN – Berlin and of 45,000 passengers on the DUS – Berlin route reflects the low fare supply of flights in this market and is thus not comparable with the situation in 2002 and before when only high fare services were offered in this market. In September 2015, Ryanair began serving the route CGN – SXF with low fares, which were still much lower than those of Air Berlin and Germanwings. As a consequence, these very low fare services of Ryanair attracted so many passengers, that the total demand grew by another 25,000 passengers per month to a total of nearly 80,000 passengers. This indicates that even in low fare markets very low fare services will still generate new demand of substantial size, although we cannot deduct from this example that all routes provide sufficient demand for additional very low fare services.
Fig: 15.1: Demand development on the route Cologne/Düsseldorf – Berlin 2001 – 2003 (No. of passengers per month); (Source: Sabre ADI, DLR)
Fig: 15.2: Demand development on the route Cologne/Düsseldorf – Berlin 2013 – 2016 (No. of passengers per month); (Source: Sabre ADI, DLR)
The second route, Rhineland to London, is a busy international route, served by LCCs (Germanwings, Easyjet, Air Berlin until Sept. 2014) and FSNCs (British Airways, Lufthansa)

17
alike. Fig. 16 shows the demand development from 2013 to 2016 when LCCs began serving more and more important airports instead of continuing network extensions from secondary airports alone. In October 2014 Ryanair started offering very low fare flights from CGN to STN in addition to the already existing LCC flights of Germanwings and Easyjet. As can be seen the demand grew immediately from roughly 20,000 passengers per month to almost 30,000 passengers. Another example, where sufficient demand will be generated by a very low fare service although LCCs have been serving this market before and since then as well. .
Fig: 16: Demand development on the route Cologne/Düsseldorf – London 2013 – 2016 (No. of passengers per month); (Source: Sabre ADI, DLR)
Other routes have been analysed and have shown similar results; demand reactions to new low fare services have been strong and occurred immediately. We may conclude that the introduction of LCC services generate substantial new demand, both in a before-situation without and with LCCs in the market. In the latter case it is essential that the fares of the newcomer should undercut the existing fares, if new passengers should be successfully attracted.
6. Results and discussion
New developments of air transport demand, as for instance tendencies of saturation of demand in some markets, and of supply factors, as for instance a slower growth of networks served with low cost services as compared with former years, and a new wave of LCC services from major airports on both European and intercontinental routes have been the reason to analyse the LCC market segment once more.
The commercial success of LCCs has caused traditional network carriers to reconsider their business model and adopt more features of LCCs, i. e. reduce costs in order to be more competitive and regain market penetration. In looking for greater market potential LCCs began on their side with new strategies by commencing services from main airports where

18
FSNCs dominated the business so far, while FSNCs responded by founding LCCs or integrating other LCCs and offering LCC services on their part on new routes or substituting former FSNC services with new LCC services.
In addition, both independent LCCs like Norwegian Air and FSNC dependent LCCs like Eurowings have entered the intercontinental market. This new development contradicts somehow with the old business model which calls for a high aircraft utilisation with quick turnaround times and easy operations. LCCs have a smaller advantage vis a vis FSNCs in competing in intercontinental markets. Never the less, since about a year Norwegian Air offers over 300 flights per week on about 35 long-haul routes.
Due to the fact that LCCs have been serving often touristic routes they have catered more for passengers traveling for private purposes, rather than for business purposes. After some years of rather slow extension of networks LCCs changed their strategy and began opening routes since about 2013/14 from more important airports, including slot coordinated airports with high capacity utilization and thus problems of getting free slots so as to minimize turnaround times. The intension was to also participate in the high yield market for business travelers. This often meant direct competing with FSNCs which have served these routes for long. Looking back at the standstill of networks since 2007 at high volume airports and since 2010 at smaller airports one wonders that LCCs had not taken up the initiative to open new routes from major airports already earlier.
One reason has been the lack of competition at secondary airports as compared with the situation at high volume airports. At major airports in Germany, about 240 out of 520 routes, corresponding to around 45 %, have been served in 2016 by more than one carrier, whereas at smaller airports only on 33 out of 250 routes, equal to 13 %, LCCs competed with one or more other carriers.
Especially at smaller airports, routes with low frequency (flights per week) are typically offered in LCC networks, and at high volume airports alike, low frequencies are the LCC route frequency mostly offered.
It has been shown in former studies of demand development on new LCC routes in Germany and Europe that LCCs attract substantial new demand when opening new low fare services. The demand generation of LCCs depends on the opening of new routes, a step that has become more and more difficult to realize as in developed networks many sustainable routes are already served by one or more LCCs. Also in the new LCC strategy situation, the introduction of LCC services generates substantial new demand, both in a before-situation without and with LCCs in the market. In the latter case it is essential that the fares of the newcomer should undercut the existing fares, if new passengers should be successfully attracted.
The new strategy of LCCs to enlarge networks by opening new routes primarily from major airports seems to be successful and confirms what has been observed since years, that LCC services attract more and more passengers so that FSNCs adapt their business models and offer low fare like services on a growing number of routes in response to the proliferation of LCCs and in direct competition with LCCs. The European air transport market will continue

19
to have a growing share of low fare supply on routes from major airports as well as from secondary airports.
20
References:
1. Berster, P., Gelhausen, M., Wilken, D., 2012. Demand and Supply Development Patterns of Low Cost Carriers in Africa, America, Europe, Australia and Asia. In: Proceedings of the 16th World Conference of the Air Transport Research Society (ATRS), Tainan.
2. DLR 2006 – 2016. Low Cost Monitor, published biannually, German Aerospace Center (DLR), Cologne.
3. Halpern, N., Graham, A. and Dennis, N. 2016. Low cost carriers and the changing fortunes of airports in the UK. Research in Transportation Business & Management, 21, pp. 33-43.
4. Maertens, S., Pabst, H., Grimme, W., 2016. The scope for low-cost connecting services in Europe – Is self-hubbing only the beginning? Research in Transportation Business & Management 21, pp. 84-93.
5. Official Airline Guide (OAG), 1998-2016. Market Analysis. Reed Travel Group, Dunstable.
6. Sabre Airport Data Intelligence (ADI), 2002-2016. Data Based on Market Information Intelligence Tapes (MIDT). Sabre Airline Solutions.
7. Wilken, D., Berster, P., 2013. Low-cost Carrier Services in Germany and Europe – from Novel to Normal. In: Forsyth, P., Gillen, D., Hüschelrath, K., Niemeier H. and Wolf, H. (Eds.), Liberalization in Aviation, Competition, Cooperation and Public Policy, Ashgate, Aldershot, pp. 157-184.