THE SECOND BIENNIAL REPORT OF THE REPUBLIC OF …
93
1 THE SECOND BIENNIAL REPORT OF THE REPUBLIC OF KAZAKHSTAN submitted in accordance with the Decision 1/СР.16 of the Conference of the Parties to the United Nations Framework Convention on Climate Change This report was prepared by the Ministry of Energy of the Republic of Kazakhstan with the support of UNDP/GEF project No 90571 ‘Development of Kazakhstan’s 7 th National Communication and Biennial Report’ Astana 2015
Transcript of THE SECOND BIENNIAL REPORT OF THE REPUBLIC OF …
1
THE SECOND BIENNIAL REPORT
OF THE REPUBLIC OF KAZAKHSTAN
submitted in accordance with the Decision 1/СР.16 of the Conference of the
Parties to the United Nations Framework Convention on Climate Change
This report was prepared by the Ministry of Energy of the Republic of Kazakhstan with
the support of UNDP/GEF project No 90571 ‘Development of Kazakhstan’s 7th National
Communication and Biennial Report’
Astana 2015

2
CONTENT
List of acronyms, abbreviations, chemical symbols and measurement units............................................... 4
All-Russia Research Institute of Hydrometeorological Information – World Data Center ........................... 5
I. Introduction................................................................................................................................................ 7
II. GREENHOUSE GAS EMISSIONS AND TRENDS ............................................................................................ 9
II. A. Summary of the national inventory of greenhouse gas (GHG) emissions and trends for the
period from 1990 to 2013. ....................................................................................................................... 9
2.1 Description and interpretation of aggregated greenhouse gas emissions trends ......................... 9
2.1.1 Time series of greenhouse gas emissions by sectors ............................................................. 9
II. B. Summary of procedures for preparation of the national greenhouse gas inventory in
Kazakhstan as well as changes in national procedures that took place after submission of the
First Biennial Report and 3rd to 6th National Communication ....................................................... 25
III. QUANTIFIED ECONOMY-WIDE EMISSION REDUCTION TARGETS .......................................................... 27
IV. PROGRESS IN MEETING QUANTIFIED ECONOMY-WIDE EMISSION REDUCTION TARGETS AND RELATED
INFORMATION ............................................................................................................................................. 28
4.1. Mitigation actions and their impact ............................................................................................. 28
4.1.1 Actions in the energy sector (fuel combustion) ...................................................................... 28
4.1.2. Actions in the industrial processes sector ............................................................................... 33
4.1.3. Actions in the forestry sector .................................................................................................. 34
4.1.4. Actions in the wastes sector.................................................................................................... 36
4.2. Changes in institutional mechanisms ........................................................................................... 36
4.3. Economic and social consequences of response measures .......................................................... 38
4.3.1. Energy sector (fuel combustion) ............................................................................................. 38
4.3.2. Wastes management .............................................................................................................. 39
4.4. Progress in meeting emission reduction targets .......................................................................... 39
V. PROJECTIONS .......................................................................................................................................... 41
5.1. Updated Projections for 2020 and 2030 ....................................................................................... 41
5.1.1 Projections in the energy sector (fuel combustion) ................................................................ 41
5.1.2. Projections in the industrial processes sector ........................................................................ 50
5.1.3. Projections in the agricultural sector ..................................................................................... 55
5.1.4. Projections in the LULUCF sector ............................................................................................ 59
5.1.5. Projections in the wastes sector ............................................................................................. 62
5.2. Methodology ................................................................................................................................... 63
5.2.1. Methodology for the energy sector (fuel combustion) .......................................................... 63
5.2.2 Methodology for the industrial processes sector ................................................................... 63
5.2.3. Methodology for the forestry sector ...................................................................................... 77

3
5.2.4. Methodology for the wastes sector ....................................................................................... 78
VI. EXTENTION OF FINANCIAL AND TECHNOLOGICAL SUPPORT FOR STRENTHENING CAPACITY OF
PARTIES WHICH ARE DEVELOPING COUNTRIES .......................................................................................... 79
VI. А. Financial resources .................................................................................................................... 80
А. Republic of Kazakhstan and GEF .................................................................................................. 80
B. Kazakhstan and international climate change organizations ....................................................... 82
VI. B. Technology development and transfer ..................................................................................... 85
VI. C. Capacity building ....................................................................................................................... 86
VII. SUMMARY OF ROUTINE CLIMATE OBSERVATIONS IN THE REPUBLIC OF KAZAKHSTAN ...................... 87
7.1. Systematic observations ................................................................................................................. 87
7.2. 7.2. Possibility of free and open international data exchange. ................................................... 88
7.3. Principles of climate monitoring in GCOS/GOOS/GTOS.......................................................... 89
7.4. Monitoring network in the Republic of Kazakhstan. ................................................................. 89
7.5. Meteorological and atmospheric observations ............................................................................ 91
List of main sources and references ..................................................................................................... 92
4
List of acronyms, abbreviations, chemical symbols and measurement
units
ACIG Khantau Concrete Plant JSC
AFOLU Agriculture, forestry and other land-use
BAU Business as usual
BR1 First Biennial Report
CHPP Combined Heat and Power Plants
CIS Commonwealth of Independent States
COP Conference of the Parties
CRF Common Reporting Format
CTF Common Table Format
ECE Economic Commission for Europe
ES Emergency situation
EAF Electric arc furnace
EP Environment Protection
EXPO-2017 World Exhibition 2017 ‘Energy of the Future’
FES Fuel and energy sector
GAW Global Atmosphere Watch of WMO
GDP Gross domestic product
GEF Global Environmental Facility
Gg Gigagramm,109 grams, kilotons, kiloton (Kt)
GIS Geological information system
GHG Greenhouse gas
GL Guidelines
GOS/GCOS Global Climate Observation System
GSN Global Surface Network
GST Global Surface Temperature
GTS Global Telecommunications System
GUAN GCOS Upper-Air Network
GVA Gross value added
GWP Global warming potential
HCFC Hydrochlorofluorocarbons
HFC Hydrofluorocarbons
HP Hazardous phenomena
HPP Hydro power plant
HQ Headquarters
IEA International Energy Agency
INDC Intended Nationally Determined Contributions
IO International Organization
IPPU Industrial processes and product use
IDMS Integrated databases management system
IPCC Intergovernmental Panel on Climate Change
JSC Joint Stock Company
KP Kyoto Protocol
LLP Limited liability partnership
LoRK Law of the Republic of Kazakhstan
LULUCF Land use, land use change and forestry
MEP Ministry of Environment Protection
ME RK Ministry of Energy of the Republic of Kazakhstan
MEWR Ministry of Environment and Water Resources

5
MFA Ministry of Foreign Affairs
MGL Vojekov Main Geophysical Laboratory, Saint-Petersburg, Russia
MNE Ministry of National Economy of the Republic of Kazakhstan
MI Metal Industry
MS Meteorological station
MSW Municipal solid wastes
NA Not available
NE Not estimated
NHME Natural hydrometeorological events
NHMS National Hydrometeorological Service
NMVOC Non-methane volatile organic compounds
NPP Nuclear power plant
ODA Official Development Assistance
ODS Ozone depleting substances
PFC Perfluorocarbons
RES Renewable energy sources
RF Russian Federation
RIHMI –
WDC
All-Russia Research Institute of Hydrometeorological Information – World Data
Center
RK Republic of Kazakhstan
RSE Republican state enterprise
RLA Regulatory legal act
R&D Research and development
SDG Sustainable development goals
SDPP State district power plant
SP State program
SPAIID State program for accelerated industrial and innovative development
SPIID State program for industrial and innovative development
SPP Solar power plant
UN United Nations
UNFCCC United Nations Framework Convention on Climate Change
UNDP UN Development Programme
UNEP UN Environment Programme
USAID U.S. Agency for International Development
USD United States Dollars
VAT Value added tax
WAM With additional measures (scenario)
WCAM With current and additional measures (scenario)
WCM With current measures (scenario)
WOM Without measures scenario
WMO World Meteorological Organization
WPP Wind power plant
WWW World Weather Watch
3-6NC 3rd to 6th National Communication
Chemical formulas
CF4 Perfluorocarbon
C2F6. Perfluoroethane

6
CH4 Methane
CO Carbon oxide
CO2 Carbon dioxide
СО2 eq. СО2 equivalent
NOX Nitrogen oxide
N2O Nitrous oxide

7
I. Introduction
The Republic of Kazakhstan presents its second biennial report in accordance with the decision
1/CP.16 of the Conference of the Parties of the United Nations Framework Convention on Climate
Change (UNFCCC). The report consists of the Common tabular format provided by the Decision
19/CP.18 in electronic format and textual form. The text of the report was prepared in accordance with
the ‘UNFCCC Biennial Reporting Guidelines for Developed Country Parties’ that are included into the
Annex 1 to the Decision 2/СР.17 of the Conference of the Parties (COP). This Biennial Report
supplements the information contained in the 3-6 National Communication of the Republic of Kazakhstan
submitted in accordance with Articles 4 and 12 of UNFCCC and consists of the following sections:
Introduction that describes national conditions and mechanisms relevant for preparation
of national communications and biennial reports on a regular basis in Kazakhstan;
Information on national inventories of anthropogenic emissions by sources and removals
by sinks of all greenhouse gases (GHGs) not controlled by the Montreal Protocol that is included into the
national inventory reports for 1990-2013;
Quantified economy-wide emission reduction targets;
Progress in meeting quantified economy-wide emission reduction targets and related
information;
Updated projections of greenhouse gas emissions until 2020 and 2030 by sector of
economy;
The section describing extension of financial and technological support for capacity
building of developing country Parties.
Kazakhstan ratified the United Nations Framework Convention on Climate Change (UNFCCC) in
May 1995 and became its Party in August of the same year. The Kyoto Protocol (KP) to the UNFCCC
was signed by the Decree of the President of Kazakhstan on March 12, 1999. On March 23, 2000 the
government of Kazakhstan has notified the Secretary-General of the United Nations of its intention to
fulfill its obligations under paragraphs 2 a) and 2) b in accordance with paragraph 2 g) of Article 4 of the
UNFCCC. On March 26, 2009 President Nursultan Nazarbayev signed the Law of the Republic of
Kazakhstan No 144-IV ‘On ratification of the Kyoto Protocol to the UN Framework Convention on
Climate Change’. KP officially entered into force for Kazakhstan on September 17, 2009, 90 days after
receipt of the ratification document by the KP depositary - UN Secretary-General.
At the Seventh Conference of the Parties (CP7) on December 3, 2011 in Marrakesh (Morocco)
the decision was made that in accordance with paragraph 7 of Article 1 of the KP Kazakhstan is to be
considered as Annex I Party to the UNFCCC as it submitted a notice in accordance with paragraph 2 g) of
Article 4 of the Convention. Implementation of this decision was possible only after ratification of KP by
Kazakhstan. Therefore in 2009 the Government of Kazakhstan has started active work on preparation of
low-carbon development strategies and creation of the national emissions trading system. In 2012 at the
COP18/CMP8 in Doha (Qatar) together with the amendment to the KP it was decided to include
Kazakhstan in Annex B of the KP for its second commitment period and to take a commitment to reduce
GHG emissions by 2020 by 5% to the level of the base year 1990 (and by 7% if case of expanded
ambitions). The Doha amendment set out in Annex I to Decision 1/CMP.8 is subject to ratification. In
accordance with Articles 20 and 21 of the KP UN Secretary-General, acting as depositary of the KP, sent
the amendment to all parties of the KP. Given that provisions set in paragraph 7-ter to Article 3 of the KP
present certain difficulties for fulfillment of obligations stated by the Republic of Kazakhstan for the
second period of the KP, the Government of Kazakhstan has not yet made a decision on the ratification of
the Doha amendment.1
At the 21st COP of UNFCCC in December 2015 in Paris at the 43rd Session of Subsidiary Body
for scientific and technological advice under the request of the Republic of Kazakhstan to UNFCC
Secretariat on clarification of applicability of Doha amendment (Article 3, paragraph 7-ter), the decision
was made about Methodological issues under the Kyoto Protocol and clarification was given of the text in
section G (Article 3, paragraph 7 ter) of the Doha Amendment to the Kyoto Protocol, in particular the
1 1 FCCC/AWGLCA/2012/MISC.1 and Add.1 and 2, FCCC/TP/2013/7 (Table 1)

8
information to be used to determine the ‘average annual emissions for the first three years of the
preceding commitment period’. The decision sets out that 2 ‘for a Party included in Annex I undergoing
the process of transition to a market economy and without a quantified emission limitation or reduction
commitment in the first commitment period of the Kyoto Protocol, the positive difference between the
total emissions during the second commitment period and the assigned amount adjusted in accordance
with Article 3, paragraph 7 ter, of the Doha Amendment shall be added to the quantity of assigned
amount unit s to be taken into account for the purpose of the assessment referred to in decision 13/CMP.1,
annex, paragraph 14, and that the added quantity shall be limited to the quantity of assigned amount units
cancelled by that Party for the second commitment period of the Kyoto Protocol, in accordance with
Article 3, paragraph 7 ter, of the Doha Amendment’.
In accordance with INDC (Intended Nationally Determined Contributions) 3 submitted by
Kazakhstan to the UNFCCC Secretariat in 2015, the national quantitative contribution to limitation and/or
reduction of greenhouse gas emissions for the period from 2021 to 2030 has got an unconditional target of
15% and a conditional target of 25% to the level of the base year 1990. One of the key conditions for
achieving this target on 25% limitation and/or reduction of greenhouse gas emissions is access to
financial resources and mechanisms of low-carbon technologies transfer as well as access to flexible and
efficient funding mechanism of UN Green Climate Fund as a Party that is in a transition period.
At the same time Kazakhstan intends to achieve the following economy-wide emission reduction
targets: 15% by 2020 and 25% by 2050 compared to 1990.
For the purpose of fulfilling commitments under Article 12 of UNFCC, in 1998 Kazakhstan
prepared and submitted its Initial National Communication and then its Second National Communication
in 2009 as a non-Annex 1 Party to UNFCCC. After having become the Annex 1 Party, Kazakhstan had to
align submission of its national communications. Therefore the next National Communication was
submitted by January 1, 2014 as well as 3-6 National Communication (3-6NC).
3-6NC, as well as the 2nd National Communication, was prepared with the support of UNDP/GEF
projects.
2 The document is available at the website of UNFCC http://unfccc.int/resource/docs/2015/sbsta/rus/l29a01r.pdf 3The document is available at the website of UNFCC
http://www4.unfccc.int/submissions/INDC/Published%20Documents/Forms/AllItems.aspx.

9
II. GREENHOUSE GAS EMISSIONS AND TRENDS
This report contains a summary of the national greenhouse gas inventory information
about emissions and trends over the period from 1990 to 2013 for inclusion into the Second
Biennial Report of the Republic of Kazakhstan under UNFCCC.
II. A. Summary of the national inventory of greenhouse gas (GHG) emissions and
trends for the period from 1990 to 2013.
2.1 Description and interpretation of aggregated greenhouse gas emissions trends
The latest national inventory of greenhouse gases submitted by Kazakhstan in 2015 shows that in
the base year 1990 cumulative greenhouse gas emissions without LULUCF were at a level of 387.21
million tons of СО2 equivalent, and with LULUCF – 371.01 million tons of СО2 eq. During the period of
economic stagnation, that is until 1999, greenhouse gas emissions decreased to 165.68 million tons of
СО2 eq. without LULUCF, that is by 57%. With LULUCF, emissions decreased to 174.81 million tons of
СО2 eq., or 47%. In 2000 when industrial production was revived, GHG emissions started to grow in
Kazakhstan: by 2013 they reached 313.44 million tons of СО2 eq. without absorption in LULUCF sector,
and 302.56 million tons of СО2 eq. with absorption in LULUCF. However they have not yet reached the
base year level. In 2013 GHG emissions in Kazakhstan with absorption in LULUCF were 18% lower than
in the base year 1990, without LULUCF – 19% lower (Table 2.1).
2.1.1 Time series of greenhouse gas emissions by sectors
According to the GHG inventory in the base year 1990 Energy sector emitted 319.32 million tons
of СО2 eq., 19.97 million tons were emitted from Industrial Processes and Product Use, 43.55 million
tons from Agriculture, 4.4 million tons from the Wastes sector. Absorption in LULUCF was 16.2 million
tons of СО2 eq.
In 2013 total emissions of gases with the direct greenhouse effect, without 2013 absorption in
LULUCF, included 260.84 million tons of СО2 eq. from Energy sector, 18.07 million tons from industrial
processes, 28.27 tons from agriculture and 6.25 tons from wastes management. Absorption in LULUCF
sector was 10.89 million tons. Net emissions of GHG regulated by Kyoto protocol with LULUCF in 2013
are estimated at a level of 302.56 million tons of СО2 eq.
The biggest share in GHG emissions has СО2 which contribution was at a level of 68-78 %.
Second biggest is methane (18 - 25 %), third one – nitrous oxide (3 - 9 %). Contribution of fluorine gases
is less than 1%.

10
Figure 2.1 – Structure of the national inventory of Kazakhstan by gases, %
In 1990 contribution of СО2 into total emissions was 70%, methane – 15 %, nitrous oxide –5%. In
2013 the share of СО2 increased to 75 %, share of methane was 20 %, and contribution of nitrous oxide
was at a level of 5 % (Figure 2.1).
0
0,2
0,4
0,6
0,8
1
1,2
19
90
19
91
19
92
19
93
19
94
19
95
19
96
19
97
19
98
19
99
20
00
20
01
20
02
20
03
20
04
20
05
20
06
20
07
20
08
20
09
20
10
20
11
20
12
20
13
Shar
e in
%
Years
Share of СО2 Share СН4 Share of N2O Share of PFC
-50000
0
50000
100000
150000
200000
250000
300000
350000
19
90
19
91
19
92
19
93
19
94
19
95
19
96
19
97
19
98
19
99
20
00
20
01
20
02
20
03
20
04
20
05
20
06
20
07
20
08
20
09
20
10
20
11
20
12
20
13GH
G e
mis
sio
ns,
kto
n o
fСО2
eq.
Years
Energy IPPU Agriculture LULUCF Wastes

11
Figure 2.2: Dynamics of emissions of greenhouse gases in the Republic of Kazakhstan by sectors
from 1990 to 2013.
As seen on the Figure 2.2, dynamics of total GHG emissions in Kazakhstan throughout the entire
period largely depends of the Energy sector emission trend. Its average contribution to national emissions
over the years is 81 %. Contribution of Agriculture is significantly lower and it is 11% on average. IPPU
and Wastes contribute 5 % and 2 % respectively. In some years contribution of the Energy sector changed
from 76 % (1999) to 84 % (2010). Contribution of Agriculture changed from 15% to 10%, and since 2006
it was keeping at a level of 6 %. Contribution of IPPU changed from 3 to 6%. Share of emissions from the
Wastes sector was 1 to 3 %.
Biggest relative changes during this period were in the Energy sector, i.e. a sharp drop in 1999 to
the amount of 126.37 million tons (Table 2.1), that was only 40 % from the level of 1990 in this sector
and it was because of a profound crisis in the economy of Kazakhstan. In 2000, when revival of industrial
production started and investments were routed into oil&gas and mining industries, GHG emissions
started to grow.
Table 2.1
Emissions of greenhouse gases in the Republic of Kazakhstan from 1990 to 2013, million tons of
СО2 equivalent
1990 1995 1999 2005 2008 2011 2012 2013
% of
1990
year
Energy 319316,6 190609,5
126374,
9 198818,8 231641,7 245802,5 254244,3 260840,5 -18
IPPU 19969,2 8668,6 9595,5 14170,8 15678,5 18428,0 17474,1 18073,7 -9
Agricultur
e 43551,0 33489,3 24804,1 24324,6 25503,4 25767,1 27803,9 28273,4 -35
LULUCF -16200,5 219,2 9130,4 -13008,1 -4113,2 -5409,7 -8154,1 -10886,6 -33
Wastes 4377,9 4815,5 4901,6 5298,2 5582,9 6006,4 6111,7 6254,8 43
Total
emissions
with
LULUCF
371014,2 258906,0 174806,
5 229604,3 274293,4 290593,3 297480,1 302555,8 -18
Total
emissions
without
LULUCF
387214,7 237583,0 165676,
1 242612,4 278406,6 296003,0 305634,1 313442,4 -19
Energy sector
Fuel combustion in the energy sector is a main source of national GHG emissions in the Republic
of Kazakhstan. According to the IPCC classification, GHG emission sources in the Energy sector consist
of the following categories: energy industry, manufacturing and construction, transport, other sectors and
volatile emissions. Contribution of each category into cumulative GHG emissions in this sector is shown
on the Figure 2.3.
44%
11% 8%
16%
6%
15%
Energy
industry
Manufacturing and
construction
Transport
Other sectors
Other sectors
Fugitive emissions

12
Figure 2.3. – Shares of GHG emission sources in the Energy sector in 2013.
Hard fuel (coal) is most commonly used in Kazakhstan (Figure 2.4). In recent years decrease in
liquid and hard fuel consumption is observed due to gasification of populated areas and heat and power
plants switching to gas.
Figure 2.4. Structure of fuel consumption in the Energy sector, 2013.
A severe economic crisis of the nineties last century in Kazakhstan after the collapse of the old
socialistic system of economy led to lower consumption of energy resources and inherently lower GHG
emissions in the period from 1990 to 1999. Starting from 2000, country’s economy was gradually
reviving, fuel consumption was growing stably and therefore GHG emissions were growing as well. GHG
emissions maximum in the Energy sector was reached in 1990, minimum - in 1999.
Dynamics of GHG emissions in the Energy sector in 1990-2013 correlates with the fuel
consumption trend over the same period. In 2013 GHG emissions in the Energy sector amounted to
260.840 million tons of СО2 eq., that is 16.9% lower in comparison with 1990, and 2.6% higher than in a
preceding year 2012. СО2 emissions contribute 99 % to total GHG emissions. Methane and nitrogen
dioxide emissions were insignificant.
The main source of emissions in the Energy sector is the category Energy industry that includes
generation of heat and electricity, oil production and distillation and production of solid fuel (Figure 2.5).
Every year GHG emissions in this category make a half of all emissions in the Energy sector. GHG
emissions in 2013 in this category were 115.510 million tons of СО2 equivalent, and that is 18,9 % lower
compared to 1990, and 4,1 % higher than the level of 2012. There is a general trend observed in
combustion of secondary fuel: heating oil, diesel, refinery gas.
24%
55%
21%
oil and oil p[roducts hard fuel fuel gas

13
Figure 2.5. – Emissions of greenhouse gases in the category Energy industry, million tons of СО2
eq.
Figure 2.6. – Emissions of greenhouse gases in the category ‘Manufacturing and construction’,
million tons of СО2 eq.
GHG emissions in the category Manufacturing and construction from consumption of fuel in all
industries for their own and process needs in 1990…2013 showed a growing trend suggesting a gradual
growth of a manufacturing industry in the country (Figure 2.6). In this category coal is key fuel. In 2013
GHG in this category amounted to 28.23 million tons of СО2 eq., and that is 43,7% higher than a level of
1990 and 7,0 % lower than that in 2012.
Main sources of GHG emissions in this sub-category is ferrous (40%) and non-ferrous (33%)
metals industry, non-metallic minerals production and mining as these are leading industries in the
economy of Kazakhstan. Contribution of other industries to cumulative GHG emissions is minor in this
category due to their poor development in the republic.
0
20
40
60
80
100
120
140
160
1990
1991
1992
1993
1994
1995
1996
1997
1998
1999
2000
2001
2002
2003
2004
2005
2006
2007
2008
2009
2010
2011
2012
2013
СО
2,m
ln t
onnes
Production of electricity and heat Oil extraction and oil refining
Extraction and processing of solid fuels Energy industry, total
0
5
10
15
20
25
30
35
1990
1991
1992
1993
1994
1995
1996
1997
1998
1999
2000
2001
2002
2003
2004
2005
2006
2007
2008
2009
2010
2011
2012
2013
Mln
. to
nnes
of
СО
2-e
q.
Iron and steel Non-Ferros Metal Chemicals
Pulp,Paper Food Processing All other

14
In 2013 GHG emissions in the Transport category were 20.5 million tons of СО2 eq. Compared to
1990 there is a 22.1% decrease in emitted GHG, compared to 2012 the decrease is 11.8% (Figure 2.7).
Sources of GHG emissions in this category are automobile transport, off-road vehicles, railway transport,
water transport, civil aviation and pipelines for delivery of fuel to the consumer in the form of
transportation of oil, petroleum products and natural gas via pipelines.
Automobile transport makes most contribution to GHG emissions in Transport category. Its share
was 73% in 1990 and 84% in 2013. GHG emissions from automobile transport in 2013 were 17.1 million
tons of СО2 eq., in 1990 - million tons of СО2 eq., and by 2013 they increased by 0.5 million tons. In the
recent years a moderate growth of GHG emissions from automobile transport was observed. It is
explained by the saturation of a domestic market with cars in a relatively good condition. Besides that, the
Government of Kazakhstan has undertaken additional measures pertaining to taxation of engines with a
high volume and limited import of old cars.
The subcategory Civil aviation experiences a sustainable fuel consumption growth in recent
years. Compared to 1990, civil aviation emits much more due to the growth of air transportation over the
last 7 years.
Figure 2.7. Greenhouse gas emissions in Transport category in 1990-2013, mln. tons of СО2 eq.
GHG emissions in Other sectors subcategory include emissions from fuel combustion in a
commercial/institutional sector, residential sector and agriculture (Figure 2.8). During the period from
1990 to 2013 GHG emissions in this category had a downward trend because of lesser coal consumption
and larger share of natural gas as result of gasification in the country. GHG emissions in this category in
2013 were 14.57 mln. tons of СО2 eq., and that is 3.8 times less than 1990 level and 8,7 % less than in
2012.
GHG emissions in Other sources subcategory include emissions from fuel combustion in
activities of the government, defense, social insurance and fuel given to enterprises and organizations.
Biggest contribution into emissions in this category is made by fuel given to enterprises and
organizations. GHG emissions in this category in the years from 1990 to 2013 had an upward trend due to
the increase in amounts of fuel given to enterprises and organizations. GHG emissions in the Other
sources subcategory in 2013 were 39.294 mln. tons of СО2 eq., and that is 4.4 times more than in 1990
and 18.7 % higher figure than in 2012.
0
5
10
15
20
25
19
90
19
91
19
92
19
93
19
94
19
95
19
96
19
97
19
98
19
99
20
00
20
01
20
02
20
03
20
04
20
05
20
06
20
07
20
08
20
09
20
10
20
11
20
12
20
13
20
14
mln
.tons o
frСО
2eq.
Years
Other transport (pipeline) Water transport Railway transport Road transport Civil aviation

15
Figure 2.8 GHG emissions in Other sectors and Other sources categories, mln. tons of СО2 eq.
In 2013 methane emissions from coal production were 30805.8 kilotons of СО2 eq., or 12 % from
total emissions in the Energy sector. The share of this subcategory is 72 %. In comparison with 1990,
emissions in 2013 in this subcategory went down to 61 %, but insignificantly grew - 1.1% in comparison
with the previous year. The figure 2.9 shows a trend of volatile GHG emissions in СО2 eq. from coal and
oil&gas production in Kazakhstan. In 2013 72 % of emissions in the category Leakage-caused emissions
were made by Solid fuel subcategory while contribution of the oil&gas sector was 28%.
Figure 2.9. – Trend of volatile GHG emissions from activities related to production and
transportation of solid fuel, oil&gas, kilotons of СО2 eq.
Industrial processes and Product Use (IPPU)
Cumulative emissions of greenhouse gases in this sector in 2013 were 18073.738 kilotons of СО2
eq., that is 9,49 % lower than in 1990. Increase of GHG emissions in this sector from 1990 to 2013 is
explained by more intensive metals fabrication and launch of 3 new concrete plants. In comparison with
the previous inventories, during this inventory all time series of GHG emissions were re-estimated for the
0
10
20
30
40
50
60
70
1990
1991
1992
1993
1994
1995
1996
1997
1998
1999
2000
2001
2002
2003
2004
2005
2006
2007
2008
2009
2010
2011
2012
2013
Mln
tonnes
of
СО
2-e
q
commercial sector buildings residential sector agriculture, forestry, fisheries Others
0
10000
20000
30000
40000
50000
60000
199019921994199619982000200220042006200820102012
GHG emissions from theproduction and transportation ofoil and gas, as well as flaring(thous. Tonnes SSCH2 eq.)
GHG emissions from theproduction and processing of solidfuels (thous. tonnes of CO2equivalent)

16
categories: Soda ash use, Ammonia production, Ferroalloys production from 1990 to 2013. Also in 2013
results of GHG inventory of lead and zinc production were added.
Emissions in the manufacturing sector were gradually growing until 2006-2008. In 2009 and
2012 there was a small slowdown in production mainly in the Metal Industry due to the global crisis and
metal prices and demand drop. Cumulative emissions of greenhouse gases in the sector Industrial
processes and Products Use in 2013 were 2013 18073.7 kilotons of СО2 eq., that is 9,49 % less than in
1990.
Mineral Industry. Main source of emissions in this category is СО2 in the subcategory Cement
production.
Figure 2.10. GHG emissions trend in the category Mineral Industry in the period from 1990 to
2013, kilotons of СО2 eq.
Figure 2.10 demonstrates GHG emissions trend in the category Mineral Industry in the period
from 1990 to 2013. Cumulative GHG emissions in this category in 2013 were 5975.2 kilotons of СО2 eq.,
and that contributes 33.06% into the IPPU sector, and it is 3.14% more than in 1990.
Figure 2.11. – Contribution of GHG emissions from the Mineral Industry category in 2013.
Emissions in this category are distributed as follows: use of limestone and dolomite (47%),
cement production (42%) and lime production (11%) (Figure 2.11).
0
1000
2000
3000
4000
5000
6000
7000
GHG emissions from the use of lmestoneand dolomite
GHG emissions from lime production
GHG emissions from cement production
Emissions from cement production
42%
Emissions from lime production
11%
Emmissions from the use of limestone and
dolomite47%
Emissions from cementproduction
Emissions from lime production
Emmissions from the use oflimestone and dolomite
17
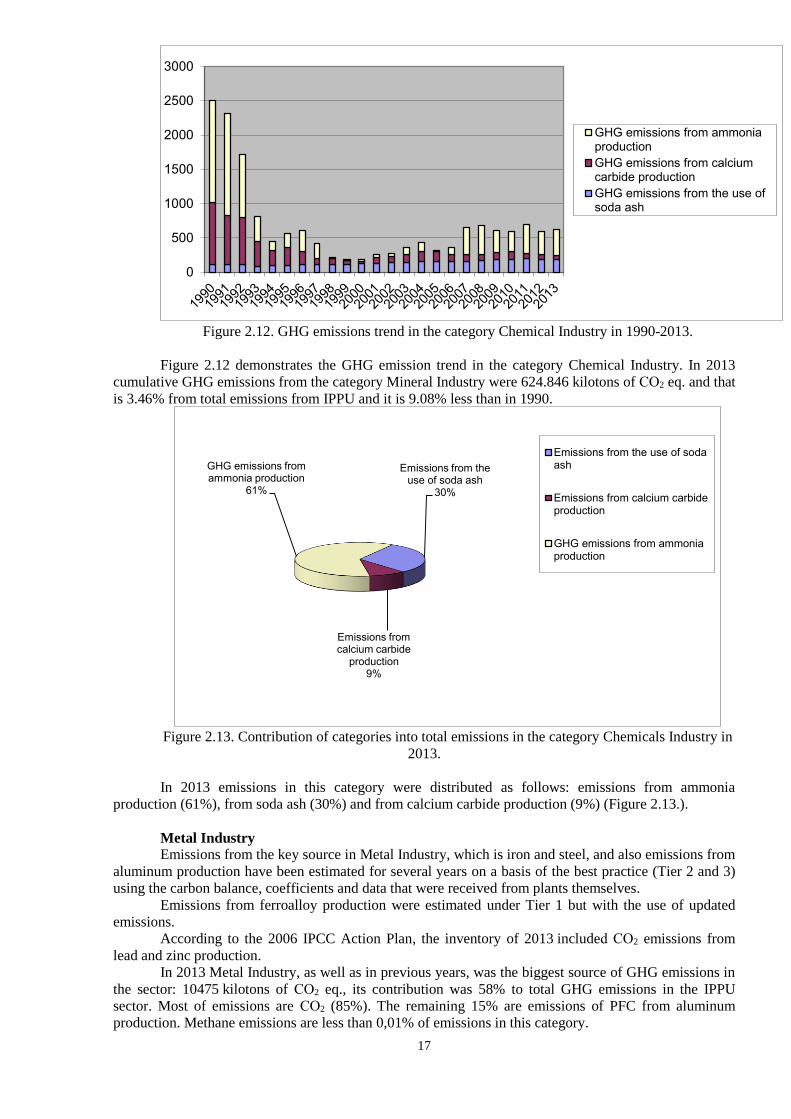
Figure 2.12. GHG emissions trend in the category Chemical Industry in 1990-2013.
Figure 2.12 demonstrates the GHG emission trend in the category Chemical Industry. In 2013
cumulative GHG emissions from the category Mineral Industry were 624.846 kilotons of СО2 eq. and that
is 3.46% from total emissions from IPPU and it is 9.08% less than in 1990.
Figure 2.13. Contribution of categories into total emissions in the category Chemicals Industry in
2013.
In 2013 emissions in this category were distributed as follows: emissions from ammonia
production (61%), from soda ash (30%) and from calcium carbide production (9%) (Figure 2.13.).
Metal Industry
Emissions from the key source in Metal Industry, which is iron and steel, and also emissions from
aluminum production have been estimated for several years on a basis of the best practice (Tier 2 and 3)
using the carbon balance, coefficients and data that were received from plants themselves.
Emissions from ferroalloy production were estimated under Tier 1 but with the use of updated
emissions.
According to the 2006 IPCC Action Plan, the inventory of 2013 included СО2 emissions from
lead and zinc production.
In 2013 Metal Industry, as well as in previous years, was the biggest source of GHG emissions in
the sector: 10475 kilotons of СО2 eq., its contribution was 58% to total GHG emissions in the IPPU
sector. Most of emissions are СО2 (85%). The remaining 15% are emissions of PFC from aluminum
production. Methane emissions are less than 0,01% of emissions in this category.
0
500
1000
1500
2000
2500
3000
GHG emissions from ammoniaproduction
GHG emissions from calciumcarbide production
GHG emissions from the use ofsoda ash
Emissions from the use of soda ash
30%
Emissions from calcium carbide
production9%
GHG emissions from ammonia production
61%
Emissions from the use of sodaash
Emissions from calcium carbideproduction
GHG emissions from ammoniaproduction
18
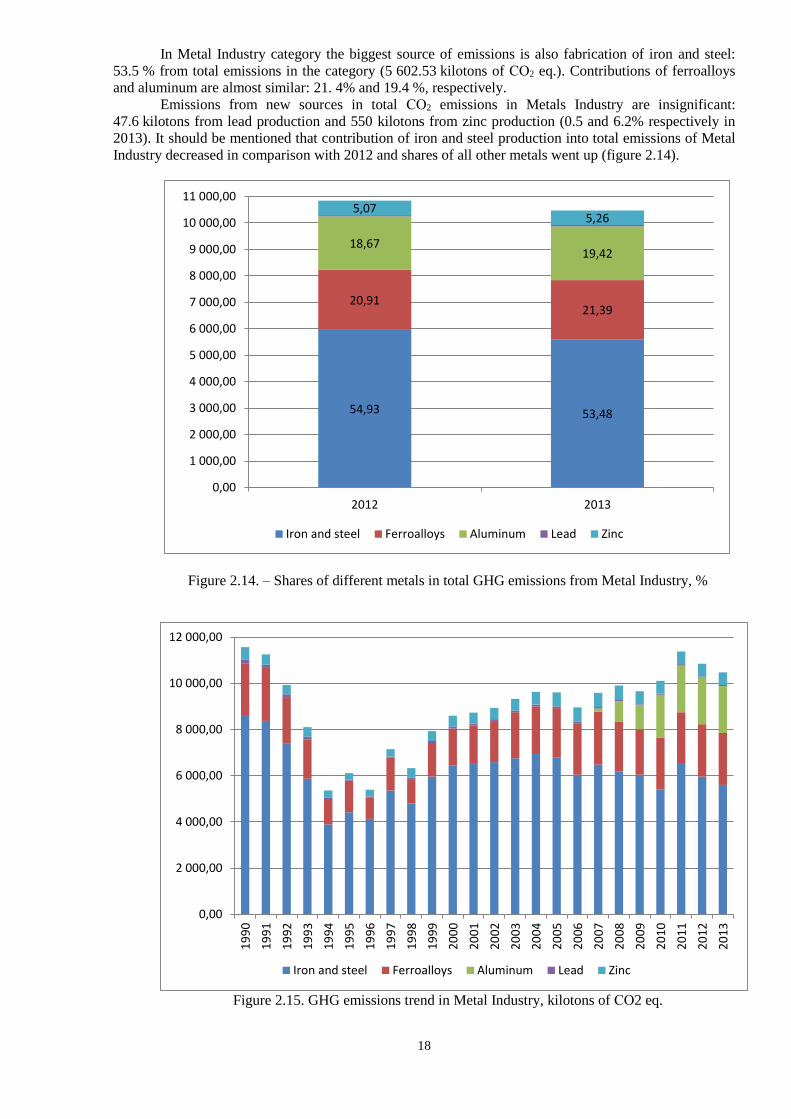
In Metal Industry category the biggest source of emissions is also fabrication of iron and steel:
53.5 % from total emissions in the category (5 602.53 kilotons of СО2 eq.). Contributions of ferroalloys
and aluminum are almost similar: 21. 4% and 19.4 %, respectively.
Emissions from new sources in total СО2 emissions in Metals Industry are insignificant:
47.6 kilotons from lead production and 550 kilotons from zinc production (0.5 and 6.2% respectively in
2013). It should be mentioned that contribution of iron and steel production into total emissions of Metal
Industry decreased in comparison with 2012 and shares of all other metals went up (figure 2.14).
Figure 2.14. – Shares of different metals in total GHG emissions from Metal Industry, %
Figure 2.15. GHG emissions trend in Metal Industry, kilotons of СО2 eq.
54,93 53,48
20,9121,39
18,6719,42
5,075,26
0,00
1 000,00
2 000,00
3 000,00
4 000,00
5 000,00
6 000,00
7 000,00
8 000,00
9 000,00
10 000,00
11 000,00
2012 2013
Iron and steel Ferroalloys Aluminum Lead Zinc
0,00
2 000,00
4 000,00
6 000,00
8 000,00
10 000,00
12 000,00
19
90
19
91
19
92
19
93
19
94
19
95
19
96
19
97
19
98
19
99
20
00
20
01
20
02
20
03
20
04
20
05
20
06
20
07
20
08
20
09
20
10
20
11
20
12
20
13
Iron and steel Ferroalloys Aluminum Lead Zinc

19
In 2013 СО2 emissions from production of some metals decreased in comparison with 2012 due
to the economic crisis: by 6% from iron and steel production and 1.2% from ferroalloy production. СО2
emissions from aluminum production were almost unchanged.
The crisis caused a minor slowdown in metals production in the country, and in 2013 total
emissions of СО2 in this category went 1.6% down in comparison with 2012. On the contrary total PFC
emissions from aluminum production increased 0.7%.
In comparison with 1990, total emissions went 9% down despite emergence of aluminum
production in 2007 and significant PFC emissions. СО2 emissions in this category are 23% lower than
1990 level mainly because of reduced production of iron and steel (table 2.2, figure 2.15).
Table 2.2
GHG emission trend in Metal Industry
Years 1990 2012 2013
СО2 10475,0 8771,9 8909,6
Iron and steel 8628,9 5958,5 5602,5
Ferroalloys 1696,1 2343,2 2240,2
Aluminum - 468,83 470,29
Lead - - 47,36
Zinc - - 550,66
PFC, aluminum - 1329,4 1565,5
Total GHG 10475,0 10101,3 10475,0
2.1.3 Agriculture, forestry and other types of land use Livestock production. In 2013 methane emissions from enteric fermentation of agricultural
animals was 631.64 Gg, and that is 401.46 Gg, or 39%, below the level of a base year 1990. Lowest
amounts were observed in 1998 (392.55 Gg). Key emissions sources were cattle and sheep (figure 2.16.).
Figure 2.16. Methane emissions (СН4) from enteric fermentation by animal species
Systems for collection, storage and use of manure. Methane emissions from the system for
collection, storage and use of manure in 2013 were 27.17 Gg, that is 20.42 Gg (43 %) lower than in 1990
(47.59 Gg) when biggest amount of CH4 emission took place (Figure 2.17.). Lowest amounts were
observed in 1998 (18.85 Gg.).
0
200
400
600
800
1000
1200
19
90
19
91
19
92
19
93
19
94
19
95
19
96
19
97
19
98
19
99
20
00
20
01
20
02
20
03
20
04
20
05
20
06
20
07
20
08
20
09
20
10
20
11
20
12
20
13
Gg
Years
Buffaloes
Asses
Swine
Horses
Camels
Goats
Sheep
Non-dairyCattleDairycattle

20
Figure 2.17. – Methane emissions (СН4) from systems of collection, storage and use of manure.
In this category of activities biggest amounts of methane were emitted from cattle manure (65 %).
Methane emissions from swine manure are 18 %, from sheep 6,5 %, other emissions are made by other
animals species.
In 2013 nitrous oxide emissions from systems of collection, storage and use of manure were
10.76 Gg, that is 42 % lower than such emissions in 1990 (18.59 Gg). Lowest emissions were observed in
1998 (7.12 Gg) (Figure 2.18).
Figure 2.18. – Emissions of nitrous oxide (N2O) from systems of collection, storage and use of
manure
Emissions of N2O from croplands. For croplands direct and indirect emissions of nitrous
compounds were estimated on a basis of additional nitrogen input into soil:
• With synthetic (mineral) nitrogen fertilizers,
• With organic fertilizers,
• With afterharvesting and root residues of agricultural crops,
• In the process of nitrogen mineralization in organic soils.
Grasslands emissions were estimated on a basis of nitrogen input with urine and manure of
grazing livestock.
N2O emissions from mineral nitrogen fertilizers were 1.04 kilotons or 309.92 kilotons of СО2
equivalent; 00.4 kilotons from organic fertilizers that is 11.92 kilotons in СО2 equivalent; emissions of
nitrous oxide from agricultural crop residues were 3.28 kilotons or 977.44 kilotons of СО2 equivalent.
Significant amounts of N2O are emitted due to mineralization of organic compounds in the soil: 11.50
0
5
10
15
20
25
30
35
40
45
50
19
90
19
91
19
92
19
93
19
94
19
95
19
96
19
97
19
98
19
99
20
00
20
01
20
02
20
03
20
04
20
05
20
06
20
07
20
08
20
09
20
10
20
11
20
12
20
13
Gg
Years
Buffaloes
Asses
Poultry
Swine
Horses
Camel
Goats
Sheep
0
2
4
6
8
10
12
14
16
18
20
19
90
19
91
19
92
19
93
19
94
19
95
19
96
19
97
19
98
19
99
20
00
20
01
20
02
20
03
20
04
20
05
20
06
20
07
20
08
20
09
20
10
20
11
20
12
20
13
Gg
Years

21
kilotons or 3427 kilotons in СО2 equivalent. In 2013 the atmosphere received 11.80 kilotons of nitrous
oxide from urine and manure of grazing livestock and that is 3516.4 kilotons of СО2 equivalent.
Total direct and indirect emissions of nitrogen compounds into the atmosphere from cultivated
soils in Kazakhstan (croplands and pastures), including release of nitrogen in the process of organic
compound mineralization, in 2013 were 27.66 kilotons or 8242.68 kilotons of СО2 equivalent (Figure
2.19).
1 – croplands; 2 - pastures
Figure 2.19. Total emissions of GHG from cultivated lands in 1990-2013.
Rice cultivation. Methane emissions from rice fields were estimated on the basis of initial data
on harvested rice acreage in Kazakhstan and IPCC default coefficients. Contribution of rice fields into
total methane emissions in the AFOLU category is less than 1 %. In 2013 methane emissions from rice
production were 14.04 kilotons and reduced by 27.7 % in comparison with the base year, and that is 351
kilotons of СО2 equivalent (Figure 2.20.).
0
5
10
15
20
25
30
35
40
45
501990
1991
1992
1993
1994
1995
1996
1997
1998
1999
2000
2001
2002
2003
2004
2005
2006
2007
2008
2009
2010
2011
2012
2013
N2
O, k
ton
es
/ye
ars
Croplands pastures

22
Figure 2.20. Emissions from flooded rice fields in 1990-2013, kilotons of СО2 equivalent
Forestry and land use. During the period of interest (1990-2013) forest lands and especially
agricultural lands of Kazakhstan have undergone significant anthropogenic transformations. For instance
in 2010-2013 canopy cover increased after trees planting and therefore improved much, forest
environment also improved largely as a result of afforestation activities, firefighting and preventive
measures. In the first decade of a period in question, commencement of the economic crisis brought
significant drop of cultivated lands as some lands were temporarily converted from crop rotation to
reserve (fallow land) and pastures. And until 2015 a stable decrease of soil fertility was observed on
croplands as well as decrease in crop rotation. Starting from the first decade and until 2005 together with
the reduction in livestock there was also decrease in actually used natural pastures, and a part of lands was
converted to reserve and this reduced burden on pastures, helped restoration of natural vegetation and in
general improved environmental conditions of lands. Those actions led to noticeable changes in carbon
reserves, annual changes in absorption/emissions of carbon dioxide and other gases on forest, agricultural
and other lands with multiple changes of flux directions (table 2.3).
Table 2.3
Annual changes in absorption (+) / emission (-) of greenhouse gases in AFOLU sector by land
use categories in Kazakhstan in 1990-2013, kilotons / year in СО2 eq.
Years Forest Pastures
and hay
field
Cultivated lands Wetland
s
Settlemen
ts
Total
11990 -4 203,94 -9 320,46 -40,33 4,25 -2 640,00 -16 200,49
11995 -2 621,27 -6 513,21 11 553,67 0,00 -2 200,00 219,18
22000 -2 374,77 -13 180,05 27 192,00 0,00 -1 771,00 9 866,18
22005 -2 814,77 -20 456,29 11 616,00 0,00 -1 353,00 -13 008,06
22010 -4 890,95 -9 185,28 12 232,00 314,60 -927,67 -2 465,29
22011 -6 899,13 -8 652,91 10 868,00 114,11 -839,67 -5 409,71
22012 -8 886,14 -8 066,89 9 504,00 46,64 -751,67 -8 154,06
22013 -10 925,24 -7 445,94 8 140,00 11,88 -667,33 -10 886,63
Table 2.3 demonstrates that after 2005 a sustainable absorption of GHG was observed in the
forest lands category of Kazakhstan, with biggest absorption amounts up to 10 925.24 kilotons/year in
0,00
50,00
100,00
150,00
200,00
250,00
300,00
350,00
400,00
450,00
500,00
19
90
19
91
19
92
19
93
19
94
19
95
19
96
19
97
19
98
19
99
20
00
20
01
20
02
20
03
20
04
20
05
20
06
20
07
20
08
20
09
20
10
20
11
20
12
20
13
СО2
eq.
in k
tons/y
ear

23
СО2 equivalent in 2013. In comparison with a previous year 2012, net absorption increased by 2039.1
kilotons/year and in comparison with 1990 by 6721.3.
During the entire observation period at natural pastures and hay fields absorption of GHG
prevailed with a maximum level of 20456.29 kilotons /year in 2005 (biomass and soil) with subsequent
reduction of absorption rate due to partial replenishment of livestock headcount and larger burden on
pastures. In 2013 absorption of СО2 was 7 445.94 kilotons/year in СО2 equivalent and that is 620.95
kilotons/year lower in comparison with the previous year 2012 and 1874.32 kilotons/year lower in
comparison with 1990.
Most visible changes in GHG fluxes in the land use category were observed after 1990 at
cultivated lands and that was due to catastrophic loss of soil fertility of arable lands in crop rotation
because of drastically reduced input into soil of mineral and organic fertilizers, biological residues of
after-harvesting remains. Another aspect was a major violation of tillage technologies and domination of
a monoculture – spring wheat – in crop rotation.
By 2000 cultivated lands reached maximal СО2 emissions: 27192.00 kilotons/year (soil and
biomass, including absorption of carbon dioxide by arable lands that are temporarily converted to reserve
lands or pasture). By 2013 emissions reduced to 8140.00 kilotons/year in СО2 equivalent that is 1364,00
kilotons/year lower in comparison with 2012 due to partial recovery of soil fertility and biomass
accumulation resulted from restored vegetation on arable lands that were temporarily withdrawn from
crop rotation. For comparison, in 1990 carbon balance of arable lands soils was assessed as deficit-free
(with absorption of carbon dioxide at a level of 40.83 kilotons/year).
In the category Settlements biggest amounts of greenhouse gas absorptions - up to 2640.40
kilotons/year in СО2 equivalent (biomass, soil) – were observed in the period of active lands use for the
purpose of settlement construction in early 90-ies last century with further decrease down to 667.33
kilotons/year in 2013.
Artificial reservoirs (as part of wetlands) emitted biggest amounts of greenhouse gases up to
314.60 kilotons/year in СО2 equivalent in the years when water was put into reservoirs constructed in
2010... 2011. In 2013 emissions were just 11.88 kilotons/year in СО2 equivalent.
Absorption prevailed in a cumulative flux of greenhouse gases of all land use categories over the
last decade: 10886.63 kilotons/year СО2 eq., that is 2732.57 kilotons more than in 2012 and 5313.86
kilotons/year less in comparison with 1990.

24
1 – Forest and tree and shrubbery planting 2 –Pastures and hay fields ; 3 – Cultivated lands (arable land under crop rotation, arable
land that is temporarily converted into reserve and pasture, arable land returned to crop rotation and perennial plantations); 4 – Wetlands (artificial reservoirs); 5 – Settlements (additionally arranged lands).
Figure 2.21. Annual changes in net absorption (-) / emission (+) of greenhouse gases by forest
lands and other types of land use in Kazakhstan from 1990 to 2013
Figure 2.22. Annual changes in net absorption (-) emission (+) of greenhouse gases cumulatively
from forest lands and other types of land use from 1990 to 2013.
-30000
-20000
-10000
0
10000
20000
30000
1990
1991
1992
1993
1994
1995
1996
1997
1998
1999
2000
2001
2002
2003
2004
2005
2006
2007
2008
2009
2010
2011
2012
2013
СО2, thous.
tones/years
1 2 3 4 5
-20000
-15000
-10000
-5000
0
5000
10000
1990
1991
1992
1993
1994
1995
1996
1997
1998
1999
2000
2001
2002
2003
2004
2005
2006
2007
2008
2009
2010
2011
2012
2013
СО2, thous
tonnes/years
25
Wastes. Total greenhouse gas emissions in the Wastes sector in 2013 were 6254.71 Gg of СО2
eq., that is 130.52 Gg СО2 eq., or 2,09 %, higher than the level of the previous year 2012. In comparison
with 1990, emissions in 2011 in this sector grew more than 1,43 times or by 42,83 %, mainly in the
category of municipal solid wastes due to bigger amounts of MSW and share of degradable organic
wastes in MSW and population growth. The share of the wastes sector in total national net emissions
without absorption in LULUCF in 2013 was 2 %. Cumulative emissions of greenhouse gases in the
Wastes sector increased mainly due to landfilling of municipal wastes, growing mass and changing
composition of MSW.
In 2013 the biggest contributor into total emissions in the Wastes sector was the category of
wastes disposal–52.8 %, and subcategory of unmanaged landfills of MSW: 49,3%.
Contribution of emissions from human wastewaters into total emissions in the wastes sector is
17,7 % in 2013, while in 1990 it was 21 %. Contribution of GHG emissions from incineration of
healthcare wastes in total emissions is small and in 2013 it was just 0,5 %.
II. B. Summary of procedures for preparation of the national greenhouse gas
inventory in Kazakhstan as well as changes in national procedures that took place after
submission of the First Biennial Report and 3rd to 6th National Communication
Kazakhstan’s national legislative framework on inventory of GHG emissions and removals
comprises institutional, legal and procedural mechanisms created to estimate anthropogenic emissions
from sources and GHG absorption on the basis of IPCC methodology. It was developed in accordance
with the paragraph 4 Article 158-1 of the Ecological Code of the Republic of Kazakhstan as of 9th of
January 2007 with changes and amendments as of 3rd of December 2011. To make implementation
possible, Kazakhstan adopted a ‘Regulation on the state system for inventory and data collection’
approved by the Decree of the Ministry of Environment Protection on 23 of July 2010 No 193-п and
Decree of the Government of the Republic of Kazakhstan as of 17 of July 2012 No 943 ‘On approval of
Rules on maintenance and management of the state cadaster of GHG emissions and removals’. After
introduction of amendments that regulate the state system for GHG emissions, the above regulations were
cancelled. To replace them, on 18 March 2015 a Decree of the Minister of Energy of RK No 214 was
adopted: ‘Rules for controlling completeness, transparency and reliability of state inventory of
greenhouse gas emissions and removals’. These Rules describe an updated procedure of the annual
national greenhouse gas inventory and include the list of information necessary for inventory at the
country level with the objective to fulfill international reporting commitments of Kazakhstan vis-a-vis
UNFCCC. Since 2015 the authorized body responsible for GHG inventory preparation and realization in
Kazakhstan is the Ministry of Energy of RK.
The state inventory is prepared with the use of data about production amounts and activities that
lead to anthropogenic GHG emissions from sources and their absorption. Such data are submitted by
government agencies according to the list mentioned in Annex to these Rules.
The Rules include definitions of the base year, key categories of sources, control of quality and
completeness of the cadaster, transparency of the state inventory of GHG emissions and removals with
open methodological approaches to estimate emissions and absorption of GHG. The Decree sets out
functions of the authorized body in the field of environment protection which govern organization and
coordination of the state GHG inventory system. The authorized body arranges preparation of the state
inventory of GHG emissions through collection, analysis and processing of data received from
government agencies and directly from enterprises who emit greenhouse gases. Government agencies
who are requested to submit information for the National report do it within a month after such a request.
In accordance with this Decree in 2015 it was possible to collect more comprehensive primary
information for the national inventory and to apply a better methodological approach to some categories
of data sources.
In accordance with these Rules, for the purpose of quality assurance and control, before
submission of the report to UNFCCC Secretariat, not later than 1st of March it is sent by the body
responsible for GHG emission and removal inventory to government agencies, independent experts,
scientific institutions and other organizations who were not directly involved in preparation of state
inventory of GHG emissions and removals. When comments are received, the authorized body organizes

26
finalization of the state inventory taking into account remarks and suggestions of independent experts,
scientific institutions and organizations.
Until 2015 GHG emissions inventory in Kazakhstan was in line with the Revised 1996 IPCC
Guidelines for National Greenhouse Gas Inventories. Since 2015 according to a Decision 24/СР.19, all
countries of Annex 1 including Kazakhstan have moved to the IPCC methodology of 2006 for preparation
of their GHG inventories. Also since 2015 electronic CRF tables are submitted in the new software CRF
Reporter. The Decision makes it necessary to use new values of the Potential global warming (PGW) in
accordance with the IPCC Fourth Assessment Report.

27
III. QUANTIFIED ECONOMY-WIDE EMISSION REDUCTION
TARGETS
Table 2 of CTF as well as the table 3.1 below includes description of the economy-wide
quantified emission reduction target.
Table 3.1
Description of the economy-wide quantified emission reduction target in the Republic of
Kazakhstan
№ Section Information
1 Base year 1990
2 Quantified emission reduction target 15%
3 Period for achieving the target 1990-2020
4 Gases and sectors covered All gases and sectors except LULUCF
5 The global warming potential, as it has been established
in the relevant decisions adopted by the COP
Fourth Assessment Report 24/CP.19
6 Approach to accounting emissions and removals from
LULUCF, taking into account any relevant decisions
adopted by the COP.
Not taken into account
7 The use of international market mechanisms to achieve
the emission reduction target, taking into account any
relevant decisions adopted by the COP, including a
description of each source of international units and/or
allowances through market mechanisms and possible
extent of contribution of each of them
Not used
8 Any other information, including the relevant
accounting rules, duly taking into account any relevant
decisions of the COP
Not available

28
IV. PROGRESS IN MEETING QUANTIFIED ECONOMY-WIDE
EMISSION REDUCTION TARGETS AND RELATED INFORMATION
4.1. Mitigation actions and their impact
4.1.1 Actions in the energy sector (fuel combustion)
On the 29th of October 2014 the Strategic Plan of the Ministry of Energy of the Republic of
Kazakhstan for 2014 – 2018 No 79 was approved. All climate-related strategic areas, outcomes and
objectives determined in the Strategic Plan of the MEWR were confirmed in the Strategic Plan of the
Ministry of Energy of RK. Climate –related strategic areas and objectives of the plan are as follows:
1. Development of electrical energy, coal industry and atomic energy.
1.1 Supporting energy generation by domestic sources to meet needs of the economy.
3. Stabilization and improvement of the environment.
3.1 Creation of conditions for conservation and restoration of ecosystems and for transition to
low-carbon development.
Key tasks and activities are summarized in Table 4.1.
Table 4.1
Outcomes, objectives and activities of the Strategic Plan of the Ministry of Energy of the
Republic of Kazakhstan for 2014-2018
Objectives and tasks Activity
Outcome 1.1
Supporting energy
generation by
domestic sources to
meet needs of the
economy.
Outcome 1.1.1.
Development of
electrical energy
(infrastructure)
Outcome 1.1.3.
Development of
renewable energy
sources
Making proposals for further development of electrical energy
Construction of the 1st module of Balkash CHPP
Construction of the Module No 3 of Ekibastuz SDPP-2
Modernization of Shardary SDPP
Reconstruction of the Module No 2 of Ekibastuz SDPP -1
Reconstruction of the Module No 1 of Ekibastuz SDPP -1
Preparing regulatory and technical documentation in the field of renewable
energy sources
Preparing regulatory legal acts that are necessary to implement the law of the
Republic of Kazakhstan on Supporting the use of renewable energy sources
Implementation of projects in the field of Renewable energy sources (RES)
Implementation together with local executive authorities of measures on
provision of electricity to populated areas an (or) settlements of Kazakhstan
where centralized power supply is economically inadvisable
Outcome 3.1
Creation of conditions
for conservation and
restoration of
ecosystems and for
transition to low-
carbon development
Outcome 3.1.3
Implementation of the
market mechanism for
reduction of
Maintaining state register of carbon units
Maintaining state cadaster of GHG emissions sources
Report on preparation of the National report on the inventory of anthropogenic
GHG emissions and removal by sinks for 1990 – 2012; 1990 – 2013; 1990 –
2014; 1990 – 2015; 1990 – 2016.
Preparation of the Biennial report on GHG emissions, climate mitigation
actions, financial resources, technologies and capacity building
Preparation of Communication to the UN Framework Convention on Climate
Change
Supporting functioning of the GHG emission trading market by creating a

29
greenhouse gas
emissions and for
transition to the green
economy*
relevant legislative framework
Activities within the framework of Partnership Programme ‘Green Bridge’
Implementation of the Action plan of the Concept on Transition of the Republic
of Kazakhstan to Green Economy for 2013-2020
Development of regulatory legal acts necessary for implementation of the Law
of the Republic of Kazakhstan ‘On supporting the use of renewable energy
sources’
Implementation of projects in the field of RES
Carrying out measures together with local authorities to ensure provision of
electricity to non-electrified settlements of Kazakhstan where centralized power
supply is economically inexpedient
Source: Strategic Plan of the Ministry of Energy for 2014 – 2018
Indicators for the above outcomes are listed in tables 4.2 and 4.3.
Table 4.2
Indicators of direct outcomes
№ Indicators of direct
outcomes
Source of
information
Mea
s.
unit.
Reporting
period
Planned period
2012 2013 2014 2015 2016 2017 2018
Outcome 1.1.1. Development of electricity (infrastructure)
1. Lower depreciation of fixed
assets of energy producers
Government
data
% 60,1 58,8 58,8 57,8 56,8 55,8 54,8
2. Share of gas power stations
in electricity generation Governmen
t data
% 17,5 18,4 18,5 18,6 18,7 18,8 18,9
Outcome 1.1.3. Development of renewable energy sources
3. Amount of electricity
generated by renewable
energy sources
Governmen
t data
bln.
kWh
- 0,53 0,57 1,2 1,4 1,6 2
Outcome 3.1.3 Implementation of the market mechanism for reduction of greenhouse gas emissions and for
transition to the green economy
4. Amount of carbon dioxide
emitted by electricity
industry as a share of 2012
Government data
% - - 100 100 100 100 100
5. Amount of electricity
generated by renewable
energy sources
Governmen
t data
bln.
kWh
- 0,53 0,57 0,7 1 1,6 2
Table 4.3
Indicators of the GHG emission target
30
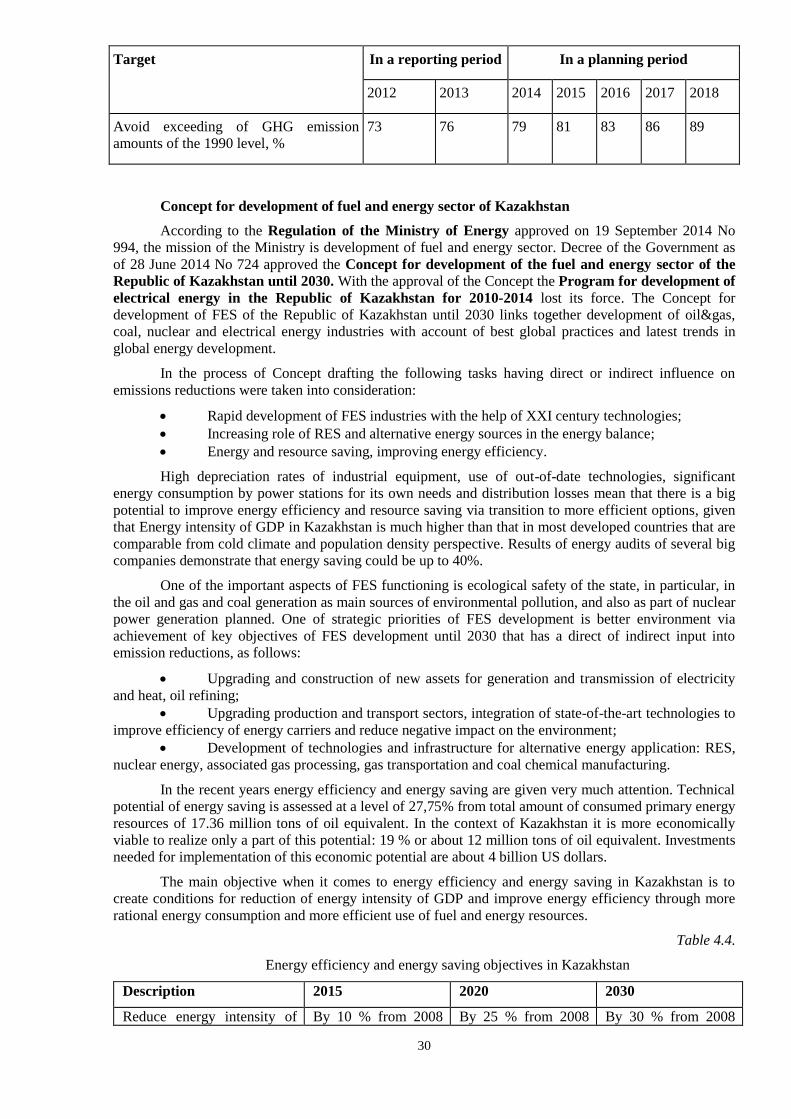
Target In a reporting period In a planning period
2012 2013 2014 2015 2016 2017 2018
Avoid exceeding of GHG emission
amounts of the 1990 level, %
73 76 79 81 83 86 89
Concept for development of fuel and energy sector of Kazakhstan
According to the Regulation of the Ministry of Energy approved on 19 September 2014 No
994, the mission of the Ministry is development of fuel and energy sector. Decree of the Government as
of 28 June 2014 No 724 approved the Concept for development of the fuel and energy sector of the
Republic of Kazakhstan until 2030. With the approval of the Concept the Program for development of
electrical energy in the Republic of Kazakhstan for 2010-2014 lost its force. The Concept for
development of FES of the Republic of Kazakhstan until 2030 links together development of oil&gas,
coal, nuclear and electrical energy industries with account of best global practices and latest trends in
global energy development.
In the process of Concept drafting the following tasks having direct or indirect influence on
emissions reductions were taken into consideration:
Rapid development of FES industries with the help of XXI century technologies;
Increasing role of RES and alternative energy sources in the energy balance;
Energy and resource saving, improving energy efficiency.
High depreciation rates of industrial equipment, use of out-of-date technologies, significant
energy consumption by power stations for its own needs and distribution losses mean that there is a big
potential to improve energy efficiency and resource saving via transition to more efficient options, given
that Energy intensity of GDP in Kazakhstan is much higher than that in most developed countries that are
comparable from cold climate and population density perspective. Results of energy audits of several big
companies demonstrate that energy saving could be up to 40%.
One of the important aspects of FES functioning is ecological safety of the state, in particular, in
the oil and gas and coal generation as main sources of environmental pollution, and also as part of nuclear
power generation planned. One of strategic priorities of FES development is better environment via
achievement of key objectives of FES development until 2030 that has a direct of indirect input into
emission reductions, as follows:
Upgrading and construction of new assets for generation and transmission of electricity
and heat, oil refining;
Upgrading production and transport sectors, integration of state-of-the-art technologies to
improve efficiency of energy carriers and reduce negative impact on the environment;
Development of technologies and infrastructure for alternative energy application: RES,
nuclear energy, associated gas processing, gas transportation and coal chemical manufacturing.
In the recent years energy efficiency and energy saving are given very much attention. Technical
potential of energy saving is assessed at a level of 27,75% from total amount of consumed primary energy
resources of 17.36 million tons of oil equivalent. In the context of Kazakhstan it is more economically
viable to realize only a part of this potential: 19 % or about 12 million tons of oil equivalent. Investments
needed for implementation of this economic potential are about 4 billion US dollars.
The main objective when it comes to energy efficiency and energy saving in Kazakhstan is to
create conditions for reduction of energy intensity of GDP and improve energy efficiency through more
rational energy consumption and more efficient use of fuel and energy resources.
Table 4.4.
Energy efficiency and energy saving objectives in Kazakhstan
Description 2015 2020 2030
Reduce energy intensity of By 10 % from 2008 By 25 % from 2008 By 30 % from 2008

31
GDP of Kazakhstan level level level
As part of transition to the green economy, a course toward diversification of generation suggests
that coal will continue to be a main energy source until 2030, however its share in the overall power
generation structure will be limited. Improvement of coal quality and moderate coal generation growth
with simultaneous implementation of modern technologies will help to improve ecology. The main
objective for the coal industry development is improvement of coal resource base efficiency to meet the
needs of a domestic market of fuel and energy resources and to make the industry more environment
friendly in general. It is expected that energy generation from coalbed methane will see growth.
Table 4.5.
Power generation from coalbed methane projections
Description 2015 2020 2030
Development of
power generation from
coalbed methane
Generation capacity
up to 6 MW
Partial satisfaction of
producers’ needs in power
generation
10% of power produced
from coalbed methane
For the purpose of meeting objectives on provision of all regions with gas transportation
infrastructure the Decree of the Government as of 4th November 2014 No 1171 has approved the
Gasification Master Plan of the Republic of Kazakhstan for 2015 – 2030. One of the key objectives of
the Master Plan in the field of environmental emissions is about creating conditions for larger
consumption of gas amongst other fuel and energy resources.
Table 4.6.
Key parameters of the Gasification Master Plan of the Republic of Kazakhstan for 2015 – 2030.
Description 2015 2020 2030
Natural gas production 44.2 billion m3/year 62.0 billion m3/year 59.8 billion m3/year
Domestic consumption of
marketable gas
13.6 billion m3/year 16.2 billion m3/year 18.4 billion m3/year
Key objective of the nuclear industry is building a full cycle of nuclear fuel manufacturing with
moderate increase of uranium production and distribution channels. One of the key tasks of the industry is
elaboration and implementation of the nuclear power plant (NPP) construction project. The following
results are expected:
Table 4.7.
Nuclear power generation projections
Description 2015 2020 2030
Development of
nuclear power
generation
Parameters and a site
for NPP construction
selected
NPP project
elaborated, NPP
construction started.
NPP with 100 MW capacity is
constructed and provided with
the network infrastructure
The Concept for FES Development declares a range of objectives that have to be met and some of
them may directly or indirectly reduce greenhouse gas emissions:
Development of renewable energy sources and their integration to the energy grid
Bringing the equipment depreciation rates down, increasing power capacity and capacity
of power transmission equipment;
Development of mobile gas generation in the Western energy grid to give capacity to the
Southern and Northern energy grids and meeting the needs of North and South peak capacity.
Improving energy efficiency in Kazakhstan.

32
Table 4.8.
Expected results for the power generation industry:
Description 2020 2030
Share of wind power plants (WPP) and solar power
plants (SPP) in total power generation
3% 10%
Share of gas power stations in total power
generation
20% 25%
Reduction of СО2 emissions from power industry Level of 2012 -15 % (to the level of
2012)
List of greenhouse gases
List of Actions of Kazakhstan in the field of climate change should be complemented with the
additional information on extension of the list of GHGs that fall under state regulation (carbon dioxide
СО2 and methane СН4) according to the Decree of the Minister of Energy as of 5th of March 2015 No
177:
1. Carbon dioxide (СО2);
2. Methane (СН4);
3. Nitrous oxide (N2O);
4. Perfluorocarbons (PFC).
In the current year 2015, the government plans to adopt the Mountain Code where it includes
methane as an independent mineral resource so that state support could be provided for its production.
Besides its use for power generation, methane would be also used for gasification of Astana city.
State Program for Accelerated Industrial and Innovative Development of the Republic of
Kazakhstan for 2015–2019
State programs are drafted in line with the list that has to be prepared by a responsible
government agency. Such a list of programs and responsible agencies is determined by the President of
the Republic of Kazakhstan. The latest list (approved on 19 March 2010 No 957) includes 11
governmental programs. The program that is directly addressing climate change is the State Program for
Accelerated Industrial and Innovative Development of the Republic of Kazakhstan for 2015–2019. This
program is a continuation of the State Program for Accelerated Industrial and Innovative
Development of the Republic of Kazakhstan for 2010 - 2014 (hereinafter: SPAIID) and it is based on
the outcomes of its predecessor.
To address the climate change issue, the program for industrial and innovative development of
Kazakhstan for 2015–2019 has an objective to reduce energy intensity in manufacturing at least by 15%
and an objective on petrochemicals development that could be achieved through unleashing resource
potential and favorable market environment. Petrochemicals development will help to address the task on
efficient use of hydrocarbons e.g. associated gas and dry gas. That helps to reduce non-productive
economic expenditures including environmental ones.
When the latest National Communication was submitted, the key industry program with climate
change issues integrated was the Zhasyl Damu Industry Program for 2010-2014 approved by the
Governmental Decree on 10 September 2010 No 924. This program’s key objective is to create
conditions for conservation and restoration of natural ecosystems. After approval of the Governmental
Decree as of 8 July 2014 No 779 ‘On amendment of the Governmental Decree of the Republic of
Kazakhstan as of 31 December 2013 No 1592 on Strategic Plan of the Ministry of Environment and
Water Resources of the Republic of Kazakhstan for 2014 – 2018’, Zhasyl Damu program lost its force.
On the 4th of July 2009 Kazakhstan adopted the Law ‘On support of the use of renewable
energy sources’. The Law supports the use of renewable energy sources as one of the instruments for
fulfilling country’s international GHG reduction obligations. It provides the national legislation with the
basic concepts pertaining to renewable energy sources, sets out approaches, forms and methods of

33
governmental support, determines competences of the Government in this regard, the authorized body,
local executive authorities. Competences of government agencies include:
• execution of the state policy in the field of renewable energy sources use;
• development of regulatory legal acts and technical regulations to support renewable
energy sources;
• approval of the renewable energy units location plan;
• ensuring connection of renewable energy sources to power grids or heat networks;
• supporting the framework for mandatory purchase of power produced by renewable
energy sources;
• creating favorable conditions for construction and operation of renewable energy
facilities;
• monitoring the use of renewable energy sources.
When in comes to regulation of generation of power (or) heat from renewable sources, feed-in
tariffs are established and targeted assistance is provided. Feed-in tariffs for electrical energy from
renewables are approved by the Governmental Decree No 645 on 12 June 2014 as follows:
Table 4.9
Feed-in tariffs for electricity generated by renewable energy sources
No Renewable energy technology used for power generation
Tariff as
KZT/kWh
(no VAT)
1
Wind power plants, except for the feed-in tariff for the wind power plant
Astana EXPO-2017 with a capacity of 100 MW, for transformation of
wind energy
22,68
1-1 Wind power plant Astana EXPO-2017 with 100 MW, for transformation
of wind energy 59,7
2
Photovoltaic solar energy transformers, except for the feed-in tariff for
solar power projects that use photovoltaic modules made of Kazakh
silica (KazPV), for transformation of solar radiation energy
34,61
3 Small hydro plants 16,71
4 Biogas plants 32,23
Rules on targeted support of individual consumers were approved by the Decree of the
Minister of Energy of the Republic of Kazakhstan on 28 November 2014 No 161. The Rules describe a
procedure of providing targeted support to individual consumers for the purchase of equipment that works
on renewable energy sources. The Government provides support to individual consumers in amount of
50% from the cost of equipment working on renewable energy sources with the cumulative capacity not
more that 5 kW according to a procedure established by an authorized body. Targeted assistance is paid
once such equipment has been put into operation.
List of climate change actions is also presented in Table 3 of CTF.
4.1.2. Actions in the industrial processes sector
Table 4.10
Actions in the industrial processes sector
Actions taken Short description
2015 2020 2030
kt. СО2 eq.
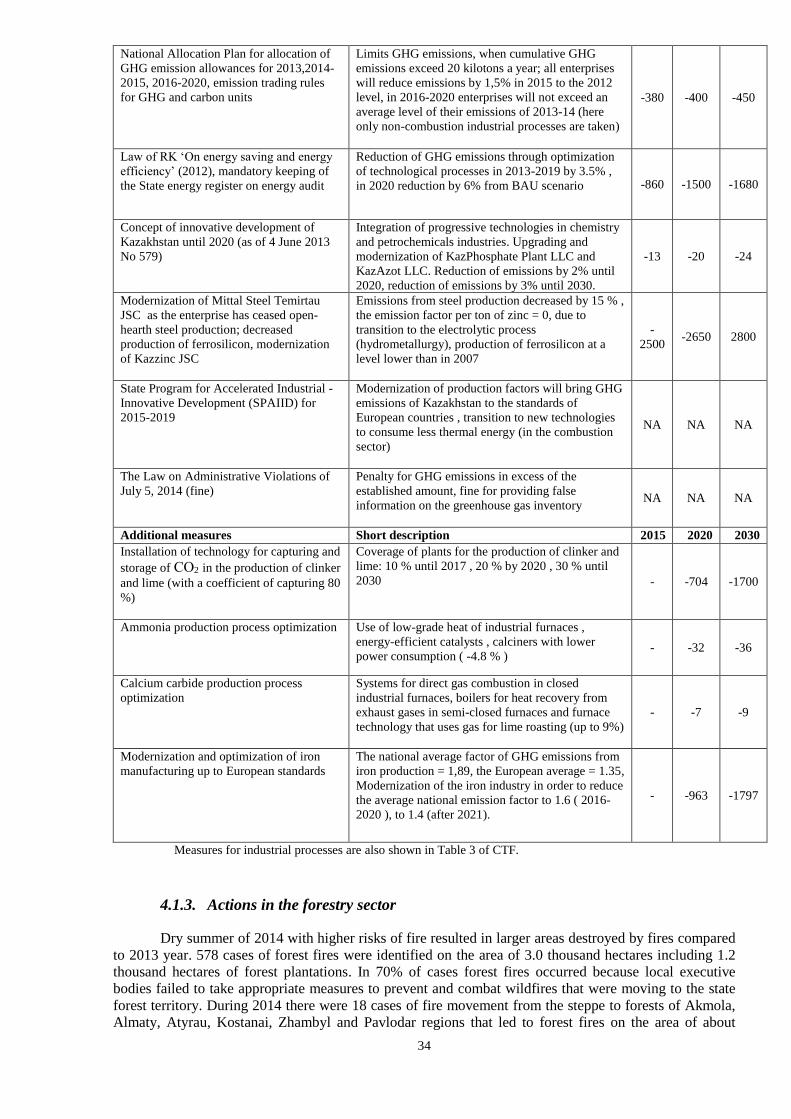
34
National Allocation Plan for allocation of
GHG emission allowances for 2013,2014-
2015, 2016-2020, emission trading rules
for GHG and carbon units
Limits GHG emissions, when cumulative GHG
emissions exceed 20 kilotons a year; all enterprises
will reduce emissions by 1,5% in 2015 to the 2012
level, in 2016-2020 enterprises will not exceed an
average level of their emissions of 2013-14 (here
only non-combustion industrial processes are taken)
-380 -400 -450
Law of RK ‘On energy saving and energy
efficiency’ (2012), mandatory keeping of
the State energy register on energy audit
Reduction of GHG emissions through optimization
of technological processes in 2013-2019 by 3.5% ,
in 2020 reduction by 6% from BAU scenario -860 -1500 -1680
Concept of innovative development of
Kazakhstan until 2020 (as of 4 June 2013
No 579)
Integration of progressive technologies in chemistry
and petrochemicals industries. Upgrading and
modernization of KazPhosphate Plant LLC and
KazAzot LLC. Reduction of emissions by 2% until
2020, reduction of emissions by 3% until 2030.
-13 -20 -24
Modernization of Mittal Steel Temirtau
JSC as the enterprise has ceased open-
hearth steel production; decreased
production of ferrosilicon, modernization
of Kazzinc JSC
Emissions from steel production decreased by 15 % ,
the emission factor per ton of zinc = 0, due to
transition to the electrolytic process
(hydrometallurgy), production of ferrosilicon at a
level lower than in 2007
-
2500 -2650 2800
State Program for Accelerated Industrial -
Innovative Development (SPAIID) for
2015-2019
Modernization of production factors will bring GHG
emissions of Kazakhstan to the standards of
European countries , transition to new technologies
to consume less thermal energy (in the combustion
sector)
NA NA NA
The Law on Administrative Violations of
July 5, 2014 (fine)
Penalty for GHG emissions in excess of the
established amount, fine for providing false
information on the greenhouse gas inventory
NA NA NA
Additional measures Short description 2015 2020 2030
Installation of technology for capturing and
storage of СО2 in the production of clinker
and lime (with a coefficient of capturing 80
%)
Coverage of plants for the production of clinker and
lime: 10 % until 2017 , 20 % by 2020 , 30 % until
2030
- -704 -1700
Ammonia production process optimization
Use of low-grade heat of industrial furnaces ,
energy-efficient catalysts , calciners with lower
power consumption ( -4.8 % ) - -32 -36
Calcium carbide production process
optimization
Systems for direct gas combustion in closed
industrial furnaces, boilers for heat recovery from
exhaust gases in semi-closed furnaces and furnace
technology that uses gas for lime roasting (up to 9%)
- -7 -9
Modernization and optimization of iron
manufacturing up to European standards
The national average factor of GHG emissions from
iron production = 1,89, the European average = 1.35,
Modernization of the iron industry in order to reduce
the average national emission factor to 1.6 ( 2016-
2020 ), to 1.4 (after 2021).
- -963 -1797
Measures for industrial processes are also shown in Table 3 of CTF.
4.1.3. Actions in the forestry sector
Dry summer of 2014 with higher risks of fire resulted in larger areas destroyed by fires compared
to 2013 year. 578 cases of forest fires were identified on the area of 3.0 thousand hectares including 1.2
thousand hectares of forest plantations. In 70% of cases forest fires occurred because local executive
bodies failed to take appropriate measures to prevent and combat wildfires that were moving to the state
forest territory. During 2014 there were 18 cases of fire movement from the steppe to forests of Akmola,
Almaty, Atyrau, Kostanai, Zhambyl and Pavlodar regions that led to forest fires on the area of about

35
2,000 hectares. Insufficient firefighting equipment in administrations of rural districts does not allow to
extinguish wildfires in a timely manner.
The second leading cause of forest loss is deforestation. The largest volume of illegal felling in
2014 was found in Zhambyl, East Kazakhstan, Kyzylorda, Kostanai, Pavlodar and North Kazakhstan
regions.
Despite the fires and felling, a tendency of reforestation and afforestation must be mentioned.
Considerable work has been done on the dried bottom of the Aral Sea, in the green zone of Astana and
Irtysh. Most silviculture activities were implemented on the territory of forest institutions of South
Kazakhstan region (24.6 thousand ha), Kyzylorda (24 thousand ha), as well as RSE Zhasyl Aimak (5
thousand ha) and Semei and Ertysormany reserves (4.2 and 2.8 thousand ha). The smallest amounts of
forest plantations are in the Pavlodar region - 19 hectares, Atyrau - 215 hectares and Karaganda - 240
hectares).
There is a plan to draft by the end of 2015 a national program for development of the forest sector
of Kazakhstan till 2020.
Emissions in the forestry sector are caused by fires when burning wood produces carbon dioxide
emissions, and by the rotting wood in wetlands.
Thus, measures to protect existing forests, planting new forests, as well as prevention and
reduction of areas under fires help to achieve emission reductions in the forestry sector. Legislative
framework and measures in this area may include: improved logging practices to reduce damage to
forests and soil, encouraging forest plantations, financial incentives for new activities in the field of forest
protection.
The main program under which a persistent achievement of increased GHG absorption in the
forestry sector took place was the program ‘Zhasyl Damu’ for 2010 - 2014 years. This program was
meant to regulate and coordinate action on adaptation to climate change and environmental protection. In
place of this document MEWR of Kazakhstan has developed the ‘Strategic Plan of the Ministry of
Environment and Water Resources of the Republic of Kazakhstan for 2014-2018 years’. Although the
MEWR of Kazakhstan was dissolved in 2014, the Strategic Plan continues to operate with the transition
of some functions of the MEWR to the Ministry of Energy and Ministry of Agriculture. According to this
plan, the area of unforested lands converted into the ‘forest’ category will increase.
Table 4.11.
Projected afforestation
Measu
rement
unit
2013
2014
2015
2016
2017
2018
The area of unforested
lands that was converted
into forest lands
Thous
and ha
6 6,5 7 7,5 8 8,5
The area of reforestation
and afforestation
Thous
and ha
53 54 55 56 57 58
Reducing the average
area under forest fires
Ha 10,9 10,8 10,7 10,6 10,5 10,4
Reducing the average
volume of 1 case of
illegal felling
m3 7,1 7 6,9 6,8 6,7 6,6
There are also many special programs for forestry development such as the Program for the forest
sector development of Kazakhstan till 2020 (2015), Concept of conservation and sustainable use of

36
biodiversity in the Republic of Kazakhstan till 2030 (2015) and others. These programs complement a
Strategic plan of the MEP for 2014-2018 and serve to protect and restore forests of Kazakhstan.
Forestry measures are also given in Table 3 of CTF.
4.1.4. Actions in the wastes sector
Table 3 of CTF provides information about actions that Kazakhstan is undertaking for climate
change mitigation in the waste sector.
These actions were officially approved (adopted) in 20144 and had not been declared in the 3-6
National Communication and First biennial report (BR1).
As indicated in the Program for modernization of the solid waste management system for 2014 -
2050 the country has no sorting stations where it would be possible to perform deep waste sorting to
extract secondary materials as well as the biodegradable fraction for its disposal for production of ‘green’
energy and compost. Also the system for separate waste collection and (or) sorting at the source of solid
waste generation is underdeveloped. The country currently has no centralized enterprises for wastes
incineration or biological treatment, and thus production of ‘green’ energy from MSW has not been
arranged. The first pilot project to build a plant for mechanical and biological treatment of wastes is
planned to be implemented in the city of Aktau. Start of construction of the waste processing plant is
planned for 2014, and this plant will be the first company that can produces ‘green’ energy from MSW
using the technology of anaerobic decomposition of the organic fraction of the waste.
In 2015, in Astana5 a pilot project was launched on the separate collection of wastes. As part of
the project since 1st of March 36 homes and 17 condominiums of the city received special colored wastes
containers for separate collection of paper, plastic, glass and mixed waste.
Since 2011, a similar project is being implemented in Kazakhstan's largest city Almaty6.
In 2007 a recycling plant was built in Almaty which worked for two years, but now it is not
functioning due to the unsettled (low) tariff for waste recycling7.
A wastes recycling plant in Astana (built in 2012) sorts only 7 percent of wastes8 (paper, plastic,
glass) of the total volume of incoming solid waste. The remaining mass is compressed and sent to a
landfill. At the current level of processing only a slight decrease in methane emissions is achieved. The
companies plan to produce energy from organic wastes.9
The executive director of the Association of Legal Entities ‘Kazakhstan Association of
Waste Management KazWaste’ Vera Mustafina 10 believes that: Kazakhstan has got very low tariffs on
disposal of solid wastes. They do not include sorting, recycling, waste reloading, equipment at collection
platforms, upgrading the vehicle fleet, containers and others. Tariffs vary in different cities several times
(from 70 to 300 tenge per person per month). Currently the Ministry of Energy has prepared a draft
methodology for the tariff calculation which includes all of the above components. International
experience shows that it is not possible to introduce a rational system of collection and recycling unless
the tariffs are raised. After the introduction of new methods and calculations it will be clear as to how
much rates will rise. At the same time some compensation must be provided to vulnerable people, similar
to other utilities tariffs.
4.2. Changes in institutional mechanisms
On August 6th, 2014 President of Kazakhstan Nursultan Nazarbayev signed a decree ‘On the
reform of the public administration system of the Republic of Kazakhstan’ No 875. This reform was
conducted as it was necessary to form a compact Government with the shift a of decision-making center
4 Resolution of the Government of the Republic of Kazakhstan ‘On approval of the program of
modernization of the solid waste management system in 2014 – 2050’ as of June 9, 2014 No 634 5http://astana.gov.kz/ru/modules/material/7640 6http://tengrinews.kz/strange_news/musora-almatintsev-delayut-detskie-ploschadki-prischepki-203174 7http://mir24.tv/news/society/3715240 8http://tengrinews.kz/kazakhstan_news/musoropererabatyivayuschiy-zavod-astane-obvinili-260272 9http://24.kz/ru/tv-projects-2/umnyj-gorod/item/68337-umnyj-gorod-razdelnyj-sbor-musora 10http://informburo.kz/stati/vyvoz-musora-v-kazahstane-podorozhaet--9824.html

37
to the level of ministries and regions, in order to increase efficiency and effectiveness of the state
machine, cut red tape and bureaucracy. For the purpose of modernization and improvement of public
administration efficiency, optimization of the state machine and formation of the compact Government a
decision was made to create a new structure of government consisting of 12 ministries and about 30
committees. 5 new ministries were created: 1) Ministry of National Economy; 2) Ministry of Culture and
Sports; 3) Ministry of Investment and Development; 4) Ministry of Energy of the Republic of
Kazakhstan. The following are the parts of the reform that directly or indirectly affect the issues of
mitigation.
The Ministry of Agriculture of the Republic of Kazakhstan was reorganized and received
functions and powers in the field of formation and implementation of state policy in the following sectors:
fishery, water management, forests, wildlife - from the Ministry of Environment and Water Resources of
the Republic of Kazakhstan.
The Ministry of Investment and Development of the Republic of Kazakhstan was formed and
received functions and powers of the Ministry of Transport and Communications of the Republic of
Kazakhstan.
The Ministry of Energy of the Republic of Kazakhstan was created and it received functions and
powers from the Ministry of Oil and Gas, Ministry of Industry and New Technologies in the field of
formation and realization of state policy in the sphere of electric power, nuclear energy, as well as from
the Ministry of Environment and Water Resources in the formation and implementation of public policy
for protection, control and supervision of natural resources management, municipal solid waste
management, renewable energy, monitoring the state policy on ‘green economy’.
This reform abolished the Ministry of Industry and New Technologies of the Republic of
Kazakhstan, Ministry of Transport and Communications of the Republic of Kazakhstan, Ministry of Oil
and Gas of the Republic of Kazakhstan and Ministry of Environment and Water Resources of the
Republic of Kazakhstan;
It was decided that the newly formed and restructured state agencies are successors to the rights
and obligations of the abolished state bodies in accordance with functions and powers transmitted.
The Ministry of Energy of Kazakhstan is the authorized body in the field of environment and
according to the new wording of Article 17 of the Environmental Code (dated September 29, 2014):
• organizes keeping of the state register of carbon units;
• organizes maintenance of the state cadaster of emissions and removals of greenhouse gases;
• defines a list of measures to encourage wastes recycling and reduce their generation;
• is responsible for issuing permissions for import and export of ozone-depleting substances and
products containing them to and from the territory of the Republic of Kazakhstan;
• prepares lists of best available technologies and arranges keeping of the register;
• develops a procedure for monitoring and control of greenhouse gas inventories;
• develops a procedure for implementation of project-based mechanisms in the field of regulation
of emissions and removals of greenhouse gases;
• develops a National Plan of allocation of allowances for greenhouse gas emissions;
• develops a procedure for allocation of allowances for greenhouse gas emissions;
• develops a procedure for development of the wastes management program;
• approves a methodology for determining standards for emissions into the environment and
wastes classification;
• develops a procedure for inclusion of nature management considerations into the permit for
emissions into the environment;
• prepares a typical list of actions for the environment protection;
• prepares a methodology for calculating fees for emissions into the environment;
• prepares a procedure for converting units of project-based mechanisms in the field of regulation
of emissions and removals of greenhouse gases into units of allowances;

38
• develops a procedure on elaboration of internal projects to reduce greenhouse gas emissions and
the list of industries and sectors in which they can be carried out;
• the procedure for mutual recognition of allowances and other carbon units on the basis of
international agreements of the RK;
• develops a procedure for emissions trading: greenhouse gases and carbon units;
• the procedure of monitoring, accounting and reporting of carbon emissions units for the purpose
of trading;
• the procedure for standardization of measurement and accounting of greenhouse gas emissions;
• methodologies for estimation of emissions, emission reductions and removals of greenhouse
gases;
• Rules on treatment of persistent organic pollutants and wastes containing them;
• the procedure for keeping the state register of carbon units;
• lists of the best available technologies;
• a list of pollutants and wastes for which emission standards are set;
• procedure of trading and commitments to reduce emissions into the environment;
• qualification requirements for the licensed activity in the field of environmental protection;
• technical regulations in the field of environmental protection;
• procedure for keeping the state register of polluted sites;
• procedures for monitoring and control of greenhouse gas inventories;
• procedure for implementing project-based mechanisms in the field regulation of emissions and
removals of greenhouse gases;
• rules for development of waste management programs;
• procedure of greenhouse gases and ozone-depleting substances inventory;
• the allowance (quota) for greenhouse gas emissions for participants of the market mechanism on
reduction of emissions and absorption of greenhouse gases;
• procedure for determining environmental quality targets;
• the procedure for issuing integrated environmental permits and the list of types of industrial
facilities, for which it is possible to obtain integrated environmental permits instead of permits for
emissions into the environment;
• A list of greenhouse gases, which are subject to government regulation;
• procedure for the issue of allowances for greenhouse gas emissions;
• procedure for implementing environmental (green) investments;
• international cooperation in the field of environmental protection;
• approves projects on emission reduction and absorption of greenhouse gases implemented in the
territory of the Republic of Kazakhstan;
• certifies independent organizations performing verification and validation of professional
(determination) activities in the field of reducing emissions and removals of greenhouse gases, as well as
confirmation of the report on greenhouse gas inventory.
4.3. Economic and social consequences of response measures
4.3.1. Energy sector (fuel combustion)
Accepted feed-in tariffs for the supply of electrical energy produced by renewable energy sources
and targeted assistance to individual consumers for the purchase of plants under five kilowatts working on
renewable energy sources in the amount of fifty percent of costs can positively influence the social and
39
economic development of remote and sparsely populated areas of the Republic of Kazakhstan by creating
jobs and improving well-being of the population.
The Gasification Master Plan of the Republic of Kazakhstan for 2015 – 2030 aims to create
conditions for sustainable socio-economic development of the country through development of the gas
transportation system and meeting gas supply needs with its own resources of natural gas as a clean fuel.
Successful implementation of the planned project on commercial production of methane from
mines will help to solve a number of important tasks. Firstly, the degassing has a positive impact on the
safety of miners. Secondly there will be an opportunity to develop new fuel and energy and chemical
industries, generating a multiplier effect through creation of new industries and innovative technologies
associated with attraction of new investments. Third, the degassing has an immediate positive effect on
the environmental situation. State support will help to generate sufficiently large tax deductions in 7-10
years.
4.3.2. Wastes management
Almaty experience has shown that separate collection of waste requires a significant investment
from local budgets. So, 1 underground container costs $ 4.00011. By the end of 2012 1000 underground
containers were installed in Almaty. Costs were 4 million US dollars. Sorted wastes are distributed to 20
enterprises that process wastes such as waste paper, glass, textiles, polyethylene and metal.
One of these companies specializes in processing of tires: rubber is crushed into small chips and
the coating is produced for children's playgrounds, tennis courts, speed bumps. Another organization is
involved in disposal of household and office equipment from which they produce clothespins, basins,
buckets and hangers. Fillers for mattresses and heaters are produced from textile wastes.
Some experts believe that Kazakhstan should not pursue separate waste collection because it
would be too expensive for the end user and they offer to introduce a line of automatic sorting of wastes12.
Profitability of plants can be ensured by secondary raw materials and fuels that can be produced from
wastes. In addition, automated process will reduce a number of staff. The technology allows to identify in
the total mass such hazardous waste items as electronics and mercury-containing products.
Other experts suggest to build sorting areas 13 from where wastes could be delivered to recycling
sites. Head of Environmental Union ‘Tabigat’ Mels Eleusizov criticized the idea of landfills construction,
wastes accumulation and subsequent sorting. He stressed that it would be better to build a sorting area in
the cities from where wastes could be transported to recycling sites. He calculated that, for example, 800
sorting areas would be enough for Almaty. According to a feasibility study, their construction will require
12 billion tenge. Eleusizov noted that with the wastes recycling system working, costs will be repaid in
ten years. In addition, the project provides 2400 jobs. According to the ecologist, 95 percent of municipal
solid wastes are subject to processing.
Wastes treatment plants can increase employment. For example, a waste recycling plant
in Astana employs more than 350 people 14.
4.4. Progress in meeting emission reduction targets
Kazakhstan is not yet able to reduce overall emissions: relatively high rates of economic growth
have led to a situation when the emissions trading system is not able to limit emissions of controlled
companies to the 2010 level (in 2013) and the average value of 2011-2012 (2014). Kazakhstan is not
using the unit emissions through market mechanisms.
According to estimates, the level of GHG emissions in 2015 in Kazakhstan will be about minus
15% from the 1990 level. To avoid exceedance of this indicator in 2020 and 2030, Kazakhstan needs to
stabilize emissions at current levels.
Additional information is provided in section V ‘Projections’ and Tables 4, 5 and 6 of CTF.
11http://tengrinews.kz/kazakhstan_news/almatyi-ustanovili-600-konteynerov-novogo-tipa-musora-227105 12http://tengrinews.kz/kazakhstan_news/razdelnyiy-sbor-musora-neeffektiven-slishkom-dorog-nemetskiy-261904 13http://tengrinews.kz/kazakhstan_news/eleusizov-raskritikoval-programmu-po-pererabotke-musora-261162 14http://tengrinews.kz/kazakhstan_news/musoropererabatyivayuschiy-zavod-zarabotal-v-astane-225679

40

41
V. PROJECTIONS
5.1. Updated Projections for 2020 and 2030
Below is an updated outlook of greenhouse gas emissions in Kazakhstan until 2030 (Figure 5.1).
According to the projection, only in the scenario with additional measures it is possible to achieve
by 2030 the goal to reduce emissions by 15% of the 1990 level.
Figure 5.1. GHG emissions projection, kt of СО2 equivalent without LULUCF
5.1.1 Projections in the energy sector (fuel combustion)
To predict greenhouse gas emissions associated with fuel combustion in a scenario with current
measures, without measures, with additional measures, a model of the energy system of the Republic of
Kazakhstan was used based on TIMES tool (The Integrated MARKAL-EFOM System) which gives a
technical and economic description of processes in the energy sector (‘bottom-up’). TIMES is a tool for
technical and economic modeling of energy systems which allows to perform scenario analysis of the
dynamics of energy systems in the long term. Emissions from sectors not related to the energy sector
were evaluated by the expert.
Business as usual (BAU) – without measures scenario.
This scenario reflects possible changes in amount of greenhouse gases when no measures are
taken to reduce them, and the main objective is to reduce costs. Further growth is achieved through the
use of cheap coal as a fuel for energy production.
0
50
100
150
200
250
300
350
400
450
500
1990 1995 2000 2005 2010 2015 2020 2030
Projection of greenhouse gas emissions, Mt of СО2 equivalent(without LULUCF)
Level of 1990 year Level of 1990 year minus 15%Without measures With measures

42
Scenario without measures has been prepared based on an analysis of emission categories. This
scenario assumes that greenhouse gas emissions are dependent on the overall GDP growth rate,
population and current transition towards less energy-intensive sectors of economy.
It is assumed that this scenario includes several measures and policies that have been
implemented in the country in recent years (National Allocation Plan for 2013 and 2014-2015). It is
expected that Balkhash thermal power plant with capacity of 1.32 GW will be constructed by 2020 and
will generate electricity in the future. This assumption is valid for the entire projection period and for all
scenarios.
With current measures scenario (WCM)
This scenario differs from the scenario without measures as it includes measures and policies to
reduce greenhouse gas emissions that have been taken and are planned to be adopted in the near future.
These measures include the planned National Allocation Plan for 2016 - 2020, growing share of
renewable and alternative energy sources in the energy mix and feed-in tariffs set for the supply of
electricity produced from renewable energy sources.
The National Allocation Plan for 2016 - 2020 suggests carbon dioxide emission allowances for
companies in the oil and gas, energy, mining and chemical industries in the amount of 738 121 767.24 in
2016-2020. According to the plan, a baseline is set as the average value of cumulative carbon dioxide
emissions in 2013-2014. The number of allowance units allocated for years 2016-2020 is calculated on
the basis of commitments to reduce carbon dioxide emissions at a rate of 0% from the baseline until 2020.
The action plan for development of alternative and renewable energy in Kazakhstan for 2013 -
2020 years suggests putting into operation about 106 renewable energy facilities with a total installed
capacity of 3054.55 MW (34 WPP - 1787 MW, 41 HPP - 539 MW, 28 SPP - 713,5 MW, 3 bio power
plants - 15.05 MW) and the Concept for development of fuel and energy sector of Kazakhstan till 2030 is
planning to launch a nuclear power plant with capacity up to 1000 MW.
Feed-in tariffs for the supply of electricity generated from renewable energy sources were
introduced in the form of subsidies for the respective plants.
With current and additional measures scenario (WCAM)
This scenario takes into account not only policies and measures of the scenario with current
measures but also additional ones that have not been yet spelled out in the action plan but most likely will
be planned and undertaken to achieve targets set by various policy documents and concepts. Since it is
not known from official sources what measures will be taken, the assumptions were made.
It is expected that after the end of the National Plan of allowances allocation for 2016 - 2020, the
next National Plan of allowances allocation for 2021 - 2025 will be adopted, and the total amount of
emissions for 5 years will be 10% more than in the previous plan. When it comes to development of
alternative and renewable energy in Kazakhstan for 2020 - 2030, it has been assumed that the same
amount of capacity will be commissioned as in the period 2013-2020. Commissioning of the nuclear
power plant with 1.5 GW capacity is expected.
In the scenario with current and additional measures a measure was suggested which was
described in the previous National Communication of Kazakhstan. This measure suggests a tax15 on
greenhouse gas emissions at a rate of $ 20 per 1 ton of greenhouse gas emissions in СО2 equivalent from
2015 to 2020, US $50 from 2020 to 2025, and then an upward trend starting from US $150 in 2025 to US
$300 by 2030.
Greenhouse gas emissions from wastes incineration
WOM, WCM and WCAM scenarios are based on technical and economic modeling of processes
associated with fuel combustion. All three scenarios are presented on Figure 5.2. The blue line on the
graph represents a level of greenhouse gas emissions in 1990, the red line represents 85% of emissions in
1990 and illustrates the defined contributions at the national level by 2030 (Intended Nationally
Determined Contributions - INDC). The black line shows the level of the energy sector in 1990.
15 This refers to the cost of certain measures to reduce greenhouse gas emissions. GHG tax is not planned and is not
considered. (The term "tax" is used for convenience of projection (hereinafter))

43
Figure 5.2 Development scenarios for greenhouse gas emissions from the energy sector
As seen on Figure 5.2, emissions in the energy sector in the WOM scenario grow throughout the
projection period and reach the 1990 level (sector Fuel combustion) approximately by 2020. Main source
of emissions in the combustion sector is Energy (58% of the total combustion sector) in which the key
categories are electricity and heat. In the WCM scenario the main factor that affects reduction of
emissions from fuel combustion is implementation of the proposed National Plan of Allowances
Allocation for 2016-2020. Construction and commissioning of renewable energy facilities helps to
stabilize the trend in the projection of emissions from fuel combustion sector in the WCAM scenario. In
the scenario with additional measures a downward trend is observed in the 20-ies due to high taxes on
СО2 emissions.
The results of the WOM, WCM and WCAM scenarios from processes associated with fuel
combustion as well as results of the inventory (by type of greenhouse gas) are listed in Table 5.1.
Table 5.1
Historical data and projections of cumulative emissions of greenhouse gases by type
Million tons of
СО2 equivalent Historical data, inventory WOM scenario
Types of gases 1990 1995 2000 2005 2010 2013 2015 2020 2030
СО2 272.71 167.00 137.37 185.77 232.91 234.88 231.01 256.71 295.57
СH4 1.50 0.92 0.42 0.62 0.86 0.83 44.78 58.78 83.57
N20 0.92 0.57 0.44 0.58 0.75 0.76 0.92 1.05 1.38
HFC NO,NA NO,NA 0.17 0.26 0.96 1.00 NE NE NE
PFC NO,NA NO,NA NO,NA NO,NA 1.42 1.57 NE NE NE
Total 275.12 168.49 138.40 187.23 236.90 239.03 276.71 316.54 380.52
Million tons of
СО2 equivalent Historical data, inventory WCM scenario
Types of gases 1990 1995 2000 2005 2010 2013 2015 2020 2030
0
50
100
150
200
250
300
350
400
450
1990 1995 2000 2005 2010 2015 2020 2030
Scenarios of greenhouse gas emissions from the Energy sector
1990 - Total emissions85% of 1990 - Total emissionsTotal emissions1990 - energy sectorWOM - energy sectorWM - energy sector

44
СО2 272.71 167.00 137.37 185.77 232.91 234.88 230.39 228.71 282.47
СH4 1.50 0.92 0.42 0.62 0.86 0.83 44.89 53.02 84.25
N20 0.92 0.57 0.44 0.58 0.75 0.76 0.92 0.96 1.32
HFC NO,NA NO,NA 0.17 0.26 0.96 1.00 NE NE NE
PFC NO,NA NO,NA NO,NA NO,NA 1.42 1.57 NE NE NE
Total 275.12 168.49 138.40 187.23 236.90 239.03 276.20 282.69 368.04
Million tons of
СО2 equivalent Historical data, inventory WAM scenario
Types of gases 1990 1995 2000 2005 2010 2013 2015 2020 2030
СО2 272.71 167.00 137.37 185.77 232.91 234.88 206.74 206.08 185.66
СH4 1.50 0.92 0.42 0.62 0.86 0.83 32.16 32.06 31.89
N20 0.92 0.57 0.44 0.58 0.75 0.76 0.81 0.85 0.91
HFC NO,NA NO,NA 0.17 0.26 0.96 1.00 NE NE NE
PFC NO,NA NO,NA NO,NA NO,NA 1.42 1.57 NE NE NE
Total 275.12 168.49 138.40 187.23 236.90 239.03 239.72 238.99 218.45
The following table shows the cumulative effect of current and additional measures.
Table 5.2
Cumulative effect of current and additional measures
Emission amounts, million tons of
СО2 equivalent
2015 2020 2030
Without measures scenario 276.7 316.5 380.5
With current measures scenario 276.2 282.7 368.0
Effect from measures 0.5 33.9 12.5
With additional measures scenario 239.7 239.0 218.5
Effect from additional measures 36.5 43.7 149.6
Figure 5.3 shows a diagram of C02 emissions associated with fuel combustion by sector.
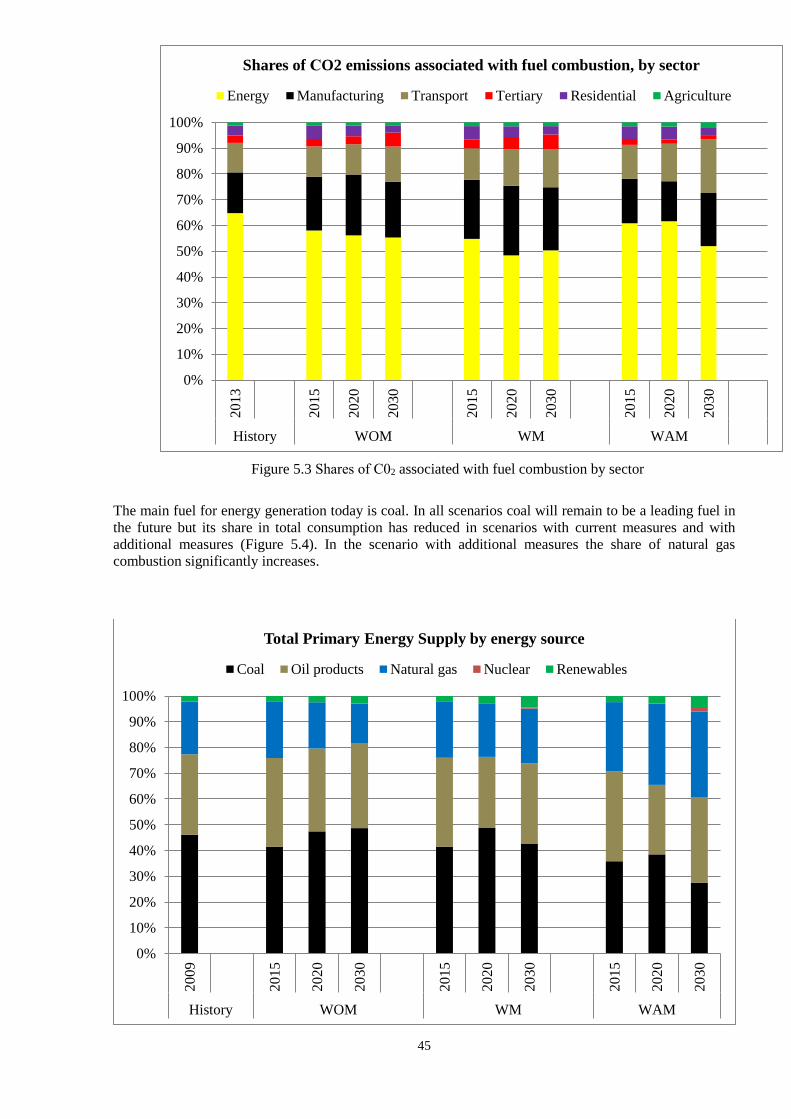
45
Figure 5.3 Shares of С02 associated with fuel combustion by sector
The main fuel for energy generation today is coal. In all scenarios coal will remain to be a leading fuel in
the future but its share in total consumption has reduced in scenarios with current measures and with
additional measures (Figure 5.4). In the scenario with additional measures the share of natural gas
combustion significantly increases.
0%
10%
20%
30%
40%
50%
60%
70%
80%
90%
100%
2013
2015
20
20
20
30
20
15
20
20
20
30
20
15
20
20
20
30
History WOM WM WAM
Shares of СO2 emissions associated with fuel combustion, by sector
Energy Manufacturing Transport Tertiary Residential Agriculture
0%
10%
20%
30%
40%
50%
60%
70%
80%
90%
100%
2009
2015
2020
2030
2015
2020
2030
2015
2020
2030
History WOM WM WAM
Total Primary Energy Supply by energy source
Coal Oil products Natural gas Nuclear Renewables

46
Figure 5.4 Emissions of С02 associated with combustion by types of fuel
Agriculture (fuel combustion)
CO2 emissions from the agricultural sector are negligible compared to emissions from other
sectors and they vary in all three scenarios. According to projections, in the agricultural sector 2.8 million
tons of CO2 will be emitted by 2020 and 3.4 million tons of CO2 by 2030. Average emissions growth will
be about 2% per year for the entire period from 2012 to 2030 and that is lower than expected growth of
GDP.
Manufacturing (fuel combustion)
Table 5.3 presents the inventory data for the period from 1990 to 2013 and projections for 2015-
2030. The emissions growth will depend on changes in technology used in the manufacturing sector. In
the WCM scenario emissions from this sector will increase by 4 million tons of CO2. This increase is
explained by the fact that reduction of heat generation by a non-manufacturing sector leads to increased
self-consumption of coal to produce heat for industrial purposes. The change in emissions across
industries will be uneven. Additional measures will reduce CO2 emissions compared to a scenario without
measures by approximately 24 million tons of CO2 because the share of natural gas grows and thus it is
possible to use the heat from the CHPP working on natural gas instead of the CHPP on coal.
Table 5.3
Total СО2 emissions from the manufacturing sector by categories of emissions, by years and
projection by scenarios
Million tons of СО2 Historical data, inventory WOM scenario
Emission categories 1990 1995 2000 2005 2010 2013 2015 2020 2030
Iron and steel 8.5 6.7 9.3 12.3 9.0 9.6 11.7 13.8 18.2
Non-ferrous metals 2.5 4.0 7.3 7.7 11.1 8.1 15.2 16.2 8.0
Chemicals 1.9 1.1 0.4 0.2 0.3 0.7 1.3 3.0 4.6
Pulp, paper and printing 0.0 0.0 0.0 0.0 0.0 0.0 0.1 0.2 0.5
Food processing, beverages and
tobacco 0.8 1.5 0.8 1.1 1.4 0.6 0.0 0.0 0.0
Non-metallic minerals 4.8 0.7 0.8 2.4 3.0 3.9 2.9 3.2 5.3
Other 1.0 2.5 4.0 5.4 4.9 5.2 11.6 18.1 24.1
Total 19.5 16.6 22.5 29.1 29.9 28.1 42.7 54.5 60.7
Million tons of СО2 equivalent Historical data, inventory WCM scenario
Emission categories 1990 1995 2000 2005 2010 2013 2015 2020 2030
Iron and steel 8.5 6.7 9.3 12.3 9.0 9.6 11.7 13.8 18.2
Non-ferrous metals 2.5 4.0 7.3 7.7 11.1 8.1 15.2 15.7 12.1
Chemicals 1.9 1.1 0.4 0.2 0.3 0.7 1.3 2.0 4.5
Pulp, paper and printing 0.0 0.0 0.0 0.0 0.0 0.0 0.1 0.2 0.5
Food processing, beverages and
tobacco 0.8 1.5 0.8 1.1 1.4 0.6 0.0 0.0 0.0
Non-metallic minerals 4.8 0.7 0.8 2.4 3.0 3.9 2.9 3.2 5.3
Other 1.0 2.5 4.0 5.4 4.9 5.2 11.8 14.3 24.1
Total 19.5 16.6 22.5 29.1 29.9 28.1 43.0 49.2 64.7
Million tons of СО2 equivalent Historical data, inventory WAM scenario
Emission categories 1990 1995 2000 2005 2010 2013 2015 2020 2030
Iron and steel 8.5 6.7 9.3 12.3 9.0 9.6 11.7 13.8 21.0
Non-ferrous metals 2.5 4.0 7.3 7.7 11.1 8.1 9.7 3.3 4.7

47
Chemicals 1.9 1.1 0.4 0.2 0.3 0.7 0.6 1.0 1.3
Pulp, paper and printing 0.0 0.0 0.0 0.0 0.0 0.0 0.0 0.1 0.1
Food processing, beverages and
tobacco 0.8 1.5 0.8 1.1 1.4 0.6 0.0 0.0 0.0
Non-metallic minerals 4.8 0.7 0.8 2.4 3.0 3.9 1.7 2.3 4.9
Other 1.0 2.5 4.0 5.4 4.9 5.2 8.7 8.7 5.3
Total 19.5 16.6 22.5 29.1 29.9 28.1 32.4 29.2 37.2
Residential sector (fuel combustion)
In these scenarios all measures to reduce emissions from fuel combustion are concentrated in the
energy sector, therefore emissions in the residential and utilities sectors do not change in different
scenarios. The main fuel causing CO2 emissions was and remains coal. Basically emissions will increase
1.5 times and will amount to 22.5 million tons of CO2 equivalent in the scenario with measures. In the
scenario with additional measures combustion of coal is reduced to zero by 2030, natural gas is
combusted only for hot water supply in the utilities sector and for cooking. All the other energy needs are
met by electricity generation.
Figure 5.5. CO2 emissions associated with combustion in residential and utilities sectors
0,0
5,0
10,0
15,0
20,0
25,0
2009
2015
2020
2030
2015
2020
2030
2015
2020
2030
History WOM WM WAM
Mt
of
CO
2 e
qu
ivale
nt
CO2 emissions related to the combustion in tertiary and residential
sector
Coal Oil products Natural gas Biofuel

48
Emissions from power and heat plants (fuel combustion)
Emissions from power plants and heat plants make 30 - 35% of total emissions and 46 - 50% of
emissions associated with fuel combustion. Although emissions and their shares are changing, Figure 5.6
shows that the main fuel for generating electrical and thermal energy is coal, regardless of the scenario.
Table 5.4 shows that the proportion of plants that produce electricity only goes down in all scenarios,
which can be explained by the fact that co-generation of electricity and heat is beneficial in the context
Kazakhstan and for emission reduction. At the same time in the scenario with additional measures the
share of power plants producing electricity increases only. This is due to a growing share of electric
power from wind, solar and nuclear energy (see Figure 5.7 and Figure 5.8). Contribution to emission
reduction from the sector of electric and thermal power plants is one of the biggest and most fundamental.
Table 5.4
Total CO2 emissions associated with combustion of fuel at power and heat plants by years,
projections by scenarios
Million tons of СО2
equivalent Historical data, inventory WOM scenario
Technology type 1990 1995 2000 2005 2010 2015 2020 2030
Power plants N/A N/A N/A N/A N/A 30.19 11.55 5.56
CHPP N/A N/A N/A N/A N/A 38.08 56.96 80.67
Boilers N/A N/A N/A N/A N/A 17.09 15.25 17.06
Total 112.39 85.26 53.56 70.61 86.84 85.35 83.77 103.29
Million tons of СО2
equivalent Historical data, inventory WCM scenario
Technology type 1990 1995 2000 2005 2010 2015 2020 2030
Power plants N/A N/A N/A N/A N/A 30.19 6.21 5.56
CHPP N/A N/A N/A N/A N/A 38.08 51.54 44.93
Boilers N/A N/A N/A N/A N/A 16.36 15.11 34.77
Total 112.39 85.26 53.56 70.61 86.84 84.63 72.86 85.26
Million tons of СО2
equivalent Historical data, inventory WAM
Technology type 1990 1995 2000 2005 2010 2015 2020 2030
Power plants N/A N/A N/A N/A N/A 30.19 35.75 17.95
CHPP N/A N/A N/A N/A N/A 38.70 39.47 38.91
Boilers N/A N/A N/A N/A N/A 12.48 10.95 1.10
Total 112.39 85.26 53.56 70.61 86.84 81.37 86.17 57.95
N/A – not applicable as inventory by Zhasyl Damu provides no breakdown by types of plants

49
Figure 5.6 СО2 emissions associated with combustion of fuel at power and heat plants by types of
fuel
Figure 5.7 Power generation by scenarios
0
20
40
60
80
100
120
2009
2015
2020
2030
2015
2020
2030
2015
2020
2030
History WOM WM WAM
Mt
of
CO
2 e
qu
iva
len
t
CO2 emissions from power and heat plants by fuel
Coal Natural gas Biofuel
70,0
80,0
90,0
100,0
110,0
120,0
130,0
140,0
150,0
160,0
170,0
2005 2010 2015 2020 2025 2030
bln
kw
h
Electricity output by scenarios
WOM WM WAM
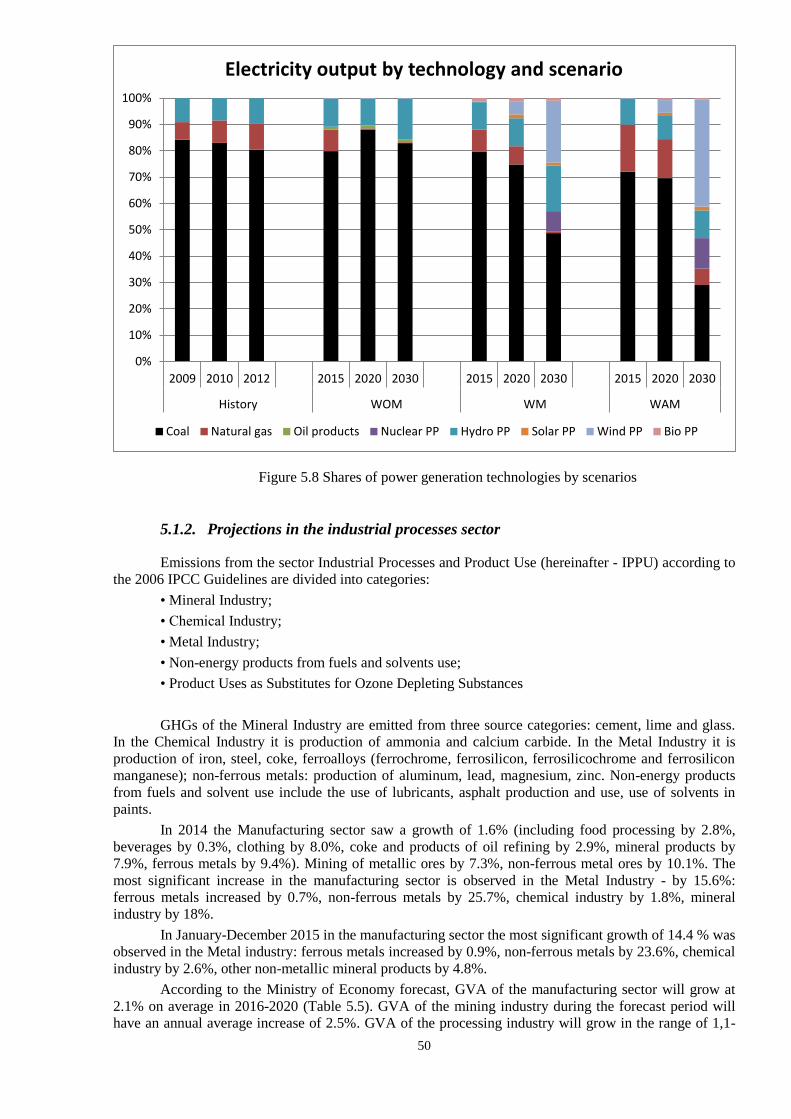
50
Figure 5.8 Shares of power generation technologies by scenarios
5.1.2. Projections in the industrial processes sector
Emissions from the sector Industrial Processes and Product Use (hereinafter - IPPU) according to
the 2006 IPCC Guidelines are divided into categories:
• Mineral Industry;
• Chemical Industry;
• Metal Industry;
• Non-energy products from fuels and solvents use;
• Product Uses as Substitutes for Ozone Depleting Substances
GHGs of the Mineral Industry are emitted from three source categories: cement, lime and glass.
In the Chemical Industry it is production of ammonia and calcium carbide. In the Metal Industry it is
production of iron, steel, coke, ferroalloys (ferrochrome, ferrosilicon, ferrosilicochrome and ferrosilicon
manganese); non-ferrous metals: production of aluminum, lead, magnesium, zinc. Non-energy products
from fuels and solvent use include the use of lubricants, asphalt production and use, use of solvents in
paints.
In 2014 the Manufacturing sector saw a growth of 1.6% (including food processing by 2.8%,
beverages by 0.3%, clothing by 8.0%, coke and products of oil refining by 2.9%, mineral products by
7.9%, ferrous metals by 9.4%). Mining of metallic ores by 7.3%, non-ferrous metal ores by 10.1%. The
most significant increase in the manufacturing sector is observed in the Metal Industry - by 15.6%:
ferrous metals increased by 0.7%, non-ferrous metals by 25.7%, chemical industry by 1.8%, mineral
industry by 18%.
In January-December 2015 in the manufacturing sector the most significant growth of 14.4 % was
observed in the Metal industry: ferrous metals increased by 0.9%, non-ferrous metals by 23.6%, chemical
industry by 2.6%, other non-metallic mineral products by 4.8%.
According to the Ministry of Economy forecast, GVA of the manufacturing sector will grow at
2.1% on average in 2016-2020 (Table 5.5). GVA of the mining industry during the forecast period will
have an annual average increase of 2.5%. GVA of the processing industry will grow in the range of 1,1-
0%
10%
20%
30%
40%
50%
60%
70%
80%
90%
100%
2009 2010 2012 2015 2020 2030 2015 2020 2030 2015 2020 2030
History WOM WM WAM
Electricity output by technology and scenario
Coal Natural gas Oil products Nuclear PP Hydro PP Solar PP Wind PP Bio PP

51
3,9% in 2016-2020. The increase in GVA of the chemical industry will be 2.2% per year on average. The
average annual growth of GVA of the construction industry will be 3.3% (with the commencement of the
State Program Nurly Jol for 2015-2019 construction works may have higher growth rates).
Projection of greenhouse gas emissions for the sector of Industrial processes, subsector Metals, is
made on a basis of an analysis of historical data and forecast of the Ministry of Economy until 2020. To
forecast the production of iron, steel, sinter, ferroalloys up to 2030 the following formula was used.
Production=Constant*GDP Elasticity
where GDP means Gross domestic product of the Republic of Kazakhstan,
Elasticity means elasticity of GVA in Metal production growth to GDP.
It is assumed that in the period of 2020-2030 real GDP growth will be 3% per year on
average. The elasticity of production in ferrous and nonferrous metallurgy of Kazakhstan is 0.15 and 0.13
respectively.
Greenhouse gas emissions in the subsectors Mineral Industry and Chemical Industry for the years
2020-2030 were estimated with a similar approach. For a short term period, forecast of the Ministry of
Economy for 2016-2020 and a preliminary assessment of the economy of Kazakhstan in 2015 were used.
Population growth projection is taken from the report of the Institute of Economic Research Demographic
projection of Kazakhstan till 2020.
Solvent use and non-energy products from fuels, fluorinated substitutes of ODS, use of HFCs and
PFCs were estimated using the average per capita indicators.
Table 5.5
Forecasted growth of indicators used
Indicator, in % to the
previous year
Fact Estimati
on
Forecast of the Ministry of Economy of
Kazakhstan
2014 2015 2016 2017 2018 2019 2020 After
2020
Real GDP 104,1 101,2 102,1 103,6 102,9 103,0 103,2 103,0
Population,
mln.people 17 417.7 17656.3 17891.2 18120.2 18341.2
18554.
0
19045.2
7
Population growth 101,5 101,37 101,33 101,28 101,22 101,16 101,10 101,0
GVA of economic industries
Production 100,8 98,5 100,4 103,3 101,8 102,0 104,0 102,0
Manufacturing 101,6 100,2 101,2 103,7 101,2 102,4 102,0 102,0
Chemical Industry 101,6 102,6 101,0 102,0 102,0 103,0 103,0 103
Non-metallic
minerals 107,9 104,8 101,0 101,5 102,0 102,5 103,0 102
Metal Industry 99,6 114,4 99,6 100,0 100,0 103,2 101,5 101
Construction 104,6 104,3 103,3 103,7 103,8 103,9 104,0 103,0
Resource: Forecast of the Ministry of Economy for 2016-2020 (http://economy.gov.kz)
Demographic projection of Kazakhstan until 2020 (akorda.kz)
Detailed analysis of the latest inventory of 1990-2013 (as of October 13, 2015) was conducted to re-
estimate GHG emissions in this sector. The difference of 6-9% was found in 2010 and 2011 in the production

52
of zinc, iron, glass and clinker. According to the 2006 IPCC Guidelines, GHG emissions from zinc production
do not take place in case of hydrometallurgical method application (however they were included into the
inventory), but during melting in the Waelz kiln non-energy CO2 emissions are formed. For the forecast of
GHG emissions, emissions from production of pellets in the ferrous metal industry were taken into account.
When calibrating the base period (2010-2013) for the prediction of emissions from clinker production, data
were taken from the Committee of Statistics of Kazakhstan. Emissions from glass production were forecasted.
Without measures scenario (WOM)
This scenario reflects possible changes in the amount of greenhouse gases when no measures are taken
to reduce them, modernization does not take place, national factor per unit of output is at the same level. This
scenario assumes that greenhouse gas emissions are dependent on the overall GDP growth rate, population and
transition towards less energy-intensive sectors of the economy. It is assumed that this scenario does not
include any measures and policies which have already been implemented in the country in recent years. It is
assumed that production of open-hearth steel continues; ferrosilicon production is not reduced; JSC Kazzinc
has not been upgraded.
With current measures (WСМ) scenario
This scenario differs from the scenario without measures as it includes measures and policies to
reduce greenhouse gas emissions that have been taken and are planned to be adopted in the near future. These
measures include the National Allocation Plan for 2016-2020, adoption of the Law ‘On energy saving and
energy efficiency’ (requirement to conduct the energy audit) and Law ‘On administrative violations’: a fine for
GHG emissions in excess of the defined amount, Concept of innovative development of Kazakhstan till 2020,
Modernization of JSC Mittal Steel Temirtau; lower production of ferrosilicon; modernization of JSC Kazzinc,
adoption of SPIID for 2015-2019.
With additional measures scenario (WAM)
This scenario takes into account current policies and measures with the assumption of possible
additional measures. It is expected that additional measures will be launched in 2016. The following additional
measures are considered: phased introduction of plants for capturing and storage of CO2 in production of
mineral materials, process optimization in the chemical industry, modernization and optimization of iron
production up to European standards.
Figure 5.9 shows actual GHG emissions in the sector Industrial processes and product use for 1990-
2014 and forecast until 2030 by sub-categories. As can be seen from the graph, the main influence on the GHG
growth is from the categories of Metal Industry and Minerals Industry. In 2014, the IPPU sector emissions
exceeded the level of the base year 1990 by 420 kt of CO2 equivalent.

53
Figure 5.9- Dynamics of GHG emissions in the IPPU sector in 2009-2030
Updated projections of greenhouse gas emissions under the scenario without measures (WOM)
and under the scenario with additional measures (WAM) are shown on Figure 5.10. During a projected
period, emissions under the scenario with current measures (WCM) are going to increase. With the
adoption of additional measures from 2016 there is an opportunity to remain lower than the baseline until
2028. Fig. 5.10 shows the dynamics of emissions inventories, and recalculated values are different in
2011 and 2012.
Figure 5.10- Scenario analysis: actual and projected emissions in IPPU category in 1990-2030
0
5
10
15
20
25
1990 1995 2000 2005 2010 2015 2020 2025 2030
Mt
ofСО2
eq
GHG emission trend in IPPU category, 1990-2030
Metal Industry Mineral Industry Chemical Industry
Substitutes for ODS Level of 1990
0
5
10
15
20
25
30
1990 1995 2000 2005 2010 2015 2020 2025 2030
Mt
of
СО
2eq
Projection of IPPU emissions in the IPPU category, 1990-2030
Level of 1990 WAM BAU WM NIR 2015

54
In the IPPU sector the biggest share of GHG emissions comes from Metal Industry (Figure 5.9).
Figure 5.11 - Comparison of the share of GHG emissions in the categories in 1990 and 2020.
As shown on Figure 5.11, the main contribution to total emissions was made by the Metal
Industry category. Adoption of timely measures significantly reduced GHG emissions from Metal
Industry and that helped to expand the construction industry. In 1990 no data were available on emissions
of fluorinated substitutes for ozone-depleting substances (ODS). Fig. 5.12 shows the dynamics of Metal
Industry in three scenarios. The graph shows that in the scenario without measures emissions exceed the
base year in 2009.
Figure 5.12 - Scenario analysis: the forecast of GHG emissions in the IPPU in Metal Industry
category
The calculations to assess the impacts of response measures (Table. 5.6) show that policies and
measures taken by Kazakhstan to reduce GHG emissions significantly reduced indicators in this category.
In the WAM scenario, overall GHG emissions do not reach the level of the base year 1990 neither in
2020 nor in 2030. Table 5.6 shows the projected emission values in industrial / commercial processes by
scenarios.
Table 5.6
Sector Manufacturing/Industrial processes by scenarios
0
2
4
6
8
10
12
14
16
18
1990 1995 2000 2005 2010 2015 2020 2025 2030
Mt
ofСО2
eq
Projection of GHG emissions in a subcategory Metal Production of IPPU, 1990-2030
Level of 1990 BAUWM WAMNIR 2015

55
Actual With current measures With additional
measures
Without measures
1990 1995 2000 2010 2020 2025 2030 2020 2025 2030 2020 2025 2030
Total 19.9 8.67 10.8 15.3
7 21.40 22.71 24.01 19,63 19,34 20,40 25.8
27.2
7 28.77
Non-metallic
minerals 6.01 2.10 1.99 3.58 7.86 8.49 9.15 7,15 6,94 7,45 8.13 8.78 9.47
Chemical Industry 2.40 0.45 0.06 0.41 0.70 0.78 0.79 0,66 0,74 0,75 0.72 0.81 0.82
Metal Industry 11.56 6.11 8.59 10.4
2 11.74 12.27 12.83 10,71 10,49 10,96
15.8
1
16.5
0 17.23
Use of substances
as substitutes of
ODS
0.17 0.96 1.10 1.18 1.25 1,10 1,17 1,24 1.10 1.18 1.25
5.1.3. Projections in the agricultural sector
Projection of greenhouse gases from the agriculture sector is based on large and small cattle
trend. Increased industry funding under the program Agribusiness-2020 led to an increase of livestock at
organized farms, but due to the drop in the stock of cattle in private households overall livestock
increment is insignificant. Therefore, projected emissions were based on headcount dynamics. On the
basis of livestock changes the trend was analyzed for 10 years from 2004 to 2013. Current funding of the
industry was also taken into account. It is expected that the number of key species of livestock will grow
as follows: cattle at + 1.3%, sheep and goats at + 3.5%, -3% swine, camels and poultry + 1%, horses +
6% per year.
Table 5.7.
Livestock projection
Annual average livestock,
thousand heads
2013 2014 201516 2020 2025 2030
Cattle 5 851,2 6 032,7 6 068,6 5 905 5 943 5 981
Dairy cattle 4 143,9 4 176,1 4 253,5 2 760 2 778 2 796
Other cattle 1 707,3 1 856,6 1 815,1 3 145 3 165 3 185
Sheep and goats 17 560,6 17 914,6 17 791,8 22 191 26 228 31 001
Camels 160,9 165,9 169,5 171 178.5 186
Horses 1 784,5 1 937,9 1 984,2 2 683 3 591 4 805
Swine 922,3 884,7 861,0 746 641 550
Poultry 34 173,1 35 020,0 36 635,3 36 893 38 967 41 158
The following are predictions of emissions from the various sub-sectors of agriculture.
Without measures scenario
In the scenario without measures, projections of emissions in the following three tables are based
on changes in the livestock.
16 Operational data for January-December 2015. Annual data for 2015 will be ready in April 2016.
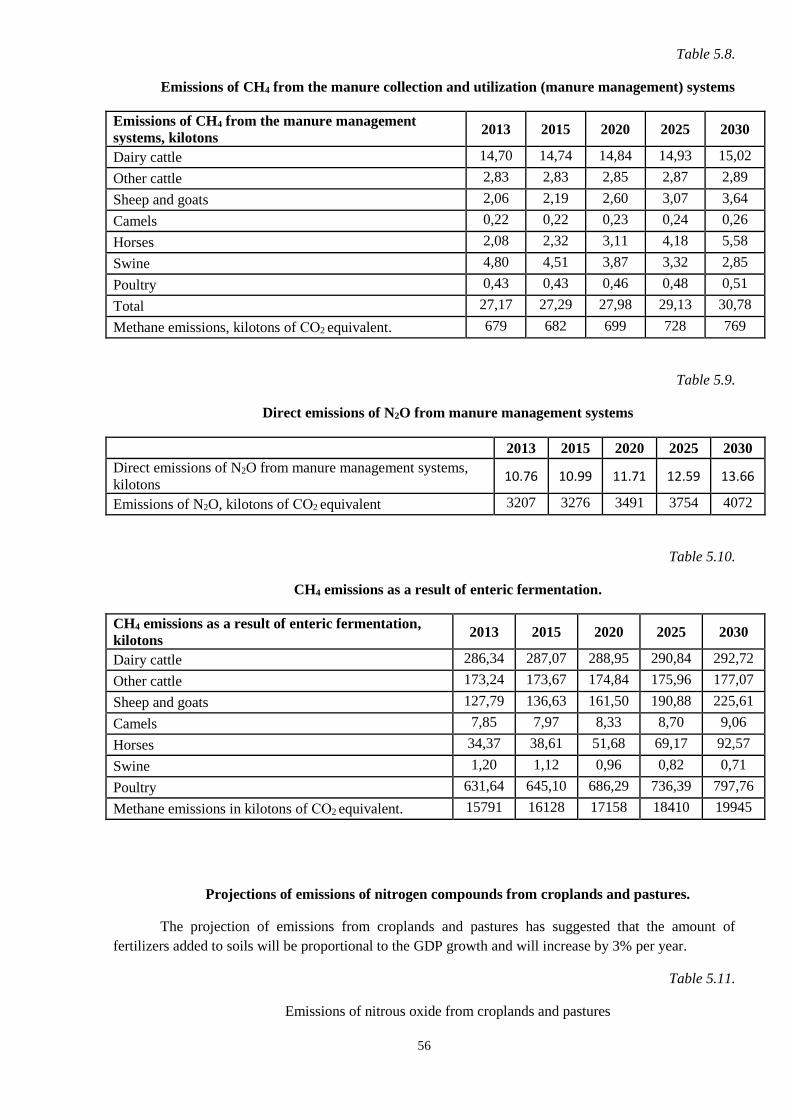
56
Table 5.8.
Emissions of CH4 from the manure collection and utilization (manure management) systems
Emissions of CH4 from the manure management
systems, kilotons 2013 2015 2020 2025 2030
Dairy cattle 14,70 14,74 14,84 14,93 15,02
Other cattle 2,83 2,83 2,85 2,87 2,89
Sheep and goats 2,06 2,19 2,60 3,07 3,64
Camels 0,22 0,22 0,23 0,24 0,26
Horses 2,08 2,32 3,11 4,18 5,58
Swine 4,80 4,51 3,87 3,32 2,85
Poultry 0,43 0,43 0,46 0,48 0,51
Total 27,17 27,29 27,98 29,13 30,78
Methane emissions, kilotons of СО2 equivalent. 679 682 699 728 769
Table 5.9.
Direct emissions of N2O from manure management systems
2013 2015 2020 2025 2030
Direct emissions of N2O from manure management systems,
kilotons 10.76 10.99 11.71 12.59 13.66
Emissions of N2O, kilotons of СО2 equivalent 3207 3276 3491 3754 4072
Table 5.10.
CH4 emissions as a result of enteric fermentation.
CH4 emissions as a result of enteric fermentation,
kilotons 2013 2015 2020 2025 2030
Dairy cattle 286,34 287,07 288,95 290,84 292,72
Other cattle 173,24 173,67 174,84 175,96 177,07
Sheep and goats 127,79 136,63 161,50 190,88 225,61
Camels 7,85 7,97 8,33 8,70 9,06
Horses 34,37 38,61 51,68 69,17 92,57
Swine 1,20 1,12 0,96 0,82 0,71
Poultry 631,64 645,10 686,29 736,39 797,76
Methane emissions in kilotons of СО2 equivalent. 15791 16128 17158 18410 19945
Projections of emissions of nitrogen compounds from croplands and pastures.
The projection of emissions from croplands and pastures has suggested that the amount of
fertilizers added to soils will be proportional to the GDP growth and will increase by 3% per year.
Table 5.11.
Emissions of nitrous oxide from croplands and pastures

57
2013 2015 2020 2025 2030
Direct N2O emissions from croplands and pastures,
kilotons 28.1 29.81 34.55 40.06 46.44
N2O emissions, kilotons of СО2 equivalent 8242 8743 10133 11749 13621
Table 5.12.
Methane emissions from rice cultivation
2013 2015 2020 2025 2030
Methane emissions from rice cultivation, kilotons 14.04 14.85 17.21 19.96 23.13
Methane emissions, kilotons of СО2 equivalent 351 372.37 431.68 500.44 580.15
Cumulative emissions from the agricultural sector are shown below.
Table 5.13.
Emissions from the agricultural sector
2013 2015 2020 2025 2030
Cumulative 𝐶𝑂2 emissions, kilotons 28 273,3 31 319,68 34 451,44 38 118,15 38 987
The following two scenarios with measures and with additional measures include the use of
biogas facilities. The use of biogas facilities in these scenarios leads to a reduction of CO2 emissions. In
these scenarios the effect of their use on reduction was estimated.
With current measures scenario
The scenario with measures suggests a growing number of biogas facilities at farms. In addition
to general reduction via reducing CH4 emissions, there is an assumption that emissions will go down as a
result of better use of fuel for heating and electricity generation. The assumptions made in the scenario
are presented below:
Suggestions in the WCM scenario17:
1) Coverage of livestock with biogas facilities reaches 1% in 2020, 3% in 2025 and 5% in
2030.
2) Amount of manure per 1 cow is 10 tons per year, one horse - 7 tons per year, sheep and
goats - 1 ton per year.
3) Production of gas per ton of manure is projected to reach 22 m3 per ton of manure.
4) The reduction of CO2 emissions from generation of heat and electricity, instead of coal, is
2 kg CO2 eq. / m3 of biogas.
5) Reduction of CH4 emissions is 26 kg of CO2 eq. / ton of CO2 eq, or 1.2kg / m3
6) Biogas facilities do not affect the level of N2O emissions
Table 5.14.
Emissions reduction via biogas facilities application
17Jørgensen, Peter Jacob. Biogas-Green Energy: Process, Design, Energy Supply, Environment. Researcher for a
Day, 2009.

58
2013 2015 2020 2025 2030
Cattle stock, thousand heads 5 851 5 866 5 905 5 943 5 981
Horses stock, thousand heads 1 784 2 005 2 683 3 591 4 805
Sheep and goats stock 17 560 18 774 22 191 26 228 31 001
Percentage of livestock covered by biogas
facilities 0% 0% 1% 3% 5%
Total manure utilized, million tons/year 0 0 0.998 3.323 6.222
Production of biogas in million 𝒎𝟑/year 0 0 21.97 73.106 136.884
Reduction of CO2 as a result optimal heat and
power generation (tons of CO2/year) 0 0 43940 146212 273768
CH4 emissions reduction in CO2 equivalent.
(tons of CO2/year) 0 0 26354 87727 164261
Reduction of N2O emissions in CO2 eq. (tons of
CO2/year) 0 0 0 0 0
Cumulative reduction of tons of CO2
equivalent/year 0 0 70294 233939 438029
The burning of methane reduces greenhouse gas emissions in CO2 equivalent. On the other hand
the use of gas for heating and electricity generation instead of coal also reduces overall emissions.
Assessment of CO2 emissions reduction as a result of reduced methane emissions as well as a result of the
optimal use of gas for heating and electricity was estimated18.
In this scenario total emissions in the agricultural sector will be a result of emission scenarios
without measures minus reduction of CH4 emissions in CO2 equivalent (Table 5.15). The effect of
reduced CO2 emissions as a result of the optimal generation of heat and electricity shall be deducted from
the fuel combustion sector (Table 5.15).
Table 5.15.
Total emissions in the scenario with current measures in the agriculture sector with biogas plants
included
2013 2015 2020 2025 2030
Cumulative emissions of 𝐶𝑂2, kilotons 28 273,3 31 319,68 34 425,1 38 030,42 38 822.8
With additional measures scenario
In the scenario with additional measures, it is assumed that the coverage of farms with biogas
plants will increase 3% by 2020, 5% by 2025 and 7% by 2030.
Table 5.16.
Emissions reduction via biogas plants application
2013 2015 2020 2025 2030
Cattle stock, thousand heads 5 851 5 866 5 905 5 943 5 981
Horses stock, thousand heads 1 784 2 005 2 683 3 591 4 805
Sheep and goats stock 17 560 18 774 22 191 26 228 31 001
18Jørgensen, Peter Jacob. Biogas-Green Energy: Process, Design, Energy Supply, Environment. Researcher for a
Day, 2009.

59
Percentage of livestock covered by biogas
installations 0% 0% 3% 5% 7%
Total manure utilized, million tons/year 0 0 3.006 5.537 8.710
Production of biogas in million 𝒎𝟑/year 0 0 66.132 121.814 191.62
Reduction of CO2 as a result optimal heat and
power generation (tons of CO2/year) 0 0 132264 243628 383240
CH4 emissions reduction in CO2 equivalent.
(tons of CO2/year) 0 0 79358 146760 229944
Reduction of N2O emissions in CO2 eq. (tons
of CO2/year) 0 0 0 0 0
Cumulative reduction of tons of CO2
equivalent/year 0 0 211622 390388 613184
In this scenario total emissions in the agricultural sector will be a result of emission scenarios
without measures minus reduction of CH4 emissions in CO2 equivalent (Table 5.16). The effect of
reduced CO2 emissions as a result of the optimal generation of heat and electricity shall be deducted from
the fuel combustion sector.
Table 5.17.
Total emissions in the scenario with additional measures in the agricultural sector with biogas
plants included
2013 2015 2020 2025 2030
Cumulative CO2 emissions in kilotons 28 273,3 31 319,68 34 372,05 37 971,34 38 751,1
5.1.4. Projections in the LULUCF sector
Emissions and removals of greenhouse gases in the forestry sector depend mainly on
anthropogenic activities. Since reclassification of forest plantations, according to IPCC principles, into the
forest lands is possible only 20 years after planting, the current pace of forests planting will not affect the
growth of forests in the next 20 years. Thus, the forest growth rate will be the same as over the past years.
This formed a basis of a projection method. A projection for this sector is based on changes in forest area
and growing stock in the last 15 years. In all three scenarios, forest growth is 0.8% per year and is based
on the growth of the forest stock. Important factors that affect the absorption of greenhouse gas will be
fires and logging that are affected by measures and policies.
According to the forecast of the government of the Republic of Kazakhstan in the agricultural
sector, real GDP growth in 2015-2020 will be about 3% per year. In this analysis it has been assumed that
GDP growth rate will remain unchanged after 2020, i.e. 3% per year. In WOM scenario expected area of
fires and logging will increase in proportion to the GDP, i.e. by 3% per year. In the scenario with current
measures, it is assumed that fire management will be more efficient as a result of better financing, while
at the same time logging will remain at the same level, despite the GDP growth. In the WAM scenario it
is assumed that sector funding will go up and that will entail reduction of fires, and a number and volume
of fellings will be reduced proportionally to GDP growth. The following table shows a dynamics of forest
change in Kazakhstan for the period of a little more than 15 years.
Table 5.18.
Forests dynamics in Kazakhstan
1998 2003 2008 2013
Timber stand (mln. m3) 373.6 376.7 375.8 380.7

60
Forest area (mln. ha) 14.232 14.326 14.320 14.573
Without measures scenario. Business as usual.
The WOM scenario assumes the increase of area under fire and reduction of afforestation and
reforestation.
Currently the annual felling is about 60 thousand ha and fires cover an area of about 10 thousand
ha19. 11.5 thousand ha of young plants were reclassified into the category of valuable forest of the state
stock in recent years. Reforestation was about 20 thousand ha + plantation of 8.8 thousand ha. Thus, the
forest is losing about 30 thousand ha per year.
Table 5.19.
Business as usual, no measures.
2013 2015 2020 2025 2030
Carbon growth in forests per year,
million tons
-2.984 -3.031 -3.155 -3.283 -3.41
Area under fires, thousand
hectares
10 11.5 13.225 15.208
Carbon losses caused by fires,
million tons
0.234 0.271 0.314 0.364
Carbon losses as a result of felling,
million tons
0.46 0.53 0.618 0.716
Carbon absorption/emission,
million tons -2.989 -2.337 -2.354 -2.351 -2.33
Cumulative absorption/emission in
million tons 𝐶𝑂2
-10.925 -8.553 -8.615 -8.604 -8.528
With current measures scenario
With current measures scenario suggests that the volume of felling remains at the 2013 level, in
spite of annual GDP growth, at the same time it is assumed that the area under fire will be reduced in
proportion to GDP growth.
Table 5.20.
With current measures scenario.
Dynamics for a year 2010 2015 2020 2025 2030
Carbon growth in forests per year,
million tons
-2.984 -3.031 -3.155 3.283 3.41
Area under fires, thousand hectares 10 8.69 7.56 6.57
Carbon losses caused by fires, million
tons
0.234 0.224 0.216 0.207
Carbon losses as a result of felling,
million tons
0.46 0.46 0.46 0.46
Carbon absorption/emission, million
tons
-2.989 -2.337 -2.471 -2.607 -2.743
Cumulative absorption/emission in -10.925 -8.553 -9.04 -9.542 -10.04
19 Statistical yearbook on environment of Kazakhstan, 2014
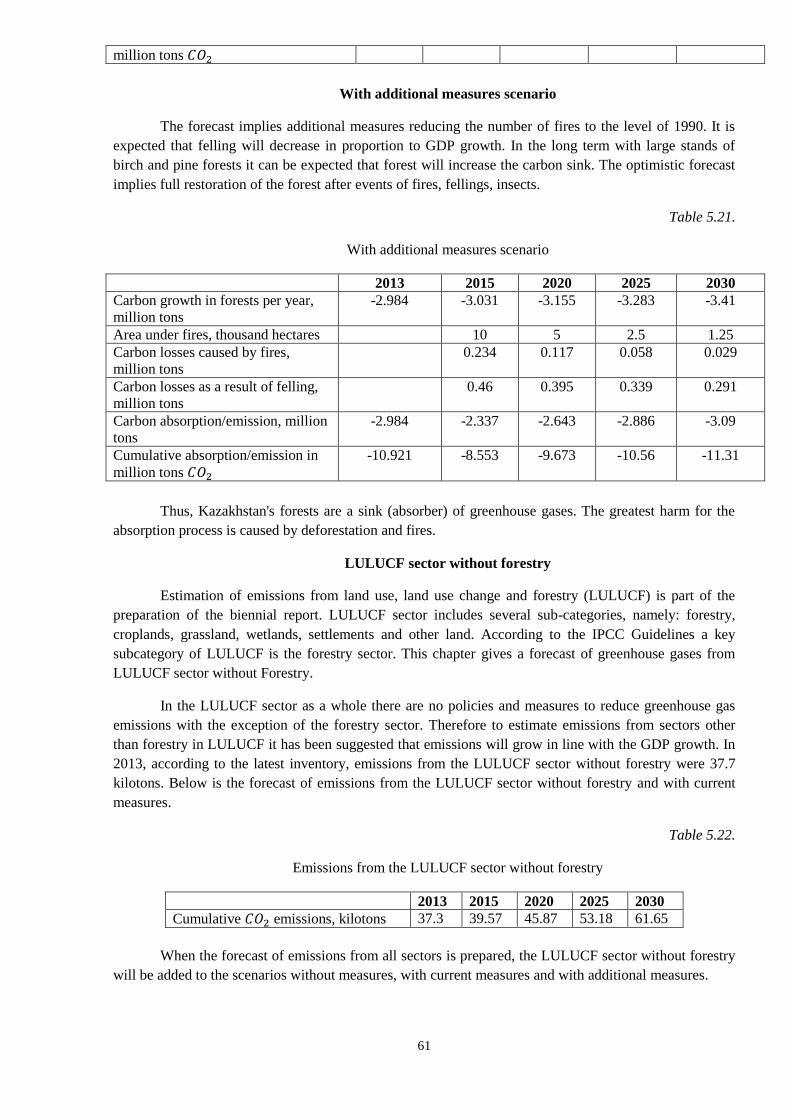
61
million tons 𝐶𝑂2
With additional measures scenario
The forecast implies additional measures reducing the number of fires to the level of 1990. It is
expected that felling will decrease in proportion to GDP growth. In the long term with large stands of
birch and pine forests it can be expected that forest will increase the carbon sink. The optimistic forecast
implies full restoration of the forest after events of fires, fellings, insects.
Table 5.21.
With additional measures scenario
2013 2015 2020 2025 2030
Carbon growth in forests per year,
million tons
-2.984 -3.031 -3.155 -3.283 -3.41
Area under fires, thousand hectares 10 5 2.5 1.25
Carbon losses caused by fires,
million tons
0.234 0.117 0.058 0.029
Carbon losses as a result of felling,
million tons
0.46 0.395 0.339 0.291
Carbon absorption/emission, million
tons
-2.984 -2.337 -2.643 -2.886 -3.09
Cumulative absorption/emission in
million tons 𝐶𝑂2
-10.921 -8.553 -9.673 -10.56 -11.31
Thus, Kazakhstan's forests are a sink (absorber) of greenhouse gases. The greatest harm for the
absorption process is caused by deforestation and fires.
LULUCF sector without forestry
Estimation of emissions from land use, land use change and forestry (LULUCF) is part of the
preparation of the biennial report. LULUCF sector includes several sub-categories, namely: forestry,
croplands, grassland, wetlands, settlements and other land. According to the IPCC Guidelines a key
subcategory of LULUCF is the forestry sector. This chapter gives a forecast of greenhouse gases from
LULUCF sector without Forestry.
In the LULUCF sector as a whole there are no policies and measures to reduce greenhouse gas
emissions with the exception of the forestry sector. Therefore to estimate emissions from sectors other
than forestry in LULUCF it has been suggested that emissions will grow in line with the GDP growth. In
2013, according to the latest inventory, emissions from the LULUCF sector without forestry were 37.7
kilotons. Below is the forecast of emissions from the LULUCF sector without forestry and with current
measures.
Table 5.22.
Emissions from the LULUCF sector without forestry
2013 2015 2020 2025 2030
Cumulative 𝐶𝑂2 emissions, kilotons 37.3 39.57 45.87 53.18 61.65
When the forecast of emissions from all sectors is prepared, the LULUCF sector without forestry
will be added to the scenarios without measures, with current measures and with additional measures.

62
5.1.5. Projections in the wastes sector
Table 6 of CTF as well as Figures 5.13 - 5.15 below shows the updated projections for 2020 and
2030 in the sector of waste management
Figure 5.13. Projection of methane emissions, disposal of municipal solid wastes, million tons of СО2-
eq.
Figure 5.14. Projection of methane emissions, wastewaters treatment, million tons of СО2
equivalent.
y = 0,0737x - 144,42R² = 0,9937
0
1
2
3
4
5
6
1995 2000 2005 2010 2015 2020 2025 2030 2035
y = 0,022x - 43,214R² = 0,9656
0
0,2
0,4
0,6
0,8
1
1,2
1,4
1,6
1,8
2005 2010 2015 2020 2025 2030 2035

63
Figure 5.15. Projection of N2O emissions from household wastewaters, million tons of СО2 eq.
5.2. Methodology
5.2.1. Methodology for the energy sector (fuel combustion)
Model TIMES-KZ, used in this study, analyzes a period from calibrated 2009 year until 2030.
The model is built around 1,600 products and processes. The annual amounts of electricity and heat are
distributed by seasons and time of day and have a total of nine time intervals. The technical and economic
model TIMES-KZ largely depends on a combination of plants, infrastructure, demand for devices that
exist in the country in the base year (2009) and on technological improvement that can possibly be
achieved in the simulated time horizon (2030). The curves of supply and demand of most commodities in
the model are technologically precise: instead of the usual econometric profile of quantitative pricing
functions depending on certain elasticity, there are linear stepwise functions where each step corresponds
to a specific technology or demand for the product. Since the model is only slightly dependent on the time
series of macroeconomic variables, the results are affected by the youth of Kazakhstan's economy much
less than in econometric models.
Model TIMES-KZ presents a demand for 33 different energy services. The demand was projected
until 2030, and it varies depending on the population size, GDP and GDP per capita as well as other
drivers of demand.
Simulation results depend largely on the existing and proposed data of the base year. Total
emissions associated with fuel combustion calculated for 2009 by applying national emission factors to
the new edited energy balance are slightly different from the total emissions listed in the national
inventory; at the sectoral level differences are more significant. Since the model TIMES-KZ is based on
the edited energy balance, in some cases the projections of the model start with values of 2009 that differ
from the national inventory. Amounts in the latest emission inventory (13 October 2015) are higher than
previously estimated emissions that have been published on the UNFCCC website.
In order to be in line with national inventories, emission projections of the model were moved up
or down so that the values at the beginning of 2009 matched. Given the limitations of the model TIMES-
KZ, results for the year 2015 are less accurate; therefore, the values in 2015 listed in the tables and graphs
are sometimes interpolated between the actual values in 2011 and the results of the model in 2020.
Energy balance used in the model was reclassified according to the IEA format and updated
according to the data provided by relevant agencies and ministries. This allowed to reallocate energy
resources from the category Other to other sectors. This is the reason why estimations of emissions are
different in sectors.
5.2.2 Methodology for the industrial processes sector
Mineral Industry
y = 0,0262x - 51,666R² = 0,9886
0
0,2
0,4
0,6
0,8
1
1,2
1,4
1,6
1,8
2000 2005 2010 2015 2020 2025 2030 2035

64
Carbon dioxide (СО2) in the Mineral Industry is formed by three types of sources: production of
cement, lime and glass. All these categories relate to the processes of calcination of carbonate materials.
According to the 2006 IPCC Guidelines for National Greenhouse Gas Inventories, other greenhouse gases
in these categories are not counted.
Cement production
In the cement production process СО2 is formed on the stage of clinker production - an
intermediate product used for cement manufacturing. According to the Committee of Statistics of the
Republic of Kazakhstan (CS of RK) clinker is produced in the East Kazakhstan, South Kazakhstan,
Zhambyl and Karaganda regions. Data on clinker are shown in the Table 5.23
Table 5.23
Data on clinker production
199020
2004 2005 2006 2007 2008 2009 2010 2011 2012 2013 2014
Clinker
production
(kilotons) in
Kazakhstan
6162 657.4 675 903.8 1134.3 1870.3 1772.4 1948.3 2026.4 4411.3 5759.1 6153.2
With the increase in construction to meet demand and diversification of the economy within
SPAIID in late 2014 new industries were launched - JSC Hantausky cement factory (ACIG) in Zhambyl
region (capacity of 360 kilotons/year of clinker and 500 kilotons/year of Portland cement), Caspian
Cement JSC in Mangistau region (capacity of 1 mln. tons/year), KoksheTsement LLP (to be
commissioned in 2016), BI-Cement (will be put in operation in 2017) in Akmola oblast (capacity of 2
million tons/year.), Rudny cement factory Ltd (capacity of 200 kilotons/year). In 2014 cement production
was modernized with the transition to a ‘dry process’ at Shymkent Cement JSC (South Kazakhstan
region) and restoration of the line ‘dry process’ of cement production at Karcement JSC (Karaganda
region). Switching to a dry process will reduce GHG emissions in terms of fuel economy. In Zhambyl
region ACIG LLP (2014), Plant of building materials Zhanatas Ltd which produces cement (50 kilotons a
year) and lime (up to 30 tons) is planning construction of a cement plant by 2017.
To assess the amount of clinker, historical dynamics of the total clinker output from 2004 and
forecasted growth of non-metallic mineral products (Table 5.23) were used. Numerical series
dependencies have been identified for clinker production projection until 2030 under the following
assumptions on GDP growth: average growth of three percent in the period from 2021 to 2030 inclusive.
Table 5.24 presents the results of clinker production projections until 2030. To forecast emissions of
carbon dioxide from clinker production, a single weighting factor of CO2 emission for clinker produced
was calculated, equal to 0.51 * 1.02 (calculated in accordance with the Tier 2 of 2006 IPCC Guidelines
for National Greenhouse Gas Inventories).
Table 5.24
Forecast of clinker production and associated emissions of СО2
199021 201522 2020 2025 2030
Clinker production, kilotons 6162 6650,1 6997 10653 12958
CO2 emissions, kilotons 3271.02 3296.9 3639.6 5541.5 6740.9
Lime production (CRF subcategory 2.А.2)
20 1) State Committee on Statistics and Analysis of the Republic of Kazakhstan "Regional Statistical Yearbook of
Kazakhstan", Kazinformcentre, Alma-Ata, 1991., 1992., 1993. ....
2) The Agency of the Republic of Kazakhstan on Statistics "Regional Statistical Yearbook of Kazakhstan", Almaty,
1999.
3) The Agency of the Republic of Kazakhstan on Statistics "Industry of Kazakhstan and its regions", Almaty, 2007. 21 Please see 20 22 Operational data for January-December 2015. Annual data for 2015 will be prepared in April 2016.

65
Calcium oxide or quicklime is made by heating limestone with high calcium content (calcite).
The process is accompanied by the release of CO2. According to the Committee of Statistics of the RK
lime is produced in eleven regions and in Almaty. The table below shows the dynamics of lime
production in the country and the forecast. To forecast carbon dioxide emissions from lime production a
single weighting factor of CO2 was estimated as 0.75 (Table 5.25, calculated in accordance with the Tier 2
of 2006 IPCC Guidelines for National Greenhouse Gas Inventories).
Table 5.25
Lime production amounts, projected and associated CO2 emissions
1990 2005 2010 2011 2012 2013 2014 201523 2020 2025 2030
Lime production,
kilotons. 1943 993.5 886.6 959.8 908 869.2 923.3 854,1 1017.6 1092.1 1166.6
CO2 emissions,
kilotons 1413 745.1 665.0 719.9 681.1 651.9 692.5 702.9 763.2 819.1 875.0
Kazakhstan imports 100% of flat glass. SAF Glass Company, a plant for glass containers
production, was founded in April 1999. The overall output of two branches is 210 million of conventional
bottles per year (1 bottle = 0.4 kg of glass). In 2017 the project will be completed in Kyzylorda region for
the construction of a glass factory with energy-saving coating, to create a vertically integrated high-tech
production of energy-efficient glass products with a capacity of 98 kilotons per year (OrdaGlass Ltd,
launching in 2017, planned capacity from 2024 is 197.1 kilotons per year). There is a plan to build a plant
for production of glass in Aktobe region near the Alazharskoe field. Glass company SAF LLP projected a
decline in demand for glass containers. Table 5.26 presents the projected glass production until 2030. To
forecast carbon dioxide emissions from glass production a single weighting factor of CO2 was estimated as
0.2 (in accordance with the Tier 1 of 2006 IPCC Guidelines for National Greenhouse Gas Inventories).
Table 5.26
Glass production amounts, projected and associated CO2 emissions
2005 2010 2015 2020 2025 2030
Glass production,
kilotons 33.0 48.0 61.7 154.3 160.4 242.7
CO2 emissions, kilotons 6.6 9.6 12.3 30.9 32.1 48.5
In the inventory of greenhouse gas emissions glass production was not considered because of
high uncertainty and low amounts of emissions.
For other carbonates-related processes statistics is not provided.
Other types of mineral products are described in the respective production category.
Possible additional measures to reduce emissions from production of mineral products
Installation and use of technologies to capture and store CO2 (capturing and storage of carbon
dioxide from gas streams released into the atmosphere and its transfer into geological depository, such as
gas and oil fields and deep horizons of salt water for indefinite storage) is an expensive measure,
collection efficiency varies between 60-90% depending on technology.
CHEMICAL INDUSTRY
Chemical industry of Kazakhstan is represented by two main productions: ammonia at the plant
KazAzot and calcium carbide at the enterprise Temirtau Electro Metallurgical Plant. Ammonia
production is characterized primarily by the low price of natural gas. Production of calcium carbide is
characterized by a low cost of coal and coke. Greenhouse gas (GHG) emissions in the chemical industry
of Kazakhstan come from production of ammonia and calcium carbide.
23 Operational data for January-December 2015. Annual data for 2015 will be prepared in April 2016.

66
Ammonia production (CRF category 2.B.1)
The only producer of ammonia and ammonium nitrate in Kazakhstan is KazAzot
(http://kazazot.kz). The company was created in November 2005 on the basis of the nitrogen fertilizer
plant and a chemical complex Prikaspijsky Mining and Metallurgical Plant. KazAzot LLP in 2014 had
production of liquid ammonia at a level of 169.1 kilotons, which is 45% more than in the previous year.
Modernization costs were 5.6 billion tenge for installations of KazAzot in 2013 in the framework of the
state program of accelerated industrial and innovative development for the production of ammonia, nitric
acid and ammonium nitrate to increase production capacity by 50%. Gas is delivered from the Kazakh gas
processing plant.
KazAzot is a producer in the following industries:
• Production of ammonia
• Production of weak 46% nitric acid
• Production of ammonium nitrate
Processes that affect CO2 emissions from ammonia production: CO conversion at two
temperatures in the presence of a catalyst of iron oxide, copper oxide and / or chromium oxide to form
CO2; conversion of residual CO2 to methane in the presence of nickel catalysts to purify the synthesis gas.
The company has not installed CO2 capturing technology. Ammonia production is a major source of non-
energy industrial emissions of CO2. The major amount of CO2 emissions takes place at plants using
catalytic steam reforming of natural gas that occurs during the CO2 regeneration from the scrubber’s wash
liquid. To forecast carbon dioxide emissions from ammonia production a single weighting factor of CO2
was estimated as 3.273 (Table 5.27, in accordance with the Tier 1 of 2006 IPCC Guidelines for National
Greenhouse Gas Inventories).
Table 5.27
GHG emissions from ammonia production in the periods 1990, 2010-2015 and forecast until
2030 (Source: Zhasyl Damu JSC and CS RK http://stat.gov.kz)
1990 2010 2011 2012 2013 2014 201524 2020 2025 2030
2.В.1.Ammonia
production, kilotons
455.9 91.9 128.1 101.5 116.1 169.1 170,8 190,4 250.0 250.0
СО2 emissions in
tons
1492,16 137.89 192.2 332.2 380.0 553.5 559,0 623,2 818.3 818.3
It is expected that the chemical industry growth would be 3% per year. But it will reach the limit
of capacity of 250 kilotons / year by 2025
Production of calcium carbide (category 2.В.5)
Greenhouse gases are emitted in the course of calcium carbide production. Calcium carbide is
formed by reduction of burnt lime (CaO) and carbon (anthracite, coke) in a special carbide electric arc
furnace at a temperature of 2000-2300ºC endothermic reaction. In the production of CaC2 СО2 is emitted
from limestone and during recovery of lime and use of carbide. Technical calcium carbide is widely used
in engineering, mainly for industrial production of acetylene and its products. It is used to recover metals,
reduce content of oxygen (deoxidizing) and sulfur (desulfurization) of steel for the manufacture of a
carbide powder reagent. Silicon carbide SiC is produced from quartz sand or quartz and coke. In the the
course of SiC production СО2 is emitted.
Calcium carbide is produced by JSC Temirtau Electrometallurgical Plant. The total change in the
production of calcium carbide, projected production and emissions are shown in Table 5.28. Source -
KazNIIEK, estimation was done in accordance with TIER 1, 2006 IPCC
Table 5.28
GHG emissions from calcium carbide production (kilotons) 1990, 2010-2015, projection
1990 2010 2011 2012 2013 2014 201525 2020 2025 2030
24 Оперативные данные за январь-декабрь 2015 года. Годовые данные за 2015 год будут сформированы в
апреле 2016 года.

67
2.В.5 Calcium carbide
production (kilotons) 306,72 31,18 27,57 25,86 18,33 22,43 26,67 25,25 29,27 33,93
СО2 emissions from
calcium carbide
production (kilotons)
k=2.62
803,6 93,5 72,2 67,8 48,0 58,8 59,3 66,2 76,7 88,9
Calcium carbide produced in Kazakhstan is fully consumed for the manufacturer's own needs.
This is due to the fact that calcium carbide is fully consumed in the Metal Industry. According to
forecasts, the Metal Industry will develop at low rates, annual growth of less than 2% until 2020, to 1%
after 2020. As can be seen from Table 5.28 in 2014 GHG emissions from production of calcium carbide
decreased with respect to 1990, more than 15 times. According to estimates, in 2030 production of CaC2
will reach 34 kilotons per year.
GHG emissions from carbide production were estimated using default factors, taking into account
specific consumption of limestone for production of 1 ton of calcium carbide, CO2 emission factors at
limestone application and reducing agent for calcium carbide production and use. According to estimates
made by JSC Zhasyl Damu, one ton of calcium carbide produced and consumed emits 2.62 ton of CO2
equivalent.
Other types of emissions from chemical industry
In Kazakhstan there is no domestic production of soda ash, therefore CO2 emissions from
application of imported soda ash (sodium carbonate Na2CO3) were counted only in relevant industries of
nonferrous metals production.
In Kazakhstan there are no industrial processes and hence no GHG emissions from the process of
production of petrochemicals and carbon black, i.e. methanol, ethylene and propylene, ethylene
dichloride, ethylene oxide, acrylonitrile and carbon black; from fluorinated compounds, i.e. HFC-23
emerging in HCFC-22 production, fugitive products and by-products when generating other fluorinated
compounds including hydrofluorocarbons (HFCs), sulfur hexafluoride (SF6) and uranium hexafluoride
(UF6).
This section gives estimates of PFCs, HFCs and SF6 emissions from application of these
substances in the refrigeration and air conditioning equipment, fabrication of foams and others. In
Kazakhstan there is no production of HFCs, PFCs and SF6, these substances used in the Republic are
imported. The contribution of hydrofluorocarbons (HFCs) and perfluorocarbons (PFCs) to cumulative
GHG emissions is negligible: 0.30% and 0.48% respectively. Emissions of sulfur hexafluoride (SF6) do
not take place.
The coke industry provides valuable raw materials to ferrous and nonferrous metallurgy and
chemical industries. Most of the coke produced in Kazakhstan is metallurgical coke for production of iron
or special ferroalloy coke. Pitch coke is imported and used for production of the graphite electrodes anode
mass, various carbon materials for construction. As recommended by 2006 IPCC Guidelines for National
Greenhouse Gas Inventories most of the coke is to be included into the power section. However due to the
fact that coke is used in the metallurgical industry, emissions are recorded in a relevant process.
Possible additional measures in the chemical industry
Additional measures that can be applied to ammonia production may be application of low-
grade heat industrial furnaces, new energy-efficient catalysts, calciners with lesser power consumption,
energy-efficient synthesis columns.
Currently the demand for natural gas per ton of ammonia produced is one thousand cubic meters
which is approximately 31.8 GJ / ton of ammonia. This leads to emissions of 1.78 tons of CO2 equivalent
per ton of ammonia. When applying maximum energy saving measures and reducing gas consumption to
the level of European standards this amount may be reduced to 30.2 GJ / ton of ammonia. With these
measures the best value of greenhouse gas emissions could reach 1,695 tons of CO2 equivalent per ton of
ammonia. Thus there will be a potential to reduce emissions by 4.8%.
25 Оперативные данные за январь-декабрь 2015 года. Годовые данные за 2015 год будут сформированы в
апреле 2016 года.

68
Additional measures that can be applied to calcium carbide production: boiler system for direct
gas combustion in closed industrial furnaces, boiler system for heat recovery from exhaust gases of semi
closed furnaces and technology that uses furnace gases for lime burning. Estimates of this report show
that for one ton of calcium carbide there are 2.62 tons of CO2 equivalent. However in accordance with the
IPCC Guidelines for National Greenhouse Gas Inventories the factor for calcium carbide production is
equal to 1,090 tons of CO2 / ton of calcium carbide produced, and for consumption of calcium carbide -
1,100 tons of CO2 / ton of calcium carbide consumed. With effective compilation of production statistics
and energy efficiency there is potential to reduce GHG emissions by 9% in this activity.
General description of measures to reduce greenhouse gas emissions:
• implementation of common energy saving measures (cost optimization, compliance with
technical standards and regulations, implementation of modern instrumentation and control);
• introduction of new energy-saving technologies, powerful industrial and power equipment for
production of calcium carbide and synthetic ammonia;
• modernization and improvement of existing technologies, facilities and equipment for
production of calcium carbide and synthetic ammonia;
• improvement of product quality and reduction of raw materials losses.
METAL INDUSTRY
GHG emissions in the ferrous industry: production of iron, steel, coke, ferroalloy
(ferrochromium, ferrosilicon, ferrosilicochrome and ferrosilicon manganese); non-ferrous metallurgy:
production of aluminum, lead and zinc.
The comprehensive plan for development of the mining and metallurgical industry for 2014-2018
(May 28, 2014) suggests construction of new facilities which according to the law on subsoil and subsoil
use (from June 24, 2010) have to use best technologies for deep and clean recycling, innovative extraction
technology and complex processing of raw materials, development of new products and active
involvement of scientific and technical potential of the industry in innovative processes, reducing harmful
effects on the environment. There are plans: to launch in 2017 production of nickel products under
Vanyukov melting technology (melting in a liquid bath) with a production capacity of 1.9 million tons /
year, in 2015 - construction of the Zhezkazgan plant for hydrometallurgical processing of flotation
tailings of mixed ores and preparation of oxidized ores, construction of Karaganda copper concentrate
flotation plant with a capacity of 16 million tons / year, construction of a modern complex for production
of high-quality gravity barite concentrate with a capacity of 30 kilotons / year in Zhambyl region in 2016,
processing of iron ore to produce iron under innovative technology in Almaty region with a capacity of 3
million tons / year.
Particular attention is paid to development of improved technology for leaching of gold, nickel,
copper-zinc ores, processing of collective concentrates, alumosilicamagnanese, processing technogenic
deposits and others. Deep processing, application of advanced clean technologies in the industry helps
Kazakh market to reduce impact on the environment. According to the plan for development of rare
metals in the Republic of Kazakhstan for 2015-2019 (November 26, 2014) there will be production of
light rare metal (lithium), refractory rare metals (titanium, zirconium, vanadium, niobium, tantalum,
molybdenum and wolfram) scattered rare metals (gallium, indium, thallium, germanium, selenium,
tellurium, rhenium), rare earth metal (scandium, yttrium and the lanthanides). It should be noted that there
is no production of magnesium in RK which is a potential source of GHG.
Iron and steel production (CRF subcategory 2.С.1)
In Kazakhstan iron and steel are produced in the steelworks of ArcelorMittal in Temirtau. Basic
data on production capacities operating at the moment:
• 6 coke ovens with a total capacity to 3.5 mln. tons per year;
• 3 sintering machines with a capacity of up to 6.5 mln. tons per year with a direct feed to blast
furnaces;
• 4 blast furnaces with a capacity of up to 5.00 mln. tons of iron per year;
• 3 converters with a capacity of up to 6 million. tons per year;
• hot rolled strips plant (mill 1700) with a capacity to 5.2 million. tons per year;
• cold rolled strips plant (mill 1400) with a capacity up to 0.8 million. tons per year;

69
• workshop for electrolytic tinning (three coating lines) with a capacity up to 375 kilotons per
year; two lines for covering stripes with aluzinc and profiling with a capacity of 320 kilotons per year
each.
Iron and steel industry is key to Kazakhstan. The formula to estimate CO2 emissions was used
from the Tier 2 (IPCC Guidelines for National Greenhouse Gas Inventories) for the iron and steel
industry.
Data on carbon content in raw materials are taken from the enterprises: production of iron and
steel and amount of reducing agent used in production of a specific metal and carbon content in the iron
and steel industry. Enterprise data were presented on production of coke, its characteristics and amount
that was used directly in the manufacturing process. Total production of iron and steel and GHG
emissions are presented in Table 5.29.
Data on production of electric steel, direct-reduced iron (0.7 tons of CO2 per ton of direct-reduced
iron), iron ore pellets (CO2 emission factor= 0.03) were received from metallurgical enterprises of
Kazakhstan. Methane emission factor for sinter production is 0.07 kg / ton of sinter (2006 IPCC
Guidelines for National Greenhouse Gas Inventories). Methane emission factor for iron production is
accepted as equal to 0.5 kg per ton of iron.
Data on production of steel and iron were compared with those of the Committee on Statistics of
the Republic of Kazakhstan. Production of iron is associated with reduction of iron ore, mainly in blast
furnaces. Coal coke is used as a reducing agent and fuel for iron production in Kazakhstan, and it is
produced directly at the enterprise producing iron, steel and other metal products.
Table 5.29
GHG emissions from iron and steel production
1990 2010 2011 2012 2013 2014 201526 2020 2030
Iron and steel production,
kilotons 11978,4 7222,34 7935,16 6465,2 6124.1 7185.6 7139,93 7489.0 8272.5
СО2 emissions from iron and
steel production, kilotons 11348.7 5877.5 6627.9 6086.6 5522.8 6721.9 6721.9 7005.7 7738.6
СН4 emissions from iron and
steel production, kilotons 7,39 3,30 4,22 3,70 3,37 4,05 4,05 4,22 4,66
Steel production, kilotons 6752,0 4328,46 4794,08 3758,19 3489,67 4000,78 3905,56 4169,71 4605,95
Emissions from steel
production (national factor =
1,46) 946,00 464,85 588,94 601.3 558.3 640.1 640.1 667.2 737.0
Iron production, kilotons 5226,40 2893.88 3141.08 2707.01 2 634.5 3 184.8 3234.37 3319.26 3666.52
СО2 emissions from iron
production, kilotons (national
factor =.1,858) 7745,29 5412.6 5960.89 5411.73 4895.22 6019.2 6019.2 6273.4 6929.7
Preparation of iron ore
pellets, kilotons (k=0,01) 13681.31 9500,96 7 803.2 7 360.4 6 919.7 6 250.5 6250.50 6514.43 7195.98
Emissions from preparation
of sinter and pellets, kilotons 2 523.1 1752,18 78.0 73.6 69.2 62.5 62.5 65.1 72.0
26 Оперативные данные

70
of СО2
СН4 emissions from
preparation of pellets,
kilotons (0,7 kg of СО2/ton
of pellets)
7,39 3,30 4,22 3,70 3,37 4,05 4,05 4,22 4,66
Iron production
To estimate СО2 emissions from iron production, the following formula is used:
(6.1)
Where: = emissions of CO2, in kilo
Where – СО2 emission factor for coal coke, ton of СО2/ton of coke;
– amount of coke used for iron production, kilotons;
– carbon content in conversion iron, %;
– amount of iron produced, kilotons
СО2 emission factor when coke is used is estimated with the formula 3.1.2:
, (6.2)
Where – share of carbon in coke that goes to coke production, %.
The amount of iron and steel produced as well a percentage of carbon in the coke arriving to the
iron production process is taken from data provided by Mittal Steel Temirtau JSC. Data on carbon
balance in production of iron and steel are shown in Table 5.30.
In accordance with the Decision 24 / SR.19 Revised UNFCCC guidelines for the reporting of
annual inventories of Parties included in Annex I to the Convention there is a new conversion factor of
methane emissions into CO2 equivalent equal to 25 (instead of 21).
Table 5.30
Carbon balance in iron production in ArcelorMittalTemirtau JSC (2013)
Inflow Outflow
Material С, % kg/t % Material С, % kg/t %
Coke 83,0 570,2 95,53 Cast iron 4,10 41,0 6,8
Fuel oil 87,0 26,7 4,47 Flue dust 20,4 1,50 0,3
Total 596,9 100,0 Gas 554,40 92,9
Total 596,9 100,0
The value of the national CO2 emission factor is 3.04 t CO2 / ton of coke. Carbon content in iron is taken
from data provided by JSC Mittal Steel Temirtau (4.1-4.5%).
12
44
10022 C
÷kCOCO
MMMkM
2COM
2COk
kM
CM
÷M
12
44
1002
c
co
dk
cd

71
Figure 6.1 - Ferrous metals production flow at JSC ArcelorMittal Temirtau.
Steel production
In Kazakhstan basic oxygen steel and steel are produced from scrap in the EAF. The amount of carbon
dioxide emitted during combustion of electrodes in electric arc furnaces was taken as a default value of 5 kg
CO2 per ton of steel. CO2 emissions in the production of steel is determined by the formula 3.1.3, taking into
account the specific consumption of iron and carbon content of each type of steel, the Tier 2 method.
(6.3)
Where:
– annual СО2 emission from steel production (t);
– emission factor for electrical steel (tons of СО2/ton of electrical steel);
– steel mass produced in EAF (t);
– carbon mass in iron (t);
– carbon mass in steel (t);
– mass of basic oxygen steel (t); BOS
44/12 – carbon to carbon dioxide conversion factor (molecular weight is 44 g/mol, СО2 – 12
g/mol), or 44/12 = 3,667.
Carbon balance in steel production at ArcelorMittalTemirtau in 2013 is presented in Table 5.31.
Table 5.31
Carbon balance in steel production at ArcelorMittalTemirtau in 2013
Inflow Outflow
Material С, % kg/t % Material С, % kg/t %
Iron 4,1 35,6 90,1 Steel 0,04 0,4 1,0
Scrap 0,4 1,1 2,9
Carbon in
gas 39,1 99,0
Coke 83,0 1,6 4,0 Total 39,5 100,0
кксcчЭДПЭДПCO MMMMkM 12
442
2COM
ЭДПk
ЭДПM
чM
cM
кксM
кксM

72
Lime 12,0 0,4 1,0
Dolomite 13,0 0,8 2,0
Total 39,5 100,0
Thus the national СО2 emission factor for steel is estimated at a level 0,149 t СО2/t of steel.
Ferroalloys Production (CRF category 2.C.2)
Main producers of ferroalloys in Kazakhstan are transnational company KazChrome which
includes manufacturers Aktobe Ferroalloys Plant and Aksu Ferroalloys Plant, core products of the
enterprise are ferrochrome, ferrosilicon (45%), ferrosilicochrome and ferrosilicon manganese.
Ferroalloy production is key to Kazakhstan, the formula was applied to estimate carbon dioxide emissions
under Tier 2 (2006 IPCC Guidelines for National Greenhouse Gas Inventories) for production of
ferroalloys. The factors for estimation of carbon dioxide emissions are determined on the basis of data on
consumption of raw materials at Aksu Ferroalloy Plant. The data of CS of Kazakhstan on produced
ferroalloy products were used.
The formula to estimate greenhouse gas emissions:
𝐸𝐶𝑂2,𝑓𝑒𝑟𝑟𝑜𝑎𝑙𝑙𝑜𝑦𝑠 = ∑ М𝑟𝑒𝑑𝑢𝑐𝑖𝑛𝑔 𝑎𝑔𝑒𝑛𝑡 ∗ 𝐸𝐹𝑟𝑒𝑑𝑢𝑐𝑖𝑛𝑔 𝑎𝑔𝑒𝑛𝑡 + [∑ М𝑜𝑟𝑒 ∗ 𝐶𝑜𝑟𝑒 − ∑ М𝑝𝑟𝑜𝑑𝑢𝑐𝑡 ∗ 𝐶𝑝𝑟𝑜𝑑𝑢𝑐𝑡] ∗44
12
(6.4)
𝐸𝐶𝐻4,𝑓𝑒𝑟𝑟𝑜𝑎𝑙𝑙𝑜𝑦𝑠 = ∑ 𝑀𝑃𝑖 ∗ 𝐸𝐹𝑖𝑖 (6.5)
where:
ECO2, ferroalloys = СО2 emissions from ferroalloy production, tons
ECH4, ferroalloys = emissions from silicon alloy i, tons
Мreducing agent = total mass of reducing agents, tons
EFreducing agent = emission factor for reducing agents, tons of СО2 /ton of a reducing agent
Мore = total ore mass, tons
Сore = carbon content in ore, ton of С/ton of ore
Мproduct = mass of product, tons
Сproduct = carbon content in the product, ton of С/ton of product
MPi = production of silicon alloy i, tons
EFi = emission factor for silicon alloy i, ton of СН4/ton of silicon alloy products.
Emissions from ferroalloys were estimated under the formula provided in the 2006 IPCC
Guidelines for National Greenhouse Gas Inventories separately for each type of ferroalloys, and in
accordance with the data of Statistics Committee based on default emission factors. СО2 emission factors
have undergone some changes in comparison with 2012 and amounted to the following values: 1.5 tons of
the / ton of ferromanganese; 2.5 ton of СО2 / ton of 45% ferrosilicon; 1.3 tons of СО2 / ton of
ferrochrome; 1.4 tons of СО2 / ton of silicomanganese, etc., IPCC Guidelines, 2006 (Table. 4.5 p. 4.3.2.2
t.3). СО2 emission factor per ton of ferroalloys prepared as total СО2 emissions from each subcategory of
ferroalloys divided by the total production of ferroalloys, Table 5.32.
According to SPAIID starting from 2015 the Aktobe plant for ferrochrome production will
operate at 30% of design capacity. The forecast reflects growing production of ferrochrome and
ferrosilicon manganese according to SPAIID. It is projected that by 2025 the plant will operate to its full
design capacity.
Table 5.32
Total production and GHG emissions from ferroalloys.
2008 2009 2010 2011 2012 2013 2014 2020 2030
2.С.2
ferroalloys, tons 1590.52 1468.79 1701.79 1668.69 1724.07 1706.93 1715.14 2010.93 2220.91
Ferrochrome,
tons 1220.32 1173.29 1311.30 1289.92 1305.34 1336.63 1351.80 1634.55 1805.56
Emission factor
1,6 t СО2/t 1952.50 1877.26 2098.08 2063.87 2088.55 2138.61 2163.03 2615.28 2888.90
Ferrosilicon
45%, tons 54.96 33.10 4.81 1.68 0.49 0.47 0.40 0.34 0.23

73
Default
emission factor
2,5 t. СО2/t
137.41 82.75 12.03 4.21 1.24 1.18 1.12 0.86 0.57
Ferrosilicon
manganese, tons 179.94 200.37 224.63 232.04 251.53 203.99 200.38 209.28 231.18
Default
emission factor
1,4 t СО2/t.
251.91 280.52 314.48 324.85 352.14 285.58 281.12 292.99 323.65
Ferrochrome
silicon, tons 133.83 60.83 159.77 143.30 164.85 165.20 158.83 165.53 182.85
Default
emission factor
1,3 t СО2/t.
173.98 79.08 207.69 186.28 214.31 214.75 206.47 215.19 237.70
Other
ferroalloys, tons 1.47 1.21 1.28 1.75 1.85 0,081 3,74 1.22 1.10
Default
emission factor
1,6 t СО2/t
2.36 1.93 2.05 2.81 2.95 1.03 1.13 1.96 1.76
Total emissions
of СО2, kilotons 2518.2 2321.5 2634.3 2582.0 2659.2 2641.2 2652.9 3126.3 3452.6
Aluminum production
Production of primary aluminum (CRF category 2С.3)
The only aluminum producer in Kazakhstan is Kazakhstan Electrolysis Plant JSC with capacity of 250
kilotons a year. The plant uses central pre-sintering technology. In this technology preroasted anodes electrolyzers
are used. Aluminum production is key to Kazakhstan. To estimate carbon dioxide emissions the formula was used
from Tier 2 (2006 IPCC Guideline for National Greenhouse Gas Inventories) for aluminum production.
At Kazakh plants primary aluminum is produced by electrolysis decomposition of alumina from cryolite-
alumina expansion by Hall–Héroult process. In the aluminum industry, electrolytic cells of various designs and
capacity are used. One of the most advanced technologies for primary aluminum production, based on achievements
of the world's leading companies and the practical experience of the last few years, is the technology of electrolytic
decomposition of alumina in cryolite-alumina melt in electrolytic cells with prebaked anodes, central loading and
point-fed alumina. The most significant emissions are carbon dioxide (СО2) from reaction of the carbon anodes
with aluminum oxide to form aluminum metal; and perfluorocarbons (PFCs) - CF4 and C2F6 emissions as a result
of anode effects CF4 and C2F6. In smaller quantities there are emissions of CO, SO2 and NMVOC from industrial
processes. Kazakhstan Electrolysis Plant was put into operation in early 2008. Table 5.36 lists the changes in GHG
emissions from aluminum production in key years.
Table 5.36
GHG emissions from aluminum production in key years
2009 2010 2011 2012 2013 2014 2020 2030
2.С.3 Aluminum
production, kilotons 127.14 227.31 249.158 250.269 250.16 207.85 250.0 250.0
СО2 emissions from
aluminum production,
kilotons (national
factor=1,87)
246.72 436.61 465.2 465.5 468.8 388.7 467.5 467.5
CF4 emissions, kilotons
(national factor =0,68) 0.086 0.155 0.169 0.169 0.171 0.141 0.100 0.100
C2F6 emissions, kilotons
(national factor=0,1) 0.013 0.023 0.025 0.025 0.025 0.021 0.010 0.010
CF4 emissions in СО2
equivalent from
aluminum production,
kilotons
638.90 1142.27 1250.10 1251.01 1260.00 1044.76 739.00 739.00
C2F6 emissions in СО2
equivalent from
aluminum production,
kilotons
155.11 277.32 303.50 303.72 305.12 253.58 122.00 122.00

74
Total emissions in СО2
equivalent, kilotons 1040.7 1856.2 2022.91 2025.02 2034.32 1686.8 2000 2000
In the period of 2011-2013 the company has reached its design capacity of 250 kilotons of aluminum
per year and production increase is not foreseen in the nearest future. It is expected to minimize anode effects
(reduction of PFC emissions - CF4 and C2F6) from 2020. Anode effect is a failure of process parameters when
alumina dissolved in the electrolyte is insufficient which leads to an increase in voltage above the normal
operating limit, resulting in formation of emissions of gases containing PFCs.
Data on the number of aluminum produced were obtained from the only producer of aluminum -
Kazakhstan Electrolysis Plant. Historical data (Table 5.37) were collected by JSC Zhasyl Damu, an assignee of
RSE Kazakh Research Institute of Ecology and Climate. Pre-baked anode consumption is the main source of
carbon dioxide emissions from production of primary aluminum (electrolytic decomposition of alumina in
cryolite-alumina melt in electrolysis cells).
Table 5.37
Mass of a reducing agent used for aluminum production in tons by types
Type of material 2008 2009 2010 2011 2012 2013
Alumina 207797,2 249360,4 444426,2 481677,9 248947,7 483792,0
Roasted anodes 59559,4 71255,2 127041,1 135545,7
135825,8 135405,3
Cryolite 531,7 565,0 449,4 159,0 0,0 0,0
Aluminum
flouride
1724,6 2001,5 3543,1 4221,6 5509,6 5246,0
Calcium flouride 164,1 102,0 247,5 252,7 243,7 204,2
Soda ash 49,5 6,3 – – 0,0 0,0
Electrolyte 8,0 – – – 0,0 0,0
Caustic
magnesite
34,8 0,1 – – 0,0 0,0
Flux for slag
removal
19,7 74,3 108,8 102,82 90,5 100,2
The formula for GHG emissions estimation
𝐸𝐶𝑂2 = 𝑁𝐴𝐶 ∗ 𝑀𝑃 ∗100−𝑆𝑎−𝑎𝑠ℎ𝑎
100∗
44
12 (6.6)
where:
ЕСО2 = СО2 emissions from consumption of prebaked anodes, СО2 emissions
MP = total metal production, tons of Al
NAC = net consumption of prebaked anodes per tons of aluminum, С/ton of Al
Sa = sulfur content in prebaked anodes, % of weight
Ashа = ash content in prebaked anodes, % of weight
𝐸𝐶𝐹4 = 𝑆𝐹 ∗ 𝐴𝐸𝑀 ∗ 𝑀𝑃
𝐸𝐶2𝐹6 = 𝐸𝐶𝐹4 ∗ 𝐹𝐶2𝐹6/𝐶𝐹4
where: ECF4 = CF4 emissions from aluminum production, kg of CF4
EC2F6 = emissions of C2F6 from aluminum production, kg of C2F6
MP = metal production under i, tons of Al
SCF4 = slope factor for CF4, (kg of CF4/ton of Al)/(anode effect minimum/bath-days)
АЕМ = anode effect minimum / bath-days
FC2F6/CF4 = weight fraction of C2F6/CF4, kg of C2F6/CF4
Factor for estimation of СО2 emissions on the basis of international and national research on
prebake electrolyzers are presented in Table 5.38
Table 5.38
СО2 emission factors for primary aluminum production.

75
Process parameters
for electrolytic cells
with the prebaked
anode
Factors on the basis
of data from the
International
Aluminum Institute
(IAI)
Factors recommended for use at the enterprises of RK
using electrolysis technology in the electrolysis cells
with prebaked anodes, equipped with highly efficient
gas removal, central loading and point-fed alumina
Lower Mean Upper
Net pre-baked anode
consumption per ton
of aluminum, ton of C
/ t of Al
0,56 0,415 0,43 0,44
Sa – sulfur content in
prebaked anodes, %
of weight
2 0,6 1,8 3,0
Ashа– ash content in
prebaked anodes, %
of weight
0,4 3,0 3,77 4,54
Soda ash application
Carbon dioxide (СО2) is released during soda ash application; these emissions are taken into
account as the source in the industry where soda ash is used (see chapter 2 Volume 3 IPCC, 2006). In
Kazakhstan there is no domestic production of soda ash, so only СО2 emissions from soda ash application
were counted. Soda ash (sodium carbonate Na2CO3) is used as a raw material in many industries: glass
industry, chemical industry, production of detergents, manufacture of pulp and paper, metals and oil
refining and others. Carbon dioxide (СО2) is released during soda ash application; these emissions are
taken into account as a source in the industry where it is applied. СО2 emissions from soda application
were estimated in accordance with the 2006 IPCC Guidelines for National GHG Inventories (Tier 1) at a
default СО2 emissions factor of 0,415 per unit of used soda. Data on soda ash application were presented
by enterprises of JSC Aluminum of Kazakhstan and the Committee on Statistics of Kazakhstan MNE.
According to forecasts, non-ferrous metals production and chemical industry will develop at low rates,
annual growth of less than 2% until 2020 and up to 1% from 2020.
.
Table 5.39
Soda ash application: actual, projected and associated СО2 emissions
1990 2010 2015 2020 2025 2030
Soda ash application,
kilotons
259,53 460,67 472.3 521.5 564.5 564.5
СО2 emissions, kilotons 107,71 191,18 196.0 216.4 234.3 234.3
Lead production (CRF category 2С.5)
The biggest producer of lead is JSC Kazzinc which uses a technology of direct lead smelting
Isasmelt. In the direct smelting process there is no sintering step, so that lead concentrates and other
materials are fed directly into the furnace where they are melted and oxidized.
Greenhouse gases are contained in interim gases. Sulfur and heavy metals are removed from intermediate
gases by filters. Greenhouse gases are emitted into the atmosphere.
The sintering / melting process consists of sequential sintering and melting and takes about 78%
of primary lead production. During sintering / melting on the first step of sintering lead concentrates are
mixed with the recycled agglomerate, limestone and silica, oxygen and lead-containing slag to remove
sulfur and volatile metals by combustion. The lead melting process is an oxide reduction reaction that
forms СО2.
The formula to estimate carbon dioxide emissions under the Tier 1 (2006 IPCC Guideline for
National Greenhouse Gas Inventories) was used for lead production.
In the course of lead production СО2 is released. Emissions of other greenhouse gases are
insignificant. The formula to estimate GHG emissions from lead production:

76
М СО2= М Pb *K (6.7)
Where: М СО2 –СО2 emissions from lead production, tons
М Pb– annual amount of lead produced, tons
K – default emissions factor, tons of СО2/ ton of lead products
(Factor equal to 0,52 was used from the Table 4.21 Т.3 Section 4.6.2.2 page.4.81 2006 IPCC
Guideline for National Greenhouse Gas Inventories)
Table 5.40
Lead production: actual, projected and associated СО2 emissions
Activity 1990 2010 2011 2012 2013 2014 2015 2020 2030
2.С.5 Lead production,
kilotons
290,3 103,4 111,518 88,099 91,072 127,064 119,89 132,43 146,28
СО2 emissions from lead
production, kilotons
150,956 53,768 60,069 45,812 47,357 66,073 66,07 68,86 76,07
At the moment, lead plant in Ust-Kamenogorsk is running at full capacity. In the near future
increase in production is not expected.
Zinc production The main producer of zinc is Kazzinc. Kazzinc zinc plant applies the electrolytic process for
production of zinc that relates to hydrometallurgy. In this process zinc sulphide is calcined and zinc oxide
is obtained. Zinc oxide is then treated with sulfuric acid and purified to remove iron impurities, copper
and cadmium. Then zinc is removed from the solution by electrolysis. The electrolytic process does not
emit non-energy СО2 emissions according to 2006 IPCC Guidelines (Metal Industry Emissions). Prior to
1997 zinc production was concentrated in three nonferrous metals factories of East Kazakhstan: Ust-
Kamenogorsk Lead and Zinc Plant, Leninogorsk Polymetallic Plant and Zyryanovsky Lead Plant. In the
base year 1990 zinc production amounted to 314.9 kilotons for which СО2 emissions were estimated
using default coefficient (k = 1,72) at 541.63 kilotons of СО2. Since 2000 we believe that the electrolytic
process does not emit non-energy СО2 emissions in this category.
Possible additional measures to reduce emissions from Metal Industry
Installation and use of СО2 capturing and storage in the process of coke production. This is a
costly measure, capturing efficiency varies between 60-90% depending on the technology.
Use of solvents and other products is a source of emissions of non-methane volatile organic
compounds (NMVOCs) and nitrous oxide (N2O). The main sources of greenhouse gases in Kazakhstan in
this sector is the category SNAP 0601 (use of paints), SNAP 0602 (degreasing and dry cleaning), SNAP
0604 (other use of solvents and related activities). Only emissions of volatile organic compounds
(NMVOCs) are classified as indirect greenhouse gases and therefore they are not included into
cumulative national emissions.
Solvents and energy products from fuels (CRF category 2.B)
Use of solvents and other products is a source of emissions of non-methane volatile organic
compounds (NMVOCs) and nitrous oxide (N2O). The main sources of greenhouse gases in Kazakhstan in
this sector are categories SNAP 0601 (use of paints), SNAP 0602 (degreasing and dry cleaning), SNAP
0604 (other use of solvents and related activities). Only emissions of volatile organic compounds
(NMVOCs) are indirect greenhouse gases and therefore they are not included into the overall national
emissions.
The main sectors of Kazakhstan in which Paint application processes are found are woodworking
industry, light industry, repair and construction industry. At the same time NMVOCs are emitted into the
atmosphere - xylene, mineral spirits, toluene and others. NMVOC emissions from dyes application in the
manufacturing, construction and households were assessed under the simplified procedure described in
the manual EMEP/CORINAIR Emission Inventory Guidebook (The European Environment, 2005). This
method uses an average emission factor of NMVOC per capita calculated for European countries. It was
used to estimate the emission factor of 4.5 kg NMVOC / per capita / year
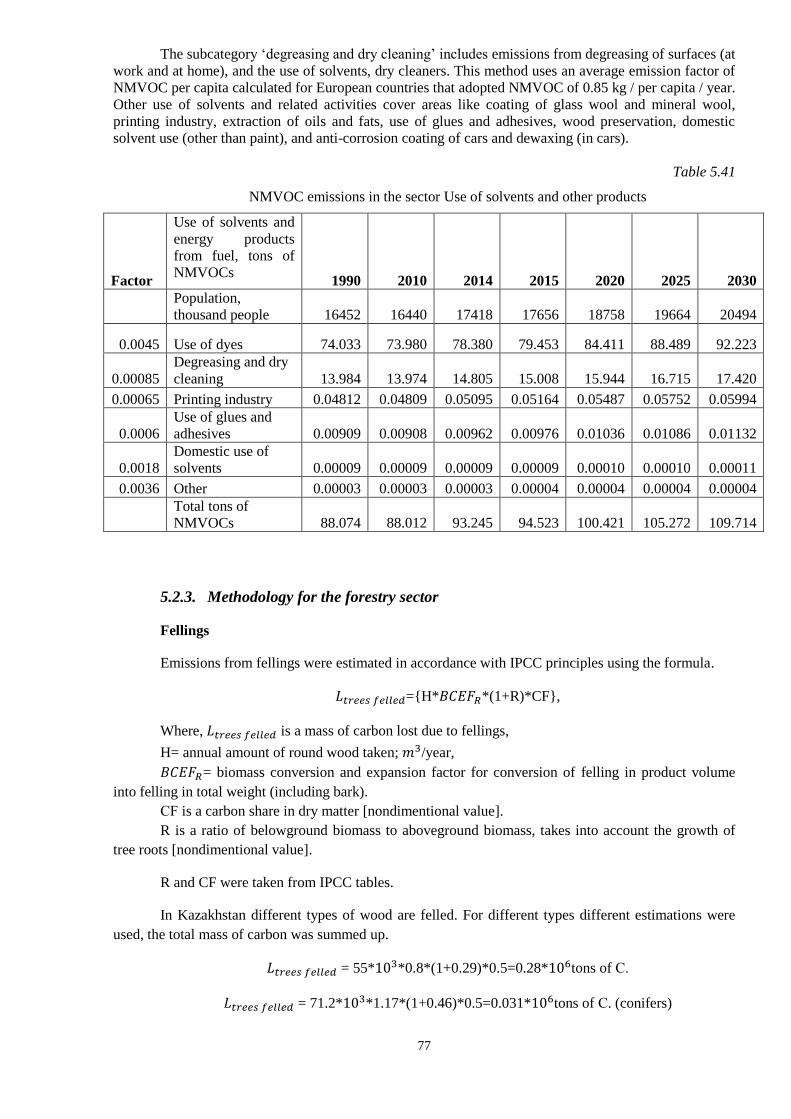
77
The subcategory ‘degreasing and dry cleaning’ includes emissions from degreasing of surfaces (at
work and at home), and the use of solvents, dry cleaners. This method uses an average emission factor of
NMVOC per capita calculated for European countries that adopted NMVOC of 0.85 kg / per capita / year.
Other use of solvents and related activities cover areas like coating of glass wool and mineral wool,
printing industry, extraction of oils and fats, use of glues and adhesives, wood preservation, domestic
solvent use (other than paint), and anti-corrosion coating of cars and dewaxing (in cars).
Table 5.41
NMVOC emissions in the sector Use of solvents and other products
Factor
Use of solvents and
energy products
from fuel, tons of
NMVOCs 1990 2010 2014 2015 2020 2025 2030
Population,
thousand people 16452 16440 17418 17656 18758 19664 20494
0.0045 Use of dyes 74.033 73.980 78.380 79.453 84.411 88.489 92.223
0.00085
Degreasing and dry
cleaning 13.984 13.974 14.805 15.008 15.944 16.715 17.420
0.00065 Printing industry 0.04812 0.04809 0.05095 0.05164 0.05487 0.05752 0.05994
0.0006
Use of glues and
adhesives 0.00909 0.00908 0.00962 0.00976 0.01036 0.01086 0.01132
0.0018
Domestic use of
solvents 0.00009 0.00009 0.00009 0.00009 0.00010 0.00010 0.00011
0.0036 Other 0.00003 0.00003 0.00003 0.00004 0.00004 0.00004 0.00004
Total tons of
NMVOCs 88.074 88.012 93.245 94.523 100.421 105.272 109.714
5.2.3. Methodology for the forestry sector
Fellings
Emissions from fellings were estimated in accordance with IPCC principles using the formula.
𝐿𝑡𝑟𝑒𝑒𝑠 𝑓𝑒𝑙𝑙𝑒𝑑={H*𝐵𝐶𝐸𝐹𝑅*(1+R)*CF},
Where, 𝐿𝑡𝑟𝑒𝑒𝑠 𝑓𝑒𝑙𝑙𝑒𝑑 is a mass of carbon lost due to fellings,
H= annual amount of round wood taken; 𝑚3/year,
𝐵𝐶𝐸𝐹𝑅= biomass conversion and expansion factor for conversion of felling in product volume
into felling in total weight (including bark).
СF is a carbon share in dry matter [nondimentional value].
R is a ratio of belowground biomass to aboveground biomass, takes into account the growth of
tree roots [nondimentional value].
R and CF were taken from IPCC tables.
In Kazakhstan different types of wood are felled. For different types different estimations were
used, the total mass of carbon was summed up.
𝐿𝑡𝑟𝑒𝑒𝑠 𝑓𝑒𝑙𝑙𝑒𝑑 = 55*103*0.8*(1+0.29)*0.5=0.28*106tons of С.
𝐿𝑡𝑟𝑒𝑒𝑠 𝑓𝑒𝑙𝑙𝑒𝑑 = 71.2*103*1.17*(1+0.46)*0.5=0.031*106tons of С. (conifers)

78
674.7 thousand 𝑚3cut.
𝐿𝑤𝑜𝑜𝑑 𝑓𝑢𝑒𝑙={𝐹𝐺𝑝𝑎𝑟𝑡*D*CF}
Preparation of raw and fuel wood. 674,7 thousand m3 cut.
𝐿𝑤𝑜𝑜𝑑 𝑓𝑢𝑒𝑙 = 674.7*103*0.5*0.5=0.168*106 tons of С.
Fires
𝐿𝑑𝑖𝑠𝑡𝑢𝑟𝑏𝑎𝑛𝑐𝑒={А𝑑𝑖𝑠𝑡𝑢𝑟𝑏𝑎𝑛𝑐𝑒 ∗ 𝐵𝑊 ∗ (1 + 𝑅)* CF*fd}
Where, А𝑑𝑖𝑠𝑡𝑢𝑟𝑏𝑎𝑛𝑐𝑒 𝑖𝑠 𝑡ℎ𝑒 𝑎𝑟𝑒𝑎 𝑜𝑓 𝑑𝑖𝑠𝑡𝑢𝑟𝑏𝑎𝑛𝑐𝑒 (𝑓𝑖𝑟𝑒), 𝐵𝑊 =average value of aboveground
biomass at areas under effect of disturbance; tons of с. В. /ha.
СF is a share of carbon in a dry matter [nondimentional value].
R is a ration of belowground biomass to aboveground biomass, takes into account the growth of
tree roots [nondimentional value].
Fd is a share of biomass lost as a result of disturbance.
There is an assumption that the area under fires in 2015 was 10 thousand hectares
𝐿𝑑𝑖𝑠𝑡𝑢𝑟𝑏𝑎𝑛𝑐𝑒 = 10*103*91*(1.29)*0.5*0.4=0.234*106 tons of С.
5.2.4. Methodology for the wastes sector
When forecasting emissions from disposal of municipal solid wastes and wastewaters, linear
extrapolation until 2030 was used.
When forecasting emissions from medical waste incineration, it was assumed that emissions will
stabilize at the 2013 level.
79
VI. EXTENTION OF FINANCIAL AND TECHNOLOGICAL
SUPPORT FOR STRENTHENING CAPACITY OF PARTIES WHICH ARE
DEVELOPING COUNTRIES
Financial resources and transfer of technology are important means of implementation and play
an crucial role in effectiveness of the global response to climate change. By definition of the Secretariat
of UNFCCC27, ‘technology transfer’ is a wide range of processes covering the transfer of know-how,
experience and equipment for mitigating and adapting to climate change amongst different stakeholders28.
These stakeholders are, by definition of the IPCC29, the government, private sector entities, financial
institutions, non-governmental organizations, research institutes and educational institutions.
Outdated technology is a source of greenhouse gases, so the global GHG reduction requires
innovation to transform existing technologies into clean and resistant to climate change ones. For this
reason innovation is a foundation of sustainable economic development. At the same time, a broad and
inclusive term ‘transfer’ implies the spread of technology and technological cooperation between
countries and within countries. It covers technology transfer processes between developed countries,
developing countries and countries with economies in transition, and also includes the transfer of
knowledge and capacity-building for the implementation and use of innovative technologies with the
ability to select and adapt them to local 30conditions31. It is important to ensure local integration with
existing technologies. National initiative for investment and development, foreign direct investment,
official development assistance (ODA), commercial lending and equity investment is an important
channel through which technology transfer is funded.
During the reporting period Kazakhstan joined the group of countries with upper-middle income
by the definition of the World Bank classification32. In 2013 GDP per capita was almost 13 thousand
dollars. Large amounts of specific greenhouse gas emissions per unit of GDP 33are continuing. According
to the International Energy Agency Enerdata at the end of 2013 Kazakhstan was ranked first in the world
from the standpoint of intensity of carbon dioxide emissions per unit of GDP. Figure 6.1. shows the trend
of emissions intensity from 2005 to 2012.34
Figure 6.1. Trend of СО2 emissions intensity per unit of GDP (2005-2012)
27http://unfccc.int/essential_background/glossary/items/3666.php#T 28http://unfccc.int/essential_background/glossary/items/3666.php#T 29Intergovernmental Panel on Climate Change
30Technology owned and used by the indigenous population, and associated and naturally developing in a certain
area or environment, in particular climate zone in accordance with the way of life. 31https://www.thegef.org/gef/Technology_Transfer 32 http://data.worldbank.org/country/kazakhstan 33Online newspaper Kursiv of 13 February 2015 (available at link
http://www.kursiv.kz/news/top_ratings/Kazakhstan_zanimaet_pervoe_mesto_v_mire_po_intensivnosti_vybrosov_u
glekislogo_gaza/) 34http://www.iea.org/statistics/statisticssearch/report/?country=KAZAKHSTAN&product=Indicators&year=2005

80
Source: International Energy Agency, country statistical data
VI. А. Financial resources
The Republic of Kazakhstan is not an Annex II country to the UNFCCC, therefore has no direct
obligation to provide financial and technological support in the field of capacity building for developing
countries not included in Annex I to the Convention.
At the same time, as a country in transition, Kazakhstan is steadily increasing domestic efforts to
implement decisions of the Conference of the Parties to the UNFCCC, and provides below the
information on how funds are received and allocated to countries in the course of implementation of
country’s voluntary commitments.
А. Republic of Kazakhstan and GEF
Since its founding in 1991, the GEF provides assistance in technology transfer to help developing
countries deal with the global problem of climate change. GEF has a mandate from the Conference of the
Parties (COP) to the UNFCCC to finance the transfer of environmentally sound technologies35. In recent
years, the GEF allocated for this purpose about $ 250 million per year36. GEF-5 (2010-2014) funding for
mitigation of the effects of climate change has a priority to transfer technology, either directly or through
indirect projects.
Kazakhstan is not a donor country for the GEF so as the recipient country receives grants from
the Global Environment Facility for projects in the field of sustainable development, environmental
35https://www.thegef.org/gef/Technology_Transfer, "The GEF has a mandate from the Conference of the Parties
(COP) to the United Nations Framework Convention on Climate Change (UNFCCC) to finance the transfer of
Environmentally Sound Technologies (ESTs)..." 36https://www.thegef.org/gef/Technology_Transfer
0
0,5
1
1,5
2
2,5
3
3,5
2005 2006 2007 2008 2009 2010 2011 2012
kg
СО
2
Trend of СО2 emissions intensity per unit of GDP (2005-2012)
(kgCO2/2005USD)
(kgCO2/2005USD PPP)

81
management and climate change on an annual basis since 2007. Table 6.1 shows the data on the
allocation of funds for targeted projects in Kazakhstan since 2007 within the framework of GEF 4 - GEF
6.
Table 6.1.
Approved national projects of GEF in Kazakhstan37
Action area GEF grant, USD Co-financing, USD Number of
projects
Biodiversity 16 618 364 56 840 300 7
Ozone screen depletion 5 433 452 748 839 1
Climate change 32 675 50038 162 106 768 8
Cross-sectoral 10 074 000 21 255 000 4
POPs 17 550 000 85 711 000 4
Soil degradation 7 986 986 70 223 200 4
TOTAL 90 338 302 396 885 107 28
Source: GEF website.
GEF funds activities on adaptation and mitigation of climate change in more than 156 developing
countries and countries with economies in transition. According to the GEF website in Kazakhstan it
implements eight national projects on climate change in the amount of 15,076,950 US dollars, the co-
financing from the government was about 180%39. Thus, the Government of the Republic of Kazakhstan
allocates significant domestic financial and technical resources for effective implementation of the
projects in the field of climate change. Data on GEF grants provided to Kazakhstan are presented in Table
6.240.
Table 6.2.
GEF projects in Kazakhstan on climate change, USD
№
Date of grant
approval GEF grant
Commission fee of
UNDP/GEF41 Total amount
1 14.06.2007 144 546 5 454 150 000
2 24.06.2009 4 568 500 456 850 5 025 350
3 23.12.2008 100 000 10 000 110 000
4 21.04.2009 432 692 17 308 450 000
5 17.03.2010 4 886 000 488 600 5 374 600
6 15.09.2009 136 364 13 636 150 000
7 08.06.2010 3 400 000 340 000 3 740 000
8 28.04.2010 70 000 7 000 77 000
Total: 13 738 102 1 338 848 15 076 95042
Source: GEF website.
To assist developing countries in getting environmentally sustainable technologies, the GEF has
developed a strategic program for investment in technology transfer which was approved by the GEF
37https://www.thegef.org/gef/country_profile/KZ?countryCode=KZ&op=Browse&form_build_id=form-
3OaZgiQLHfrI8OUdHedl7vj_bRNDBZR7a0Nph-t5I3U&form_id=selectcountry_form 38It includes funds under GEF5 and GEF6, including in the framework of regional projects on climate
change and multisectoral projects. 39https://www.thegef.org/gef/country_profile/KZ?countryCode=KZ&op=Browse&form_build_id=form-
3OaZgiQLHfrI8OUdHedl7vj_bRNDBZR7a0Nph-t5I3U&form_id=selectcountry_form 40https://www.thegef.org 41All grants are made through the agency UNDP / GEF. 42It includes contributions only from GEF-4.
* Relevant exchange rates used were from the website http://www.x-rates.com/average/

82
Council and relevant funds in November 2008. At COP 14, the program was approved and renamed as
Poznan strategic program on technology transfer.43
In 2011, the Republic of Kazakhstan in the framework of UNEP launched the project on
technology needs assessments in the sector of climate change mitigation with funding from the Global
Environmental Facility44. This report has identified and analyzed the most relevant technological needs of
the country's major economic sectors. Information obtained as a result of this assessment is used to form a
portfolio of projects and programs to mitigate climate change. Also these documents represent a basis for
action plans for the technology, to overcome barriers and promote the transfer, deployment and diffusion
of certain technologies in participating countries.
B. Kazakhstan and international climate change organizations
The Republic of Kazakhstan has actively participated in the international process to develop a
global climate agreement and has been working steadily in the country to meet its international
obligations. According to INDC (Intended Nationally Determined Contributions) submitted by
Kazakhstan to the UNFCCC Secretariat, the national quantitative contribution to limit and / or reduce
greenhouse gas emissions for the period from 2021 to 2030 has an unconditional target to limit and / or
reduce greenhouse gas emissions by 15%, and a conditional target to limit and / or reduce greenhouse gas
emissions by 25%, to the level of 1990 base year. One of the key conditions for implementation of the
objective to reduce emissions by 25% is to have access to additional financial resources and mechanisms
for the transfer of low carbon technologies, as well as a flexible and efficient mechanism for participation
of countries with economies in transition in the financing by the UN Green Climate Fund. Table 6.3
below shows information on implementation of financial obligations in the framework of Kazakhstan's
participation in international organizations and bodies.
Table 6.3.
Compulsory membership fees of Kazakhstan in the international organizations (IOs) and other
international bodies
Source: Ministry of Foreign Affairs of the Republic of Kazakhstan (in response to the
request of the Ministry of Energy of the Republic of Kazakhstan, outgoing № 18-05-5935/4 as of
28/05/2015)
43 https://www.thegef.org/gef/TT_poznan_strategic_program 44 Part I – Technology needs assessment Report - Mitigation available at
http://unfccc.int/ttclear/misc_/StaticFiles/gnwoerk_static/TNR_CRE/e9067c6e3b97459989b2196f12155ad5/447548
a763b44013a124ceecc8bd26f5.pdf
№
Name of IO, universal international
treaty, an international body
Size of contribution, USD
2013 2014 2015
1. UN 3 083 421 3 087 872 3 283413
2. Vienna Convention for the Protection of
the Ozone Layer
1 992 5 158 5 158
3. Kyoto protocol 15 000 14 887 13 124
4. UN Framework Convention on Climate
Change
23 761 23 778 24 186
5. Multilateral Fund for the
Implementation of the Montreal
Protocol on Substances that Deplete the
Ozone Layer
- 128 906 128 906
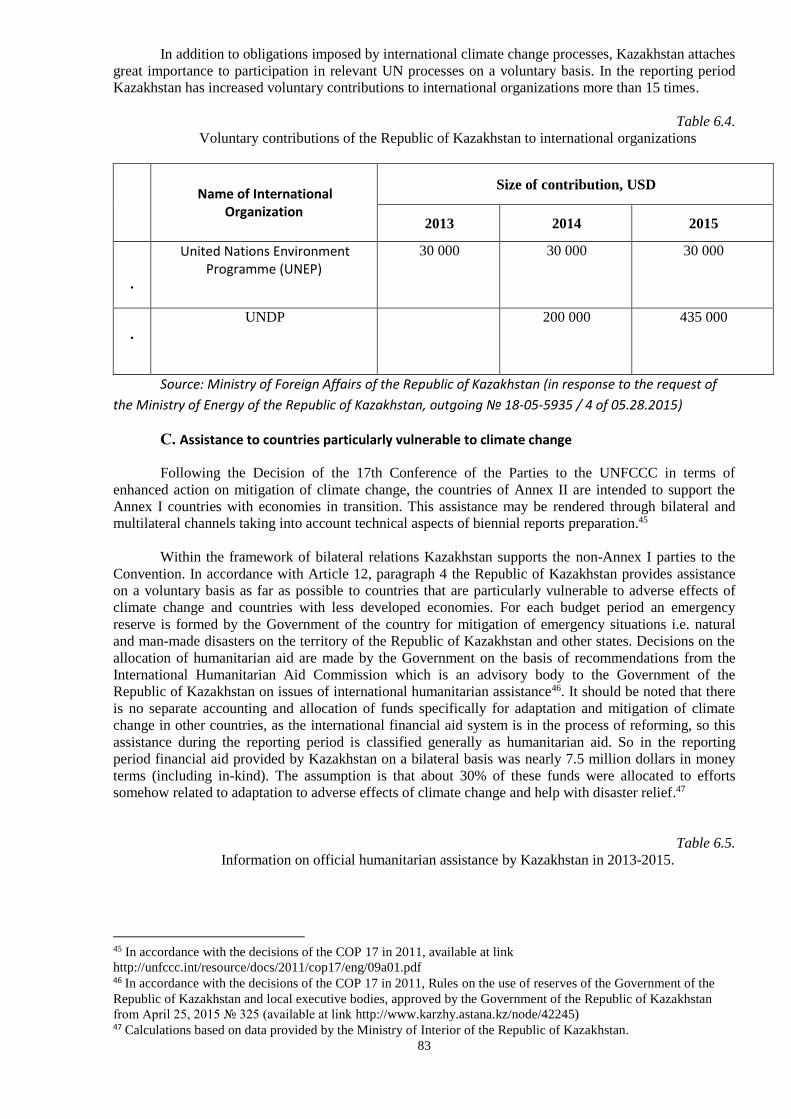
83
In addition to obligations imposed by international climate change processes, Kazakhstan attaches
great importance to participation in relevant UN processes on a voluntary basis. In the reporting period
Kazakhstan has increased voluntary contributions to international organizations more than 15 times.
Table 6.4.
Voluntary contributions of the Republic of Kazakhstan to international organizations
№ Name of International
Organization
Size of contribution, USD
2013 2014 2015
1
.
United Nations Environment Programme (UNEP)
30 000 30 000 30 000
2
.
UNDP 200 000 435 000
Source: Ministry of Foreign Affairs of the Republic of Kazakhstan (in response to the request of
the Ministry of Energy of the Republic of Kazakhstan, outgoing № 18-05-5935 / 4 of 05.28.2015)
С. Assistance to countries particularly vulnerable to climate change
Following the Decision of the 17th Conference of the Parties to the UNFCCC in terms of
enhanced action on mitigation of climate change, the countries of Annex II are intended to support the
Annex I countries with economies in transition. This assistance may be rendered through bilateral and
multilateral channels taking into account technical aspects of biennial reports preparation.45
Within the framework of bilateral relations Kazakhstan supports the non-Annex I parties to the
Convention. In accordance with Article 12, paragraph 4 the Republic of Kazakhstan provides assistance
on a voluntary basis as far as possible to countries that are particularly vulnerable to adverse effects of
climate change and countries with less developed economies. For each budget period an emergency
reserve is formed by the Government of the country for mitigation of emergency situations i.e. natural
and man-made disasters on the territory of the Republic of Kazakhstan and other states. Decisions on the
allocation of humanitarian aid are made by the Government on the basis of recommendations from the
International Humanitarian Aid Commission which is an advisory body to the Government of the
Republic of Kazakhstan on issues of international humanitarian assistance46. It should be noted that there
is no separate accounting and allocation of funds specifically for adaptation and mitigation of climate
change in other countries, as the international financial aid system is in the process of reforming, so this
assistance during the reporting period is classified generally as humanitarian aid. So in the reporting
period financial aid provided by Kazakhstan on a bilateral basis was nearly 7.5 million dollars in money
terms (including in-kind). The assumption is that about 30% of these funds were allocated to efforts
somehow related to adaptation to adverse effects of climate change and help with disaster relief.47
Table 6.5.
Information on official humanitarian assistance by Kazakhstan in 2013-2015.
45 In accordance with the decisions of the COP 17 in 2011, available at link
http://unfccc.int/resource/docs/2011/cop17/eng/09a01.pdf 46 In accordance with the decisions of the COP 17 in 2011, Rules on the use of reserves of the Government of the
Republic of Kazakhstan and local executive bodies, approved by the Government of the Republic of Kazakhstan
from April 25, 2015 № 325 (available at link http://www.karzhy.astana.kz/node/42245) 47 Calculations based on data provided by the Ministry of Interior of the Republic of Kazakhstan.

84
The name of the state to
which humanitarian aid
was provided
Period of
emergency
Character of
emergency Commodity form Monetary form
2013
The Republic of Guatemala
January Earthquake In money terms For amount of
50.000 USD
Republic of Afghanistan
March Financial and
economic hardship
Supplies Equivalent about
528 thousand USD
Republic of Lebanon Financial and
economic hardship
In money terms For amount of
200 000 USD
The Democratic Socialist
Republic of Sri Lanka
Financial and
economic hardship
In money terms For amount of
200 000 USD
2014
Republic of the Philippines In money terms For amount of
100 000 USD
Islamic Republic of
Afghanistan
Supplies Equivalent of
1 985917 USD
Russian Federation April For construction of a
kindergarten
In money terms Equivalent of
2084065 USD
Saint Lucia and
Saint Vincent and
Grenadines
May Natural disaster In money terms 100 000 thousand
USD
(50 thousand USD
to each country).
Republic of Serbia July Flood
Goods of first priority Total amount
equivalent to
202 488 USD
Islamic Republic of
Afghanistan
July For construction of 4
types of bridges in
the city of Aibak and
reinforcement of
Aibak riverbanks
In money terms Total amount of 1
474 083,38 USD
Islamic Republic of
Afghanistan
(BadaKhshan and Jowzjan
provinces)
July Landslide Supplies and clothing Total amount
equivalent to 775
085 USD
Bosnia and Herzegovina July In money terms 100 000 USD
Republic of Tajikistan July Supplies Equivalent of 627
465 USD
Central African Republic July In money terms 50 000 USD
Source: Ministry of Interior of the Republic of Kazakhstan (in response to the request of the
Ministry of Energy of the Republic of Kazakhstan, outgoing № 18-05-5935/4 as of 28/05/2015)
For the purpose of development of a national policy on provision of financial, technical and other
assistance to foreign countries designed to promote social and economic development of recipient

85
countries, in 2013 the Concept of the Republic of Kazakhstan in the field of official development
assistance (hereinafter - ODA) was developed and adopted. This concept is consistent with the norms of
national and international legislation and best international practices. In order to promote the ODA
concept, the KazAID agency was created with the support of UNDP. One of the main objectives of the
emerging ODA system of the Republic of Kazakhstan is to contribute to solving global and regional
sustainable development problems.48
Kazakhstan also has got a wide experience in international development assistance projects being
implemented under the auspices of the United Nations and through voluntary contributions and
participation in the trust funds. According to the Concept, in 2011 the extent of such cooperation has
exceeded $ 2 million. In 2012, the total amount of voluntary contributions of the Republic of Kazakhstan
to the international organizations, which can be defined as development assistance, amounted to more
than 2.11 million US dollars. However, according to statistics from the United Nations for the period
from January 2006 to July 2011, Kazakhstan has allocated US $ 53.7 million as humanitarian aid to
foreign countries, most of which was sent to the Central Asian region49. According to the Ministry of
Foreign Affairs of the Republic of Kazakhstan, Kazakhstan provided humanitarian aid and ODA in the
amount of approximately US $ 100 million.50
VI. B. Technology development and transfer
Cooperation and exchange of experience and capacity building One of the international initiatives in the field of climate change mitigation by reducing
greenhouse gas emissions is the Covenant of the European Mayors joined by several cities of Kazakhstan.
Under the Covenant, cities of Kazakhstan develop and adopt the Action Plan for sustainable energy
development. The aim of such a plan is to reduce greenhouse gas emissions from municipal facilities by
20% by 2020. By August 2015 9 cities of Kazakhstan including Aksu, Astana, Lisakovsk, Petropavlovsk,
Satpayev, Taraz, Temirtau, Zhezkazgan and Karaganda signed this agreement and have begun drafting
their plans. Their plans are expected to include projects for low-carbon development which will be
implemented at the city level in order to reduce GHG emissions.
Assistance for capacity-building in Kazakhstan for transition to a green economy is provided by
the UN Economic Commission for Europe (UNECE). In particular during the period from 2015 to 2018
UNECE has routed through the United Nations Development Programme funds in the amount of 7.1 mln.
Euros51. It is expected that the capacity and cooperation necessary for transition to a green economy will
be strengthened both within the country and in other Central Asian countries. This will be done through
efforts on improvement of legislation, development of mechanisms to encourage sustainable management
of water resources as well as the development of methodological approaches and tools. Kazakhstan’s program on climate change mitigation is a three-year project of the US Agency for
International Development (USAID) aimed to support Kazakhstan in the long-term and sustainable
reduction of specific emissions of greenhouse gases. In this project USAID has supported the government
and business community of Kazakhstan in the implementation of policies and measures to reduce
greenhouse gas emissions at the project, corporate and national levels. The program also contributes to
improvement of specialized training programs for a new generation of professionals in the field of energy
and climate in Kazakhstan. One of the initiative’s goals is development of professional training programs
in energy conservation and climate change through delivery of training seminars, supporting professional
accreditation and establishing extension centers to distribute modern knowledge and technology.52
48 Same as 37.
49 Same as 37.
50 Same as 37. 51 http://vlast.kz/novosti/11459-7-mln-evro-vydelaut-mezdunarodnye-organizacii-na-perehod-kazahstana-k-zelenoj-
ekonomike.html 52http://kazccmp.org/kccmp/

86
VI. C. Capacity building
At the same time the issues of peace and development have been put high on country’s
development agenda and Kazakhstan plans to increase further its participation in international
development processes. According to the MFA in 2016 Kazakhstan plans to increase its contributions to
international organizations up to 55 million dollars, as with higher levels of income the Republic is
changing its status from recipient countries to donor countries53.
As part of the recent initiatives to promote international cooperation in the framework of the 70th
session of the UN General Assembly which took place late September in New York, Kazakhstan jointly
with the UNDP adopted a program to assist 45 African countries in the implementation of sustainable
development goals (SDGs) approved at the same session of the UN General Assembly. It is expected that
the initiative ‘Kazakhstan - Africa Partnership for the SDG’ will allow African countries to increase the
level of participation and exchange information both within Africa and with other regions of the world.
The program will enter the stage of processing and preparation and further can be started.
At this stage Kazakhstan embarked on economic diversification to support a low-carbon
development strategy towards sustainability. In the concept of transition to a ‘green’ economy until 2050,
Kazakhstan provides for measures for the transition to low-carbon development.
In July 2013 Kazakhstan launched a national system of GHG emissions regulation in accordance
with the rules of allowances trade and obligations to reduce emissions into the environment, approved by
Decree of the Minister of Energy of the Republic of Kazakhstan dated 31 March 2015 № 250.
Allowances are issued to 178 businesses which are responsible for cumulative emissions of 147 mln. tons
per year. The system includes companies whose emissions exceed 20 kilotons per year. The allowance
market was launched with the system Cap & Trade. Similar systems are used in China, Australia, India,
Korea, New Zealand and other countries. Further information on the system of greenhouse gas emissions
trading in Kazakhstan was given in the section on the country's progress in achieving the quantified
economy-wide emission reduction targets.
Kazakhstan has some international and regional initiatives for technology and best practices
transfer. One such example is the initiative ‘Green Bridge’ that was supported by other countries in the
Central Asian region. In June and September 2017 Kazakhstan will hold the international exhibition
EXPO-2017 with the theme ‘Future Energy’. Preparation and hosting of EXPO in Astana will give
impetus to strengthening measures for transition to low-carbon development and will promote sustainable
development and fulfillment of obligations taken by Kazakhstan under the UNFCCC.
53 International news agency KAZINFORM online version of 16 February 2015, available at link
http://www.inform.kz/rus/article/2746842

87
VII. SUMMARY OF SYSTEMATIC CLIMATE OBSERVATIONS IN
THE REPUBLIC OF KAZAKHSTAN
Systematic climate observations are performed within the framework of existing national programs
of the Republican State Enterprise ‘Kazhydromet’ which is a subdivision of the Ministry of Energy of the
Republic of Kazakhstan. Activities of the National Hydrometeorological Service of the Republic of
Kazakhstan are aimed at providing information on weather, climate, water resources and the environment,
notification of dangerous and extreme weather phenomena and extremely high levels of pollution.
7.1. Systematic observations
Systematic observation, data collection, processing and dissemination of data and management of
observational data. The program supports network development and technological modernization of
stations, hydrometeorological and heliogeophysical observations, development of technologies for
collection, processing and dissemination of operational and routine observations, maintenance and
development of the National Fund of data on hydrometeorology and environmental pollution.
Climate monitoring in Kazakhstan: supporting climate data keeping and management. Preparation
of regime and reference information as well as providing various sectors of the Kazakh economy with
climate information for forecasting purposes.
The National Hydrometeorological Service of Kazakhstan manages the observation network (Table
7.1), logistics, planning and funding for research and development (R&D) works on methods and means
of measurement, methods of observation, data collection and processing. The Global Climate Observing
System (GCOS) has two networks: a network of upper-air and ground-based meteorological network. The
GCOS ground subsystem on the territory of Kazakhstan includes surface synoptic stations on land which
SYNOP reports are delivered to the Global Telecommunication System (GTS) at four basic terms, upper-
air stations which deliver the CLIMAT TEMP summary report, climatological stations that generate
CLIMAT reports (Table 7.1).
Table 7.1.
RSE Kazhydromet observation network
№ Types of observations Number of
observation
stations
Global network
I. Ground meteorological station:
1 Meteorological observations 328 82 (SYNOP),
44 (СLIMAT)
Aerological observations 9 9 (СLIMATTEMP)
Actinometric observation 40
Ozonometric observations 5
Weather stations 12
II. Agrometeorological network:
1 Agrometeorological observations 203
III. Hydrological network:

88
1 Rivers 262
Lakes 36
Sea 8
2 Observations at snow-measuring routes 25
III. Network of environmental monitoring:
1 Air pollution observation stations 146
2 Automated buoy stations 7
3
Water pollution Observations
River 83
Lakes 26
Channel 4
Reservoir 14
Sea 1
4
Soil pollution monitoring:
City/town 65
IV. Radiation monitoring
Gamma background 86 stations
Beta activity 43 stations
Source: Technical specifications for government programs 031 – ‘Maintenance of hydrometeorological
monitoring’, 018 – ‘Observations of the state of the environment’
7.2. 7.2. Possibility of free and open international data exchange.
The National Hydrometeorological Service of Kazakhstan ensures a free and open international
exchange of data:
1. World Data Center (Volume A) on meteorology (National Climatic Data Center, US);
2. SI ‘RIHMI – WDC’: the exchange of meteorological data on a regular basis as current regime
information is processed by 22 international exchange stations.
According to a joint action plan on implementation of the hydrometeorological safety concept of
CIS member states, Kazhydromet RSE supports bilateral cooperation in the exchange of information on
hazardous weather (HW) and extreme weather phenomena (EWP). In the event of the extreme weather
events threat on the territory of Kazakhstan Kazhydromet directs storm warnings to the NHMS of Russia,
Uzbekistan and Kyrgyzstan.

89
7.3. Principles of climate monitoring in GCOS/GOOS/GTOS.
In its national programs for systematic observations the Hydrometeorological Service of
Kazakhstan adheres to principles and best practices of climate monitoring. Systems and programs of the
observation network in Kazakhstan are based on those of the Global Observing System (GOS) of the
World Weather Watch (WWW), Guide to the Global Observing System, WMO Technical Regulations,
Guide to Instruments and Methods of Measurement.
On January 1, 2016, 328 meteorological stations will operate in Kazakhstan, including 71
unmanned stations with automatic meteorological observations, the information comes every hour to the
central server in the city of Astana. In the period from 2011 to 2015 70 automatic weather stations were
set up and opened. Growth dynamics of the state monitoring network is shown on Fig. 1.
40 meteorological stations perform actinometric monitoring of the intensity of direct, diffuse, total
solar radiation as well as effective radiation, radiation balance and albedo; in 2014 27 automatic weather
stations with actinometric sensors were installed.
Ozone content in the atmosphere is observed by 5 stations - Almaty, Aral Sea, Atyrau, Karaganda,
Semipalatinsk. The measured data are sent monthly to the Central Geophysical Observatory of St.
Petersburg.
One of the major tasks of NHMS is upper-air observations at standard and special levels up to 30-
40 km heights. Today upper-air observations are performed by 9 upper-air stations. In the period from
2009 to 2014 as part of modernization of upper-air observation network 7 new upper-air systems were
acquired.
Observations of ground station networks on the territory of Kazakhstan are monitored and archived
by the software PERSONA-MIS (Automated System for meteorological information, developed by
RIHMI-WDC, Obninsk, Russian Federation).
Stations’ representative location is controlled by a program ‘inter-station control’, developers are
Voeykov MSO, St. Petersburg, Russian Federation (RF). Later on the climatological information
processing stage, the historical series are analyzed for homogeneity using a variety of methods for
detecting and eliminating climatological heterogeneity.
An important element of monitoring is a climate data management system. Currently work is
underway on updating the database of all meteorological stations in Kazakhstan in the hardware-software
complex ‘integrated database management system’ of CliWare (ACS CliWare).
7.4. Monitoring network in the Republic of Kazakhstan.
A primary and systemic problem of the NHMS of Kazakhstan at the present stage is a mismatch
between capabilities of NMHS and increasing demand of society for hydrometeorological and other
information about the state of the environment, as well as seriously outdated technical, technological and
human resources in comparison with developed countries’ Hydrometeorological Services.
NHMS work depends on the State observation network. After the collapse of the Soviet Union
and until 1999 the state monitoring network has been steadily declining. The number of meteorological
stations (MS) decreased from 361 to 244, the number of weather stations performing agro-meteorological

90
observations - from 246 to 111, the number of hydrological stations from 457 to 159, upper-air stations
from 15 to 854
Increase in the number of environmental and meteorological stations and posts is shown on Fig.
7.1.
Figure 7. 1. Growth of the national observation system.
Sources: Technical specifications of government programs: 031 – ‘Maintenance of hydrometeorological
monitoring’, 018 – ‘Observations of the state of the environment’
Currently, despite the ongoing efforts to expand the State observation network, coverage of the
national observation network of NHMS of Kazakhstan does not meet the requirements of the World
Meteorological Organization. For example, the minimum number of observation points shall be:
• 421 meteorological stations;
• 15 upper-air stations;
• 500 hydrological stations;
• agro-meteorological observations should be conducted at 280 stations;
• 250 air pollution stations.
As a result today 78% of the Republic is covered by meteorological monitoring, 73% by
agrometeorological, 61% by hydrological, 58% by environmental (air, soil, surface water), which is not
enough for full coverage of the territory with all kinds of monitoring, as well as for qualitative assessment
of regional and global environmental and climate change. / 3 /.
54 Feasibility study ‘Implementation of an integrated system of environmental and hydrometeorological
monitoring the Republic of Kazakhstan on the basis of a national GIS’ 2013.
Meteorologicalstations
Agro-meteorologicalstations
Upper-air stations Hydrological stations Air pollution stations
2012 260 186 9 298 78
2013 287 186 9 298 104
2014 297 202 9 298 114
2015 325 203 9 302 142
0
50
100
150
200
250
300
350
Growth of the national observation system
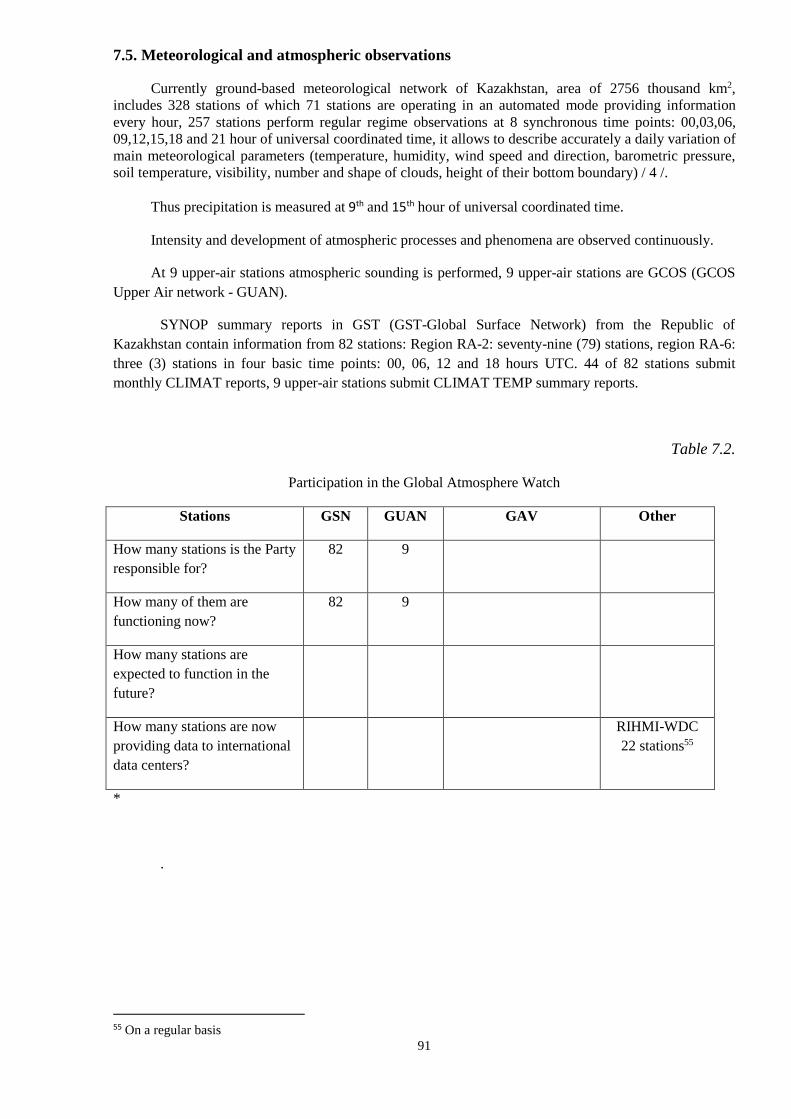
91
7.5. Meteorological and atmospheric observations
Currently ground-based meteorological network of Kazakhstan, area of 2756 thousand km2,
includes 328 stations of which 71 stations are operating in an automated mode providing information
every hour, 257 stations perform regular regime observations at 8 synchronous time points: 00,03,06,
09,12,15,18 and 21 hour of universal coordinated time, it allows to describe accurately a daily variation of
main meteorological parameters (temperature, humidity, wind speed and direction, barometric pressure,
soil temperature, visibility, number and shape of clouds, height of their bottom boundary) / 4 /.
Thus precipitation is measured at 9th and 15th hour of universal coordinated time.
Intensity and development of atmospheric processes and phenomena are observed continuously.
At 9 upper-air stations atmospheric sounding is performed, 9 upper-air stations are GCOS (GCOS
Upper Air network - GUAN).
SYNOP summary reports in GST (GST-Global Surface Network) from the Republic of
Kazakhstan contain information from 82 stations: Region RA-2: seventy-nine (79) stations, region RA-6:
three (3) stations in four basic time points: 00, 06, 12 and 18 hours UTC. 44 of 82 stations submit
monthly CLIMAT reports, 9 upper-air stations submit CLIMAT TEMP summary reports.
Table 7.2.
Participation in the Global Atmosphere Watch
Stations GSN GUAN GAV Other
How many stations is the Party
responsible for?
82 9
How many of them are
functioning now?
82 9
How many stations are
expected to function in the
future?
How many stations are now
providing data to international
data centers?
RIHMI-WDC
22 stations55
*
.
55 On a regular basis
92
List of main sources and references
Foreign policy concept of the Republic of Kazakhstan for 2014 – 2020 approved by the
Presidential Decree on 21st of January 2014 No 741 http://mfa.gov.kz/index.php/ru/vneshnyaya-
politika/kontseptsiya-vneshnoj-politiki-rk-na-2014-2020-gg;
Concept of the Republic of Kazakhstan in the field of Official Development Assistance,
approved by the Presidential Decree on 9th of April 2013 No 538
http://adilet.zan.kz/rus/docs/U1300000538;
‘About Regulation of the Government of the Republic of Kazakhstan’ – Decree of the
Government of Kazakhstan as of 10th of December 2002 No 1300
http://adilet.zan.kz/rus/docs/P020001300_;
Rules for the use of reserves of the Government of Kazakhstan and local authorities,
approved by the Governmental Decree of the Republic of Kazakhstan as of 25 April 2014 No 325;
United Nations Framework Convention on Climate Change adopted on 9th of May 1992;
Ecological code of the Republic of Kazakhstan as of 9th of January 2007 No 212;
Kyoto Protocol to the UN Framework Convention on Climate Change, 1998;
Law of the Republic of Kazakhstan ‘On Official Development Assistance’;
III-VI National Communication of the Republic of Kazakhstan to UN Framework
Convention on Climate Change, 2013;
Annotated Outline for Fifth National Communications of Annex I Parties under the
UNFCCC, including Reporting Elements under the Kyoto Protocol;
UNFCCC biennial reporting guidelines for developed country Parties
(FCCC/CP/2011/9/Add.1) ;
Strategic Development Plan of the Republic of Kazakhstan until 2020 approved by the
Presidential Decree on the 1st of February 2010 No 922;
Law of the Republic of Kazakhstan ‘On the republican budget for 2015-2017’ as of 28
November 2014 No 259-V ZRK;
Technical specifications for state programs (031 – ‘Maintenance of hydrometeorological
monitoring’, 018 – ‘Observations of the state of the environment’, 003 – ‘Scientific research in
the field of environmental protection’) relating to activities in the area of systematic climate
observations by the National Hydrometeorological service of the Republic of Kazakhstan for
2014-2015, p.1-2 P.J. Kozhahmetov ‘On principles of construction of land-based weather network Kazhydromet in
current conditions. Determination of the minimum number of weather stations in Kazakhstan’,
2011;
The Strategic Plan of the Ministry of Energy of the Republic of Kazakhstan in 2014-
2018;
Manual hydrometeorological stations and posts, part 1, 2002;
Financial and economic justification for ‘Development of the integrated system for ecological
and hydrometeorological monitoring of the Republic of Kazakhstan on a basis of national GIS,
2013;
Mapping vulnerability of Kazakhstan regions to climate change. The report was prepared as part
of the joint project of UNDP/MEP RoK ‘Capacity building in the field of sustainable
development through integration of climate change issues into strategic planning in the Republic
of Kazakhstan’ with the support of the UNDP Regional Programme on Climate Risks
Management;
Concept of Kazakhstan on adaptation to climate change (draft), Astana, December 2010, page 33;
3-6 National Communication of the Republic of Kazakhstan to the Conference of the Parties to
UN Framework Convention on Climate change, Astana, 2013;
Climate change: Summary report. Contribution of working groups I, II, III to the Fourth
Assesment Report in 2007 (R.K.Pachauri, A. Reisinger and main team of authors), IPCC,
Zheneve, Switzerland, 2007, page 104.
http://mfa.gov.kz/index.php/ru/vneshnyaya-politika/kontseptsiya-vneshnoj-politiki-rk-na-2014-2020-gg

93
Internet sources:
Website of the UN Development Programme of Kazakhstan http://www.kz.undp.org/;
Website of the World Bank http://data.worldbank.org;
Website of the International Energy Agency http://www.iea.org;
Website of the Global Environmental Facility https://www.thegef.org;
Website of the UNFCCC Secretariat http://www4.unfccc.int;
Website of the Finance Department of Astana http://www.karzhy.astana.kz;
Website of the Information and Legal Support system of the Republic of Kazakhstan Adilet
http://adilet.zan.kz;
News website http://www.inform.kz;
News website BNews.kz;
News website www.kursiv.kz;
News website http://kapital.kz;
News website http://vlast.kz;
Website of the Kazakhstan Climate Change Mitigation Programme (KCCMP)
http://kazccmp.org;