THE SCIENTIFIC METHOD Physics, Chemistry, Biology and Psychology all ask different questions…. But...
45
THE SCIENTIFIC METHOD Physics, Chemistry, Biology and Psychology all ask different questions…. But they all get their answers the same way.
-
Upload
lindsey-boyd -
Category
Documents
-
view
215 -
download
1
Transcript of THE SCIENTIFIC METHOD Physics, Chemistry, Biology and Psychology all ask different questions…. But...

THE SCIENTIFIC METHODPhysics, Chemistry, Biology and Psychology all ask different questions…. But they all get their answers the same way.

Studying people – getting a sample
Population – Not the population of Australia, all people who we are interested in studying.
Eg. All year 11 students, all female police officers, all interstate truck drivers
Sample – Who you use in your study, drawn from population of research interest. Supposed to represent population of research interest

Sampling
Convenience Sampling – selecting participants who are readily available, targeting a specific area etc. Can produce a biased sample.
Random Sampling - A sampling technique, which ensures that every member of the population, has an equal chance of being selected. Can lead to a biased sample.
Stratified Sampling - A sampling technique, which involved dividing the population into distinct strata and selecting a separate sample from each stratum, in the same proportions, as they existed in the population.
The strata are usually characteristics such as e.g. age, sex, religion, IQ scores, cultural background, etc.

Biased sample
Major problem with poorly conducted research
Some sub groups in the population of research interest are not represented at all
Leads to a sample that does not represent the population
Results from a biased sample can not be generalised to a larger population

Hypotheses and Variables Hypothesis – a testable prediction relating to the
outcome of the research being conducted, a prediction that one variable (IV) will effect another variable (DV) in a certain way.
To write a hypothesis we need to know our variables – we are measuring the effect of ________ on _______?
IV DV
Independent variable – the variable that is changed by the experimenter, interested in its effect. We want to see the effect of the IV on the DV
Dependent Variable – measures the effect of the IV, see if the IV has effected the DV

Hypotheses IV’s and DV’s
I want to find out if smoking marijuana will effect driving performance
Independent Variable – smoking marijuana Dependent Variable – Driving a car
It is hypothesised that participants who smoke marijuana will perform worse on a driving test as compared to participants who have not smoked marijuana

The Operational Hypothesis
I want to test the effect of Smoking Marijuana on Driving Performance.
Variables that need to be operationalised Smoking Marijuana Driving Performance The population – who we are testing Operational Definitions Smoking Marijuana – smoking one joint containing 500 milligrams of pure
marijuana (not mixed with tobacco) 20 minutes before taking a driving test Driving Performance -% score on VIC Roads, “Are you Road Ready?”driving
simulator
Operational Hypothesis It is hypothesized that Victorian drivers aged 18 – 25 who have smoked
marijuana (smoking one joint containing 500 milligrams of pure marijuana 20 minutes before taking a driving test) will perform worse on a driving test (obtain a lower % score on the VIC Roads “Are you Road Ready?” driving simulator) compared to participants who have not smoked marijuana.

Experimental Vs Control Groups Experimental Groups Participants are exposed to the experimental condition
(i.e. The IV is present – SMOKE MARIJUANA)
Control Group Participants who are exposed to the control condition (i.e.
the IV is absent- DO NOT SMOKE MARIJUANA)
We compare the experimental group to the control group
Random Allocation All participants who have been selected for an experiment
are just as likely to be in one group as the other.

Sampling

Extraneous Variables
Extraneous Variables – can effect DV A random variable other than the independent variable that can cause
change in the dependent variable and therefore effect the results of an experiment
e.g. Individual Differences among participants - personal characteristics, ability, temperament, motivation etc.
When the effects of an extraneous/uncontrolled variable are confused, or confounded with those of the independent variable, then the extraneous variable has become a confounding variable
What else could effect Driving performance other than Marijuana use? – poor eye sight, driving experience, previous drug use, poor steering wheel quality, poor car etc.

Controlling Extraneous Variables – Research Designs
Repeated Measures Design Each participant is involved in both the experimental
and control conditions This design controls or eliminates any effects that might
be attributed to participant's personal characteristics, since they remain constant
Also known as the within participants design Can suffer from the Order Effect - effect of practice and
fatigue Counterbalancing can help this

Repeated Measures Design

Controlling Extraneous Variables – Research Designs
Matched Participants Design – Paired up Involves selecting pairs of participants who are
similar in characteristics that can influence the dependent variable, on the basis of scores achieved on a pre-test, or a number of pre-tests
Participants are then ranked in accordance with their scores and then one of each pair is allocated to the respective groups (Experimental or Control)

Matched Participants Design

Controlling Extraneous Variables – Research Designs
Independent Groups Design Allocates participants to groups via a random
procedure such as the toss of a coin, or by having each participant draw a numbered ticket from a container that holds the same number of tickets, as there are participants
Then all those who draw an even number might be allocated to the control group and all those who draw an odd number to the experimental group

Independent Groups Design

Research designs – Make all things equal…… except for the IV
All research designs attempt to ensure that the Experimental and Control groups are as similar as possible on all characteristics except for the IV
They aim to make the only difference between the groups whether they were exposed to the IV (experimental group) or not (control group)

The Placebo Effect The placebo effect occurs when a participant's behavioural
response is influenced by their expectation of how they should behave
The expectations of the participants rather than (or as well as) the independent variable, may be affecting the dependent variable and therefore the results
For example, the participants in the above study think that they have had a better nights sleep after taking melatonin. However their experience of having a better nights sleep may have been caused by their expectation that the melatonin would make them sleep better
In this case feeling like they slept better is a result of the belief that they will sleep better not a result of the melatonin (IV) itself.

Controlling the Placebo EffectSingle Blind Procedure A single blind procedure involves allocating participants to groups
so that they are "blind" to the knowledge of which group they are in: experiment or control
For example in the study mentioned above I could give both groups (experimental and control) a pill to take. One type of pill will contain melatonin, the other will be a sugar pill with no active ingredients.
Now participants don’t know which pill they have taken (melatonin or sugar) thus they do not know what group they are in (experiment or control) and their behaviour is therefore not likely to be influenced by their expectations!

The Experimenter Effect
The experimenter effect refers to the actions of the experimenter, rather than (or as well as) the independent variable, affecting the dependent variable, and therefore the results of the experiment
The experimenter effect can take two forms

The Experimenter Effect
Self-fulfilling prophecy - participants behave in line with the way they believe the experimenter wants them to behave because the experimenter unintentionally suggests to the participants how to respond
For example in the study mentioned above the fact that the experimenter knows that it was jimmy who took the melatonin may cause the experimenter to unintentionally treat jimmy differently thereby effecting Jimmy’s responses
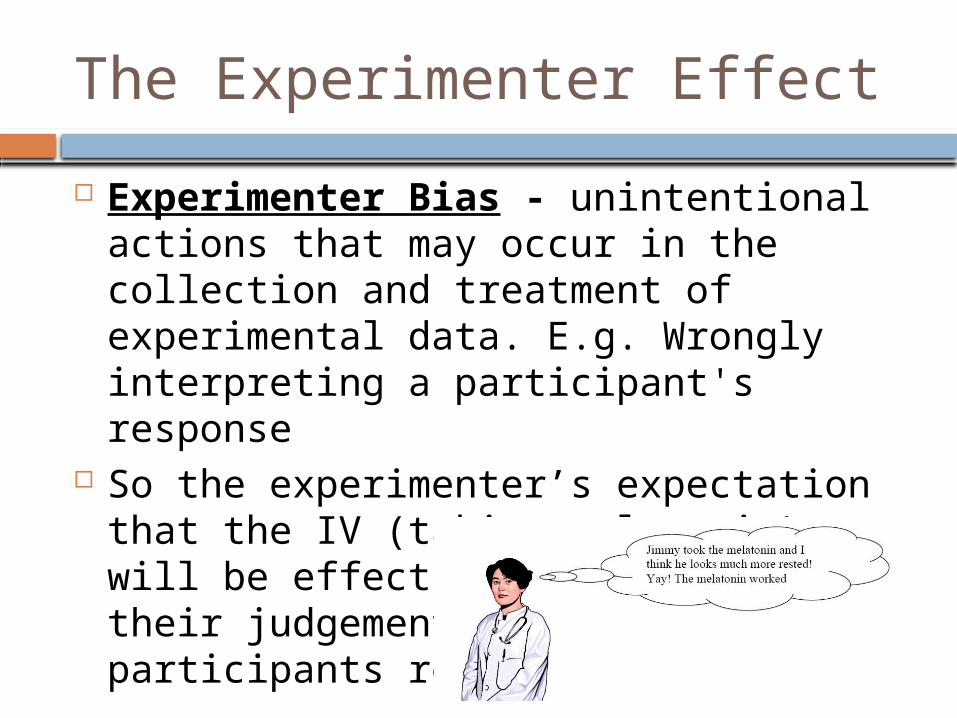
The Experimenter Effect
Experimenter Bias - unintentional actions that may occur in the collection and treatment of experimental data. E.g. Wrongly interpreting a participant's response
So the experimenter’s expectation that the IV (taking melatonin) will be effective has influenced their judgement of the participants responses

Controlling the Experimenter Effect
Double-blind procedure The allocation of participants to groups so that
both the experimenter and the participants are "blind" to the conditions to which the participants have been allocated
For example in the study mentioned above I could get research assistants to hand out the pills so my experimenters don’t know who is in which group
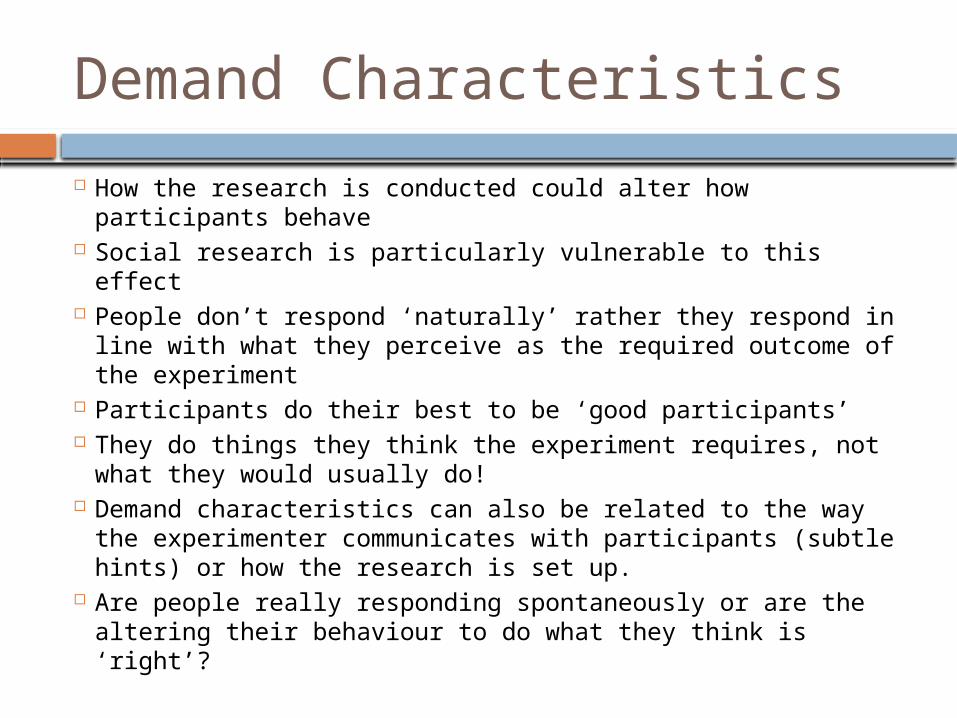
Demand Characteristics
How the research is conducted could alter how participants behave
Social research is particularly vulnerable to this effect People don’t respond ‘naturally’ rather they respond in
line with what they perceive as the required outcome of the experiment
Participants do their best to be ‘good participants’ They do things they think the experiment requires, not
what they would usually do! Demand characteristics can also be related to the way
the experimenter communicates with participants (subtle hints) or how the research is set up.
Are people really responding spontaneously or are the altering their behaviour to do what they think is ‘right’?

Artificiality
Simply being in a lab can change the way people respond
Trying to study ‘real life’ while in the lab is a problem
Can limit the ability to generalise from the lab results

Non standardised procedures Not all participants are treated the same
or receive identical instructions or conditions
A source of extraneous variables
Researchers always try to avoid this at all costs!

Descriptive Statistics
Help us describe our data Do NOT allow us to draw conclusions
about what our data mean…. Did the IV effect the DV?
Mean – the average Median – the middle score Mode – the most frequently occurring
score

Inferential Statistics
Allow us to draw inferences – that is to make conclusions
Allow us to decide whether or not any change in the DV was caused by the IV
Calculate the Probability of Chance Could these results happen just by
chance? We want a very low probability of
chance!

Probability – the P value
P values are recorded as a decimal score Eg. if P < 0.05 (5%) means that there is less
than a 5% or 5 in 100 chance that the results of a study are just a fluke
As the probability of chance is very low we can assume that the results are meaningful – that is that the IV did in fact cause a change in the DV
Two most common are <0.05 and <0.01 (less than 1% chance)

P<0.05…..pretend it’s shark teeth, must focus your attention on where the shark is facing!

The Significance Booze Bus
For results to be considered significant the probability of chance must be at and below 5% In other words p < 0.05

If you get a result OVER 0.05, it’s a ‘bad result.’
(due to chance) (E.g. p<0.80)
If you get a result of 0.05 and under, it’s a ‘good result.’
(due to IV) (E.g. p<0.02)

Ethics- doing the right thing! Beneficence – did the benefits of this procedure
outweigh the potential risks? Respect for persons – were the welfare, rights,
cultural heritage etc. of the participants respected?
Integrity – did this procedure/research genuinely show the potential to advance our understanding of the brain?
Justification – is the use of this particular participant justified, do they represent the norm, will others benefit from the generalisation of these results.

Participants’ rights
1. Informed consent2. Withdrawal rights3. Deception?4. Debriefing5. Confidentiality

Ethics committees -
Ensure the study designed to meet national guidelines
Ensure researchers adequately qualified
Monitor progress
Handle complaints
Ensure accountability (responsibility) of researcher

Reliability
Do we get the same results over and over again when using the same test?
Consistency, dependability, stability of test results A ruler should not be stretchy! Otherwise I would
get different measurements every time I measured things
Doing a personality test should yield similar results for the same person tested on different days
Internal consistency – do all questions on a test measure the same thing?

Validity
Are you measuring what you think you are measuring? For example the Coke Vs Pepsi study? This study was reliable in that it consistently showed
that people preferred the letter Q to the letter M It was however not valid as it was not measuring what
it aimed to measure
Construct validity – when a measurement tool has evidence to suggest it relates to the behaviour being tested
If the VCE had construct validity it would correlate well with university performance and career success

Validity
Internal validity – when a research design is appropriate to measure an specific behaviour
No major flaws in sampling, control of variables etc.
External validity – how far can the results be generalised beyond the research participants
Can other researchers replicate the study and its results with different samples and populations?

Qualitative Vs Quantitative data Qualitative data – qualities,
descriptions, meanings, pictures, don’t use numerical values
much more time consuming and hard to compare
Quantitative data – quantities, how much, numerical, means p values etc.
Easier to compare and analyse

Case studies
Intense in-depth investigation of an individual or small group
Can involve a combination of data collection techniques
Phineas Gage was a case study Advantages – avoid artificiality, detailed
information of thoughts, feelings and behaviours, could lead to hypothesis for further research
Limitations – cannot test a hypothesis, cannot be replicated, time consuming, prone to experimenter effect, can be skewed by the participant

Observational studies
Watching and recording behaviour as it occurs Can occur in the lab or as a field study Naturalistic observation – in the field,
watching things happen in their natural environment
Non participant observation - spying - but we wont call it that because it sounds rather suspicious!
Participant observation – going undercover as a part of the group being observed (Rosenham, 1973)

Observational studies
Advantages – seeing behaviour in natural setting, effects of environment observable also
Allow research into areas in which controlled research would be unethical – i.e wild children
Disadvantages – no informed consent, difficult to determine causality, prone to experimenter bias

Self reports
Questionnaire / survey Face to face interview
•Written responses by participant•Fixed response questions•Open ended questions
•Data collected by interviewer•Fixed response questions•Open ended questions
•Structured interviews – set questions etc.•Unstructured interviews – free flowing conversation but with a certain aim

Self reports
Advantages – very efficient way of collecting large amounts of data, anonymity could enable sensitive questions to be asked, often easy to collate and summarise data
Disadvantages – do people really know what they think? Are they honest or do they just want to look good? Unstructured or free response takes time and hard to summarise, lack of control makes it hard to compare participants

M&m’s activity for stratified sampling
Population- Place all the m&m’s into different strata (categories) according to colour.
Sample- you need to select a sample (smaller version of the population) and take a proportion of m&m’s from each strata, that represent the population of m&m’s.
E.g. population- 50 red, 30 blue, 20, orange, 10 green
sample- 5 red, 3 blue, 2 orange, 1 green