The Science of Failure - NASA
104
The Science of Failure (Systems Health Monitoring for Satellite Systems) Diagnostics and Prognostics Group Discovery and Systems Health Area Intelligent Systems Division NASA Ames Research Center Wendy A. Okolo, Ph.D. Team: Indranil Roychoudhury, Lilly Spirkovska, Kai Goebel, Edward Balaban Chetan Kulkarni, John Ossenfort, Chris Teubert, Molly O’Connor Acknowledgements: Matthew Daigle & Shankar Sankararaman, Former Team-Members Zainab Saleem & Elizabeth Torres De Jesus, Former Interns Prognostics & Health Management Society University of Tartu, Summer School – Microsatellites and their use in Planetary/Astrobiology Research. August 5 th – 12 th , 2018. T t Et i
Transcript of The Science of Failure - NASA

The Science of Failure (Systems Health Monitoring for Satellite
Systems)Diagnostics and Prognostics Group
Discovery and Systems Health AreaIntelligent Systems Division
NASA Ames Research Center
Wendy A. Okolo, Ph.D.
Team: Indranil Roychoudhury, Lilly Spirkovska, Kai Goebel, Edward BalabanChetan Kulkarni, John Ossenfort, Chris Teubert, Molly O’Connor
Acknowledgements: Matthew Daigle & Shankar Sankararaman, Former Team-Members
Zainab Saleem & Elizabeth Torres De Jesus, Former InternsPrognostics & Health Management Society
University of Tartu, Summer School – Microsatellites and their use in Planetary/Astrobiology Research. August 5th – 12th, 2018. T t E t i
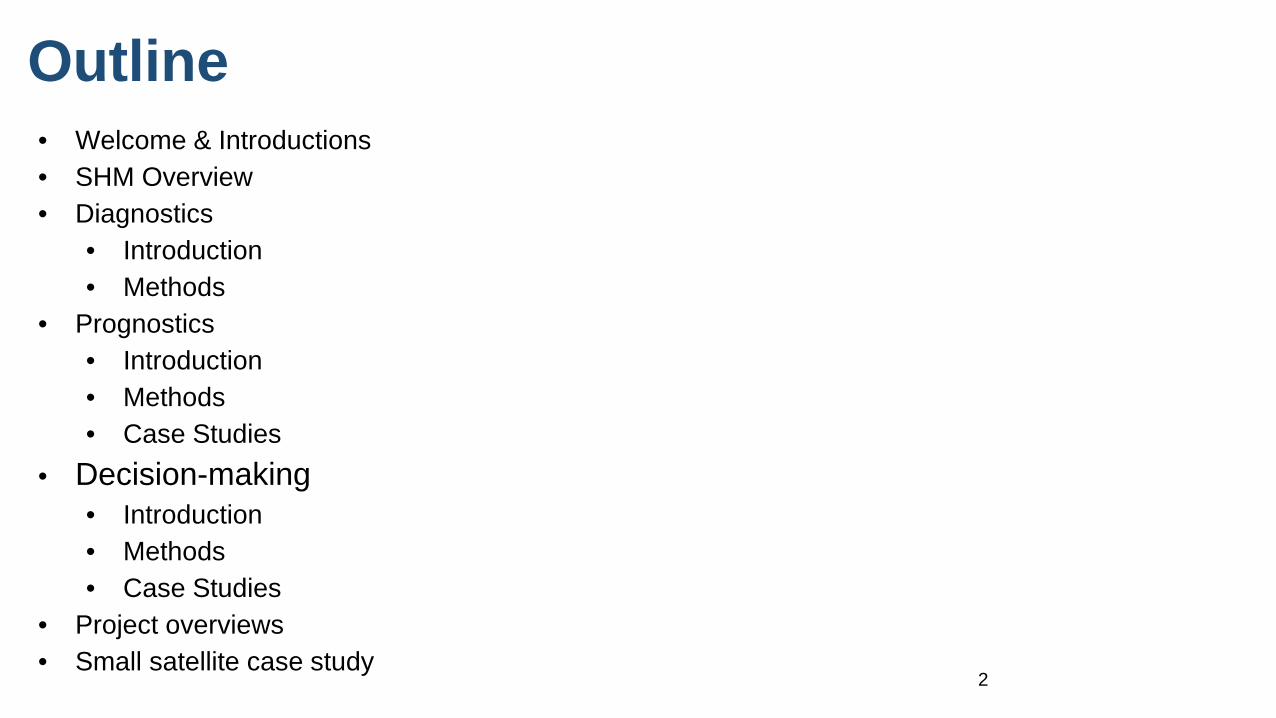
Outline• Welcome & Introductions• SHM Overview• Diagnostics
• Introduction• Methods
• Prognostics• Introduction• Methods• Case Studies
• Decision-making• Introduction• Methods• Case Studies
• Project overviews• Small satellite case study
2

Overview: Real Time Safety Monitoring and Prediction of Unsafe Events in the National
Airspace
3

Motivation• National Airspace System (NAS) ensures safety through rules, regulations, and response procedures• Air traffic in the NAS projected to increase in the near future
• Advanced decision-making tools required to maintain the current level of NAS safety• Optimal decisions require knowledge of both current and future state of the NAS
• At present, different stakeholders of NAS (e.g., pilots, flight controllers) rely on their situational awareness to make informed decisions to avoid unsafe events• Consolidate information from disparate sources• Apply their domain knowledge to interpret current and forecast
NAS state• Interact with multiple independent tools and mentally integrate
the information• Uncertainty is typically not handled in a formal and
rigorous manner• Safety assessment tools typically focus on a few threats
• Their assessments mostly independent of other threats
4
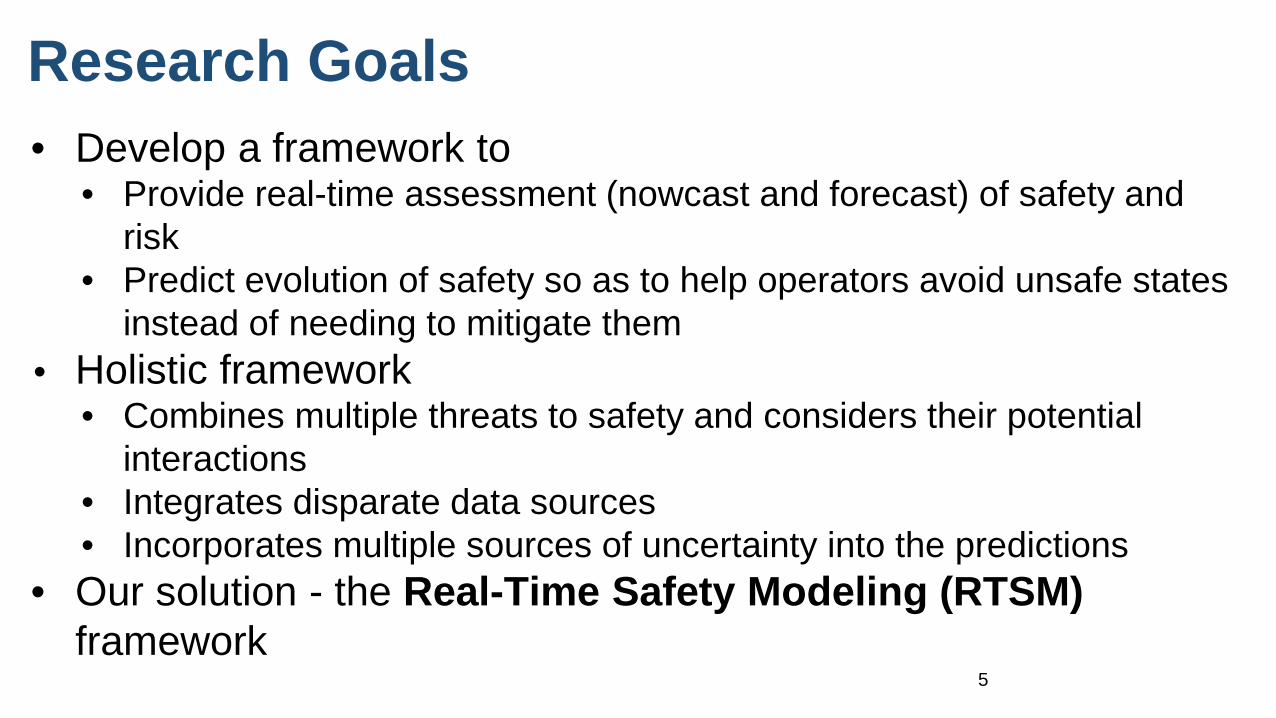
Research Goals• Develop a framework to
• Provide real-time assessment (nowcast and forecast) of safety and risk
• Predict evolution of safety so as to help operators avoid unsafe states instead of needing to mitigate them
• Holistic framework • Combines multiple threats to safety and considers their potential
interactions• Integrates disparate data sources• Incorporates multiple sources of uncertainty into the predictions
• Our solution - the Real-Time Safety Modeling (RTSM) framework
5

Approach• Safety Analysis & Modeling
– What are the hazards to safe flight?– What unsafe events can occur?– Which hazards/events occur most frequently?
• Real-Time Safety Monitoring– How do we define “safety” and “risk” in the
NAS?– How do we measure/quantify it?– How do we estimate the current state?
• Safety/Risk Prediction– Which unsafe events are likely to occur in the
future, if no corrective action is taken?– What do different NAS users need to be aware
of?
Monitoring
Prediction
NAS
Flight tracks, flight plans, weather, etc.
Estimate of current state of NAS safety, risk estimates
Future state of NAS safety, unsafe event prediction
6

Safety Analysis• Identify hazards that
compromise safety by analyzing reports from several national incident and accident databases– Generally categorize into
airspace, human performance, and environmental categories
– Down-select hazards based on potential to model, monitor, and predict
• Identify unsafe events that result from hazards
NTSB ASRS FAA ……
Hazards- Inoperative Navaid- Excessive Communication- Procedure Complexity- Low Visibility- Turbulence- Icing
Events- Loss of separation- Evasive maneuvers- Go around or rejected takeoff- Unstable approach- Convective weather encounter
7

Definitions• Unsafe event: An event/situation that compromises NAS safety or established
safety standards– Examples: loss of separation, loss of control, controlled flight into terrain,
runway incursion, hard landing, tail strike, collision, etc.
• Hazard: A condition that potentially contributes to unsafe events
– Examples: convective weather, poor visibility, difficult terrain, etc.
• Safety metric: A quantitative measure of some aspect of safety of the NAS
– Examples: distance between two aircraft, distance between aircraft and convective weather region
• Safety threshold: Some limit on a safety metric or set of safety metrics
– Example: Enroute separation of 5 nautical miles
• Safety margin: “Distance” between current safety metric(s) and safety threshold(s)
8

Safety Modeling• What categories of events can occur?
• Loss of separation, wake vortex encounter, convective weather encounter, sector demand violation, etc.
• What conditions define the occurrence of the event?• Defined as some function of the NAS state• Example 1: Loss of separation between A1 and A2 occurs when the horizontal
separation is less than 5 nautical miles and the vertical separation is less than 1000 ft• Example 2: Sector demand is too high when the number of aircraft in a sector meets
or exceeds the capacity limit• How do we compute the safety margin w/r/t an event?
• Margin = {“distance” to event threshold}/threshold and expressed as a percentage• Therefore, Margin is 0% when event is present
• How do we compute aggregate safety margins?• Example: Average safety margins over all potential events
9

Computational Architecture
NAS Monitoring PredictionInputs
Measured State
Hidden State
Estimate
Safety Margin Values
Predicted State
Predicted Safety Margins
Predicted Times of Occurrence of Unsafe Events
Probability of Future Occurrence of Unsafe Events
(in next x minutes)Computation can be distributed to different regions of the NAS and
consolidated for system-level safety assessment
Model-based framework• First principles models of NAS
components (aircraft dynamics, weather, wake vortex, etc.)
• Safety metrics & thresholds
Set of Unscented
Kalman Filters
Monte Carlo Prediction
10

State space X
State x``(kh)
State x`(kh)
State x``(kh)Loss of
Separation A1-A2
Sector Demand Violation ZOA12
State x(ko)
Conceptual Framework
11

Distributed Computational Architecture
12

Prediction
13

Extension to Airport Surface Operations
14

Motivation
“While commercial aviation has made extraordinary strides in safety, one area where risk remains is on the airport surface. The bottom line is planes shouldn’t run into each other in the air or on the ground.”
- NTSB Spokesman
15

Hazard Analysis
• Over 600 accident reports queried spanning multiple decades• Flight phases: Standing, taxi, takeoff, and landing• Locations: Ramp, taxiway, runway• Databases: NTSB and ASRS primarily
• Results:• Human factors primarily• Weather Conditions• Aircraft equipment
16
NTSB ASRS Skybrary ……

Ground Incident Classification
• Predictable incidents:• Can be measured, modeled, and predicted using real-time data e.g. failure to
maintain clearance from another aircraft during taxi → relevant data precursor, distance
• Unpredictable incidents:• Cannot be measured, modeled, or predicted using the RTSM framework1 e.g. flight
attendant tripping and falling• Runway incursions by foreign object• Failure to follow current operating standards and procedures• Equipment failure such as nose landing gear separation• Inadvertent throttle movement by flight crewmember
17
[1] NTSB Report No. ERA11CA010, CHI06LA016, NYC02LA042[1] NTSB Report No. LAX05LA218[1] NTSB Report No. NYC05LA043, CHI01LA066[1] NTSB Report No. CHI99LA289, FTW99FA201, CHI93FA129 MIA99LA026[1] NTSB Report No. ENG08IA042, CHI00FA244, CHI00LA296, LAX07IA191[1] NTSB Report No. CEN11IA270

Predictable Incidents• Aircraft - Aircraft Ground Collisions During Taxi
– Wingtip/Winglet impacts tail of adjacent aircraft– Wingtips not visible from cockpit for certain transport a/c
• Collisions During Pushback– Failure of tug driver to maintain clearance during
pushback– Lack of situational awareness, inadequate visual lookout,
overestimation of proximity, & lack of communication between wing walker & tug operators
• Weather-Related Incidents1
– Ground contamination: Snow, ice, rain, slush– Presence of deicers on taxiways & ramps– Decreased visibility
[1] NTSB Report No. DCA09MA021[1] NTSB Report No. ATL02LA029, CEN09LA093, NYC05LA038, NYC02LA056[1] NTSB Report No. ATL04LA053, CHI08LA051[1]NTSB Report No. DCA16CA070[1] NTSB Report No. NYC06LA074, DCA14CA051, ANC07LA008, DEN06IA008, DEN05LA048[1] NTSB Report No. DCA13CA035[1] NTSB Report No. FTW02LA088, CHI06LA092, DFW07LA155
18

Development of Safety Metrics
• Safety Metric (SM)• SM Function Arguments• SM Function Outputs• Threshold Equations• Required Data
19

Safety Metrics
20
Safety Metric (SM) Safety Metric Function Arguments Safety Metric Function Outputs Threshold Equation Example Required Data Examples
Weather at coordinate point of interest, time matrix of all weather categories(e.g., precipitation,wind, temperature, etc.)and their relevant properties (e.g., type, direction, severity, persistence, etc.)
A threshold is needed for eachelement of the matrix. Examples: thunderstorm.began = :08, precipitation.type = ice_pellets.
Current weather; forecast weather
Surface visual range (SVR) (aka visibility) point of interest, time, {weather at coordinate} Distance in feet SVR > 50 ft As required by “Weather at coordinate” SM
Ground services operating status Volume of interest, time matrix of all service categories(e.g., lights,tracking coverage, runways, etc.) and operational status (e.g.,Inoperative, nominal)
servicesOperatingStatus.asde_x = NOMINAL NOTAMs
Degree of taxi route normalcy {Airport configuration at time t}, {airport configuration at time t+5},{probability of ramp/taxiway/runway congestion}, {surface facilities operating status}, off-nominal ops (e.g., priority aircraft, etc.)
NOTAMs (Notice to Airmen) regarding closed taxiways, standard taxi routes, expected airport reconfiguration
Taxi complexity Taxi clearance, time, {weather at coordinate}, {degree of taxi route normalcy}
complexity category, e.g., low, medium, high taxiComplexity < MEDIUM Airport layout, location of hot spots, taxi clearance
Airport configuration at a given time time, {weather at coordinate} Runways in use, taxi routes in use Current and forecast weather, especially wind; airport layout; standard operating procedures; traffic forecasts
Risk of aircraft collision with aircraft/vehicle/structure
position, heading, and speed of ownship, position, heading and speed of other aircraft /vehicle/structure, {probability of ramp /taxiway/runway congestion}
nearest distance (ft), risk category, e.g., none, low,medium, high
ProximityViolation = NONE Precise position and heading; aircraft type; winglet type; aircraft dimensions; weather; airport structures location and dimensions
Probability of ramp/taxiway/runway contamination Point of interest, time, {weather at coordinate} probability of all contaminationcategories such as ice e.g., blackice, slush, etc.; water; {FOD debris}; dead animals
rwyContamination.blackIce = 0 Current and forecast weather; PIREPs; runway condition reports;
Probability of vehicle loss of control on the ground (LOC-G)
point of interest, time, {probability of taxiway contamination}, {weather at coordinate}
risk category, e.g., none, low,medium, high
VehicleLOCG <= LOW Current and forecast weather providing information about surface icing
Risk of drifting Foreign Object Debris (FOD-G) Point of interest, time, {weather at coordinate}, FOD at nearby coordinates
risk category, e.g., none, low, medium, high FODGRisk <= LOW FOD existence (e.g., camera-fed image recognition)
Risk of jet blast point of interest, time risk category, e.g., none, low, medium, high jetblastRisk <= LOW Precise position and heading of all operating aircraft
Probability of ramp/taxiway/runway congestion {airport configuration at a given time}, {weather at coordinate}, {aircraft at coordinate}
Comparison to expected congestion, i.e. low, normal, high probCongestion <= NORMAL Data required for the helper functions
Probability of pilot error during ground ops Pilot id, time, {taxi complexity}, {visibility conditions} probability in percentages pilotErrorProb < 10% Position and heading of aircraft, plus all the data required for the helper functions
Probability of controller error on ground ops Controller id, time, {Ground service operating status}, {taxi complexity},{Controller workload}
probability in percentages controllerErrorProb < 1% Data required for the helper functions

Airport Reconfiguration
21

Motivation
• Runway configurations depend on current and predicted traffic demand, wind speed and direction coordinated between controllers, pilots, and ground personnel
• Can be disruptive and challenging for human decision makers• Optimization methods do not systematically handle uncertainty associated
with meteorological conditions, arrival & departure demands, and other variables
Approach: Markov Decision Process
22

Markov Decision Process Framework
• Markov Property: The effects of an action taken in one state depend only on that state and not on the prior history.
• An MDP model is a tuple (S, A, T, R):• A set of possible states S• A set of possible actions A• A real valued reward function R(s, a)• State Transition Probability Function, T• Uncertainty in outcome after action is taken
• Goal: Generate optimal policy using tuple instead of static planning • Dynamic planning with multiple step look-ahead
23

Reconfiguration Example
24

MDP Elements for Runway Reconfiguration
• Using landing crosswind limit of 20 knots and tailwind limit of 15 knots
• Zero degree north• Assume transition outside
of runway is deterministic• Transition function on
runway:i.e. probability of a landing or a missed approach →
25
0 degrees, positive CW

Summary Slide
• RTSM Framework for NAS Safety Monitoring and Prediction• Airport Surface Operations
• Hazard analysis using NTSB & ASRS databases• Large number of unpredictable incidents• Predictable incidents - may be monitored, predicted, and mitigated with relevant
safety precursors using RTSM framework• Airport Reconfiguration Problem
• Optimal runway reconfiguration• Minimize frequency & handle uncertainty • Markov Decision Process Framework • Prototype implementation - Single runway, two aircraft
26

SHM for Satellites
27

Developing a conceptual prognostics and health management (PHM) framework for small satellites in swarm formations; enabling predictions of possible failure times and the remaining useful life of the satellite(s), components and subsystems; to ultimately further autonomous exploration for space and science missions
❏ System Health Monitoring❏ Prognostic Approaches❏ Remaining Useful Life RUL Estimation❏ Current and Future Space Missions❏ Goals for Satellite Missions❏ Satellite and Systems Health Monitoring❏ Satellite Subsystems❏ Satellite Subsystems Anomalies and Failures❏ Attitude and Orbit Control Subsystem❏ Anomalies and Failures in AOCS❏ System Health Monitoring and AOCS❏ PHM Frame work for AOCS
Scope

System Health Monitoring
• Prognostics provides the decision maker an early warning about the expected time to system/subsystem/component failure
Data acquisition Diagnostics Prognostics Decision
Making
Collection condition
monitoring data & extract features
What is the fault and how severe is it?
What is the remaining useful life?
Optimal management on maintenance and
logistics

Prognostics approaches
Accurateprediction
Physics-based
Data driven
Hybrid approach
Degradation data+
usage conditions
Physics with physical model
Extrapolation with mathematical
function
Degradation data (training data)
AI approaches
Statistical approaches
Physics based
Data driven
Model para.
Co-efficient
Degradation & RUL prediction
Moreinformation
Prognostic Approaches
1. Kim, N.-H., An, D., & Choi, J.-H. (2017). Prognostics and Health Management of Engineering Systems: Springer International Publishing.

Remaining Useful Life RUL Estimation
1. Kim, N.-H., An, D., & Choi, J.-H. (2017). Prognostics and Health Management of Engineering Systems: Springer International Publishing.

RUL MethodologiesRemaining Useful Life
Estimation Methodology
Model Based
Physical Model
Cumulative Damage
Hazard Rate Proportional Hazard
Rate
Nonlinear Dynamics
Data Driven
Neural Network
Support Vector Machine
Bayesian Network
Hidden(Markov, semi markov)
Hybrid
Statistical Model
Fourier Transform with Neural Network
Statistical Model with Neural Network
Fuzzy Logic with Neural Network
Wavelet Transform Analysis with Statistical
Model
Dynamic Wavelet with Neural Network1. .Ahmadzadeh, F., & Lundberg, J. (2014). Remaining useful life estimation. International Journal
of System Assurance Engineering and Management, 5(4), 461-474.

Current and Future Space Missions• Categorization of thirty-nine multi-satellite missions based on their mission type, formation type and
number of satellites
1. Bandyopadhyay, S., Foust, R., Subramanian, G. P., Chung, S.-J., & Hadaegh, F. Y. (2016). Review of formation flying and constellation missions using nanosatellites. Journal of spacecraft and rockets.
2. Bandyopadhyay, S., Subramanian, G. P., Foust, R., Morgan, D., Chung, S.-J., & Hadaegh, F. (2015). A review of impending small satellite formation flying missions. Paper presented at the 53rd AIAA Aerospace Sciences Meeting.

continued
❏ Categorization of thirty-nine multi-satellite missions based on their mission status, leading organization and funding source
1. Bandyopadhyay, S., Foust, R., Subramanian, G. P., Chung, S.-J., & Hadaegh, F. Y. (2016). Review of formation flying and constellation missions using nanosatellites. Journal of spacecraft and rockets.
2. Bandyopadhyay, S., Subramanian, G. P., Foust, R., Morgan, D., Chung, S.-J., & Hadaegh, F. (2015). A review of impending small satellite formation flying missions. Paper presented at the 53rd AIAA Aerospace Sciences Meeting.

Goals for Satellite Missions• The goal of future space missions is autonomy, with the following requirements
identified in the literature• Self-requirements
• self-trajectory • self-protection • self-scheduling • self-reparation
• Knowledge• Awareness• Monitoring• Adaptability• Dynamicity• Robustness• Resilience• Mobility
1. Vassev, E., & Hinchey, M. (2014). Autonomy Requirements Engineering for Space Missions: Springer.

Maintenance planningMission Planning Etc.
Systems
Decision Management
PrognosticsComponent RULFuture capabilities Etc.
Enhanced Diagnostics
Preprocessing
Feature Extraction
De-noisingFiltering Etc.
Signal StatisticsEstimated parametersEtc.
Fault statusSystem capabilitiesEtc.
Sensor Data
Decisions
Preprocessed Data
FeaturesDiagnosis
Remaining Useful Life
Satellite and Systems Health Monitoring
1. Fong, C. M., and Hui, S. C. An intelligent online machine fault diagnosis system. Computing and Control Engineering Journal, Oct. 2001.

Satellite Subsystems
• On-board Data Handling System (OBDH)• Power System (EPS)• Communication System - Inter-Satellite Link & Data Downlink and/or Uplink
(COM)• Thermal Control System (TCS)• Structure (MECH)• Attitude and Orbit Control System (AOCS)• Payload (PL)

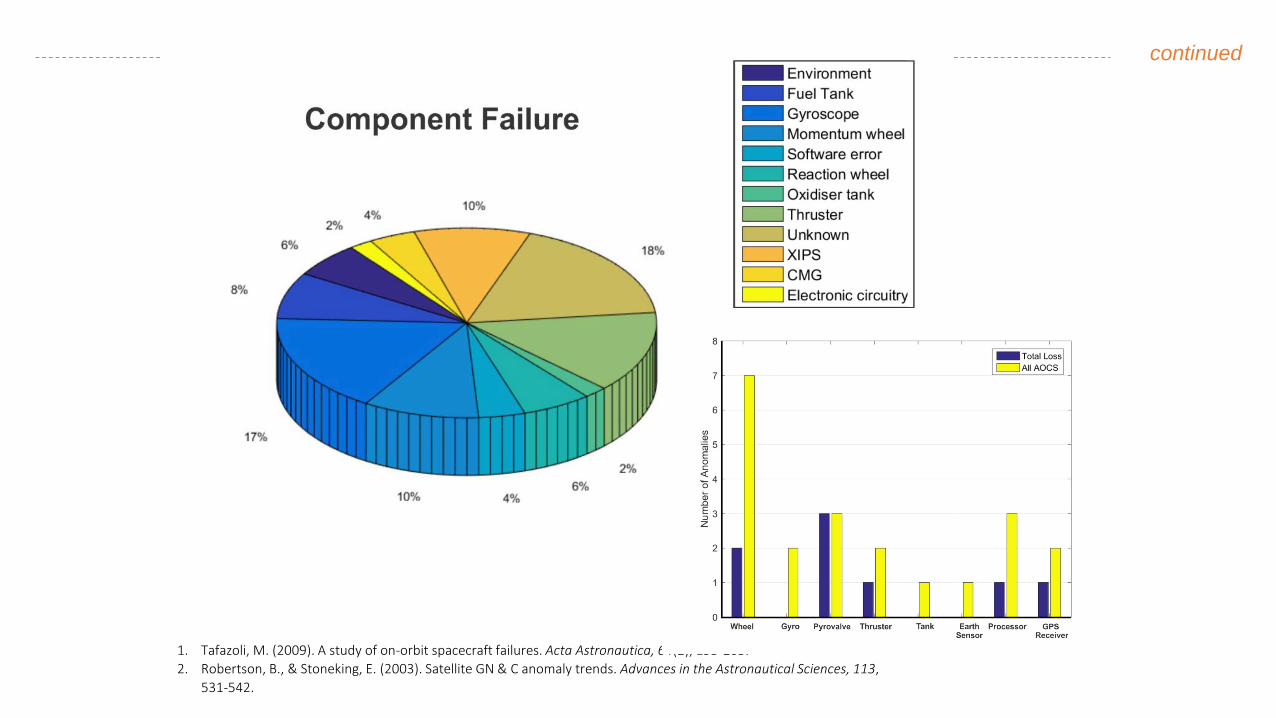
Satellite Subsystems Anomalies and Failures
1. Tafazoli, M. (2009). A study of on-orbit spacecraft failures. Acta Astronautica, 64(2), 195-205. .

continued
1. Wayer, J. K., Castet, J. F., & Saleh, J. H. (2013). Spacecraft attitude control subsystem: Reliability, multi-state analyses, and comparative failure behavior in LEO and GEO. Acta Astronautica, 85, 83-92.

continued
1. Wayer, J. K., Castet, J. F., & Saleh, J. H. (2013). Spacecraft attitude control subsystem: Reliability, multi-state analyses, and comparative failure behavior in LEO and GEO. Acta Astronautica, 85, 83-92.

continued
1. Robertson, B., & Stoneking, E. (2003). Satellite GN & C anomaly trends. Advances in the Astronautical Sciences, 113, 531-542.

SHM for AOCS Subsystem

Attitude and Orbit Control
continued
1. Tafazoli, M. (2009). A study of on-orbit spacecraft failures. Acta Astronautica, 64(2), 195-205.2. Robertson, B., & Stoneking, E. (2003). Satellite GN & C anomaly trends. Advances in the Astronautical Sciences, 113,
531-542.

continued
1. Barua, A., & Khorasani, K. (2011). Hierarchical fault diagnosis and health monitoring in satellites formation flight. IEEE Transactions on Systems, Man, and Cybernetics, Part C (Applications and Reviews), 41(2), 223-239.

PHM Frame work for AOCS
• Model based prognostics algorithms to predict the remaining useful life of AOCS components using a probabilistic approach incorporating the uncertainty model for each component to estimate the RUL of the complete AOCS system for the satellite.
• This information will be useful for the formation to maintain their position or to reconfigure within the estimated time for uninterrupted mission deliverables


State Estimation
Health Management Approach
Actuator Control CommandsPlant (GNC) AOCS Model
Reference statistical
model parameters
Fault Detection
Useful life remaining RUL / EOL
Actuator Response
Prognostics
Residual
ModelPrediction
Fault identification
Diagnostics

Conclusion
• SHM for small satellites is important for autonomy• AOCS contributes to about 32% of all on-board failures• AOCS is a critical component in satellite formation flying• Telemetry data for deep space missions of small satellite is unavailable• 84% of all AOCS anomalies and failures are from related to design and
operations• ISHM will provide useful information to designers for more robust design
Background
Tafazoli, M. (2009). A study of on-orbit spacecraft failures. Acta Astronautica, 64(2-3), 195-205. doi:10.1016/j.actaastro.2008.07.019
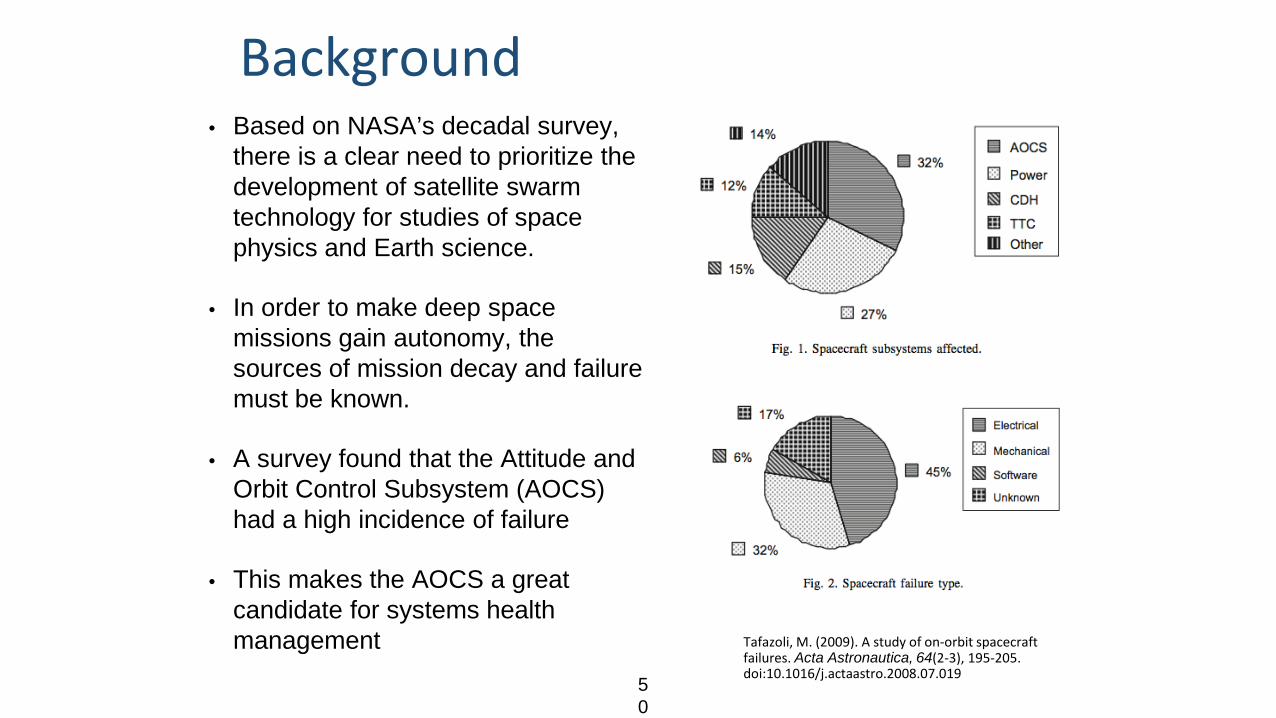
• Based on NASA’s decadal survey, there is a clear need to prioritize the development of satellite swarm technology for studies of space physics and Earth science.
• In order to make deep space missions gain autonomy, the sources of mission decay and failure must be known.
• A survey found that the Attitude and Orbit Control Subsystem (AOCS) had a high incidence of failure
• This makes the AOCS a great candidate for systems health management
50

What is the AOCS?❏ This stands for Attitude and Orbit Control
System, but it may also be called Attitude Determination System (ADS) or Attitude Determination and Control Subsystem (ADCS).
❏ This is the subsystem that stabilizes the spacecraft and orients it in desired directions during its operation.
51

Scope
Determine component for study
Obtain modeling sources
Model nominal and faulty operation
52

Component Determination❏Magnetorquers
❏Reaction Wheels
❏Momentum Wheels
❏Control Momentum Gyros (CMGs)
❏Thrusters
Actuators
53

Component Determination❏ Relevance: is it suitable for future satellite
missions?❏ History: does the component have records of
failure?❏ Benefits: what are the pros of using this
actuator?
54

Component Determination❏Magnetorquers
❏Reaction Wheels
❏Momentum Wheels
❏Control Momentum Gyros (CMGs)
❏Thrusters
ActuatorsPointing accuracy
Low energy consumption
Known cause of missiondecay and failure
55

Reaction Wheels
❏The Reaction Wheel Assembly (RWA) is an actuator which in essence consists of a flywheel attached to a brushless DC motor.
❏They produce a torque that is applied to the spacecraft to correct its position.
Source: Blue Canyon Technologies
56

❏A minimum of three reaction wheels, one per body axis, is required to maintain attitude
❏Reaction wheels are used for zero-momentum control or momentum-bias control on ADCS, which are the two forms of three-axis control
From US patent: Onboard attitude control using reaction wheelsSource: Blue Canyon Technologies 5
7

Obtain modeling sources❏ What needed to be determined?❏ Parameters❏ Model ❏ Faults
58

Schematic of an AOCS Actuated by RWA
Reaction Wheels
Spacecraft DynamicsController
Td,external
Φm
θm
ψm
Tc
59
ΣΣΦc
θc
ψc
Φe,θe,ψe

Equations❏ Mechanical:
Tm - Tf + Td = Jω❏ Electrical:
VR = VS - Vemf
VR = k∫(ic-im) - kemfω
.Motor torque
Disturbance torque
Friction torque
Resistance Voltage
CommandedVoltage
Back EMFVoltage 60

Parameter Notation ValueTorque constant km 5.88 mNm/A
Back EMF constant kemf 5.89 mNm/A
Inertia of rotor J 1.12x10^-6 kg-m2
Resistance R 6.67 Ω
Number of poles N 8
Viscous friction coefficient b 5.1965x10⁻⁷ Nms
Static Imbalance s 1.2 g-mm
Dynamic Imbalance d 20 g-mm2
Gain k 220 V/A*s
Source: Maxon Motor
61

Motor disturbances
❏Torque Ripple: result of the drive torque being a superposition of rectified sine waves. The torque ripple of a motor with a greater number of poles is at a higher frequency, where it is less problematic.
❏Cogging torque: is a result of the magnets in the rotor moving past a ferromagnetic
Markley, F. L. & Crassidis, J.L. (2014). Fundamentals of Spacecraft Attitude Determination and Control, 195-205. Springer.62

❏Cogging torque (f1): where C is the amplitude of the cogging torque, N is the number of poles, and ω is the angular speed
❏Torque Ripple (f2): where B is the amplitude of the cogging torque, N is the number of poles, and ω is the angular speed
Khorasani, K, & Sobhani-Tehrani, E. (2009). Fault Diagnosis of Nonlinear Systems Using a Hybrid Approach. Springer.63

Flywheel Imbalances
❏ Static imbalance: condition that the wheel’s center of mass is not on the axis of rotation.
❏ Dynamic imbalance: condition that the axis of rotation of the wheel is not on the principal axis.
Markley, F. L. & Crassidis, J.L. (2014). Fundamentals of Spacecraft Attitude Determination and Control, 195-205. Springer.
Shields, J et. al (2017). Characterization of CubeSat Reaction Wheel Assemblies. Journal of Small Satellites, 6(1), 565-580. 64

Simulation Scenarios
❏Using three different inputs, the following scenarios were simulated:
1. Nominal operation
2. Loss of effectiveness of motor torque: kmf1=0.7kmn
3. Voltage disturbance: V_f = 1.5*sin(30*t)
4. Change in friction: including Coulomb friction, c=0.00103 65

Simulink Model
Motor Dynamics
Flywheel Imbalances
Motor disturbances
66

Nominal Operation
67

68

69

70

71

72

73

Faulty Operation
74

Fault 2:Voltage Disturbance
Fault 1:Efficiency loss
Fault 3:Increase in friction
Fault 4:Increase in current with increase in friction
75

Fault 1: kmf1=0.7kmn
76

77

78

79

80

81

=1.5*sin(30*t)
82

83

84
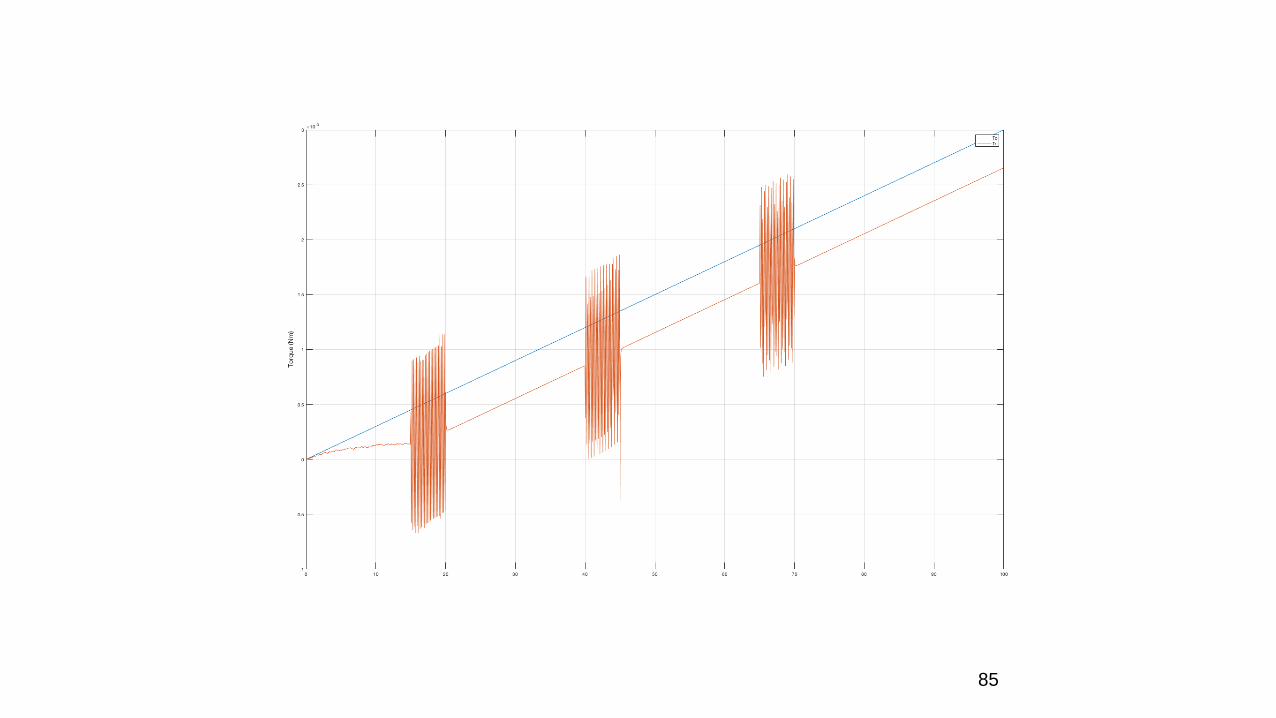
85

86

87

Increase
88

89

90

91

92

93

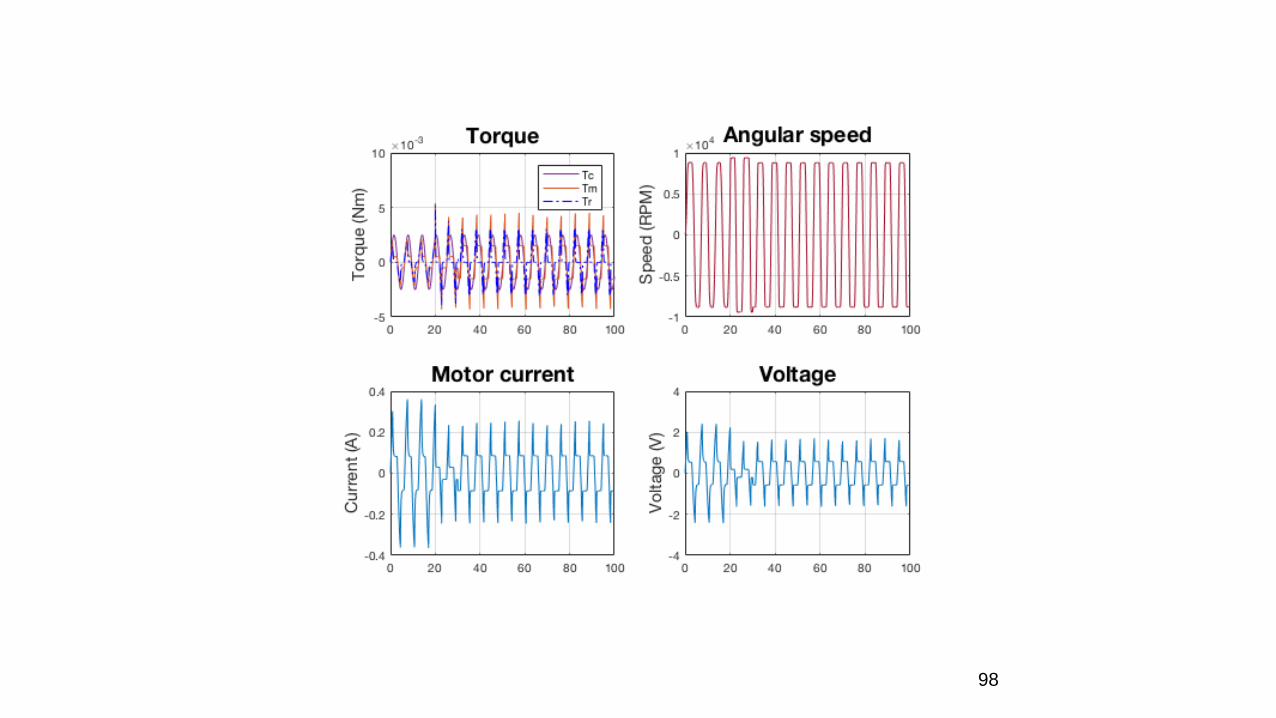
Fault 4: kmf4=0.7kmn
94

95

96

97
98

99

Ripple and Cogging
100

Next Steps
❏ Compare with experimental data (testbed design)
❏ Include spacecraft dynamics and momentum dumping devices to observe further faults
❏ Augmenting model with motor drive electronics❏ Develop diagnostics and prognostics approach
(i.e. wheel speed condition, energy consumption, etc.)
101

Questions?
❏Thanks for your attention!
Source: NASA/JPL-Caltech
102

Acknowledgements
• Discovery & Systems Health Group (DaSH) Group• Indranil Roychoudhury, Lilly Spirkovska, Kai Goebel, Edward Balaban
Chetan Kulkarni, John Ossenfort, Chris Teubert, Molly O’Connor, Anupa Bajwa• Former Diagnostics & Prognostic Team Members
• Matthew Daigle & Shankar Sankararaman• Visiting Researcher
• Zainab Saleem• Student Intern
• Elizabeth Torres de Jesus • Tracie Conn• Prognostics & Health Management Society
103