The School Development and Support Project with IQMS checklists – both monitored by officials who...
26
1 Corner Forest Drive and Logan Way Pinelands 7405 P O Box 396 Cape Town 8000 T: +27 -0-21 532 6000 F: +27 -0-21 531 4877 Supporting best practices to improve teaching and learning outcomes in challenging, under-resourced and disadvantaged contexts. The School Development and Support Project Supporting the Department of Basic Education to improve teaching practices and learner results in disadvantaged, under-resourced and under-performing schools Grade 3 and 6 Literacy and Numeracy results 2008 - 2011 Kariem, V; Langhan, D and Velensky, K February 2012
Transcript of The School Development and Support Project with IQMS checklists – both monitored by officials who...
1
Corner Forest Drive and Logan WayPinelands 7405
P O Box 396Cape Town 8000
T: +27 -0-21 532 6000F: +27 -0-21 531 4877
Supporting best practices to improve teaching and learning outcomes in challenging, under-resourced and disadvantaged contexts.
The School Development and Support Project
Supporting the Department of Basic Education to improve teaching practices and learner results in disadvantaged, under-resourced and
under-performing schools
Grade 3 and 6 Literacy and Numeracy results
2008 - 2011
Kariem, V; Langhan, D and Velensky, K
February 2012

2
CONTENTS Executive summary 3 Introduction 4 The context in 2008 7 What learners were not learning in 2008 8 Trends: 2008 results 9 Trends: 2008 and 2011 results 12 Main trends emerging 20 Reasons for the significantly improved results 21 Conclusions 23 Recommendations 24 References 25 Appendix 26 Diagnostic feedback reports for individual schools:
Grade 3 Numeracy 2008 – 2011
Grade 6 Numeracy 2008 - 2011
Grade 3 Literacy 2008 - 2011
Grade 6 Literacy 2008 - 2011
3
Executive summary Within the context of a struggling education system, uneven curriculum compliance in schools and poor learner results 14 years into the implementation of the Department of Basic Education’s outcomes-based approach, this report brings good news and hope. It reviews the positive impact of the School Development and Support Project on learner results in disadvantaged primary schools in three of the most disadvantaged districts in the country. The report details the Literacy and Numeracy improvements achieved by 30 out of 35 classes in 8 schools between 2008 and 2011. It provides evidence of how each of the worst performing schools of 2008 consistently achieved the most significant improvements of all project schools for 3 consecutive years, providing good evidence of sustainability. It also illustrates:
How the huge disparities between the worst and best performing schools in 2008 have come close to being levelled out, with most project schools scoring grade averages within the 60 – 80% range after 3 years.
That many more learners are scoring over 35% than in 2008
That significantly fewer learners are scoring zero per activity than in 2008 Significantly, the results achieved by the most disadvantaged schools provide strong evidence that under-performing schools in severely disadvantaged and under-resourced contexts can be turned around to become steadily achieving schools within three years. Since the project’s successes have been achieved in response to combined emphases on the critical role of textbooks and supportive capacity building interventions, they provide persuasive evidence to suggest that the Department of Basic Education could enable significant improvements in schools by ensuring that at the beginning of each school year:
Every teacher has the teacher’s guides they need
Every learner has the textbooks, workbooks and study guides they need
District officials encourage and support the systematic use of textbooks
District officials are trained and supported to enable schools to comply with policy requirements before monitoring their compliance with them.
The evidence in this report also suggests that finding a way to provide district officials with the capacity building support they need is key to enabling disadvantaged schools to achieve and sustain these kinds of improvements.
4
Introduction The School Development and Support Project Pearson Southern Africa’s Maskew Miller Longman Foundation was established in 2007 as an independent Educational Trust to support best practices to improve teaching and learning outcomes in challenging, under-resourced and disadvantaged contexts in South Africa. To do this, the Foundation has developed and implemented a school development and support project in 10 primary schools and 6 high schools in Mpumalanga, KwaZulu/Natal, the Eastern Cape and the Western Cape since 2009. Understanding the problem A 6-month baseline study and needs analysis conducted in each of the project schools in 2008 (Kariem and Langhan, April 2009), shed light on some of the less familiar reasons for the widely reported dysfunction in many disadvantaged districts and their schools. For example:
- Very few officials, school leaders and teachers had seen their job descriptions or understood their own, or each other’s roles and responsibilities
- Very few had copies of, or were familiar with, the policies they were responsible for managing and implementing
- Even fewer had received training in how to implement policy requirements practically
- There was little or no evidence of the implementation of any version of the outcomes-based education curriculum
- There was little or no evidence of the democratic and participatory values, attitudes and practices embodied in post-1994 policy documents in the way officials, school leaders and teachers went about their duties
The study confirmed that instead of emphasising the capacity building and support necessary to equip district officials to mediate meaningful compliance with policy requirements in schools, National and Provincial Departments had emphasized:
- Monitoring schools’ administrative compliance with outcomes-based policy requirements that were not being championed, mediated, embraced or implemented by district officials, school communities, or schools
- Assessing learner competency against outcomes-based education criteria that teachers were not exposing learners to in classrooms
It also revealed that as a consequence:
- The majority of education officials and school leaders in disadvantaged contexts have not been equipped to lead, manage or mediate the meaningful implementation of any version of the outcomes-based curriculum.
- As a result, remarkably similar coping strategies have evolved in disadvantaged districts and their schools. Two of these are:

5
1. Complicity in approving the day-to-day implementation of an
alternative curriculum that reflects a combination of apartheid education’s legacy and community norms, values and expectations. This is a teacher-driven curriculum characterised by restricted content; traditional chalk, talk and chorus teaching methods; and a strong emphasis on regurgitation and repetition.
2. Complicity in approving the regular suspension of day-to-day teaching - for as much as a week at a time - in order to complete de-contextualized administrative policy compliance requirements, most of which are unrelated to actual day-to-day school and classroom practices. For example: preparing work schedules and lesson plans to comply with NCS checklists; and completing peer reviews to conform with IQMS checklists – both monitored by officials who tick boxes on corresponding checklists.
In summary, the study provides strong evidence that this situation:
Has resulted in the non-implementation of any version of the post-1994 OBE curriculum in many disadvantaged schools
Created and sustained the illusion that successive versions of the curriculum had in fact been embraced and implemented in the majority of schools
These insights go a long way towards explaining why the nation’s learners have performed disastrously against:
The assessment criteria of each version of the OBE curriculum since its introduction via Curriculum 2005 in 1997
Independent Regional and International surveys such as the TIMMS, PIRLS and SACMEQ reports that have been widely publicised in recent years.
Identifying the missing ingredient The baseline study insights helped the project to identify what could be a key to addressing the severe dislocations between official policy expectations and the actual district, school and classroom practices outlined above:
The absence of capacity building programmes or activities intended to enable officials to:
Understand the policies they are responsible for the implementation of
Practically mediate them Enable schools to implement them meaningfully

6
A model to address the problem To address the critical absence of capacity building at both district and schools levels, the Foundation developed a School Development and Support Model (Kariem, Langhan and Mpofu, October 2009) intended to:
Enable officials to enable schools to begin to understand – through practical engagement – how to lead, manage and implement the curriculum meaningfully.
The main components of the School Development and Support Model:
During the first three years of implementation, district officials seemed unable to dedicate much time to the project. As a result, meaningful partnerships were not developed with any of the project districts offices. Instead of a three-way partnership intended to enhance the capacity of district officials to support schools, the
Key focus areas Target groups Means of support Properly understand school challenges Share and negotiate voluntary participation Negotiate performance agreements for partnership accountabilities over a 3-year period
District Officials School Management Teams/HODs/Subject Heads
6 month baseline study Needs analysis Develop support and development programme
Develop practical school-based curriculum mediation capacity
District Officials School Management Teams/HODs/Subject Heads
District and school-based: Observation Reflection Feedback Practical training Monitoring Support Mentoring Coaching
Develop practical school-based curriculum leadership and management capacity w.r.t. WSE and IQMS
School Management Teams/HODs/Subject Heads
School-based support as above with emphasis on: Roles and responsibilities Administration Basic school functionality
Mediate practical school-based curriculum understanding
District officials HOD’s/Subject Heads/ Teachers
School-based practical training and positive, reflective, affirming feedback through: Classroom observation Co-teaching Demonstration lessons
Develop practical school-based curriculum implementation capacity
District Officials HODs/Subject Heads/ Teachers
Classroom-based support as above
Supporting practical school-based curriculum understanding and practical implementation
HODs/Subject Heads/ Teachers
Provision of: Teaching, learning and assessment materials Supplementary resources Support for use of existing resources Classroom-based support
7
Foundation and the schools were given permission to implement the model to explore how officials could more effectively support schools1. For details about the model, its implementation, impact on teaching practices, learner results, successes achieved, and challenges encountered during implementation, see: Kariem, Langhan and Mpofu (February 2010); Kariem and Langhan (March 2011); and Langhan, Kariem and Velensky (November 2011). The focus of this report This report reviews:
The state of teaching and learning in the 8 project primary schools that have participated in the project since 20082
Trends in the grade 3 and 6 Literacy and Numeracy results3 between 2008
and 2011 in terms of:
- Grade averages
- Number of learners scoring above 35%
- Number of learners scoring zero per activity
Main trends emerging
Reasons for the significantly improved trends The context in 2008 The baseline study of 2008 (Kariem and Langhan, April, 2009) found that all of the project schools directed a great deal of energy towards:
Addressing the many socio-economic issues impacting on their schools
Complying with Departmental administrative requirements
Most teachers:
Received little or no practical support with curriculum implementation from
district officials or school management teams
Had very little faith in their schools leaders and management teams
Were generally de-motivated
Had low expectations of themselves and their colleagues
Had even lower expectations of their learners
1As a result of significant improvements achieved by the project schools between 2009 and 2011, the project districts have formally agreed to participate in a 3-year district partnership project intended to develop district capacity as originally envisaged. 2 Two primary schools that did not participate in the baseline study were added to the project during 2009. 3 For details about the project’s assessment instruments, see Kariem and Langhan, October 2009.

8
Showed little regard for time on task
Most classrooms were characterized by:
Dislocations between NCS compliant Educator Portfolios and actual
classroom practices
Inadequate supply of textbooks and teaching materials
Under-utilization of available textbooks
Classrooms in the more disadvantaged rural areas were also characterized by:
Absence of visual materials on walls
Inadequate supply of classroom furniture
Poor maintenance and a general state of disrepair
Teachers working in isolation from each other
Limited use of English in English medium lessons
Absence of evidence of OBE curriculum implementation
Authoritarian approach
Prevalence of a repetitive transmission teaching style
A very slow teaching pace
Extremely limited curriculum coverage
Consistently under-stimulated learners
Very little evidence of written work in exercise books
What learners were not learning in 2008 Extensive classroom observation across the curriculum in all Grades during the study revealed that in five of the eight schools4, teachers were not implementing any form of outcomes-base curriculum. As a consequence, their learners had never been exposed to, or prepared to fulfil the expectations of the National Curriculum Statements. The study’s Literacy and Numeracy assessment results confirmed that in these five schools, most learners were completely unprepared for, and unable to fulfil most of the expectations of the NCS in either Grades 3 or Grade 6. Similarly, the majority of Grade 6 learners were unable to cope with even the most basic requirements of English medium of instruction. The following table summarizes how the learners responded to the range of OBE activity types included in the project’s assessment instruments at the end of 2008.
4 These are four of the five disadvantaged schools (classified as quintile 1, 2 or 3) and one of the previously advantaged schools (classified as quintile 4).

9
How the learners responded to the OBE activity types in the assessment instruments at the end of 2008
Trends: 2008 results The following is an overview of some of the more significant trends revealed by the 2008 Literacy and Numeracy assessment results. Quintile 3 and 4 schools scoring equally well in Grade 3 A quintile 3 school in the Eastern Cape and a quintile 4 school in the Western Cape achieved similarly excellent scores in the 70% - 80% range as shown below:
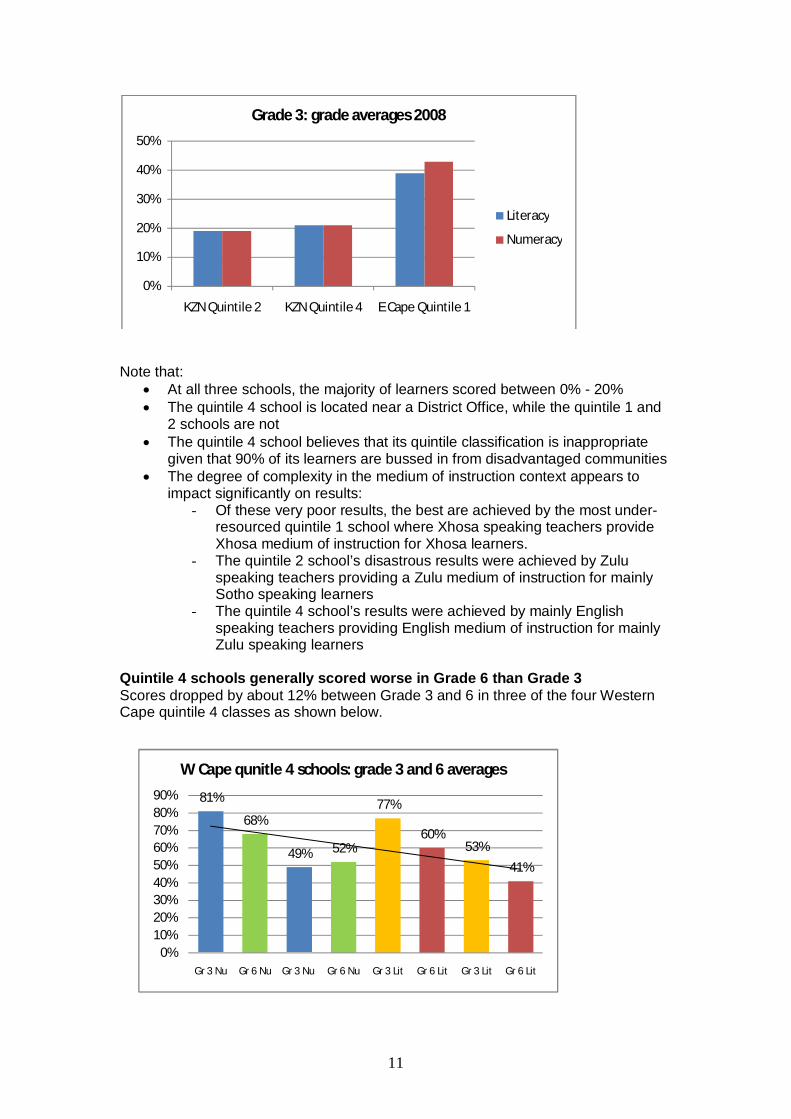
Note that:
The semi-rural Eastern Cape School is significantly more disadvantaged than its urban Western Cape counterpart
66%
68%
70%
72%
74%
76%
78%
80%
82%
E Cape Quintile 3 W Cape Quintile 4
Grade 3: grade averages 2008
Literacy
Numeracy
For Literacy: For Numeracy: About a quarter of the learners scored zero for every activity. Almost all struggled with activities that required:
- Interpretation - Reasoning - Comparing - Independent thinking - Expressing opinions - Problem solving - Re-expressing information in other
formats - Content knowledge and skills from
other Learning Areas
Almost all struggled with activities that required:
- Using more than one operation - Dealing with more than one concept - Engaging in thinking and calculating
at intermediate and advanced levels - Familiar content or concepts
presented in unfamiliar ways - Using mathematical instruments (in
Grade 6)
Most coped reasonably well with activities requiring:
- One-word answers - Completing sentences - Extracting information directly from
passages
Most coped reasonably with activities requiring basic understanding and operations

10
Both schools are located near to District Offices Both implement English as the medium of instruction from Grade R Both believe that their existing quintile classifications are completely
inappropriate given the number of disadvantaged learners they actually cater for
Quintile 2 and 4 schools scoring similarly poorly in Grade 3 A previously advantaged quintile 4 urban school in the Western Cape scored as poorly as two disadvantaged quintile 2 rural schools in Mpumalanga. All three scored averages in the 45% - 65% range as shown below:
Note that:
The majority of learners scored well below 50% for both Literacy and Numeracy at all three schools
The quintile 4 school is located near a District Office, while the quintile 2 schools are not
The quintile 4 school believes that its quintile classification is inappropriate given the number of disadvantaged learners it actually caters for
Two of the schools have interesting medium of instruction challenges:
- The dual medium quintile 4 school offers separate English and Afrikaans streams from Grade R. However, Afrikaans is being phased out due to an increasing demand for English medium instruction for the increasing number of disadvantaged learners registering at the school.
- The quintile 2 school in the middle of the graph has Sepedi teachers
using Sepedi as medium of instruction for mainly Sepedi learners in Grades 1 – 3; while the other has the same language policy for a mixed learner population of Sepedi and Siswati speaking learners
Quintile 1, 2 and 4 schools scoring very poorly in Grade 3 A previously advantaged urban school and two disadvantaged deep rural schools all scored averages in the range of 15% - 45%. While this was not surprising at the deep rural quintile 1 and 2 schools, it was unexpected at the comparatively well resourced urban quintile 4 school.
0%
10%
20%
30%
40%
50%
60%
70%
W Cape Quintile 4 MPL Quintile 2 MPL Quintile 2
Grade 3: grade averages 2008
Literacy
Numeracy
11
Note that:
At all three schools, the majority of learners scored between 0% - 20% The quintile 4 school is located near a District Office, while the quintile 1 and
2 schools are not The quintile 4 school believes that its quintile classification is inappropriate
given that 90% of its learners are bussed in from disadvantaged communities The degree of complexity in the medium of instruction context appears to
impact significantly on results: - Of these very poor results, the best are achieved by the most under-
resourced quintile 1 school where Xhosa speaking teachers provide Xhosa medium of instruction for Xhosa learners.
- The quintile 2 school’s disastrous results were achieved by Zulu speaking teachers providing a Zulu medium of instruction for mainly Sotho speaking learners
- The quintile 4 school’s results were achieved by mainly English speaking teachers providing English medium of instruction for mainly Zulu speaking learners
Quintile 4 schools generally scored worse in Grade 6 than Grade 3 Scores dropped by about 12% between Grade 3 and 6 in three of the four Western Cape quintile 4 classes as shown below.
0%
10%
20%
30%
40%
50%
KZN Quintile 2 KZN Quintile 4 E Cape Quintile 1
Grade 3: grade averages 2008
Literacy
Numeracy
81%
68%
49% 52%
77%
60%53%
41%
0%10%20%30%40%50%60%70%80%90%
Gr 3 Nu Gr 6 Nu Gr 3 Nu Gr 6 Nu Gr 3 Lit Gr 6 Lit Gr 3 Lit Gr 6 Lit
W Cape qunitle 4 schools: grade 3 and 6 averages
12
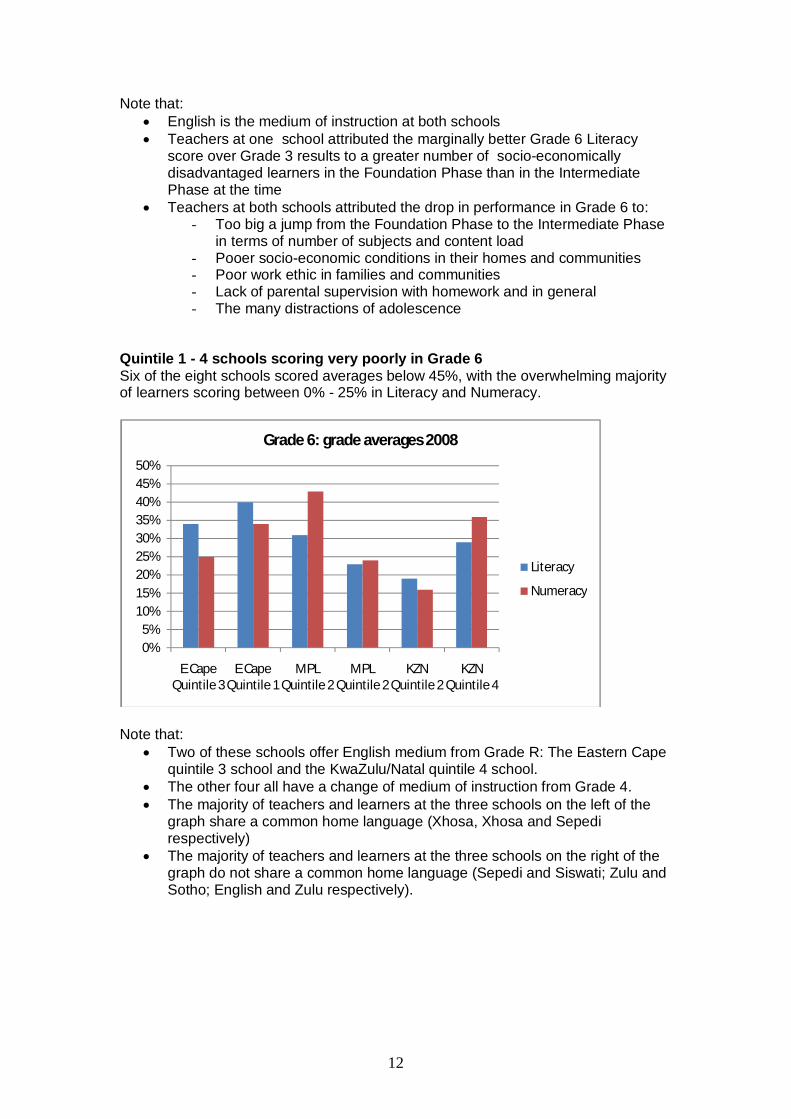
Note that: English is the medium of instruction at both schools Teachers at one school attributed the marginally better Grade 6 Literacy
score over Grade 3 results to a greater number of socio-economically disadvantaged learners in the Foundation Phase than in the Intermediate Phase at the time
Teachers at both schools attributed the drop in performance in Grade 6 to: - Too big a jump from the Foundation Phase to the Intermediate Phase
in terms of number of subjects and content load - Pooer socio-economic conditions in their homes and communities - Poor work ethic in families and communities - Lack of parental supervision with homework and in general - The many distractions of adolescence
Quintile 1 - 4 schools scoring very poorly in Grade 6 Six of the eight schools scored averages below 45%, with the overwhelming majority of learners scoring between 0% - 25% in Literacy and Numeracy.
Note that: Two of these schools offer English medium from Grade R: The Eastern Cape
quintile 3 school and the KwaZulu/Natal quintile 4 school. The other four all have a change of medium of instruction from Grade 4. The majority of teachers and learners at the three schools on the left of the
graph share a common home language (Xhosa, Xhosa and Sepedi respectively)
The majority of teachers and learners at the three schools on the right of the graph do not share a common home language (Sepedi and Siswati; Zulu and Sotho; English and Zulu respectively).
0%5%
10%15%20%25%30%35%40%45%50%
E Cape Quintile 3
E Cape Quintile 1
MPL Quintile 2
MPL Quintile 2
KZN Quintile 2
KZN Quintile 4
Grade 6: grade averages 2008
Literacy
Numeracy

13
Trends: 2008 - 2011 results The individual diagnostic feedback reports for each of the schools in the Appendix provide details on the Grade 3 and 6 Literacy and Numeracy results after three years of project implementation. They compare:
Grade averages from 2008 to 2011
Activity-by-activity scores for 2008 and 2011 This section of the report analyses the main trends emerging from the reports in terms of:
Grade averages
Number of learners scoring above 35%
Number of learners scoring zero per activity Grade 3 Numeracy Between 2008 and 2011, grade averages have:
Improved in all 8 participating classes Improved to over the 50% mark in 6 of the schools, bringing them well into
the 55% - 80% range Improved most significantly in the worst performing classes of 2008, raising
their standards from around 20% to over 70%, and putting them on par with the best of the other schools
0102030405060708090
100
EC Q3 EC Q1 MPL Q2 MPL Q2 KZN Q4 KZN Q2 WC Q4 WC Q4
Av %
Grade 3 classes
Grade 3 Numeracy: Grade average %
20082011
14
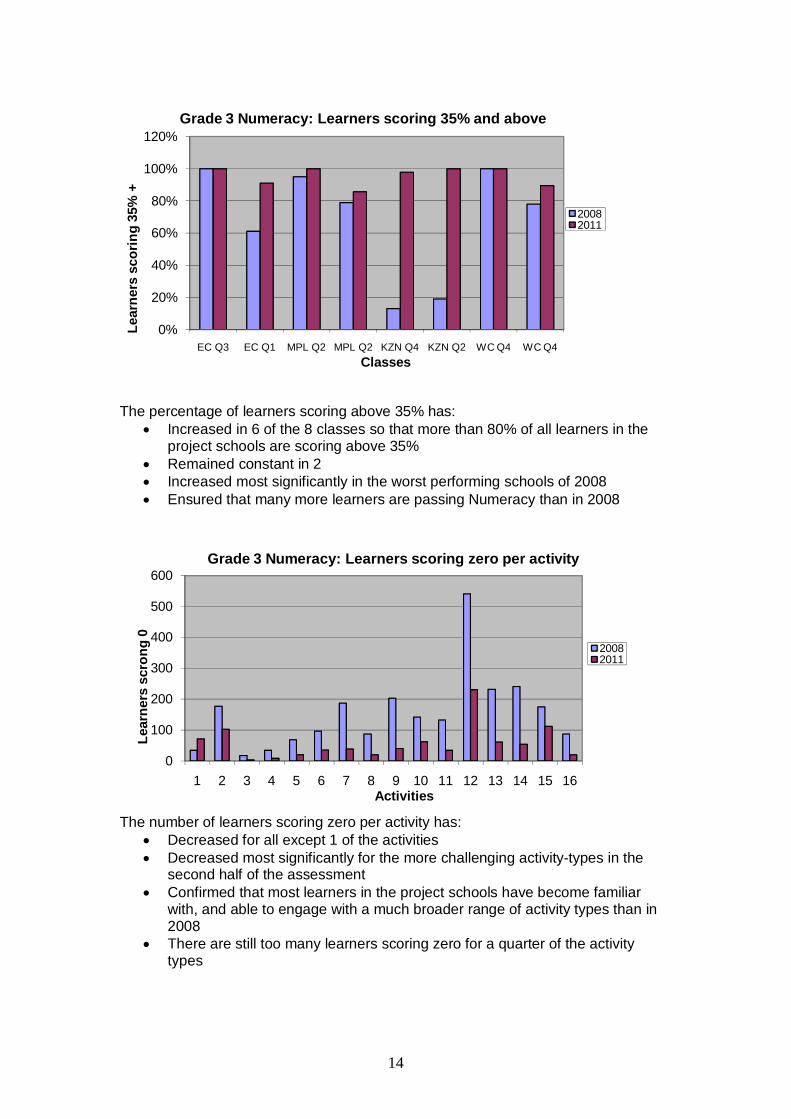
The percentage of learners scoring above 35% has:
Increased in 6 of the 8 classes so that more than 80% of all learners in the project schools are scoring above 35%
Remained constant in 2 Increased most significantly in the worst performing schools of 2008 Ensured that many more learners are passing Numeracy than in 2008
The number of learners scoring zero per activity has:
Decreased for all except 1 of the activities Decreased most significantly for the more challenging activity-types in the
second half of the assessment Confirmed that most learners in the project schools have become familiar
with, and able to engage with a much broader range of activity types than in 2008
There are still too many learners scoring zero for a quarter of the activity types
0%
20%
40%
60%
80%
100%
120%
EC Q3 EC Q1 MPL Q2 MPL Q2 KZN Q4 KZN Q2 WC Q4 WC Q4
Lear
ners
sco
ring
35%
+
Classes
Grade 3 Numeracy: Learners scoring 35% and above
20082011
0
100
200
300
400
500
600
1 2 3 4 5 6 7 8 9 10 11 12 13 14 15 16
Lear
ners
scr
ong
0
Activities
Grade 3 Numeracy: Learners scoring zero per activity
20082011

15
Grade 3 Literacy
Between 2008 and 2011, Literacy grade averages have:
Improved in 5 of the 9 participating classes Remained more or less constant in 2 and dropped in 2 Improved most significantly in the worst performing classes of 2008, raising
their standards from around 20% to between 45% and 90%, putting them well on the road to being on par with the best of the other schools
The percentage of learners scoring above 35% has:
Decreased in 1 class Remained more or less constant in 4 and increased only slightly in 1 Increased significantly in the 3 worst performing classes of 2008 Ensured that many more learners are passing Literacy than in 2008
0%
20%
40%
60%
80%
100%
120%
EC Q3 EC Q1 MPL Q2 MPL Q2 KZN Q4 KZN Q2 KZN Q2 WC Q4 WC Q4
Lear
ners
sco
ring
35%
+
Classes
Grade 3 Literacy: scores of 35% and above
2008
2011
0102030405060708090
100
EC Q3 EC Q1 MPL Q2 MPL Q2 KZN Q4 KZN Q2 KZN Q2 WC Q4 WC Q4
Av %
Grade 3 classes
Grade 3 Literacy: Grade average %
20082011

16
The number of learners scoring zero per activity has:
Decreased very significantly for every activity type Decreased most significantly for the activity-types that most learners were not
familiar with in 2008 Confirmed that most learners in the project schools have become familiar
with, and able to engage with a much broader range of activity types than in 2008
There are still too many learners scoring zero for every activity The number of learners scoring zero per activity illustrates that:
Significantly fewer learners scored zero in and African language, even if it was not their home language, than in English Literacy in both 2008 and 2011
As for English Literacy, scores of zero decreased significantly for the activity-types that learners were not familiar with in 2008
Most learners in the project schools have become familiar with, and able to engage with a broader range of activity types than in 2008
0
20
40
60
80
100
120
140
1 2 3 4 5 6 7 8
No.
of l
earn
ers
Activities
Grade 3 English Literacy: Learners scoring zero per activity
20082011
020406080
100120140160180200
1 2 3 4 5 6 7 8 9
No.
of l
earn
ers
Activities
Gr 3 Sepedi, Xhosa, Zulu Literacy: Learners scoring zero per activity
2008
2011

17
Grade 6 Numeracy
Between 2008 and 2011, grade averages have:
Improved in 6 of the 9 participating classes Remained more or less constant in 1 Decreased significantly in 2 - quintile 4 classes in the better resourced
Western Cape Improved the most in the 6 poorest performing classes in 2008, raising their
standards from between 15% and 45% to between 35% and 65%, bringing 3 of them into the same range as the best of the other schools
The percentage of learners scoring above 35% has:
Increased in 7 of the 9 classes Decreased in 2 – quintile 4 classes in the better resourced Western Cape Increased most significantly in the 4 worst performing schools of 2008 Ensured that, in spite of the drops in the Western Cape classes, overall, many
more learners are passing Numeracy than in 2008
0
10
20
30
40
50
60
70
80
EC Q3 EC Q1 MPL Q2 MPL Q2 KZN Q4 KZN Q2 WC Q4 WC Q4 WC Q4
Av %
Grade 6 classes
Grade 6 Numeracy: Grade average %
20082011
0%
20%
40%
60%
80%
100%
120%
EC Q3 EC Q1 MPL Q2 MPL Q2 KZN Q4 KZN Q2 WC Q4 WC Q4 WC Q4
% o
f lea
rner
s
Classes
Grade 6 Numeracy: Learners scoring above 35%
2008
2011

18
The number of learners scoring zero per activity has:
Decreased consistently across 18 of the 20 activities Confirmed that many more learners in the project schools have become
familiar with, and able to engage with a much broader range of activity types than in 2008.
There are still far too many learners scoring zero for 17 of the activity types Grade 6 Literacy Between 2008 and 2011, Literacy grade averages have:
Improved significantly in 4 of the 9 classes and marginally in 2 Dropped marginally in 3 classes, 2 of which are in more advantaged quintile
4 schools in the Western Cape
0
10
20
30
40
50
60
70
EC Q3 EC Q1 MPL Q2 MPL Q2 KZN Q4 KZN Q2 WC Q4 WC Q4 WC Q4
Av %
Grade 6 classes
Grade 6 Literacy: Grade average %
20082011
0
100
200
300
400
500
600
1 2 3 4 5 6 7 8 9 10 11 12 13 14 15 16 17 18 19 20
Lear
ners
sco
ring
0
Activities
Grade 6 Numeracy: Learners scoring zero per activity
20082011
19
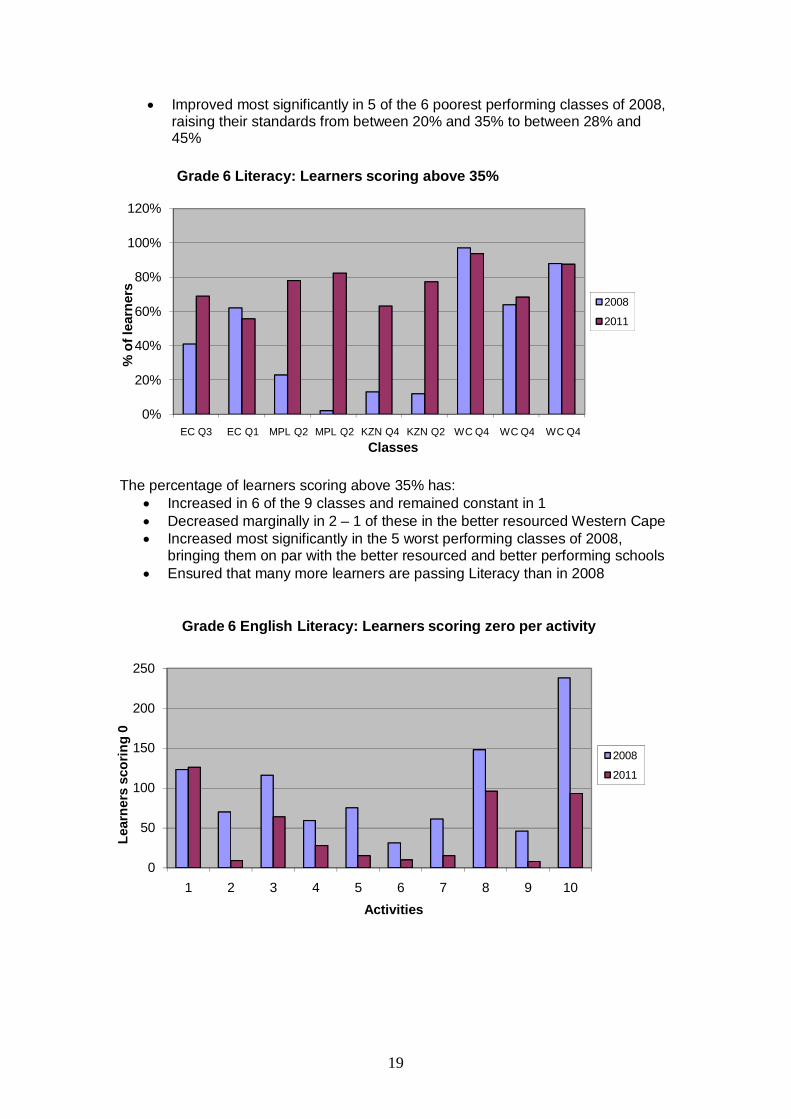
Improved most significantly in 5 of the 6 poorest performing classes of 2008, raising their standards from between 20% and 35% to between 28% and 45%
The percentage of learners scoring above 35% has:
Increased in 6 of the 9 classes and remained constant in 1 Decreased marginally in 2 – 1 of these in the better resourced Western Cape Increased most significantly in the 5 worst performing classes of 2008,
bringing them on par with the better resourced and better performing schools Ensured that many more learners are passing Literacy than in 2008
0
50
100
150
200
250
1 2 3 4 5 6 7 8 9 10
Lear
ners
sco
ring
0
Activities
Grade 6 English Literacy: Learners scoring zero per activity
2008
2011
0%
20%
40%
60%
80%
100%
120%
EC Q3 EC Q1 MPL Q2 MPL Q2 KZN Q4 KZN Q2 WC Q4 WC Q4 WC Q4
% o
f lea
rner
s
Classes
Grade 6 Literacy: Learners scoring above 35%
2008
2011
20
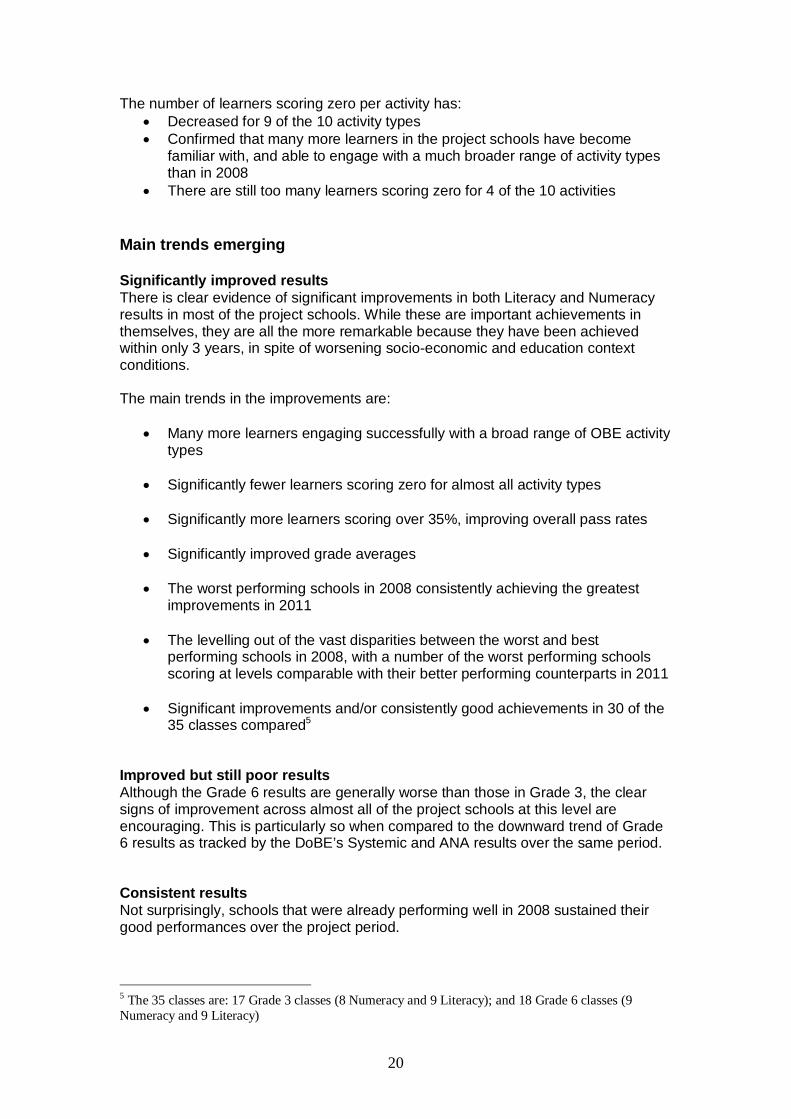
The number of learners scoring zero per activity has: Decreased for 9 of the 10 activity types Confirmed that many more learners in the project schools have become
familiar with, and able to engage with a much broader range of activity types than in 2008
There are still too many learners scoring zero for 4 of the 10 activities Main trends emerging Significantly improved results There is clear evidence of significant improvements in both Literacy and Numeracy results in most of the project schools. While these are important achievements in themselves, they are all the more remarkable because they have been achieved within only 3 years, in spite of worsening socio-economic and education context conditions. The main trends in the improvements are:
Many more learners engaging successfully with a broad range of OBE activity types
Significantly fewer learners scoring zero for almost all activity types
Significantly more learners scoring over 35%, improving overall pass rates
Significantly improved grade averages
The worst performing schools in 2008 consistently achieving the greatest improvements in 2011
The levelling out of the vast disparities between the worst and best performing schools in 2008, with a number of the worst performing schools scoring at levels comparable with their better performing counterparts in 2011
Significant improvements and/or consistently good achievements in 30 of the 35 classes compared5
Improved but still poor results Although the Grade 6 results are generally worse than those in Grade 3, the clear signs of improvement across almost all of the project schools at this level are encouraging. This is particularly so when compared to the downward trend of Grade 6 results as tracked by the DoBE’s Systemic and ANA results over the same period. Consistent results Not surprisingly, schools that were already performing well in 2008 sustained their good performances over the project period. 5 The 35 classes are: 17 Grade 3 classes (8 Numeracy and 9 Literacy); and 18 Grade 6 classes (9 Numeracy and 9 Literacy)

21
Deteriorating results Results deteriorated in five of the thirty five project classes over the project period as follows:
Grade 3 Literacy dropped by around 10% in two of the disadvantaged schools: An Eastern Cape quintile 1 school and an Mpumalanga quintile 2 school
Grade 6 Numeracy results dropped by around 20% in one of the more advantaged Western Cape quintile 4 school’s
Grade 6 Literacy results dropped by about 5% in both of the more advantaged Western Cape quintile 4 schools’
Reasons for the significantly improved results Given that there have been no other interventions at the project schools since 2008, there can be little doubt that the improved results can be attributed to the combined impact of following elements of the School Development and Support Project: The approach An approach that emphasized:
The values, attitudes and practices embodied in post-1994 curriculum policy
documents
Developing trusting relationships
Developing a thorough understanding of each school’s challenges through a
6-month baseline study
The expectations of the curriculum and related policy documents
Enabling schools to comply meaningfully with policy expectations
A needs-driven approach
The collaborative identification and prioritization of each school’s own needs
Practical school-based support
Reliance on teachers’ guides and textbooks as a means of enabling
effective curriculum implementation
Nature of the support In response to the clear need for enabling support in all of the disadvantaged schools, the model focuses on supportive capacity building interventions. The interventions took the form of regular, ongoing cycles of supportive, practical, hands-on training, mentoring, coaching and monitoring6 in four key areas:
1. Leadership, management and administrative roles and responsibilities, and how to implement them practically to support curriculum implementation
6 The purpose of monitoring was to determine the extent to which participants were able to effectively implement policy requirements, and as was generally necessary, to identify areas in which they needed further training and coaching support.

22
2. Personal development to become better leaders, managers and educators
3. Understanding curriculum requirements, how to plan to achieve them, how to plan lessons, how to teach effectively and how to implement each practically
4. The systematic use of approved teacher’s guides, textbooks, workbooks and
study guides7 to enable effective curriculum implementation because they:
Embody curriculum requirements
Provide explicit, detailed, on-the-job, do-it-yourself teacher training and guidance
Deliver the curriculum into the classroom through officially approved: - Lesson plans - Content - Learning, self-study and assessment activities
Provide teachers with:
- Teaching methods and techniques - The language for teaching through the medium of instruction - Conceptual progression from grade to grade across phases - Pacing guidelines for curriculum coverage
The schools’ responses to the support The many improvements achieved, and sustained, by the school leaders and their staff in response to these interventions resulted in the following new practices:
More attention to lesson planning and preparation
More regular use of textbooks
More systematic use of textbooks
Evidence of a faster pace of teaching
More teaching through the medium of instruction
Exposing learners to a broader range of teaching methods and techniques
More structured conceptual explanations
Exposing learners to a wider range of learning and assessment activity types
Providing greater stimulation for weaker learners
Allowing learners to participate more actively
Allowing learners to begin to work more independently
Requiring learners to do more written work
7 The project donated to each project school: teacher’s guides for every teacher and textbooks, workbooks and supplementary reading materials for every learner , in every learning area, in every grade

23
Reasons for deteriorations Apart from the socio-economic and systemic factors already alluded to; the following have also impacted on the performance of teachers and learners in the few classes that did not sustain good results over the three years:
Teacher turn-over. In the more rural schools, this is an ongoing challenge. This is as much due to poverty-related deaths, as it is to teachers relocating to schools in towns or cities.
Dwindling learner numbers. Similarly, the number of learners is dwindling due to rural-urban migration.
More poor learners. Teachers in the more advantaged Western Cape
Schools attribute the deterioration to the significant increase in the number of socio-economically disadvantaged learners registering at their schools in the last three years.
Resistance to change. In a few cases, teachers simply do not want to change. These are generally teachers who are close to retirement. In others, teachers are overwhelmed by the degree of change required of them, and prefer to operate within their comfort zones.
Anxiety about further curriculum changes. Some teachers are reluctant to change because they expect curriculum requirements to continue shifting every few years.
Full-circle expectations. Many teachers, even those who have made huge shifts in their practices, believe that the ongoing curriculum changes will eventually come full circle – back to more achievable prescriptive syllabi and traditional teaching practices.
Conclusions Given that the Department of Basic Education’s almost exclusive emphasis on compliance monitoring has not achieved the desired results, it is significant that the project’s quickly achieved successes in 30 of 35 classes have been in response to the combined emphases on:
The critical role of textbooks
Supportive capacity building interventions. The significant improvements achieved by the project schools provide evidence that under-performing schools in disadvantaged and under-resourced contexts can become better achieving schools within a few years. They also confirm that the kind of support offered by the school development and support model is critical to achieving and sustaining these kinds of improvements in other disadvantaged schools. At the same time, in spite of the many significant improvements presented in this report, the more disadvantaged project schools still have a long way to go before the majority of their learners are consistently achieving curriculum expectations

24
satisfactorily. To sustain necessary ongoing improvements into 2012 and beyond, the schools will need the right kinds of support from their district officials. For these reasons, the current model has been expanded to re-incorporate the original emphasis on capacity building at the district level. Re-named the District Partnership Project, from 2012 it will focus on:
Conducting a baseline study and needs analysis to identify actual support needs in the district offices.
‘On-the-job’ capacity building of district officials in existing project schools.
Supporting the expansion of the support model into the other schools they are responsible for.
Recommendations The Department of Basic Education could enable the kinds of significant improvements described in this report in most of its disadvantaged schools by addressing just three issues comprehensively. These are, ensuring that:
1. At the beginning of each school year, every teacher and learner has all of the teacher’s guides, textbooks, workbooks and study guides they need
2. Throughout the year, district officials are regularly trained and supported to enable schools to understand and meaningfully implement policy requirements8
3. Throughout the year, district officials regularly visit schools and classrooms to:
Encourage and support the systematic use of teacher’s guides and textbooks
Explain, demonstrate and enable the practical implementation of policy requirements
Monitor compliance with policy requirements only after enabling
meaningful practical implementation .
8 The provision of capacity building support for district officials will be the key to enabling disadvantaged schools to achieve and sustain the required improvements.

25
References Kariem, V and Langhan, D (April, 2009) 2008 Baseline Study Report: Towards identifying the curriculum implementation support schools need. Kariem, V and Langhan, D (October 2009) What learners are not learning, why, and what to do about it: An analysis of Grade 3 and 6 Literacy and Numeracy results in 8 Primary Schools across 4 Provinces in South Africa. Kariem, V. Langhan, D and Mpofu, N (February 2010) The impact of the School Development Project on 8 Primary Schools in year 1 of a 3-year programme Kariem, V and Langhan, D (March 2011) The School Support Model: Summary of trends 2008 – 2010 Langhan, D with Kariem, V and Velensky, K (November 2011) A supportive attitude and the ability to provide practical support could be all we need to enable under-performing schools to become achieving schools

26
Appendix - Diagnostic feedback reports The following diagnostic reports for each of the schools are available from the Foundation on request:
Grade 3 Numeracy 2008 – 2011
Grade 6 Numeracy 2008 - 2011
Grade 3 Literacy 2008 - 2011
Grade 6 Literacy 2008 - 2011