Public Accounts of British Columbia fiscal year ended March 31
1www.sabb.com
The Saudi British Bank
Annual Report and Accounts
2009

2
7 Board of Directors 9 Financial Highlights 10 Chairman’s Statement 12 Directors’ Report 32 Independent Auditors’ Report 3430 Consolidated Statement of Financial Position 35 Consolidated Statement of Income 36 Consolidated Statements of Comprehensive Income 37 Consolidated Statement of Changes in Shareholders’ Equity 38 Consolidated Statement of Cash Flows 39 Notes to the Consolidated Financial Statements (31 December 2009)84 Basel II – Pillar 3 Annual Disclosures (31 December 2009) 96 Pillar 3 Annual Disclosures – Tables 110 Addresses and Contact Numbers
This report is issued by SABB (The Saudi British Bank)
To receive a copy of this report, please contact:
Corporate Communications
SABB
Head Office:P.O. Box 9084Riyadh 11413Kingdom of Saudi ArabiaTel: +966 (1) 276 4779Fax: +966 (1) 276 4809Email: [email protected]
or visit our website at:www.sabb.com
Table of Contents
T H E S A U D I B R I T I S H B A N K

3

4

5
Custodian of The Two Holy Mosques
King Abdullah Bin Abdulaziz Al Saud
His Royal Highness
Prince Sultan Bin Abdulaziz Al Saud
The Crown Prince, Deputy Premier,Minister of Defence and Aviation and Inspector General
His Royal Highness
Prince Nayef Bin Abdulaziz Al Saud, Second Deputy Prime Minister,
Minister of Interior

6

7
Mohammed Omran Al Omran
ChairmanKhaled Suliman Olayan
Richard W L Groves
Simon Cooper
Fouad AbdulwahabBahrawi
Sulaiman AbdulkaderAl Muhaidib
Robin Douglas JonesDavid Dew Ahmed Sulaiman Banaja
Khalid AbdullahAl Molhem
Board of Directors
T H E S A U D I B R I T I S H B A N K
7

8

9
Financial Highlights
T H E S A U D I B R I T I S H B A N K
Net income
Sau
di R
iyal
(m
illio
ns)
3000
2500
3500
2000
1500
1000
500
0
2008 2007 2006 20052009
3,040
2,5042,6072,920
2,032
Year
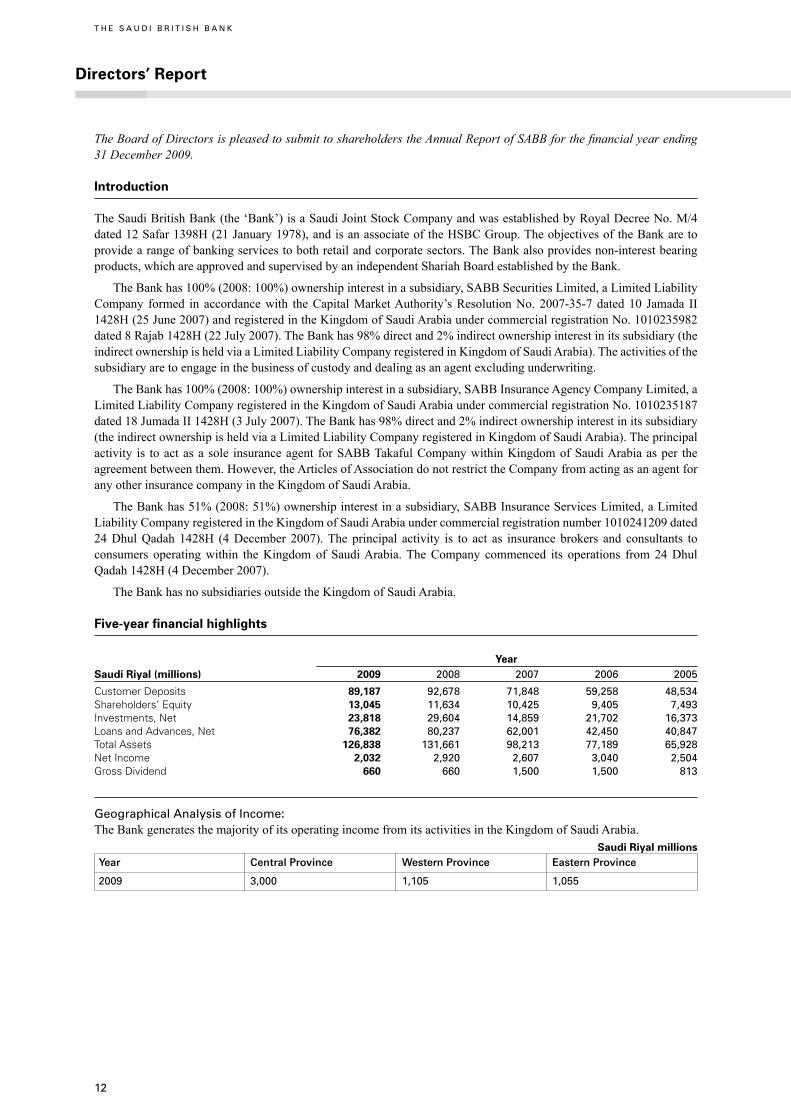
Five-year financial highlights
YearSaudi Riyal (millions) 2009 2008 2007 2006 2005
Customer Deposits 89,187 92,678 71,848 59,258 48,534Shareholders’ Equity 13,045 11,634 10,425 9,405 7,493Investments, Net 23,818 29,604 14,859 21,702 16,373Loans and Advances, Net 76,382 80,237 62,001 42,450 40,847Total Assets 126,838 131,661 98,213 77,189 65,928Net Income 2,032 2,920 2,607 3,040 2,504Gross Dividend 660 660 1,500 1,500 813
10
Chairman’s Statement
T H E S A U D I B R I T I S H B A N K
On behalf of the Board of Directors I am pleased to present the Annual Report of SABB for the financial year ending 31 December 2009.
2009 has been a difficult and challenging global economic and business environment, including for the financial sector in Saudi Arabia. Despite the Saudi government implementing the largest budget in its history during the year, overall growth was limited to lower rates yet higher than had been anticipated. In this environment, the Saudi private sector was very subdued recovering from the effects of the previous year’s global financial crisis; this included shelving many projects that had earlier been mooted for implementation, whilst SABB pursued a conservative approach to the prevailing environment, containing lending whilst seeking to strengthen its balance sheet.
Net profits for the year amounted to SAR 2,032 million (USD 542 million), with a Return on Average Equity (RoAE) of 15.83%. The Bank has continued its efforts to strengthen its core businesses, introduce new products and invest in technology to improve services.
The gross dividend for the year is SAR 660 million (2008: SAR 660 million) and was paid as an interim dividend to shareholders on 27 July 2009. In order to further strengthen the capital position of the Bank, no final dividend has been recommended.
Despite operating in a constrained environment, SABB maintained its programme of branch and ATM network expansion to the benefit of customers across Saudi Arabia. Seven new branches were opened in 2009, bringing the Bank’s branch total to 88 Kingdom-wide, of which 16 are solely for ladies; four more branches were under construction as the year came to an end. In addition, and for higher net worth customers, four new Premier Centres were opened during the year.
HSBC Saudi Arabia Limited, has maintained its leading role in the Kingdom during the year despite the growing level of competition. SABB Takaful, the publicly quoted Shariah-compliant insurance subsidiary, raised its capital to SAR 340 million during the year through what proved to be a most successful rights issue. This increase in capital enables the company to compete more effectively in what has become a highly competitive market and has helped ensure SABB Takaful a major role in the sector in terms of gross contribution written.
SABB Securities, a majority-owned subsidiary offering brokerage and securities services, was at the forefront of market developments in 2009 being among the first to offer Sukuk and bond trading through Tadawul (the Saudi stock market) whilst being placed fourth among 36 active competitors in terms of market turnover in equity brokerage.
Corporate and Commercial Banking continued to grow its business and a number of landmark deals were struck during the year, ensuring maintenance of its leadership position in this most competitive sector.
Personal Banking enjoyed a successful year, especially under the Shariah-compliant Amanah brand, but also through its SABB Premier activities, where the Bank succeeded in increasing the customer base by 28%, and in its card business where SABB continues to be the largest issuer in the Kingdom. Meanwhile, Private Banking maintained its leadership role in terms of both market share and the quality of investment solutions provided.
A clear reflection of SABB’s profile in the Kingdom is the number of honours received from international organisations and publications during the year. These have included awards such as “Saudi Arabia’s Strongest Bank” and “Bank of the Year in Saudi Arabia” amongst many other accolades for the Bank’s activities.
This year’s activities at SABB have ensured the Bank can look to the future with confidence, especially in the light of the strengthened balance sheet in preparation for what is anticipated to be a more active year for the Kingdom’s private sector in 2010. Although questions remain about global economic recovery, the Saudi government has elected to drive forward the domestic economy in the coming year with a budget contemplating expenditure 14% higher than in the just concluded year, giving cause for confidence in the local economy over the year.
11
This leaves me, on behalf of the Board of Directors, with the pleasant task of expressing my thanks to all shareholders for their continued loyalty; my deep appreciation to all members of the Bank’s staff, whose wholehearted effort ensures continued success; and my sincere gratitude to all our customers for their ongoing confidence and support. I express also my immense gratitude to the Saudi government, especially to the Ministries of Finance and Commerce & Industry and the Saudi Arabian Monetary Agency, as well as to the Capital Market Authority, for their continued guidance and help to the Saudi Arabian banking and financial community. On behalf of SABB, a leading member of that community, I reiterate our commitment to the growth and development of Saudi Arabia under the leadership of the Custodian of the Two Holy Mosques, the Crown Prince, and HH the Second Deputy Prime Minister.
Khaled Suliman Olayan
12
Directors’ Report
T H E S A U D I B R I T I S H B A N K
The Board of Directors is pleased to submit to shareholders the Annual Report of SABB for the financial year ending 31 December 2009.
Introduction
The Saudi British Bank (the ‘Bank’) is a Saudi Joint Stock Company and was established by Royal Decree No. M/4 dated 12 Safar 1398H (21 January 1978), and is an associate of the HSBC Group. The objectives of the Bank are to provide a range of banking services to both retail and corporate sectors. The Bank also provides non-interest bearing products, which are approved and supervised by an independent Shariah Board established by the Bank.
The Bank has 100% (2008: 100%) ownership interest in a subsidiary, SABB Securities Limited, a Limited Liability Company formed in accordance with the Capital Market Authority’s Resolution No. 2007-35-7 dated 10 Jamada II 1428H (25 June 2007) and registered in the Kingdom of Saudi Arabia under commercial registration No. 1010235982 dated 8 Rajab 1428H (22 July 2007). The Bank has 98% direct and 2% indirect ownership interest in its subsidiary (the indirect ownership is held via a Limited Liability Company registered in Kingdom of Saudi Arabia). The activities of the subsidiary are to engage in the business of custody and dealing as an agent excluding underwriting.
The Bank has 100% (2008: 100%) ownership interest in a subsidiary, SABB Insurance Agency Company Limited, a Limited Liability Company registered in the Kingdom of Saudi Arabia under commercial registration No. 1010235187 dated 18 Jumada II 1428H (3 July 2007). The Bank has 98% direct and 2% indirect ownership interest in its subsidiary (the indirect ownership is held via a Limited Liability Company registered in Kingdom of Saudi Arabia). The principal activity is to act as a sole insurance agent for SABB Takaful Company within Kingdom of Saudi Arabia as per the agreement between them. However, the Articles of Association do not restrict the Company from acting as an agent for any other insurance company in the Kingdom of Saudi Arabia.
The Bank has 51% (2008: 51%) ownership interest in a subsidiary, SABB Insurance Services Limited, a Limited Liability Company registered in the Kingdom of Saudi Arabia under commercial registration number 1010241209 dated 24 Dhul Qadah 1428H (4 December 2007). The principal activity is to act as insurance brokers and consultants to consumers operating within the Kingdom of Saudi Arabia. The Company commenced its operations from 24 Dhul Qadah 1428H (4 December 2007).
The Bank has no subsidiaries outside the Kingdom of Saudi Arabia.
Five-year financial highlights
YearSaudi Riyal (millions) 2009 2008 2007 2006 2005
Customer Deposits 89,187 92,678 71,848 59,258 48,534Shareholders’ Equity 13,045 11,634 10,425 9,405 7,493Investments, Net 23,818 29,604 14,859 21,702 16,373Loans and Advances, Net 76,382 80,237 62,001 42,450 40,847Total Assets 126,838 131,661 98,213 77,189 65,928Net Income 2,032 2,920 2,607 3,040 2,504Gross Dividend 660 660 1,500 1,500 813
Geographical Analysis of Income:The Bank generates the majority of its operating income from its activities in the Kingdom of Saudi Arabia.
Year Central Province Western Province Eastern Province
2009 3,000 1,105 1,055
Saudi Riyal millions
13
Five-year financial highlights (continued)Main Business Segments:
The Bank is organised into the following main business segments:
Retail Banking - which caters mainly to the banking requirements of personal and private banking customers.
Corporate Banking - which caters mainly to the banking requirements of commercial and corporate banking customers.
Treasury - which manages the Bank’s liquidity, currency and special commission rate risks. It is also responsible for funding the Bank’s operations and managing the Bank’s investment portfolio and statement of financial position.
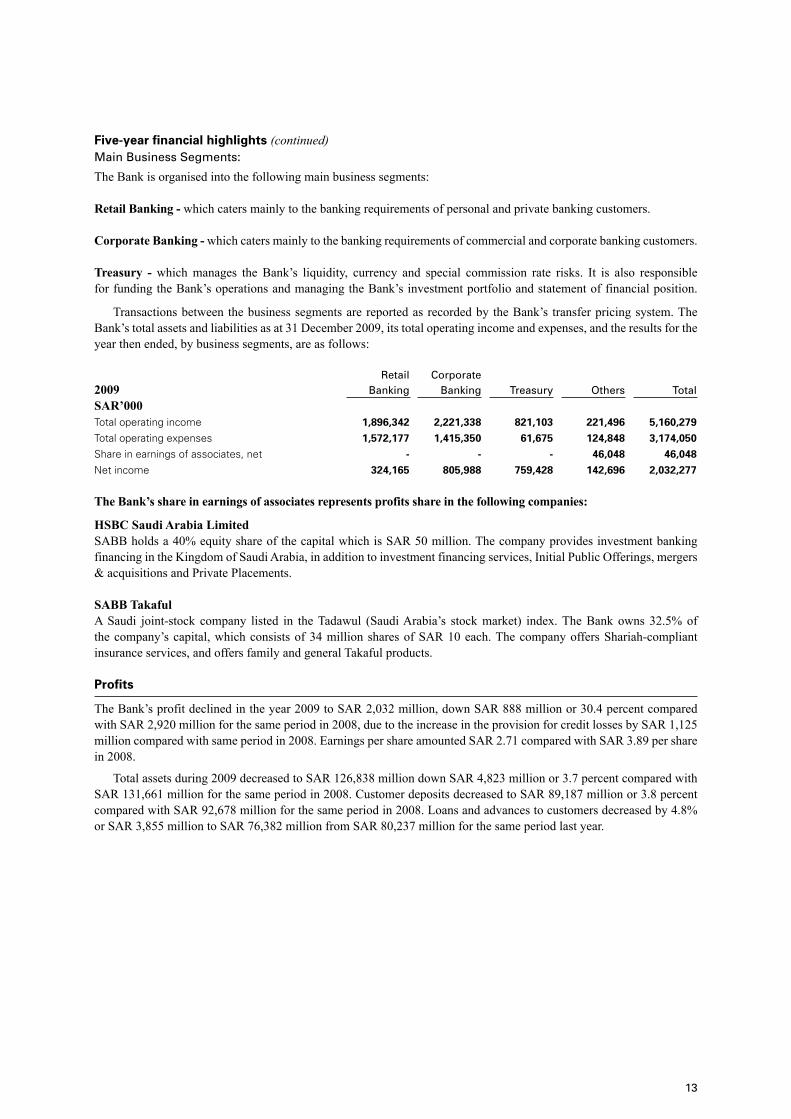
Transactions between the business segments are reported as recorded by the Bank’s transfer pricing system. The Bank’s total assets and liabilities as at 31 December 2009, its total operating income and expenses, and the results for the year then ended, by business segments, are as follows:
Retail Corporate2009 Banking Banking Treasury Others TotalSAR’000Total operating income 1,896,342 2,221,338 821,103 221,496 5,160,279Total operating expenses 1,572,177 1,415,350 61,675 124,848 3,174,050Share in earnings of associates, net - - - 46,048 46,048Net income 324,165 805,988 759,428 142,696 2,032,277
The Bank’s share in earnings of associates represents profits share in the following companies:
HSBC Saudi Arabia LimitedSABB holds a 40% equity share of the capital which is SAR 50 million. The company provides investment banking financing in the Kingdom of Saudi Arabia, in addition to investment financing services, Initial Public Offerings, mergers & acquisitions and Private Placements.
SABB TakafulA Saudi joint-stock company listed in the Tadawul (Saudi Arabia’s stock market) index. The Bank owns 32.5% of the company’s capital, which consists of 34 million shares of SAR 10 each. The company offers Shariah-compliant insurance services, and offers family and general Takaful products.
Profits
The Bank’s profit declined in the year 2009 to SAR 2,032 million, down SAR 888 million or 30.4 percent compared with SAR 2,920 million for the same period in 2008, due to the increase in the provision for credit losses by SAR 1,125 million compared with same period in 2008. Earnings per share amounted SAR 2.71 compared with SAR 3.89 per share in 2008.
Total assets during 2009 decreased to SAR 126,838 million down SAR 4,823 million or 3.7 percent compared with SAR 131,661 million for the same period in 2008. Customer deposits decreased to SAR 89,187 million or 3.8 percent compared with SAR 92,678 million for the same period in 2008. Loans and advances to customers decreased by 4.8% or SAR 3,855 million to SAR 76,382 million from SAR 80,237 million for the same period last year.
14
Directors’ Report (continued)
T H E S A U D I B R I T I S H B A N K
Profits (continued)
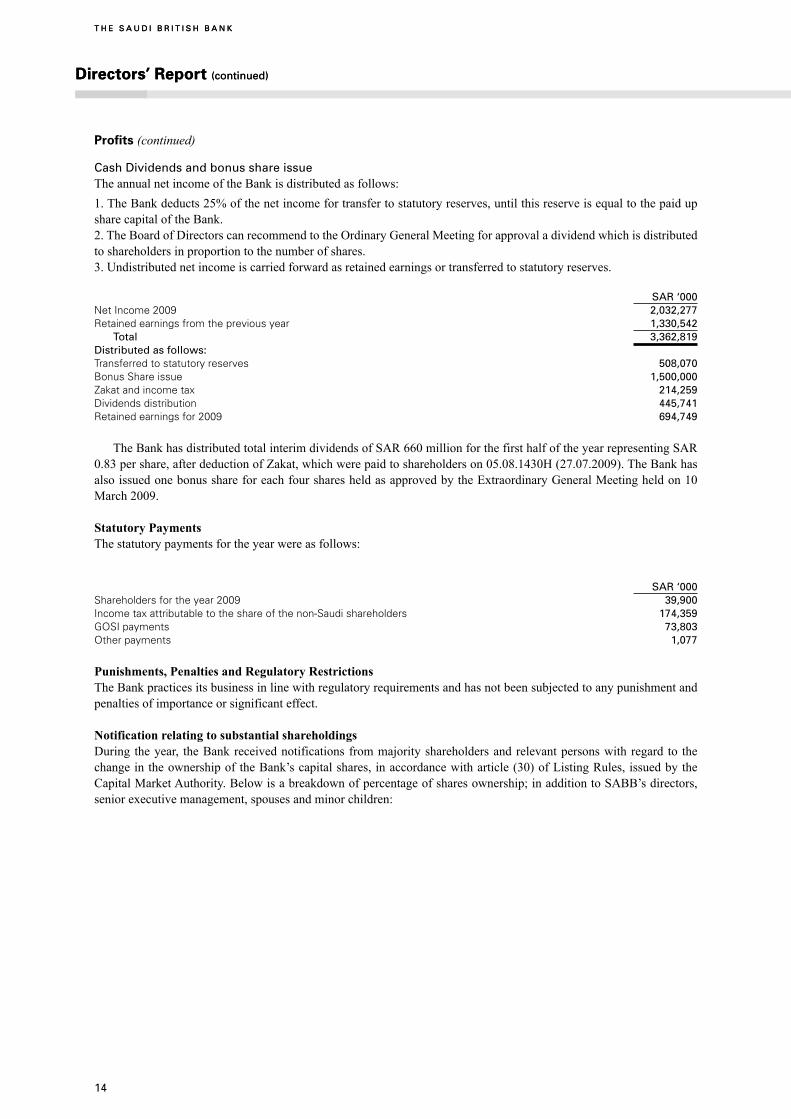
Cash Dividends and bonus share issueThe annual net income of the Bank is distributed as follows:1. The Bank deducts 25% of the net income for transfer to statutory reserves, until this reserve is equal to the paid up share capital of the Bank.2. The Board of Directors can recommend to the Ordinary General Meeting for approval a dividend which is distributed to shareholders in proportion to the number of shares. 3. Undistributed net income is carried forward as retained earnings or transferred to statutory reserves.
SAR ‘000Net Income 2009 2,032,277Retained earnings from the previous year 1,330,542 Total 3,362,819Distributed as follows:Transferred to statutory reserves 508,070Bonus Share issue 1,500,000Zakat and income tax 214,259Dividends distribution 445,741Retained earnings for 2009 694,749
The Bank has distributed total interim dividends of SAR 660 million for the first half of the year representing SAR 0.83 per share, after deduction of Zakat, which were paid to shareholders on 05.08.1430H (27.07.2009). The Bank has also issued one bonus share for each four shares held as approved by the Extraordinary General Meeting held on 10 March 2009.
Statutory PaymentsThe statutory payments for the year were as follows:
SAR ‘000Shareholders for the year 2009 39,900Income tax attributable to the share of the non-Saudi shareholders 174,359GOSI payments 73,803Other payments 1,077
Punishments, Penalties and Regulatory RestrictionsThe Bank practices its business in line with regulatory requirements and has not been subjected to any punishment and penalties of importance or significant effect.
Notification relating to substantial shareholdingsDuring the year, the Bank received notifications from majority shareholders and relevant persons with regard to the change in the ownership of the Bank’s capital shares, in accordance with article (30) of Listing Rules, issued by the Capital Market Authority. Below is a breakdown of percentage of shares ownership; in addition to SABB’s directors, senior executive management, spouses and minor children:
Directors’ Report (continued)
T H E S A U D I B R I T I S H B A N K
15
Profits (continued)
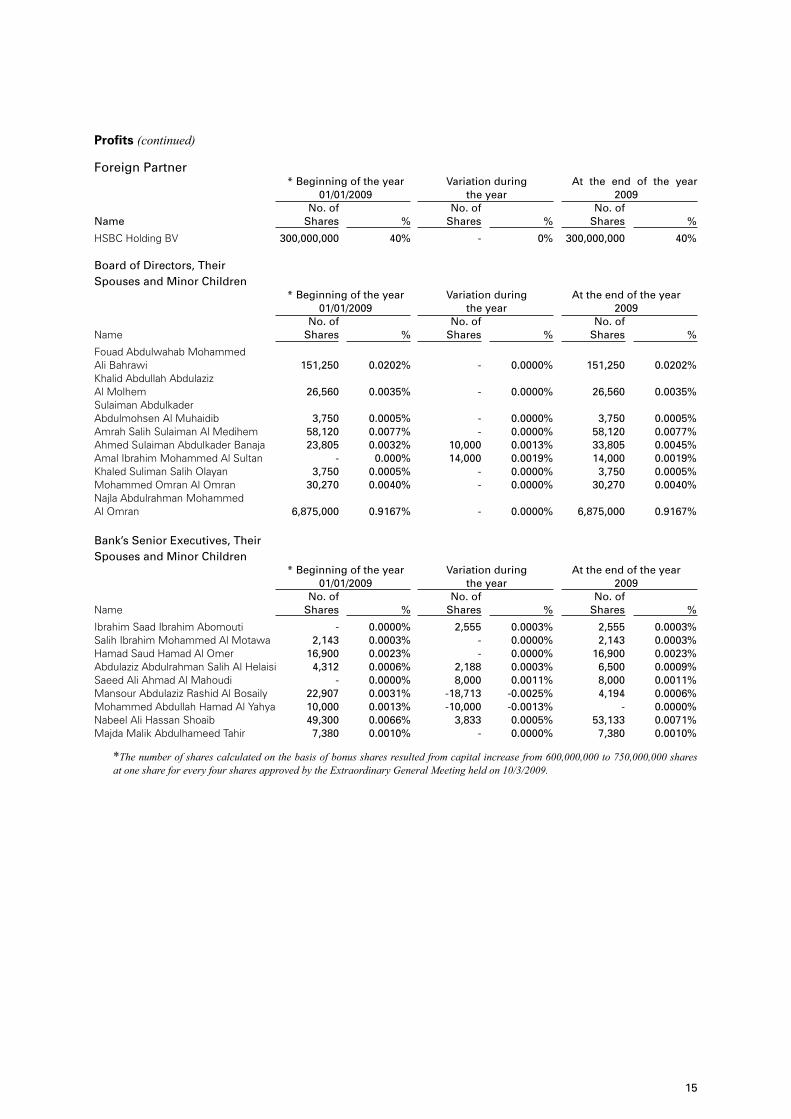
Foreign Partner * Beginning of the year Variation during At the end of the year 01/01/2009 the year 2009 No. of No. of No. of Name Shares % Shares % Shares %
HSBC Holding BV 300,000,000 40% - 0% 300,000,000 40%
Board of Directors, Their Spouses and Minor Children * Beginning of the year Variation during At the end of the year 01/01/2009 the year 2009 No. of No. of No. of Name Shares % Shares % Shares %
Fouad Abdulwahab Mohammed Ali Bahrawi 151,250 0.0202% - 0.0000% 151,250 0.0202%Khalid Abdullah Abdulaziz Al Molhem 26,560 0.0035% - 0.0000% 26,560 0.0035%Sulaiman Abdulkader Abdulmohsen Al Muhaidib 3,750 0.0005% - 0.0000% 3,750 0.0005%Amrah Salih Sulaiman Al Medihem 58,120 0.0077% - 0.0000% 58,120 0.0077%Ahmed Sulaiman Abdulkader Banaja 23,805 0.0032% 10,000 0.0013% 33,805 0.0045%Amal Ibrahim Mohammed Al Sultan - 0.000% 14,000 0.0019% 14,000 0.0019%Khaled Suliman Salih Olayan 3,750 0.0005% - 0.0000% 3,750 0.0005%Mohammed Omran Al Omran 30,270 0.0040% - 0.0000% 30,270 0.0040%Najla Abdulrahman Mohammed Al Omran 6,875,000 0.9167% - 0.0000% 6,875,000 0.9167%
Bank’s Senior Executives, TheirSpouses and Minor Children * Beginning of the year Variation during At the end of the year 01/01/2009 the year 2009 No. of No. of No. of Name Shares % Shares % Shares %
Ibrahim Saad Ibrahim Abomouti - 0.0000% 2,555 0.0003% 2,555 0.0003%Salih Ibrahim Mohammed Al Motawa 2,143 0.0003% - 0.0000% 2,143 0.0003%Hamad Saud Hamad Al Omer 16,900 0.0023% - 0.0000% 16,900 0.0023%Abdulaziz Abdulrahman Salih Al Helaisi 4,312 0.0006% 2,188 0.0003% 6,500 0.0009%Saeed Ali Ahmad Al Mahoudi - 0.0000% 8,000 0.0011% 8,000 0.0011%Mansour Abdulaziz Rashid Al Bosaily 22,907 0.0031% -18,713 -0.0025% 4,194 0.0006%Mohammed Abdullah Hamad Al Yahya 10,000 0.0013% -10,000 -0.0013% - 0.0000%Nabeel Ali Hassan Shoaib 49,300 0.0066% 3,833 0.0005% 53,133 0.0071%Majda Malik Abdulhameed Tahir 7,380 0.0010% - 0.0000% 7,380 0.0010%
*The number of shares calculated on the basis of bonus shares resulted from capital increase from 600,000,000 to 750,000,000 shares at one share for every four shares approved by the Extraordinary General Meeting held on 10/3/2009.
16
Directors’ Report (continued)
T H E S A U D I B R I T I S H B A N K
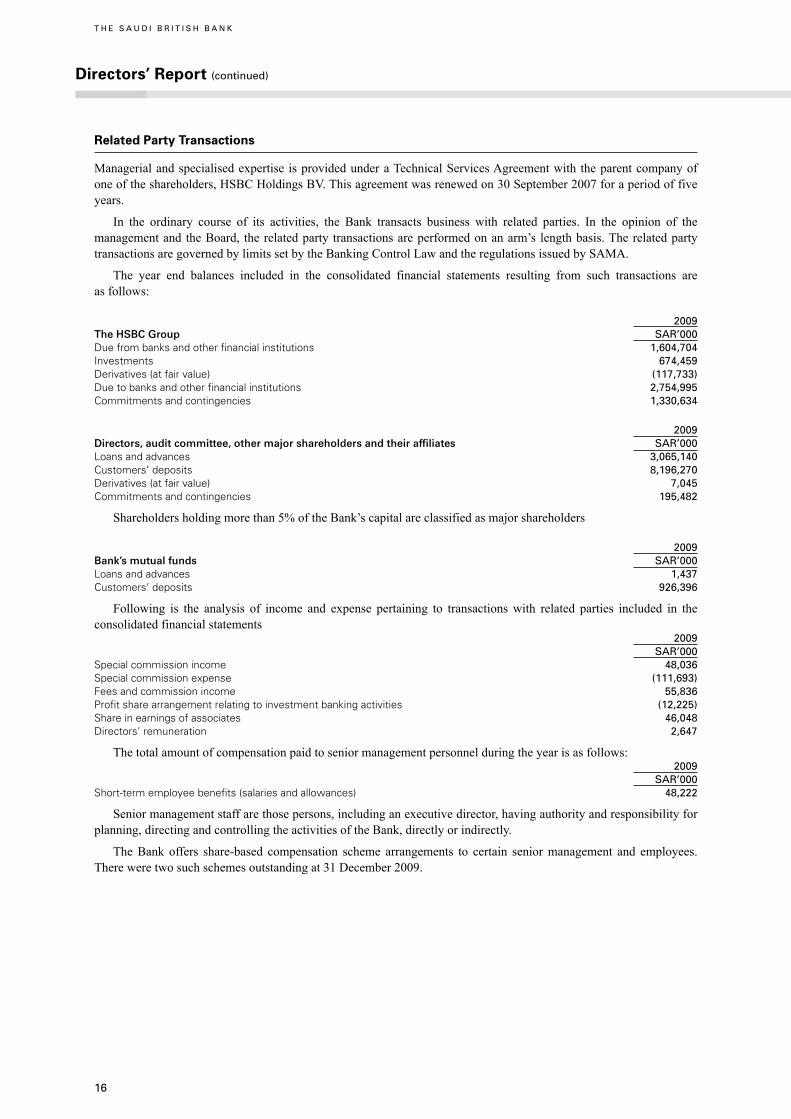
Related Party Transactions
Managerial and specialised expertise is provided under a Technical Services Agreement with the parent company of one of the shareholders, HSBC Holdings BV. This agreement was renewed on 30 September 2007 for a period of five years.
In the ordinary course of its activities, the Bank transacts business with related parties. In the opinion of the management and the Board, the related party transactions are performed on an arm’s length basis. The related party transactions are governed by limits set by the Banking Control Law and the regulations issued by SAMA.
The year end balances included in the consolidated financial statements resulting from such transactions are as follows:
2009The HSBC Group SAR’000 Due from banks and other financial institutions 1,604,704Investments 674,459Derivatives (at fair value) (117,733)Due to banks and other financial institutions 2,754,995Commitments and contingencies 1,330,634
2009Directors, audit committee, other major shareholders and their affiliates SAR’000 Loans and advances 3,065,140Customers’ deposits 8,196,270Derivatives (at fair value) 7,045Commitments and contingencies 195,482
Shareholders holding more than 5% of the Bank’s capital are classified as major shareholders
2009Bank’s mutual funds SAR’000 Loans and advances 1,437Customers’ deposits 926,396
Following is the analysis of income and expense pertaining to transactions with related parties included in the consolidated financial statements 2009 SAR’000 Special commission income 48,036Special commission expense (111,693)Fees and commission income 55,836 Profit share arrangement relating to investment banking activities (12,225) Share in earnings of associates 46,048Directors’ remuneration 2,647
The total amount of compensation paid to senior management personnel during the year is as follows: 2009 SAR’000 Short-term employee benefits (salaries and allowances) 48,222
Senior management staff are those persons, including an executive director, having authority and responsibility for planning, directing and controlling the activities of the Bank, directly or indirectly.
The Bank offers share-based compensation scheme arrangements to certain senior management and employees. There were two such schemes outstanding at 31 December 2009.
17
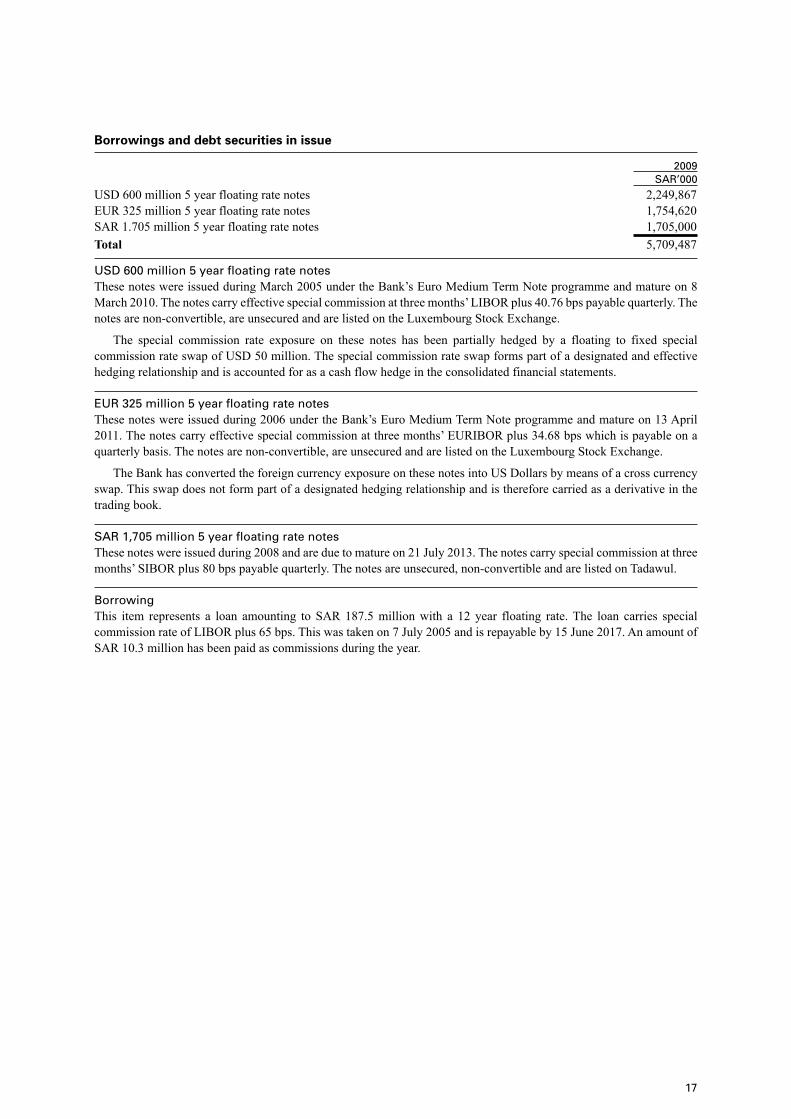
Borrowings and debt securities in issue
2009 SAR’000 USD 600 million 5 year floating rate notes 2,249,867EUR 325 million 5 year floating rate notes 1,754,620SAR 1.705 million 5 year floating rate notes 1,705,000 Total 5,709,487
USD 600 million 5 year floating rate notesThese notes were issued during March 2005 under the Bank’s Euro Medium Term Note programme and mature on 8 March 2010. The notes carry effective special commission at three months’ LIBOR plus 40.76 bps payable quarterly. The notes are non-convertible, are unsecured and are listed on the Luxembourg Stock Exchange.
The special commission rate exposure on these notes has been partially hedged by a floating to fixed special commission rate swap of USD 50 million. The special commission rate swap forms part of a designated and effective hedging relationship and is accounted for as a cash flow hedge in the consolidated financial statements.
EUR 325 million 5 year floating rate notesThese notes were issued during 2006 under the Bank’s Euro Medium Term Note programme and mature on 13 April 2011. The notes carry effective special commission at three months’ EURIBOR plus 34.68 bps which is payable on a quarterly basis. The notes are non-convertible, are unsecured and are listed on the Luxembourg Stock Exchange.
The Bank has converted the foreign currency exposure on these notes into US Dollars by means of a cross currency swap. This swap does not form part of a designated hedging relationship and is therefore carried as a derivative in the trading book.
SAR 1,705 million 5 year floating rate notesThese notes were issued during 2008 and are due to mature on 21 July 2013. The notes carry special commission at three months’ SIBOR plus 80 bps payable quarterly. The notes are unsecured, non-convertible and are listed on Tadawul.
BorrowingThis item represents a loan amounting to SAR 187.5 million with a 12 year floating rate. The loan carries special commission rate of LIBOR plus 65 bps. This was taken on 7 July 2005 and is repayable by 15 June 2017. An amount of SAR 10.3 million has been paid as commissions during the year.
18
Directors’ Report (continued)
T H E S A U D I B R I T I S H B A N K
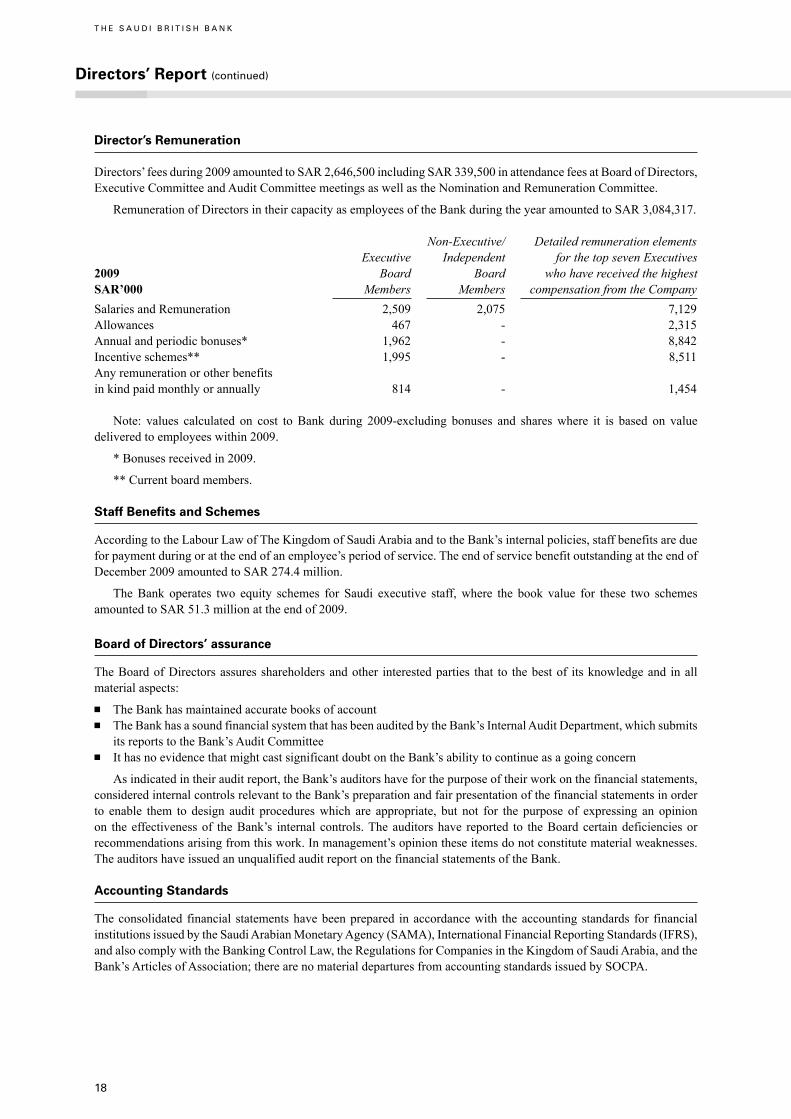
Director’s Remuneration
Directors’ fees during 2009 amounted to SAR 2,646,500 including SAR 339,500 in attendance fees at Board of Directors, Executive Committee and Audit Committee meetings as well as the Nomination and Remuneration Committee.
Remuneration of Directors in their capacity as employees of the Bank during the year amounted to SAR 3,084,317.
Non-Executive/ Detailed remuneration elements Executive Independent for the top seven Executives 2009 Board Board who have received the highest SAR’000 Members Members compensation from the CompanySalaries and Remuneration 2,509 2,075 7,129Allowances 467 - 2,315Annual and periodic bonuses* 1,962 - 8,842Incentive schemes** 1,995 - 8,511Any remuneration or other benefits in kind paid monthly or annually 814 - 1,454
Note: values calculated on cost to Bank during 2009-excluding bonuses and shares where it is based on value delivered to employees within 2009.
* Bonuses received in 2009.
** Current board members.
Staff Benefits and Schemes
According to the Labour Law of The Kingdom of Saudi Arabia and to the Bank’s internal policies, staff benefits are due for payment during or at the end of an employee’s period of service. The end of service benefit outstanding at the end of December 2009 amounted to SAR 274.4 million.
The Bank operates two equity schemes for Saudi executive staff, where the book value for these two schemes amounted to SAR 51.3 million at the end of 2009.
Board of Directors’ assurance
The Board of Directors assures shareholders and other interested parties that to the best of its knowledge and in all material aspects:n The Bank has maintained accurate books of accountn The Bank has a sound financial system that has been audited by the Bank’s Internal Audit Department, which submits its reports to the Bank’s Audit Committeen It has no evidence that might cast significant doubt on the Bank’s ability to continue as a going concern
As indicated in their audit report, the Bank’s auditors have for the purpose of their work on the financial statements, considered internal controls relevant to the Bank’s preparation and fair presentation of the financial statements in order to enable them to design audit procedures which are appropriate, but not for the purpose of expressing an opinion on the effectiveness of the Bank’s internal controls. The auditors have reported to the Board certain deficiencies or recommendations arising from this work. In management’s opinion these items do not constitute material weaknesses. The auditors have issued an unqualified audit report on the financial statements of the Bank.
Accounting Standards
The consolidated financial statements have been prepared in accordance with the accounting standards for financial institutions issued by the Saudi Arabian Monetary Agency (SAMA), International Financial Reporting Standards (IFRS), and also comply with the Banking Control Law, the Regulations for Companies in the Kingdom of Saudi Arabia, and the Bank’s Articles of Association; there are no material departures from accounting standards issued by SOCPA.

19
Board of Directors and Subsidiary Committees
Directors
On 10 March 2009, Mr. Khaled Suliman Olayan was appointed as Chairman of the Board in succession to the late Abdullah Mohammed Al Hugail, and appointed Mr. Mohammed Omran Al-Omran as Director of the Board in the vacant position and his appointment was approved by the General Meeting held on 10 March 2009.
Mr. Richard W L Groves was appointed as Managing Director with effect from 16 March 2009 succeeding Mr. John Coverdale, and Mr. Robin Douglas Jones (Chief Operating Officer) was appointed as a Director of the Board with effect from 16 March 2009.
Mr. Simon Nigel Cooper was appointed a Director of the Board with effect from 21 October 2009 succeeding Mr. Yousef Nasr.
Mr. David Dew was appointed a Director of the Board with effect from 09 December 2009 succeeding Mr. Mukhtar Hussain.
In the light of these changes the Board of Directors as at 31 December 2009 comprised:
Mr. Khaled Suliman Olayan, chairman, independent Board Member, Al-Zamil Industrial Investment Company
Mr. Fouad Abdulwahab Bahrawi, board member, independent Board Member, SABB Takaful Co.
Engr. Khalid Abdullah Al Molhem, board member, independent Board Member, Aseer Company
Mr. Suliman Abdulkader Al Muhaidib, board member, independent
Chairman, A. K. Al-Muhaidib & Sons Group of Companies, Chairman, Secorp Jusrer Co. Board Member, Arabian Pipes Co.
Mr. Ahmed Sulaiman Banaja, board member, independent Board Member, Saudi Economic and Development Co. (SEDCO), Board Member, Al Ahli Takaful, Board Member, Jeddah Urban Development and Regeneration Co., Board Member, Al Faisaliah Group, Board Member, King Abdullah Economic City, Board Member, SEDCO Capital.
Mr. Mohammed Omran Al-Omran, board member, independent Director, Credit Suisse (Saudi Arabia), Director, Saudi Telecommunications Co., Director, Saudi Orex Lease Finance Company, Member, Director, Al-Rajhi Insurance Co.
Mr. Richard W L Groves, executive member
Board Member, SABB Takaful Co.
Mr. David Dew, non-executive member Board Member, SABB Takaful Co.
Mr. Simon Cooper, non-executive member
Mr. Robin D Jones, executive member
20
Directors’ Report (continued)
T H E S A U D I B R I T I S H B A N K
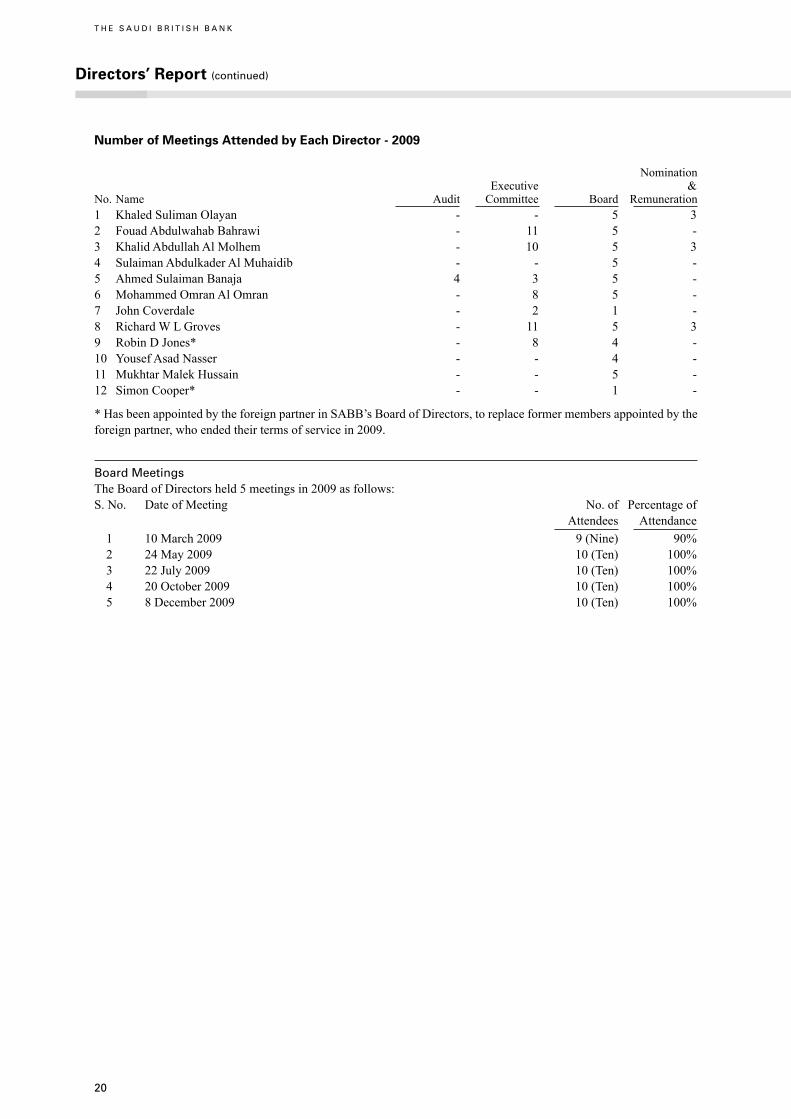
Number of Meetings Attended by Each Director - 2009
Nomination Executive & No. Name Audit Committee Board Remuneration1 Khaled Suliman Olayan - - 5 32 Fouad Abdulwahab Bahrawi - 11 5 -3 Khalid Abdullah Al Molhem - 10 5 34 Sulaiman Abdulkader Al Muhaidib - - 5 -5 Ahmed Sulaiman Banaja 4 3 5 -6 Mohammed Omran Al Omran - 8 5 -7 John Coverdale - 2 1 -8 Richard W L Groves - 11 5 39 Robin D Jones* - 8 4 -10 Yousef Asad Nasser - - 4 -11 Mukhtar Malek Hussain - - 5 -12 Simon Cooper* - - 1 -
* Has been appointed by the foreign partner in SABB’s Board of Directors, to replace former members appointed by the foreign partner, who ended their terms of service in 2009.
Board MeetingsThe Board of Directors held 5 meetings in 2009 as follows: S. No. Date of Meeting No. of Percentage of Attendees Attendance 1 10 March 2009 9 (Nine) 90% 2 24 May 2009 10 (Ten) 100% 3 22 July 2009 10 (Ten) 100% 4 20 October 2009 10 (Ten) 100% 5 8 December 2009 10 (Ten) 100%
21
Executive Committee
The Executive Committee is appointed by the Board in accordance with Article 26 of the Bank’s Articles of Association and consists of the Managing Director (Chairman) and four other members selected from among the Directors. The main task is to assist the Managing Director within the powers determined by the Board to deal with matters referred by MGD or by the Board. The Executive Committee reviews and considers all monthly reports submitted by different Functional Heads, and shall meet twelve times during the year. The members of the Executive Committee as at 31 December 2009 were: Mr. Richard W L Groves, Chairman, Mr. Fouad Abdulwahab Bahrawi, Mr. Khalid Abdullah Al Molhem, Mr. Mohammed Omran Al Omran, Mr. Robin D. Jones.
The Executive Committee held 11 meetings during the year 2009.
Audit Committee
SABB’s Audit Committee was formed in 1992 reporting directly to the Board of Directors, and shall meet four times during the year. The Committee monitors the Bank’s internal and external audit functions and reviews control, weaknesses and system deficiencies. It is also responsible for ensuring that all financial information is of the highest quality, concentrating on critical business issues, which enable the Bank’s external auditors and management to focus on those areas of greatest risk to the business. The members of the Audit Committee as at 31 December 2009 were: Mr. Ahmed Sulaiman Banaja (Chairman), Mr. Ian Stewart Martin and Mr. Mohammed Mutlaq Al Ammaj.
The Audit Committee held 4 meetings during the year 2009.
Property Committee
The Property Committee was formed comprising four members of the Board with a brief to consider and approve the Bank’s expenditure and liabilities in respect of properties including rentals, project costs and related support expenditure in areas such as safety and security. Subjects for the Property Committee are considered by circulation unless the Chairman of the Committee requires a meeting. The members of the Property Committee as at 31 December 2009 were: Mr. Khaled Suliman Olayan (Chairman) with Mr. Sulaiman Abdulkader Al Muhaidib, Mr. Richard W L Groves, Mr. Adel Marzook Al Nasser and Mr. Robin D. Jones.
Nomination and Remuneration Committee
The Nomination and Remuneration Committee was formed by the Board and approved by the General Meeting held on 10 March 2009, and shall meet at least twice during the year. The committee consists of three members of the Board appointed by the Board and reports directly to the Board.
The committee recommends to the Board of Directors the nomination to the Board membership, annually reviews the required needs of skills and capabilities suitable for Board membership (including the time needed by the Board member for the Board business) and reviews the structure of the Board and submit the necessary recommendations. The members of the committee as at 31 December 2009 were: Mr. Khaled Suliman Olayan (Chairman), Mr. Richard W L Groves, and Mr. Khalid Abdullah Al Molhem.
The Nomination and Remuneration Committee held 3 meetings during the year 2009.
Corporate Governance
SABB complies with all Corporate Governance guidelines issued by the Capital Market Authority except the issue of Cumulative Voting which is under consideration. SABB also complies with SAMA guidelines while continuing to adhere to Basel II principles related to risk measurement, capital adequacy and disclosure. The Risk Committee formed by the Bank’s management continues to ensure ongoing compliance with all the guidelines laid down in accordance with best international practice. SABB has prepared its own internal policy in line with the regulatory requirements. The SABB Policy takes into consideration the requirements provided for in the “Principal Concepts of Governance” for banks operating in the Kingdom which will be issued by SAMA soon.
22
Directors’ Report (continued)
T H E S A U D I B R I T I S H B A N K
Directors’ Report (continued)
T H E S A U D I B R I T I S H B A N K
Corporate and Commercial Banking
This year has seen SABB Corporate Banking participate in the financing of some of the Saudi government’s major educational projects, specifically the King Abdullah University for Science and Technology (KAUST) near Jeddah, which was inaugurated in September, and the Princess Noura bint Abdulrahman University in Riyadh.
In what has been a difficult and challenging global economic and business environment, Central Region Corporate Banking has been successful in growing by increasing the level of business from existing clients and by acquiring new clients. In the Western Region, further market penetration has been achieved; integral to which has been a number of landmark deals on behalf of global corporations including a SAR1,000 million inventory finance transaction, a first of its kind, and the provision of large value guarantees for those participating in government sponsored contracts. Additionally, the low interest rate environment has resulted in substantial hedging transactions being completed on behalf of local corporates whilst two prominent Saudi businesses have converted to HSBCnet for their transaction banking. In support of this increased activity, new Saudi staff have been employed and trained.
During the year, increased efforts were made to maximise the synergies within SABB with HSBC Group and to leverage the international reach of the Group as a whole. Integral to this was the segmentation of corporate banking teams and their alignment to the strategy of developing business segments based on the complexity of the underlying business.
With the need for the region to be closer to its corporate customer base, the decision was made to relocate Central Region Corporate Banking area management to a new location in North Riyadh at the intersection of Olaya Road and King Abdullah Road.
Amanah
During 2009, SABB Amanah sustained its growth momentum of previous years by developing and launching new non-interest bearing products and services; by increasing its network to 71 Amanah branches (81% of total SABB branches); and through active participation in the development of global business strategies for the Amanah brand. Integral to this further growth, Amanah made a significant contribution to SABB’s performance during the year.
The highlight of 2009 has been the launch of high quality innovative Amanah products to cater to both personal and business customer demand. The products introduced include the “Amanah Overdraft Flexible Account”, the non-interest bearing alternative to the conventional overdraft – SABB being the first bank to launch such a product in Saudi Arabia; the “Amanah Lending facility”, that enables customers to obtain non-interest bearing finance against shares that they hold; the “Islamic Forex Rate Hedge” product that assists business customers in hedging potential currency fluctuations on their future trade payments; the “Amanah Local Murabaha” product that offers finance to customers, based on locally available products; the “Mudarabah Savings Account” that provides a return on customers’ savings; the “Amanah Overnight Call Deposit Account”, a specially structured account for both corporate and private banking customers; and an enhanced “Amanah Time Deposit” with an automatic renewal option. In addition, two new credit cards were launched, namely Amanah Premier and Amanah Platinum.
As a result of allying SABB with HSBC’s global business strategies, Amanah was also able to introduce the “Global Amanah Premier” proposition to customers in Saudi Arabia in December and anticipates being in a position to launch “Amanah Advance” products early in 2010. Amanah’s plans for the coming year also include a “Home Construction Finance” product that will offer customers progress payment finance when building their own homes.
In support of its activities, SABB Amanah has focussed on attracting well-qualified Saudi staff to its Shariah and product development teams, whilst ensuring the full compliance of all processes and unwavering attention to new and existing product offerings. Furthermore, through the provision of quality training, SABB has ensured better customer service as is evidenced by the marked increase in customer numbers and the level of Amanah business transacted.
In focussing its activities on Amanah, SABB has demonstrated its ability to better understand its customers’ needs and so provide them with a wider range of innovative non-interest bearing financial solutions. This, allied to all the new products launched in 2009 and the ongoing expansion of the Amanah branch network, ensures the potential for considerable further growth in SABB Amanah’s business in the Kingdom in the years to come.

23
Credit and Risk
SABB remains compliant with Basel II requirements and is committed to the progressive adoption of the more advanced approaches to risk assessment.
SABB continues to support the National Data Pooling initiative being undertaken by all banks in conjunction with SIMAH. This initiative seeks to create a consolidated Kingdom-wide database of local credit data that can be used to develop credit risk models meeting Basel II (IRB – internal-rating-based) capital adequacy guidelines associated with probability of default (PD), loss given default (LGD) and exposure at default (EAD) criteria.
Human Resources
SABB’s people and human resource strategies aim to drive a high performing and engaged workforce that has the capability and tools to deliver sustained financial performance with integrity.
Global research clearly indicates that improved employee engagement is a key driver of improved business performance. In 2009 SABB again participated in the annual independent Global People Survey and recorded significant engagement scores well above the norm for the Middle East, surpassing the target that had been set within the Bank for the year. This increase in the employee engagement score is a direct result of the effort and steps taken by all employees in understanding the feedback received from the 2008 survey whilst also discussing, developing and implementing action plans to address the core issues and concerns that were identified.
SABB further pursued its efforts in improving the competence and capabilities of all staff through the provision of world-class training and the implementation of development solutions that enhance leadership capabilities, knowledge, expertise, service delivery and overall career progression.
SABB provides learning and development programmes to personnel at all levels of seniority across the Kingdom. Anti-money-laundering, Basel II compliance, corporate and commercial banking, credit and risk, English language, information technology, leadership, management, operation, sales and services and Takaful all formed the basis of key course deliveries in 2009.
Accreditation programmes for Branch Management, Cash Supervisors as well as for Amanah have been expanded. High performing and high potential executives continue to benefit from HSBC Group strategic leadership and graduate development programmes in the UK and other destinations outside Saudi Arabia.
Utilising the structurally improved performance management system allied to a structured role identification process, SABB actively pursues a performance-based, market-driven compensation strategy that includes participation in annual compensation and benefits surveys in the Kingdom that enable the Bank to keep abreast of ongoing market trends.
SABB remains fully committed to the Saudisation process, undertaking a number of local recruitment drives during the year. High-calibre candidates were identified and attracted from a variety of educational backgrounds through the Bank’s participation in career day events and by offering attachments for quality undergraduates from co-operative programmes and providing summer internships to potential undergraduates. High-quality, mid-career executives were also recruited with considerable commercial and industrial experience and expertise of real benefit to the Bank.
At year end, SABB’s staff complement totalled 3,504 of which 444 were ladies. The Saudisation ratio at 31 December was 87%. During 2009 a total of 48,664 training days were attended by 10,738 delegates.
24
Directors’ Report (continued)
T H E S A U D I B R I T I S H B A N K
Annual review of internal control procedures effectiveness
SABB’s internal control systems and policies were prepared on the basis of enhanced effectiveness which covered Internal Audit, Compliance and Risk functions.
Such functions are considered an essential part of the activities of effective control adopted by the Bank through the provision of independent and objective views of the Bank’s various activities. These organisational functions exercise their roles through periodical internal review of the various sectors of the Bank in accordance with the requirements and supervisory controls, and according to annual work plans approved by the Audit Committee and the Compliance Committee which was formed in line with the requirements of SAMA Compliance Manual for Banks Operating in Saudi Arabia. Based on the above, the Bank’s management extended all aspects of support to the units and functions involved in the internal control in order to ensure that audit and control procedures are carried out in line with the approved internal control policies and systems as well as to ensure the integrity of financial and non-financial procedures and transactions and that the Bank and its staff are in compliance with the rules and local regulations issued by the various competent government departments, supervisory authorities as well as with the policies and internal rules adopted by the Bank’s senior management. The Bank’s management has also effectively contributed to the various specialised committees to ensure development of business and ideal use of available resources supported by the quality and efficacy of central control for development of automated systems and the operation thereof.
In support of the effective control activities, the Bank’s management - during 2009 - established units and internal control and audit committees of credit, operational risk and the committee on the continuous monitoring of branch operations; and has also established a higher committee to follow up the internal audit high-risk recommendations to ensure that they were dealt with in a timely manner. Furthermore, in line with the supervisory regulations a Compliance Committee has been established to oversee all aspects and activities of compliance and to closely monitor all the Bank’s activities in order to measure and handle the risks of non-compliance.
The Risk Department which is managed through dedicated risk business units covering credit, market, operational and other risks together with separate functions manages business continuity, security and fraud risk and compliance. The risk management process is fully integrated with the strategic planning, annual operating and capital planning cycle. SABB’s policies and procedures are formulated and regularly reviewed to establish compliant processes which have adequate segregation of duties, embedded systems controls, along with effective mechanisms for monitoring, controlling and timely reporting to management to mitigate risks.
To ensure highest levels of efficiency, the Bank appointed a Local Compliance Officer along with operational and information risk coordinators, within each business, who were assigned to ensure ongoing compliance with policies and regulations as well as to escalate procedural lapses. Furthermore each employee is expected to be accountable for and manage the risks within their assigned responsibilities, which is reinforced through SABB’s governance framework and training programmes.

25
Future Risk the Bank May Face
SABB operates an autonomous risk function that operates within a well defined risk governance and control framework, which continues to be developed in line with industry best practices and Basel II compliance requirements.
The main risk to which SABB is exposed is credit and counterparty risk, emanating from its corporate and personal banking asset portfolios. Whilst opportunities to grow assets are expected to be driven by continued investment in infrastructure projects and population growth, the uncertainty around the sustainability of the global economic recovery may diminish demand for borrowing and cause financial pressure for companies or individuals exposed to these markets.
Operational risk is inherent in all of SABB’s businesses and during 2009, work has been completed to strengthen capabilities in the areas of information and fraud risk as well as to raise awareness across the Bank regarding reputational risk and business continuity planning.
The level of market risk operated within SABB is low as the Bank focuses on supporting customer transactions with limited speculative trading activities. SABB is exposed to interest rate movements and the reduction in interest income on its surplus deposits which result from lower interest rates.
As the outcome of the financial crisis becomes clearer, there is an expectation that globally banks will face greater scrutiny and regulation, which is likely to require banks to improve transparency on the risks faced and the quality of capital retained to support business activities.
Property and Support Services
Expanding the branch and ATM networks has been a major feature of Property and Support Services’ activities in 2009. Seven new branches were built at Al Quds, Rawabi, Khurais and Sinaiyah in Riyadh; on Prince Sultan Street (including a fully-fledged ladies section and a card centre) and Al Malik Road in Jeddah; and in Tabuk in the Western Province.
At the year end, four more branches were under construction for completion during the first half of 2010 in Hayel, Qatif, Dhahran and Dammam. Looking ahead, five new branches and two ladies sections are in the pipeline, for which premises have already been secured, with construction scheduled for completion in 2010.
In 2009, 40 new ATMs were constructed and began operation and another 21 were under construction and will come into use during the first quarter of 2010. In addition, four Premier Centres were built at Al Suwaidi in Riyadh; in Tahlia Superbranch and Al Zahra on Malik Road in Jeddah; and at Aziziah branch in Makkah.
Central Province Management was relocated in the course of the year to the SABB building at the intersection of King Abdullah and Olaya Roads, whilst Western Province Management was moved to the recently completed SABB Building on Al Malik Road in Jeddah. Additionally, Eastern Province Management’s building was restructured as part of the Bank’s open space policy.
As regards health, safety and the environment, and as part of SABB’s contribution to promoting sustainability and reducing direct impact on the environment, a baseline figure was established in 2008 with a reduction target of 2% by 31 December 2009 in the consumption of electricity, water and paper, the emission of CO2 and the level of waste. The Bank achieved a reduction of 8.4% in electricity consumption and 43.6% in CO2 emissions whilst managing waste production and paper consumption tightly.
Security and fire safety measures continued to be addressed. A new state-of-the-art central monitoring station is now in place covering the branch and off-branch ATM network Kingdom-wide in order to improve vigilance and to protect SABB’s staff, customers and assets.
26
Directors’ Report (continued)
T H E S A U D I B R I T I S H B A N K
Personal Banking
During 2009 SABB retained its status as a leading provider in Saudi Arabia of Personal Banking products and services.
To better serve the Bank’s valued customers, four new branches were opened across the Kingdom during the year thereby increasing SABB’s retail branch network to 88; 72 for men and 16 for ladies. 71 branches out of 88 are Amanah while 17 are conventional branches. All the new locations were selected taking into consideration proximity and convenience for the Bank’s customers.
Further attention has been given to internal restructuring and reorganisation to the benefit of high net worth customers, with specific focus on increasing the number of Premier Centres within the Kingdom. In order to enhance the customer experience for these customers, SABB opened four new Premier Centres; making a total of seven centres Kingdom-wide. These exclusive centres provide Premier customers with specially developed products and services as well as addressing their local and international needs through HSBC’s global network. In addition, SABB has launched new Premier Family Services to extend the provision of non-interest bearing services to the families of Premier customers.
With the launch of the Amanah Premier proposition in six more countries, making the services available in 44 countries around the world, SABB and HSBC Premier customers now have access to a wider range of the very best international retail banking products and services through relationship managers dedicated to providing those financial management solutions best suited to each individual customer’s needs.
To widen the availability of its wealth management offerings, SABB has increased its sales capability across the branch network by ensuring all Al-Imtiaz Business Officers and Premier Relationship Managers attain intermediate wealth management certification that allows them to sell selected SABB Takaful Family products.
Such expansion and increased activity, coupled with focused marketing and sales initiatives, contributed to a year-on-year increase of 28% in the SABB Premier customer base in 2009.
SABB installed a further 40 ATMs in 2009, increasing its network to 472, including 69 new generation Cash Deposit Machines. Moreover, SABB has made considerable progress in introducing chip and PIN technology that enhances security for card customers. SABB Debit (SPAN) chip and PIN cards are expected to be launched early in 2010, to be followed later in the year by chip and PIN credit cards.
SABB continues to be the largest issuer in the credit card business in Saudi Arabia, largely due to the introduction of new products and services as well as the extended distribution of service and support. Credit Card Service Centres in Riyadh, Jeddah and Dammam are part of this initiative, providing customers with immediate responses to their requests. The launch of e-statements on SABBNET, SMS alerts for card transactions made and the introduction of the Extended Payment Plan (AQSAT), that allows customers to spread their card repayments over a fixed period at preferential rates, were among the leading initiatives taken during 2009. The Bank also entered into strategic partnerships with leading retailers, hotels, airlines and other merchants in order to provide exclusive benefits and discounts to SABB credit card holders, whilst introducing Amanah Premier Mastercard and Platinum cards that offer high net worth customers a real choice between conventional and non-interest bearing financial services over a comprehensive range of premium products.
In Direct Banking SABB’s capabilities were upgraded during the year with the introduction of paperless service activation for Online and Telephone Banking and transaction passwords for use with SMS that allow customers to create transfer payment instructions online swiftly and safely. An additional new feature is the provision of Ministry of Interior payment (MOI) services that enable customers to perform government-related payments online and via telephone banking.
Evidence of the success of SABB Direct Banking was the recognition received during the year from Global Finance magazine that honoured the Bank with two awards: “Best Consumer Internet Bank in Saudi Arabia” and “Best Online Consumer Credit Site in the Middle East and Africa”.
27
Operations and Processing
Operations and Processing has been active throughout the year addressing those operations within the Bank that accelerate not only internal processing but also all customer-related activities. Integral to this has been considerable input to the comprehensive development of the core banking systems.
The pre-deployment of these systems benefits derived during 2009 included a considerable reduction in paper usage as a result of issuing only e-statements for all staff accounts, and by cancelling the provision of advices for loan interest payments, and significant savings on the cost of funds on cash balances held by rationalising and reducing the cash holding limits of branches and regional cash centres.
In compliance with SAMA’s instructions, the Bank has successfully implemented the International Bank Account Number (IBAN) system for payments to local banks and SADAD for settlement of all government fees and penalties, resulting in enhanced efficiency and improved straight-through processing. Additionally, the updating of the Correspondent Bank Identification (CBID) file has ensured more rapid outward payment services for customers.
Private Banking
SABB Private Banking maintained its leading status in the Kingdom in 2009 in terms of both market share and the provision of quality investment solutions to wealthy individuals. This it has achieved by providing high-quality services across Saudi Arabia through dedicated offices in Jeddah / Makkah, Riyadh and Al Khobar; from the latter of which clients are also provided with a high level of service in Al Qatif and Al Hasa. Further dedicated Private Banking offices are under consideration for Al Madina, Buraidah and Al Hasa.
In Riyadh, Private Banking also has a dedicated ladies’ team, with expansion to Jeddah and Al Khobar contemplated for 2010.
In addition to SABB Private Banking’s services are those offered to high net worth individuals through HSBC Investment Bank, whilst close relationships have been established with HSBC Private Bank in London and Geneva. Furthermore, SABB relationship managers were seconded to a number of HSBC Group branches overseas during the summer months in order to provide client support. Arrangements were also made for SABB clients to benefit from the services offered by the HSBC Group in several other locations across the globe.
Integral to SABB Private Banking’s undoubted success has been the level of expertise of the Bank’s relationship managers, 90% of whom hold the Saudi Institute of Banking’s Financial Planner certification and some of whom are also accredited to the Institute’s Wealth Management Programme. Investment in high-quality staff is a prime consideration as is the provision of comprehensive training to enhance every team member’s skills, thereby ensuring the provision of the highest standard of advice and level of service.
Recognition of SABB Private Banking’s attainments was again received from Euromoney. Their publication honoured the Bank with its “Best Private Bank in Saudi Arabia” award in 2009, for the second year in succession.
Treasury
Treasury enjoyed a strong and profitable year despite the prevailing low interest rate environment and global economic slowdown. The deterioration of regional credit and market liquidity premiums presented Treasury with various challenges but nevertheless the balance sheet remained healthy with robust liquidity levels. Active interest rate risk management, as well as leading positions in foreign exchange, made a significant contribution to bottom line income and led to excellent results.
Treasury’s focus on hedging and investment products through increased non-interest bearing and conventional product offerings further consolidated SABB’s position among the top derivative houses in the Kingdom. The dedicated sales forces in the Central, Western and Eastern Provinces proved to be highly successful in terms of enhancing key customer coverage and service. A successful Treasury road show was undertaken for the third year running in the key centres of the Kingdom.
28
SABB Securities Limited
Equity BrokerageSABB Securities Limited provides customers with access to the Saudi and major international stock markets worldwide; offering a comprehensive variety of services via several different delivery channels, including fourteen investment centres located across the Kingdom, online services (SABB Tadawul & SABB Mubasher) and phone services via the Brokerage Call Centre.
At the end of 2009, SABB Securities was ranked fourth among 36 active competitors with a market share, in terms of total Saudi market turnover, in excess of 11.5%.
Securities ServicesSecurities Services offers custody and clearing, non-bank financial institutional services (NBFI), institutional funds services (IFS) and corporate trustee and loan agency (CTLA) services to its clients.
Despite difficult market conditions, which impacted on the level of assets under custody, the number of custody accounts continued to grow. Fund administration and corporate trustee services experienced an increase in revenue through the launch of new funds and the signing of major new client relationships.
SABB Securities has been at the forefront of local market developments and was one of the first to offer a Sukuk and bond trading service through the Saudi Stock Exchange (Tadawul).
During 2009, SABB Securities was honoured with Global Finance’s “Best Sub-Custodian Bank in Saudi Arabia” award.
SABB Takaful Limited
SABB Takaful is a leading provider of Islamic insurance products in Saudi Arabia. Capitalised at SAR 340 million, SABB Takaful was the first Takaful company in the Kingdom to be listed on the Saudi Stock Exchange (Tadawul) and is 32.5% owned by SABB and 32.5% by subsidiaries of the HSBC Group, with the balance being held by the general public following an Initial Public Offering in July 2007. During 2009, SABB Takaful obtained approval from the Capital Market Authority to raise its capital by way of a rights issue. This was the first such issue by an insurance company in the Kingdom and raised SAR 240 million.
SABB Takaful offers a comprehensive range of Takaful plans to meet individual and corporate customers’ protection needs in the Kingdom, including Shariah-compliant protection and savings schemes for individuals and families as well as property and marine plans for commercial customers. As at the year end, SABB Takaful was the sixth largest insurance company in the country, as per gross contribution written in 2009, which amounted to in excess of SAR 217 million. In attaining this milestone, SABB’s Family Takaful business saw a rise year-on-year approaching 200%.
Several factors have contributed to the success of SABB Takaful: a compelling proposition, a comprehensive product range, practical use of technology, a successful Bank Takaful model focusing on customer service, innovative marketing campaigns and the high quality of the company’s staff. The awards detailed below highlight the broad appeal of SABB Takaful’s comprehensive range of General and Life products for both personal and corporate customers.
In July this year Philip Head, with more than 30 years experience in the global insurance industry, was appointed the Company’s new Chief Executive Officer.
In pursuing its activities, SABB Takaful received three awards in 2009: Euromoney’s “Best Global Takaful Provider” award and two International Takaful Awards; “Best Takaful Marketing”, for formulating the best marketing campaign for promoting Takaful products and services, and “Best Takaful Product” for the Company’s innovative Simple Savings Takaful Plan.
SABB Insurance Services Limited (SISL)
SABB Insurance Services Limited (SISL) provides high-end insurance brokerage services to Corporate, Commercial and Private Banking clients.
Having commenced business in 2008, SISL consolidated its market position this year recording 100% growth in its top line revenue base over that achieved a year earlier. Over thirty new accounts were acquired during the year whilst the company was continuing to build on its level of expertise and implementing best global practice.
Directors’ Report (continued)
T H E S A U D I B R I T I S H B A N K

29
HSBC Saudi Arabia Limited
HSBC Saudi Arabia Limited, SABB and the HSBC Group’s joint venture investment banking arm in the Kingdom, was incorporated in 2006 and licensed by the Saudi Capital Market Authority for all five licensed activities (Dealing, Managing, Arranging, Advising and Custody). HSBC Saudi Arabia Limited is 40% owned by SABB and 60% by HSBC Holdings plc, through HSBC Asia Holdings BV.
The company’s main services are as follows:
Asset ManagementThe Asset Management Division of HSBC Saudi Arabia maintained its market leadership in local equity funds with a market share of 10.8% as at the end December 2009 and was ranked fourth in terms of overall market share amongst asset managers in the Kingdom. The Division’s investment products are now being marketed across the GCC in partnership with HSBC Bank Middle East. Of special note is HSBC Saudi Arabia’s leading role in product innovation as exemplified by the launch of a capital protected fund linked to the performance of the Saudi equity market. This non-interest bearing fund was well received by clients as it offers the opportunity to participate in one of the Middle East’s most promising equity markets whilst enjoying protection from downside risk.
HSBC Saudi Arabia continues to broaden the offering of Saudi Access Products to foreign investors through HSBC Bank plc, a process authorised in August 2008 when single stock access to foreign investors through swaps was first offered in addition to exposure to the Saudi market through mutual funds. The inflow of funds from foreign investors into the Saudi equity market through swaps with HSBC Saudi Arabia enjoying a preeminent position in this offering.
Investment Banking AdvisoryHSBC Saudi Arabia sustained its prominent position among the Kingdom’s banks in both equity capital markets and mergers and acquisitions. During the year, the Division led the IPO of Mouwasat Medical Services company, one of only two premium IPOs in KSA to have taken place in 2009. Since 2003, HSBC Saudi Arabia has led more equity issues in Saudi Arabia than any other financial adviser; 19 in total with a value in excess of SAR 24,000 million.
Investment Banking Finance – Debt Capital Markets and Syndicated FinanceHSBC Saudi Arabia Limited continued to lead the debt capital and syndicated finance markets in Saudi Arabia, a position it has held since inception. During the year, HSBC successfully led 4 local debt capital market issuances and actively distributed local and international offerings in Saudi Arabia, helping its clients locally and internationally to raise more than SAR 13,500 million from the local market. HSBC was a lead manager in 2009 in Saudi Electricity Company’s second Sukuk offering, which resulted in the largest order book in the history of the Saudi market totalling in excess of SAR 20,000 million.
Also, despite the challenges in the loan market in 2009, HSBC in conjunction with SABB participated at a lead level in more than 3 syndicated loans as well as lead managing loan restructuring activities that helped clients to secure, refinance and reschedule more than SAR 9,000 million.
Project and Export Finance HSBC Saudi Arabia maintained its leading project and export finance advisory and arranging roles in the Kingdom with activities covering a wide spectrum of industries from refining and petrochemicals to power generation and mineral extraction. A key role was played in the financing of the Rabigh IPP, a USD 24,000 million greenfield power project - the only major project financing to reach financial close in Saudi Arabia during 2009 - and was appointed during the fourth quarter of the year as financial advisor to the Sumitomo Corporation, Tenaga Nasional Berhad and Saudi Bin Laden consortium in their bid for the Riyadh IPP, a 2,000MW power plant being developed for Saudi Electricity Company.
International RecognitionDuring 2009, HSBC Saudi Arabia won Euromoney’s “Best Investment Bank in Saudi Arabia” award for the second time in three years; was a major contributor to HSBC Bank Middle East’s “Best Debt House in the Middle East” award; won the Lipper Fund Awards for the “Best Saudi Equity Fund” (over a 10 year period); and was the trophy winner for the “Best Gulf Islamic Equity Fund” over 3 years.
30
Community Service and Sustainability
SABB is a dynamic participant in community and charitable activities. During 2009, the Bank carried out many initiatives under the umbrella of “SABB in the Community Programmes”, which focuses on themes of education, environment and support of community needs. Key contributions by the Bank in 2009 included the following activities:
During the year, Sheikh Khaled Bin Suliman Olayan, Chairman of SABB and H.E. Dr. Yousef Bin Ahmed Al-Othaimeen, Minister of Social Affairs, signed a Memorandum of Understanding between SABB and the Ministry of Social Affairs, for support of the “Productive Families” scheme in Mahayel Aseer in the Southern Region under the supervision of the Ministry of Social Affairs. The scheme seeks to provide sesame oil pressing mills to needy families in Mahayel Aseer, assisting social security beneficiaries in earning a living and to support their other productive projects.
During the year SABB has maintained its support for many charitable societies including: the Blind Association Charity (Kafeef), the Anti-Smoking Charitable Association, and the Al-Nahda Schools for Down’s syndrome, which was established by the Al-Nahda Philanthropic Society for Women and to which SABB has provided annual support since 1995. SABB also supports the Prince Salman Center for Disability Research which creates development projects for individuals with special needs and contributes to raising awareness of disability and enhancing the living standards of those with special needs whilst helping them to realise much of their potential.
The Bank maintained its support of the Riyadh Orphans Care Charitable Society (ENSAN) whose aim is to support orphans. Covered under this initiative is the KSA School Bag Programme which helps provide all the needs of students during the school year. The Bank also undertakes to assist orphans in performing Umrah during Ramadan and supports the Diploma Programme for a selected group of orphans to obtain qualifications in various fields, thereby enabling them to work and sustain their living.
SABB gives considerable attention to training and educational programmes through SABB’s Cooperative Training Programme, which enables university and institute students to acquire the skills needed to support their university graduation requirements. In addition, the Bank supports summer student training programmes and as well as the educational initiatives of the Society of Chartered Public Accountants. SABB also contributes to the training programmes offered by SAMA to the judges of the Ministry of Justice and Bureau of Grievances.
On the environmental front, SABB sponsored the “Environment Awareness Programme” in coordination with the National Commission for Wildlife Conservation and Development, which aims at enhancing awareness of the importance of environment protection and preservation of wildlife, particularly among our younger generations. SABB also continued in 2009 to contribute to a number of environment initiatives in which SABB staff participated in cooperation with municipalities in different regions. These included the clearing of the Al-Washela Valley in Riyadh and of the Half Moon Beach in Al-Khobar.
In addition, the Bank maintained its numerous annual programmes, among them the SABB MBA Scholarship Programme and the blood donation initiative which is always willingly supported by many of the Bank’s staff.
Directors’ Report (continued)
T H E S A U D I B R I T I S H B A N K

31
International Recognition This year SABB won two major awards, the first being “Strongest Bank in the Kingdom of Saudi Arabia for 2009” and seventh strongest Bank among 92 banks in the Middle East by The Asian Banker Magazine. This evaluation is based on principal parameters such as growth of balance sheet, details of risks and liquidity in light of the recent international financial crisis.
The Bank received the second major award “Best Bank in the Kingdom of Saudi Arabia” by The Banker Magazine at the end of the year.
Other awards received by SABB which clearly reflect the strong position of the Bank across the different sectors were: “World’s Best Internet Banks in the Middle East and Africa” by Global Finance for the fourth year in a row, “Best Trade Finance Provider in KSA for 2009”, and “The Number 1 Cash Management Bank” by Euromoney, which was awarded subsequent to a survey of thousands of cash managers, treasury managers and financial officials on the global level.
32
INDEPENDENT AUDITORS’ REPORT
T H E S A U D I B R I T I S H B A N K
To the Shareholders of The Saudi British Bank (A Saudi Joint Stock Company)
We have audited the accompanying consolidated financial statements of The Saudi British Bank (the “Bank”) and its subsidiary, which comprise the consolidated statements of financial position as at 31 December 2009, and the consolidated statements of income, comprehensive income, changes in shareholders’ equity and cash flows for the year then ended, and a summary of significant accounting policies and other explanatory notes from 1 to 41, other than note 38, and the infromation related to “Basel II disclosures” cross-referenced therein, which is not required to be within the scope of our audit.
Management’s Responsibility for the Consolidated Financial StatementsManagement is responsible for the preparation and fair presentation of these consolidated financial statements in accordance with Accounting Standards for Financial Institutions issued by the Saudi Arabian Monetary Agency, International Financial Reporting Standards, the provisions of the Regulations for Companies and the Banking Control Law in the Kingdom of Saudi Arabia and the Bank’s Articles of Association. This responsibility includes designing, implementing and maintaining internal control relevant to the preparation and fair presentation of consolidated financial statements that are free from material misstatement, whether due to fraud or error; selecting and applying appropriate accounting policies; and making accounting estimates that are reasonable in the circumstances.
Auditors’ ResponsibilityOur responsibility is to express an opinion on these consolidated financial statements based on our audit. We conducted our audit in accordance with generally accepted auditing standards in the Kingdom of Saudi Arabia and International Standards on Auditing. Those standards require that we comply with ethical requirements and plan and perform the audit to obtain reasonable assurance whether these consolidated financial statements are free from material misstatement.
An audit involves performing procedures to obtain audit evidence about the amounts and disclosures in the financial statements. The procedures selected depend on the auditor’s judgment, including the assessment of the risks of material misstatement of the financial statements, whether due to fraud or error. In making those risk assessments, the auditor considers internal control relevant to the entity’s preparation and fair presentation of the financial statements in order to design audit procedures that are appropriate in the circumstances, but not for the purpose of expressing an opinion on the effectiveness of the entity’s internal control. An audit also includes evaluating the appropriateness of accounting policies used and the reasonableness of accounting estimates made by management, as well as evaluating the overall presentation of the financial statements.
We believe that the audit evidence we have obtained is sufficient and appropriate to provide a basis for our audit opinion.
33
OpinionIn our opinion, the consolidated financial statements taken as a whole:n present fairly, in all material respects, the consolidated financial position of the Bank and its subsidiary as at
31 December 2009, and its financial performance and cash flows for the year then ended in accordance with Accounting Standards for Financial Institutions issued by the Saudi Arabian Monetary Agency and with International Financial Reporting Standards; and
n comply with the requirements of the Regulations for Companies, the Banking Control Law in the Kingdom of Saudi Arabia and the Bank’s Articles of Association in so far as they affect the preparation and presentation of the consolidated financial statements.
34
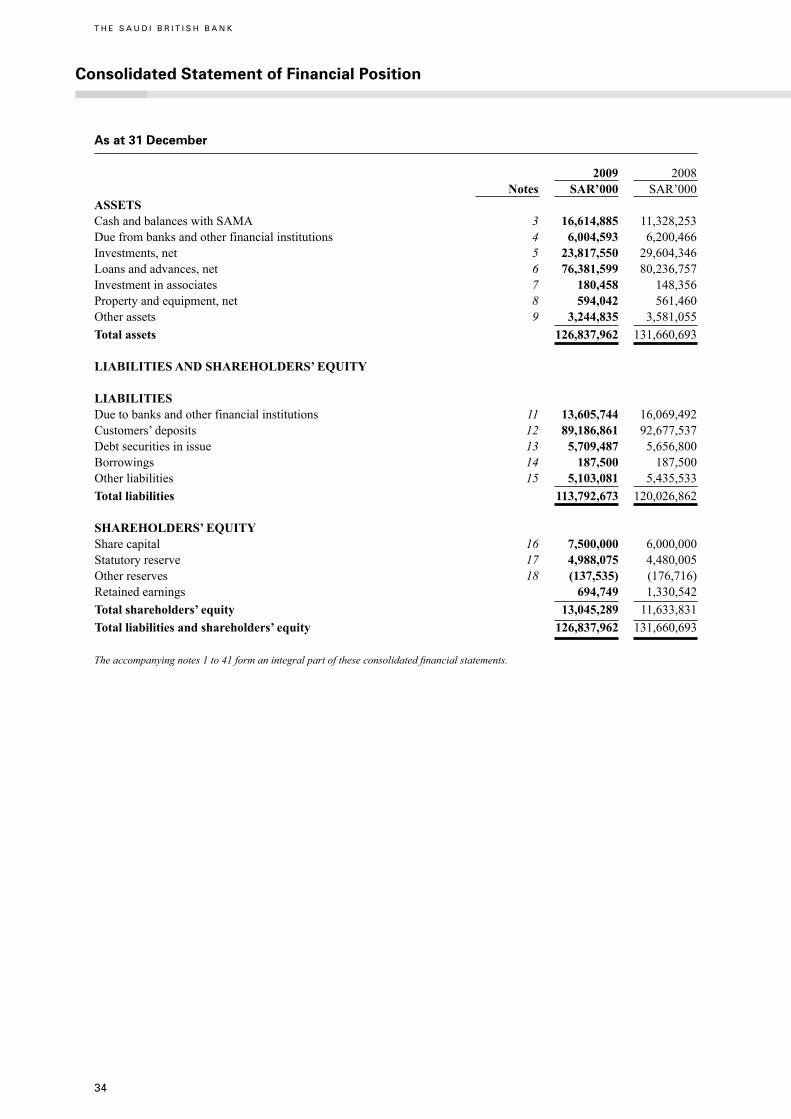
As at 31 December
2009 2008 Notes SAR’000 SAR’000ASSETS Cash and balances with SAMA 3 16,614,885 11,328,253Due from banks and other financial institutions 4 6,004,593 6,200,466Investments, net 5 23,817,550 29,604,346Loans and advances, net 6 76,381,599 80,236,757Investment in associates 7 180,458 148,356Property and equipment, net 8 594,042 561,460Other assets 9 3,244,835 3,581,055Total assets 126,837,962 131,660,693
LIABILITIES AND SHAREHOLDERS’ EQUITY LIABILITIESDue to banks and other financial institutions 11 13,605,744 16,069,492Customers’ deposits 12 89,186,861 92,677,537Debt securities in issue 13 5,709,487 5,656,800Borrowings 14 187,500 187,500Other liabilities 15 5,103,081 5,435,533Total liabilities 113,792,673 120,026,862 SHAREHOLDERS’ EQUITY Share capital 16 7,500,000 6,000,000Statutory reserve 17 4,988,075 4,480,005Other reserves 18 (137,535) (176,716)Retained earnings 694,749 1,330,542Total shareholders’ equity 13,045,289 11,633,831Total liabilities and shareholders’ equity 126,837,962 131,660,693
The accompanying notes 1 to 41 form an integral part of these consolidated financial statements.
Consolidated Statement of Financial Position
T H E S A U D I B R I T I S H B A N K

35
Consolidated Statement of Income
T H E S A U D I B R I T I S H B A N K
For the years ended 31 December
2009 2008 Notes SAR’000 SAR’000Special commission income 20 4,573,599 5,864,966Special commission expense 20 1,136,857 2,657,922Net special commission income 3,436,742 3,207,044
Fees and commission income, net 21 1,210,734 1,257,222Exchange income, net 127,265 138,310Income (losses) from FVIS financial instruments, net 22 6,567 (42,400)Trading income, net 23 295,982 363,569Dividend income 1,453 1,770Gains (losses) on non-trading investments, net 24 48,828 (17,010)Other operating income 32,708 3,023Total operating income 5,160,279 4,911,528
Salaries and employee related expenses 919,395 898,078Rent and premises related expenses 82,159 79,459Depreciation 8 111,289 107,395Other general and administrative expenses 564,706 556,612Provision for credit losses, net 6 1,496,483 371,280Impairment of other financial assets - 86,929Other operating expenses 18 77Total operating expenses 3,174,050 2,099,830
Income from operating activities 1,986,229 2,811,698Share in earnings of associates, net 7 46,048 108,321Net income for the year 2,032,277 2,920,019Basic and diluted earnings per share (in SAR) 25 2.71 3.89
The accompanying notes 1 to 41 form an integral part of these consolidated financial statements.
36
Consolidated Statements of Comprehensive Income
T H E S A U D I B R I T I S H B A N K
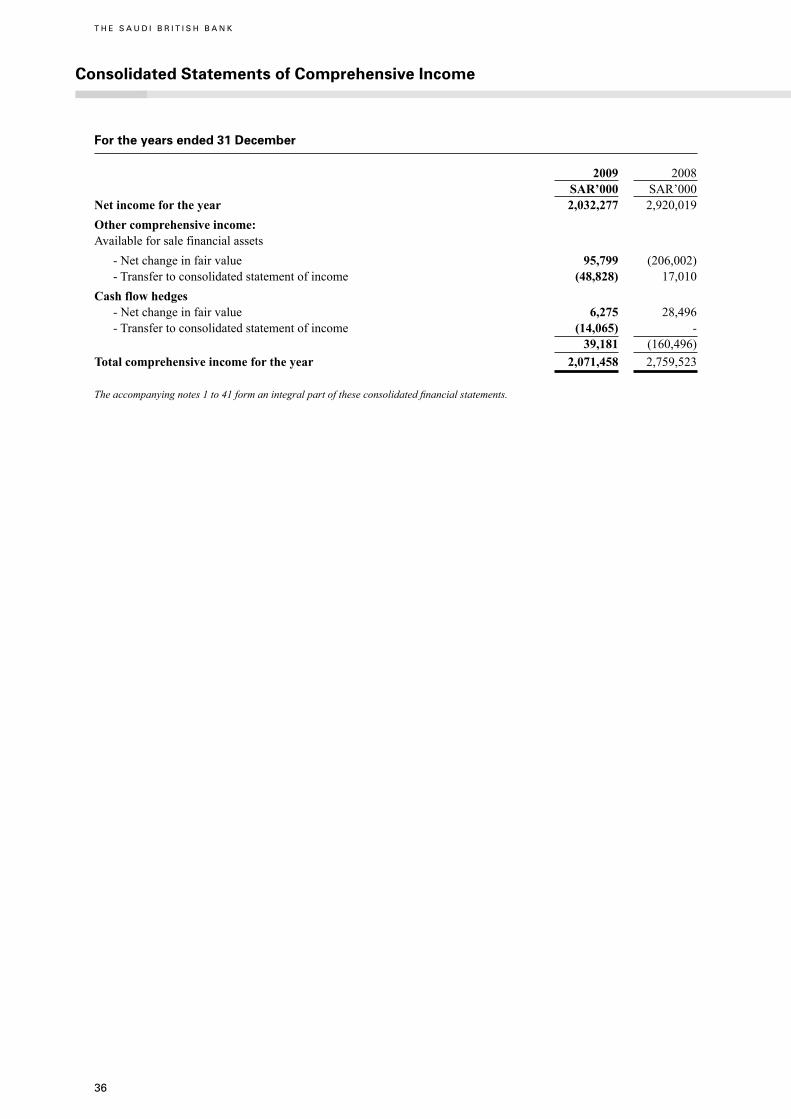
For the years ended 31 December
2009 2008 SAR’000 SAR’000Net income for the year 2,032,277 2,920,019Other comprehensive income:Available for sale financial assets - Net change in fair value 95,799 (206,002) - Transfer to consolidated statement of income (48,828) 17,010Cash flow hedges - Net change in fair value 6,275 28,496 - Transfer to consolidated statement of income (14,065) - 39,181 (160,496)Total comprehensive income for the year 2,071,458 2,759,523
The accompanying notes 1 to 41 form an integral part of these consolidated financial statements.
37
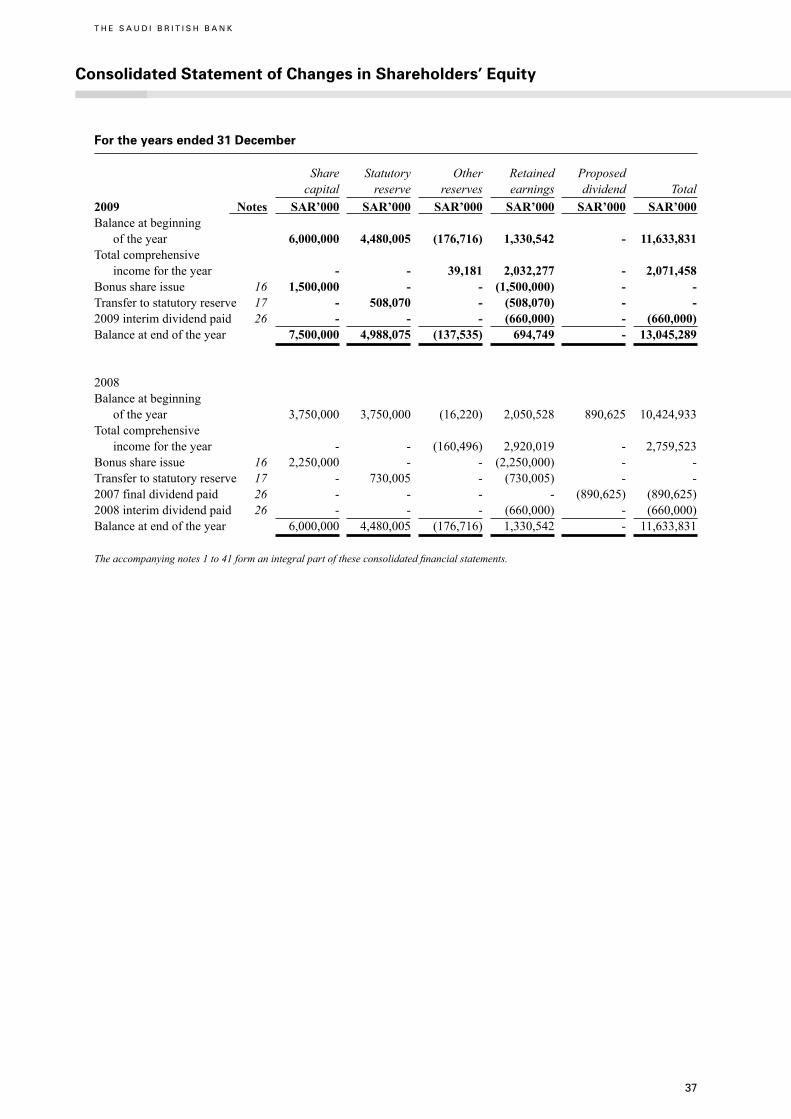
For the years ended 31 December
Share Statutory Other Retained Proposed capital reserve reserves earnings dividend Total2009 Notes SAR’000 SAR’000 SAR’000 SAR’000 SAR’000 SAR’000Balance at beginning of the year 6,000,000 4,480,005 (176,716) 1,330,542 - 11,633,831Total comprehensive income for the year - - 39,181 2,032,277 - 2,071,458Bonus share issue 16 1,500,000 - - (1,500,000) - -Transfer to statutory reserve 17 - 508,070 - (508,070) - -2009 interim dividend paid 26 - - - (660,000) - (660,000)Balance at end of the year 7,500,000 4,988,075 (137,535) 694,749 - 13,045,289
2008Balance at beginning of the year 3,750,000 3,750,000 (16,220) 2,050,528 890,625 10,424,933Total comprehensive income for the year - - (160,496) 2,920,019 - 2,759,523Bonus share issue 16 2,250,000 - - (2,250,000) - -Transfer to statutory reserve 17 - 730,005 - (730,005) - -2007 final dividend paid 26 - - - - (890,625) (890,625)2008 interim dividend paid 26 - - - (660,000) - (660,000)Balance at end of the year 6,000,000 4,480,005 (176,716) 1,330,542 - 11,633,831
The accompanying notes 1 to 41 form an integral part of these consolidated financial statements.
Consolidated Statement of Changes in Shareholders’ Equity
T H E S A U D I B R I T I S H B A N K
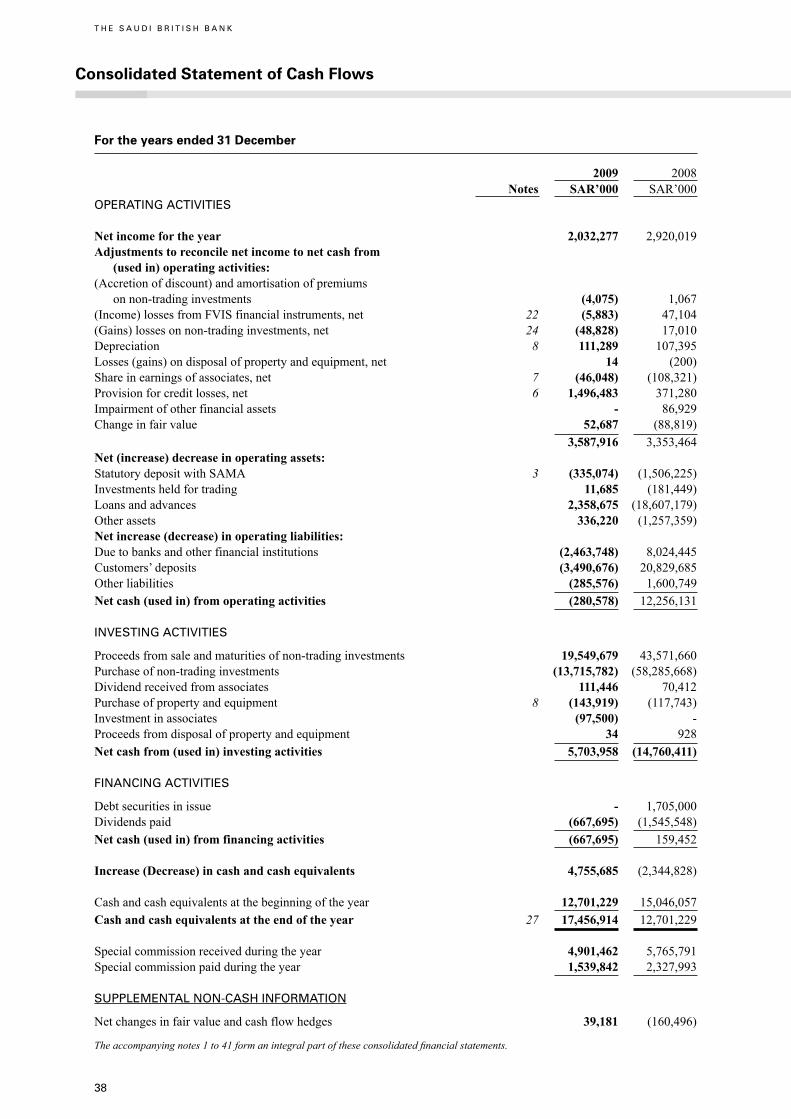
38
Consolidated Statement of Cash Flows
T H E S A U D I B R I T I S H B A N K
For the years ended 31 December
2009 2008 Notes SAR’000 SAR’000OPERATING ACTIVITIES
Net income for the year 2,032,277 2,920,019Adjustments to reconcile net income to net cash from (used in) operating activities:(Accretion of discount) and amortisation of premiums on non-trading investments (4,075) 1,067(Income) losses from FVIS financial instruments, net 22 (5,883) 47,104(Gains) losses on non-trading investments, net 24 (48,828) 17,010Depreciation 8 111,289 107,395Losses (gains) on disposal of property and equipment, net 14 (200)Share in earnings of associates, net 7 (46,048) (108,321)Provision for credit losses, net 6 1,496,483 371,280Impairment of other financial assets - 86,929Change in fair value 52,687 (88,819) 3,587,916 3,353,464Net (increase) decrease in operating assets: Statutory deposit with SAMA 3 (335,074) (1,506,225)Investments held for trading 11,685 (181,449)Loans and advances 2,358,675 (18,607,179)Other assets 336,220 (1,257,359)Net increase (decrease) in operating liabilities: Due to banks and other financial institutions (2,463,748) 8,024,445Customers’ deposits (3,490,676) 20,829,685Other liabilities (285,576) 1,600,749Net cash (used in) from operating activities (280,578) 12,256,131
INVESTING ACTIVITIES
Proceeds from sale and maturities of non-trading investments 19,549,679 43,571,660Purchase of non-trading investments (13,715,782) (58,285,668)Dividend received from associates 111,446 70,412Purchase of property and equipment 8 (143,919) (117,743)Investment in associates (97,500) -Proceeds from disposal of property and equipment 34 928Net cash from (used in) investing activities 5,703,958 (14,760,411)
FINANCING ACTIVITIES
Debt securities in issue - 1,705,000Dividends paid (667,695) (1,545,548)Net cash (used in) from financing activities (667,695) 159,452
Increase (Decrease) in cash and cash equivalents 4,755,685 (2,344,828) Cash and cash equivalents at the beginning of the year 12,701,229 15,046,057Cash and cash equivalents at the end of the year 27 17,456,914 12,701,229 Special commission received during the year 4,901,462 5,765,791Special commission paid during the year 1,539,842 2,327,993 SUPPLEMENTAL NON-CASH INFORMATION
Net changes in fair value and cash flow hedges 39,181 (160,496)
The accompanying notes 1 to 41 form an integral part of these consolidated financial statements.
39
Notes to the Consolidated Financial Statements (31 December 2009)
T H E S A U D I B R I T I S H B A N K
1. General
The Saudi British Bank (the Bank) is a Saudi Joint Stock Company and was established by Royal Decree No. M/4 dated 12 Safar 1398H (21 January 1978). The Bank formally commenced business on 26 Rajab 1398H (1 July 1978) with the taking over of the operations of The British Bank of the Middle East in the Kingdom of Saudi Arabia. The Bank operates under Commercial Registration No. 1010025779 dated 22 Dhul Qadah 1399H (13 October 1979) as a commercial bank through a network of 72 branches (2008: 68) and 31 exclusive ladies’ sections (2008: 31) in the Kingdom of Saudi Arabia. The Bank employed 3,504 staff members as at 31 December 2009 (2008: 3,395). The address of the Bank’s head office is as follows:
The Saudi British Bank P.O. Box 9084 Riyadh 11413 Kingdom of Saudi Arabia
The objectives of the Bank are to provide a range of banking services. The Bank also provides non-interest bearing products, which are approved and supervised by an independent Shariah Board established by the Bank.
The Bank has 100% (2008: 100%) ownership interest in a subsidiary, SABB Securities Limited, a Limited Liability Company formed in accordance with the Capital Market Authority’s Resolution No. 2007-35-7 dated 10 Jamada II 1428H (25 June 2007) and registered in the Kingdom of Saudi Arabia under commercial registration No. 1010235982 dated 8 Rajab 1428H (22 July 2007). The Bank has 98% direct and 2% indirect ownership interest in its subsidiary (the indirect ownership is held via a Limited Liability Company registered in Kingdom of Saudi Arabia). The activities of the subsidiary are to engage in business of custody and dealing as an agent excluding underwriting.
The Bank has 100% (2008: 100%) ownership interest in a subsidiary, SABB Insurance Agency Company Limited, a Limited Liability Company registered in the Kingdom of Saudi Arabia under commercial registration No. 1010235187 dated 18 Jumada II 1428H (3 July 2007). The Bank has 98% direct and 2% indirect ownership interest in its subsidiary (the indirect ownership is held via a Limited Liability Company registered in Kingdom of Saudi Arabia). The principal activity is to act as a sole insurance agent for SABB Takaful Company (an associate company _ see note 7) within Kingdom of Saudi Arabia as per the agreement between them. However, the Article of Association does not restrict the Company from acting as an agent to any other insurance company in the Kingdom of Saudi Arabia.
The Bank has 51% (2008: 51%) ownership interest in a subsidiary, SABB Insurance Services Limited, a Limited Liability Company registered in the Kingdom of Saudi Arabia under commercial registration number 1010241209 dated 24 Dhul Qadah 1428H (4 December 2007). The principal activity is to act as insurance brokers and consultants to consumers operating within the Kingdom of Saudi Arabia. The Company commenced its operations from 24 Dhul Qadah 1428H (4 December 2007).
1.1. Basis of preparation
a) Statement of compliance
The consolidated financial statements have been prepared in accordance with the Accounting Standards for Financial Institutions promulgated by the Saudi Arabian Monetary Agency (SAMA) and International Financial Reporting Standards (IFRS). The Bank also prepares its consolidated financial statements to comply with the Banking Control Law and the Regulations for Companies in the Kingdom of Saudi Arabia.
b) Basis of measurement
These consolidated financial statements have been prepared under the historical cost convention except for the measurement at fair value of derivatives, financial assets held at fair value through income statement (FVIS) and available for sale. In addition, assets and liabilities that are hedged in a fair value hedging relationship are carried at fair value to the extent of the risks that are being hedged.
c) Functional and presentation currency
These consolidated financial statements are expressed in Saudi Arabian Riyals (SAR), rounded off to the nearest thousand, which is the functional currency of the Bank.
40
Notes to the Consolidated Financial Statements (31 December 2009) (continued)
T H E S A U D I B R I T I S H B A N K
1.1. Basis of preparation (continued)
d) Basis of consolidation
The consolidated financial statements comprise the financial statements of the Bank and its subsidiary, SABB Securities Limited. The financial statements of the subsidiary are prepared for the same reporting year as that of the Bank, using consistent accounting policies. The Bank has not consolidated SABB Insurance Agency Limited and SABB Insurance Services Limited as their total assets, liabilities and their income and expenses are not significant to the Bank’s overall consolidated financial statements.
A subsidiary is an entity over which the Bank has the power to govern the financial and operating policies, so as to obtain benefits from its activities, generally accompanying an ownership interest of more than half of the voting rights. A subsidiary is consolidated from the date on which control is transferred to the Bank and ceases to be consolidated from the date on which the control is transferred from the Bank.
Intercompany transactions and balances have been eliminated upon consolidation.
e) Critical accounting judgements and estimates
The preparation of consolidated financial statements in conformity with IFRS requires the use of certain critical accounting judgements, estimates, and assumptions that affect the reported amounts of assets and liabilities. It also requires management to exercise its judgement in the process of applying the Bank’s accounting policies. Such estimates, assumptions and judgements are continually evaluated and are based on historical experience and other factors, including obtaining professional advice and expectations of future events that are believed to be reasonable under the circumstances. Significant areas where management has used estimates, assumptions or exercised judgements are as follows:
i) Impairment losses on loans and advances
The Bank reviews its non-performing loans and advances at each reporting date to assess whether a specific provision for credit losses should be recorded in the consolidated statement of income. In particular, judgement by management is required in the estimation of the amount and timing of future cash flows when determining the level of provision required. Such estimates are based on assumptions about a number of factors and actual results may differ, resulting in future changes to the specific provision.
The Bank reviews its loan portfolios to assess an additional portfolio provision on each reporting date. In determining whether an impairment loss should be recorded, the Bank makes judgements as to whether there is any observable data indicating that there is a measurable decrease in the estimated future cash flows from a portfolio of loans. This evidence may include observable data indicating that there has been an adverse change in the payment status of borrowers in a group, or national or local economic conditions that correlate with defaults on assets in the group. Management uses estimates based on historical loss experience for assets with credit risk characteristics and objective evidence of impairment similar to those in the portfolio when estimating its cash flows. The methodology and assumptions used for estimating both the amount and the timing of future cash flows are reviewed regularly to reduce any differences between loss estimates and actual loss experience.
ii)Fairvalueoffinancialinstrumentsthatarenotquotedinanactivemarket
The fair values of financial instruments that are not quoted in active markets are determined by using valuation techniques. Where valuation techniques (for example, models) are used to determine fair values, they are validated and periodically reviewed by qualified personnel independent of the area that created them. All models are certified before they are used, and models are calibrated to ensure that outputs reflect actual data and comparative market prices. To the extent practical, models use only observable data, however areas such as credit risk (both own and counterparty), volatilities and correlations require management to make estimates. Changes in assumptions about these factors could affect reported fair value of financial instruments.
41
1.1. Basis of preparation (continued)
iii)Impairmentofavailableforsaleequityinvestments
The Bank exercises judgement to consider impairment on the available for sale equity investments. This includes determination of a significant or prolonged decline in the fair value below its cost. The determination of what is ‘significant’ or ‘prolonged’ requires judgement. In making this judgement, the Bank evaluates among other factors, the normal volatility in share price. In addition, the Bank considers impairment to be appropriate when there is evidence of deterioration in the financial health of the investee, industry and sector performance, changes in technology, and operational and financing cash flows.
Due to current volatility in the market, 25% or more is used as a reasonable measure for significant decline below its cost, irrespective of the duration of the decline, and is recognised in the consolidated statement of income as provision for impairment for other financial assets.
Prolonged decline represents decline below cost that persists for 1 year or longer irrespective of the amount and is, thus, recognised in the consolidated statement of income as provision for impairment for other financial assets.
iv)Classificationofheldtomaturityinvestments
The Bank follows the guidance of IAS 39 on classifying non-derivative financial assets with fixed or determinable payments and fixed maturity as held to maturity. In making this judgement, the Bank evaluates its intention and ability to hold such investments to maturity.
v) Classificationoffairvaluethroughincomestatement
The Bank follows IAS 39 criteria on classifying financial assets and liabilities to fair value through income statement. In making this judgement, the Bank evaluates its compliance with the conditions as prescribed in IAS 39.
f) Going concern
The Bank’s management has made an assessment of the Bank’s ability to continue as a going concern and is satisfied that the Bank has the resources to continue in business for the foreseeable future. Furthermore, the management is not aware of any material uncertainties that may cast significant doubt upon the Bank’s ability to continue as a going concern. Therefore, the consolidated financial statements continue to be prepared on the going concern basis.
2. Summary of significant accounting policies
The significant accounting policies adopted in the preparation of these consolidated financial statements are set out below:
a) Changeinaccountingpolicies
The accounting policies adopted are consistent with those of the annual consolidated financial statements for the year ended 31 December 2008, as described in the annual consolidated financial statements for the year ended 31 December 2008 except for the adoption of IFRS 8 Operating Segments and amendments to existing standards, as mentioned below. The Bank has adopted the standard and amendments with retrospective effect which had no impact on the financial position and financial performance of the Bank. The comparative information has been restated, where required, to conform to current year presentation.
n IFRS 8 Operating Segments, which supersedes IAS 14 Segment Reporting and requires disclosure of information about the Bank’s operating segments; n the revisions and amendments to IAS 1 Presentation of Financial statements; andn amendments to IFRS 2 Share based payments – vesting conditions and cancellations and IAS 32 Financial Instruments Presentation
b) Trade date accounting
All regular way purchases and sales of financial assets are recognised and derecognised on the trade date i.e. the date on which the Bank commits to purchase or sell the assets. Regular way purchases and sales are purchases and sales of financial assets that require delivery of assets within the time frame generally established by regulation or convention in the market place.
42
Notes to the Consolidated Financial Statements (31 December 2009) (continued)
T H E S A U D I B R I T I S H B A N K
2. Summary of significant accounting policies (continued)
c) Derivativefinancialinstrumentsandhedgeaccounting
Derivative financial instruments including foreign exchange contracts, special commission rate futures, forward rate agreements, currency and special commission rate swaps, currency and special commission rate options (both written and purchased), are measured at fair value (premium received for written options). All derivatives are carried at their fair value as assets where the fair value is positive and as liabilities where the fair value is negative.
Fair values are generally obtained by reference to quoted market prices, discounted cash flow models or pricing models as appropriate.
The treatment of changes in their fair value depends on their classification into the following categories:
i) Derivatives held for trading
Any changes in the fair value of derivatives that are held for trading purposes are taken directly to the consolidated statement of income for the year. Derivatives held for trading also include those derivatives which do not qualify for hedge accounting.
ii) Embedded derivatives
Derivatives embedded in other financial instruments are treated as separate derivatives and recorded at fair value if their economic characteristics and risks are not closely related to those of the host contract, and the host contract is not itself held for trading or designated at fair value through profit or loss. The embedded derivatives separated from the host are carried at fair value in the trading portfolio with changes in fair value recognised in the consolidated statement of income.
iii) Hedge accounting
For the purpose of hedge accounting, hedges are classified into two categories; (a) fair value hedges which hedge the exposure to changes in the fair value of a recognised asset or liability, and (b) cash flow hedges which hedge exposure to variability in cash flows that is either attributable to a particular risk associated with a recognised asset or liability, or a highly probable forecasted transaction that will affect the reported net gain or loss.
In order to qualify for hedge accounting, it is required that the hedge should be expected to be highly effective i.e. the changes in fair value or cash flows of the hedging instrument should effectively offset corresponding changes in the hedged item, and should be reliably measurable. At the inception of the hedge, the risk management objective and strategy is documented including the identification of the hedging instrument, the related hedged item, the nature of risk being hedged and how the Bank will assess the effectiveness of the hedging relationship. Subsequently, the effectiveness of the hedge is assessed on an ongoing basis.
In relation to fair value hedges, which meet the criteria for hedge accounting, any gain or loss from remeasuring the hedging instruments to fair value is recognised immediately in the consolidated statement of income. The related portion of the hedged item is recognised in the consolidated statement of income. Where the fair value hedge of a special commission bearing financial instrument ceases to meet the criteria for hedge accounting, the adjustment in the carrying value is amortised to the consolidated statement of income over the remaining life of the instrument. If the hedged item is derecognised, the unamortised fair value adjustment is recognised immediately in the consolidated statement of income.
In relation to cash flow hedges, which meet the criteria for hedge accounting, the portion of the gain or loss on the hedging instrument that is determined to be an effective hedge is recognised in other reserves under shareholders’ equity. The ineffective portion, if any, is recognised in the consolidated statement of income. For cash flow hedges affecting future transactions, the gains or losses recognised in other reserves are transferred to the consolidated statement of income in the same period in which the hedged transaction affects the consolidated statement of income.
Hedge accounting is discontinued when the hedging instrument expires or is sold, terminated or exercised, or no longer qualifies for hedge accounting. On discontinuation of hedge accounting on cash flow hedges, any cumulative gain or loss that was recognised in other reserves is retained in shareholders’ equity until the forecasted transaction occurs. Where the hedged forecasted transaction is no longer expected to occur, the net cumulative gain or loss recognised in other reserves is transferred to the consolidated statement of income for the year.
43
2. Summary of significant accounting policies (continued)
d) Foreign currencies
Transactions in foreign currencies are translated into Saudi Arabian Riyals at the spot exchange rates prevailing at transaction dates. Monetary assets and liabilities at year-end, denominated in foreign currencies, are translated into Saudi Arabian Riyals at the exchange rates prevailing at the statement of financial position date. The foreign currency gain or loss on monetary items is the difference between amortised cost in the functional currency at the beginning of the year adjusted for effective interest and payments during the year, and the amortised cost in foreign currency translated at the exchange rate at the end of the year. All differences arising on non-trading activities are taken to other non-operating income in the statement of income, with the exception of differences on foreign currency borrowings that provide an effective hedge against a net investment in a foreign entity. Foreign exchange gains or losses on translation of monetary assets and liabilities denominated in foreign currencies are recognised in the consolidated statement of income, except for differences arising on the retranslation of available for sale equity instruments or when deferred in equity as qualifying cash flow hedges and qualifying net investment hedges. Translation gains or losses on non-monetary items carried at fair value are included as part of the fair value adjustment either in the consolidated statement of income or in equity depending on the underlying financial asset.
e) Offsettingfinancialinstruments
Financial assets and liabilities are offset and are reported net in the consolidated statement of financial position when there is a legally enforceable right offset off the recognised amounts and when the Bank intends to settle on a net basis, or to realise the asset and settle the liability simultaneously.
f) Revenue/expenses recognition
Special commission income and expense
Special commission income and expense for all commission-bearing financial instruments, except for those classified as held for trading or designated as at fair value through income statement (FVIS), are recognised in the consolidated statement of income on the effective yield basis. The effective commission rate is the rate that exactly discounts the estimated future cash payments and receipts through the expected life of the financial asset or liability (or, where appropriate, a shorter period) to the carrying amount of the financial asset or liability. When calculating the effective commission rate, the Bank estimates future cash flows considering all contractual terms of the financial instrument but not future credit losses.
The carrying amount of the financial asset or financial liability is adjusted if the Bank revises its estimates of payments or receipts. The adjusted carrying amount is calculated based on the original effective commission rate. The change in carrying amount is recorded as special commission income or expense.
If the recorded value of a financial asset or a group of similar financial assets has been reduced due to an impairment loss, special commission income continues to be recognised using the original effective commission rate applied to the new carrying amount.
The calculation of the effective yield takes into account all contractual terms of the financial instruments (prepayment, options etc.) and includes all fees paid or received related transaction costs, and discounts or premiums that are an integral part of the effective commission rate. Transaction costs are incremental costs that are directly attributable to the acquisition, issue or disposal of financial asset or liability.
When the Bank enters into special commission rate swap to change special commission from fixed to floating (or vice versa) the amount of special commission income or expense is adjusted by the net special commission on the swap.
Exchangeincome/loss
Exchange income/loss is recognised when earned/incurred.
44
Notes to the Consolidated Financial Statements (31 December 2009) (continued)
T H E S A U D I B R I T I S H B A N K
2. Summary of significant accounting policies (continued)
Fees and commission income
Fees and commission income are recognised on an accrual basis when the service has been provided. Loan commitment fees for loans that are likely to be drawn down are deferred and, together with the related direct cost are recognised as an adjustment to the effective yield on the loan. Portfolio and other management advisory and service fees are recognised based on the applicable service contract, usually on a time-proportionate basis. Fees received on asset management, wealth management, financial planning, custody services and other similar services that are provided over an extended period of time are recognised rateably over the period when the service is being provided. When a loan commitment is not expected to result in the drawdown of a loan, loan commitment fees are recognised on a straight-line basis over the commitment period. Other fees and commission expense relate mainly to transaction and service fees, which is expensed as the service is received.
Dividend income
Dividend income is recognised when the right to receive income is established.
Net trading income
Results arising from trading activities include all gains and losses from changes in fair value and related special commission income or expense, dividends from financial assets and financial liabilities held for trading and foreign exchange differences. This includes any ineffectiveness recorded in hedging transactions.
g) Saleandrepurchaseagreements
Assets sold with a simultaneous commitment to repurchase at a specified future date (repos) continue to be recognised in the consolidated statement of financial position and are measured in accordance with related accounting policies for the underlying financial assets held as FVIS, available for sale, held to maturity and other investments held at amortised cost. The counterparty liability for amounts received under these agreements is included in “due to banks and other financial institutions” or “customers’ deposits”, as appropriate. The difference between sale and repurchase price is treated as special commission expense and amortised over the life of the repo agreement, using the effective yield method.
Assets purchased with a corresponding commitment to resell at a specified future date (reverse repo) are not recognised in the consolidated statement of financial position, as the Bank does not obtain control over the assets. Amounts paid under these agreements are included in “cash and balances with SAMA”, “due from banks and other financial institutions” or “loans and advances”, as appropriate. The difference between purchase and resale price is treated as special commission income and amortised over the life of the reverse repo agreement, using the effective yield method.
h) Investments
All investment securities are initially recognised at cost, being the fair value of consideration given, including acquisition charges associated with the investment except for investments held as FVIS, which are not added to the cost at initial recognition and are charged to the consolidated statement of income. Premiums are amortised and discounts accreted using the effective yield method and are taken to special commission income.
For securities traded in organised financial markets, fair value is determined by reference to exchange quoted market bid prices at the close of business on the consolidated statement of financial position date. Fair value of managed assets and investments in mutual funds are determined by reference to declared net asset values.
For securities where there is no quoted market price, a reasonable estimate of the fair value is determined by reference to the current market value of another instrument which is substantially the same, or is based on the expected cash flows or the underlying net asset base of the security.
Following initial recognition, subsequent transfers between the various classes of investments are not ordinarily permissible. The subsequent period end reporting values for each class of investment are determined on the basis as set out in the following paragraphs.

45
2. Summary of significant accounting policies (continued)
i) Held as FVIS
Investments in this category are classified as either investment held for trading or those designated as FVIS at inception or on adoption of the revised International Accounting Standard 39. Investments classified as trading are acquired principally for the purpose of selling or repurchasing in the short term. An investment may be designated as FVIS by the management if it satisfies the criteria set out below (except for equity instruments that do not have a quoted market price in an active market and whose fair values cannot be reliably measured):n it is a financial instrument containing one or more embedded derivatives that significantly modify the cash flows resulting from the financial instrument, orn it is a financial instrument with an embedded derivative that is required to be separated from the host contract under International Accounting Standard 39, but the Bank is unable to measure reliably the embedded derivative separately either at acquisition or at a subsequent reporting date
The fair value designation is made in accordance with the Risk Management Strategy approved by the Bank’s Assets and Liabilities Committee (ALCO) and is irrevocable. Designated financial assets are recognised when the Bank enters into the contractual provisions of the arrangements with counterparties on trade date and derecognised when sold.
After initial recognition, investments at FVIS are measured at fair value and any change in the fair value is recognised in the consolidated statement of income for the period in which it arises. Special commission income and dividend income received on financial assets held as FVIS are reflected as income from financial instruments designated as FVIS in the consolidated statement of income.
ii) Available for sale
Available for sale investments are those intended to be held for an unspecified period of time, which may be sold in response to needs for liquidity or changes in commission rates, exchange rates or equity prices.
Investments which are classified as “available for sale” are subsequently measured at fair value. For an available for sale investment where the fair value has not been hedged, any gain or loss arising from a change in its fair value is recognised directly in “other reserves” under shareholders’ equity. On derecognition, any cumulative gain or loss previously recognised in shareholders’ equity is included in the consolidated statement of income for the period.
Equity investments classified under available-for-sale investments whose fair value cannot be reliably measured are carried at cost.
iii) Held to maturity
Investments having fixed or determinable payments and fixed maturity that the Bank has the positive intention and ability to hold to maturity other than those that meet the definition of “held at amortised cost” are classified as held to maturity. Held to maturity investments are subsequently measured at amortised cost, less provision for impairment in value. Amortised cost is calculated by taking into account any discount or premium on acquisition using the effective yield method. Any gain or loss on such investments is recognised in the consolidated statement of income when the investment is derecognised or impaired.
Investments classified as held to maturity cannot ordinarily be sold or reclassified without impacting the Bank’s ability to use this classification and cannot be designated as a hedged item with respect to special commission rate or prepayment risk, reflecting the intention to hold them to maturity.
iv) Held at amortised cost
Investment securities with fixed or determinable payments that are not quoted in an active market are classified as “held at amortised cost”. Such investments whose fair values have not been hedged are stated at amortised cost, less provision for impairment. Investments in a fair value hedge relationship are adjusted for fair value changes to the extent of the risk being hedged. Any gain or loss is recognised in the consolidated statement of income when the investment is derecognised and is disclosed as gains/(losses) on non-trading investments. Amortised cost is calculated by taking into account any discount or premium on acquisition using the effective yield method.

46
Notes to the Consolidated Financial Statements (31 December 2009) (continued)
T H E S A U D I B R I T I S H B A N K
2. Summary of significant accounting policies (continued)
i) Investment in associates
Investment in associates is accounted for using the equity method in accordance with International Accounting Standard 28 – Investment in Associates. An associate is an entity in which the Bank has significant influence and which is neither a subsidiary nor a joint venture.
Under the equity method, investment in associates is carried in the statement of financial position at cost plus post investment changes in the Bank’s share of net assets of the associates. The investments in associates are carried in the statement of financial position at the lower of equity accounted or recoverable amount.
The reporting dates of the associates and the Bank are identical and the associate’s accounting policies conform to those used by the Bank for like transactions and events in similar circumstances.
Unrealised profits and losses resulting from transactions between the Bank and its associates are eliminated to the extent of the Bank’s interest in the associates.
j) Loans and advances
Loans and advances are non-derivative financial assets originated or acquired by the Bank with fixed or determinable payments that are not quoted in an active market.
All loans and advances are initially measured at cost, being the fair value of consideration given, including acquisition charges associated with the loans and advances.
Following the initial recognition, subsequent transfers between the various classes of loans and advances is not ordinarily permissible.
The Bank’s loans and advances are classified as held at amortised cost less any amount written off and provisions for impairment.
For loans and advances, which are hedged, the related portion of the hedged fair value is adjusted against the carrying amount.
k)Duefrombanksandotherfinancialinstitutions
Due from banks and other financial institutions are financial assets which are mainly money market placements with fixed or determinable payments and fixed maturities that are not quoted in an active market. Money market placements are not entered into with the intention of immediate or short-term resale. Due from banks and other financial institutions are initially measured at cost, being the fair value of the consideration given.
Following the initial recognition, due from banks and other financial institutions are stated at cost less any amount written off and provisions for impairment, if any.
l) Impairmentoffinancialassets
An assessment is made at each statement of financial position date to determine whether there is objective evidence that a financial asset or group of financial assets may be impaired. If such evidence exists, the estimated recoverable amount of that asset is determined and any impairment loss, based on the net present value of future anticipated cash flows, is recognised for changes in its carrying amounts.
When a financial asset is uncollectible, it is written off against the related provision for impairment. Financial assets are written off only in circumstances where effectively all possible means of recovery have been exhausted, and the amount of the loss has been determined.
Once a financial asset has been written down to its estimated recoverable amount, special commission income is thereafter recognised based on the rate of special commission that was used to discount the future cash flows for the purpose of measuring the recoverable amount.
If, in a subsequent period, the amount of the impairment loss on investments other than available for sale equity investments decreases and the decrease can be related objectively to an event occurring after the impairment was recognised (such as an improvement in the debtor’s credit rating), the previously recognised impairment loss is reversed by adjusting the allowance account. The amount of the reversal is recognised in the consolidated statement of income in provision for credit losses.

47
2. Summary of significant accounting policies (continued)
i) Impairmentoffinancialassetsheldatamortisedcost
A financial asset is classified as impaired when there is objective evidence of credit related impairment as a result of one or more loss events that occurred after the initial recognition of the asset and that a loss event(s) has an impact on the estimated future cash flows of the financial asset or group of financial assets that can be reliably estimated.
A specific provision for credit losses due to impairment of a loan or any other financial asset held at amortised cost, including those arising from sovereign risk exposures, is established if there is objective evidence that the Bank will not be able to collect all amounts due. The amount of the specific provision is the difference between the carrying amount and the estimated recoverable amount. The estimated recoverable amount is the present value of expected cash flows, including amounts estimated to be recoverable from guarantees and collateral, discounted based on the original effective special commission rate.
In addition to specific provision for credit losses, provision for collective impairment is made on a portfolio basis for credit losses where there is objective evidence that unidentified losses exist at the reporting date. These are based on any deterioration in the risk rating (i.e. downward migration of risk ratings) of the financial assets since it was originally granted. This provision is estimated based on various factors including credit ratings allocated to a borrower or group of borrowers, the current economic conditions, the experience the Bank has had in dealing with a borrower or group of borrowers and available historical default information.
The carrying amount of the asset is adjusted through the use of an allowance account and the amount of the adjustment is included in the consolidated statement of income.
ii) Impairmentoffinancialassetsheldatfairvalue
For financial assets held at fair value, where a loss has been recognised directly under shareholders’ equity, the cumulative net loss recognised in shareholders’ equity is transferred to the consolidated statement of income when the asset is considered to be impaired.
For equity investments held as available for sale, a significant or prolonged decline in fair value below its cost represents objective evidence of impairment. Unlike debt securities, the previously recognised impairment loss cannot be reversed through the consolidated statement of income as long as the asset continues to be recognised i.e. any increase in fair value after impairment has been recorded can only be recognised in equity. On derecognition, any cumulative gain or loss previously recognised in shareholders’ equity is included in consolidated statement of income for the period.
The Bank writes off its financial assets when the respective business units together with Risk Management determine that the financial assets are uncollectible. This determination is reached after considering information such as the occurrence of significant changes in the borrower/issuer’s financial position such that the borrower/issuer can no longer pay the obligations, or that proceeds from collateral will not be sufficient to pay back the entire exposure. The financial assets are, then, written off only in circumstances where effectively all possible means of recovery have been exhausted. For consumer loans, write-off decisions are generally based on a product specific past due status. When a financial asset is uncollectible, it is written off against the related provision for impairment, if any, and any amounts in excess of available provision are directly charged to consolidated statement of income.
Loans whose terms have been renegotiated are no longer considered to be past due but are treated as new loans. Restructuring policies and practices is based on indicators or criteria which indicate that payment will most likely continue. The loans continue to be subject to an individual or collective impairment assessment, calculated using the loan’s original effective commission rate.
48
Notes to the Consolidated Financial Statements (31 December 2009) (continued)
T H E S A U D I B R I T I S H B A N K
2. Summary of significant accounting policies (continued)
m) Propertyandequipment
Property and equipment are stated at cost and presented net of accumulated depreciation. Freehold land is not depreciated.
The cost of other property and equipment is depreciated on the straight-line method over the estimated useful lives of the assets as follows:
Buildings 20 years Leasehold improvements over the period of the lease contract. Furniture, equipment and vehicles 3 to 4 years
Gains and losses on disposals are determined by comparing proceeds with the carrying amount. These are included in the consolidated statement of income.
The assets’ residual values and useful lives are reviewed for impairment whenever events or changes in circumstances indicate that the carrying amount may not be recoverable. Any carrying amount is written down immediately to its recoverable amount if the asset’s carrying amount is greater than its estimated recoverable amount.
n) Liabilities
All money market deposits, customer deposits, borrowing and debt securities in issue are initially recognised at cost, being fair value of consideration received.
Subsequently all commission bearing financial liabilities where fair values have not been hedged are measured at amortised cost. Amortised cost is calculated by taking into account any discount or premium. Premiums are amortised and discounts accreted on an effective yield basis to maturity and taken to special commission expense.
Financial liabilities in a fair value hedge relationship are adjusted for fair value changes to the extent of the risk being hedged. The resultant gain or loss is recognised in the consolidated statement of income.
o) Provisions
Provisions are recognised when a reliable estimate can be made by the Bank of a present legal or constructive obligation as a result of past events. It is more likely than not that an outflow of resources will be required to settle the obligation.
p) Guarantees
Financial guarantees are initially recognised in the consolidated financial statements at fair value in other liabilities, being the value of the premium received. Subsequent to the initial recognition, the Bank’s liability under each guarantee is measured at the higher of the amortised premium and the best estimate of expenditure required to settle any financial obligations arising as a result of guarantees. Any increase in the liability relating to the financial guarantee is taken to the consolidated statement of income in “provision for credit losses”. The premium received is recognised in the consolidated statement of income in “net fees and commission income” on a straight-line basis over the life of the guarantee.
q) Accountingforleases
Leases entered into by the Bank as a lessee are all operating leases. Payments made under these operating leases are charged to the consolidated statement of income on a straight-line basis over the period of the lease.
r) Cashandcashequivalents
For the purpose of the consolidated statement of cash flows, cash and cash equivalents comprise cash, balances with SAMA, reverse repos with SAMA excluding the statutory deposit and due from banks and other financial institutions with original maturity of ninety days or less from date of acquisition.
s) Derecognitionoffinancialinstruments
A financial asset (or a part of a financial asset, or a part of a group of similar financial assets) is derecognised, when the contractual rights to the cash flows from the financial asset expires.
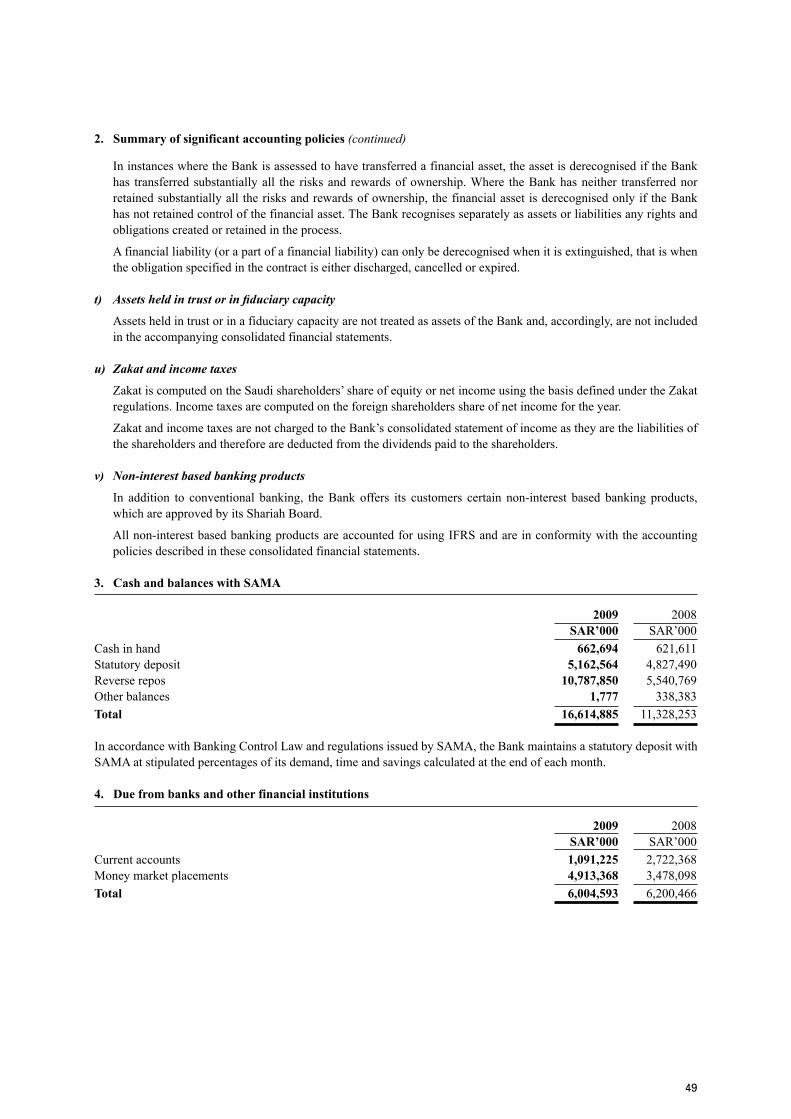
49
2. Summary of significant accounting policies (continued)
In instances where the Bank is assessed to have transferred a financial asset, the asset is derecognised if the Bank has transferred substantially all the risks and rewards of ownership. Where the Bank has neither transferred nor retained substantially all the risks and rewards of ownership, the financial asset is derecognised only if the Bank has not retained control of the financial asset. The Bank recognises separately as assets or liabilities any rights and obligations created or retained in the process.
A financial liability (or a part of a financial liability) can only be derecognised when it is extinguished, that is when the obligation specified in the contract is either discharged, cancelled or expired.
t) Assetsheldintrustorinfiduciarycapacity
Assets held in trust or in a fiduciary capacity are not treated as assets of the Bank and, accordingly, are not included in the accompanying consolidated financial statements.
u) Zakatandincometaxes
Zakat is computed on the Saudi shareholders’ share of equity or net income using the basis defined under the Zakat regulations. Income taxes are computed on the foreign shareholders share of net income for the year.
Zakat and income taxes are not charged to the Bank’s consolidated statement of income as they are the liabilities of the shareholders and therefore are deducted from the dividends paid to the shareholders.
v) Non-interestbasedbankingproducts
In addition to conventional banking, the Bank offers its customers certain non-interest based banking products, which are approved by its Shariah Board.
All non-interest based banking products are accounted for using IFRS and are in conformity with the accounting policies described in these consolidated financial statements.
3. Cash and balances with SAMA
2009 2008 SAR’000 SAR’000Cash in hand 662,694 621,611Statutory deposit 5,162,564 4,827,490Reverse repos 10,787,850 5,540,769Other balances 1,777 338,383Total 16,614,885 11,328,253 In accordance with Banking Control Law and regulations issued by SAMA, the Bank maintains a statutory deposit with SAMA at stipulated percentages of its demand, time and savings calculated at the end of each month.
4. Due from banks and other financial institutions
2009 2008 SAR’000 SAR’000Current accounts 1,091,225 2,722,368Money market placements 4,913,368 3,478,098Total 6,004,593 6,200,466
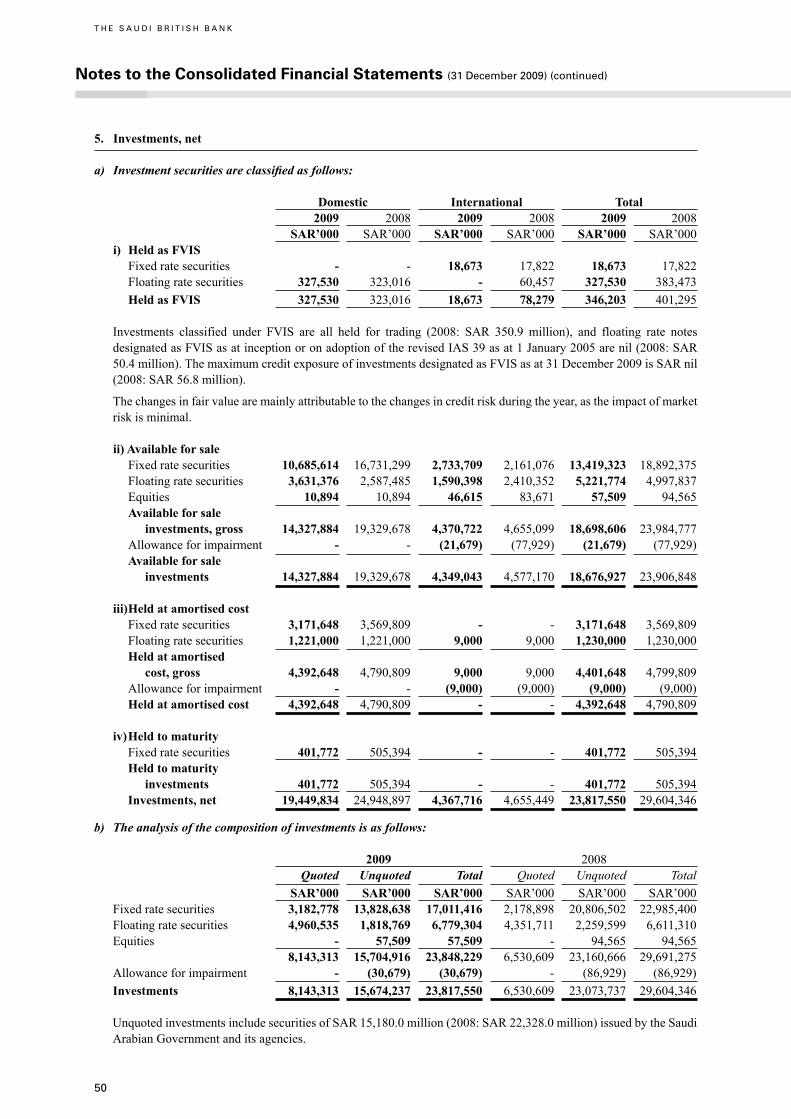
50
Notes to the Consolidated Financial Statements (31 December 2009) (continued)
T H E S A U D I B R I T I S H B A N K
5. Investments, net
a) Investmentsecuritiesareclassifiedasfollows:
Domestic International Total 2009 2008 2009 2008 2009 2008 SAR’000 SAR’000 SAR’000 SAR’000 SAR’000 SAR’000 i) Held as FVIS Fixed rate securities - - 18,673 17,822 18,673 17,822 Floating rate securities 327,530 323,016 - 60,457 327,530 383,473 Held as FVIS 327,530 323,016 18,673 78,279 346,203 401,295
Investments classified under FVIS are all held for trading (2008: SAR 350.9 million), and floating rate notes designated as FVIS as at inception or on adoption of the revised IAS 39 as at 1 January 2005 are nil (2008: SAR 50.4 million). The maximum credit exposure of investments designated as FVIS as at 31 December 2009 is SAR nil (2008: SAR 56.8 million).
The changes in fair value are mainly attributable to the changes in credit risk during the year, as the impact of market risk is minimal.
ii) Available for sale Fixed rate securities 10,685,614 16,731,299 2,733,709 2,161,076 13,419,323 18,892,375 Floating rate securities 3,631,376 2,587,485 1,590,398 2,410,352 5,221,774 4,997,837 Equities 10,894 10,894 46,615 83,671 57,509 94,565 Available for sale investments, gross 14,327,884 19,329,678 4,370,722 4,655,099 18,698,606 23,984,777 Allowance for impairment - - (21,679) (77,929) (21,679) (77,929) Available for sale investments 14,327,884 19,329,678 4,349,043 4,577,170 18,676,927 23,906,848
iii) Held at amortised cost Fixed rate securities 3,171,648 3,569,809 - - 3,171,648 3,569,809 Floating rate securities 1,221,000 1,221,000 9,000 9,000 1,230,000 1,230,000 Held at amortised cost, gross 4,392,648 4,790,809 9,000 9,000 4,401,648 4,799,809 Allowance for impairment - - (9,000) (9,000) (9,000) (9,000) Held at amortised cost 4,392,648 4,790,809 - - 4,392,648 4,790,809
iv) Held to maturity Fixed rate securities 401,772 505,394 - - 401,772 505,394 Held to maturity investments 401,772 505,394 - - 401,772 505,394 Investments, net 19,449,834 24,948,897 4,367,716 4,655,449 23,817,550 29,604,346
b) Theanalysisofthecompositionofinvestmentsisasfollows:
2009 2008 Quoted Unquoted Total Quoted Unquoted Total SAR’000 SAR’000 SAR’000 SAR’000 SAR’000 SAR’000 Fixed rate securities 3,182,778 13,828,638 17,011,416 2,178,898 20,806,502 22,985,400 Floating rate securities 4,960,535 1,818,769 6,779,304 4,351,711 2,259,599 6,611,310 Equities - 57,509 57,509 - 94,565 94,565 8,143,313 15,704,916 23,848,229 6,530,609 23,160,666 29,691,275 Allowance for impairment - (30,679) (30,679) - (86,929) (86,929) Investments 8,143,313 15,674,237 23,817,550 6,530,609 23,073,737 29,604,346
Unquoted investments include securities of SAR 15,180.0 million (2008: SAR 22,328.0 million) issued by the Saudi Arabian Government and its agencies.
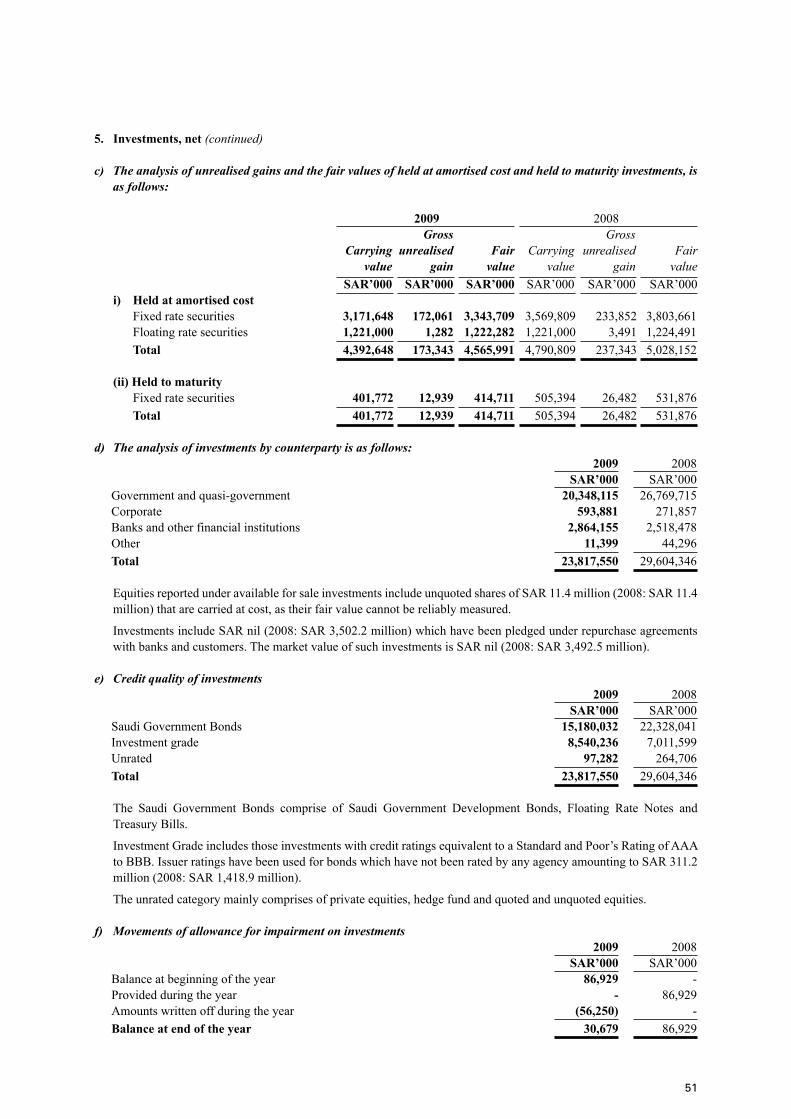
51
5. Investments, net (continued)
c) Theanalysisofunrealisedgainsandthefairvaluesofheldatamortisedcostandheldtomaturityinvestments,isasfollows:
2009 2008 Gross Gross Carrying unrealised Fair Carrying unrealised Fair value gain value value gain value SAR’000 SAR’000 SAR’000 SAR’000 SAR’000 SAR’000 i) Held at amortised cost Fixed rate securities 3,171,648 172,061 3,343,709 3,569,809 233,852 3,803,661 Floating rate securities 1,221,000 1,282 1,222,282 1,221,000 3,491 1,224,491 Total 4,392,648 173,343 4,565,991 4,790,809 237,343 5,028,152 (ii) Held to maturity Fixed rate securities 401,772 12,939 414,711 505,394 26,482 531,876 Total 401,772 12,939 414,711 505,394 26,482 531,876
d) Theanalysisofinvestmentsbycounterpartyisasfollows: 2009 2008 SAR’000 SAR’000 Government and quasi-government 20,348,115 26,769,715 Corporate 593,881 271,857 Banks and other financial institutions 2,864,155 2,518,478 Other 11,399 44,296 Total 23,817,550 29,604,346
Equities reported under available for sale investments include unquoted shares of SAR 11.4 million (2008: SAR 11.4 million) that are carried at cost, as their fair value cannot be reliably measured.
Investments include SAR nil (2008: SAR 3,502.2 million) which have been pledged under repurchase agreements with banks and customers. The market value of such investments is SAR nil (2008: SAR 3,492.5 million).
e) Creditqualityofinvestments 2009 2008 SAR’000 SAR’000 Saudi Government Bonds 15,180,032 22,328,041 Investment grade 8,540,236 7,011,599 Unrated 97,282 264,706 Total 23,817,550 29,604,346
The Saudi Government Bonds comprise of Saudi Government Development Bonds, Floating Rate Notes and Treasury Bills.
Investment Grade includes those investments with credit ratings equivalent to a Standard and Poor’s Rating of AAA to BBB. Issuer ratings have been used for bonds which have not been rated by any agency amounting to SAR 311.2 million (2008: SAR 1,418.9 million).
The unrated category mainly comprises of private equities, hedge fund and quoted and unquoted equities.
f) Movementsofallowanceforimpairmentoninvestments 2009 2008 SAR’000 SAR’000 Balance at beginning of the year 86,929 - Provided during the year - 86,929 Amounts written off during the year (56,250) - Balance at end of the year 30,679 86,929
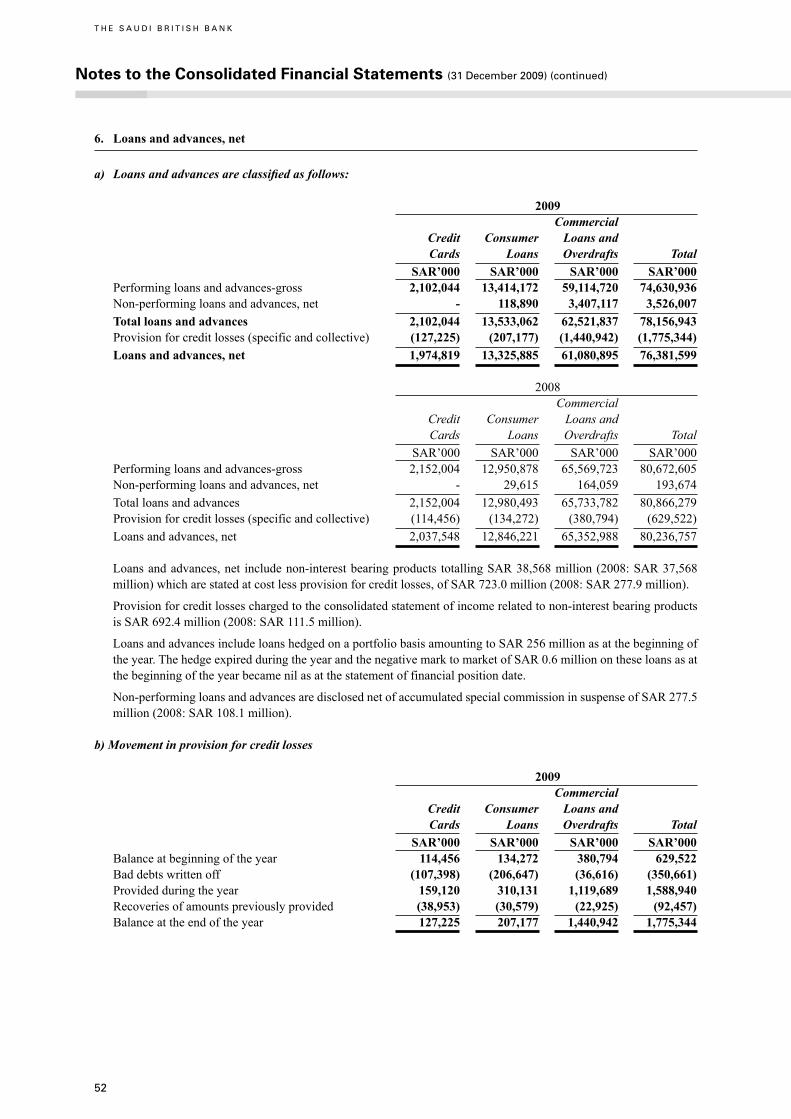
52
6. Loans and advances, net
a) Loansandadvancesareclassifiedasfollows:
2009 Commercial Credit Consumer Loans and Cards Loans Overdrafts Total SAR’000 SAR’000 SAR’000 SAR’000 Performing loans and advances-gross 2,102,044 13,414,172 59,114,720 74,630,936 Non-performing loans and advances, net - 118,890 3,407,117 3,526,007 Total loans and advances 2,102,044 13,533,062 62,521,837 78,156,943 Provision for credit losses (specific and collective) (127,225) (207,177) (1,440,942) (1,775,344) Loans and advances, net 1,974,819 13,325,885 61,080,895 76,381,599
2008 Commercial Credit Consumer Loans and Cards Loans Overdrafts Total SAR’000 SAR’000 SAR’000 SAR’000 Performing loans and advances-gross 2,152,004 12,950,878 65,569,723 80,672,605 Non-performing loans and advances, net - 29,615 164,059 193,674 Total loans and advances 2,152,004 12,980,493 65,733,782 80,866,279 Provision for credit losses (specific and collective) (114,456) (134,272) (380,794) (629,522) Loans and advances, net 2,037,548 12,846,221 65,352,988 80,236,757
Loans and advances, net include non-interest bearing products totalling SAR 38,568 million (2008: SAR 37,568 million) which are stated at cost less provision for credit losses, of SAR 723.0 million (2008: SAR 277.9 million).
Provision for credit losses charged to the consolidated statement of income related to non-interest bearing products is SAR 692.4 million (2008: SAR 111.5 million).
Loans and advances include loans hedged on a portfolio basis amounting to SAR 256 million as at the beginning of the year. The hedge expired during the year and the negative mark to market of SAR 0.6 million on these loans as at the beginning of the year became nil as at the statement of financial position date.
Non-performing loans and advances are disclosed net of accumulated special commission in suspense of SAR 277.5 million (2008: SAR 108.1 million).
b) Movement in provision for credit losses
2009 Commercial Credit Consumer Loans and Cards Loans Overdrafts Total SAR’000 SAR’000 SAR’000 SAR’000 Balance at beginning of the year 114,456 134,272 380,794 629,522 Bad debts written off (107,398) (206,647) (36,616) (350,661) Provided during the year 159,120 310,131 1,119,689 1,588,940 Recoveries of amounts previously provided (38,953) (30,579) (22,925) (92,457) Balance at the end of the year 127,225 207,177 1,440,942 1,775,344
Notes to the Consolidated Financial Statements (31 December 2009) (continued)
T H E S A U D I B R I T I S H B A N K
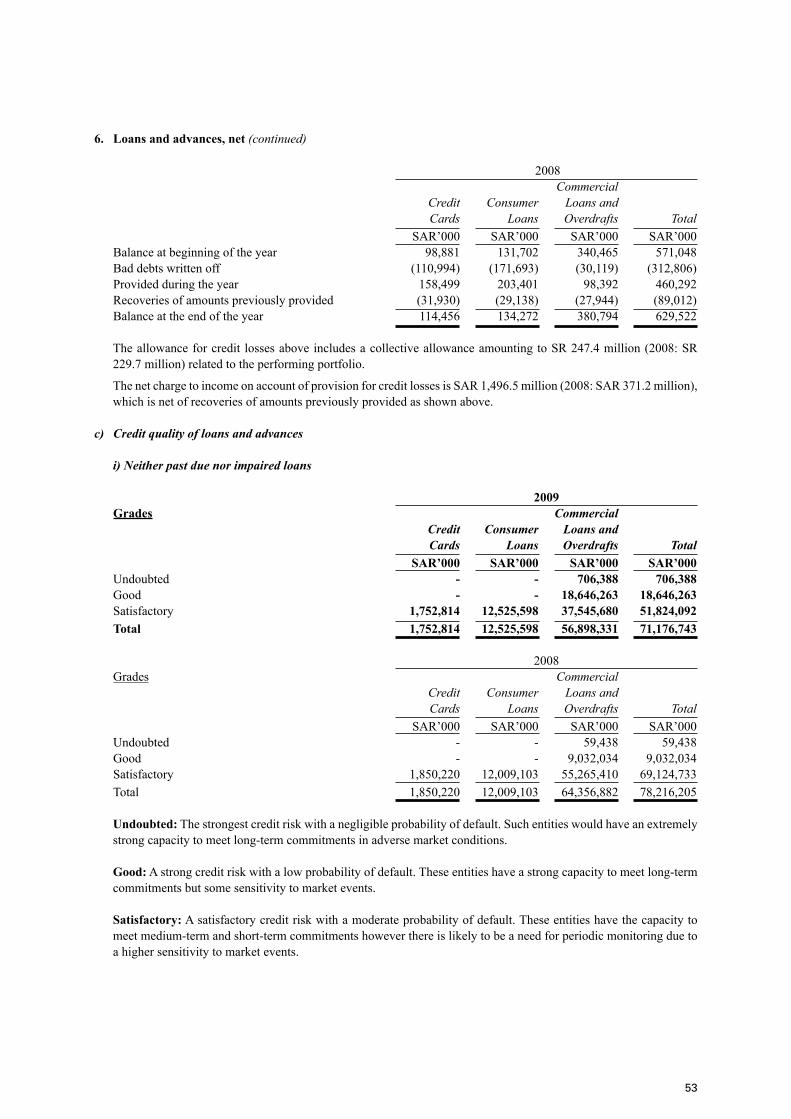
53
6. Loans and advances, net (continued)
2008 Commercial Credit Consumer Loans and Cards Loans Overdrafts Total SAR’000 SAR’000 SAR’000 SAR’000 Balance at beginning of the year 98,881 131,702 340,465 571,048 Bad debts written off (110,994) (171,693) (30,119) (312,806) Provided during the year 158,499 203,401 98,392 460,292 Recoveries of amounts previously provided (31,930) (29,138) (27,944) (89,012) Balance at the end of the year 114,456 134,272 380,794 629,522
The allowance for credit losses above includes a collective allowance amounting to SR 247.4 million (2008: SR 229.7 million) related to the performing portfolio.
The net charge to income on account of provision for credit losses is SAR 1,496.5 million (2008: SAR 371.2 million), which is net of recoveries of amounts previously provided as shown above.
c) Creditqualityofloansandadvances
i)Neitherpastduenorimpairedloans
2009 Grades Commercial Credit Consumer Loans and Cards Loans Overdrafts Total SAR’000 SAR’000 SAR’000 SAR’000 Undoubted - - 706,388 706,388 Good - - 18,646,263 18,646,263 Satisfactory 1,752,814 12,525,598 37,545,680 51,824,092 Total 1,752,814 12,525,598 56,898,331 71,176,743
2008 Grades Commercial Credit Consumer Loans and Cards Loans Overdrafts Total SAR’000 SAR’000 SAR’000 SAR’000 Undoubted - - 59,438 59,438 Good - - 9,032,034 9,032,034 Satisfactory 1,850,220 12,009,103 55,265,410 69,124,733 Total 1,850,220 12,009,103 64,356,882 78,216,205
Undoubted: The strongest credit risk with a negligible probability of default. Such entities would have an extremely strong capacity to meet long-term commitments in adverse market conditions.
Good: A strong credit risk with a low probability of default. These entities have a strong capacity to meet long-term commitments but some sensitivity to market events.
Satisfactory: A satisfactory credit risk with a moderate probability of default. These entities have the capacity to meet medium-term and short-term commitments however there is likely to be a need for periodic monitoring due to a higher sensitivity to market events.
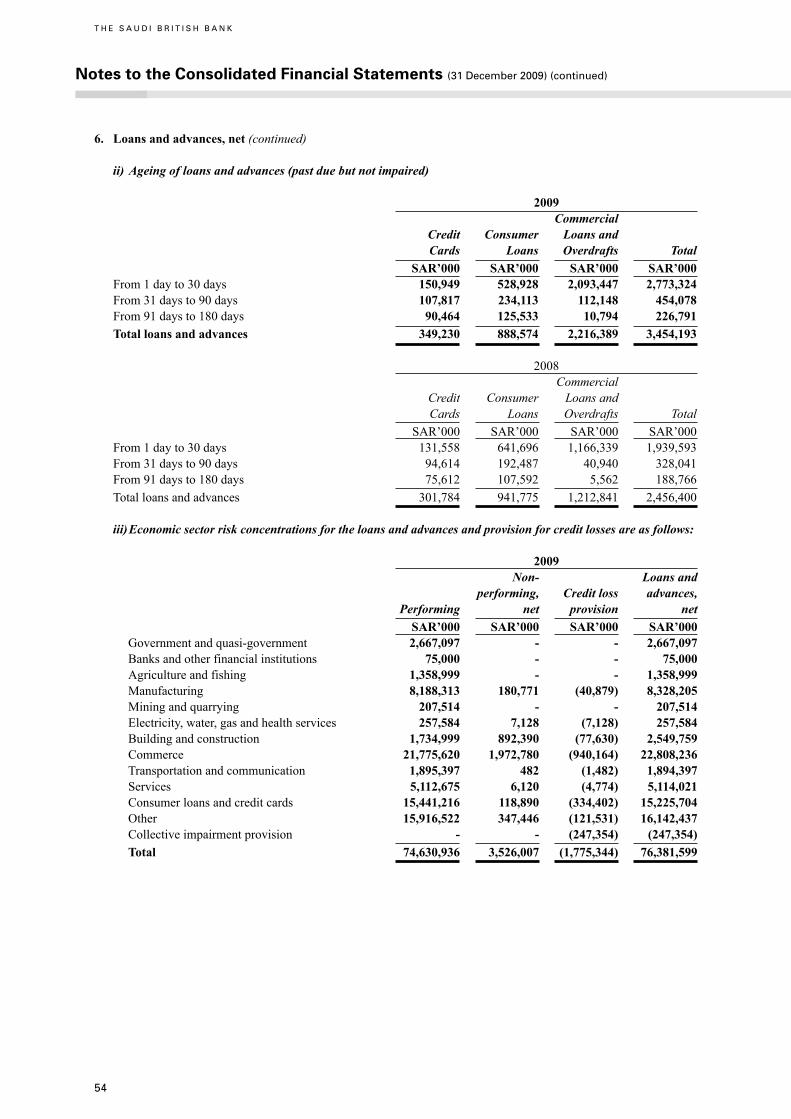
54
Notes to the Consolidated Financial Statements (31 December 2009) (continued)
T H E S A U D I B R I T I S H B A N K
6. Loans and advances, net (continued)
ii) Ageing of loans and advances (past due but not impaired)
2009 Commercial Credit Consumer Loans and Cards Loans Overdrafts Total SAR’000 SAR’000 SAR’000 SAR’000 From 1 day to 30 days 150,949 528,928 2,093,447 2,773,324 From 31 days to 90 days 107,817 234,113 112,148 454,078 From 91 days to 180 days 90,464 125,533 10,794 226,791 Total loans and advances 349,230 888,574 2,216,389 3,454,193
2008 Commercial Credit Consumer Loans and Cards Loans Overdrafts Total SAR’000 SAR’000 SAR’000 SAR’000 From 1 day to 30 days 131,558 641,696 1,166,339 1,939,593 From 31 days to 90 days 94,614 192,487 40,940 328,041 From 91 days to 180 days 75,612 107,592 5,562 188,766 Total loans and advances 301,784 941,775 1,212,841 2,456,400
iii)Economicsectorriskconcentrationsfortheloansandadvancesandprovisionforcreditlossesareasfollows:
2009 Non- Loans and performing, Creditloss advances, Performing net provision net SAR’000 SAR’000 SAR’000 SAR’000 Government and quasi-government 2,667,097 - - 2,667,097 Banks and other financial institutions 75,000 - - 75,000 Agriculture and fishing 1,358,999 - - 1,358,999 Manufacturing 8,188,313 180,771 (40,879) 8,328,205 Mining and quarrying 207,514 - - 207,514 Electricity, water, gas and health services 257,584 7,128 (7,128) 257,584 Building and construction 1,734,999 892,390 (77,630) 2,549,759 Commerce 21,775,620 1,972,780 (940,164) 22,808,236 Transportation and communication 1,895,397 482 (1,482) 1,894,397 Services 5,112,675 6,120 (4,774) 5,114,021 Consumer loans and credit cards 15,441,216 118,890 (334,402) 15,225,704 Other 15,916,522 347,446 (121,531) 16,142,437 Collective impairment provision - - (247,354) (247,354) Total 74,630,936 3,526,007 (1,775,344) 76,381,599
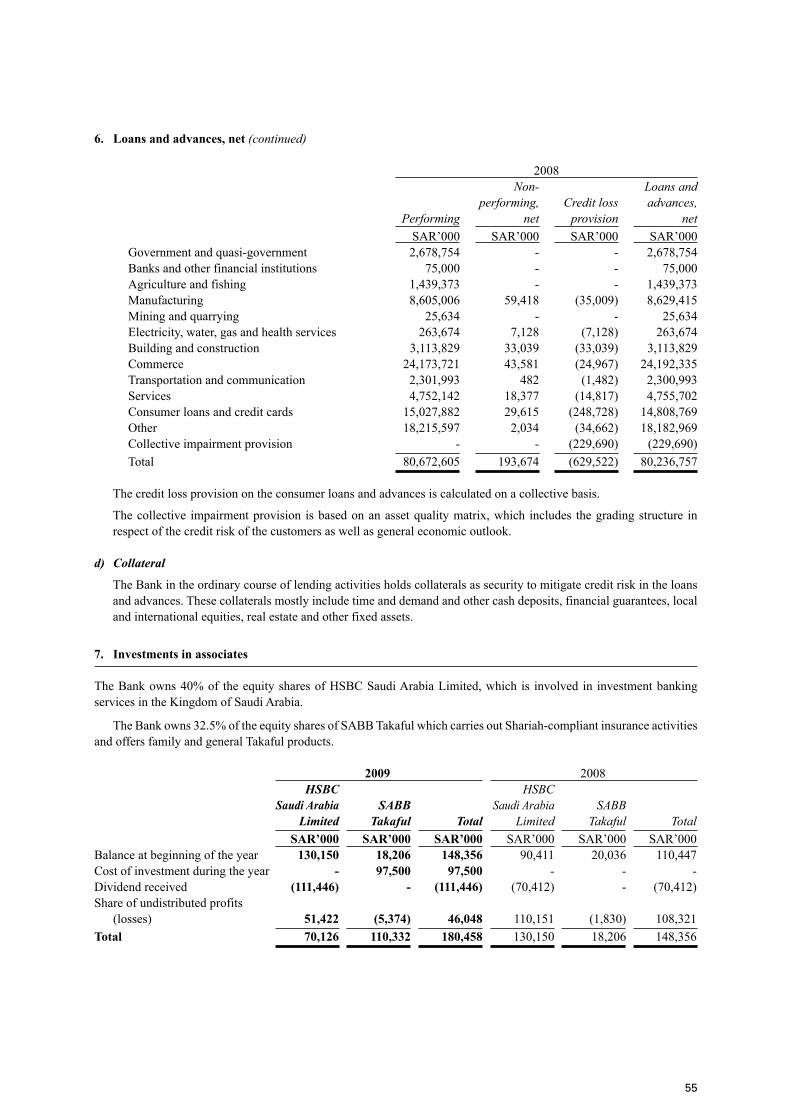
55
6. Loans and advances, net (continued)
2008 Non- Loans and performing, Credit loss advances, Performing net provision net SAR’000 SAR’000 SAR’000 SAR’000 Government and quasi-government 2,678,754 - - 2,678,754 Banks and other financial institutions 75,000 - - 75,000 Agriculture and fishing 1,439,373 - - 1,439,373 Manufacturing 8,605,006 59,418 (35,009) 8,629,415 Mining and quarrying 25,634 - - 25,634 Electricity, water, gas and health services 263,674 7,128 (7,128) 263,674 Building and construction 3,113,829 33,039 (33,039) 3,113,829 Commerce 24,173,721 43,581 (24,967) 24,192,335 Transportation and communication 2,301,993 482 (1,482) 2,300,993 Services 4,752,142 18,377 (14,817) 4,755,702 Consumer loans and credit cards 15,027,882 29,615 (248,728) 14,808,769 Other 18,215,597 2,034 (34,662) 18,182,969 Collective impairment provision - - (229,690) (229,690) Total 80,672,605 193,674 (629,522) 80,236,757
The credit loss provision on the consumer loans and advances is calculated on a collective basis.
The collective impairment provision is based on an asset quality matrix, which includes the grading structure in respect of the credit risk of the customers as well as general economic outlook.
d) Collateral
The Bank in the ordinary course of lending activities holds collaterals as security to mitigate credit risk in the loans and advances. These collaterals mostly include time and demand and other cash deposits, financial guarantees, local and international equities, real estate and other fixed assets.
7. Investments in associates
The Bank owns 40% of the equity shares of HSBC Saudi Arabia Limited, which is involved in investment banking services in the Kingdom of Saudi Arabia.
The Bank owns 32.5% of the equity shares of SABB Takaful which carries out Shariah-compliant insurance activities and offers family and general Takaful products.
2009 2008 HSBC HSBC Saudi Arabia SABB Saudi Arabia SABB Limited Takaful Total Limited Takaful Total SAR’000 SAR’000 SAR’000 SAR’000 SAR’000 SAR’000Balance at beginning of the year 130,150 18,206 148,356 90,411 20,036 110,447Cost of investment during the year - 97,500 97,500 - - -Dividend received (111,446) - (111,446) (70,412) - (70,412)Share of undistributed profits (losses) 51,422 (5,374) 46,048 110,151 (1,830) 108,321Total 70,126 110,332 180,458 130,150 18,206 148,356
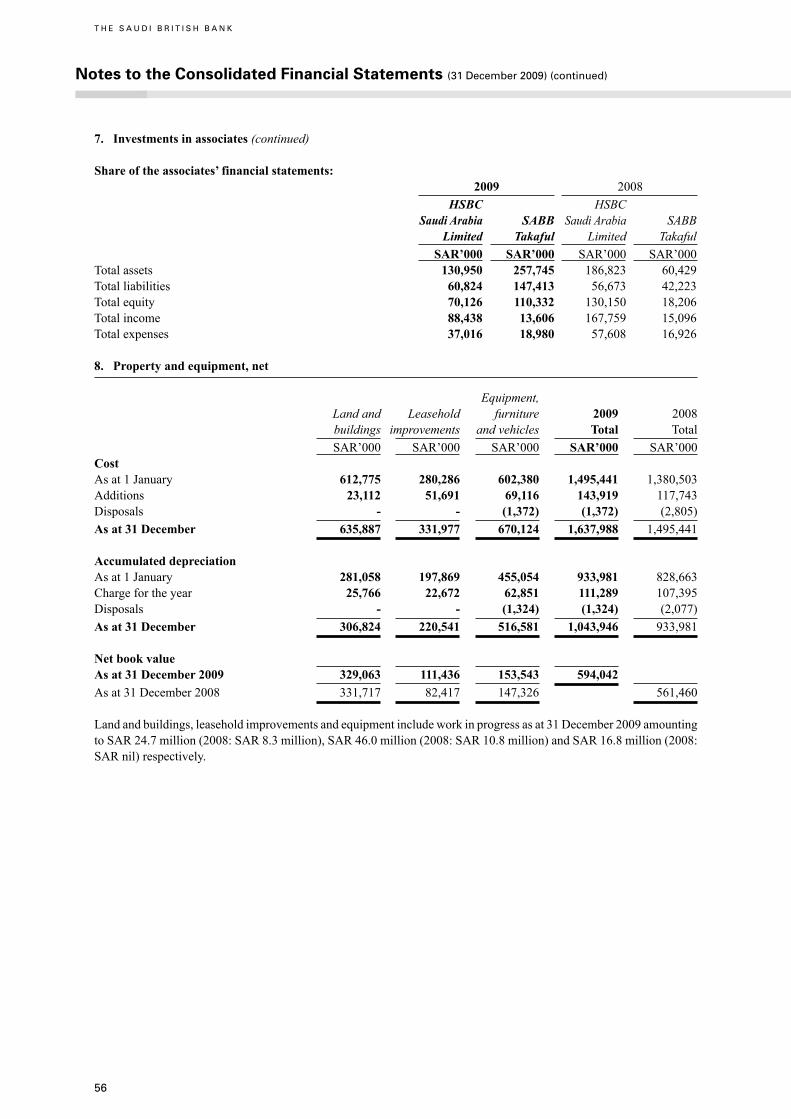
56
Notes to the Consolidated Financial Statements (31 December 2009) (continued)
T H E S A U D I B R I T I S H B A N K
7. Investments in associates (continued)
Share of the associates’ financial statements: 2009 2008 HSBC HSBC Saudi Arabia SABB Saudi Arabia SABB Limited Takaful Limited Takaful SAR’000 SAR’000 SAR’000 SAR’000Total assets 130,950 257,745 186,823 60,429Total liabilities 60,824 147,413 56,673 42,223Total equity 70,126 110,332 130,150 18,206Total income 88,438 13,606 167,759 15,096Total expenses 37,016 18,980 57,608 16,926
8. Property and equipment, net
Equipment, Land and Leasehold furniture 2009 2008 buildings improvements and vehicles Total Total SAR’000 SAR’000 SAR’000 SAR’000 SAR’000Cost As at 1 January 612,775 280,286 602,380 1,495,441 1,380,503Additions 23,112 51,691 69,116 143,919 117,743Disposals - - (1,372) (1,372) (2,805)As at 31 December 635,887 331,977 670,124 1,637,988 1,495,441 Accumulated depreciationAs at 1 January 281,058 197,869 455,054 933,981 828,663Charge for the year 25,766 22,672 62,851 111,289 107,395Disposals - - (1,324) (1,324) (2,077)As at 31 December 306,824 220,541 516,581 1,043,946 933,981 Net book valueAs at 31 December 2009 329,063 111,436 153,543 594,042As at 31 December 2008 331,717 82,417 147,326 561,460
Land and buildings, leasehold improvements and equipment include work in progress as at 31 December 2009 amounting to SAR 24.7 million (2008: SAR 8.3 million), SAR 46.0 million (2008: SAR 10.8 million) and SAR 16.8 million (2008: SAR nil) respectively.
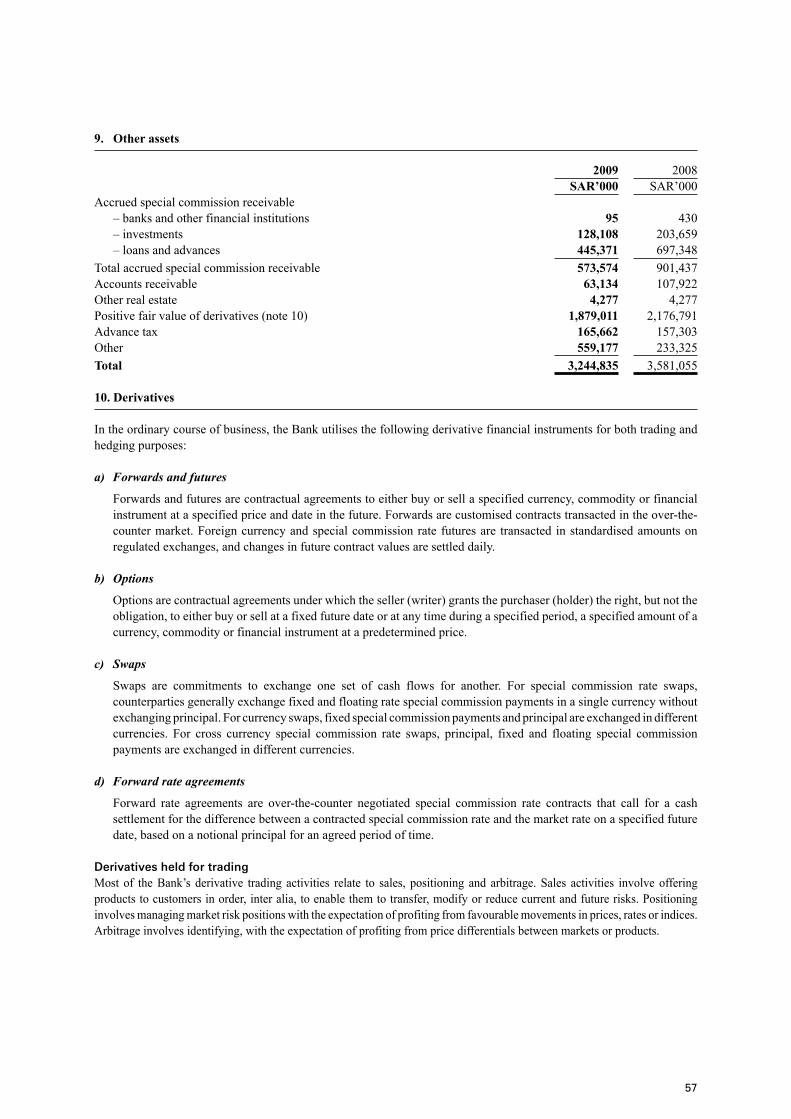
57
9. Other assets
2009 2008 SAR’000 SAR’000Accrued special commission receivable – banks and other financial institutions 95 430 – investments 128,108 203,659 – loans and advances 445,371 697,348Total accrued special commission receivable 573,574 901,437Accounts receivable 63,134 107,922Other real estate 4,277 4,277Positive fair value of derivatives (note 10) 1,879,011 2,176,791Advance tax 165,662 157,303Other 559,177 233,325Total 3,244,835 3,581,055
10. Derivatives
In the ordinary course of business, the Bank utilises the following derivative financial instruments for both trading and hedging purposes:
a) Forwardsandfutures
Forwards and futures are contractual agreements to either buy or sell a specified currency, commodity or financial instrument at a specified price and date in the future. Forwards are customised contracts transacted in the over-the-counter market. Foreign currency and special commission rate futures are transacted in standardised amounts on regulated exchanges, and changes in future contract values are settled daily.
b) Options
Options are contractual agreements under which the seller (writer) grants the purchaser (holder) the right, but not the obligation, to either buy or sell at a fixed future date or at any time during a specified period, a specified amount of a currency, commodity or financial instrument at a predetermined price.
c) Swaps
Swaps are commitments to exchange one set of cash flows for another. For special commission rate swaps, counterparties generally exchange fixed and floating rate special commission payments in a single currency without exchanging principal. For currency swaps, fixed special commission payments and principal are exchanged in different currencies. For cross currency special commission rate swaps, principal, fixed and floating special commission payments are exchanged in different currencies.
d) Forwardrateagreements
Forward rate agreements are over-the-counter negotiated special commission rate contracts that call for a cash settlement for the difference between a contracted special commission rate and the market rate on a specified future date, based on a notional principal for an agreed period of time.
Derivatives held for tradingMost of the Bank’s derivative trading activities relate to sales, positioning and arbitrage. Sales activities involve offering products to customers in order, inter alia, to enable them to transfer, modify or reduce current and future risks. Positioning involves managing market risk positions with the expectation of profiting from favourable movements in prices, rates or indices. Arbitrage involves identifying, with the expectation of profiting from price differentials between markets or products.
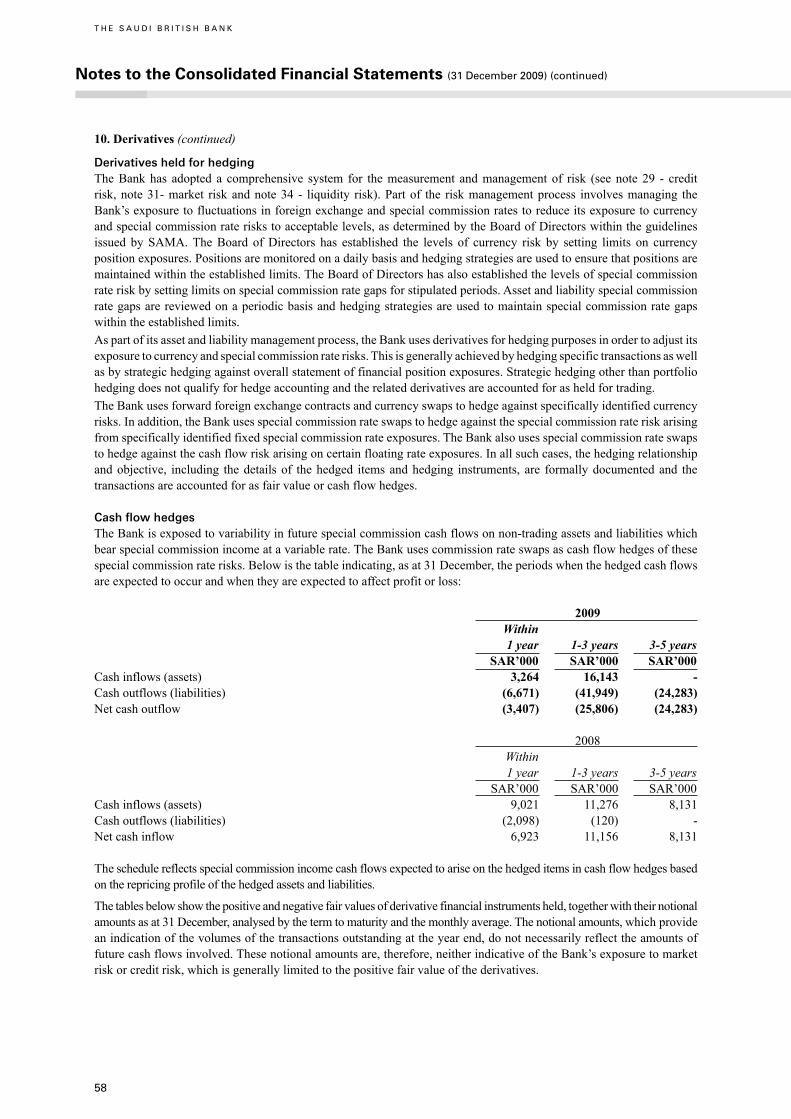
58
Notes to the Consolidated Financial Statements (31 December 2009) (continued)
T H E S A U D I B R I T I S H B A N K
10. Derivatives (continued)
Derivatives held for hedgingThe Bank has adopted a comprehensive system for the measurement and management of risk (see note 29 - credit risk, note 31- market risk and note 34 - liquidity risk). Part of the risk management process involves managing the Bank’s exposure to fluctuations in foreign exchange and special commission rates to reduce its exposure to currency and special commission rate risks to acceptable levels, as determined by the Board of Directors within the guidelines issued by SAMA. The Board of Directors has established the levels of currency risk by setting limits on currency position exposures. Positions are monitored on a daily basis and hedging strategies are used to ensure that positions are maintained within the established limits. The Board of Directors has also established the levels of special commission rate risk by setting limits on special commission rate gaps for stipulated periods. Asset and liability special commission rate gaps are reviewed on a periodic basis and hedging strategies are used to maintain special commission rate gaps within the established limits.As part of its asset and liability management process, the Bank uses derivatives for hedging purposes in order to adjust its exposure to currency and special commission rate risks. This is generally achieved by hedging specific transactions as well as by strategic hedging against overall statement of financial position exposures. Strategic hedging other than portfolio hedging does not qualify for hedge accounting and the related derivatives are accounted for as held for trading.The Bank uses forward foreign exchange contracts and currency swaps to hedge against specifically identified currency risks. In addition, the Bank uses special commission rate swaps to hedge against the special commission rate risk arising from specifically identified fixed special commission rate exposures. The Bank also uses special commission rate swaps to hedge against the cash flow risk arising on certain floating rate exposures. In all such cases, the hedging relationship and objective, including the details of the hedged items and hedging instruments, are formally documented and the transactions are accounted for as fair value or cash flow hedges.
Cash flow hedgesThe Bank is exposed to variability in future special commission cash flows on non-trading assets and liabilities which bear special commission income at a variable rate. The Bank uses commission rate swaps as cash flow hedges of these special commission rate risks. Below is the table indicating, as at 31 December, the periods when the hedged cash flows are expected to occur and when they are expected to affect profit or loss:
2009 Within 1 year 1-3 years 3-5 years SAR’000 SAR’000 SAR’000Cash inflows (assets) 3,264 16,143 -Cash outflows (liabilities) (6,671) (41,949) (24,283)Net cash outflow (3,407) (25,806) (24,283)
2008 Within 1 year 1-3 years 3-5 years SAR’000 SAR’000 SAR’000Cash inflows (assets) 9,021 11,276 8,131Cash outflows (liabilities) (2,098) (120) -Net cash inflow 6,923 11,156 8,131
The schedule reflects special commission income cash flows expected to arise on the hedged items in cash flow hedges based on the repricing profile of the hedged assets and liabilities.
The tables below show the positive and negative fair values of derivative financial instruments held, together with their notional amounts as at 31 December, analysed by the term to maturity and the monthly average. The notional amounts, which provide an indication of the volumes of the transactions outstanding at the year end, do not necessarily reflect the amounts of future cash flows involved. These notional amounts are, therefore, neither indicative of the Bank’s exposure to market risk or credit risk, which is generally limited to the positive fair value of the derivatives.
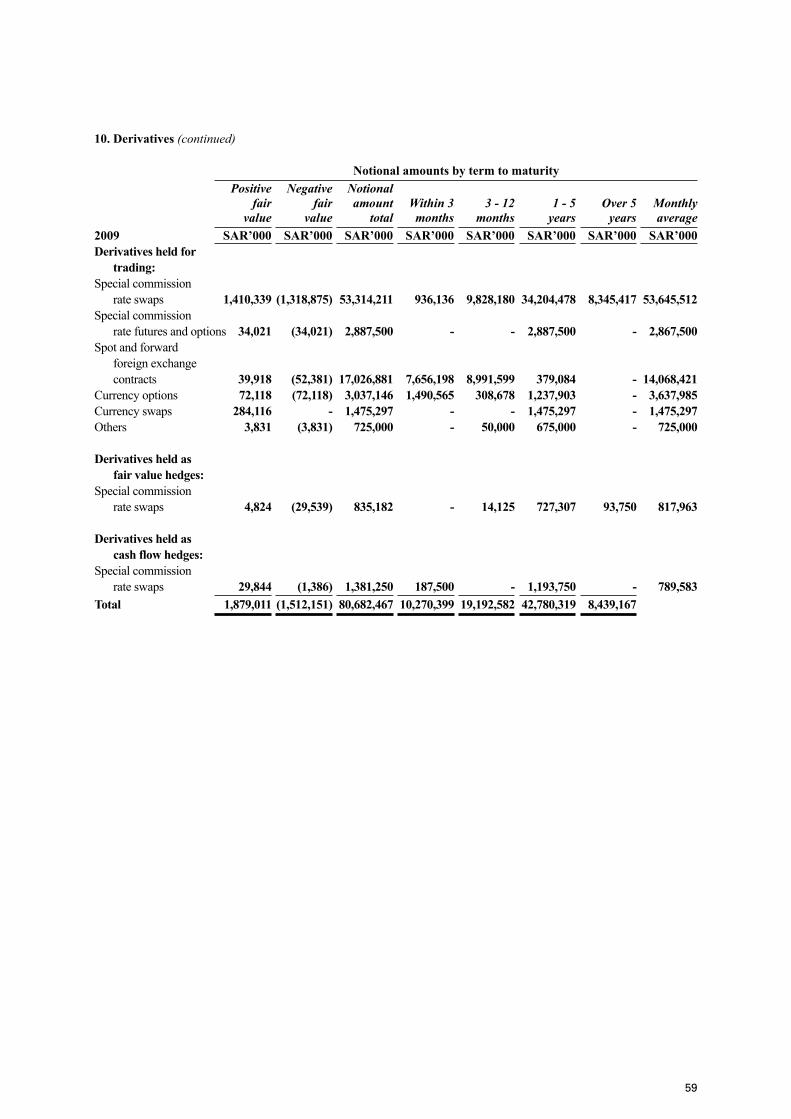
59
10. Derivatives (continued)
Notional amounts by term to maturity Positive Negative Notional fair fair amount Within3 3-12 1-5 Over5 Monthly value value total months months years years average2009 SAR’000 SAR’000 SAR’000 SAR’000 SAR’000 SAR’000 SAR’000 SAR’000Derivatives held for trading: Special commission rate swaps 1,410,339 (1,318,875) 53,314,211 936,136 9,828,180 34,204,478 8,345,417 53,645,512Special commission rate futures and options 34,021 (34,021) 2,887,500 - - 2,887,500 - 2,867,500Spot and forward foreign exchange contracts 39,918 (52,381) 17,026,881 7,656,198 8,991,599 379,084 - 14,068,421Currency options 72,118 (72,118) 3,037,146 1,490,565 308,678 1,237,903 - 3,637,985Currency swaps 284,116 - 1,475,297 - - 1,475,297 - 1,475,297Others 3,831 (3,831) 725,000 - 50,000 675,000 - 725,000
Derivatives held as fair value hedges:Special commission rate swaps 4,824 (29,539) 835,182 - 14,125 727,307 93,750 817,963
Derivatives held as cash flow hedges: Special commission rate swaps 29,844 (1,386) 1,381,250 187,500 - 1,193,750 - 789,583Total 1,879,011 (1,512,151) 80,682,467 10,270,399 19,192,582 42,780,319 8,439,167
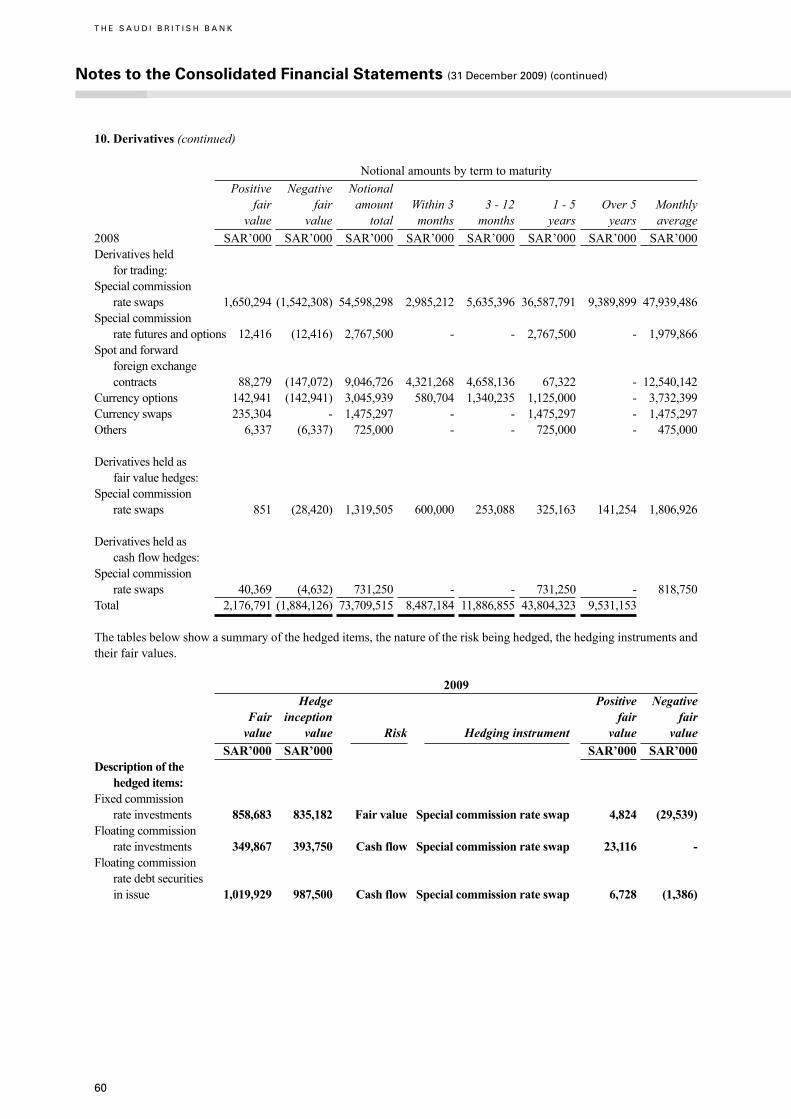
60
Notes to the Consolidated Financial Statements (31 December 2009) (continued)
T H E S A U D I B R I T I S H B A N K
10. Derivatives (continued)
Notional amounts by term to maturity Positive Negative Notional fair fair amount Within 3 3 - 12 1 - 5 Over 5 Monthly value value total months months years years average2008 SAR’000 SAR’000 SAR’000 SAR’000 SAR’000 SAR’000 SAR’000 SAR’000Derivatives held for trading: Special commission rate swaps 1,650,294 (1,542,308) 54,598,298 2,985,212 5,635,396 36,587,791 9,389,899 47,939,486Special commission rate futures and options 12,416 (12,416) 2,767,500 - - 2,767,500 - 1,979,866Spot and forward foreign exchange contracts 88,279 (147,072) 9,046,726 4,321,268 4,658,136 67,322 - 12,540,142Currency options 142,941 (142,941) 3,045,939 580,704 1,340,235 1,125,000 - 3,732,399Currency swaps 235,304 - 1,475,297 - - 1,475,297 - 1,475,297Others 6,337 (6,337) 725,000 - - 725,000 - 475,000
Derivatives held as fair value hedges: Special commission rate swaps 851 (28,420) 1,319,505 600,000 253,088 325,163 141,254 1,806,926 Derivatives held as cash flow hedges: Special commission rate swaps 40,369 (4,632) 731,250 - - 731,250 - 818,750Total 2,176,791 (1,884,126) 73,709,515 8,487,184 11,886,855 43,804,323 9,531,153
The tables below show a summary of the hedged items, the nature of the risk being hedged, the hedging instruments and their fair values.
2009 Hedge Positive Negative Fair inception fair fair value value Risk Hedginginstrument value value SAR’000 SAR’000 SAR’000 SAR’000Description of the hedged items:Fixed commission rate investments 858,683 835,182 Fair value Special commission rate swap 4,824 (29,539)Floating commission rate investments 349,867 393,750 Cash flow Special commission rate swap 23,116 -Floating commission rate debt securities in issue 1,019,929 987,500 Cash flow Special commission rate swap 6,728 (1,386)
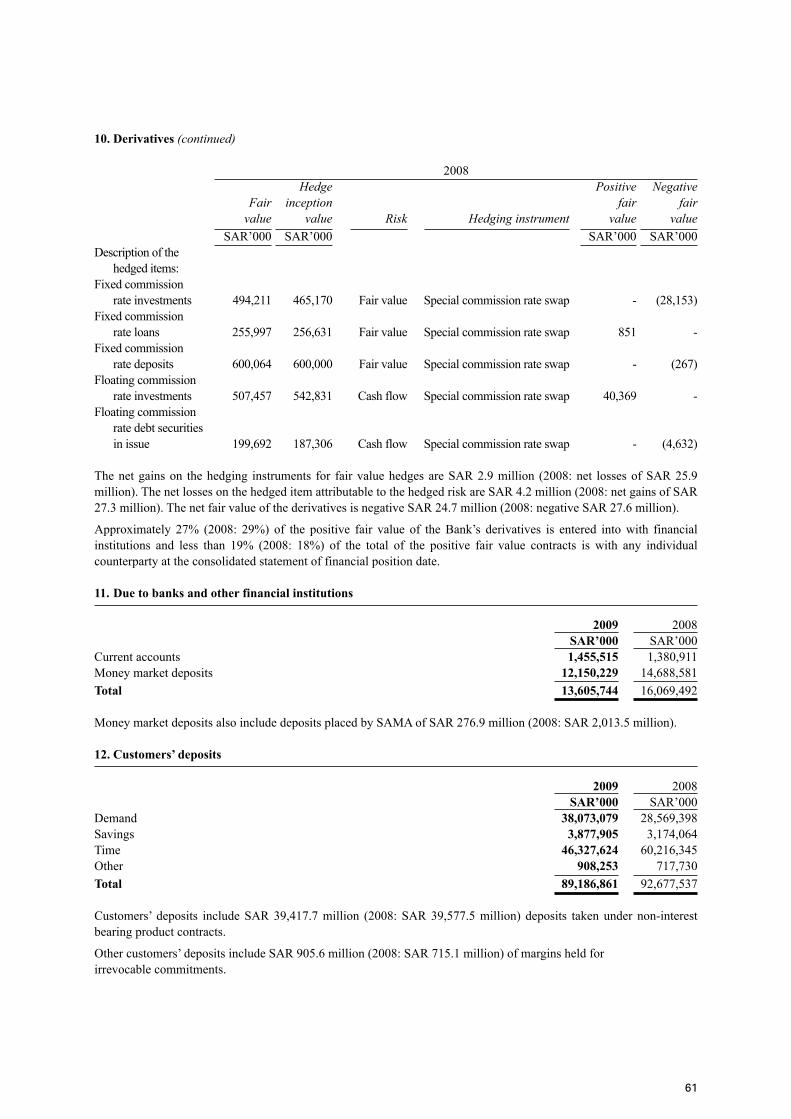
61
10. Derivatives (continued)
2008 Hedge Positive Negative Fair inception fair fair value value Risk Hedging instrument value value SAR’000 SAR’000 SAR’000 SAR’000Description of the hedged items:Fixed commission rate investments 494,211 465,170 Fair value Special commission rate swap - (28,153)Fixed commission rate loans 255,997 256,631 Fair value Special commission rate swap 851 -Fixed commission rate deposits 600,064 600,000 Fair value Special commission rate swap - (267)Floating commission rate investments 507,457 542,831 Cash flow Special commission rate swap 40,369 -Floating commission rate debt securities in issue 199,692 187,306 Cash flow Special commission rate swap - (4,632)
The net gains on the hedging instruments for fair value hedges are SAR 2.9 million (2008: net losses of SAR 25.9 million). The net losses on the hedged item attributable to the hedged risk are SAR 4.2 million (2008: net gains of SAR 27.3 million). The net fair value of the derivatives is negative SAR 24.7 million (2008: negative SAR 27.6 million).
Approximately 27% (2008: 29%) of the positive fair value of the Bank’s derivatives is entered into with financial institutions and less than 19% (2008: 18%) of the total of the positive fair value contracts is with any individual counterparty at the consolidated statement of financial position date.
11. Due to banks and other financial institutions
2009 2008 SAR’000 SAR’000Current accounts 1,455,515 1,380,911Money market deposits 12,150,229 14,688,581Total 13,605,744 16,069,492
Money market deposits also include deposits placed by SAMA of SAR 276.9 million (2008: SAR 2,013.5 million).
12. Customers’ deposits
2009 2008 SAR’000 SAR’000Demand 38,073,079 28,569,398Savings 3,877,905 3,174,064Time 46,327,624 60,216,345Other 908,253 717,730Total 89,186,861 92,677,537
Customers’ deposits include SAR 39,417.7 million (2008: SAR 39,577.5 million) deposits taken under non-interest bearing product contracts.
Other customers’ deposits include SAR 905.6 million (2008: SAR 715.1 million) of margins held forirrevocable commitments.
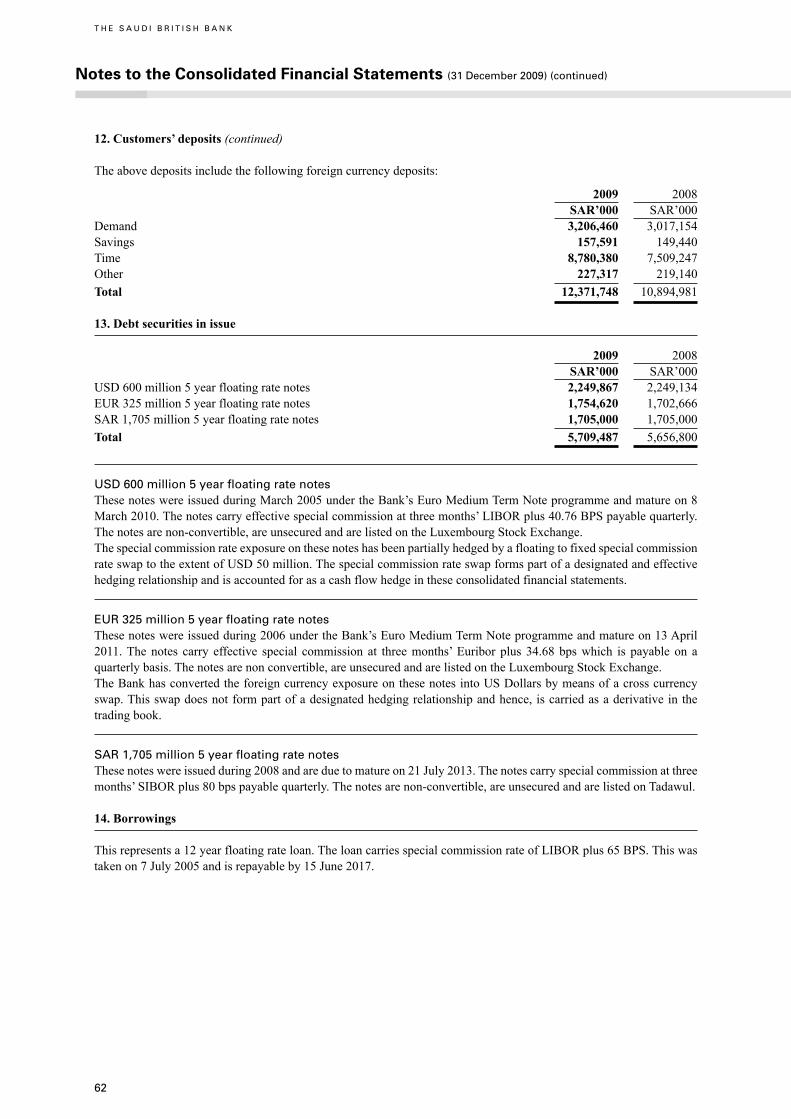
62
Notes to the Consolidated Financial Statements (31 December 2009) (continued)
T H E S A U D I B R I T I S H B A N K
12. Customers’ deposits (continued)
The above deposits include the following foreign currency deposits:
2009 2008 SAR’000 SAR’000Demand 3,206,460 3,017,154Savings 157,591 149,440Time 8,780,380 7,509,247Other 227,317 219,140Total 12,371,748 10,894,981
13. Debt securities in issue
2009 2008 SAR’000 SAR’000USD 600 million 5 year floating rate notes 2,249,867 2,249,134EUR 325 million 5 year floating rate notes 1,754,620 1,702,666SAR 1,705 million 5 year floating rate notes 1,705,000 1,705,000Total 5,709,487 5,656,800
USD 600 million 5 year floating rate notesThese notes were issued during March 2005 under the Bank’s Euro Medium Term Note programme and mature on 8 March 2010. The notes carry effective special commission at three months’ LIBOR plus 40.76 BPS payable quarterly. The notes are non-convertible, are unsecured and are listed on the Luxembourg Stock Exchange.The special commission rate exposure on these notes has been partially hedged by a floating to fixed special commission rate swap to the extent of USD 50 million. The special commission rate swap forms part of a designated and effective hedging relationship and is accounted for as a cash flow hedge in these consolidated financial statements.
EUR 325 million 5 year floating rate notesThese notes were issued during 2006 under the Bank’s Euro Medium Term Note programme and mature on 13 April 2011. The notes carry effective special commission at three months’ Euribor plus 34.68 bps which is payable on a quarterly basis. The notes are non convertible, are unsecured and are listed on the Luxembourg Stock Exchange.The Bank has converted the foreign currency exposure on these notes into US Dollars by means of a cross currency swap. This swap does not form part of a designated hedging relationship and hence, is carried as a derivative in the trading book.
SAR 1,705 million 5 year floating rate notesThese notes were issued during 2008 and are due to mature on 21 July 2013. The notes carry special commission at three months’ SIBOR plus 80 bps payable quarterly. The notes are non-convertible, are unsecured and are listed on Tadawul.
14. Borrowings
This represents a 12 year floating rate loan. The loan carries special commission rate of LIBOR plus 65 BPS. This was taken on 7 July 2005 and is repayable by 15 June 2017.
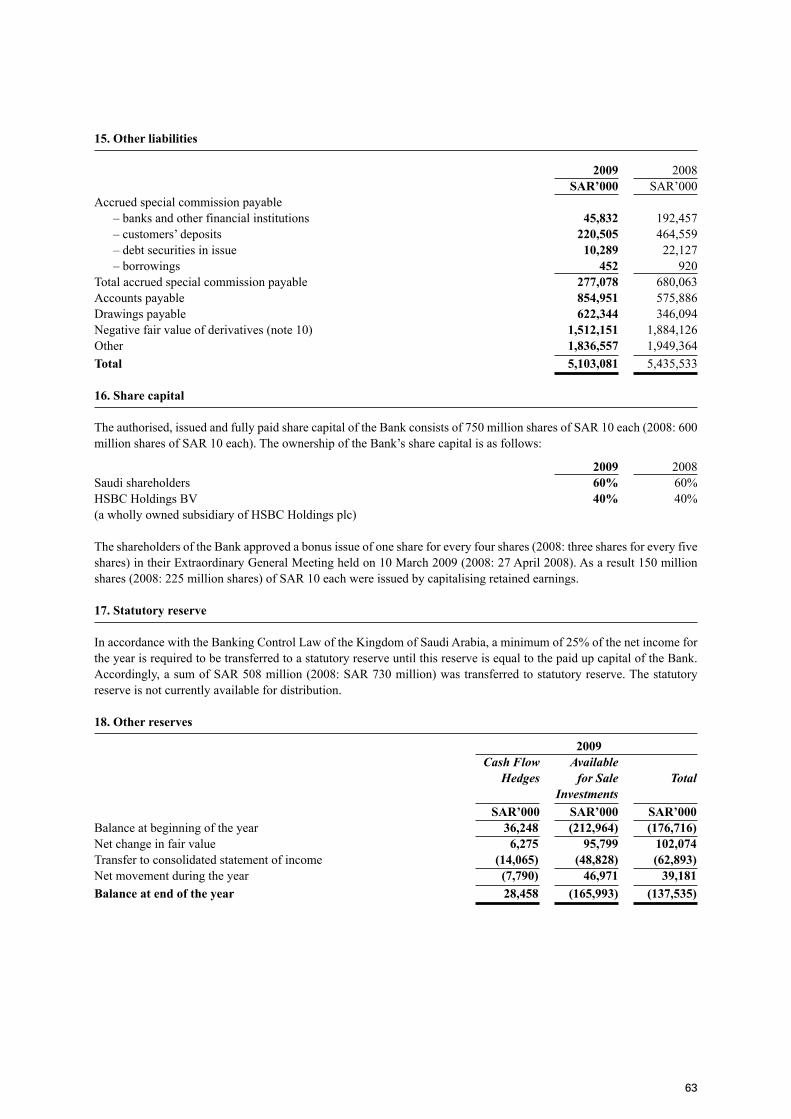
63
15. Other liabilities
2009 2008 SAR’000 SAR’000Accrued special commission payable – banks and other financial institutions 45,832 192,457 – customers’ deposits 220,505 464,559 – debt securities in issue 10,289 22,127 – borrowings 452 920Total accrued special commission payable 277,078 680,063Accounts payable 854,951 575,886Drawings payable 622,344 346,094Negative fair value of derivatives (note 10) 1,512,151 1,884,126Other 1,836,557 1,949,364Total 5,103,081 5,435,533
16. Share capital
The authorised, issued and fully paid share capital of the Bank consists of 750 million shares of SAR 10 each (2008: 600 million shares of SAR 10 each). The ownership of the Bank’s share capital is as follows:
2009 2008Saudi shareholders 60% 60%HSBC Holdings BV 40% 40%(a wholly owned subsidiary of HSBC Holdings plc)
The shareholders of the Bank approved a bonus issue of one share for every four shares (2008: three shares for every five shares) in their Extraordinary General Meeting held on 10 March 2009 (2008: 27 April 2008). As a result 150 million shares (2008: 225 million shares) of SAR 10 each were issued by capitalising retained earnings.
17. Statutory reserve
In accordance with the Banking Control Law of the Kingdom of Saudi Arabia, a minimum of 25% of the net income for the year is required to be transferred to a statutory reserve until this reserve is equal to the paid up capital of the Bank. Accordingly, a sum of SAR 508 million (2008: SAR 730 million) was transferred to statutory reserve. The statutory reserve is not currently available for distribution.
18. Other reserves
2009 CashFlow Available Hedges for Sale Total Investments SAR’000 SAR’000 SAR’000Balance at beginning of the year 36,248 (212,964) (176,716)Net change in fair value 6,275 95,799 102,074Transfer to consolidated statement of income (14,065) (48,828) (62,893)Net movement during the year (7,790) 46,971 39,181Balance at end of the year 28,458 (165,993) (137,535)
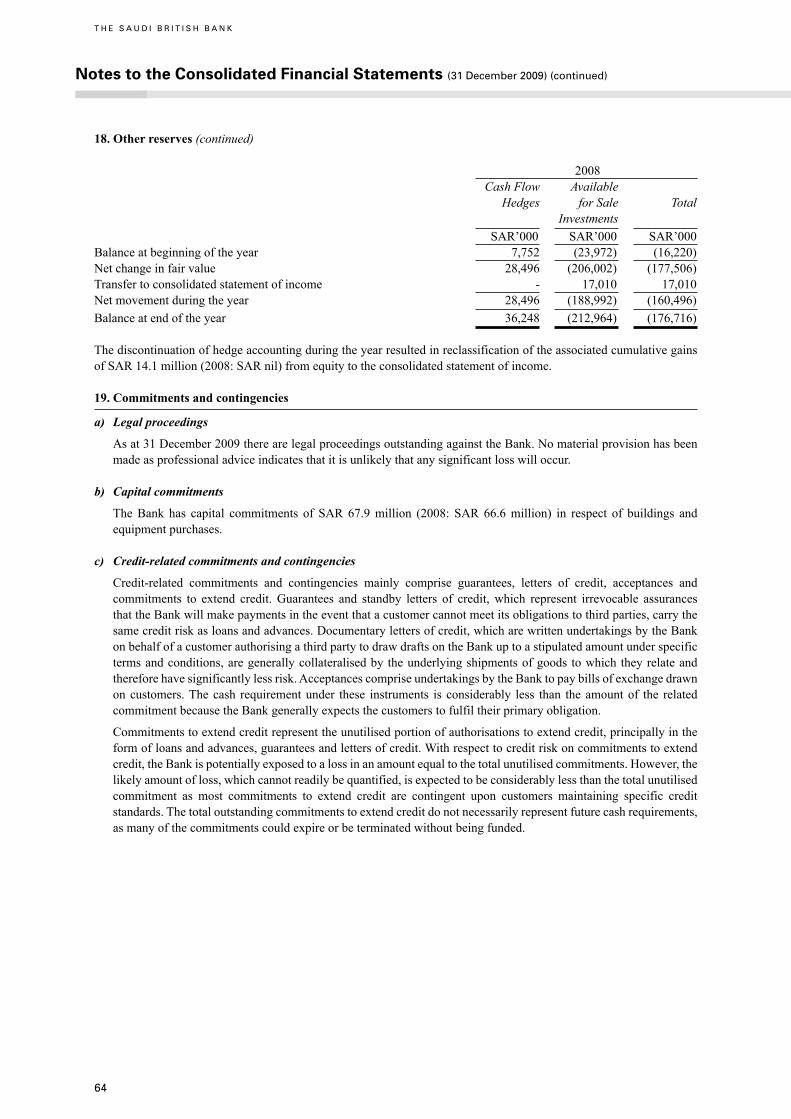
64
Notes to the Consolidated Financial Statements (31 December 2009) (continued)
T H E S A U D I B R I T I S H B A N K
18. Other reserves (continued)
2008 Cash Flow Available Hedges for Sale Total Investments SAR’000 SAR’000 SAR’000Balance at beginning of the year 7,752 (23,972) (16,220)Net change in fair value 28,496 (206,002) (177,506)Transfer to consolidated statement of income - 17,010 17,010Net movement during the year 28,496 (188,992) (160,496)Balance at end of the year 36,248 (212,964) (176,716)
The discontinuation of hedge accounting during the year resulted in reclassification of the associated cumulative gains of SAR 14.1 million (2008: SAR nil) from equity to the consolidated statement of income.
19. Commitments and contingencies
a) Legal proceedings
As at 31 December 2009 there are legal proceedings outstanding against the Bank. No material provision has been made as professional advice indicates that it is unlikely that any significant loss will occur.
b) Capital commitments
The Bank has capital commitments of SAR 67.9 million (2008: SAR 66.6 million) in respect of buildings and equipment purchases.
c) Credit-related commitments and contingencies
Credit-related commitments and contingencies mainly comprise guarantees, letters of credit, acceptances and commitments to extend credit. Guarantees and standby letters of credit, which represent irrevocable assurances that the Bank will make payments in the event that a customer cannot meet its obligations to third parties, carry the same credit risk as loans and advances. Documentary letters of credit, which are written undertakings by the Bank on behalf of a customer authorising a third party to draw drafts on the Bank up to a stipulated amount under specific terms and conditions, are generally collateralised by the underlying shipments of goods to which they relate and therefore have significantly less risk. Acceptances comprise undertakings by the Bank to pay bills of exchange drawn on customers. The cash requirement under these instruments is considerably less than the amount of the related commitment because the Bank generally expects the customers to fulfil their primary obligation.
Commitments to extend credit represent the unutilised portion of authorisations to extend credit, principally in the form of loans and advances, guarantees and letters of credit. With respect to credit risk on commitments to extend credit, the Bank is potentially exposed to a loss in an amount equal to the total unutilised commitments. However, the likely amount of loss, which cannot readily be quantified, is expected to be considerably less than the total unutilised commitment as most commitments to extend credit are contingent upon customers maintaining specific credit standards. The total outstanding commitments to extend credit do not necessarily represent future cash requirements, as many of the commitments could expire or be terminated without being funded.
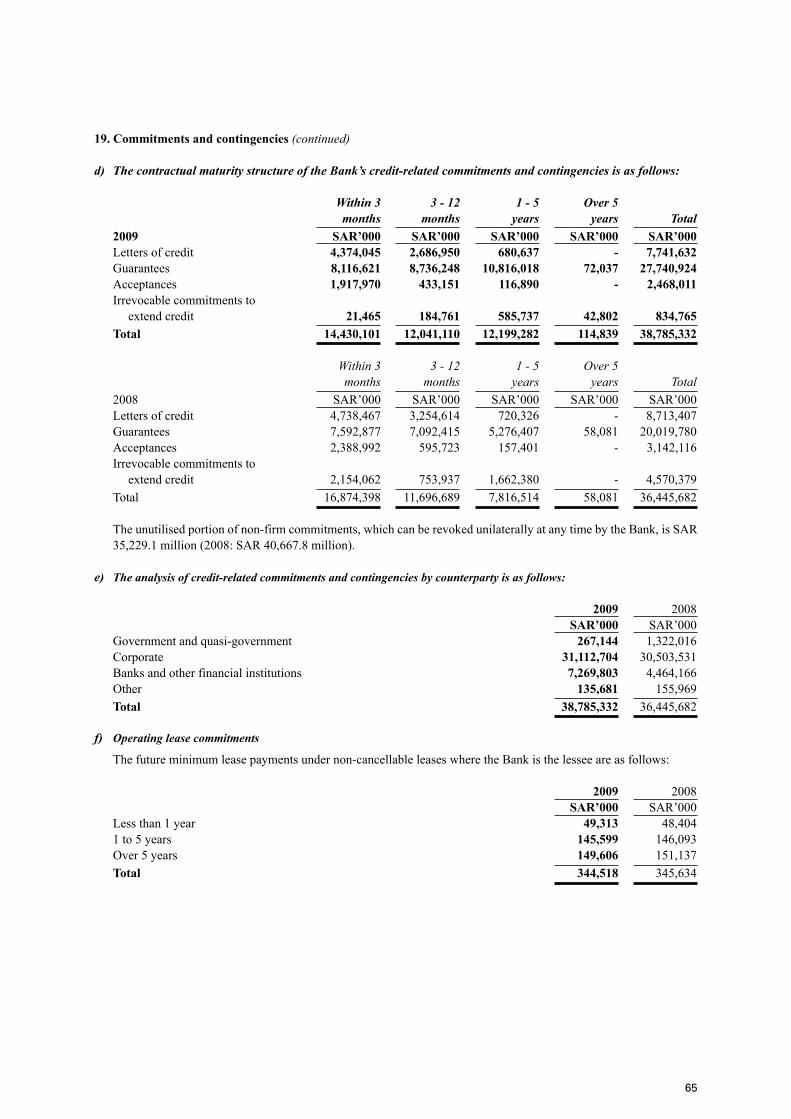
65
19. Commitments and contingencies (continued)
d) ThecontractualmaturitystructureoftheBank’scredit-relatedcommitmentsandcontingenciesisasfollows:
Within3 3-12 1-5 Over5 months months years years Total 2009 SAR’000 SAR’000 SAR’000 SAR’000 SAR’000 Letters of credit 4,374,045 2,686,950 680,637 - 7,741,632 Guarantees 8,116,621 8,736,248 10,816,018 72,037 27,740,924 Acceptances 1,917,970 433,151 116,890 - 2,468,011 Irrevocable commitments to extend credit 21,465 184,761 585,737 42,802 834,765 Total 14,430,101 12,041,110 12,199,282 114,839 38,785,332
Within 3 3 - 12 1 - 5 Over 5 months months years years Total 2008 SAR’000 SAR’000 SAR’000 SAR’000 SAR’000 Letters of credit 4,738,467 3,254,614 720,326 - 8,713,407 Guarantees 7,592,877 7,092,415 5,276,407 58,081 20,019,780 Acceptances 2,388,992 595,723 157,401 - 3,142,116 Irrevocable commitments to extend credit 2,154,062 753,937 1,662,380 - 4,570,379 Total 16,874,398 11,696,689 7,816,514 58,081 36,445,682
The unutilised portion of non-firm commitments, which can be revoked unilaterally at any time by the Bank, is SAR 35,229.1 million (2008: SAR 40,667.8 million).
e) Theanalysisofcredit-relatedcommitmentsandcontingenciesbycounterpartyisasfollows:
2009 2008 SAR’000 SAR’000 Government and quasi-government 267,144 1,322,016 Corporate 31,112,704 30,503,531 Banks and other financial institutions 7,269,803 4,464,166 Other 135,681 155,969 Total 38,785,332 36,445,682
f) Operating lease commitments
The future minimum lease payments under non-cancellable leases where the Bank is the lessee are as follows:
2009 2008 SAR’000 SAR’000 Less than 1 year 49,313 48,404 1 to 5 years 145,599 146,093 Over 5 years 149,606 151,137 Total 344,518 345,634
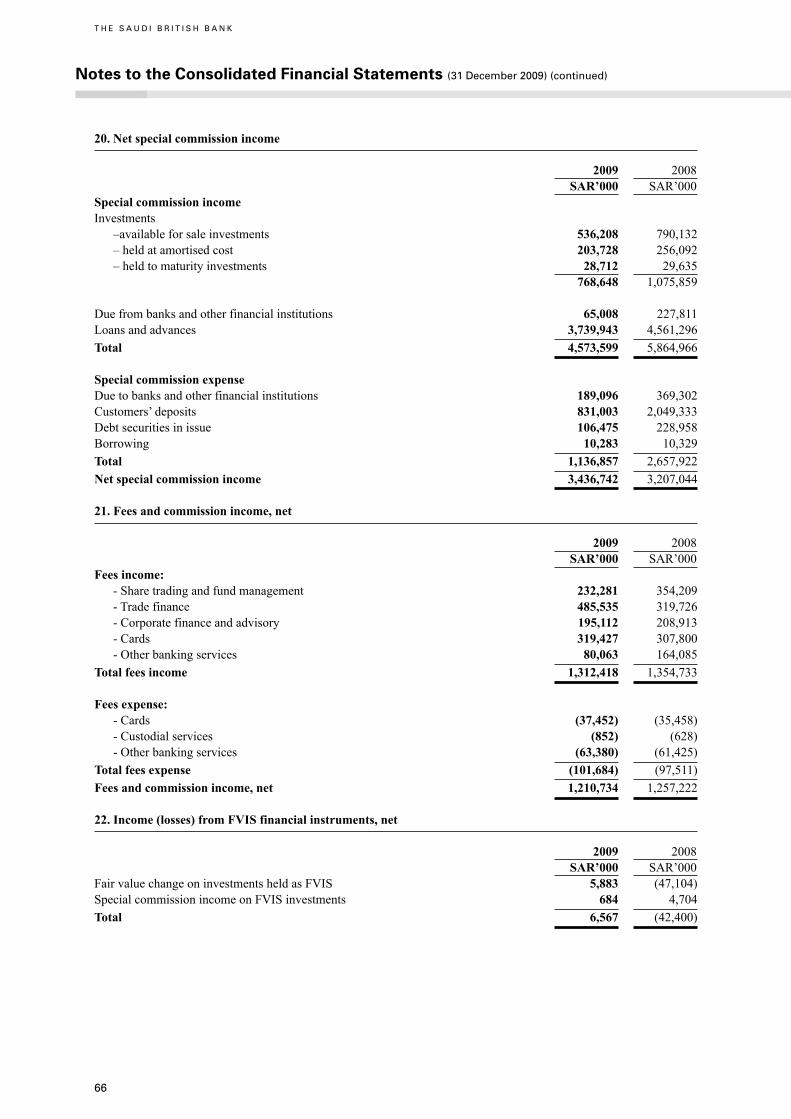
66
Notes to the Consolidated Financial Statements (31 December 2009) (continued)
T H E S A U D I B R I T I S H B A N K
20. Net special commission income
2009 2008 SAR’000 SAR’000Special commission incomeInvestments –available for sale investments 536,208 790,132 – held at amortised cost 203,728 256,092 – held to maturity investments 28,712 29,635 768,648 1,075,859
Due from banks and other financial institutions 65,008 227,811Loans and advances 3,739,943 4,561,296Total 4,573,599 5,864,966
Special commission expenseDue to banks and other financial institutions 189,096 369,302Customers’ deposits 831,003 2,049,333Debt securities in issue 106,475 228,958Borrowing 10,283 10,329Total 1,136,857 2,657,922Net special commission income 3,436,742 3,207,044
21. Fees and commission income, net
2009 2008 SAR’000 SAR’000Fees income: - Share trading and fund management 232,281 354,209 - Trade finance 485,535 319,726 - Corporate finance and advisory 195,112 208,913 - Cards 319,427 307,800 - Other banking services 80,063 164,085Total fees income 1,312,418 1,354,733 Fees expense: - Cards (37,452) (35,458) - Custodial services (852) (628) - Other banking services (63,380) (61,425)Total fees expense (101,684) (97,511)Fees and commission income, net 1,210,734 1,257,222
22. Income (losses) from FVIS financial instruments, net
2009 2008 SAR’000 SAR’000Fair value change on investments held as FVIS 5,883 (47,104)Special commission income on FVIS investments 684 4,704Total 6,567 (42,400)
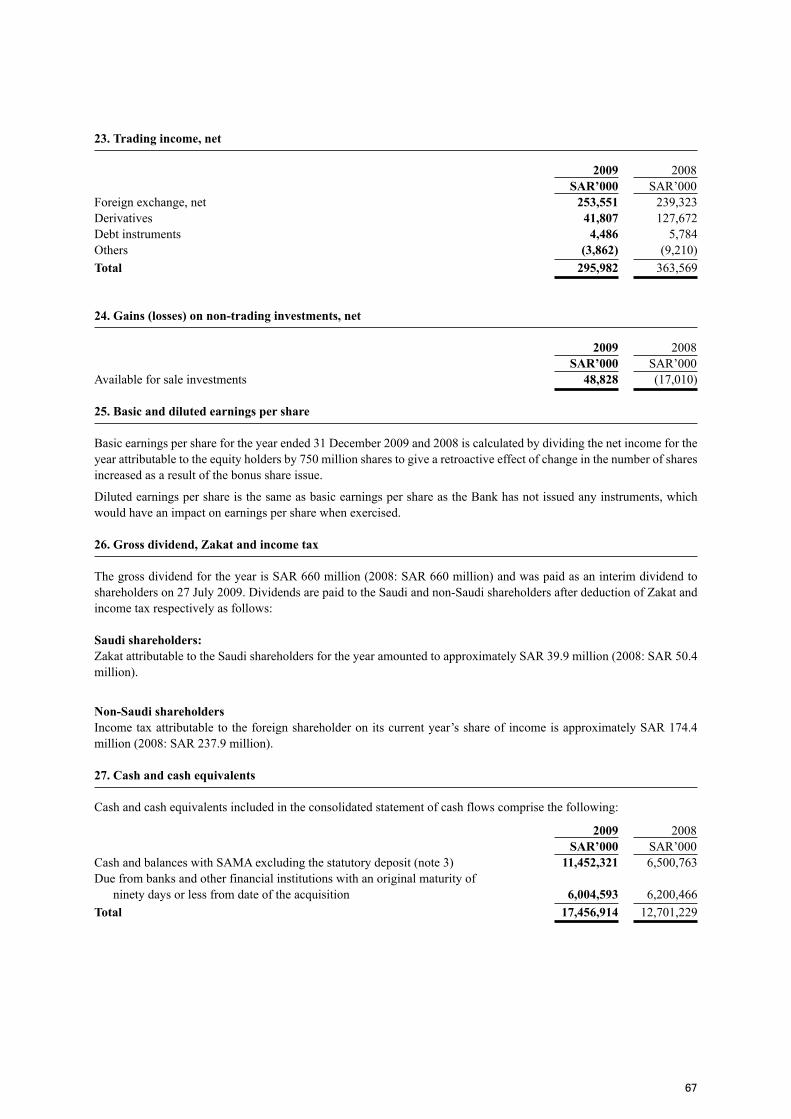
67
23. Trading income, net
2009 2008 SAR’000 SAR’000Foreign exchange, net 253,551 239,323Derivatives 41,807 127,672Debt instruments 4,486 5,784Others (3,862) (9,210)Total 295,982 363,569
24. Gains (losses) on non-trading investments, net
2009 2008 SAR’000 SAR’000Available for sale investments 48,828 (17,010)
25. Basic and diluted earnings per share
Basic earnings per share for the year ended 31 December 2009 and 2008 is calculated by dividing the net income for the year attributable to the equity holders by 750 million shares to give a retroactive effect of change in the number of shares increased as a result of the bonus share issue.
Diluted earnings per share is the same as basic earnings per share as the Bank has not issued any instruments, which would have an impact on earnings per share when exercised.
26. Gross dividend, Zakat and income tax
The gross dividend for the year is SAR 660 million (2008: SAR 660 million) and was paid as an interim dividend to shareholders on 27 July 2009. Dividends are paid to the Saudi and non-Saudi shareholders after deduction of Zakat and income tax respectively as follows:
Saudi shareholders:Zakat attributable to the Saudi shareholders for the year amounted to approximately SAR 39.9 million (2008: SAR 50.4 million).
Non-Saudi shareholdersIncome tax attributable to the foreign shareholder on its current year’s share of income is approximately SAR 174.4 million (2008: SAR 237.9 million).
27. Cash and cash equivalents
Cash and cash equivalents included in the consolidated statement of cash flows comprise the following:
2009 2008 SAR’000 SAR’000Cash and balances with SAMA excluding the statutory deposit (note 3) 11,452,321 6,500,763Due from banks and other financial institutions with an original maturity of ninety days or less from date of the acquisition 6,004,593 6,200,466Total 17,456,914 12,701,229

68
Notes to the Consolidated Financial Statements (31 December 2009) (continued)
T H E S A U D I B R I T I S H B A N K
28. Business segments
The Bank has adopted IFRS 8 Operating Segments with effect from 1 January 2009. IFRS 8 requires operating segments to be identified on the basis of internal reports about components of the Bank that are regularly reviewed by the chief decision maker in order to allocate resources to the segments and to assess its performance. In contrast, the predecessor standard IAS 14 Segment Reporting required an entity to identify two sets of segments (business and geographical), using a risks and reward approach, with the entity’s system of internal financial reporting to key management personnel serving only as a starting point for the identification of such segments. Following the adoption of IFRS 8, the identification of the Bank’s reportable segments has not changed.
The Bank’s primary business is conducted in Saudi Arabia.
Transactions between the operating segments are on normal commercial terms and conditions. There are no material items of income or expense between the operating segments. Segment assets and liabilities comprise operating assets and liabilities, being the majority of the balance.
a) TheBank’sreportablesegmentsunderIFRS8areasfollows:
Retail Banking – which caters mainly to the banking requirements of personal and private banking customers.
Corporate Banking – which caters mainly to the banking requirements of commercial and corporate banking customers.
Treasury – which manages the Bank’s liquidity, currency and special commission rate risks. It is also responsible for funding the Bank’s operations and managing the Bank’s investment portfolio and statement of financial position.
Transactions between the business segments are reported as recorded by the Bank’s transfer pricing system. The Bank’s total assets and liabilities as at 31 December 2009 and 2008, its total operating income and expenses and the results for the years then ended (by business segment) are as follows:
Retail Corporate Banking Banking Treasury Others Total2009 SAR’000 SAR’000 SAR’000 SAR’000 SAR’000Total assets 21,007,060 57,326,634 48,313,780 190,488 126,837,962Total liabilities 36,360,818 39,664,579 37,732,187 35,089 113,792,673Total operating income 1,896,342 2,221,338 821,103 221,496 5,160,279Total operating expenses 1,572,177 1,415,350 61,675 124,848 3,174,050Share in earnings of associates,net - - - 46,048 46,048Net income 324,165 805,988 759,428 142,696 2,032,277Fees and commission income, net 507,889 691,507 11,659 (321) 1,210,734Trading income, net - 5,027 290,955 - 295,982Credit losses and impairment provision, net 436,966 1,059,517 - - 1,496,483
Retail Corporate2008 Banking Banking Treasury Others TotalTotal assets 24,032,842 58,450,117 49,026,870 150,864 131,660,693Total liabilities 35,434,109 41,808,929 42,771,069 12,755 120,026,862Total operating income 1,932,519 1,889,277 664,895 424,837 4,911,528Total operating expenses 1,426,032 393,934 149,927 129,937 2,099,830Share in earnings of associates,net - - - 108,321 108,321Net income 506,487 1,495,343 514,968 403,221 2,920,019Fees and commission income, net 654,146 602,778 317 (19) 1,257,222Trading income, net 3,190 - 360,379 - 363,569Credit losses and impairment provision, net 304,450 66,830 86,929 - 458,209

69
b) TheBank’screditexposurebybusinesssegmentisasfollows:
Retail Corporate2009 Banking Banking Treasury Others TotalAssets 19,481,964 56,899,635 45,774,334 180,458 122,336,391Commitments and contingencies 211,368 16,118,405 - - 16,329,773Derivatives - - 2,821,383 - 2,821,383Total 19,693,332 73,018,040 48,595,717 180,458 141,487,547 Retail Corporate2008 Banking Banking Treasury Others TotalAssets 22,345,009 57,891,748 46,511,454 148,356 126,896,567Commitments and contingencies 174,607 14,491,577 - - 14,666,184Derivatives - - 3,195,209 - 3,195,209Total 22,519,616 72,383,325 49,706,663 148,356 144,757,960
Credit exposure comprises the carrying value of assets excluding cash, property and equipment and other assets, and the credit equivalent value for commitments, contingencies and derivatives.
29. Credit risk
The Bank manages exposure to credit risk, which is the risk that one party to a financial instrument will fail to discharge an obligation and cause the other party to incur a financial loss. Credit exposures arise principally in lending activities that lead to loans and advances, and investment activities. There is also credit risk on credit-related commitments and contingencies and derivatives.
The Bank assesses the probability of default of counterparties using internal rating tools. Also the Bank uses the external ratings, of the major rating agencies, where available.
The Bank attempts to control credit risk by monitoring credit exposures, limiting transactions with specific counterparties, and continually assessing the creditworthiness of counterparties. The Bank’s risk management policies are designed to identify and to set appropriate risk limits and to monitor the risks and adherence to limits. Actual exposures against limits are monitored daily. In addition to monitoring credit limits, the Bank manages the credit exposure relating to its trading activities by entering into master netting agreements and collateral arrangements with counterparties in appropriate circumstances, and limiting the duration of exposure. In certain cases the Bank may also close out transactions or assign them to other counterparties to mitigate credit risk. The Bank’s credit risk for derivatives, represents the potential cost to replace the derivative contracts if counterparties fail to fulfill their obligation, and to control the level of credit risk taken, The Bank assesses counterparties using the same techniques as for its lending activities.
Concentrations of credit risk arise when a number of counterparties are engaged in similar business activities, or activities in the same geographic region, or have similar economic features that would cause their ability to meet contractual obligations to be similarly affected by changes in economic, political or other conditions.
Concentrations of credit risk indicate the relative sensitivity of the Bank’s performance to developments affecting a particular industry or geographical location.
The Bank seeks to manage its credit risk exposure through diversification of lending activities to ensure that there is no undue concentration of risks with individuals or groups of customers in specific locations or business. It also takes security when appropriate. The Bank also seeks additional collateral from the counterparty as soon as impairment indicators are noticed for the relevant individual loans and advances.
Management monitors the market value of collateral and requests additional collateral in accordance with the underlying agreements. It also monitors the market value of collateral obtained during its review of the adequacy of the provision for credit losses.
The Bank regularly reviews its risk management policies and systems to reflect changes in market’s products and emerging best practice.
The debt securities included in the investment portfolio are mainly sovereign risk. Analysis of investments by counterparty is provided in note 5. For details of the composition of loans and advances refer to note 6. Information on credit risk relating to derivative instruments is provided in note 10, and for commitments and contingencies in note 19. The information on Bank’s maximum credit exposure by business segment is given in note 28. The information on maximum credit risk exposure and its relative risk weights is also provided in note 37.
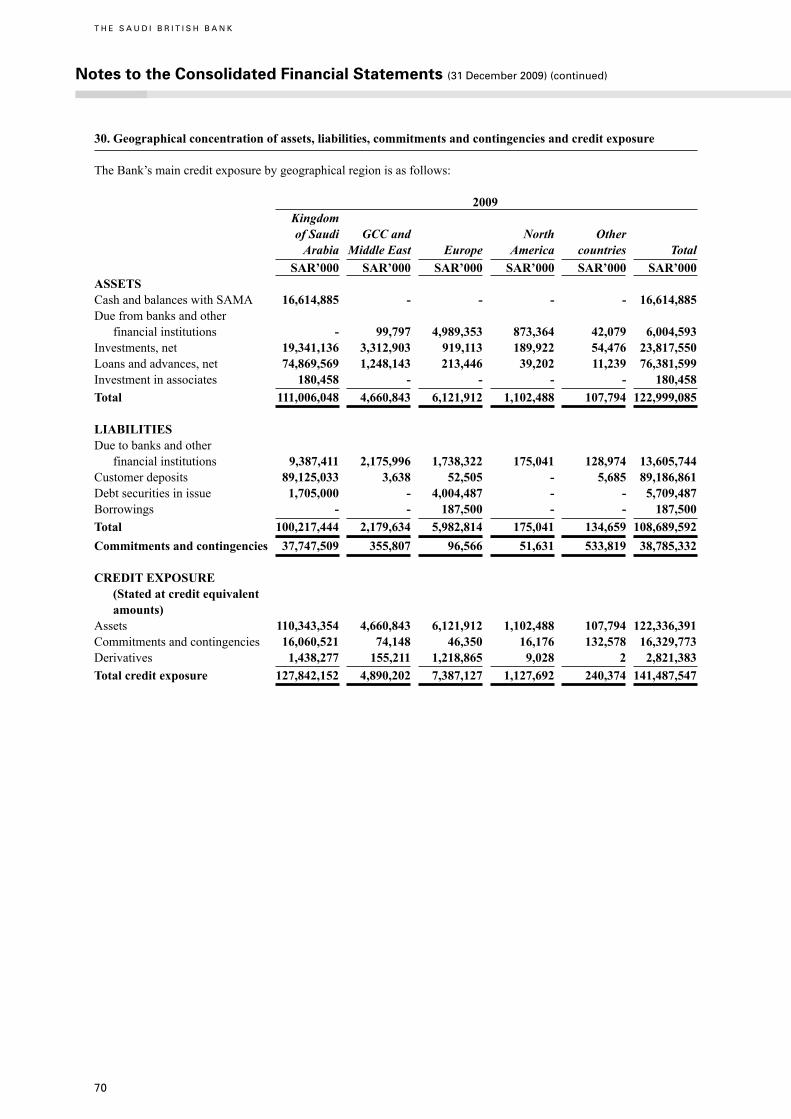
70
Notes to the Consolidated Financial Statements (31 December 2009) (continued)
T H E S A U D I B R I T I S H B A N K
30. Geographical concentration of assets, liabilities, commitments and contingencies and credit exposure
The Bank’s main credit exposure by geographical region is as follows:
2009 Kingdom ofSaudi GCCand North Other Arabia Middle East Europe America countries Total SAR’000 SAR’000 SAR’000 SAR’000 SAR’000 SAR’000ASSETS Cash and balances with SAMA 16,614,885 - - - - 16,614,885Due from banks and other financial institutions - 99,797 4,989,353 873,364 42,079 6,004,593Investments, net 19,341,136 3,312,903 919,113 189,922 54,476 23,817,550Loans and advances, net 74,869,569 1,248,143 213,446 39,202 11,239 76,381,599Investment in associates 180,458 - - - - 180,458Total 111,006,048 4,660,843 6,121,912 1,102,488 107,794 122,999,085
LIABILITIES Due to banks and other financial institutions 9,387,411 2,175,996 1,738,322 175,041 128,974 13,605,744Customer deposits 89,125,033 3,638 52,505 - 5,685 89,186,861Debt securities in issue 1,705,000 - 4,004,487 - - 5,709,487Borrowings - - 187,500 - - 187,500Total 100,217,444 2,179,634 5,982,814 175,041 134,659 108,689,592Commitments and contingencies 37,747,509 355,807 96,566 51,631 533,819 38,785,332 CREDIT EXPOSURE (Stated at credit equivalent amounts)Assets 110,343,354 4,660,843 6,121,912 1,102,488 107,794 122,336,391Commitments and contingencies 16,060,521 74,148 46,350 16,176 132,578 16,329,773Derivatives 1,438,277 155,211 1,218,865 9,028 2 2,821,383Total credit exposure 127,842,152 4,890,202 7,387,127 1,127,692 240,374 141,487,547
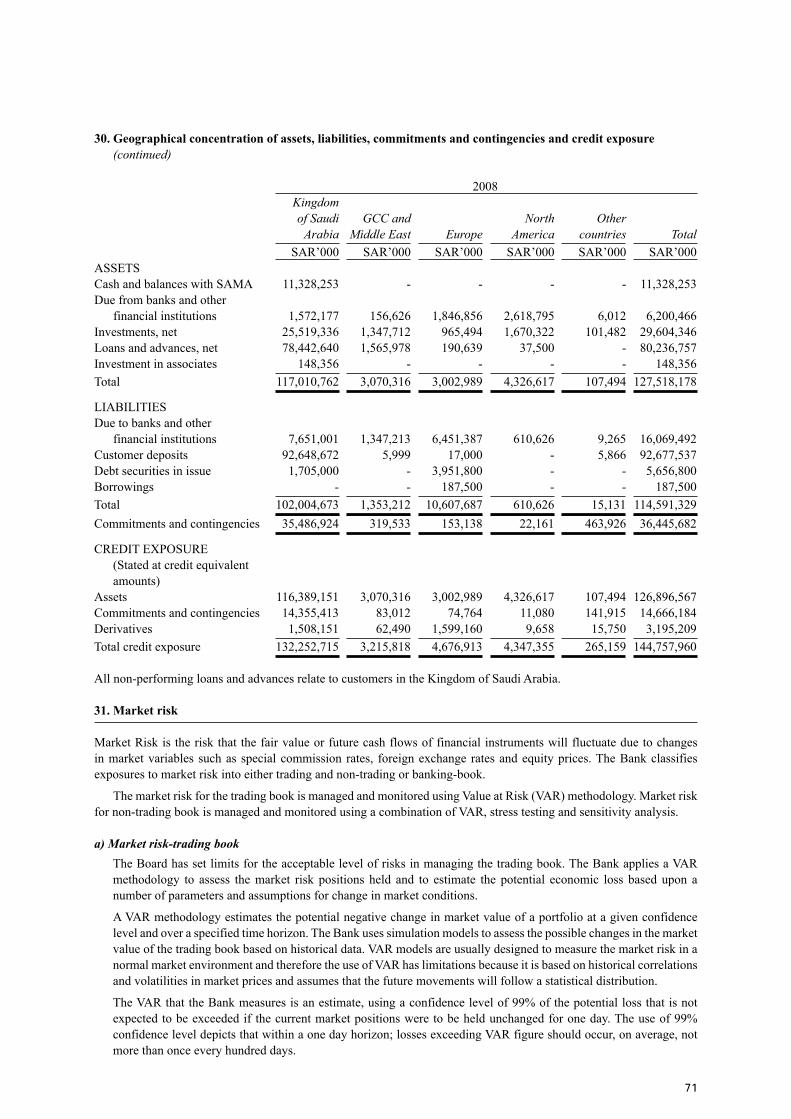
71
30. Geographical concentration of assets, liabilities, commitments and contingencies and credit exposure (continued)
2008 Kingdom of Saudi GCC and North Other Arabia Middle East Europe America countries Total SAR’000 SAR’000 SAR’000 SAR’000 SAR’000 SAR’000ASSETS Cash and balances with SAMA 11,328,253 - - - - 11,328,253Due from banks and other financial institutions 1,572,177 156,626 1,846,856 2,618,795 6,012 6,200,466Investments, net 25,519,336 1,347,712 965,494 1,670,322 101,482 29,604,346Loans and advances, net 78,442,640 1,565,978 190,639 37,500 - 80,236,757Investment in associates 148,356 - - - - 148,356Total 117,010,762 3,070,316 3,002,989 4,326,617 107,494 127,518,178
LIABILITIES Due to banks and other financial institutions 7,651,001 1,347,213 6,451,387 610,626 9,265 16,069,492Customer deposits 92,648,672 5,999 17,000 - 5,866 92,677,537Debt securities in issue 1,705,000 - 3,951,800 - - 5,656,800Borrowings - - 187,500 - - 187,500Total 102,004,673 1,353,212 10,607,687 610,626 15,131 114,591,329Commitments and contingencies 35,486,924 319,533 153,138 22,161 463,926 36,445,682
CREDIT EXPOSURE (Stated at credit equivalent amounts)Assets 116,389,151 3,070,316 3,002,989 4,326,617 107,494 126,896,567Commitments and contingencies 14,355,413 83,012 74,764 11,080 141,915 14,666,184Derivatives 1,508,151 62,490 1,599,160 9,658 15,750 3,195,209Total credit exposure 132,252,715 3,215,818 4,676,913 4,347,355 265,159 144,757,960
All non-performing loans and advances relate to customers in the Kingdom of Saudi Arabia.
31. Market risk
Market Risk is the risk that the fair value or future cash flows of financial instruments will fluctuate due to changes in market variables such as special commission rates, foreign exchange rates and equity prices. The Bank classifies exposures to market risk into either trading and non-trading or banking-book.
The market risk for the trading book is managed and monitored using Value at Risk (VAR) methodology. Market risk for non-trading book is managed and monitored using a combination of VAR, stress testing and sensitivity analysis.
a)Marketrisk-tradingbook The Board has set limits for the acceptable level of risks in managing the trading book. The Bank applies a VAR
methodology to assess the market risk positions held and to estimate the potential economic loss based upon a number of parameters and assumptions for change in market conditions.
A VAR methodology estimates the potential negative change in market value of a portfolio at a given confidence level and over a specified time horizon. The Bank uses simulation models to assess the possible changes in the market value of the trading book based on historical data. VAR models are usually designed to measure the market risk in a normal market environment and therefore the use of VAR has limitations because it is based on historical correlations and volatilities in market prices and assumes that the future movements will follow a statistical distribution.
The VAR that the Bank measures is an estimate, using a confidence level of 99% of the potential loss that is not expected to be exceeded if the current market positions were to be held unchanged for one day. The use of 99% confidence level depicts that within a one day horizon; losses exceeding VAR figure should occur, on average, not more than once every hundred days.
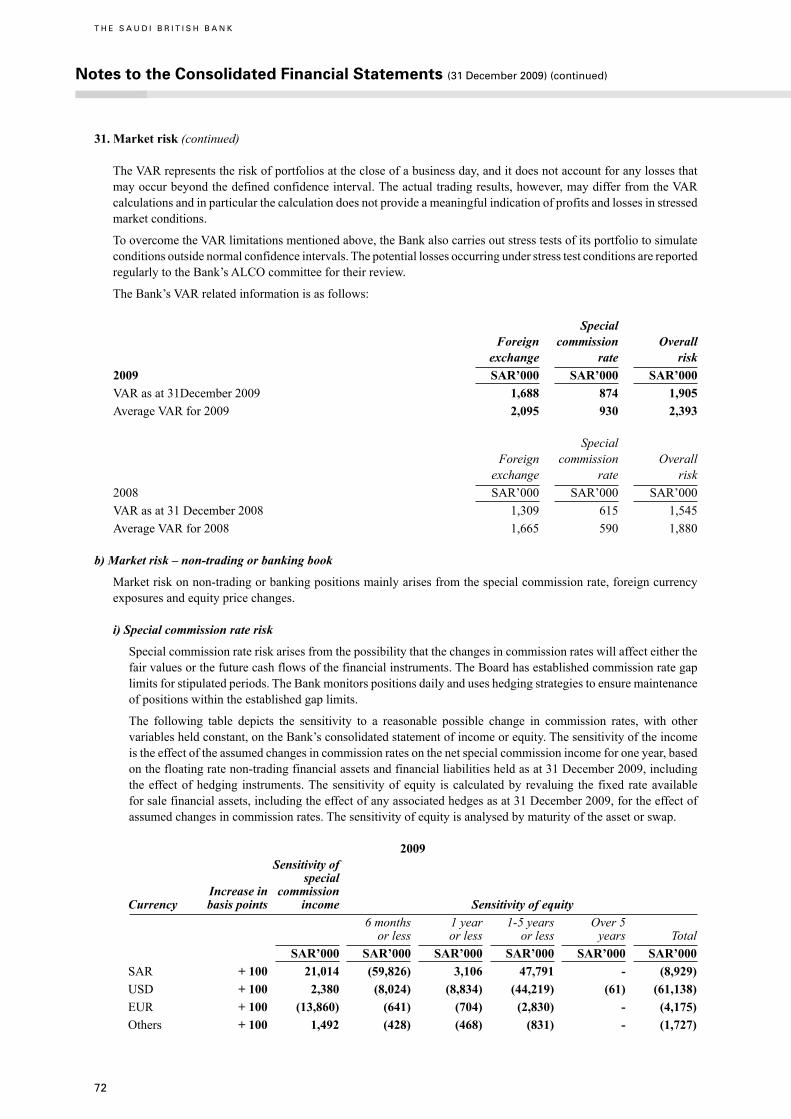
72
Notes to the Consolidated Financial Statements (31 December 2009) (continued)
T H E S A U D I B R I T I S H B A N K
31. Market risk (continued)
The VAR represents the risk of portfolios at the close of a business day, and it does not account for any losses that may occur beyond the defined confidence interval. The actual trading results, however, may differ from the VAR calculations and in particular the calculation does not provide a meaningful indication of profits and losses in stressed market conditions.
To overcome the VAR limitations mentioned above, the Bank also carries out stress tests of its portfolio to simulate conditions outside normal confidence intervals. The potential losses occurring under stress test conditions are reported regularly to the Bank’s ALCO committee for their review.
The Bank’s VAR related information is as follows:
Special Foreign commission Overall exchange rate risk 2009 SAR’000 SAR’000 SAR’000 VAR as at 31December 2009 1,688 874 1,905 Average VAR for 2009 2,095 930 2,393
Special Foreign commission Overall exchange rate risk 2008 SAR’000 SAR’000 SAR’000 VAR as at 31 December 2008 1,309 615 1,545 Average VAR for 2008 1,665 590 1,880
b)Marketrisk–non-tradingorbankingbook
Market risk on non-trading or banking positions mainly arises from the special commission rate, foreign currency exposures and equity price changes.
i)Specialcommissionraterisk
Special commission rate risk arises from the possibility that the changes in commission rates will affect either the fair values or the future cash flows of the financial instruments. The Board has established commission rate gap limits for stipulated periods. The Bank monitors positions daily and uses hedging strategies to ensure maintenance of positions within the established gap limits.
The following table depicts the sensitivity to a reasonable possible change in commission rates, with other variables held constant, on the Bank’s consolidated statement of income or equity. The sensitivity of the income is the effect of the assumed changes in commission rates on the net special commission income for one year, based on the floating rate non-trading financial assets and financial liabilities held as at 31 December 2009, including the effect of hedging instruments. The sensitivity of equity is calculated by revaluing the fixed rate available for sale financial assets, including the effect of any associated hedges as at 31 December 2009, for the effect of assumed changes in commission rates. The sensitivity of equity is analysed by maturity of the asset or swap.
2009 Sensitivity of special Increase in commission Currency basispoints income Sensitivityofequity 6 months 1 year 1-5 years Over 5 or less or less or less years Total SAR’000 SAR’000 SAR’000 SAR’000 SAR’000 SAR’000 SAR + 100 21,014 (59,826) 3,106 47,791 - (8,929) USD + 100 2,380 (8,024) (8,834) (44,219) (61) (61,138) EUR + 100 (13,860) (641) (704) (2,830) - (4,175) Others + 100 1,492 (428) (468) (831) - (1,727)
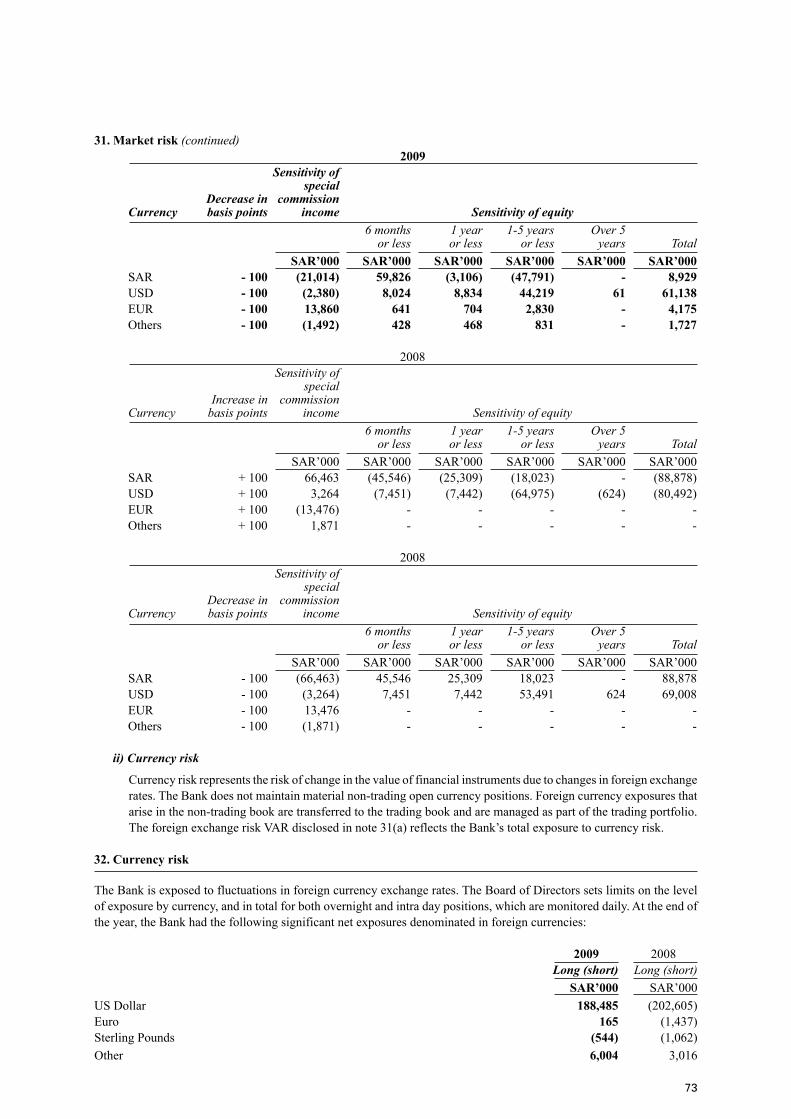
73
31. Market risk (continued) 2009 Sensitivity of special Decrease in commission Currency basispoints income Sensitivityofequity 6 months 1 year 1-5 years Over 5 or less or less or less years Total SAR’000 SAR’000 SAR’000 SAR’000 SAR’000 SAR’000 SAR - 100 (21,014) 59,826 (3,106) (47,791) - 8,929 USD - 100 (2,380) 8,024 8,834 44,219 61 61,138 EUR - 100 13,860 641 704 2,830 - 4,175 Others - 100 (1,492) 428 468 831 - 1,727
2008 Sensitivity of special Increase in commission Currency basis points income Sensitivity of equity 6 months 1 year 1-5 years Over 5 or less or less or less years Total SAR’000 SAR’000 SAR’000 SAR’000 SAR’000 SAR’000 SAR + 100 66,463 (45,546) (25,309) (18,023) - (88,878) USD + 100 3,264 (7,451) (7,442) (64,975) (624) (80,492) EUR + 100 (13,476) - - - - - Others + 100 1,871 - - - - -
2008 Sensitivity of special Decrease in commission Currency basis points income Sensitivity of equity 6 months 1 year 1-5 years Over 5 or less or less or less years Total SAR’000 SAR’000 SAR’000 SAR’000 SAR’000 SAR’000 SAR - 100 (66,463) 45,546 25,309 18,023 - 88,878 USD - 100 (3,264) 7,451 7,442 53,491 624 69,008 EUR - 100 13,476 - - - - - Others - 100 (1,871) - - - - -
ii)Currencyrisk
Currency risk represents the risk of change in the value of financial instruments due to changes in foreign exchange rates. The Bank does not maintain material non-trading open currency positions. Foreign currency exposures that arise in the non-trading book are transferred to the trading book and are managed as part of the trading portfolio. The foreign exchange risk VAR disclosed in note 31(a) reflects the Bank’s total exposure to currency risk.
32. Currency risk
The Bank is exposed to fluctuations in foreign currency exchange rates. The Board of Directors sets limits on the level of exposure by currency, and in total for both overnight and intra day positions, which are monitored daily. At the end of the year, the Bank had the following significant net exposures denominated in foreign currencies:
2009 2008 Long(short) Long (short) SAR’000 SAR’000US Dollar 188,485 (202,605)Euro 165 (1,437)Sterling Pounds (544) (1,062)Other 6,004 3,016
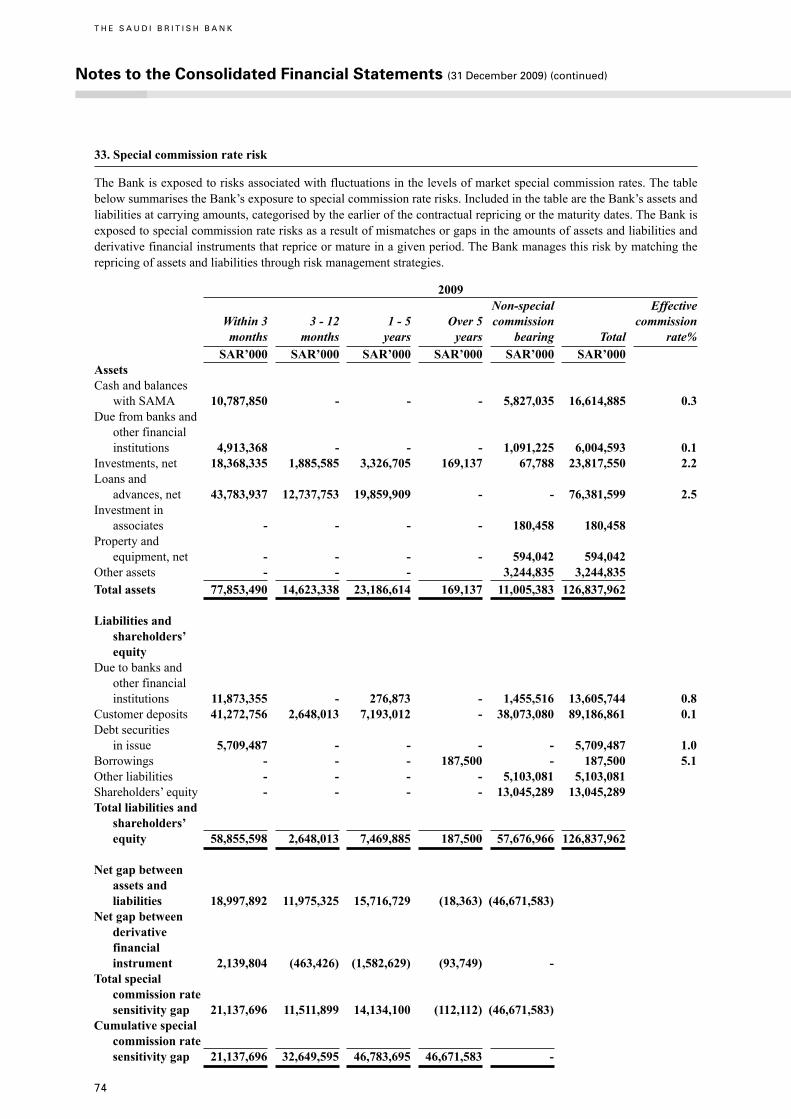
74
Notes to the Consolidated Financial Statements (31 December 2009) (continued)
T H E S A U D I B R I T I S H B A N K
33. Special commission rate risk
The Bank is exposed to risks associated with fluctuations in the levels of market special commission rates. The table below summarises the Bank’s exposure to special commission rate risks. Included in the table are the Bank’s assets and liabilities at carrying amounts, categorised by the earlier of the contractual repricing or the maturity dates. The Bank is exposed to special commission rate risks as a result of mismatches or gaps in the amounts of assets and liabilities and derivative financial instruments that reprice or mature in a given period. The Bank manages this risk by matching the repricing of assets and liabilities through risk management strategies.
2009 Non-special Effective Within3 3-12 1-5 Over5 commission commission months months years years bearing Total rate% SAR’000 SAR’000 SAR’000 SAR’000 SAR’000 SAR’000 AssetsCash and balances with SAMA 10,787,850 - - - 5,827,035 16,614,885 0.3Due from banks and other financial institutions 4,913,368 - - - 1,091,225 6,004,593 0.1Investments, net 18,368,335 1,885,585 3,326,705 169,137 67,788 23,817,550 2.2Loans and advances, net 43,783,937 12,737,753 19,859,909 - - 76,381,599 2.5Investment in associates - - - - 180,458 180,458Property and equipment, net - - - - 594,042 594,042 Other assets - - - 3,244,835 3,244,835 Total assets 77,853,490 14,623,338 23,186,614 169,137 11,005,383 126,837,962
Liabilities and shareholders’ equityDue to banks and other financial institutions 11,873,355 - 276,873 - 1,455,516 13,605,744 0.8Customer deposits 41,272,756 2,648,013 7,193,012 - 38,073,080 89,186,861 0.1Debt securities in issue 5,709,487 - - - - 5,709,487 1.0Borrowings - - - 187,500 - 187,500 5.1Other liabilities - - - - 5,103,081 5,103,081Shareholders’ equity - - - - 13,045,289 13,045,289 Total liabilities and shareholders’ equity 58,855,598 2,648,013 7,469,885 187,500 57,676,966 126,837,962
Net gap between assets and liabilities 18,997,892 11,975,325 15,716,729 (18,363) (46,671,583) Net gap between derivative financial instrument 2,139,804 (463,426) (1,582,629) (93,749) -Total special commission rate sensitivity gap 21,137,696 11,511,899 14,134,100 (112,112) (46,671,583) Cumulative special commission rate sensitivity gap 21,137,696 32,649,595 46,783,695 46,671,583 -
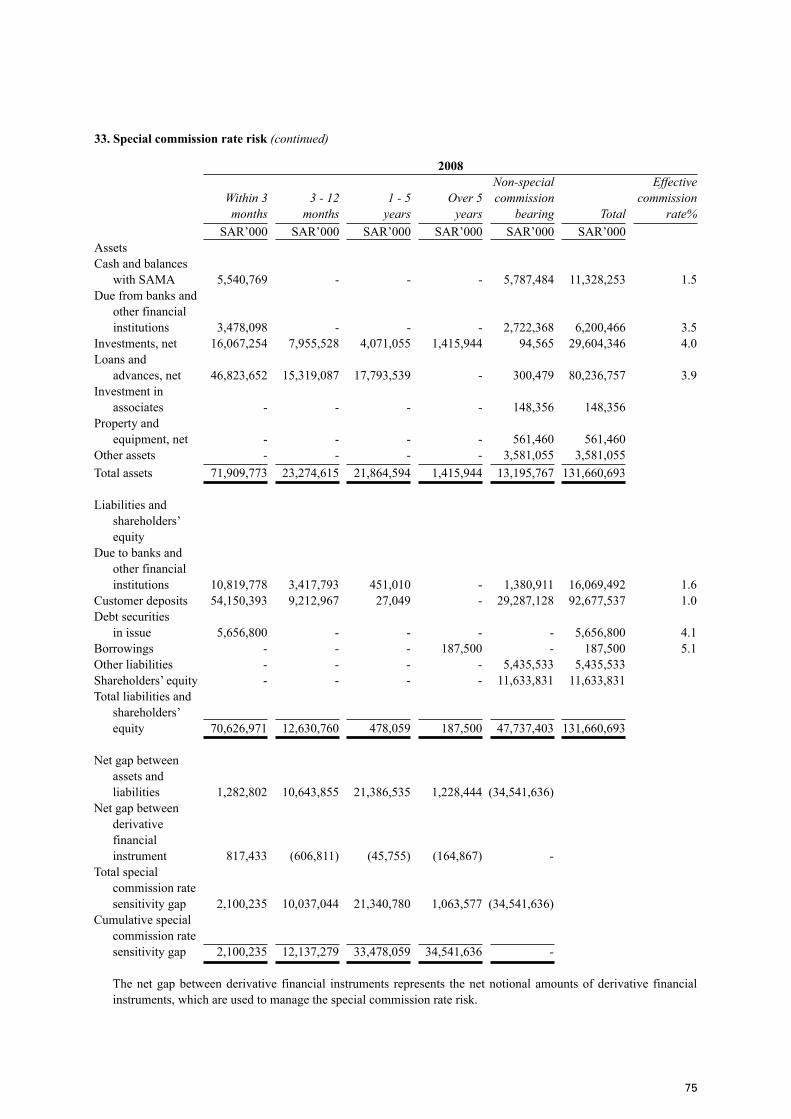
75
33. Special commission rate risk (continued)
2008 Non-special Effective Within 3 3 - 12 1 - 5 Over 5 commission commission months months years years bearing Total rate% SAR’000 SAR’000 SAR’000 SAR’000 SAR’000 SAR’000 AssetsCash and balances with SAMA 5,540,769 - - - 5,787,484 11,328,253 1.5Due from banks and other financial institutions 3,478,098 - - - 2,722,368 6,200,466 3.5Investments, net 16,067,254 7,955,528 4,071,055 1,415,944 94,565 29,604,346 4.0Loans and advances, net 46,823,652 15,319,087 17,793,539 - 300,479 80,236,757 3.9Investment in associates - - - - 148,356 148,356Property and equipment, net - - - - 561,460 561,460 Other assets - - - - 3,581,055 3,581,055 Total assets 71,909,773 23,274,615 21,864,594 1,415,944 13,195,767 131,660,693
Liabilities and shareholders’ equityDue to banks and other financial institutions 10,819,778 3,417,793 451,010 - 1,380,911 16,069,492 1.6Customer deposits 54,150,393 9,212,967 27,049 - 29,287,128 92,677,537 1.0Debt securities in issue 5,656,800 - - - - 5,656,800 4.1Borrowings - - - 187,500 - 187,500 5.1Other liabilities - - - - 5,435,533 5,435,533Shareholders’ equity - - - - 11,633,831 11,633,831 Total liabilities and shareholders’ equity 70,626,971 12,630,760 478,059 187,500 47,737,403 131,660,693
Net gap between assets and liabilities 1,282,802 10,643,855 21,386,535 1,228,444 (34,541,636) Net gap between derivative financial instrument 817,433 (606,811) (45,755) (164,867) -Total special commission rate sensitivity gap 2,100,235 10,037,044 21,340,780 1,063,577 (34,541,636) Cumulative special commission rate sensitivity gap 2,100,235 12,137,279 33,478,059 34,541,636 -
The net gap between derivative financial instruments represents the net notional amounts of derivative financial instruments, which are used to manage the special commission rate risk.
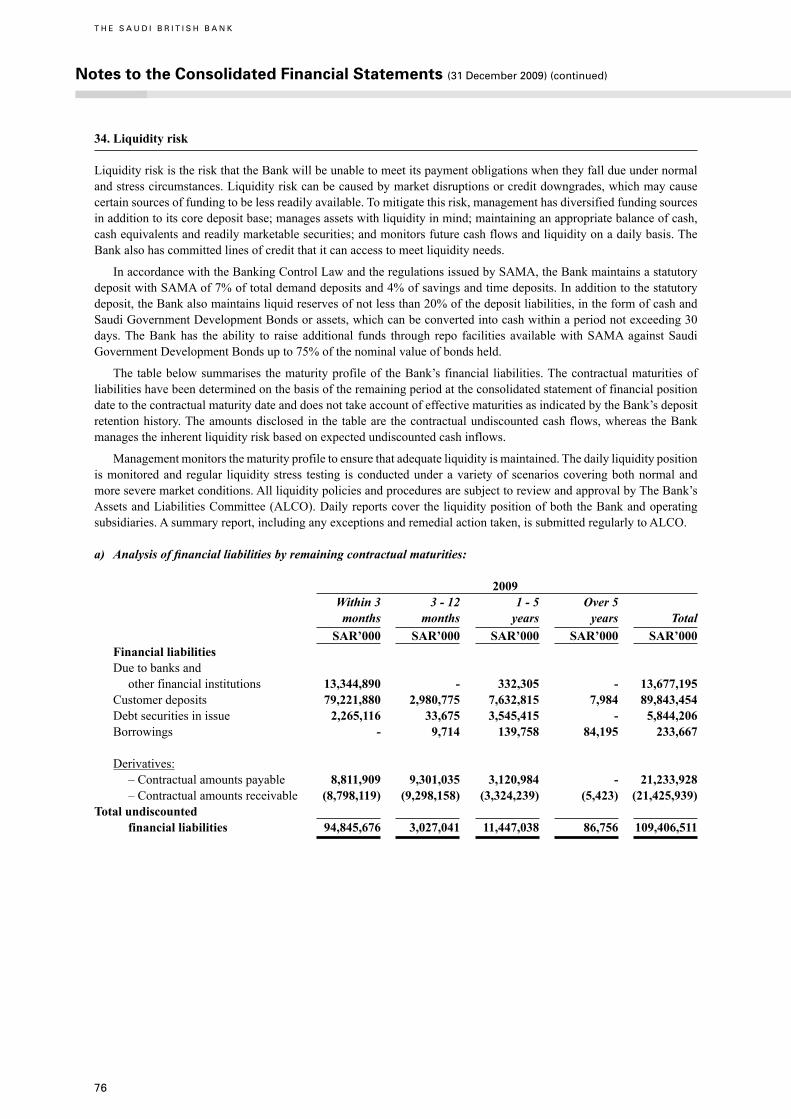
76
Notes to the Consolidated Financial Statements (31 December 2009) (continued)
T H E S A U D I B R I T I S H B A N K
34. Liquidity risk
Liquidity risk is the risk that the Bank will be unable to meet its payment obligations when they fall due under normal and stress circumstances. Liquidity risk can be caused by market disruptions or credit downgrades, which may cause certain sources of funding to be less readily available. To mitigate this risk, management has diversified funding sources in addition to its core deposit base; manages assets with liquidity in mind; maintaining an appropriate balance of cash, cash equivalents and readily marketable securities; and monitors future cash flows and liquidity on a daily basis. The Bank also has committed lines of credit that it can access to meet liquidity needs.
In accordance with the Banking Control Law and the regulations issued by SAMA, the Bank maintains a statutory deposit with SAMA of 7% of total demand deposits and 4% of savings and time deposits. In addition to the statutory deposit, the Bank also maintains liquid reserves of not less than 20% of the deposit liabilities, in the form of cash and Saudi Government Development Bonds or assets, which can be converted into cash within a period not exceeding 30 days. The Bank has the ability to raise additional funds through repo facilities available with SAMA against Saudi Government Development Bonds up to 75% of the nominal value of bonds held.
The table below summarises the maturity profile of the Bank’s financial liabilities. The contractual maturities of liabilities have been determined on the basis of the remaining period at the consolidated statement of financial position date to the contractual maturity date and does not take account of effective maturities as indicated by the Bank’s deposit retention history. The amounts disclosed in the table are the contractual undiscounted cash flows, whereas the Bank manages the inherent liquidity risk based on expected undiscounted cash inflows.
Management monitors the maturity profile to ensure that adequate liquidity is maintained. The daily liquidity position is monitored and regular liquidity stress testing is conducted under a variety of scenarios covering both normal and more severe market conditions. All liquidity policies and procedures are subject to review and approval by The Bank’s Assets and Liabilities Committee (ALCO). Daily reports cover the liquidity position of both the Bank and operating subsidiaries. A summary report, including any exceptions and remedial action taken, is submitted regularly to ALCO.
a) Analysisoffinancialliabilitiesbyremainingcontractualmaturities:
2009 Within3 3-12 1-5 Over5 months months years years Total SAR’000 SAR’000 SAR’000 SAR’000 SAR’000 Financial liabilities Due to banks and other financial institutions 13,344,890 - 332,305 - 13,677,195 Customer deposits 79,221,880 2,980,775 7,632,815 7,984 89,843,454 Debt securities in issue 2,265,116 33,675 3,545,415 - 5,844,206 Borrowings - 9,714 139,758 84,195 233,667
Derivatives: – Contractual amounts payable 8,811,909 9,301,035 3,120,984 - 21,233,928 – Contractual amounts receivable (8,798,119) (9,298,158) (3,324,239) (5,423) (21,425,939) Total undiscounted financial liabilities 94,845,676 3,027,041 11,447,038 86,756 109,406,511

77
34. Liquidity risk (continued)
2008 Within 3 3 - 12 1 - 5 Over 5 months months years years Total SAR’000 SAR’000 SAR’000 SAR’000 SAR’000 Financial liabilities Due to banks and other financial institutions 14,289,803 2,018,366 - - 16,308,169 Customer deposits 83,254,162 10,039,746 159,542 4,809 93,458,259 Debt securities in issue 63,115 205,454 6,178,587 - 6,447,156 Borrowings - 9,741 112,962 120,706 243,409
Derivatives: – Contractual amounts payable 4,685,897 5,307,824 2,648,203 - 12,641,924 – Contractual amounts receivable (4,632,191) (5,384,701) (3,052,244) (22,587) (13,091,723) Total undiscounted financial liabilities 97,660,786 12,196,430 6,047,050 102,928 116,007,194
b) Maturityanalysisofassetsandliabilities:
The table below shows an analysis of assets and liabilities analysed according to when they are expected to be recovered or settled. See note (a) above for the Bank’s contractual undiscounted financial liabilities.
2009 Within3 3-12 1-5 Over5 Nofixed months months years years maturity Total SAR’000 SAR’000 SAR’000 SAR’000 SAR’000 SAR’000 Assets Cash and balances with SAMA 11,452,321 - - - 5,162,564 16,614,885 Due from banks and other financial institutions 6,004,593 - - - - 6,004,593 Investments, net 9,574,249 3,504,383 10,355,914 305,374 77,630 23,817,550 Loans and advances, net 35,375,478 12,594,329 20,354,079 8,057,713 - 76,381,599 Investment in associates - - - - 180,458 180,458 Property and equipment, net - - - - 594,042 594,042 Other assets - - - - 3,244,835 3,244,835 Total assets 62,406,641 16,098,712 30,709,993 8,363,087 9,259,529 126,837,962
Liabilities and shareholders’ equity Due to banks and other financial institutions 13,328,871 - 276,873 - - 13,605,744 Customer deposits 79,092,271 2,969,161 7,117,445 7,984 - 89,186,861 Debt securities in issue 2,249,867 - 3,459,620 - - 5,709,487 Borrowings - - - 187,500 - 187,500 Other liabilities - - - - 5,103,081 5,103,081 Shareholders’ equity - - - - 13,045,289 13,045,289 Total liabilities and shareholders’ equity 94,671,009 2,969,161 10,853,938 195,484 18,148,370 126,837,962
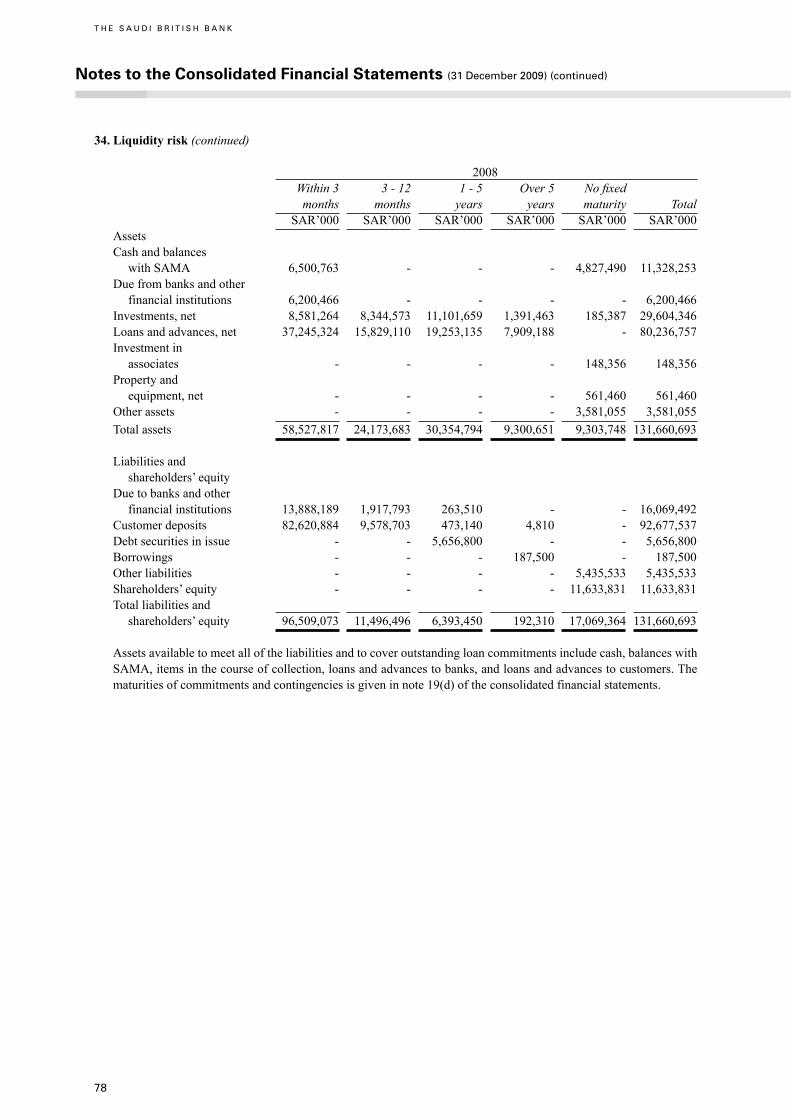
78
34. Liquidity risk (continued)
2008 Within 3 3 - 12 1 - 5 Over 5 No fixed months months years years maturity Total SAR’000 SAR’000 SAR’000 SAR’000 SAR’000 SAR’000 Assets Cash and balances with SAMA 6,500,763 - - - 4,827,490 11,328,253 Due from banks and other financial institutions 6,200,466 - - - - 6,200,466 Investments, net 8,581,264 8,344,573 11,101,659 1,391,463 185,387 29,604,346 Loans and advances, net 37,245,324 15,829,110 19,253,135 7,909,188 - 80,236,757 Investment in associates - - - - 148,356 148,356 Property and equipment, net - - - - 561,460 561,460 Other assets - - - - 3,581,055 3,581,055 Total assets 58,527,817 24,173,683 30,354,794 9,300,651 9,303,748 131,660,693
Liabilities and shareholders’ equity Due to banks and other financial institutions 13,888,189 1,917,793 263,510 - - 16,069,492 Customer deposits 82,620,884 9,578,703 473,140 4,810 - 92,677,537 Debt securities in issue - - 5,656,800 - - 5,656,800 Borrowings - - - 187,500 - 187,500 Other liabilities - - - - 5,435,533 5,435,533 Shareholders’ equity - - - - 11,633,831 11,633,831 Total liabilities and shareholders’ equity 96,509,073 11,496,496 6,393,450 192,310 17,069,364 131,660,693
Assets available to meet all of the liabilities and to cover outstanding loan commitments include cash, balances with SAMA, items in the course of collection, loans and advances to banks, and loans and advances to customers. The maturities of commitments and contingencies is given in note 19(d) of the consolidated financial statements.
Notes to the Consolidated Financial Statements (31 December 2009) (continued)
T H E S A U D I B R I T I S H B A N K
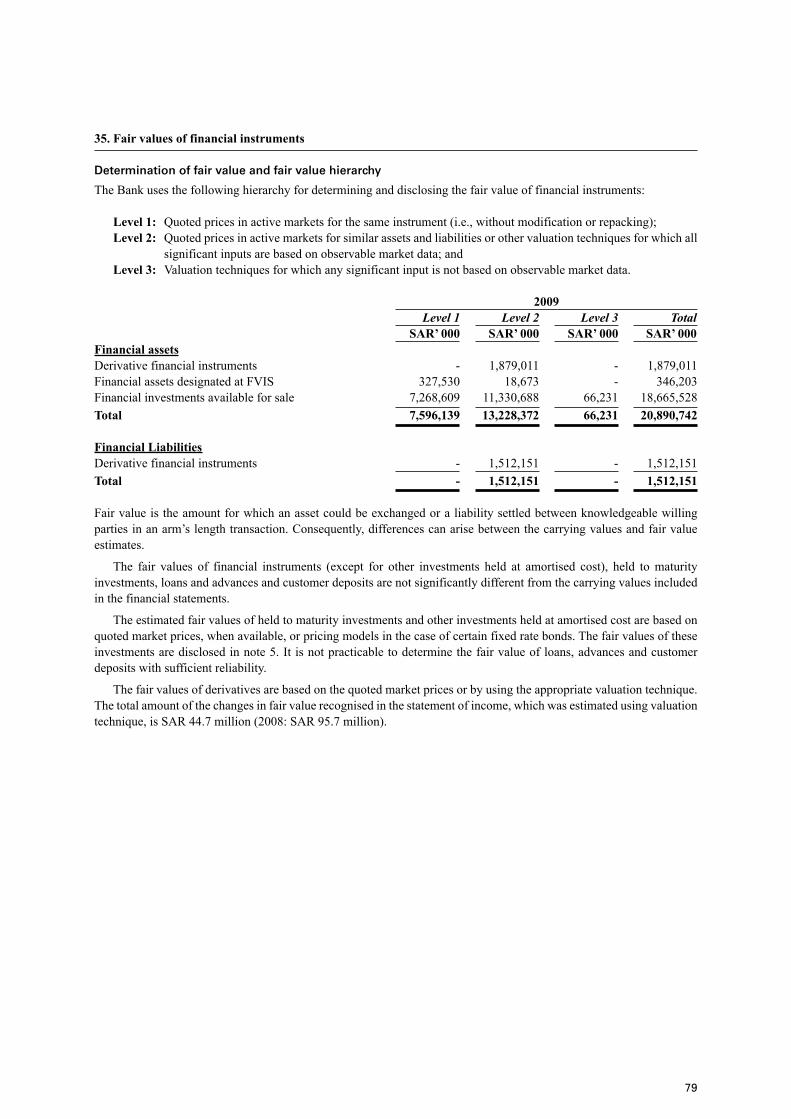
79
35. Fair values of financial instruments
Determination of fair value and fair value hierarchy
The Bank uses the following hierarchy for determining and disclosing the fair value of financial instruments:
Level 1: Quoted prices in active markets for the same instrument (i.e., without modification or repacking); Level 2: Quoted prices in active markets for similar assets and liabilities or other valuation techniques for which all significant inputs are based on observable market data; and Level 3: Valuation techniques for which any significant input is not based on observable market data.
2009 Level1 Level2 Level3 Total SAR’ 000 SAR’ 000 SAR’ 000 SAR’ 000Financial assetsDerivative financial instruments - 1,879,011 - 1,879,011Financial assets designated at FVIS 327,530 18,673 - 346,203Financial investments available for sale 7,268,609 11,330,688 66,231 18,665,528Total 7,596,139 13,228,372 66,231 20,890,742
Financial LiabilitiesDerivative financial instruments - 1,512,151 - 1,512,151Total - 1,512,151 - 1,512,151
Fair value is the amount for which an asset could be exchanged or a liability settled between knowledgeable willing parties in an arm’s length transaction. Consequently, differences can arise between the carrying values and fair value estimates.
The fair values of financial instruments (except for other investments held at amortised cost), held to maturity investments, loans and advances and customer deposits are not significantly different from the carrying values included in the financial statements.
The estimated fair values of held to maturity investments and other investments held at amortised cost are based on quoted market prices, when available, or pricing models in the case of certain fixed rate bonds. The fair values of these investments are disclosed in note 5. It is not practicable to determine the fair value of loans, advances and customer deposits with sufficient reliability.
The fair values of derivatives are based on the quoted market prices or by using the appropriate valuation technique. The total amount of the changes in fair value recognised in the statement of income, which was estimated using valuation technique, is SAR 44.7 million (2008: SAR 95.7 million).
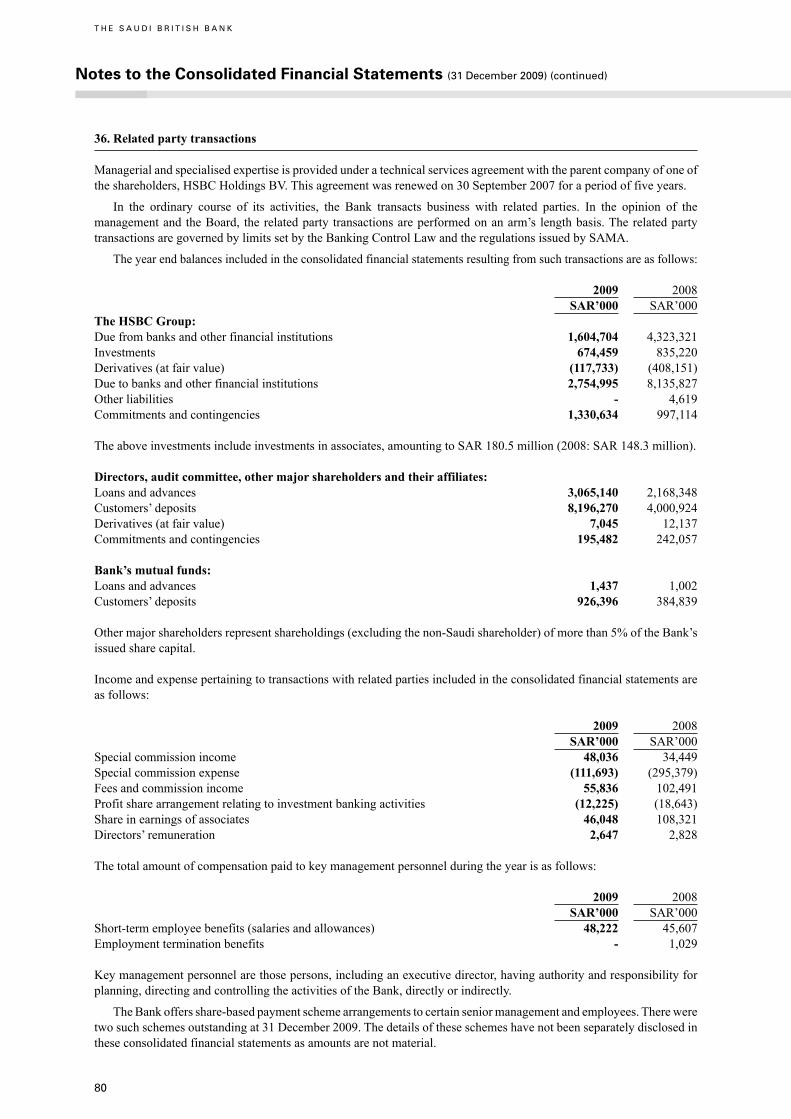
80
36. Related party transactions
Managerial and specialised expertise is provided under a technical services agreement with the parent company of one of the shareholders, HSBC Holdings BV. This agreement was renewed on 30 September 2007 for a period of five years.
In the ordinary course of its activities, the Bank transacts business with related parties. In the opinion of the management and the Board, the related party transactions are performed on an arm’s length basis. The related party transactions are governed by limits set by the Banking Control Law and the regulations issued by SAMA.
The year end balances included in the consolidated financial statements resulting from such transactions are as follows:
2009 2008 SAR’000 SAR’000The HSBC Group:Due from banks and other financial institutions 1,604,704 4,323,321Investments 674,459 835,220Derivatives (at fair value) (117,733) (408,151)Due to banks and other financial institutions 2,754,995 8,135,827Other liabilities - 4,619Commitments and contingencies 1,330,634 997,114
The above investments include investments in associates, amounting to SAR 180.5 million (2008: SAR 148.3 million).
Directors, audit committee, other major shareholders and their affiliates:Loans and advances 3,065,140 2,168,348Customers’ deposits 8,196,270 4,000,924Derivatives (at fair value) 7,045 12,137Commitments and contingencies 195,482 242,057
Bank’s mutual funds:Loans and advances 1,437 1,002Customers’ deposits 926,396 384,839
Other major shareholders represent shareholdings (excluding the non-Saudi shareholder) of more than 5% of the Bank’s issued share capital.
Income and expense pertaining to transactions with related parties included in the consolidated financial statements are as follows:
2009 2008 SAR’000 SAR’000Special commission income 48,036 34,449Special commission expense (111,693) (295,379)Fees and commission income 55,836 102,491Profit share arrangement relating to investment banking activities (12,225) (18,643)Share in earnings of associates 46,048 108,321Directors’ remuneration 2,647 2,828
The total amount of compensation paid to key management personnel during the year is as follows:
2009 2008 SAR’000 SAR’000Short-term employee benefits (salaries and allowances) 48,222 45,607Employment termination benefits - 1,029
Key management personnel are those persons, including an executive director, having authority and responsibility for planning, directing and controlling the activities of the Bank, directly or indirectly.
The Bank offers share-based payment scheme arrangements to certain senior management and employees. There were two such schemes outstanding at 31 December 2009. The details of these schemes have not been separately disclosed in these consolidated financial statements as amounts are not material.
Notes to the Consolidated Financial Statements (31 December 2009) (continued)
T H E S A U D I B R I T I S H B A N K
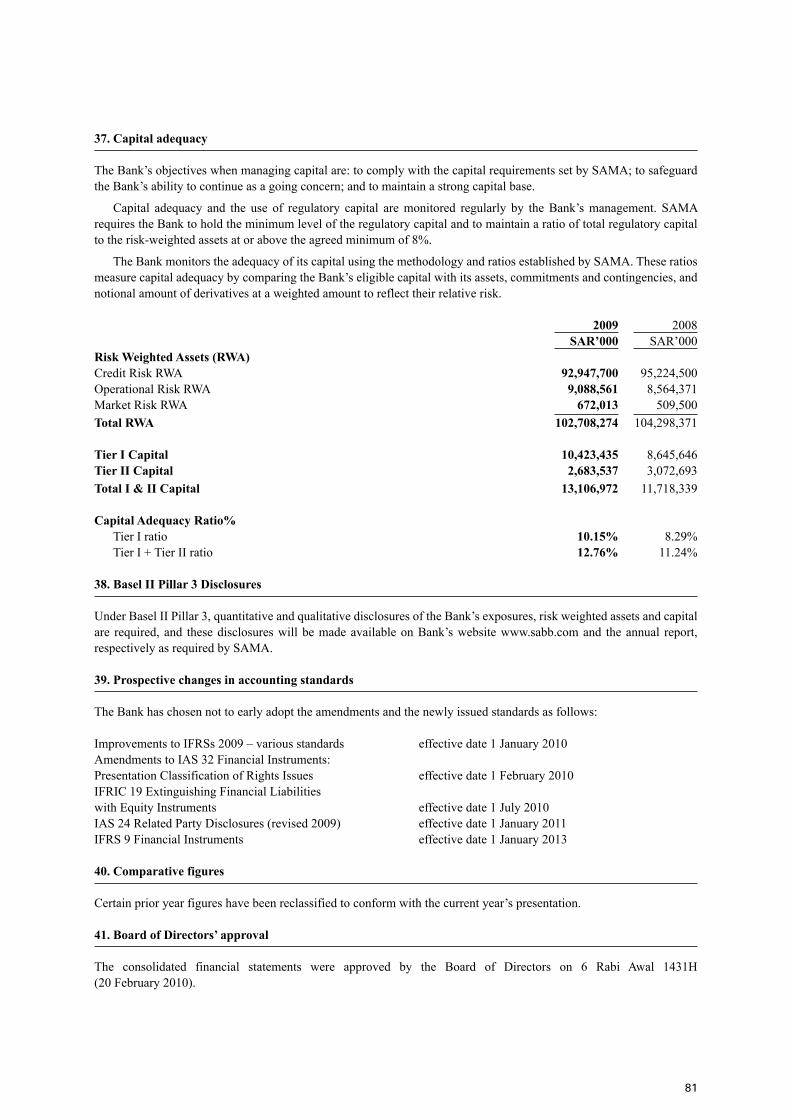
81
37. Capital adequacy
The Bank’s objectives when managing capital are: to comply with the capital requirements set by SAMA; to safeguard the Bank’s ability to continue as a going concern; and to maintain a strong capital base.
Capital adequacy and the use of regulatory capital are monitored regularly by the Bank’s management. SAMA requires the Bank to hold the minimum level of the regulatory capital and to maintain a ratio of total regulatory capital to the risk-weighted assets at or above the agreed minimum of 8%.
The Bank monitors the adequacy of its capital using the methodology and ratios established by SAMA. These ratios measure capital adequacy by comparing the Bank’s eligible capital with its assets, commitments and contingencies, and notional amount of derivatives at a weighted amount to reflect their relative risk.
2009 2008 SAR’000 SAR’000Risk Weighted Assets (RWA) Credit Risk RWA 92,947,700 95,224,500Operational Risk RWA 9,088,561 8,564,371Market Risk RWA 672,013 509,500Total RWA 102,708,274 104,298,371
Tier I Capital 10,423,435 8,645,646Tier II Capital 2,683,537 3,072,693Total I & II Capital 13,106,972 11,718,339 Capital Adequacy Ratio% Tier I ratio 10.15% 8.29% Tier I + Tier II ratio 12.76% 11.24%
38. Basel II Pillar 3 Disclosures
Under Basel II Pillar 3, quantitative and qualitative disclosures of the Bank’s exposures, risk weighted assets and capital are required, and these disclosures will be made available on Bank’s website www.sabb.com and the annual report, respectively as required by SAMA.
39. Prospective changes in accounting standards
The Bank has chosen not to early adopt the amendments and the newly issued standards as follows:
Improvements to IFRSs 2009 – various standards effective date 1 January 2010Amendments to IAS 32 Financial Instruments:Presentation Classification of Rights Issues effective date 1 February 2010 IFRIC 19 Extinguishing Financial Liabilitieswith Equity Instruments effective date 1 July 2010IAS 24 Related Party Disclosures (revised 2009) effective date 1 January 2011IFRS 9 Financial Instruments effective date 1 January 2013
40. Comparative figures
Certain prior year figures have been reclassified to conform with the current year’s presentation.
41. Board of Directors’ approval
The consolidated financial statements were approved by the Board of Directors on 6 Rabi Awal 1431H (20 February 2010).

82
83
The Saudi British BankBasel II - Pillar 3
Annual Disclosures
84
Basel II – Pillar 3 Annual Disclosures (31 December 2009)
T H E S A U D I B R I T I S H B A N K
Cautionary statement regarding forward-looking statements
These Capital and Risk Management Pillar 3 Disclosures as at 31 December 2009 contain certain forward-looking statements with respect to the financial condition, results of operations and business of SABB. These forward-looking statements represent SABB expectations or beliefs concerning future events and involve known and unknown risks and uncertainty that could cause actual results, performance or events to differ materially from those expressed or implied in such statements.
Forward-looking statements involve inherent risks and uncertainties. Readers are cautioned that a number of factors could cause actual results to differ, in some instances materially, from those anticipated or implied in any forward-looking statement. Forward-looking statements speak only as of the date they are made, and it should not be assumed that they have been reviewed or updated in the light of new information or future events.
1. Scope of Application
a) Scope
These qualitative disclosures set out SABB’s approach to capital assessment and complement the minimum capital requirements and the supervisory review process.
b) Basis of consolidation
The basis of consolidation for accounting purposes is described on page 8 of the Annual Report and Accounts 2009.
The basis of consolidation for regulatory purposes differs from that used for the financial consolidation in that holdings in insurance and financial entities are excluded if they qualify as significant minority investments i.e exceed 20% up to 50% of the investee company’s paid-up capital.
SABB uses regulatory capital as the basis for assessing its capital adequacy. Risk weighted assets driving regulatory capital requirements are forecast and monitored at customer group level or at a lower sub-unit level, as appropriate.
Entitiesthatarefullyconsolidated:
SABB Securities Limited is a wholly owned subsidiary of SABB and its financial statements are consolidated with SABB. The Bank has 98% direct and 2% indirect ownership interest in its subsidiary.
SignificantMinorityagency:
Following Significant Minority investments are deducted from the capital:n The Bank owns 40% of the equity shares of HSBC Saudi Arabia Limited, which is involved in Investment Banking services in the Kingdom of Saudi Arabian The Bank owns 32.5% of the equity shares of SABB Takaful. It carries out Shariah-compliant insurance activities and offers Family and General Takaful products
Equityinvestmentswhichareriskweighted
Equity investments are risk weighted at 100% where percentage of shareholding is less than 20%.
c) Capital transferability between legal entities
Restrictions by Memorandum and Articles of Association
Through Article 10 of Memorandum & Articles of Association SABB has restricted the transfer of shares held by Saudi nationals to non-Saudi nationals and has empowered its Board of Directors the right to either approve or refuse the transfer of shares.
Apart from the above, no other restrictions have been imposed by the management on transfer of shares.
Statutory restriction
SABB is required to transfer at least 25% of its net profit to a statutory reserve before declaration of dividend until the amount of statutory reserves is equal to the paid-up capital of the Bank.

85
1. Scope of Application (continued)
Regulatory restriction
SAMA has imposed a restriction of at least 8% of capital adequacy ratio which is in line with Basel II requirements.
The significant minority investments namely HSBC Saudi Arabia Limited and SABB Takaful’s Articles of Association restrict the reduction in paid-up capital below the current levels.
2. Capital Structure
The authorised, issued and fully paid share capital of the Bank consists of 750 million shares of SAR 10 each (2008: 600 million shares of SAR 10 each). The ownership of the Bank’s share capital is as follows:
2009 2008Saudi shareholders 60% 60%HSBC Holdings BV 40% 40%(a wholly owned subsidiary of HSBC Holdings plc)
The composition of shareholders’ equity is available in the annual financial statements.
There are four different ‘types’ of capital which SABB must manage. The distinctions between the different notions / definitions of capital, and the capital management principles which arise, are outlined below:
Category Definition/meaning/significance Implications for SABB capital management
Regulatory Capital Proxy for Risk Capital, particularly Requirements must be met on a SAMA regulatory under Basel II rules basis at all timesAccounting Capital The capital recognised by Requirements must be met to achieve audited accounting standards accountsInvested Capital The equity capital invested in SABB SABB must earn a return on its invested capital(Legal Capital) by its shareholders for which which is in excess of its cost of capital SABB is accountableEconomic Capital Capital actually held by SABB to Allocated to businesses in proportion to risks run, bear risk, support growth etc. and and acts as basis to set economic profit targets upon which an ‘economic’ return and inform e.g. pricing decisions is required
Along with these capital measures, SABB wishes to effectively manage its capital in order to support and improve its own external rating as calculated by risk rating agencies.
3. Capital Adequacy
SABB’s approach in assessing adequacy of its capital to support current and future activities envisages around the following principles:n It has a process for assessing its overall capital adequacy in relation to its risk profile and a strategy for maintaining capital levelsn A review of SABB’s ICAAP and capital strategies are undertaken by its management, as well as monitoring and ensuring compliance to SAMA regulations, with appropriate actions being taken when requiredn It is operating above the minimum regulatory capital ratios, with the ability to hold capital in excess of the minimumn The ability to intervene at an early stage to prevent capital from falling below the minimum levels as required according to its risk profile

86
Basel II – Pillar 3 Annual Disclosures (31 December 2009) (continued)
T H E S A U D I B R I T I S H B A N K
3. Capital Adequacy (continued)
SABB Capital Adequacy Ratio in the last 5 years has been as follows:
2005-2007: Capital Adequacy Ratios are on Basel I basis2008-2009: Capital Adequacy Ratios are on Basel II basis
Risk Exposure and Assessment – General Qualitative Disclosure Requirements
CreditRisk
Credit risk is the risk of financial loss through the failure of a customer or counterparty to honour their commitments as they fall due. Credit risk arises principally in corporate and personal lending, trade finance, treasury and syndication underwriting. But credit risk also arises from off balance sheet products such as guarantees and derivatives or from SABB’s holdings of debt securities.
A culture of prudent and responsible lending is supported by a strong risk policy and control framework which is managed by an independent credit function who both partner and challenge business proposals in line with the Board approved risk appetite levels.
SABB’s credit culture is dedicated to achieving sustainable profitability through maintaining high-quality risk assets. This is attained through effective control and management of risk, seeking to minimise credit losses while enhancing risk-adjusted returns, thus contributing to the overall success of the Bank.
A strong risk governance framework has been established under the oversight of the Board designated committee the Risk Management Meeting. A number of sub-committees have been established to focus on retail and corporate credit risk, Treasury market risk, operational risk, security and fraud risk, reputational risk, capital planning, and stress testing.
Credit risk management functions have an appropriate degree of independence and responsibility for key aspects of rating systems including selection, implementation, performance and oversight. Approval processes observe high standards of governance, efficiency and facilitate timely decision-making through the use of delegated approval limits.
Credit discipline encompasses an attitude towards risk and risk management instilled in credit officers through experience and training as evidenced for example in: n Being proactive rather than reactive; n Knowing the customer; n Recognising strengths, weaknesses and competitive advantages; n Understanding and employing constructively all appropriate techniques for the measurement and management of risk
Automated systems are a prerequisite for efficient credit application processes, for the proper recording, control and reporting of risk limits and exposures and for the calculation of internal risk scores and ratings as well as regulatory and economic capital.
Capital Adequacy Ratio
19%
18%
17%
16%
15%
14%
13%
12%
11%
10%
2005 2006 2007 2008 2009
87
3. Capital Adequacy (continued)
SABB’s association to the HSBC Group promotes the use of standard systems and methodologies for these purposes and employs common measurements of risk throughout the organisation. At SABB, consumer lending decisions are based on credit risk score models developed using internal data and embedded into an automated decision process. Corporate customers are evaluated using internal rating models which apply a 22-point rating scale and which are complemented by expert judgment from the credit approval teams.
In the event of customers facing difficulties with repayment, SABB operates dedicated collection and recoveries teams to manage non-performing loans and maximise recovery rates.
In order to support and evaluate credit decisions, SABB maintains an analytics capability to develop policy and systems, generate performance and management information and undertake stress testing and scenario analysis across SABB’s various risk asset portfolios. The outcomes of any analysis are subject to a thorough management challenge to ensure any changes are fit for purpose.
Credit risk consumes the largest proportion of SABB’s minimum capital requirement. Within the established principles and parameters, SABB ensures that strict capital discipline is maintained through correct pricing and management of credit risks in relation to the regulatory and economic capital requirements.
Information on counterparty credit risk is provided in the table 8 commentary below.
MarketRisk
Market risk is the risk that movements in market risk factors, including foreign exchange rates, commodity prices, interest rates, credit spreads and equity prices will reduce SABB’s income or the value of its portfolios.
Further information on market risk is provided in the table 10 commentary below.
OperationalRisk
Operational risk is the risk of loss arising through fraud, unauthorised activities, error, omission, inefficiency, system failure or from external events. These risks are inherent in every business and cover a wide range of issues including process failures, systems failures and human error.
Further information on operational risk capital is provided in the table 12 commentary below.
InvestmentRisk
Investment risk is the risk of an adverse impact on P&L and capital due to an unexpected loss in value of the investment position held by SABB on a long-term (non-trading) basis. This can arise out of SABB’s investment, private equity or equity investment portfolios.
As a general policy SABB seeks to focus investments around establishing a diversified portfolio of high-quality and highly liquid securities. Less liquid or structured investments account for less than 2% of the portfolio.
SABB will continue to review its investment policy in line with market developments and opportunities as they arise. The risk mandate will however always maintain a focus on high-quality, liquid investments with a preference for domestically issued debt and securities.
Whilst SABB does hold a nominal position in private equity investments it does not hold any direct equity investments. Further information on equities risk is provided in the table 13 commentary below.
Interest Rate Risk
Interest rate risk in the banking book is defined as the exposure of the non-trading products of the Bank to interest rates. Interest rate risk arises principally from mismatches between the future yield on assets and their funding costs, as a result of changes in interest rates.
Further information on interest risk is provided in the table 14 commentary below.
88
Basel II – Pillar 3 Annual Disclosures (31 December 2009) (continued)
T H E S A U D I B R I T I S H B A N K
3. Capital Adequacy (continued)
Foreign Exchange Risk
Currency or foreign exchange risk (FX) arises from an open position, either overbought (long) or oversold (short), in a foreign currency, creating exposure to a change in the relevant exchange rate.
SABB categorises foreign exchange risk as follows:
TradingBookFXrisk
Arises from proprietary currency trading i.e. spot, forwards, futures, swaps and options. Trading exposures are controlled through assigning limits to each currency and aggregate exposure levels as well as through VAR and stress testing measures.
BankingBookFXrisk
Arises from a currency mismatch / revaluation between assets and liabilities, including accrued interest and accrued expenses. The mismatch is transferred to Treasury and managed on daily basis through the trading book.
StructuralFXrisk
Arises for one of two reasons: a) relating to net investments in subsidiaries, branches or associated capital undertakings; b) Relating to the non-SAR denominated assets. The currencies where structural FX rise arises are those other than the designated reporting currency of the SABB, which is the Saudi Riyal (SAR).
Liquidity Risk
Liquidity risk is the risk that SABB does not have sufficient financial resources to meet its obligations when they fall due, or will have to do so at excessive cost. This risk can arise from mismatches in the timing of cash flows. Funding risk (a particular form of liquidity risk) arises when the necessary liquidity to fund illiquid asset positions cannot be obtained at the expected terms and when required.
As a general policy SABB seeks to be self-sufficient with regards to funding its own operations through the use of a range of diverse funding sources.
The approach taken by SABB to managing liquidity risk has been aligned with the 17 principles issued by the BIS in their note titled ‘Principles for Sound Liquidity Risk Management and Supervision’ issued in September 2008.
SABB assesses and manages liquidity risk through clearly defined liquidity policies which form part of a boarder Liquidity and Funding framework and funding plan which is reviewed and approved by The Assets and Liabilities Committee (ALCO) and The Executive Committee of the Board (EXCOM). There is a designated Liquidity Management Committee, which monitors the Bank’s current and projected liquidity position and proposes changes to ALCO on SABB’s liquidity ratio limits, funding strategy and liquidity stress testing scenarios.
SABB manages and reports balance sheet liquidity against a range of internal and regulatory ratios which cover the proportion of net liquid assets to customer liabilities, the adequacy of assets to deposits, the proportion of customer deposits held in liquid assets and that Amanah liabilities are only invested in Amanah assets and any excess needs to be invested in Shariah-compliant assets.
The Financial Control Department prepares a Bank-wide liquidity report, which is monitored daily against approved limits and regulatory requirements by Senior Management, along with a 1-year rolling forecast balance sheet on a quarterly basis showing expected loan and deposit growth including major currency breakdowns.
SABB seeks to maintain a cushion of unencumbered, high-quality, liquid assets that can be liquidated or repoed in times of stressed liquidity. The asset tolerance limit is defined and monitored by ALCO on a monthly basis.
Operational Cashflow Projections are used to stress the liquidity position across a range of maturity bands and through the application of bank specific and market-wide scenarios.
Current accounts and savings deposits payable on demand or at short notice form a significant part of SABB’s funding and there is considerable focus on maintaining the stability of such deposits. SABB manages and monitors depositor and debt security concentration in order to avoid undue reliance on large individual depositors and ensuring a satisfactory overall funding mix and maturity profile of deposit and debt securities.
A comprehensive Liquidity Contingency Plan is in place and tested on an annual basis. The plan identifies early indicators of stress conditions and describes actions to be taken in the event of difficulties arising from systemic or other crises.
SABB has continued to expand its investor relations programme to ensure that it keeps investors advised of developments and kept itself aware of their changing requirements in readiness for any potential debt or equity issuances.
89
3. Capital Adequacy (continued)
Concentration Risk
Concentration in credit portfolios has been a cause for bank and banking system distress in the past. As a result, concentration risk forms an integral part of SABB’s supervisory review and internal risk assessment process. There can also be benefits where a bank’s portfolio can evidence diversification across asset classes, customer groups, industry sectors, business lines and geographic locations.
Concentration risk can manifest itself in three main forms where there is an imperfect diversification of credit risk: n Single name concentration (Idiosyncratic risk)n Sector concentration (Systematic risk)n Contagion (Systemic failure)
It is the Bank’s policy to avoid undesired concentration of exposure in any single dimension of the entire credit portfolio (asset class, industry sector, geography, etc.). We aim to ensure that the Bank’s exposure is well diversified across a broad mix of business sectors. SABB has established exposure policies and lending risk tolerance limits for individual counterparties, industry sectors, country cross border risk, specific products or advance purposes and portfolio level controls.
SABB retains capital against the granularity of its lending portfolio and reviews the level of concentration within portfolios on a monthly basis through the senior risk management meeting (RMM) and Excom.
Reputational Risk
Reputational risk is the potential negative but unquantifiable current and future impact on profits and capital, which might arise from a changed and adverse perception of SABB’s reputation among its various stakeholders in the various facets of its operations.
The safeguarding of SABB’s reputation is of paramount importance and critical to its success. SABB’s policies and procedures are regularly reviewed to ensure reputational factors covering environmental, social and governance risks are continually updated in light of relevant developments. All new products are reviewed by the reputational risk committee, which reviews key activities that give rise to material reputational risk sensitivities.
Actions by employees can have an impact on the reputation of the Bank and they are provided with awareness sessions to educate people on reputational risk and their personal responsibilities in upholding and enhancing the image and brand of SABB.
The range of stakeholders whose perception of SABB may give rise to a reputational impact include investors, customers, suppliers, employees, regulators, politicians, the media, non-governmental organisations, and the communities and societies in which SABB operates. The facets of SABB’s activities that may influence a changed and adverse perception of its reputation include product quality and cost, corporate governance, employee relations, customer service, intellectual capital, financial performance, compliance or regulatory breaches, involvement in the financing of terrorist or major money laundering incidents, and the handling of environmental and social issues.
Sustainability risk sensitivities are also of high importance in managing reputational risk and SABB seeks to uphold the highest sustainability risk standards, including the equator principles for project finance lending, sector based sustainability guidelines covering sectors with high environmental, ethical or social impacts.
The unique structure of Islamic financial products (Shariah compliant products) is quite distinct and places increased requirements on the Bank to ensure that not only do they meet customer suitability standard but that the internal Shariah compliance process if robust. The impact of Shariah-compliance failures would impact SABB’s reputation and as a result SABB operates a dedicated Amanah banking team who control Islamic product develop and monitor ongoing compliance with Shariah requirements.
Macroeconomic and Business Cycle Risk
SABB assesses and manages macroeconomic and business cycle risk through clearly defined policies and procedures. Macroeconomic and business cycle risks are seen as the potential negative impacts on profits and capital as a result of SABB not meeting its goals and objectives caused by unforeseen changes in the business and regulatory environment, exposure to economic cycles and technological changes.
90
Basel II – Pillar 3 Annual Disclosures (31 December 2009) (continued)
T H E S A U D I B R I T I S H B A N K
3. Capital Adequacy (continued)
As an intrinsic part of the process, SABB’s Risk Management Meeting (RMM) regularly monitors local key macroeconomic indicators, such as: n Price of oil per barrel in the world market n Any significant reduction in public finances expenditure n The TASI index n Decline in rental yields n Annual real GDP growth n Inflation rate n Currency uncertainty that may be caused by USD weakness and real appreciation of the SAR
Strategic Risk
Strategic risk is the risk that the business will fail to identify and react appropriately to opportunities and/or threats arising from changes in the market, some of which may emerge over a number of years such as changing economic and political circumstances, customer requirements, demographic trends, regulatory developments or competitor action. Risk may be mitigated by consideration of the potential opportunities and challenges through the strategic planning process.
Strategic and Operating Plans are established against clearly defined guidelines and via a rigorous process that considers the wider business, regulatory and economic environment when preparing the plans. Plans are monitored on an ongoing basis to ensure that targets are being achieved and to proactively consider risks, which might arise to non-achievement of goals.
The strategic risks are monitored by the strategic planning function on a regular basis and variations, if any are reported to the Risk Management Meeting. Where necessary the Board holds strategic review meetings to refine the Bank’s strategy in light of market developments.
Compliance Risk
Compliance risk is the risk leading to statutory, legal sanctions, material financial loss, or damage to the reputation of SABB that may be suffered as a result of the failure to comply with all applicable laws, rules and regulations. The aim of compliance is to protect the reputation and credibility of SABB, protect the interest of shareholders and depositors, and safeguard the institution against legal consequences.
Compliance risk is managed by adhering to industry best practice and local regulator requirements for the management of compliance in banks. A dedicated compliance manual, responsibilities assigned to business compliance officers, periodic risk based compliance risk assessments and quarterly meetings are methods used to manage compliance risk. Annual Compliance Risk Assessments (CRA) are required by every business and business control heat maps monitor and report progress. In 2009 a Compliance Committee was formed based on the guidelines of the SAMA Compliance Manual issued during the year.
Wrong-Way Risk
Wrong-way risk occurs when there is an adverse correlation between the counterparty’s probability of default and the mark-to-market value of the underlying transaction. Wrong way risks arising from customer activity is managed under defined guidelines and limits on a regular basis. The following control infrastructure is in place and reported to senior management on monthly basis.n Business referral process where wrong-way risk transactions are passed for separate approval prior to execution n A wrong-way risk exposure report is tabled in the senior Risk Management Meetingn Total exposure at counterparty level is maintained under predefined credit approved limits
Other Risks
SABB continues identifying risks that will adversely impact on the present and future operations of the Bank. The process flows in an interactive fashion among the Bank’s Board of Directors, executive committee and senior managers. This aims to address issues in a proactive manner with respect to risk assessment and management and to ensure continued compliance with HSBC Group and consistent with local regulatory requirements. Economic and regulatory capital issues, if any, shall be promptly addressed through the policies and procedures in place.
91
4. Credit Risk: General Disclosures for All Banks
Past due loans:
A loan is considered past due if it is not repaid on the payment due date or maturity date.
Impaired loan:
IndividualImpairmentProvisions:
The Bank reviews its non-performing loans and advances at each reporting date to assess whether a specific provision for credit losses should be recorded in the consolidated statement of income. In particular, judgment by management is required in the estimation of the amount and timing of future cash flows when determining the level of provision required. Such estimates are based on assumptions about a number of factors and actual results may differ, resulting in future changes to the specific provision.
CollectiveImpairmentProvisions:
The Bank reviews its loan portfolios to assess an additional portfolio provision on each reporting date. In determining whether an impairment loss should be recorded, the Bank makes judgments as to whether there is any observable data indicating that there is a measurable decrease in the estimated future cash flows from a portfolio of loans. This evidence may include observable data indicating that there has been an adverse change in the payment status of borrowers in a group, or national or local economic conditions that correlate with defaults on assets in the group. Management uses estimates based on historical loss experience for assets with credit risk characteristics and objective evidence of impairment similar to those in the portfolio when estimating its cash flows. The methodology and assumptions used for estimating both the amount and the timing of future cash flows are reviewed regularly to reduce any differences between loss estimates and actual loss experience.
Credit Risk:
Standardised Approach
Overall, SABB currently calculates its models and assessments based on the Basel II Standardised Approach, in line with the approval granted by SAMA. Specifically, SABB is segmenting its asset portfolio and generating associated RWAs and capital support data in accordance with SAMA guidelines and uses the Standardised Approach to calculate the minimum capital requirements.
Advanced IRB Approach
SABB is developing its processes, in line with SAMA guidance notes, to enable it to move to the advanced approaches of Basel II for credit risk.
SABB has a set of independently validated corporate scorecards to calculate the PD for each exposure. Along with this, specific LGD & EAD engines are being developed to calculate the respective LGD & EAD for each client. The output from these engines, combined with additional appropriate data such as maturity, allow SABB to calculate RWA based on the IRB-A approach. It is important to note that each distinct portfolio has a dedicated PD scorecard to determine the appropriate credit risk rating. These scorecards are reviewed at least annually and approved by the RMM.
For retail portfolios SABB uses a wide range of application and behavioural models and has completed a risk segmentation process as well as having developed a full range of Basel II IRB-A compliant scorecards to calculate expected and unexpected losses for each retail portfolio. SABB is currently in the process of embedding these models into its capital generation system.
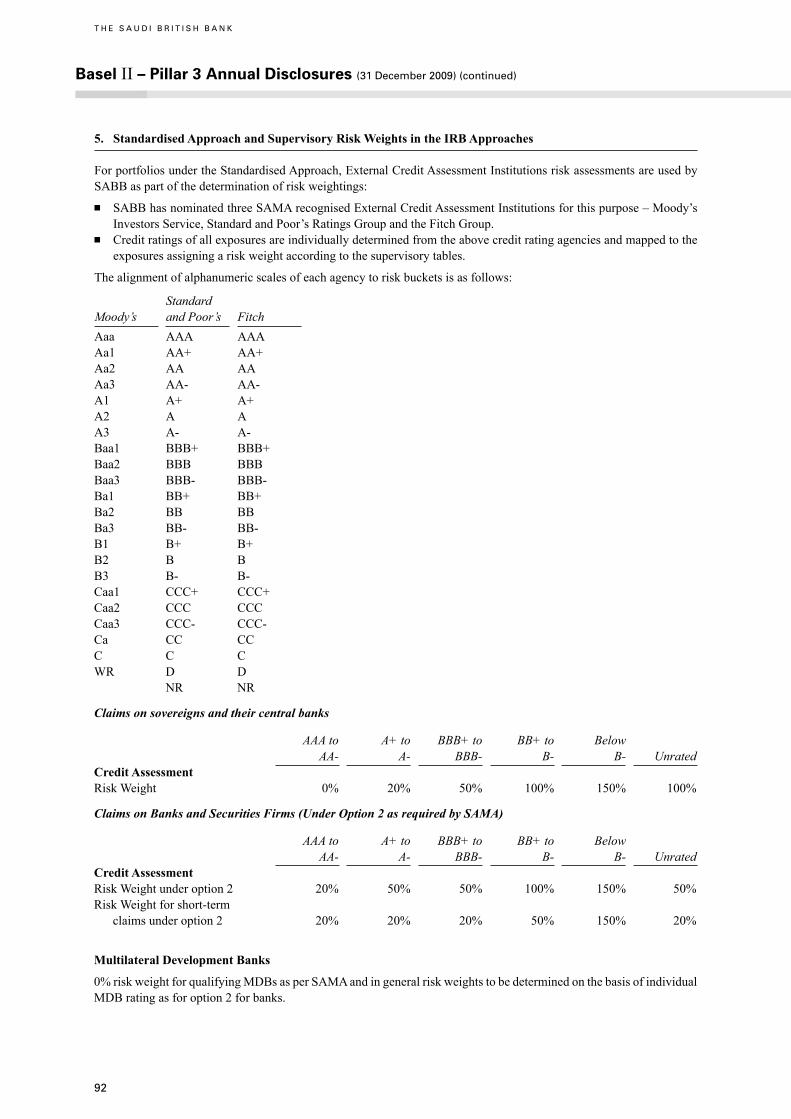
92
Basel II – Pillar 3 Annual Disclosures (31 December 2009) (continued)
T H E S A U D I B R I T I S H B A N K
5. Standardised Approach and Supervisory Risk Weights in the IRB Approaches
For portfolios under the Standardised Approach, External Credit Assessment Institutions risk assessments are used by SABB as part of the determination of risk weightings:n SABB has nominated three SAMA recognised External Credit Assessment Institutions for this purpose – Moody’s Investors Service, Standard and Poor’s Ratings Group and the Fitch Group. n Credit ratings of all exposures are individually determined from the above credit rating agencies and mapped to the exposures assigning a risk weight according to the supervisory tables.
The alignment of alphanumeric scales of each agency to risk buckets is as follows:
StandardMoody’s and Poor’s FitchAaa AAA AAAAa1 AA+ AA+Aa2 AA AAAa3 AA- AA-A1 A+ A+A2 A AA3 A- A-Baa1 BBB+ BBB+Baa2 BBB BBBBaa3 BBB- BBB-Ba1 BB+ BB+Ba2 BB BBBa3 BB- BB-B1 B+ B+B2 B BB3 B- B-Caa1 CCC+ CCC+Caa2 CCC CCCCaa3 CCC- CCC-Ca CC CCC C CWR D D NR NR
Claimsonsovereignsandtheircentralbanks
AAA to A+ to BBB+ to BB+ to Below AA- A- BBB- B- B- UnratedCredit AssessmentRisk Weight 0% 20% 50% 100% 150% 100%
ClaimsonBanksandSecuritiesFirms(UnderOption2asrequiredbySAMA)
AAA to A+ to BBB+ to BB+ to Below AA- A- BBB- B- B- UnratedCredit AssessmentRisk Weight under option 2 20% 50% 50% 100% 150% 50%Risk Weight for short-term claims under option 2 20% 20% 20% 50% 150% 20%
Multilateral Development Banks
0% risk weight for qualifying MDBs as per SAMA and in general risk weights to be determined on the basis of individual MDB rating as for option 2 for banks.

93
5. Standardised Approach and Supervisory Risk Weights in the IRB Approaches (continued)
Claims on public sector entities (PSEs)
As per Option 2
Claims on corporates
AAA to A+ to BBB+ to BB+ to AA- A- BBB- B- UnratedCredit AssessmentRisk Weight 20% 50% 100% 150% 100%
Claims included in the regulatory non-mortgage retail portfolios
A 75% risk weight to be assigned to such exposures
Claims secured by residential mortgages
A 100% retail risk weight to be applied to such claims.
Claims secured by commercial real estate
A 100% retail risk weight to be applied to such claims.
Past due loans
Risk Level of Weight% Provisioning150 Up to 20%100 20% to 50%100 50% and above
Other assets
The standard risk weight for all other assets will be 100% except gold to be treated equivalent to cash and risk weighted at 0%.
When calculating the risk weighted value of any exposure under the Standardised Approach, look up function is applied to the central database maintained in Excel and assigns to each individual exposures.
6. Credit Risk: Disclosures for Portfolios Subject to IRB Approaches
Not Applicable
7. Credit Risk Mitigation: Disclosures for Standardised and IRB Approaches
The mitigation of credit risk is an important aspect of its effective management and takes many forms.
SABB grants facilities based on the borrower’s ability to repay, rather than placing its reliance on credit risk mitigation. SABB nevertheless does hold a range of security to reduce the risk of loss and maximise the probability of facilities being repaid. A number of these risk mitigants have been applied under the Standardised Approach in Pillar I, and there are other securities that cannot be assigned a value such as shares, land and local property.
The main types of collateral taken by the Bank are as follows:
- Savings and Time deposits - Government Bonds- Listed Shares - Mutual Funds Units- Bank Guarantees - Corporate / Individual Guarantees- Title deeds of property - Assignment of salary or contract proceeds
International and local banks guarantees are referred to Institutional Banking for counterparty and cross border country risk approval.
The granting of facilities and taking of collateral as risk mitigants is governed by defined policies and procedures, as well as the use of bank standard documentation, that cater for the offset of credit balances against facilities granted, the control over the integrity and valuation of collateral, and the rights required to enforce and realise security. SABB monitors the concentration of risk mitigants and does not have any material concentrations in the risk mitigants currently held.

94
8. General Disclosure for Exposure Related to Counterparty Credit Risk
Counterparty credit risk is the risk that a counterparty to a transaction may default before completing the satisfactory settlement of the transaction.
The Bank calculates its counterparty credit risk for both trading and banking book exposures by assigning risk weights to exposure types:n Securities financing transactions (e.g reverse repos) - trading and banking bookn Over the counter (OTC) derivatives – trading and banking book
The capital requirement is determined on above exposures based on same methodology as credit risk and is reported separately for risk assessment.
9. Securitisation
Currently there are no securitisation deals involving SABB. There is a prescribed process in SABB for managing securitisation transactions. This risk assessment and reporting process will be observed when the need to apply the same arises.
10. Market Risk: Disclosure for Banks Using Standardised Approaches
Market risk is identified by businesses and transferred into SABB Treasury who has the necessary expertise to manage the positions using risk limits approved by the executive committee of the Board (EXCOM). Exposures are separated into trading (market-making, proprietary trading, and mark to market positions) and non-trading (interest rate management, and financial investments either held to maturity or available for sale) portfolios.
The monitoring and control of market risk is handled by an independent market risk team which is responsible for ensuring market risk exposures are measured in accordance with defined policies and reported daily against prescribed control limits.
SABB uses a range of control measures to manage market risk ranging from specific stop loss control limits to sensitivity analysis limits including the present value of a basis point movement of interest rates, as well as VAR loss limits designed to estimate the potential loss from market movements across a specified time horizon and for a given level of confidence using a historical simulation approach. SABB recognises the limitations of VAR and complements its analysis with scenario stress testing to evaluate the impact of more extreme but plausible events or movements in market variables.
Stress testing is performed at a portfolio level covering the impacts of movements in any single risk factor, technical scenarios looking at the largest observed movements, hypothetical scenarios looking at potential macro-economic events and historical scenarios which incorporate observed market movements from periods not captured in the VAR. These scenarios are governed by an oversight committee and the results are reported to senior management together with an assessment of the impact such events would have on SABB together with proposals for mitigating actions.
The risk of credit spread movements or specific issuer risk which arises from the change in value of a bond due to perceived changes in the credit quality of an issuer is managed through credit VAR and stress testing limits and tolerance levels.
Whilst SABB uses both VAR and standard rules to manage market risk, capital requirements are assessed for all positions using the standard rules approaches prescribed by SAMA.
11. Market Risk: Disclosure for Banks Using Internal Models Approach (Ima) for Trading Portfolios
Not Applicable
12. Operational Risk
SABB manages operational risk by tracking actual and near miss operational losses. Historical loss experiences have been seen in the areas of fraudulent activities, breakdown in processes due to misjudgment or human error and systems failures.
Whilst operational risk is the responsibility of individual employees and businesses, it is organised as an independent risk discipline within SABB. The operational risk function seeks to manage and control risk in a cost-efficient manner within agreed risk tolerance levels. A formal governance structure is in place to provide oversight over the management of risk within which designated business coordinators feed into a committee structure and ultimately to the Risk Management Meeting and Board.
Basel II – Pillar 3 Annual Disclosures (31 December 2009) (continued)
T H E S A U D I B R I T I S H B A N K
95
12. Operational Risk (continued)
Operational risk policies and procedures explain the requirements for identifying, assessing, monitoring reporting and controlling risk as well as providing guidance on the mitigation action to be taken when weaknesses are identified. Businesses are responsible for undertaking a self assessment, designing controls and reporting defined key risk indicators all of which are subject to an independent challenge and review process. Systems and centralised databases are in place to track and record actual as well as near miss loss events for collation, analysis and reporting to senior management.
Capital requirements are assessed using the Standardised Approach, which applies one of three fixed percentages to an average of the last three financial years gross revenues allocated across eight defined business lines.
13. Equities: Disclosures for Banking Book Positions
Equity Investments are either classified as “Available for sale” or as “Investments in Associate”.
Available for sale investments are those intended to be held for an unspecified period of time, which may be sold in response to needs for liquidity or changes in interest rates, exchange rates or equity prices.
Investments, which are classified as “available for sale”, are subsequently measured at fair value. For an available for sale investment where the fair value has not been hedged, any gain or loss arising from a change in its fair value is recognised directly in “other reserves” under shareholders’ equity. On derecognition, any cumulative gain or loss previously recognised in shareholders’ equity is included in the consolidated statement of income for the period.
Equity investments classified under available for sale investments whose fair value cannot be reliably measured are carried at cost.
Investment in associate is accounted for using the equity method in accordance with International Accounting Standard 28 – Investment in Associates. An associate is an entity in which the Bank has significant influence and which is neither a subsidiary nor a joint venture.
Under the equity method, investment in associate is carried in the balance sheet at cost plus post investment changes in the Bank’s share of net assets of the associate. The investments in associates are carried in balance sheet at the lower of equity accounted or recoverable amount.
The reporting dates of the associate and the Bank are identical and the associate’s accounting policies conform to those used by the Bank for like transactions and events in similar circumstances.
Unrealised profits and losses resulting from transactions between the Bank and its associate are eliminated to the extent of the Bank’s interest in the associate.
14. Interest Rate Risk in the Banking Book (IRRBB)
The analysis of interest rate risk is complicated by having to make assumptions on embedded optionality in products such as loan prepayments, and from behavioural assumptions regarding the economic duration of liabilities, which are contractually repayable on demand. Product reviews are undertaken annually to review and validate any behavioural assumptions.
In order to manage interest rate risk, the risk is transferred to Treasury by a series of internal deals between Treasury and the various business units. Treasury then evaluates the relative risk on the basis of applying Present Value Basis Point (PVBP) and VAR approaches and managing the resultant risk within approved limits assigned by Excom. Where practical, risk monitoring takes place on a daily basis.
Stress testing and sensitivity analysis is also carried out and results are reported to ALCO on a monthly basis.
SABB Treasury seeks to manage the impact of interest rate risk on net interest income in so far as such hedging is possible and cost effective to undertake.
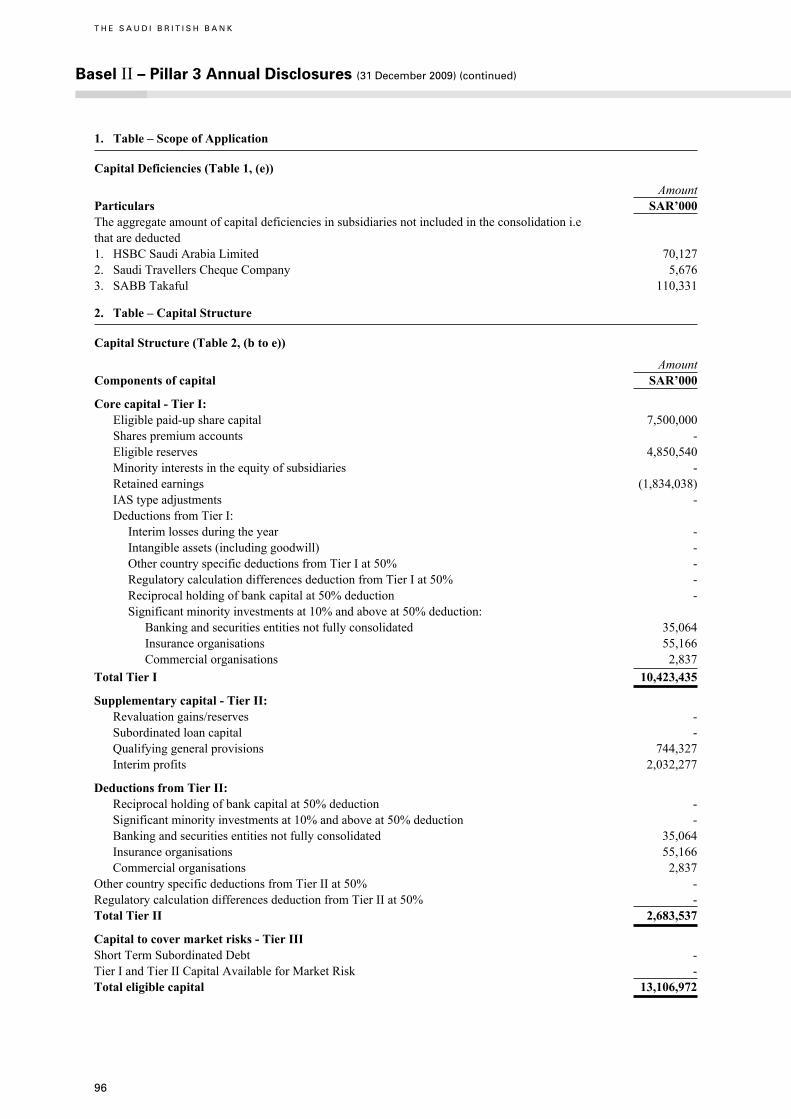
96
Basel II – Pillar 3 Annual Disclosures (31 December 2009) (continued)
T H E S A U D I B R I T I S H B A N K
1. Table – Scope of Application
Capital Deficiencies (Table 1, (e))
AmountParticulars SAR’000The aggregate amount of capital deficiencies in subsidiaries not included in the consolidation i.e that are deducted1. HSBC Saudi Arabia Limited 70,127 2. Saudi Travellers Cheque Company 5,6763. SABB Takaful 110,331
2. Table – Capital Structure
Capital Structure (Table 2, (b to e))
AmountComponents of capital SAR’000
Core capital - Tier I: Eligible paid-up share capital 7,500,000 Shares premium accounts - Eligible reserves 4,850,540 Minority interests in the equity of subsidiaries - Retained earnings (1,834,038) IAS type adjustments - Deductions from Tier I: Interim losses during the year - Intangible assets (including goodwill) - Other country specific deductions from Tier I at 50% - Regulatory calculation differences deduction from Tier I at 50% - Reciprocal holding of bank capital at 50% deduction - Significant minority investments at 10% and above at 50% deduction: Banking and securities entities not fully consolidated 35,064 Insurance organisations 55,166 Commercial organisations 2,837 Total Tier I 10,423,435
Supplementary capital - Tier II: Revaluation gains/reserves - Subordinated loan capital - Qualifying general provisions 744,327 Interim profits 2,032,277
Deductions from Tier II: Reciprocal holding of bank capital at 50% deduction - Significant minority investments at 10% and above at 50% deduction - Banking and securities entities not fully consolidated 35,064 Insurance organisations 55,166 Commercial organisations 2,837Other country specific deductions from Tier II at 50% -Regulatory calculation differences deduction from Tier II at 50% -Total Tier II 2,683,537
Capital to cover market risks - Tier IIIShort Term Subordinated Debt -Tier I and Tier II Capital Available for Market Risk -Total eligible capital 13,106,972
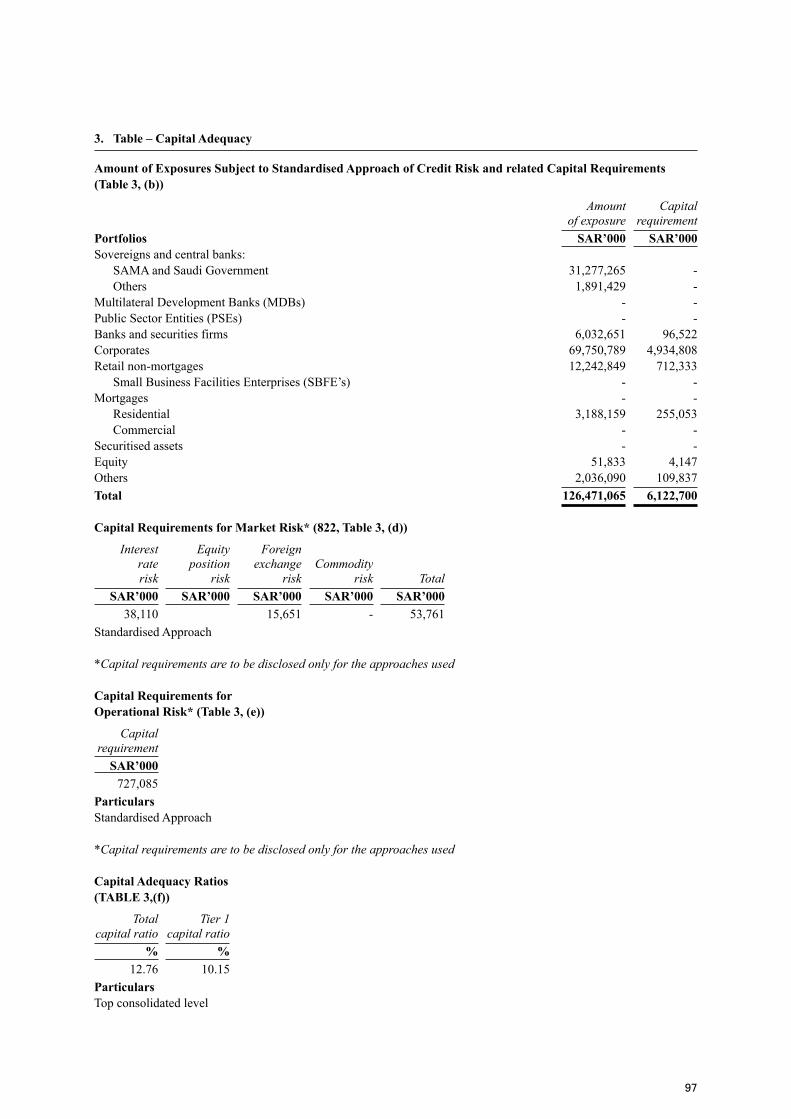
97
3. Table – Capital Adequacy
Amount of Exposures Subject to Standardised Approach of Credit Risk and related Capital Requirements (Table 3, (b))
Amount Capital of exposure requirementPortfolios SAR’000 SAR’000Sovereigns and central banks: SAMA and Saudi Government 31,277,265 - Others 1,891,429 - Multilateral Development Banks (MDBs) - - Public Sector Entities (PSEs) - - Banks and securities firms 6,032,651 96,522 Corporates 69,750,789 4,934,808 Retail non-mortgages 12,242,849 712,333 Small Business Facilities Enterprises (SBFE’s) - - Mortgages - - Residential 3,188,159 255,053 Commercial - - Securitised assets - - Equity 51,833 4,147 Others 2,036,090 109,837 Total 126,471,065 6,122,700
Capital Requirements for Market Risk* (822, Table 3, (d))
Interest Equity Foreign rate position exchange Commodity risk risk risk risk Total SAR’000 SAR’000 SAR’000 SAR’000 SAR’000 38,110 15,651 - 53,761Standardised Approach
*Capital requirements are to be disclosed only for the approaches used
Capital Requirements for Operational Risk* (Table 3, (e))
Capital requirement SAR’000 727,085ParticularsStandardised Approach
*Capital requirements are to be disclosed only for the approaches used
Capital Adequacy Ratios (TABLE 3,(f))
Total Tier 1 capital ratio capital ratio % % 12.76 10.15ParticularsTop consolidated level

98
4. Table (STA) – Credit Risk: General Disclosures
Credit Risk Exposure (Table 4, (b))
Average Total gross credit gross risk credit exposure risk over the exposure period*Portfolios SAR’000 SAR’000Sovereigns and central banks: SAMA and Saudi Government 31,304,265 - Others 1,891,429 -Multilateral Development Banks (MDBs) - -Public Sector Entities (PSEs) - -Banks and securities firms 10,616,035 -Corporates 84,515,510 -Retail non-mortgages 11,641,226 - Small Business Facilities Enterprises (SBFE’s) - -Mortgages - - Residential 3,188,159 - Commercial - -Securitised assets - -Equity 51,833 -Others 2,036,090 -Total 145,244,547 -
Basel II – Pillar 3 Annual Disclosures (31 December 2009) (continued)
T H E S A U D I B R I T I S H B A N K
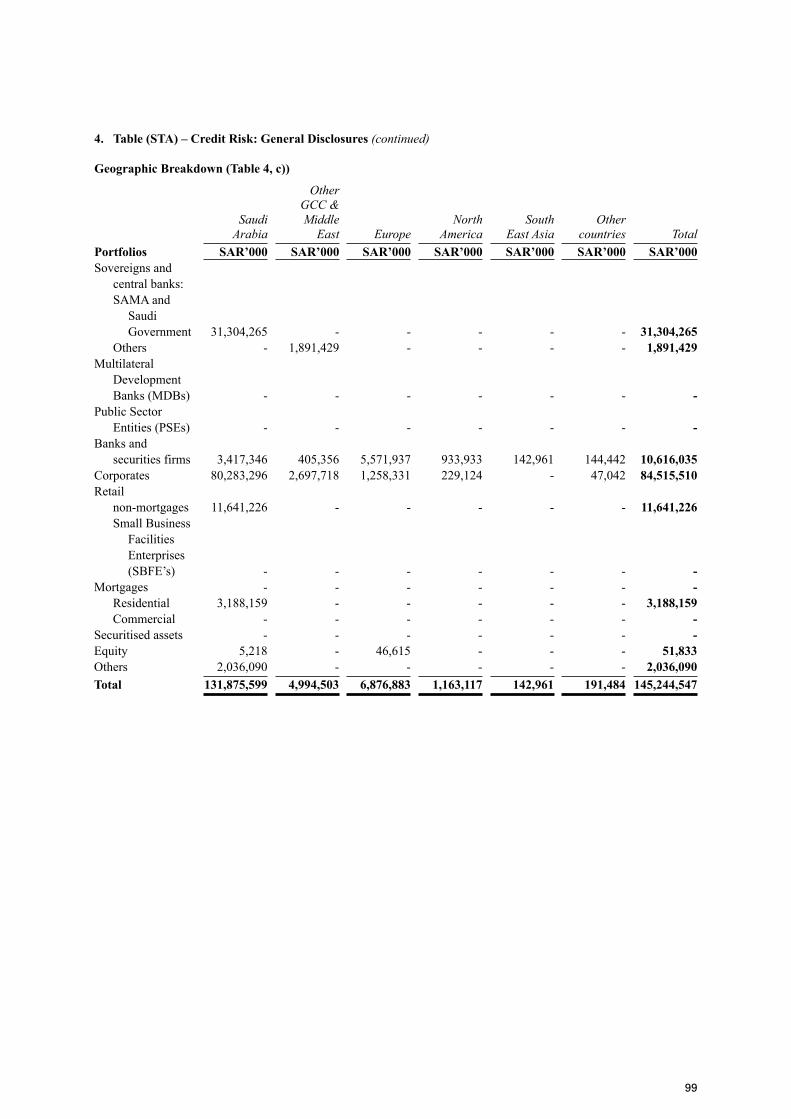
99
4. Table (STA) – Credit Risk: General Disclosures (continued)
Geographic Breakdown (Table 4, c))
Other GCC & Saudi Middle North South Other Arabia East Europe America East Asia countries TotalPortfolios SAR’000 SAR’000 SAR’000 SAR’000 SAR’000 SAR’000 SAR’000Sovereigns and central banks: SAMA and Saudi Government 31,304,265 - - - - - 31,304,265 Others - 1,891,429 - - - - 1,891,429 Multilateral Development Banks (MDBs) - - - - - - - Public Sector Entities (PSEs) - - - - - - - Banks and securities firms 3,417,346 405,356 5,571,937 933,933 142,961 144,442 10,616,035 Corporates 80,283,296 2,697,718 1,258,331 229,124 - 47,042 84,515,510 Retail non-mortgages 11,641,226 - - - - - 11,641,226 Small Business Facilities Enterprises (SBFE’s) - - - - - - -Mortgages - - - - - - - Residential 3,188,159 - - - - - 3,188,159 Commercial - - - - - - - Securitised assets - - - - - - - Equity 5,218 - 46,615 - - - 51,833Others 2,036,090 - - - - - 2,036,090 Total 131,875,599 4,994,503 6,876,883 1,163,117 142,961 191,484 145,244,547
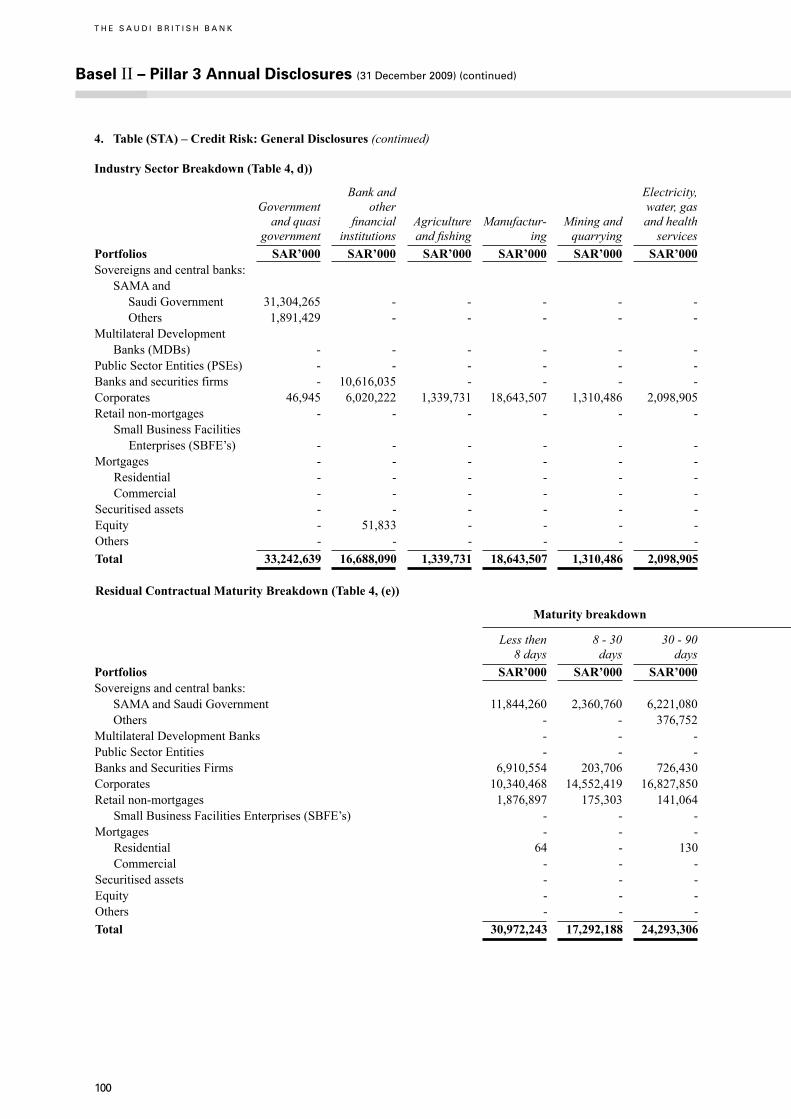
100
4. Table (STA) – Credit Risk: General Disclosures (continued)
Industry Sector Breakdown (Table 4, d))
Bank and Electricity, Transporta- Government other water, gas tion and Consumer and quasi financial Agriculture Manufactur- Mining and and health Building and communica- loan and government institutions and fishing ing quarrying services construction Commerce tion Services credit cards Others TotalPortfolios SAR’000 SAR’000 SAR’000 SAR’000 SAR’000 SAR’000 SAR’000 SAR’000 SAR’000 SAR’000 SAR’000 SAR’000 SAR’000Sovereigns and central banks: SAMA and Saudi Government 31,304,265 - - - - - - - - - - - 31,304,265 Others 1,891,429 - - - - - - - - - - - 1,891,429Multilateral Development Banks (MDBs) - - - - - - - - - - - - -Public Sector Entities (PSEs) - - - - - - - - - - - - -Banks and securities firms - 10,616,035 - - - - - - - - - - 10,616,035Corporates 46,945 6,020,222 1,339,731 18,643,507 1,310,486 2,098,905 12,475,570 23,195,538 6,519,478 1,236,216 - 11,628,912 84,515,510Retail non-mortgages - - - - - - - - - - 11,641,226 - 11,641,226 Small Business Facilities Enterprises (SBFE’s) - - - - - - - - - - - - -Mortgages - - - - - - - - - - - - - Residential - - - - - - - - - - 3,188,159 - 3,188,159 Commercial - - - - - - - - - - - - -Securitised assets - - - - - - - - - - - - -Equity - 51,833 - - - - - - - - - - 51,833Others - - - - - - - - - - - 2,036,090 2,036,090Total 33,242,639 16,688,090 1,339,731 18,643,507 1,310,486 2,098,905 12,475,570 23,195,538 6,519,478 1,236,216 14,829,385 13,665,002 145,244,547
Residual Contractual Maturity Breakdown (Table 4, (e))
Maturity breakdown Maturity breakdown Less then 8 - 30 30 - 90 90 - 180 180 - 360 1 - 3 3 - 5 Over 5 *No 8 days days days days days years years years Maturity TotalPortfolios SAR’000 SAR’000 SAR’000 SAR’000 SAR’000 SAR’000 SAR’000 SAR’000 SAR’000 SAR’000Sovereigns and central banks: SAMA and Saudi Government 11,844,260 2,360,760 6,221,080 1,871,442 1,037,307 1,696,522 985,858 5,287,036 - 31,304,265 Others - - 376,752 - - 110,127 1,174,618 229,932 - 1,891,429Multilateral Development Banks - - - - - - - - - -Public Sector Entities - - - - - - - - - -Banks and Securities Firms 6,910,554 203,706 726,430 266,277 571,331 1,615,241 163,524 158,972 - 10,616,035Corporates 10,340,468 14,552,419 16,827,850 9,642,231 7,476,060 16,370,092 7,570,299 1,736,091 - 84,515,510Retail non-mortgages 1,876,897 175,303 141,064 152,975 193,958 2,472,143 5,047,680 1,581,206 - 11,641,226 Small Business Facilities Enterprises (SBFE’s) - - - - - - - - - -Mortgages - - - - - - - - - - Residential 64 - 130 653 272 37,337 128,020 3,021,683 - 3,188,159 Commercial - - - - - - - - - -Securitised assets - - - - - - - - - -Equity - - - - - - - 51,833 - 51,833Others - - - - - - - - 2,036,090 2,036,090Total 30,972,243 17,292,188 24,293,306 11,933,578 9,278,928 22,301,462 15,069,999 12,066,753 2,036,090 145,244,547
Basel II – Pillar 3 Annual Disclosures (31 December 2009) (continued)
T H E S A U D I B R I T I S H B A N K
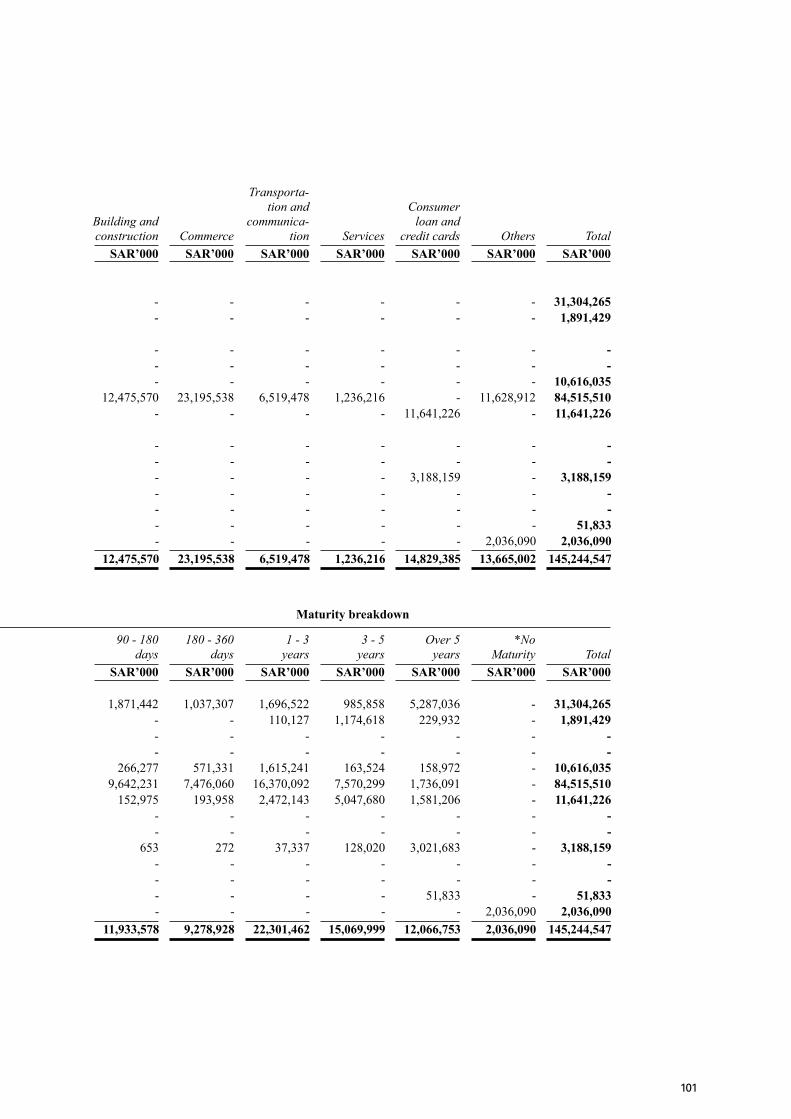
101
4. Table (STA) – Credit Risk: General Disclosures (continued)
Industry Sector Breakdown (Table 4, d))
Bank and Electricity, Transporta- Government other water, gas tion and Consumer and quasi financial Agriculture Manufactur- Mining and and health Building and communica- loan and government institutions and fishing ing quarrying services construction Commerce tion Services credit cards Others TotalPortfolios SAR’000 SAR’000 SAR’000 SAR’000 SAR’000 SAR’000 SAR’000 SAR’000 SAR’000 SAR’000 SAR’000 SAR’000 SAR’000Sovereigns and central banks: SAMA and Saudi Government 31,304,265 - - - - - - - - - - - 31,304,265 Others 1,891,429 - - - - - - - - - - - 1,891,429Multilateral Development Banks (MDBs) - - - - - - - - - - - - -Public Sector Entities (PSEs) - - - - - - - - - - - - -Banks and securities firms - 10,616,035 - - - - - - - - - - 10,616,035Corporates 46,945 6,020,222 1,339,731 18,643,507 1,310,486 2,098,905 12,475,570 23,195,538 6,519,478 1,236,216 - 11,628,912 84,515,510Retail non-mortgages - - - - - - - - - - 11,641,226 - 11,641,226 Small Business Facilities Enterprises (SBFE’s) - - - - - - - - - - - - -Mortgages - - - - - - - - - - - - - Residential - - - - - - - - - - 3,188,159 - 3,188,159 Commercial - - - - - - - - - - - - -Securitised assets - - - - - - - - - - - - -Equity - 51,833 - - - - - - - - - - 51,833Others - - - - - - - - - - - 2,036,090 2,036,090Total 33,242,639 16,688,090 1,339,731 18,643,507 1,310,486 2,098,905 12,475,570 23,195,538 6,519,478 1,236,216 14,829,385 13,665,002 145,244,547
Residual Contractual Maturity Breakdown (Table 4, (e))
Maturity breakdown Maturity breakdown Less then 8 - 30 30 - 90 90 - 180 180 - 360 1 - 3 3 - 5 Over 5 *No 8 days days days days days years years years Maturity TotalPortfolios SAR’000 SAR’000 SAR’000 SAR’000 SAR’000 SAR’000 SAR’000 SAR’000 SAR’000 SAR’000Sovereigns and central banks: SAMA and Saudi Government 11,844,260 2,360,760 6,221,080 1,871,442 1,037,307 1,696,522 985,858 5,287,036 - 31,304,265 Others - - 376,752 - - 110,127 1,174,618 229,932 - 1,891,429Multilateral Development Banks - - - - - - - - - -Public Sector Entities - - - - - - - - - -Banks and Securities Firms 6,910,554 203,706 726,430 266,277 571,331 1,615,241 163,524 158,972 - 10,616,035Corporates 10,340,468 14,552,419 16,827,850 9,642,231 7,476,060 16,370,092 7,570,299 1,736,091 - 84,515,510Retail non-mortgages 1,876,897 175,303 141,064 152,975 193,958 2,472,143 5,047,680 1,581,206 - 11,641,226 Small Business Facilities Enterprises (SBFE’s) - - - - - - - - - -Mortgages - - - - - - - - - - Residential 64 - 130 653 272 37,337 128,020 3,021,683 - 3,188,159 Commercial - - - - - - - - - -Securitised assets - - - - - - - - - -Equity - - - - - - - 51,833 - 51,833Others - - - - - - - - 2,036,090 2,036,090Total 30,972,243 17,292,188 24,293,306 11,933,578 9,278,928 22,301,462 15,069,999 12,066,753 2,036,090 145,244,547
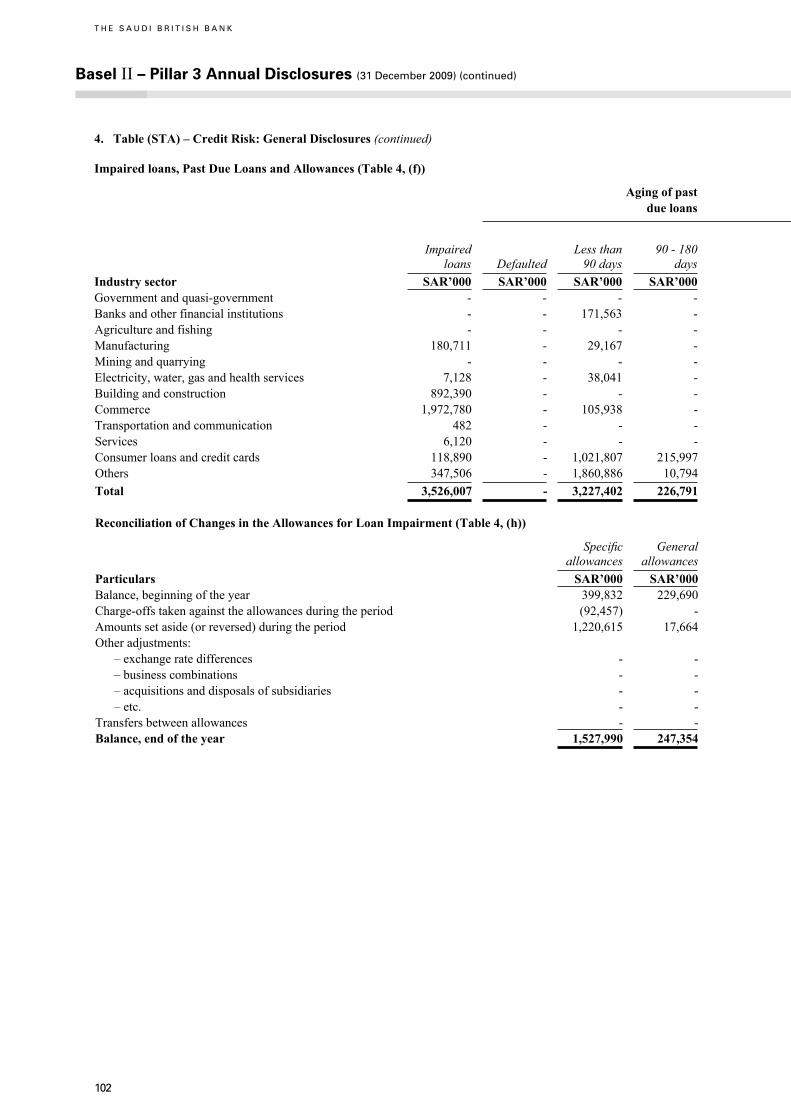
102
4. Table (STA) – Credit Risk: General Disclosures (continued)
Impaired loans, Past Due Loans and Allowances (Table 4, (f))
Aging of past Aging of past due loans due loans Specific allowances Balance at Charges Charge-offs Balance at Impaired Less than 90 - 180 180 - 360 Over 360 begining of during the during the the end of General loans Defaulted 90 days days days days the period period period the period allowancesIndustry sector SAR’000 SAR’000 SAR’000 SAR’000 SAR’000 SAR’000 SAR’000 SAR’000 SAR’000 SAR’000 SAR’000Government and quasi-government - - - - - - - - - - -Banks and other financial institutions - - 171,563 - - - - - - - -Agriculture and fishing - - - - - - - - - - 2,802Manufacturing 180,711 - 29,167 - - - 35,009 34,391 (28,521) 40,879 83,068Mining and quarrying - - - - - - - - - - 1,289Electricity, water, gas and health services 7,128 - 38,041 - - - 7,128 - - 7,128 4,568Building and construction 892,390 - - - - - 33,039 44,591 - 77,630 58,717Commerce 1,972,780 - 105,938 - - - 24,967 915,830 (633) 940,164 73,544Transportation and communication 482 - - - - - 1,482 - - 1,482 5,519Services 6,120 - - - - - 14,817 (10,043) - 4,774 2,153Consumer loans and credit cards 118,890 - 1,021,807 215,997 - - 248,728 399,719 (314,045) 334,402 15,694Others 347,506 - 1,860,886 10,794 - - 34,662 94,331 (7,462) 121,531 -Total 3,526,007 - 3,227,402 226,791 - - 399,832 1,478,819 (350,661) 1,527,990 247,354
Reconciliation of Changes in the Allowances for Loan Impairment (Table 4, (h))
Specific General allowances allowancesParticulars SAR’000 SAR’000Balance, beginning of the year 399,832 229,690 Charge-offs taken against the allowances during the period (92,457) - Amounts set aside (or reversed) during the period 1,220,615 17,664Other adjustments: – exchange rate differences - - – business combinations - - – acquisitions and disposals of subsidiaries - - – etc. - - Transfers between allowances - -Balance, end of the year 1,527,990 247,354
Basel II – Pillar 3 Annual Disclosures (31 December 2009) (continued)
T H E S A U D I B R I T I S H B A N K
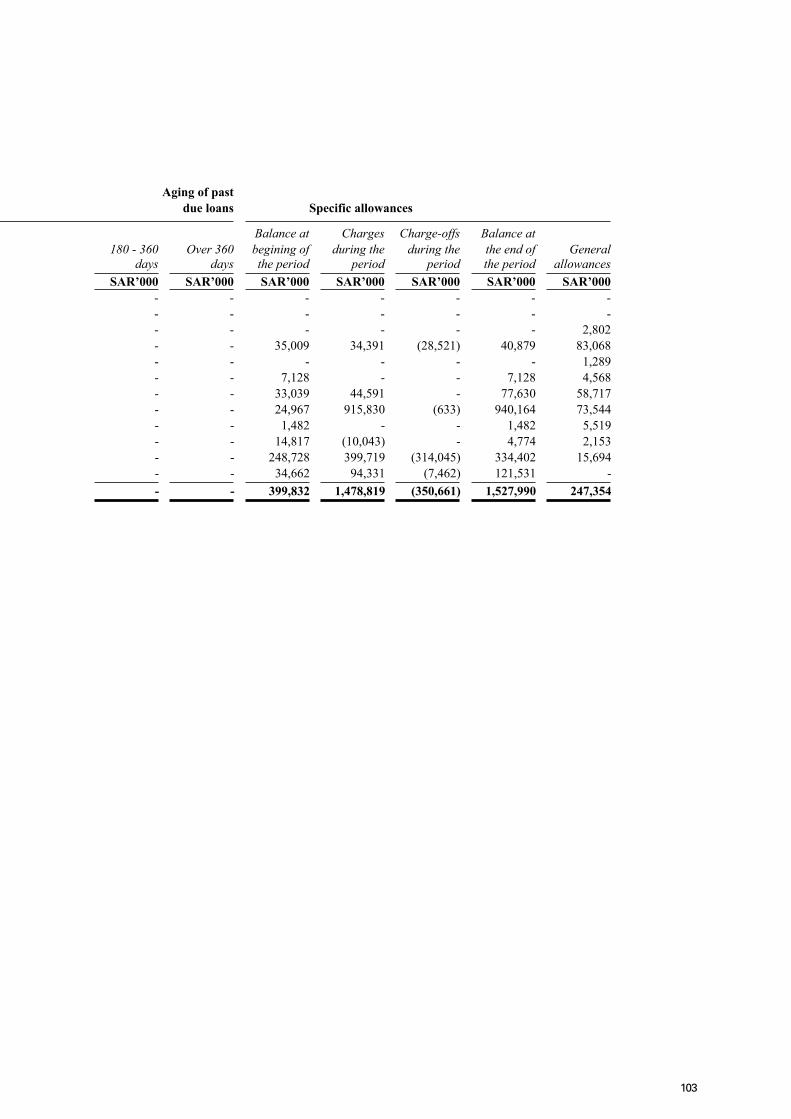
103
4. Table (STA) – Credit Risk: General Disclosures (continued)
Impaired loans, Past Due Loans and Allowances (Table 4, (f))
Aging of past Aging of past due loans due loans Specific allowances Balance at Charges Charge-offs Balance at Impaired Less than 90 - 180 180 - 360 Over 360 begining of during the during the the end of General loans Defaulted 90 days days days days the period period period the period allowancesIndustry sector SAR’000 SAR’000 SAR’000 SAR’000 SAR’000 SAR’000 SAR’000 SAR’000 SAR’000 SAR’000 SAR’000Government and quasi-government - - - - - - - - - - -Banks and other financial institutions - - 171,563 - - - - - - - -Agriculture and fishing - - - - - - - - - - 2,802Manufacturing 180,711 - 29,167 - - - 35,009 34,391 (28,521) 40,879 83,068Mining and quarrying - - - - - - - - - - 1,289Electricity, water, gas and health services 7,128 - 38,041 - - - 7,128 - - 7,128 4,568Building and construction 892,390 - - - - - 33,039 44,591 - 77,630 58,717Commerce 1,972,780 - 105,938 - - - 24,967 915,830 (633) 940,164 73,544Transportation and communication 482 - - - - - 1,482 - - 1,482 5,519Services 6,120 - - - - - 14,817 (10,043) - 4,774 2,153Consumer loans and credit cards 118,890 - 1,021,807 215,997 - - 248,728 399,719 (314,045) 334,402 15,694Others 347,506 - 1,860,886 10,794 - - 34,662 94,331 (7,462) 121,531 -Total 3,526,007 - 3,227,402 226,791 - - 399,832 1,478,819 (350,661) 1,527,990 247,354
Reconciliation of Changes in the Allowances for Loan Impairment (Table 4, (h))
Specific General allowances allowancesParticulars SAR’000 SAR’000Balance, beginning of the year 399,832 229,690 Charge-offs taken against the allowances during the period (92,457) - Amounts set aside (or reversed) during the period 1,220,615 17,664Other adjustments: – exchange rate differences - - – business combinations - - – acquisitions and disposals of subsidiaries - - – etc. - - Transfers between allowances - -Balance, end of the year 1,527,990 247,354
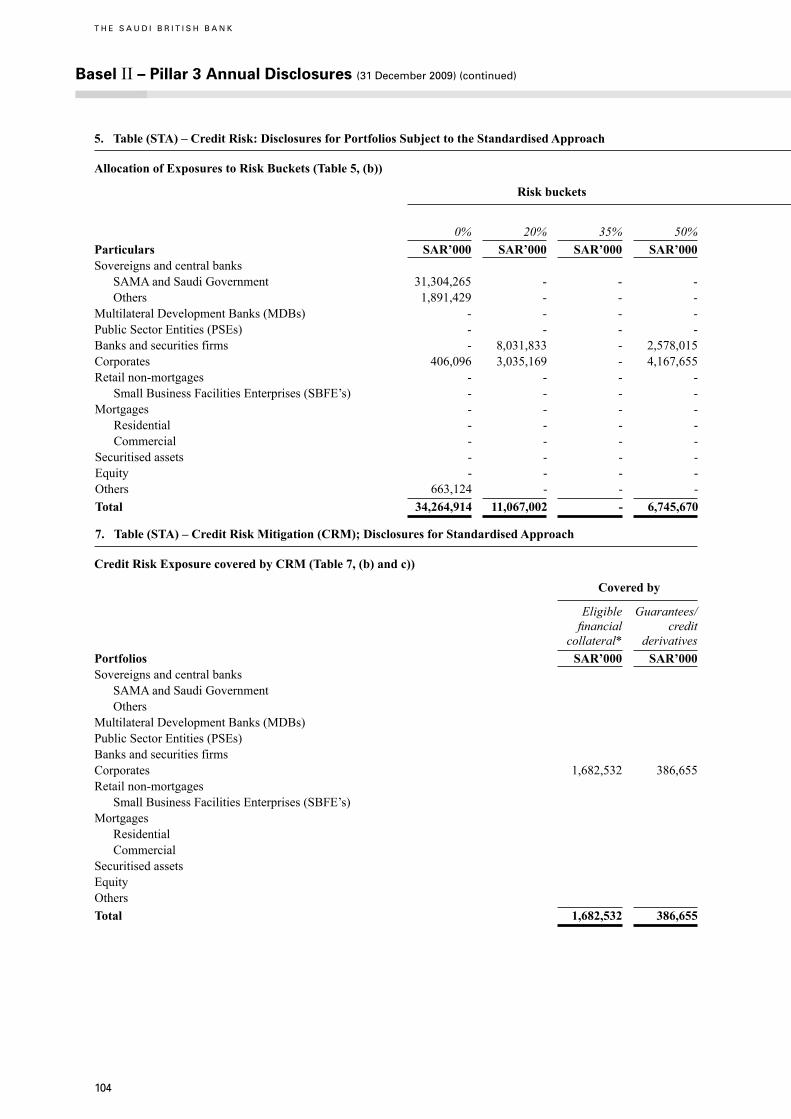
104
5. Table (STA) – Credit Risk: Disclosures for Portfolios Subject to the Standardised Approach
Allocation of Exposures to Risk Buckets (Table 5, (b))
Risk buckets Risk buckets Total Deducted Other risk 0% 20% 35% 50% 75% 100% 150% weights UnratedParticulars SAR’000 SAR’000 SAR’000 SAR’000 SAR’000 SAR’000 SAR’000 SAR’000 SAR’000 SAR’000 SAR’000Sovereigns and central banks SAMA and Saudi Government 31,304,265 - - - - - - - - 31,304,265 - Others 1,891,429 - - - - - - - - 1,891,429 -Multilateral Development Banks (MDBs) - - - - - - - - - - -Public Sector Entities (PSEs) - - - - - - - - - - -Banks and securities firms - 8,031,833 - 2,578,015 - 6,187 - - - 10,616,035 -Corporates 406,096 3,035,169 - 4,167,655 - 73,968,347 6,460 - - 81,583,727 -Retail non-mortgages - - - - 11,507,729 133,497 - - - 11,461,226 - Small Business Facilities Enterprises (SBFE’s) - - - - - - - - - - -Mortgages - - - - - - - - - - - Residential - - - - - 3,188,159 - - - 3,188,159 - Commercial - - - - - - - - - - -Securitised assets - - - - - - - - - - -Equity - - - - - 51,833 - - - 51,833 186,133Others 663,124 - - - - 1,372,966 - - - 2,036,090 -Total 34,264,914 11,067,002 - 6,745,670 11,507,729 78,720,989 6,460 - - 142,312,764 186,133
7. Table (STA) – Credit Risk Mitigation (CRM); Disclosures for Standardised Approach
Credit Risk Exposure covered by CRM (Table 7, (b) and c))
Covered by Eligible Guarantees/ financial credit collateral* derivativesPortfolios SAR’000 SAR’000Sovereigns and central banks SAMA and Saudi Government Others Multilateral Development Banks (MDBs) Public Sector Entities (PSEs) Banks and securities firms Corporates 1,682,532 386,655Retail non-mortgages Small Business Facilities Enterprises (SBFE’s) Mortgages Residential Commercial Securitised assets Equity Others Total 1,682,532 386,655
Basel II – Pillar 3 Annual Disclosures (31 December 2009) (continued)
T H E S A U D I B R I T I S H B A N K
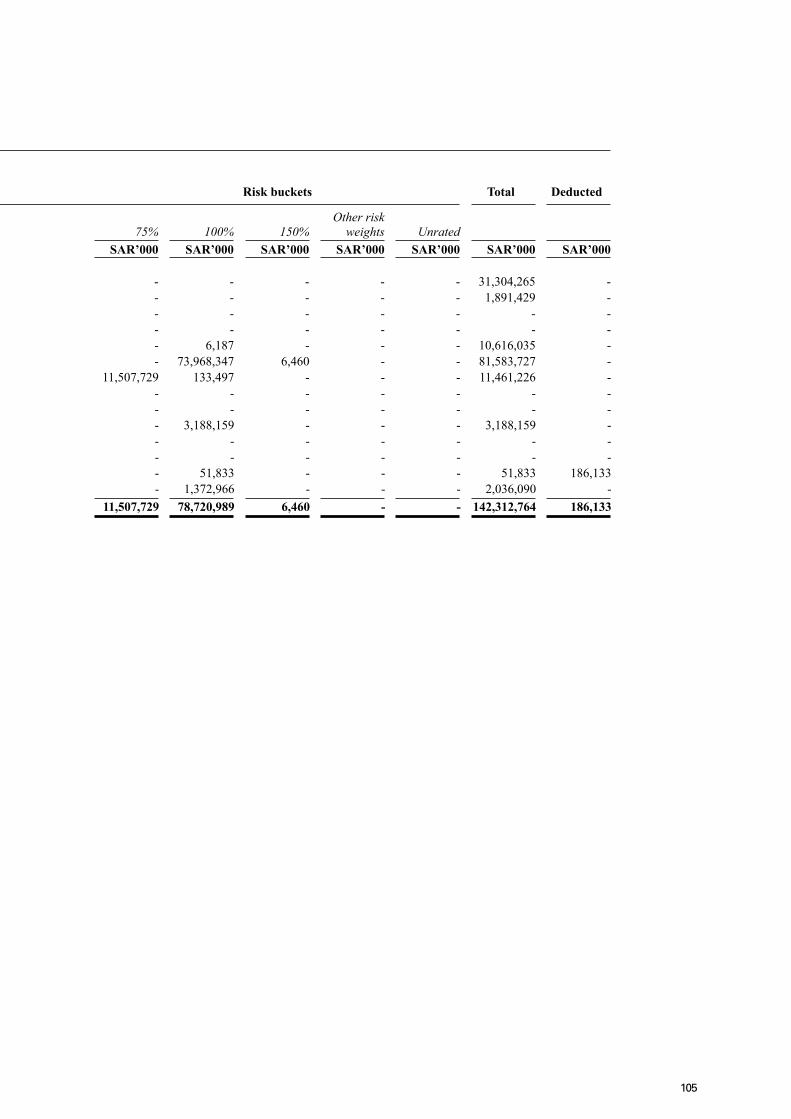
105
5. Table (STA) – Credit Risk: Disclosures for Portfolios Subject to the Standardised Approach
Allocation of Exposures to Risk Buckets (Table 5, (b))
Risk buckets Risk buckets Total Deducted Other risk 0% 20% 35% 50% 75% 100% 150% weights UnratedParticulars SAR’000 SAR’000 SAR’000 SAR’000 SAR’000 SAR’000 SAR’000 SAR’000 SAR’000 SAR’000 SAR’000Sovereigns and central banks SAMA and Saudi Government 31,304,265 - - - - - - - - 31,304,265 - Others 1,891,429 - - - - - - - - 1,891,429 -Multilateral Development Banks (MDBs) - - - - - - - - - - -Public Sector Entities (PSEs) - - - - - - - - - - -Banks and securities firms - 8,031,833 - 2,578,015 - 6,187 - - - 10,616,035 -Corporates 406,096 3,035,169 - 4,167,655 - 73,968,347 6,460 - - 81,583,727 -Retail non-mortgages - - - - 11,507,729 133,497 - - - 11,461,226 - Small Business Facilities Enterprises (SBFE’s) - - - - - - - - - - -Mortgages - - - - - - - - - - - Residential - - - - - 3,188,159 - - - 3,188,159 - Commercial - - - - - - - - - - -Securitised assets - - - - - - - - - - -Equity - - - - - 51,833 - - - 51,833 186,133Others 663,124 - - - - 1,372,966 - - - 2,036,090 -Total 34,264,914 11,067,002 - 6,745,670 11,507,729 78,720,989 6,460 - - 142,312,764 186,133
7. Table (STA) – Credit Risk Mitigation (CRM); Disclosures for Standardised Approach
Credit Risk Exposure covered by CRM (Table 7, (b) and c))
Covered by Eligible Guarantees/ financial credit collateral* derivativesPortfolios SAR’000 SAR’000Sovereigns and central banks SAMA and Saudi Government Others Multilateral Development Banks (MDBs) Public Sector Entities (PSEs) Banks and securities firms Corporates 1,682,532 386,655Retail non-mortgages Small Business Facilities Enterprises (SBFE’s) Mortgages Residential Commercial Securitised assets Equity Others Total 1,682,532 386,655
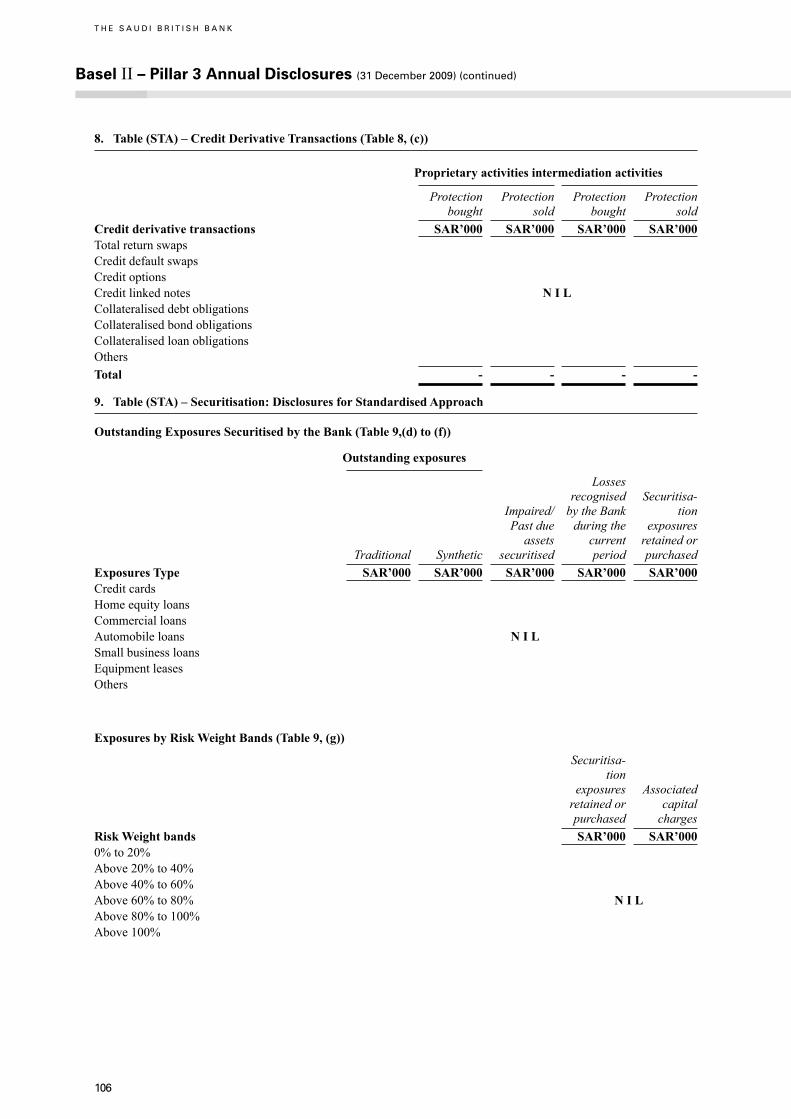
106
8. Table (STA) – Credit Derivative Transactions (Table 8, (c))
Proprietary activities intermediation activities Protection Protection Protection Protection bought sold bought soldCredit derivative transactions SAR’000 SAR’000 SAR’000 SAR’000Total return swapsCredit default swapsCredit optionsCredit linked notes N I LCollateralised debt obligationsCollateralised bond obligationsCollateralised loan obligationsOthersTotal - - - -
9. Table (STA) – Securitisation: Disclosures for Standardised Approach
Outstanding Exposures Securitised by the Bank (Table 9,(d) to (f))
Outstanding exposures Losses recognised Securitisa- Impaired/ by the Bank tion Past due during the exposures assets current retained or Traditional Synthetic securitised period purchasedExposures Type SAR’000 SAR’000 SAR’000 SAR’000 SAR’000Credit cardsHome equity loansCommercial loansAutomobile loans N I LSmall business loansEquipment leasesOthers
Exposures by Risk Weight Bands (Table 9, (g))
Securitisa- tion exposures Associated retained or capital purchased chargesRisk Weight bands SAR’000 SAR’0000% to 20%Above 20% to 40%Above 40% to 60%Above 60% to 80% N I LAbove 80% to 100%Above 100%
Basel II – Pillar 3 Annual Disclosures (31 December 2009) (continued)
T H E S A U D I B R I T I S H B A N K
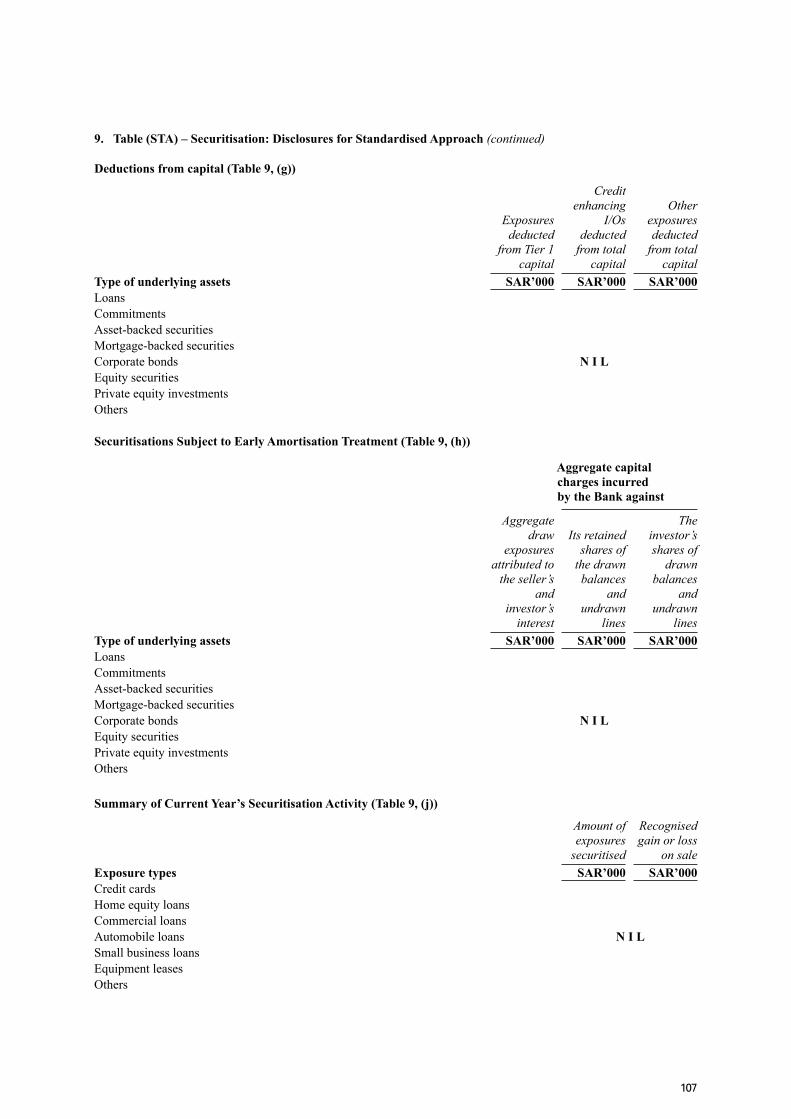
107
9. Table (STA) – Securitisation: Disclosures for Standardised Approach (continued)
Deductions from capital (Table 9, (g))
Credit enhancing Other Exposures I/Os exposures deducted deducted deducted from Tier 1 from total from total capital capital capitalType of underlying assets SAR’000 SAR’000 SAR’000LoansCommitmentsAsset-backed securitiesMortgage-backed securitiesCorporate bonds N I LEquity securitiesPrivate equity investmentsOthers
Securitisations Subject to Early Amortisation Treatment (Table 9, (h))
Aggregate capital charges incurred by the Bank against Aggregate The draw Its retained investor’s exposures shares of shares of attributed to the drawn drawn the seller’s balances balances and and and investor’s undrawn undrawn interest lines linesType of underlying assets SAR’000 SAR’000 SAR’000LoansCommitmentsAsset-backed securitiesMortgage-backed securitiesCorporate bonds N I LEquity securitiesPrivate equity investmentsOthers
Summary of Current Year’s Securitisation Activity (Table 9, (j))
Amount of Recognised exposures gain or loss securitised on saleExposure types SAR’000 SAR’000Credit cardsHome equity loansCommercial loansAutomobile loans N I LSmall business loansEquipment leasesOthers
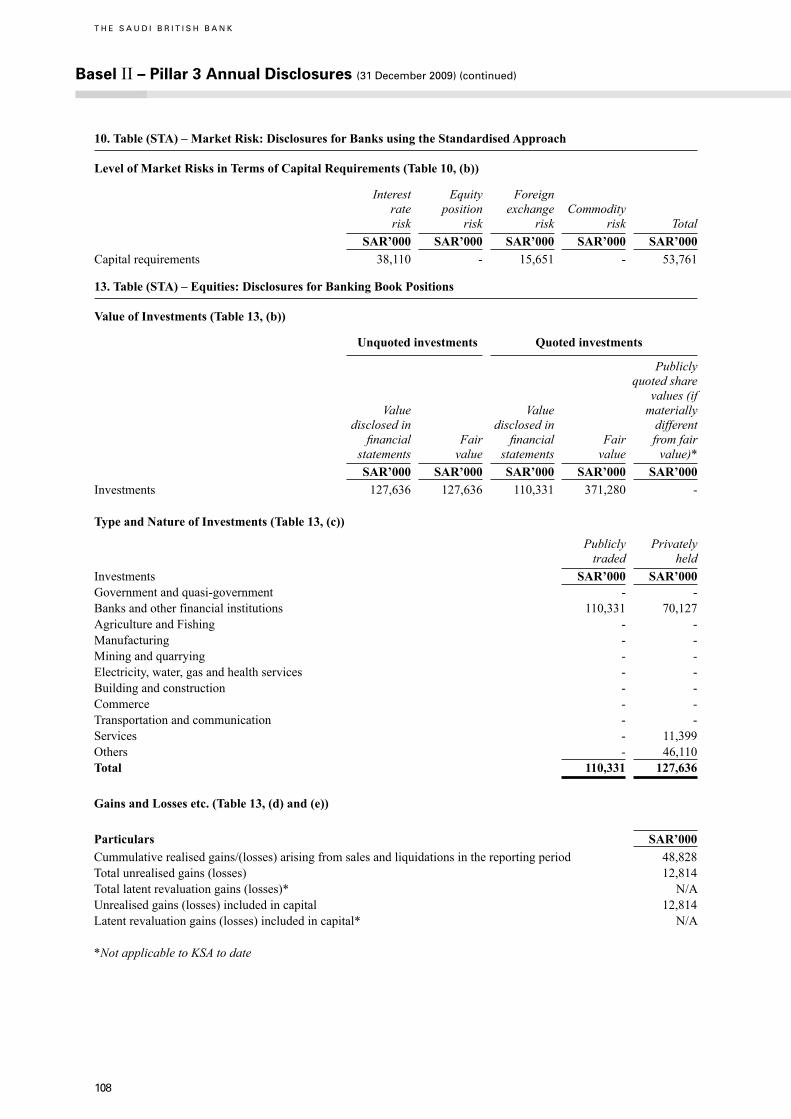
108
10. Table (STA) – Market Risk: Disclosures for Banks using the Standardised Approach
Level of Market Risks in Terms of Capital Requirements (Table 10, (b))
Interest Equity Foreign rate position exchange Commodity risk risk risk risk Total SAR’000 SAR’000 SAR’000 SAR’000 SAR’000Capital requirements 38,110 - 15,651 - 53,761
13. Table (STA) – Equities: Disclosures for Banking Book Positions
Value of Investments (Table 13, (b))
Unquoted investments Quoted investments Publicly quoted share values (if Value Value materially disclosed in disclosed in different financial Fair financial Fair from fair statements value statements value value)* SAR’000 SAR’000 SAR’000 SAR’000 SAR’000Investments 127,636 127,636 110,331 371,280 -
Type and Nature of Investments (Table 13, (c))
Publicly Privately traded heldInvestments SAR’000 SAR’000Government and quasi-government - -Banks and other financial institutions 110,331 70,127Agriculture and Fishing - -Manufacturing - -Mining and quarrying - -Electricity, water, gas and health services - -Building and construction - -Commerce - -Transportation and communication - -Services - 11,399Others - 46,110Total 110,331 127,636
Gains and Losses etc. (Table 13, (d) and (e))
Particulars SAR’000Cummulative realised gains/(losses) arising from sales and liquidations in the reporting period 48,828Total unrealised gains (losses) 12,814Total latent revaluation gains (losses)* N/AUnrealised gains (losses) included in capital 12,814Latent revaluation gains (losses) included in capital* N/A
*Not applicable to KSA to date
Basel II – Pillar 3 Annual Disclosures (31 December 2009) (continued)
T H E S A U D I B R I T I S H B A N K
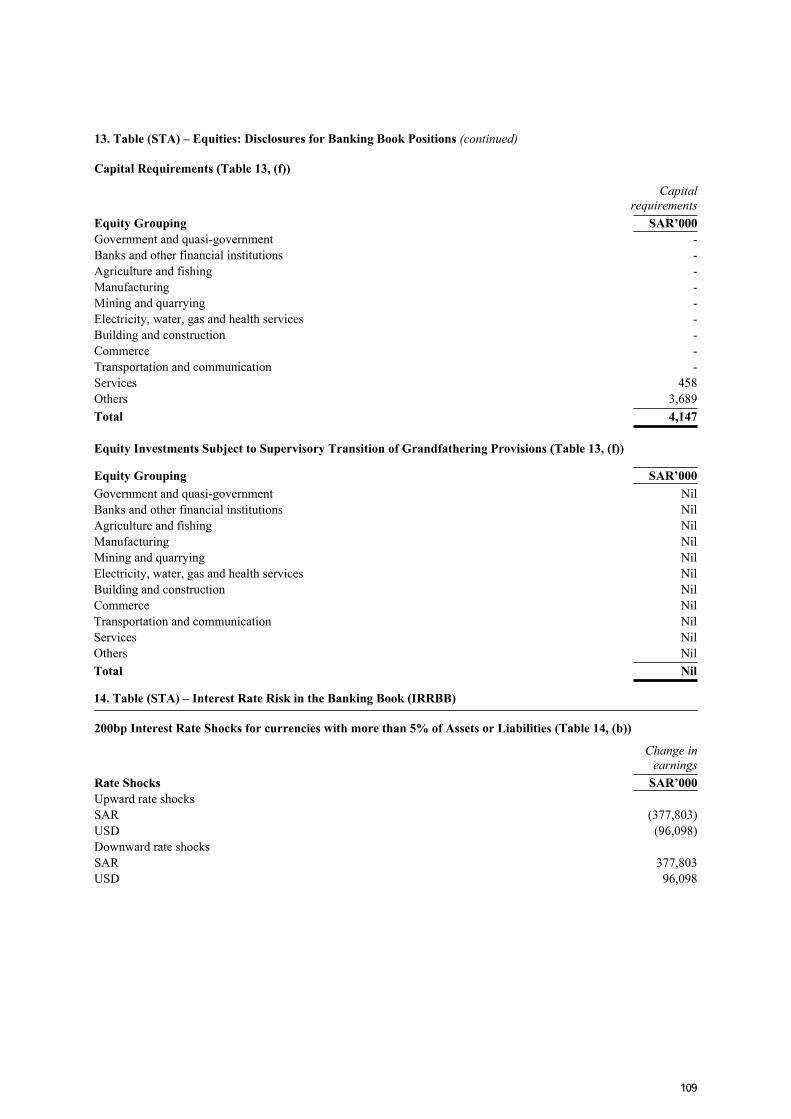
109
13. Table (STA) – Equities: Disclosures for Banking Book Positions (continued)
Capital Requirements (Table 13, (f))
Capital requirementsEquity Grouping SAR’000Government and quasi-government -Banks and other financial institutions -Agriculture and fishing -Manufacturing -Mining and quarrying -Electricity, water, gas and health services -Building and construction -Commerce -Transportation and communication -Services 458Others 3,689Total 4,147
Equity Investments Subject to Supervisory Transition of Grandfathering Provisions (Table 13, (f))
Equity Grouping SAR’000Government and quasi-government NilBanks and other financial institutions NilAgriculture and fishing NilManufacturing NilMining and quarrying NilElectricity, water, gas and health services NilBuilding and construction NilCommerce NilTransportation and communication NilServices NilOthers NilTotal Nil
14. Table (STA) – Interest Rate Risk in the Banking Book (IRRBB)
200bp Interest Rate Shocks for currencies with more than 5% of Assets or Liabilities (Table 14, (b))
Change in earningsRate Shocks SAR’000Upward rate shocksSAR (377,803)USD (96,098)Downward rate shocksSAR 377,803USD 96,098

110
Addresses and Contact Numbers
T H E S A U D I B R I T I S H B A N K
The Saudi British Bank (SABB)SAUDI ARABIAHead OfficePrince Abdulaziz BinMossaad Bin Jalawi Street (Dabaab)P.O. Box 9084, Riyadh 11413Telephone: +966 1 405 0677 Facsimile: +966 1 405 0660
TREASURY
Telephone: +966 1 405 0020Facsimile: +966 1 405 8652
CUSTOMER SERVICE CENTRE
Toll-free number: 800 124 8888Website: www.sabb.com
Area Management Offices:CENTRAL PROVINCERiyadhPrince Abdulaziz BinMossaad Bin Jalawi Street (Dabaab)P.O. Box 9084, Riyadh 11413Telephone: +966 1 405 0677Facsimile: +966 1 405 8418
WESTERN PROVINCEJeddahAli Bin Abi Talib StreetSharafiahP.O. Box 109, Jeddah 21411Telephone: +966 2 651 2121Facsimile: +966 2 653 2816
EASTERN PROVINCEAl-KhobarKing Abdulaziz BoulevardP.O. Box 394, Al-Khobar 31952Telephone: +966 3 882 6000Facsimile: +966 3 882 1669
© Copyright The Saudi British Bank 2009All rights reserved
No part of this publication may be reproduced, stored in a retrieval system, or transmitted in any form or by any means, electronic, mechanical, photocopying, recording, or otherwise, without the prior written permission of The Saudi British Bank.
Published by Corporate Communications,The Saudi British Bank, Riyadh.
Cover designed by Addison Corporate Marketing Limited, London;text pages designed by Group Communications (Asia), The Hongkong and Shanghai Banking Corporation Limited, Hong Kong.
Printed byAl-Nasher Al-Arabi Printing PressRiyadh, Saudi Arabia