The Saint Paul Minimum Wage Increase: Baseline Report
40
The Saint Paul Minimum Wage Increase Baseline Report * Loukas Karabarbounis Jeremy Lise Anusha Nath September 30, 2020 Abstract The baseline report describes economic indicators between 2001 and 2017 for the city of Saint Paul, the broader metro area, Ramsey County, and the state of Min- nesota. We document trends in a variety of local and regional outcomes such as em- ployment, unemployment, wages, number of establishments, worker turnover rates, business sales, and income and consumption. We disaggregate economic outcomes by industry, occupation, types of firms and workers, and place of residence and work. * Karabarbounis: University of Minnesota, Federal Reserve Bank of Minneapolis, NBER, and CEPR; email: [email protected]. Lise: University of Minnesota and Federal Reserve Bank of Minneapolis; email: [email protected]. Nath: Federal Reserve Bank of Minneapolis; email: [email protected]. This report has been prepared for the City of Saint Paul. Karabarbounis and Lise thank the Opportunity and Inclusive Growth Institute at the Federal Reserve Bank of Minneapolis for hosting them. The views expressed herein are those of the authors and not necessarily those of the Federal Reserve Bank of Minneapolis or the Federal Reserve System.
Transcript of The Saint Paul Minimum Wage Increase: Baseline Report
The Saint Paul Minimum Wage Increase
Baseline Report ∗
Loukas Karabarbounis Jeremy Lise Anusha Nath
September 30, 2020
Abstract
The baseline report describes economic indicators between 2001 and 2017 for the
city of Saint Paul, the broader metro area, Ramsey County, and the state of Min-
nesota. We document trends in a variety of local and regional outcomes such as em-
ployment, unemployment, wages, number of establishments, worker turnover rates,
business sales, and income and consumption. We disaggregate economic outcomes by
industry, occupation, types of firms and workers, and place of residence and work.
∗Karabarbounis: University of Minnesota, Federal Reserve Bank of Minneapolis, NBER, and CEPR; email:
[email protected]. Lise: University of Minnesota and Federal Reserve Bank of Minneapolis; email: [email protected].
Nath: Federal Reserve Bank of Minneapolis; email: [email protected]. This report has been prepared
for the City of Saint Paul. Karabarbounis and Lise thank the Opportunity and Inclusive Growth Institute at the
Federal Reserve Bank of Minneapolis for hosting them. The views expressed herein are those of the authors and
not necessarily those of the Federal Reserve Bank of Minneapolis or the Federal Reserve System.

Contents
1 Executive Summary 1
2 Trends in Economic Indicators 5
2.1 Employment . . . . . . . . . . . . . . . . . . . . . . . . . . . . . . . . . . . . . 5
2.2 Unemployment . . . . . . . . . . . . . . . . . . . . . . . . . . . . . . . . . . . 13
2.3 Wages and Earnings . . . . . . . . . . . . . . . . . . . . . . . . . . . . . . . . 14
2.4 Turnover Rates . . . . . . . . . . . . . . . . . . . . . . . . . . . . . . . . . . . 21
2.5 Establishments and Firms . . . . . . . . . . . . . . . . . . . . . . . . . . . . . 24
2.6 Business Sales . . . . . . . . . . . . . . . . . . . . . . . . . . . . . . . . . . . . 29
2.7 Income and Consumption . . . . . . . . . . . . . . . . . . . . . . . . . . . . . 33
3 Trends in Restaurant Services 35
Saint Paul Minimum Wage: Baseline Report Karabarbounis, Lise, and Nath
1 Executive Summary
In January 2020, the City of Saint Paul increased the minimum wage for businesses with more
than 10,000 employees to 12.5 dollars per hour. The minimum wage will increase gradually to
reach 15 dollars per hour in:
• July 2022 for macro businesses (more than 10,000 employees);
• July 2023 for large businesses (101–10,0000 employees);
• July 2025 for small businesses (6–100 employees);
• July 2027 for micro business (less than 6 employees).
This baseline report provides analysis of pre-trends in economic indicators between 2000
and 2017 for the city of Saint Paul, the broader metro area, Ramsey County, and the state of
Minnesota. We stop our analysis of pre-trends before 2018, the year when Minneapolis raised
its minimum wage to a level above the minimum wage in Saint Paul.
We summarize key results of our analysis.
1. Employment growth has been modest in Saint Paul since the early 2010s.
(a) Industries with faster employment growth:
• Accommodation and food services.
• Education.
• Health.
• Professional, scientific, and technical services.
(b) Industries with slower employment growth:
• Information.
• Manufacturing.
1 of 38
Saint Paul Minimum Wage: Baseline Report Karabarbounis, Lise, and Nath
• Retail.
(c) Groups of workers with faster employment growth:
• Workers with low levels of education.
• Older workers.
• Workers who identify as Asian.
• Workers who identify as Black or African-American.
• Workers who identify as Latino or Hispanic.
(d) Groups of workers with slower employment growth:
• Younger workers.
• Workers who identify as White.
2. Real wage growth has been relatively steady in Saint Paul since the 2000s.
(a) Industries with faster wage growth:
• Professional, scientific, and technical services.
• Wholesale.
• Accommodation and food services.
(b) Industries with slower wage growth:
• Education.
• Health.
• Manufacturing.
• Retail.
(c) Groups of workers with faster wage growth:
• Workers with low levels of education.
• Older workers.
2 of 38

Saint Paul Minimum Wage: Baseline Report Karabarbounis, Lise, and Nath
• Workers who identify as Asian.
• Workers who identify as White.
(d) Groups of workers with slower wage growth:
• Younger workers.
• Workers who identify as Black or African-American.
3. Worker turnover (hires and separations) rates have declined since 2000.
(a) Groups of workers with higher turnover levels:
• Workers with low levels of education.
• Younger workers.
• Workers in the accommodation and food, administrative services, and recreation
industries.
• Workers who identify as Black or African-American.
• Workers who identify as Latino or Hispanic.
(b) Groups of workers with lower turnover levels:
• Workers with high levels of education.
• Older workers.
• Workers who identify as White.
4. The number of establishments has declined since 2000.
(a) Industries with significant declines in their number of establishments:
• Finance and insurance.
• Manufacturing.
• Wholesale.
(b) Industries with significant increases in their number of establishments:
3 of 38
Saint Paul Minimum Wage: Baseline Report Karabarbounis, Lise, and Nath
• Health.
5. Consumers in the Minneapolis, Saint Paul, and Bloomington metro area have shifted
their consumption baskets away from apparel, tobacco, and alcohol toward health and
education relative to the early 2000s.
4 of 38

Saint Paul Minimum Wage: Baseline Report Karabarbounis, Lise, and Nath
170
180
190
200
Tota
l Em
ploy
men
t
2001 2006 2011 2016
Figure 1: Employment in Saint Paul, Thousands of Jobs
2 Trends in Economic Indicators
In this section, we present our analyses of trends in various economic indicators for the city of
Saint Paul, neighboring areas and counties, and the state of Minnesota. We draw on a large
number of publicly available data sources to document trends in employment, unemployment,
wages, the number of establishments, worker turnover rates, business sales, personal income,
and consumption. We disaggregate these trends by industry, type of worker, and type of firm.
2.1 Employment
We begin our analyses by documenting employment (number of jobs) trends in the city of Saint
Paul and neighboring areas. The source data come from the Quarterly Census of Employment
and Wages (QCEW). The QCEW is a census of employers. The measure of employment refers
to the number of workers who worked during or received pay for a pay period that includes the
12th of the month, as reported by establishments covered under the unemployment insurance
program. According to the QCEW, these jobs account for roughly 97 percent of employment
in the state of Minnesota. Most of the excluded employment comes from the self-employed.
5 of 38

Saint Paul Minimum Wage: Baseline Report Karabarbounis, Lise, and Nath
.9.9
51
1.05
1.1
Tota
l Em
ploy
men
t [20
15(Q
1)=1
]
2001 2006 2011 2016
Saint Paul Minneapolis Other Neighboring
Figure 2: Employment Index, 2015(1) = 1
Employment covers all industries, including the public sector.
Figure 1 presents the evolution of employment in Saint Paul between 2000 and 2017.
Employment in Saint Paul during the 2000s largely followed national employment, declining
during the economic downturns of 2001 and 2007 and recovering in between. Since 2010,
Saint Paul has added jobs at an annual rate of roughly 0.6 percent, for a total of about 7,800
additional jobs.1
In Figure 2, we plot employment in the city of Saint Paul together with employment in
the city of Minneapolis and in other neighboring cities excluding Minneapolis.2 All series
in the figure have been normalized to one in the first quarter of 2015 to better visualize
employment growth for cities with different employment levels. Figure 2 displays important
differences across the three groups of cities. Between 2000 and 2015, Saint Paul lost jobs while
1We seasonally adjust the raw employment series from the QCEW by regressing raw employment on quarterlydummies and then subtracting the estimated coefficient on the quarterly dummy from raw employment. Theresulting employment series is then normalized to have the same mean as the raw series over the sample period.Unless otherwise noted, all time series described in this report are seasonally adjusted using the same methodology.
2Other neighboring cities includes Brooklyn Center, Columbia Heights, Eagan, Edina, Falcon Heights, FortSnelling, Fridley, Golden Valley, Lauderdale, Maplewood, Richfield, Robbinsdale, Roseville, Saint Anthony, SaintLouis Park, and Woodbury.
6 of 38
Saint Paul Minimum Wage: Baseline Report Karabarbounis, Lise, and Nath
Minneapolis gained jobs. Other neighboring cities also gained jobs in this period.3 All cities
have experienced job growth since 2015, although Minneapolis by a somewhat higher rate. In
fact, since 2010, Minneapolis added jobs at an annual rate of roughly 2 percent, compared to
about 0.6 percent for Saint Paul.
In Table 1, we present summary statistics of the 2017 composition of employment across
industries in the state of Minnesota, Ramsey County, the city of Saint Paul, and the city
of Minneapolis.4 We note the relative similarity of employment shares between Saint Paul
and Minneapolis. Notably, in both cities, health is the largest industry and educational,
financial, and professional services absorb a large share of jobs. A difference between the two
cities is in the size of their public sector, which accounts for 13 percent of employment in
Saint Paul, as opposed to roughly 5 percent in Minneapolis. Importantly, in both cities, retail,
administrative services, and accommodation and food services collectively account for between
17 and 18 percent of all jobs.5
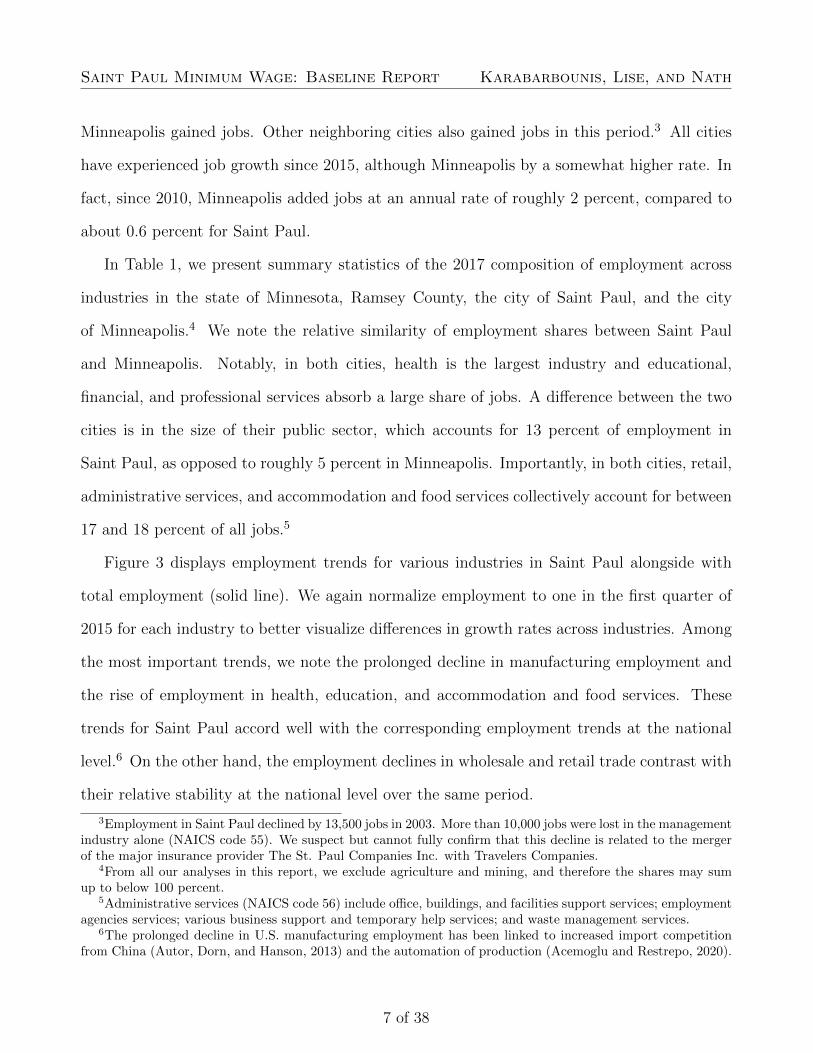
Figure 3 displays employment trends for various industries in Saint Paul alongside with
total employment (solid line). We again normalize employment to one in the first quarter of
2015 for each industry to better visualize differences in growth rates across industries. Among
the most important trends, we note the prolonged decline in manufacturing employment and
the rise of employment in health, education, and accommodation and food services. These
trends for Saint Paul accord well with the corresponding employment trends at the national
level.6 On the other hand, the employment declines in wholesale and retail trade contrast with
their relative stability at the national level over the same period.
3Employment in Saint Paul declined by 13,500 jobs in 2003. More than 10,000 jobs were lost in the managementindustry alone (NAICS code 55). We suspect but cannot fully confirm that this decline is related to the mergerof the major insurance provider The St. Paul Companies Inc. with Travelers Companies.
4From all our analyses in this report, we exclude agriculture and mining, and therefore the shares may sumup to below 100 percent.
5Administrative services (NAICS code 56) include office, buildings, and facilities support services; employmentagencies services; various business support and temporary help services; and waste management services.
6The prolonged decline in U.S. manufacturing employment has been linked to increased import competitionfrom China (Autor, Dorn, and Hanson, 2013) and the automation of production (Acemoglu and Restrepo, 2020).
7 of 38

Saint Paul Minimum Wage: Baseline Report Karabarbounis, Lise, and Nath
Table 1: Industry Shares of Employment (2017)
(percent of area total) Minnesota Ramsey Saint Paul Minneapolis
Acc. and Food Services 8.1 7.2 6.8 8.6
Administrative Services 4.7 5.6 5.2 4.4
Arts and Entertainment 1.8 1.7 2.1 2.0
Construction 4.4 3.6 2.7 2.2
Education 8.0 9.6 9.9 10.3
Finance and Insurance 5.0 5.0 6.8 9.9
Health 17.1 19.5 24.9 18.8
Information 1.9 2.5 2.7 3.2
Management 2.8 5.4 2.7 5.2
Manufacturing 11.2 8.4 4.2 4.1
Other Services 3.2 3.4 3.7 3.1
Prof., Sc., and Tech. 5.6 4.4 4.1 11.6
Public Administration 4.6 8.0 12.9 4.7
Real Estate 1.2 1.4 1.3 1.4
Retail 10.5 8.2 5.3 4.8
Transportation 3.7 2.1 1.3 2.4
Utilities 0.5 0.4 0.5 0.9
Wholesale 4.6 3.6 3.1 2.5
8 of 38

Saint Paul Minimum Wage: Baseline Report Karabarbounis, Lise, and Nath
.81
1.2
1.4
1.6
1.8
2
Em
ploy
men
t [20
15(Q
1)=
1]
2001 2006 2011 2016
Total Construction ManufactutingWholesale Retail Acc. and Food
.81
1.2
1.4
1.6
1.8
2
Em
ploy
men
t [20
15(Q
1)=
1]
2001 2006 2011 2016
Total Information FinanceProf. Services Education Health
Figure 3: Employment Index in Saint Paul across Industries, 2015(1) = 1
We next analyze employment trends across different groups of workers. For these analyses,
we use data from the Quarterly Workforce Indicators (QWI). In contrast to the QCEW, which
uses establishment records, the QWI has the advantage that the source data are job-level data
that link workers to their employers. This makes an analysis of employment of workers with
different characteristics feasible. The disadvantage of the QWI is that publicly available labor
market statistics come at a level that is more aggregated than the city of Saint Paul. For these
analyses, therefore, we look at the state of Minnesota; Ramsey County; and the combined
metro of Minneapolis, Saint Paul, and Bloomington. To confirm that these data are useful for
our purposes, we have compared Saint Paul employment levels and changes from the QCEW at
both the aggregate and the industry level with their analogs for the three regions in the QWI.
While differences may exist, the general trends we documented in the QCEW for Saint Paul
are not significantly different in the QWI for the broader geographical regions that include
Saint Paul. This makes us confident that the worker-level analysis we perform with the QWI
for this baseline report can be informative for worker-level labor outcomes in Saint Paul.
9 of 38
Saint Paul Minimum Wage: Baseline Report Karabarbounis, Lise, and Nath
.7.8
.91
1.1
Empl
oym
ent [
2015
(Q1)
=1]
2001 2006 2011 2016
Minnesota Ramsey Mpls/StP/Bloom
(a) Less than high school
.7.8
.91
1.1
Empl
oym
ent [
2015
(Q1)
=1]
2001 2006 2011 2016
Minnesota Ramsey Mpls/StP/Bloom
(b) High school
.7.8
.91
1.1
Empl
oym
ent [
2015
(Q1)
=1]
2001 2006 2011 2016
Minnesota Ramsey Mpls/StP/Bloom
(c) Some college
.7.8
.91
1.1
Empl
oym
ent [
2015
(Q1)
=1]
2001 2006 2011 2016
Minnesota Ramsey Mpls/StP/Bloom
(d) College or more
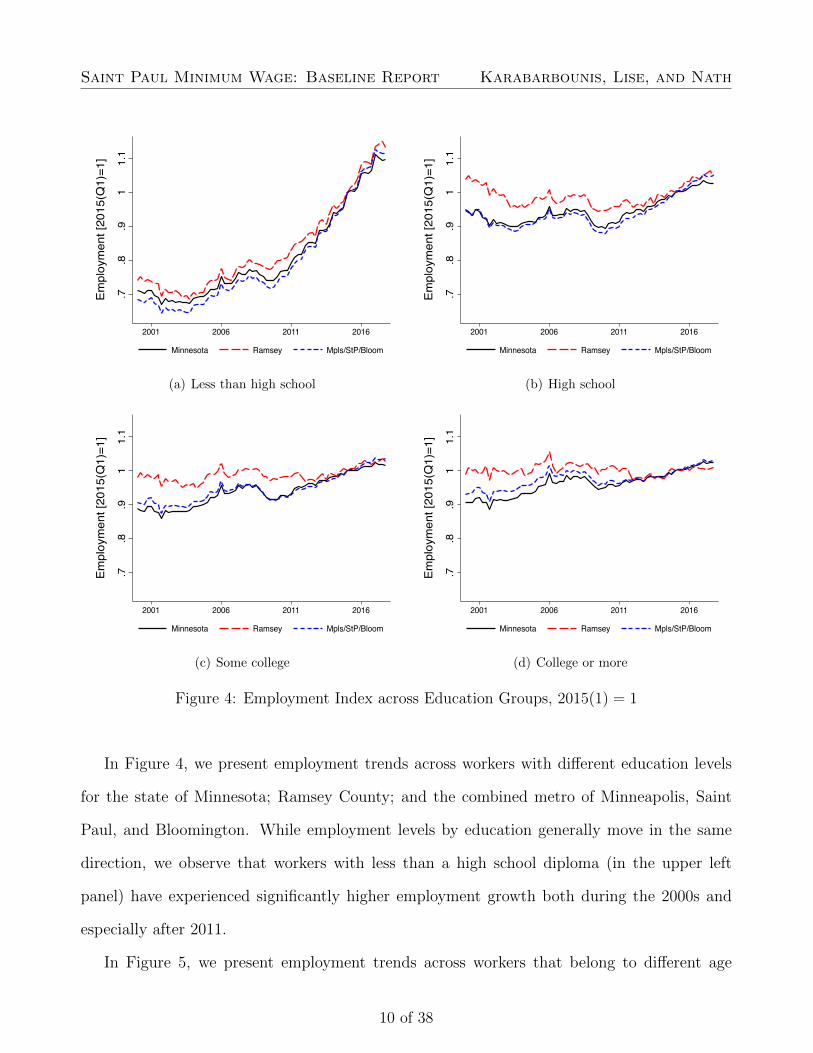
Figure 4: Employment Index across Education Groups, 2015(1) = 1
In Figure 4, we present employment trends across workers with different education levels
for the state of Minnesota; Ramsey County; and the combined metro of Minneapolis, Saint
Paul, and Bloomington. While employment levels by education generally move in the same
direction, we observe that workers with less than a high school diploma (in the upper left
panel) have experienced significantly higher employment growth both during the 2000s and
especially after 2011.
In Figure 5, we present employment trends across workers that belong to different age
10 of 38
Saint Paul Minimum Wage: Baseline Report Karabarbounis, Lise, and Nath
.5.7
51
1.25
1.5
Empl
oym
ent [
2015
(Q1)
=1]
2001 2006 2011 2016
Minnesota Ramsey Mpls/StP/Bloom
(a) Workers age 19-21
.5.7
51
1.25
1.5
Empl
oym
ent [
2015
(Q1)
=1]
2001 2006 2011 2016
Minnesota Ramsey Mpls/StP/Bloom
(b) Workers age 25-34
.5.7
51
1.25
1.5
Empl
oym
ent [
2015
(Q1)
=1]
2001 2006 2011 2016
Minnesota Ramsey Mpls/StP/Bloom
(c) Workers age 35-44
.5.7
51
1.25
1.5
Empl
oym
ent [
2015
(Q1)
=1]
2001 2006 2011 2016
Minnesota Ramsey Mpls/StP/Bloom
(d) Workers age 55-64
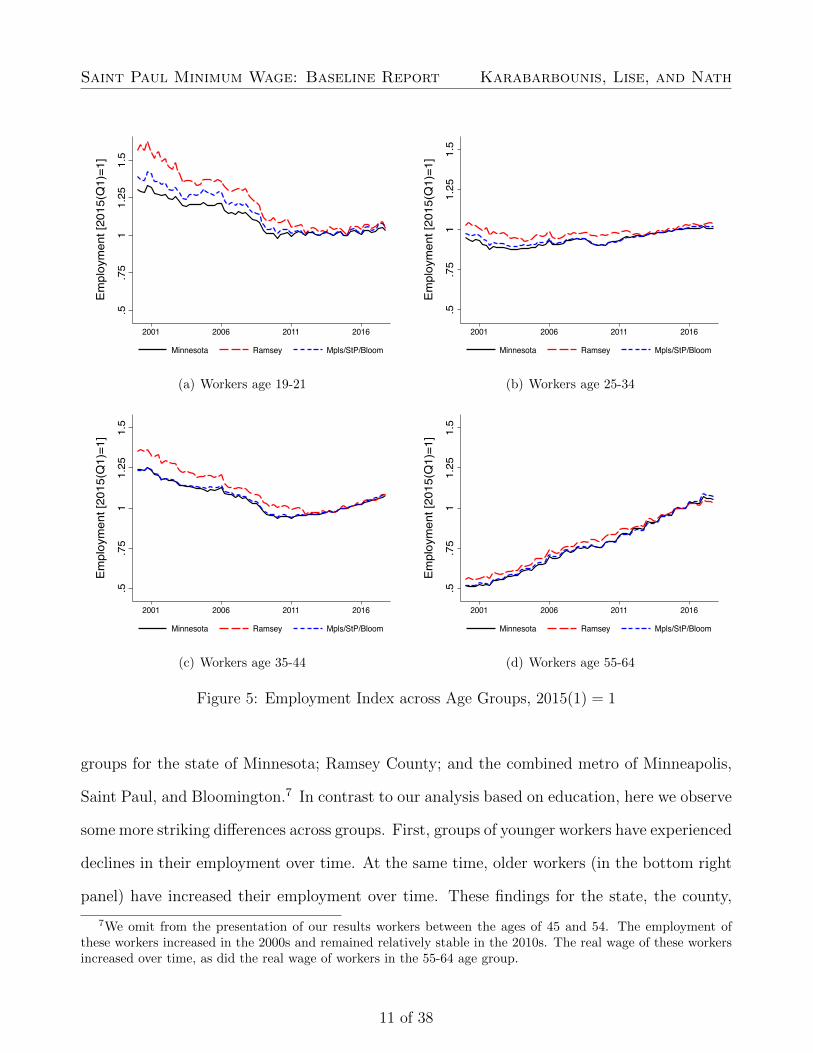
Figure 5: Employment Index across Age Groups, 2015(1) = 1
groups for the state of Minnesota; Ramsey County; and the combined metro of Minneapolis,
Saint Paul, and Bloomington.7 In contrast to our analysis based on education, here we observe
some more striking differences across groups. First, groups of younger workers have experienced
declines in their employment over time. At the same time, older workers (in the bottom right
panel) have increased their employment over time. These findings for the state, the county,
7We omit from the presentation of our results workers between the ages of 45 and 54. The employment ofthese workers increased in the 2000s and remained relatively stable in the 2010s. The real wage of these workersincreased over time, as did the real wage of workers in the 55-64 age group.
11 of 38
Saint Paul Minimum Wage: Baseline Report Karabarbounis, Lise, and Nath
.6.8
11.
2
Empl
oym
ent [
2015
(Q1)
=1]
2001 2006 2011 2016
Minnesota Ramsey Mpls/StP/Bloom
(a) White
.6.8
11.
2
Empl
oym
ent [
2015
(Q1)
=1]
2001 2006 2011 2016
Minnesota Ramsey Mpls/StP/Bloom
(b) Black or African-American
.6.8
11.
2
Empl
oym
ent [
2015
(Q1)
=1]
2001 2006 2011 2016
Minnesota Ramsey Mpls/StP/Bloom
(c) Asian
.6.8
11.
2
Empl
oym
ent [
2015
(Q1)
=1]
2001 2006 2011 2016
Minnesota Ramsey Mpls/StP/Bloom
(d) Hispanic or Latino
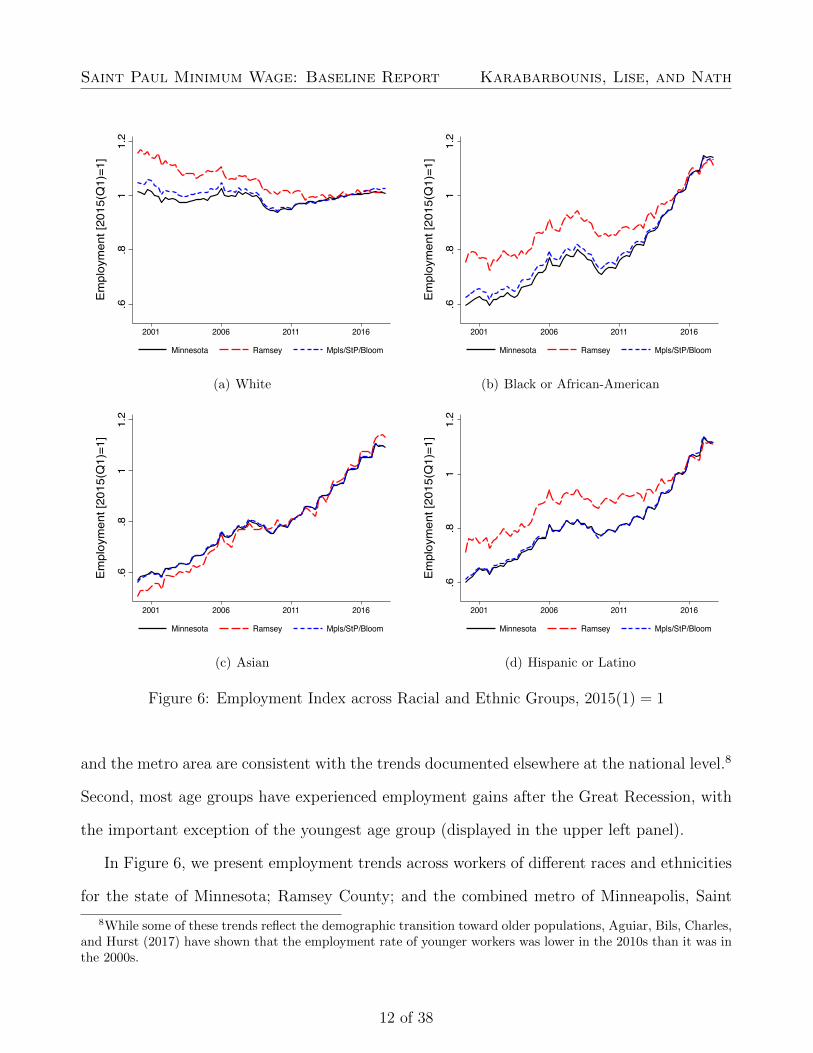
Figure 6: Employment Index across Racial and Ethnic Groups, 2015(1) = 1
and the metro area are consistent with the trends documented elsewhere at the national level.8
Second, most age groups have experienced employment gains after the Great Recession, with
the important exception of the youngest age group (displayed in the upper left panel).
In Figure 6, we present employment trends across workers of different races and ethnicities
for the state of Minnesota; Ramsey County; and the combined metro of Minneapolis, Saint
8While some of these trends reflect the demographic transition toward older populations, Aguiar, Bils, Charles,and Hurst (2017) have shown that the employment rate of younger workers was lower in the 2010s than it was inthe 2000s.
12 of 38

Saint Paul Minimum Wage: Baseline Report Karabarbounis, Lise, and Nath
24
68
Une
mpl
oym
ent R
ate
2001 2006 2011 2016
Minnesota 7 County Region Saint Paul
24
68
Une
mpl
oym
ent R
ate
2001 2006 2011 2016
Saint Paul Minneapolis
Figure 7: Unemployment Rate, Percent
Paul, and Bloomington. We find significant employment gains throughout the sample period
and for all regions for workers who identify as Black or African-American, Asian, and Latino
or Hispanic. By contrast, workers who identify as White experienced declining employment
during the 2000s followed by stabilization of employment in Ramsey County and a modest
recovery in the metro region during the 2010s.
2.2 Unemployment
Figure 7 presents the (seasonally adjusted) unemployment rate for selected regions between
2000 and 2018. The source data come from the Local Unemployment Area Statistics (LAUS),
a federal-state cooperative program between the U.S. Bureau of Labor Statistics (BLS) and
state agencies.9 The unemployment rate is calculated as the ratio of the unemployed to labor
9Monthly estimates of unemployment and employment at the state level are developed based on a state spacemodel that uses data from the Current Population Survey, the Current Employment Statistics, and the Unem-ployment Insurance Statistics. The state unemployment rate determines eligibility for unemployment insurancebenefits. See Chodorow-Reich, Coglianese, and Karabarbounis (2019) for more details on the state space modelsand the noise that this model may introduce in determining eligibility into benefits at the state level. We notethat the LAUS program imputes unemployment at the local level using state-level information, and thereforesome of the comovement between local unemployment rates may be mechanical.
13 of 38

Saint Paul Minimum Wage: Baseline Report Karabarbounis, Lise, and Nath
force participants. Unemployed refers to persons on temporary layoff, waiting to report for a
new job, or not employed but available for work and actively looking during the last four weeks,
whereas labor force participants refers to the sum of the employed and unemployed. The left
panel plots the unemployment rate for the state of Minnesota, the seven county region, and
the city of Saint Paul.10 The right panel displays the unemployment rate for the city of Saint
Paul and the city of Minneapolis. The unemployment rates comove closely across all regions
during both economic expansions and downturns.
2.3 Wages and Earnings
We begin our analysis of wages using data from the QCEW. Average weekly wages in QCEW
equal quarterly total payroll divided by 13 times the average of the three monthly employment
levels. Included in the quarterly payroll data are non-wage cash payments such as bonuses,
the cash value of meals and lodging when supplied, tips and other gratuities, and employer
contributions to certain deferred compensation plans such as 401(k) plans and stock options.
Wages measured by the QCEW are subject to large fluctuations due to calendar effects result-
ing from some quarters having more pay dates than others. For this reason, we remove wage
seasonality and smooth the series by constructing a four-quarter moving average.
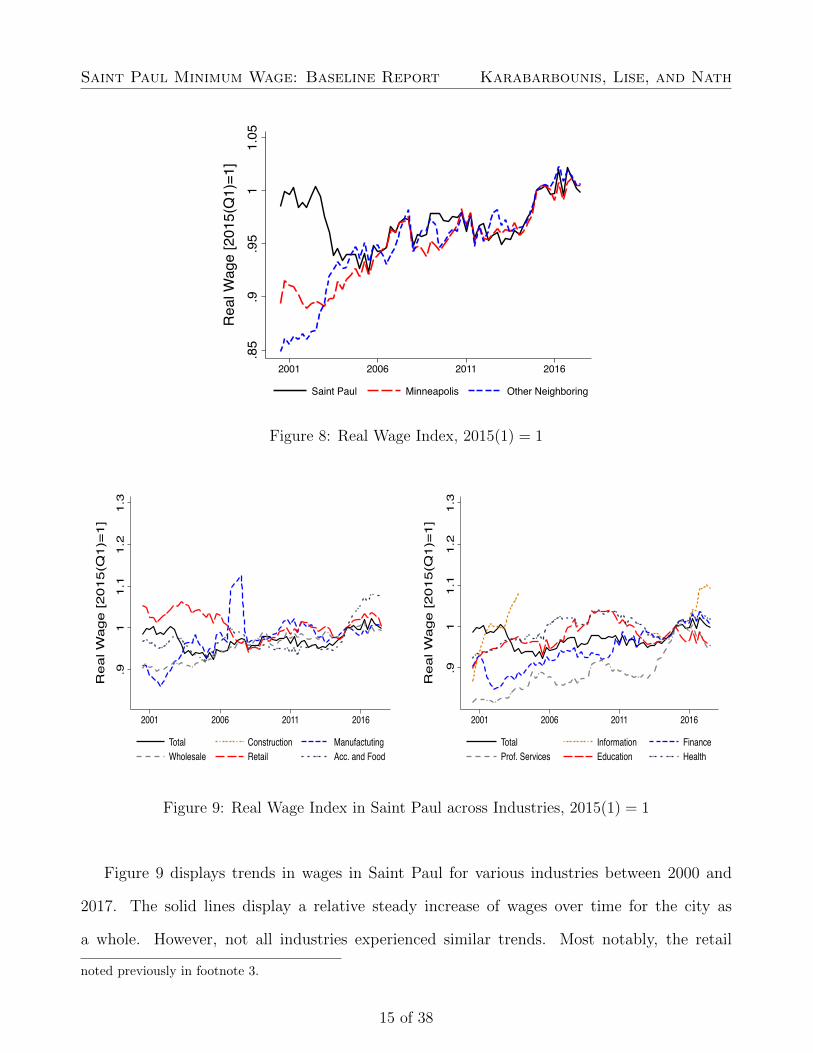
In Figure 8, we plot the real wage in the city of Saint Paul, the city of Minneapolis, and
other neighboring cities. Wages are deflated using the semi-annual consumer price index for all
urban consumers and all items from the BLS in the Saint Paul, Minneapolis, and Bloomington
metro area. Similar to our analyses of employment across cities, all series in the figure have
been normalized to one in the first quarter of 2015 to better visualize differences in the wage
growth across areas. Figure 8 shows important differences in the evolution of the real wage
across the three areas early in the sample. However, all areas have experienced similar real
wage growth since 2006.11
10The seven county region includes the counties of Anoka, Carver, Dakota, Hennepin, Ramsey, Scott, andWashington and covers a population of roughly 3 million.
11The notable drop in wages in Saint Paul in the early 2000s coincides with the drop in employment that we
14 of 38
Saint Paul Minimum Wage: Baseline Report Karabarbounis, Lise, and Nath
.85
.9.9
51
1.05
Rea
l Wag
e [2
015(
Q1)
=1]
2001 2006 2011 2016
Saint Paul Minneapolis Other Neighboring
Figure 8: Real Wage Index, 2015(1) = 1
.91
1.1
1.2
1.3
Rea
l Wag
e [2
015(
Q1)
=1]
2001 2006 2011 2016
Total Construction ManufactutingWholesale Retail Acc. and Food
.91
1.1
1.2
1.3
Rea
l Wag
e [2
015(
Q1)
=1]
2001 2006 2011 2016
Total Information FinanceProf. Services Education Health
Figure 9: Real Wage Index in Saint Paul across Industries, 2015(1) = 1
Figure 9 displays trends in wages in Saint Paul for various industries between 2000 and
2017. The solid lines display a relative steady increase of wages over time for the city as
a whole. However, not all industries experienced similar trends. Most notably, the retail
noted previously in footnote 3.
15 of 38
Saint Paul Minimum Wage: Baseline Report Karabarbounis, Lise, and Nath
.9.9
51
1.05
1.1
Rea
l Wag
e [2
015(
Q1)
=1]
2001 2006 2011 2016
Minnesota Ramsey Mpls/StP/Bloom
(a) Less than high school
.9.9
51
1.05
1.1
Rea
l Wag
e [2
015(
Q1)
=1]
2001 2006 2011 2016
Minnesota Ramsey Mpls/StP/Bloom
(b) High school
.9.9
51
1.05
1.1
Rea
l Wag
e [2
015(
Q1)
=1]
2001 2006 2011 2016
Minnesota Ramsey Mpls/StP/Bloom
(c) Some college
.9.9
51
1.05
1.1
Rea
l Wag
e [2
015(
Q1)
=1]
2001 2006 2011 2016
Minnesota Ramsey Mpls/StP/Bloom
(d) College or more
Figure 10: Real Wage Index across Education Groups, 2015(1) = 1
industry in the left panel exhibits a large, prolonged decline in wages over the 2000s before
slightly recovering in the 2010s. On the other hand, wholesale and manufacturing (in the left
panel) and professional services and finance (in the right panel) have experienced significant
wage growth over time.
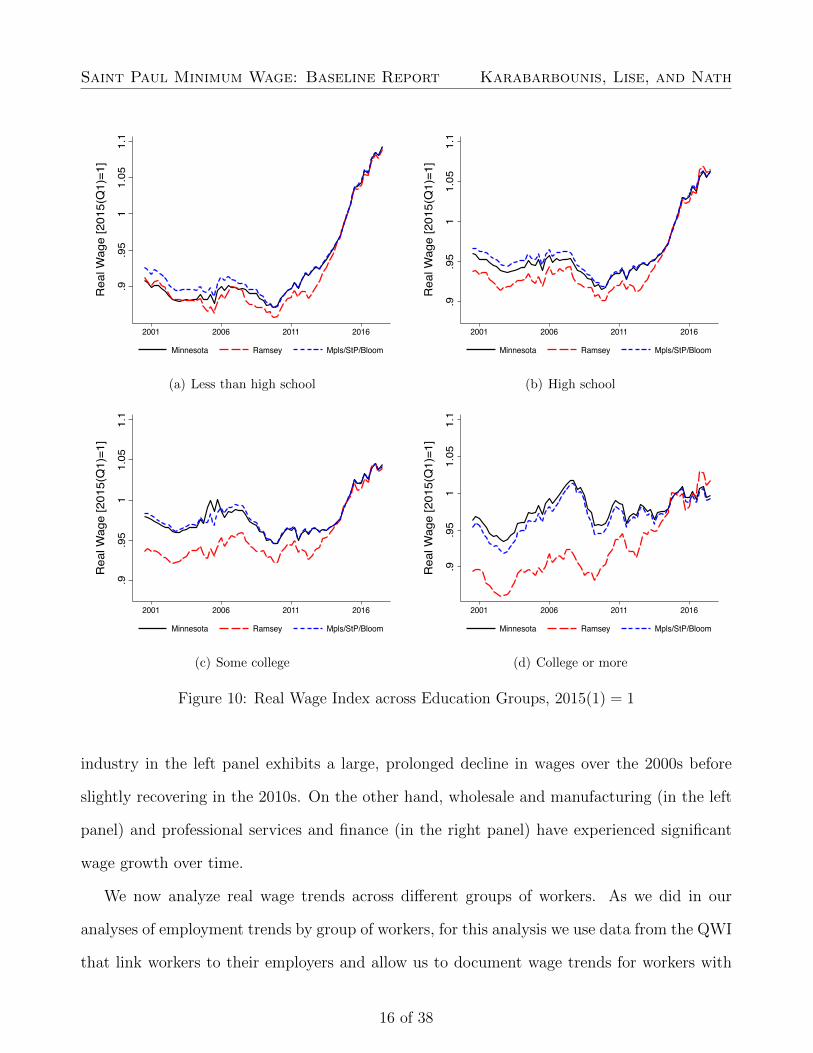
We now analyze real wage trends across different groups of workers. As we did in our
analyses of employment trends by group of workers, for this analysis we use data from the QWI
that link workers to their employers and allow us to document wage trends for workers with
16 of 38
Saint Paul Minimum Wage: Baseline Report Karabarbounis, Lise, and Nath
.91
1.1
1.2
1.3
Rea
l Wag
e [2
015(
Q1)
=1]
2001 2006 2011 2016
Minnesota Ramsey Mpls/StP/Bloom
(a) Workers age 19-21
.91
1.1
1.2
1.3
Rea
l Wag
e [2
015(
Q1)
=1]
2001 2006 2011 2016
Minnesota Ramsey Mpls/StP/Bloom
(b) Workers age 25-34
.91
1.1
1.2
1.3
Rea
l Wag
e [2
015(
Q1)
=1]
2001 2006 2011 2016
Minnesota Ramsey Mpls/StP/Bloom
(c) Workers age 35-44
.91
1.1
1.2
1.3
Rea
l Wag
e [2
015(
Q1)
=1]
2001 2006 2011 2016
Minnesota Ramsey Mpls/StP/Bloom
(d) Workers age 55-64
Figure 11: Real Wage Index across Age Groups, 2015(1) = 1
different characteristics. In Figure 10, we present wage trends across workers with different
education levels for the state of Minnesota; Ramsey County; and the combined metro of
Minneapolis, Saint Paul, and Bloomington. After a decade of stable or declining real wage,
non-college educated workers have experienced the highest wage growth in the 2010s. Workers
with a college degree have experienced more modest gains.
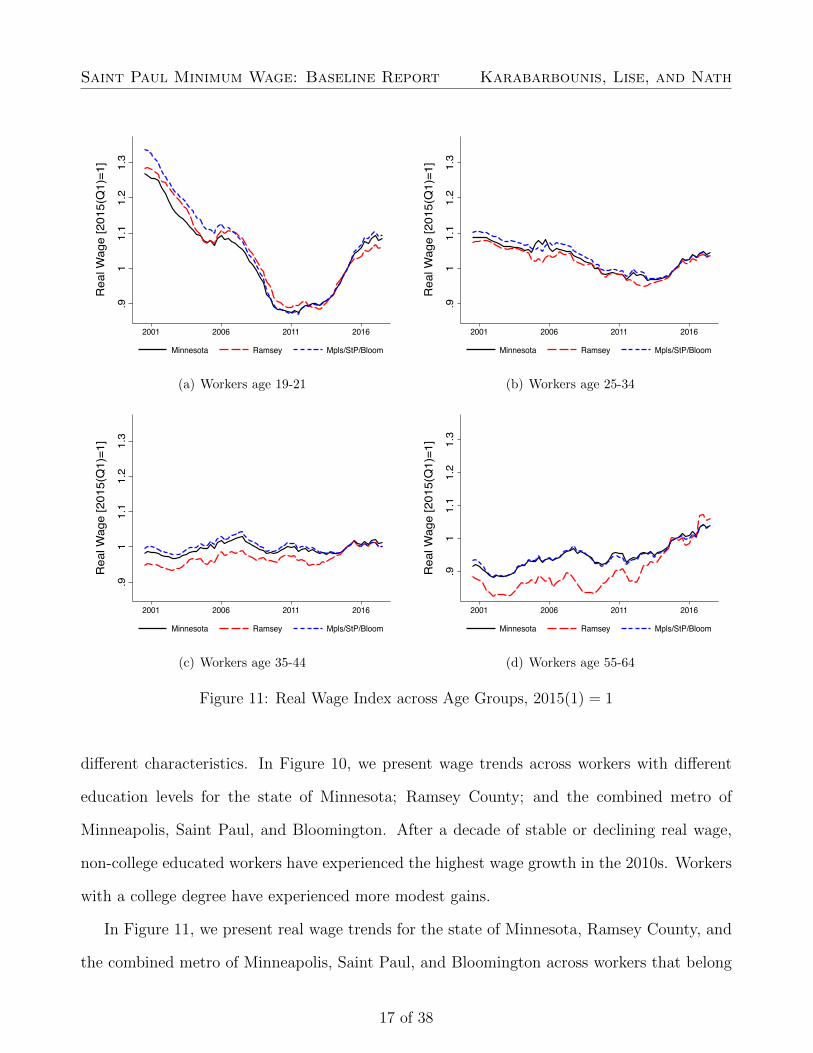
In Figure 11, we present real wage trends for the state of Minnesota, Ramsey County, and
the combined metro of Minneapolis, Saint Paul, and Bloomington across workers that belong
17 of 38
Saint Paul Minimum Wage: Baseline Report Karabarbounis, Lise, and Nath
.8.9
11.
11.
2
Rea
l Wag
e [2
015(
Q1)
=1]
2001 2006 2011 2016
Minnesota Ramsey Mpls/StP/Bloom
(a) White
.8.9
11.
11.
2
Rea
l Wag
e [2
015(
Q1)
=1]
2001 2006 2011 2016
Minnesota Ramsey Mpls/StP/Bloom
(b) Black or African-American
.8.9
11.
11.
2
Rea
l Wag
e [2
015(
Q1)
=1]
2001 2006 2011 2016
Minnesota Ramsey Mpls/StP/Bloom
(c) Asian
.8.9
11.
11.
2
Rea
l Wag
e [2
015(
Q1)
=1]
2001 2006 2011 2016
Minnesota Ramsey Mpls/StP/Bloom
(d) Hispanic or Latino
Figure 12: Real Wage Index across Racial and Ethnic Groups, 2015(1) = 1
to different age groups. Mirroring their employment trends, younger groups of workers (in
the upper panels) experienced significant declines in their wages in the 2000s. At the same
time, older workers (in the bottom right panel) have experienced increasing real wages over
the entire sample period.
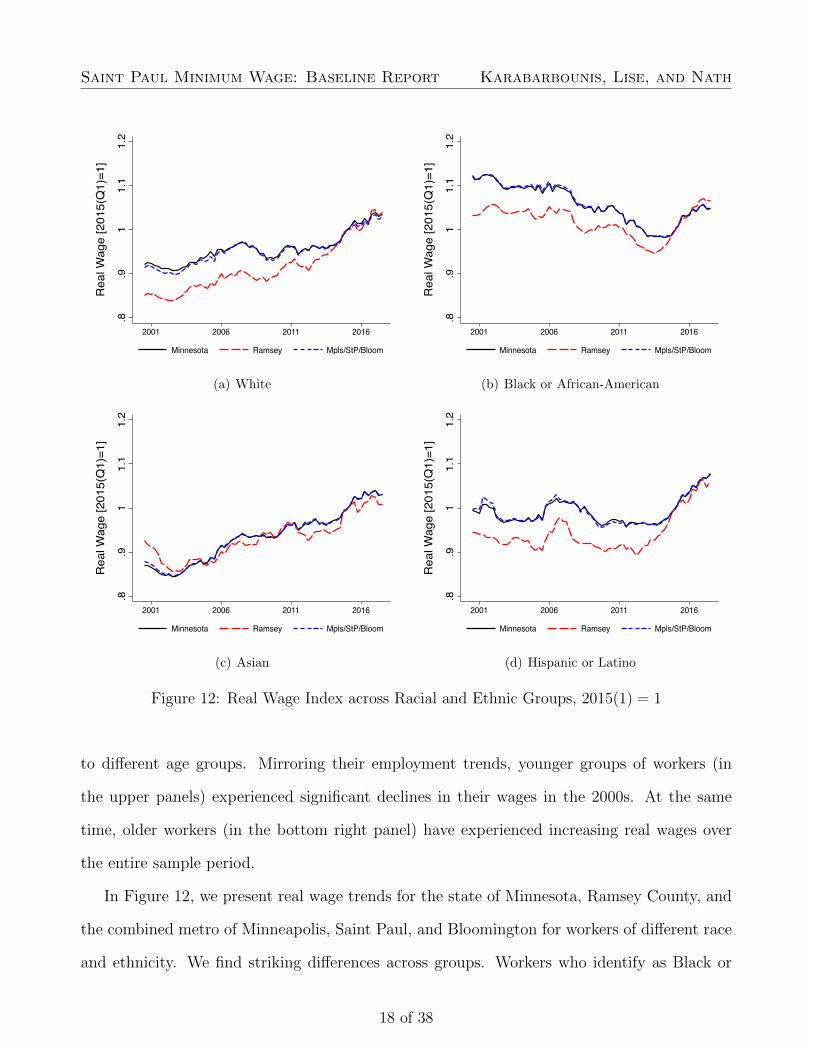
In Figure 12, we present real wage trends for the state of Minnesota, Ramsey County, and
the combined metro of Minneapolis, Saint Paul, and Bloomington for workers of different race
and ethnicity. We find striking differences across groups. Workers who identify as Black or
18 of 38

Saint Paul Minimum Wage: Baseline Report Karabarbounis, Lise, and Nath
African-American experienced a roughly 12 percent decline in their real wage between 2001 and
2015, followed by a modest recovery in the last few years of the sample.12 The evolution of their
wages contrasts sharply with the significant employment gains of these workers (previously
shown in Figure 6). Workers who identify as Latino or Hispanic experienced relatively stable
real wages over time. By contrast, workers who identify as White experienced a roughly 12
percent increase in their real wage, and workers who identify as Asian experienced a roughly
17 percent increase in their real wage over our sample period.
We conclude this section by providing further distributional analyses of wages and earn-
ings, using data from the American Community Survey (ACS) for 2017. The ACS is a large
nationally representative survey of households conducted by the U.S. Census Bureau. It con-
tains information on household demographics, employment outcomes, and other socioeconomic
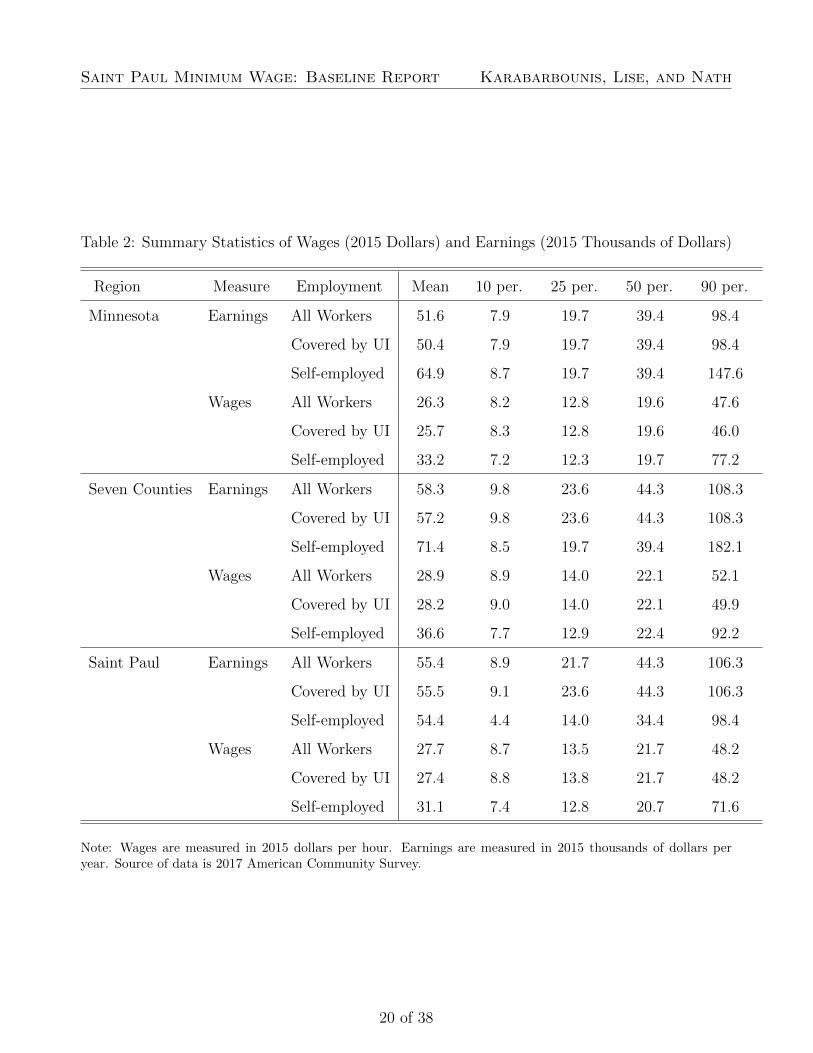
outcomes. In Table 2, we present summary statistics of wages and earnings for workers in Min-
nesota, the seven county region, and the city of Saint Paul.
Our analysis splits all workers into those covered under the unemployment insurance pro-
gram and those who are not. We define workers covered under the unemployment insurance
program as those workers who are classified in the ACS as employees of private companies or
individuals and employees of the local, state, and federal government. Our measure of wages
for covered workers is wages or salary income in the past 12 months divided by usual hours
worked per week in the past 12 months times weeks worked during the past 12 months.13 For
the purposes of these statistics, we define workers uncovered under the unemployment insur-
ance program as those workers who are classified in the ACS as self-employed. To calculate
their wage, we use personal earnings instead of wages and salaries.
12Daly, Hobijn, and Pedtke (2017) document the increase of the wage gap between Black and White workersin the United States between 1979 and 2016. They also document that this gap persists even after conditioningon age, education, industry and occupation, state of residence, and part-time job status. Wilson and Rodgers(2016) reach broadly similar conclusions and discuss the roles of declining unionization, incarceration rates, andanti-discrimination laws.
13The weeks worked variable in the ACS comes only at bins (e.g. 50 to 52 weeks). We use the (rounded) midpointof each bin to construct wages. While measurement error from assigning the midpoint could be concerning, wenote the similarity of our conclusions using either the distribution of wages or the distribution of earnings.
19 of 38
Saint Paul Minimum Wage: Baseline Report Karabarbounis, Lise, and Nath
Table 2: Summary Statistics of Wages (2015 Dollars) and Earnings (2015 Thousands of Dollars)
Region Measure Employment Mean 10 per. 25 per. 50 per. 90 per.
Minnesota Earnings All Workers 51.6 7.9 19.7 39.4 98.4
Covered by UI 50.4 7.9 19.7 39.4 98.4
Self-employed 64.9 8.7 19.7 39.4 147.6
Wages All Workers 26.3 8.2 12.8 19.6 47.6
Covered by UI 25.7 8.3 12.8 19.6 46.0
Self-employed 33.2 7.2 12.3 19.7 77.2
Seven Counties Earnings All Workers 58.3 9.8 23.6 44.3 108.3
Covered by UI 57.2 9.8 23.6 44.3 108.3
Self-employed 71.4 8.5 19.7 39.4 182.1
Wages All Workers 28.9 8.9 14.0 22.1 52.1
Covered by UI 28.2 9.0 14.0 22.1 49.9
Self-employed 36.6 7.7 12.9 22.4 92.2
Saint Paul Earnings All Workers 55.4 8.9 21.7 44.3 106.3
Covered by UI 55.5 9.1 23.6 44.3 106.3
Self-employed 54.4 4.4 14.0 34.4 98.4
Wages All Workers 27.7 8.7 13.5 21.7 48.2
Covered by UI 27.4 8.8 13.8 21.7 48.2
Self-employed 31.1 7.4 12.8 20.7 71.6
Note: Wages are measured in 2015 dollars per hour. Earnings are measured in 2015 thousands of dollars peryear. Source of data is 2017 American Community Survey.
20 of 38
Saint Paul Minimum Wage: Baseline Report Karabarbounis, Lise, and Nath
We summarize important takeaways from the statistics in Table 2. In Minnesota and the
seven counties, mean wages and earnings for covered employees are lower than mean wages
and earnings of the self-employed. In Saint Paul, however, while covered employees have lower
mean wages than self-employed workers, they have higher mean earnings than those of the self-
employed. In all regions, the wages and earnings of the self-employed are more dispersed. For
example, while the 10th percentile of the wage distribution in Saint Paul is roughly 8 dollars
for both types of workers, the 90th percentile is roughly 72 dollars for the self-employed and
48 dollars for covered employees. Comparing across regions, we see that Saint Paul’s wages
for covered employees are on average lower than wages for the seven counties but higher than
those for the state of Minnesota as a whole.
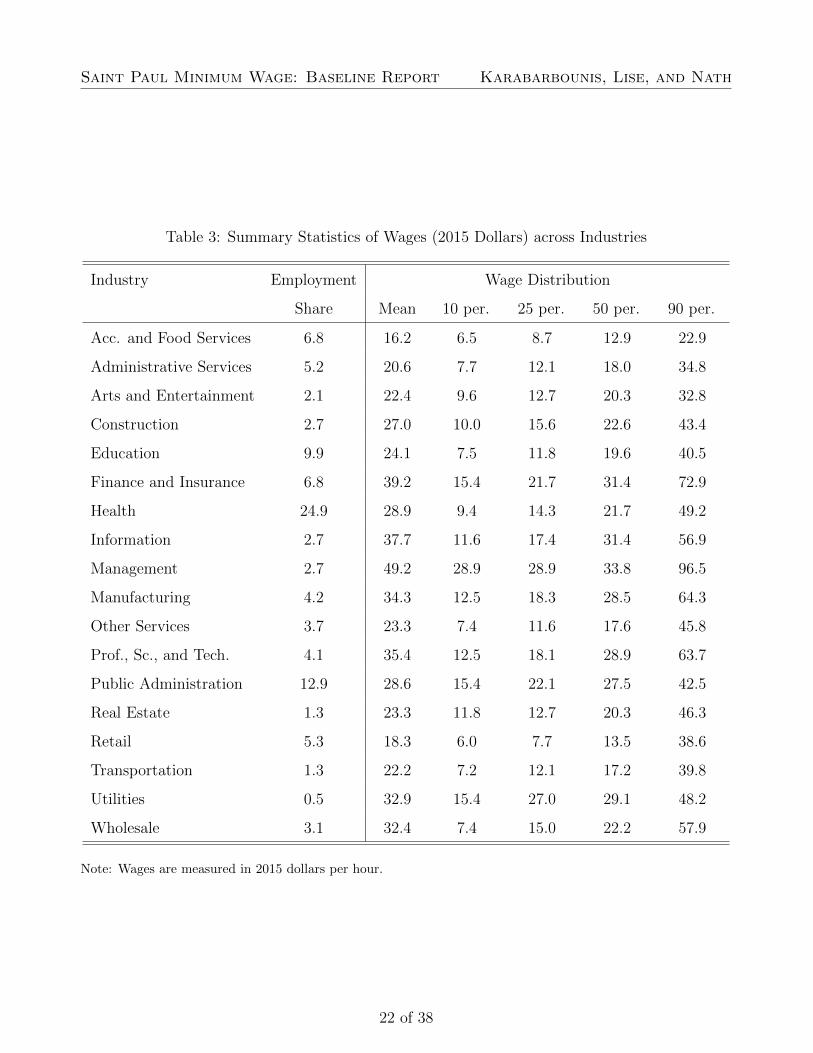
Table 3 presents summary statistics of wages for all workers across industries in Saint
Paul during 2017. Mean wages are lowest for accommodation and food services industry
at 16.2 dollars per hour. The retail industry has the second lowest wages per hour at 18.3
dollars. Comparing these two low wage industries, we see that wages are less dispersed in
the accommodation and food services industry than in the retail industry. While the 10th
percentile wage rate for both industries is around 6 dollars, the 90th percentile is 23 dollars
for the former and about 39 dollars for the latter.
2.4 Turnover Rates
In this section, we analyze turnover rates at the industry and worker level, using data from the
QWI. Turnover is the rate at which stable jobs begin and end. It is calculated by summing the
number of stable hires in the reference quarter and stable separations in the next quarter and
then dividing this sum by the average full-quarter employment. The QWI defines stable hires
as the workers who started a job that lasted at least one full quarter with a given employer.
It defines stable separations as the workers who had a job for at least a full quarter and then
were separated from the job.
21 of 38
Saint Paul Minimum Wage: Baseline Report Karabarbounis, Lise, and Nath
Table 3: Summary Statistics of Wages (2015 Dollars) across Industries
Industry Employment Wage Distribution
Share Mean 10 per. 25 per. 50 per. 90 per.
Acc. and Food Services 6.8 16.2 6.5 8.7 12.9 22.9
Administrative Services 5.2 20.6 7.7 12.1 18.0 34.8
Arts and Entertainment 2.1 22.4 9.6 12.7 20.3 32.8
Construction 2.7 27.0 10.0 15.6 22.6 43.4
Education 9.9 24.1 7.5 11.8 19.6 40.5
Finance and Insurance 6.8 39.2 15.4 21.7 31.4 72.9
Health 24.9 28.9 9.4 14.3 21.7 49.2
Information 2.7 37.7 11.6 17.4 31.4 56.9
Management 2.7 49.2 28.9 28.9 33.8 96.5
Manufacturing 4.2 34.3 12.5 18.3 28.5 64.3
Other Services 3.7 23.3 7.4 11.6 17.6 45.8
Prof., Sc., and Tech. 4.1 35.4 12.5 18.1 28.9 63.7
Public Administration 12.9 28.6 15.4 22.1 27.5 42.5
Real Estate 1.3 23.3 11.8 12.7 20.3 46.3
Retail 5.3 18.3 6.0 7.7 13.5 38.6
Transportation 1.3 22.2 7.2 12.1 17.2 39.8
Utilities 0.5 32.9 15.4 27.0 29.1 48.2
Wholesale 3.1 32.4 7.4 15.0 22.2 57.9
Note: Wages are measured in 2015 dollars per hour.
22 of 38
Saint Paul Minimum Wage: Baseline Report Karabarbounis, Lise, and Nath
.05
.1.15
.2
Turnover
2001 2006 2011 2016
Minnesota Ramsey Mpls/StP/Bloom
(a) Total Private
.05
.1.15
.2
Turnover
2001 2006 2011 2016
Minnesota Ramsey Mpls/StP/Bloom
(b) Health
.05
.1.15
.2
Turnover
2001 2006 2011 2016
Minnesota Ramsey Mpls/StP/Bloom
(c) Accommodation and Food
.05
.1.15
.2
Turnover
2001 2006 2011 2016
Minnesota Ramsey Mpls/StP/Bloom
(d) Retail
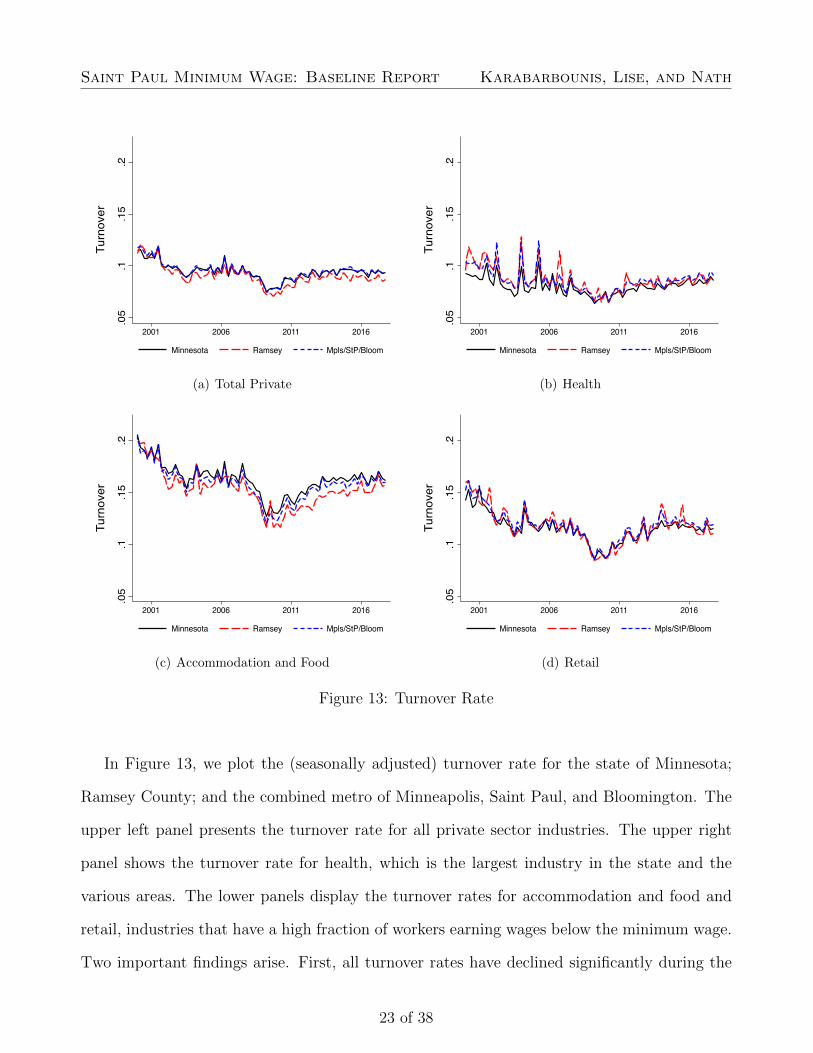
Figure 13: Turnover Rate
In Figure 13, we plot the (seasonally adjusted) turnover rate for the state of Minnesota;
Ramsey County; and the combined metro of Minneapolis, Saint Paul, and Bloomington. The
upper left panel presents the turnover rate for all private sector industries. The upper right
panel shows the turnover rate for health, which is the largest industry in the state and the
various areas. The lower panels display the turnover rates for accommodation and food and
retail, industries that have a high fraction of workers earning wages below the minimum wage.
Two important findings arise. First, all turnover rates have declined significantly during the
23 of 38
Saint Paul Minimum Wage: Baseline Report Karabarbounis, Lise, and Nath
2000s and only slightly recovered since then. These trends in Minnesota parallel the decline
in turnover at the national level.14 Second, industries affected significantly by the minimum
wage, such as accommodation and food and retail, have significantly higher turnover rates
than the rest of the economy.
Figure 14 shows trends in turnover rates across workers with different levels of educational
attainment. We note that all groups have experienced declines in their turnover rate during
the 2000s that mirror the decline found for the aggregate economy. In terms of differences
across groups, Figure 14 shows that workers with less than a high school diploma have higher
turnover rate levels than all other groups.
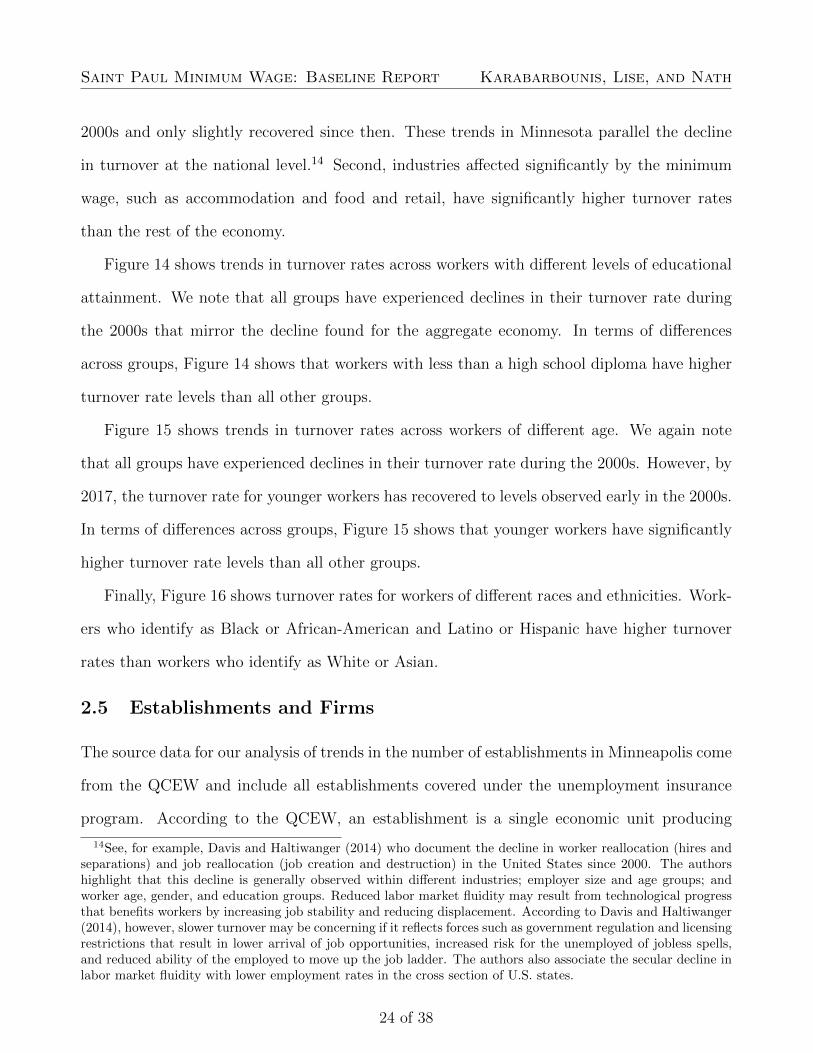
Figure 15 shows trends in turnover rates across workers of different age. We again note
that all groups have experienced declines in their turnover rate during the 2000s. However, by
2017, the turnover rate for younger workers has recovered to levels observed early in the 2000s.
In terms of differences across groups, Figure 15 shows that younger workers have significantly
higher turnover rate levels than all other groups.
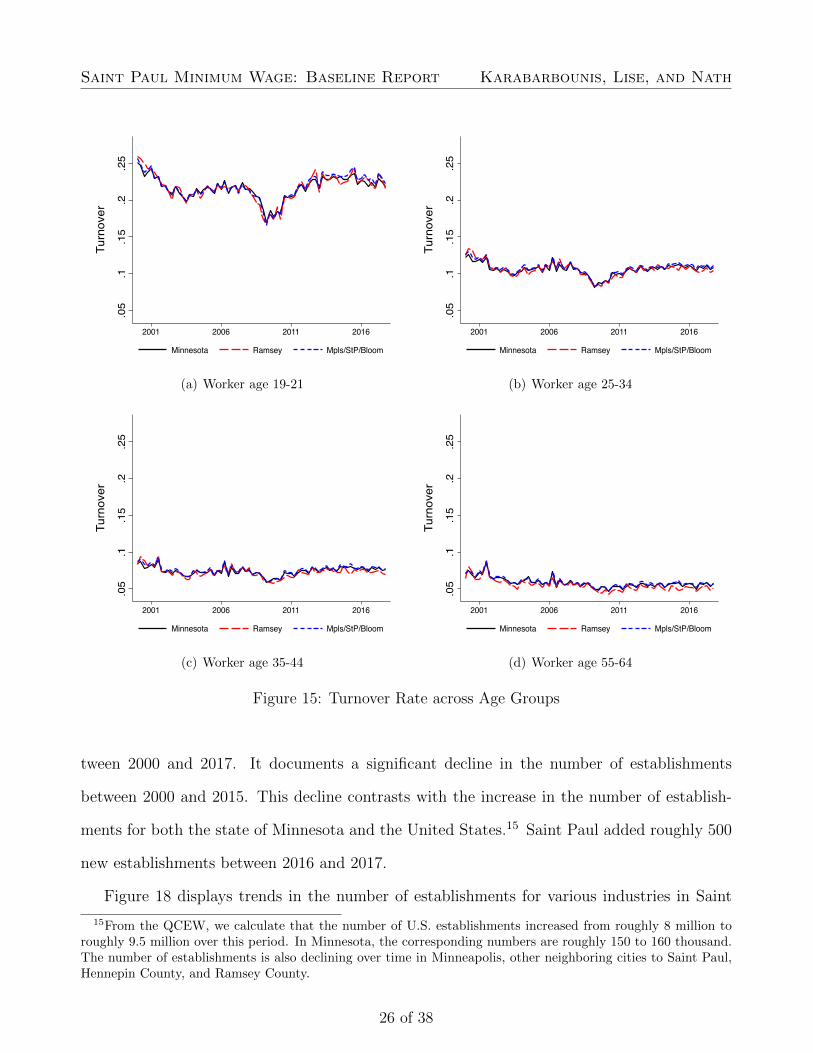
Finally, Figure 16 shows turnover rates for workers of different races and ethnicities. Work-
ers who identify as Black or African-American and Latino or Hispanic have higher turnover
rates than workers who identify as White or Asian.
2.5 Establishments and Firms
The source data for our analysis of trends in the number of establishments in Minneapolis come
from the QCEW and include all establishments covered under the unemployment insurance
program. According to the QCEW, an establishment is a single economic unit producing
14See, for example, Davis and Haltiwanger (2014) who document the decline in worker reallocation (hires andseparations) and job reallocation (job creation and destruction) in the United States since 2000. The authorshighlight that this decline is generally observed within different industries; employer size and age groups; andworker age, gender, and education groups. Reduced labor market fluidity may result from technological progressthat benefits workers by increasing job stability and reducing displacement. According to Davis and Haltiwanger(2014), however, slower turnover may be concerning if it reflects forces such as government regulation and licensingrestrictions that result in lower arrival of job opportunities, increased risk for the unemployed of jobless spells,and reduced ability of the employed to move up the job ladder. The authors also associate the secular decline inlabor market fluidity with lower employment rates in the cross section of U.S. states.
24 of 38

Saint Paul Minimum Wage: Baseline Report Karabarbounis, Lise, and Nath
.06
.08
.1.12
.14
Turnover
2001 2006 2011 2016
Minnesota Ramsey Mpls/StP/Bloom
(a) Less than high school
.06
.08
.1.12
.14
Turnover
2001 2006 2011 2016
Minnesota Ramsey Mpls/StP/Bloom
(b) High school
.06
.08
.1.12
.14
Turnover
2001 2006 2011 2016
Minnesota Ramsey Mpls/StP/Bloom
(c) Some college
.06
.08
.1.12
.14
Turnover
2001 2006 2011 2016
Minnesota Ramsey Mpls/StP/Bloom
(d) College or more
Figure 14: Turnover Rate across Education Groups
goods or services; located in one physical location; and engaged in one, or predominantly one,
type of economic activity. This definition contrasts with the definition of a firm or a company
that allows for one or more establishments, with each establishment potentially engaged in
different types of economic activity. The QCEW aims to increase the amount of data reported
at the establishment level and reports only the predominant economic activity in classifying
the industry of an establishment.
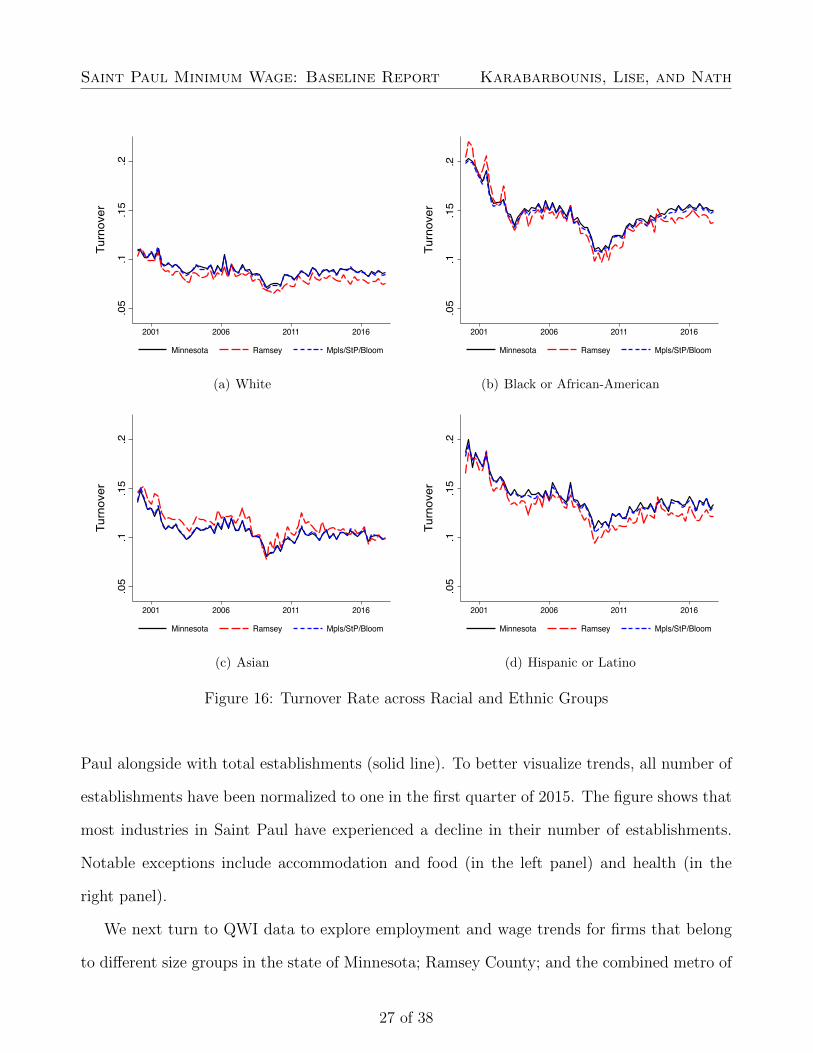
Figure 17 presents the (seasonally adjusted) number of establishments in Saint Paul be-
25 of 38
Saint Paul Minimum Wage: Baseline Report Karabarbounis, Lise, and Nath
.05
.1.15
.2.25
Turnover
2001 2006 2011 2016
Minnesota Ramsey Mpls/StP/Bloom
(a) Worker age 19-21
.05
.1.15
.2.25
Turnover
2001 2006 2011 2016
Minnesota Ramsey Mpls/StP/Bloom
(b) Worker age 25-34
.05
.1.15
.2.25
Turnover
2001 2006 2011 2016
Minnesota Ramsey Mpls/StP/Bloom
(c) Worker age 35-44
.05
.1.15
.2.25
Turnover
2001 2006 2011 2016
Minnesota Ramsey Mpls/StP/Bloom
(d) Worker age 55-64
Figure 15: Turnover Rate across Age Groups
tween 2000 and 2017. It documents a significant decline in the number of establishments
between 2000 and 2015. This decline contrasts with the increase in the number of establish-
ments for both the state of Minnesota and the United States.15 Saint Paul added roughly 500
new establishments between 2016 and 2017.
Figure 18 displays trends in the number of establishments for various industries in Saint
15From the QCEW, we calculate that the number of U.S. establishments increased from roughly 8 million toroughly 9.5 million over this period. In Minnesota, the corresponding numbers are roughly 150 to 160 thousand.The number of establishments is also declining over time in Minneapolis, other neighboring cities to Saint Paul,Hennepin County, and Ramsey County.
26 of 38
Saint Paul Minimum Wage: Baseline Report Karabarbounis, Lise, and Nath
.05
.1.15
.2
Turnover
2001 2006 2011 2016
Minnesota Ramsey Mpls/StP/Bloom
(a) White
.05
.1.15
.2
Turnover
2001 2006 2011 2016
Minnesota Ramsey Mpls/StP/Bloom
(b) Black or African-American
.05
.1.15
.2
Turnover
2001 2006 2011 2016
Minnesota Ramsey Mpls/StP/Bloom
(c) Asian
.05
.1.15
.2
Turnover
2001 2006 2011 2016
Minnesota Ramsey Mpls/StP/Bloom
(d) Hispanic or Latino
Figure 16: Turnover Rate across Racial and Ethnic Groups
Paul alongside with total establishments (solid line). To better visualize trends, all number of
establishments have been normalized to one in the first quarter of 2015. The figure shows that
most industries in Saint Paul have experienced a decline in their number of establishments.
Notable exceptions include accommodation and food (in the left panel) and health (in the
right panel).
We next turn to QWI data to explore employment and wage trends for firms that belong
to different size groups in the state of Minnesota; Ramsey County; and the combined metro of
27 of 38
Saint Paul Minimum Wage: Baseline Report Karabarbounis, Lise, and Nath
6500
7000
7500
8000
8500
Tota
l Est
ablis
hmen
ts
2001 2006 2011 2016
Figure 17: Establishments in Saint Paul
.81
1.2
1.4
1.6
Est
ablis
hmen
ts [2
015(
Q1)
=1]
2001 2006 2011 2016
Total Construction ManufactutingWholesale Retail Acc. and Food
.81
1.2
1.4
1.6
Est
ablis
hmen
ts [2
015(
Q1)
=1]
2001 2006 2011 2016
Total Information FinanceProf. Services Education Health
Figure 18: Establishments Index in Saint Paul across Industries, 2015(1) = 1
Bloomington, Minneapolis, and Saint Paul. For these analyses, we focus only on the private
sector, since size is reported only for private sector firms. Firm size is defined using employment
in March 12 of the previous year at the national level rather than the state level, and therefore
a national firm often is larger than the part of that firm found in the state. We note that
28 of 38
Saint Paul Minimum Wage: Baseline Report Karabarbounis, Lise, and Nath
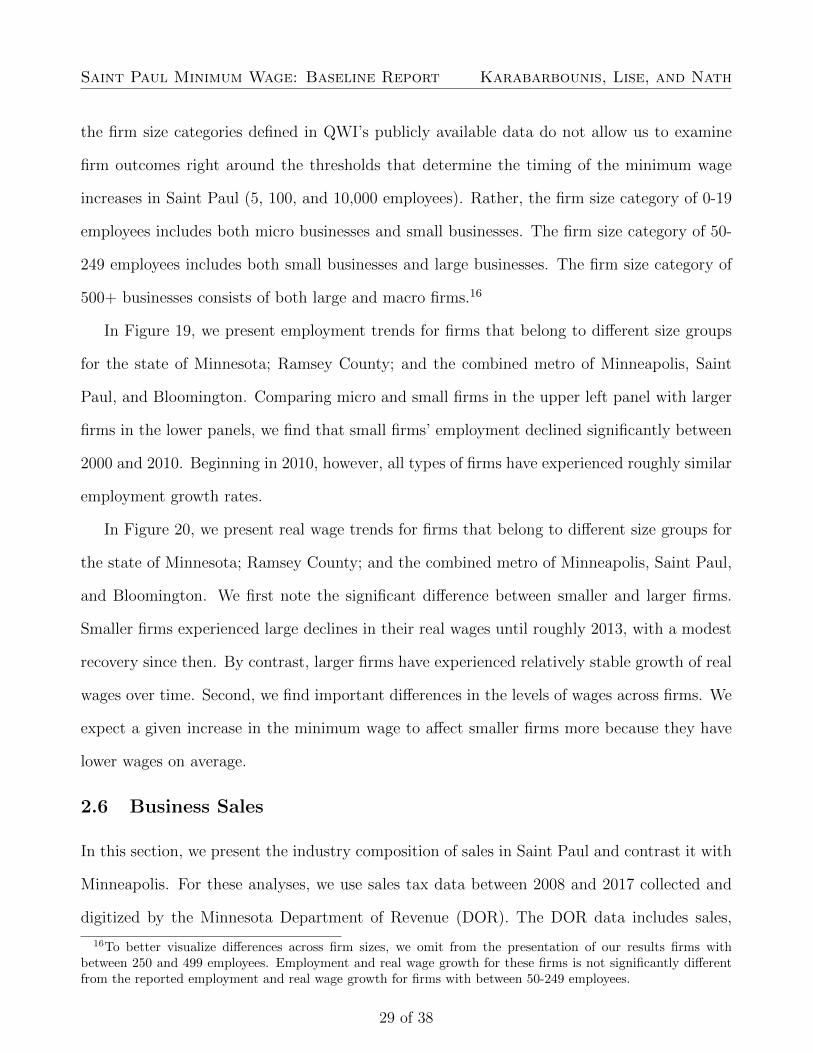
the firm size categories defined in QWI’s publicly available data do not allow us to examine
firm outcomes right around the thresholds that determine the timing of the minimum wage
increases in Saint Paul (5, 100, and 10,000 employees). Rather, the firm size category of 0-19
employees includes both micro businesses and small businesses. The firm size category of 50-
249 employees includes both small businesses and large businesses. The firm size category of
500+ businesses consists of both large and macro firms.16
In Figure 19, we present employment trends for firms that belong to different size groups
for the state of Minnesota; Ramsey County; and the combined metro of Minneapolis, Saint
Paul, and Bloomington. Comparing micro and small firms in the upper left panel with larger
firms in the lower panels, we find that small firms’ employment declined significantly between
2000 and 2010. Beginning in 2010, however, all types of firms have experienced roughly similar
employment growth rates.
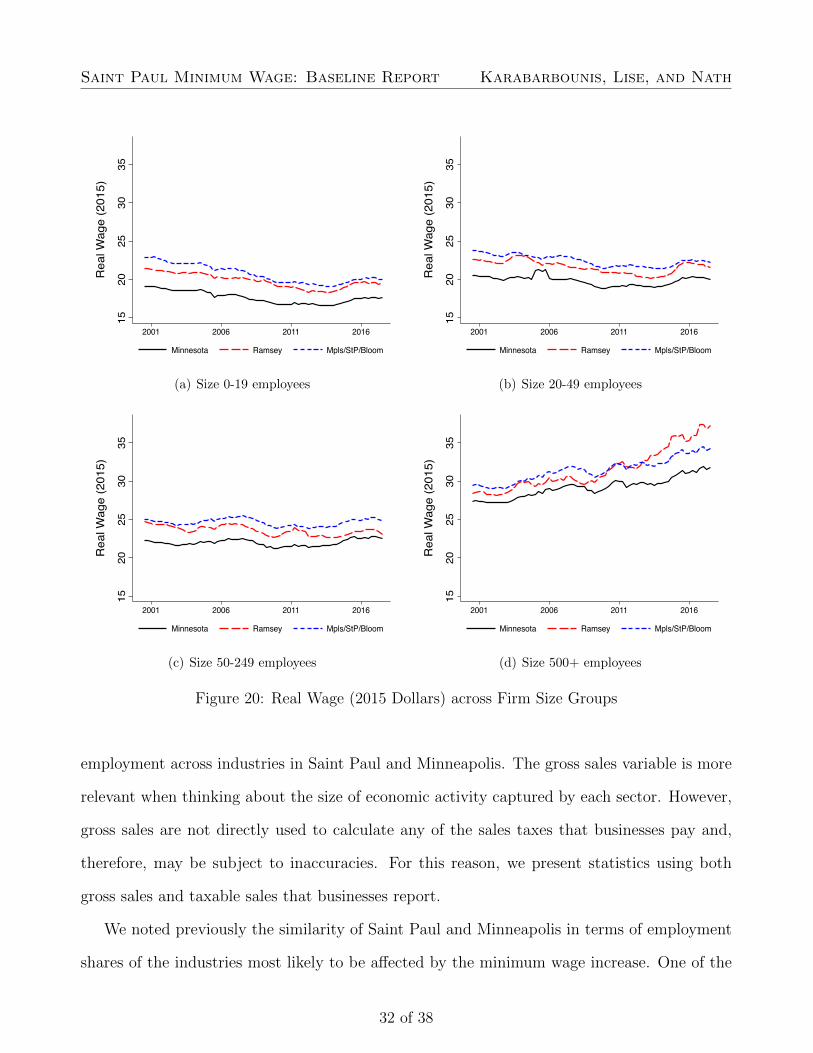
In Figure 20, we present real wage trends for firms that belong to different size groups for
the state of Minnesota; Ramsey County; and the combined metro of Minneapolis, Saint Paul,
and Bloomington. We first note the significant difference between smaller and larger firms.
Smaller firms experienced large declines in their real wages until roughly 2013, with a modest
recovery since then. By contrast, larger firms have experienced relatively stable growth of real
wages over time. Second, we find important differences in the levels of wages across firms. We
expect a given increase in the minimum wage to affect smaller firms more because they have
lower wages on average.
2.6 Business Sales
In this section, we present the industry composition of sales in Saint Paul and contrast it with
Minneapolis. For these analyses, we use sales tax data between 2008 and 2017 collected and
digitized by the Minnesota Department of Revenue (DOR). The DOR data includes sales,
16To better visualize differences across firm sizes, we omit from the presentation of our results firms withbetween 250 and 499 employees. Employment and real wage growth for these firms is not significantly differentfrom the reported employment and real wage growth for firms with between 50-249 employees.
29 of 38

Saint Paul Minimum Wage: Baseline Report Karabarbounis, Lise, and Nath
.85
.9.9
51
1.05
Empl
oym
ent [
2015
(Q1)
=1]
2001 2006 2011 2016
Minnesota Ramsey Mpls/StP/Bloom
(a) Size 0-19 employees
.85
.9.9
51
1.05
Empl
oym
ent [
2015
(Q1)
=1]
2001 2006 2011 2016
Minnesota Ramsey Mpls/StP/Bloom
(b) Size 20-49 employees
.85
.9.9
51
1.05
Empl
oym
ent [
2015
(Q1)
=1]
2001 2006 2011 2016
Minnesota Ramsey Mpls/StP/Bloom
(c) Size 50-249 employees
.85
.9.9
51
1.05
Empl
oym
ent [
2015
(Q1)
=1]
2001 2006 2011 2016
Minnesota Ramsey Mpls/StP/Bloom
(d) Size 500+ employees
Figure 19: Employment Index across Firm Size Groups, 2015(1) = 1
taxable sales, and sales and use taxes from tax returns and business registration information
received from tax filers. Sales tax on motor vehicle sales is not included in the DOR statistics.
Businesses that are not required to file sales or use tax returns or filing zero amounts are not
included in the statistics. While most businesses with more than one location file a consolidated
return, they list their sales and taxes separately for each of their locations. Therefore, each
location counts separately in the statistics, and the data are available at the city level.
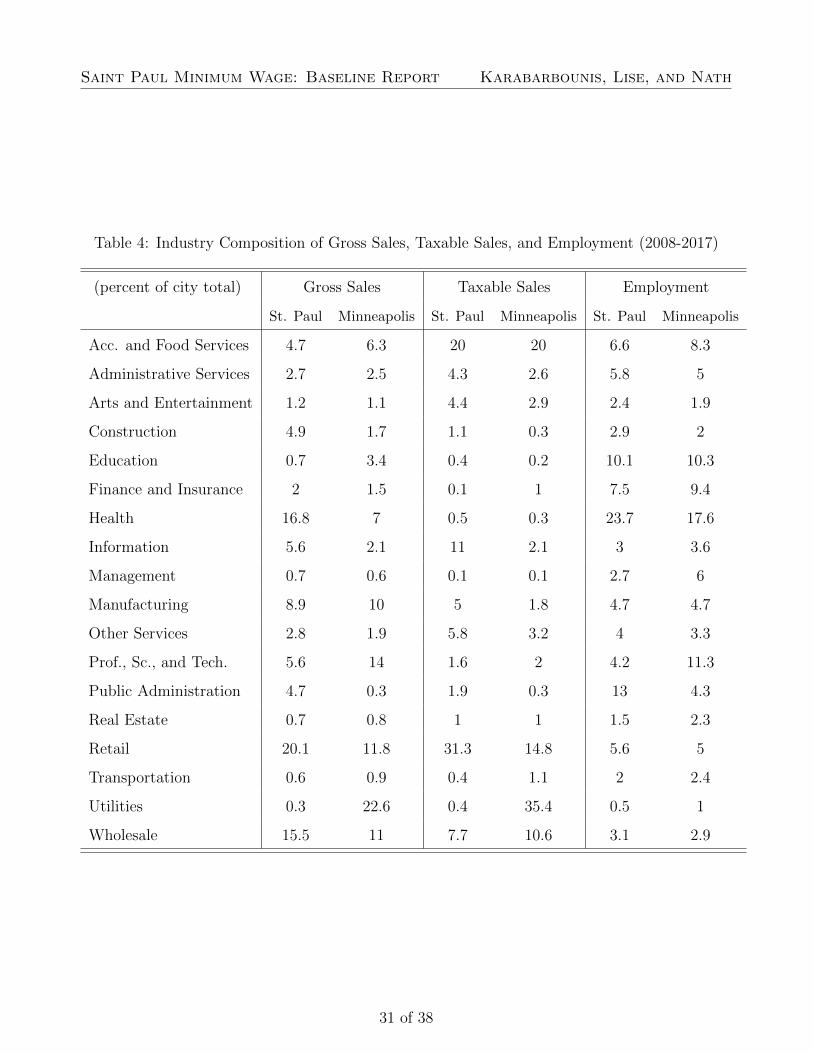
In Table 4, we present summary statistics of the fraction of gross sales, taxable sales, and
30 of 38
Saint Paul Minimum Wage: Baseline Report Karabarbounis, Lise, and Nath
Table 4: Industry Composition of Gross Sales, Taxable Sales, and Employment (2008-2017)
(percent of city total) Gross Sales Taxable Sales Employment
St. Paul Minneapolis St. Paul Minneapolis St. Paul Minneapolis
Acc. and Food Services 4.7 6.3 20 20 6.6 8.3
Administrative Services 2.7 2.5 4.3 2.6 5.8 5
Arts and Entertainment 1.2 1.1 4.4 2.9 2.4 1.9
Construction 4.9 1.7 1.1 0.3 2.9 2
Education 0.7 3.4 0.4 0.2 10.1 10.3
Finance and Insurance 2 1.5 0.1 1 7.5 9.4
Health 16.8 7 0.5 0.3 23.7 17.6
Information 5.6 2.1 11 2.1 3 3.6
Management 0.7 0.6 0.1 0.1 2.7 6
Manufacturing 8.9 10 5 1.8 4.7 4.7
Other Services 2.8 1.9 5.8 3.2 4 3.3
Prof., Sc., and Tech. 5.6 14 1.6 2 4.2 11.3
Public Administration 4.7 0.3 1.9 0.3 13 4.3
Real Estate 0.7 0.8 1 1 1.5 2.3
Retail 20.1 11.8 31.3 14.8 5.6 5
Transportation 0.6 0.9 0.4 1.1 2 2.4
Utilities 0.3 22.6 0.4 35.4 0.5 1
Wholesale 15.5 11 7.7 10.6 3.1 2.9
31 of 38
Saint Paul Minimum Wage: Baseline Report Karabarbounis, Lise, and Nath
1520
2530
35
Rea
l Wag
e (2
015)
2001 2006 2011 2016
Minnesota Ramsey Mpls/StP/Bloom
(a) Size 0-19 employees
1520
2530
35
Rea
l Wag
e (2
015)
2001 2006 2011 2016
Minnesota Ramsey Mpls/StP/Bloom
(b) Size 20-49 employees
1520
2530
35
Rea
l Wag
e (2
015)
2001 2006 2011 2016
Minnesota Ramsey Mpls/StP/Bloom
(c) Size 50-249 employees
1520
2530
35
Rea
l Wag
e (2
015)
2001 2006 2011 2016
Minnesota Ramsey Mpls/StP/Bloom
(d) Size 500+ employees
Figure 20: Real Wage (2015 Dollars) across Firm Size Groups
employment across industries in Saint Paul and Minneapolis. The gross sales variable is more
relevant when thinking about the size of economic activity captured by each sector. However,
gross sales are not directly used to calculate any of the sales taxes that businesses pay and,
therefore, may be subject to inaccuracies. For this reason, we present statistics using both
gross sales and taxable sales that businesses report.
We noted previously the similarity of Saint Paul and Minneapolis in terms of employment
shares of the industries most likely to be affected by the minimum wage increase. One of the
32 of 38
Saint Paul Minimum Wage: Baseline Report Karabarbounis, Lise, and Nath
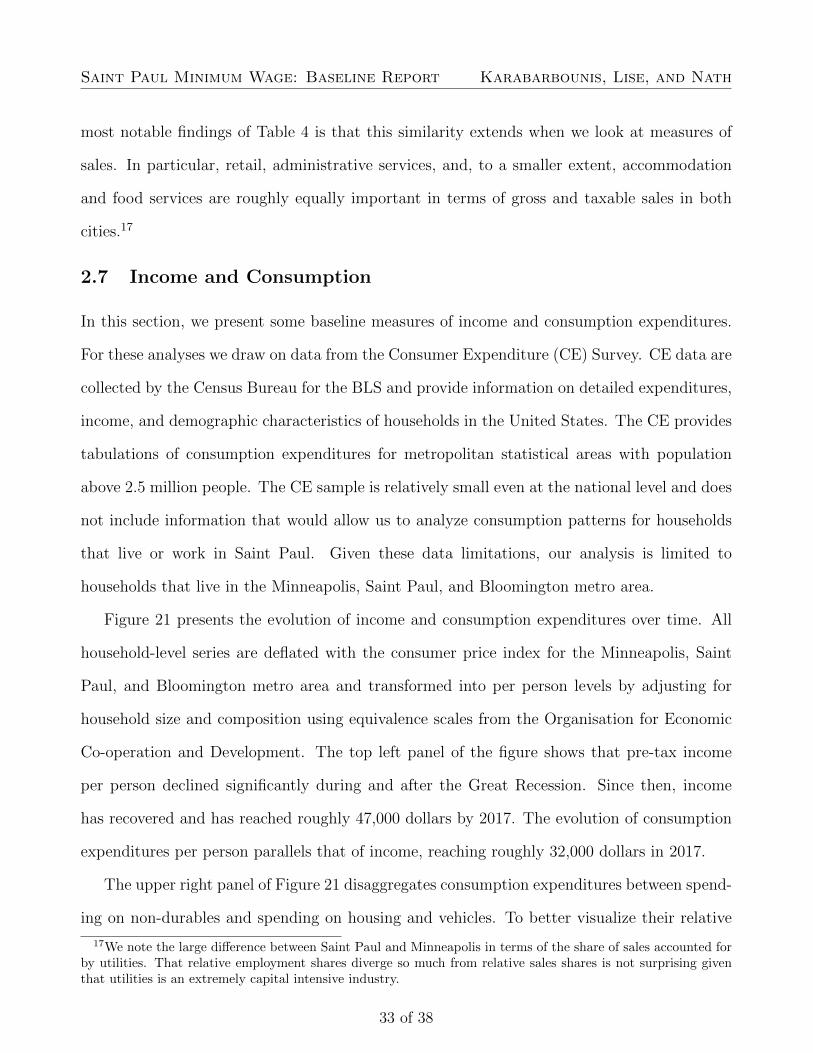
most notable findings of Table 4 is that this similarity extends when we look at measures of
sales. In particular, retail, administrative services, and, to a smaller extent, accommodation
and food services are roughly equally important in terms of gross and taxable sales in both
cities.17
2.7 Income and Consumption
In this section, we present some baseline measures of income and consumption expenditures.
For these analyses we draw on data from the Consumer Expenditure (CE) Survey. CE data are
collected by the Census Bureau for the BLS and provide information on detailed expenditures,
income, and demographic characteristics of households in the United States. The CE provides
tabulations of consumption expenditures for metropolitan statistical areas with population
above 2.5 million people. The CE sample is relatively small even at the national level and does
not include information that would allow us to analyze consumption patterns for households
that live or work in Saint Paul. Given these data limitations, our analysis is limited to
households that live in the Minneapolis, Saint Paul, and Bloomington metro area.
Figure 21 presents the evolution of income and consumption expenditures over time. All
household-level series are deflated with the consumer price index for the Minneapolis, Saint
Paul, and Bloomington metro area and transformed into per person levels by adjusting for
household size and composition using equivalence scales from the Organisation for Economic
Co-operation and Development. The top left panel of the figure shows that pre-tax income
per person declined significantly during and after the Great Recession. Since then, income
has recovered and has reached roughly 47,000 dollars by 2017. The evolution of consumption
expenditures per person parallels that of income, reaching roughly 32,000 dollars in 2017.
The upper right panel of Figure 21 disaggregates consumption expenditures between spend-
ing on non-durables and spending on housing and vehicles. To better visualize their relative
17We note the large difference between Saint Paul and Minneapolis in terms of the share of sales accounted forby utilities. That relative employment shares diverge so much from relative sales shares is not surprising giventhat utilities is an extremely capital intensive industry.
33 of 38

Saint Paul Minimum Wage: Baseline Report Karabarbounis, Lise, and Nath
2030
4050
60
Thou
sand
of 2
015
dolla
rs
2001 2006 2011 2016
Income Expenditures
.8.9
11.
11.
2Ex
pend
iture
s In
dex
[201
5=1]
2001 2006 2011 2016
Total Non-Durables Housing and Vehicles
.4.6
.81
1.2
Expe
nditu
res
Inde
x [2
015=
1]
2001 2006 2011 2016
Non-Durables Health/Educ No Health/Educ
.81
1.2
1.4
1.6
Expe
nditu
res
Inde
x [2
015=
1]
2001 2006 2011 2016
Non-Durables Food ApparelTransportation Entertainment Tobbaco/Alc.
Figure 21: Income and Spending (2015 Dollars) in Minneapolis - St. Paul - Bloomington
growth over time, expenditures are normalized to one in 2015. We note that the evolution
of non-durables and durables is similar over time. The bottom left panel separates expen-
ditures in health and education from other non-durable expenditures. We find that health
and educational expenditures have risen significantly over time, mirroring the rising employ-
ment importance of these sectors for both the local and the national economy. Finally, the
bottom right panel disaggregates the remaining non-durable expenditures into various subcat-
egories. Over time, residents of the metro area have shifted their consumption basket away
from apparel, tobacco, and alcohol.
34 of 38
Saint Paul Minimum Wage: Baseline Report Karabarbounis, Lise, and Nath
10
02
00
30
04
00
50
0
Nu
mb
er
of
Re
sta
ura
nts
2001 2006 2011 2016
Full Service Limited Service
(a) Saint Paul1
00
20
03
00
40
05
00
Nu
mb
er
of
Re
sta
ura
nts
2001 2006 2011 2016
Full Service Limited Service
(b) Minneapolis
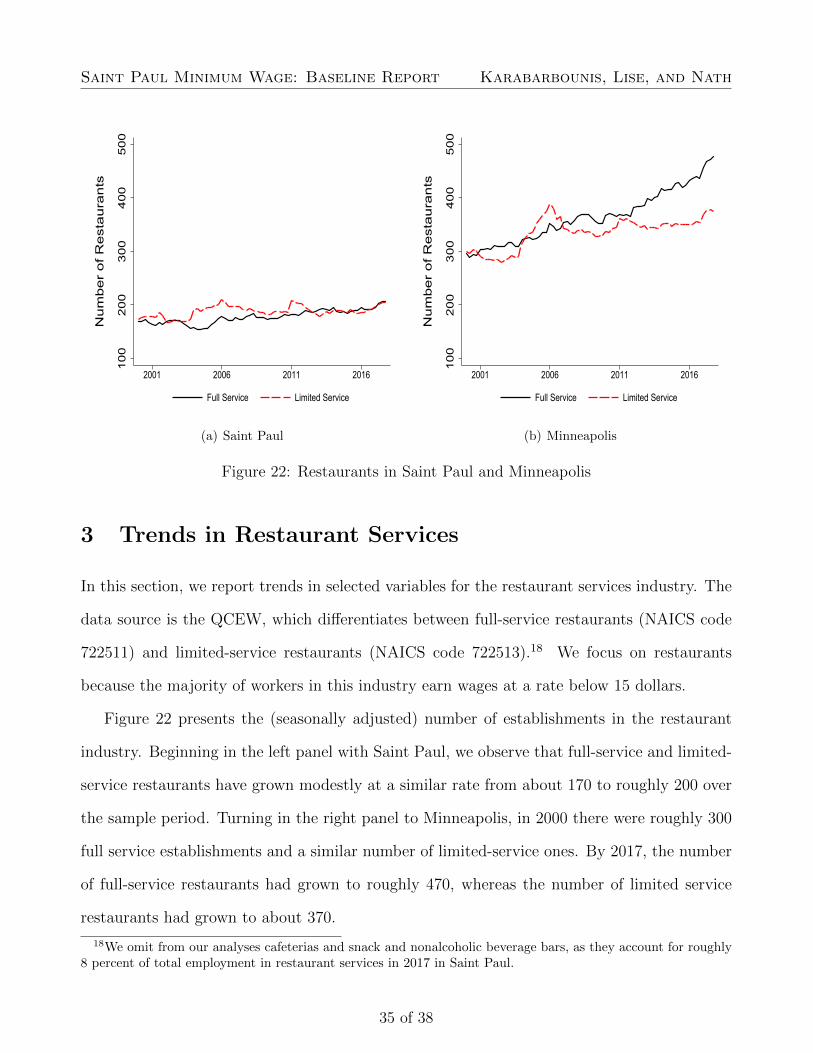
Figure 22: Restaurants in Saint Paul and Minneapolis
3 Trends in Restaurant Services
In this section, we report trends in selected variables for the restaurant services industry. The
data source is the QCEW, which differentiates between full-service restaurants (NAICS code
722511) and limited-service restaurants (NAICS code 722513).18 We focus on restaurants
because the majority of workers in this industry earn wages at a rate below 15 dollars.
Figure 22 presents the (seasonally adjusted) number of establishments in the restaurant
industry. Beginning in the left panel with Saint Paul, we observe that full-service and limited-
service restaurants have grown modestly at a similar rate from about 170 to roughly 200 over
the sample period. Turning in the right panel to Minneapolis, in 2000 there were roughly 300
full service establishments and a similar number of limited-service ones. By 2017, the number
of full-service restaurants had grown to roughly 470, whereas the number of limited service
restaurants had grown to about 370.
18We omit from our analyses cafeterias and snack and nonalcoholic beverage bars, as they account for roughly8 percent of total employment in restaurant services in 2017 in Saint Paul.
35 of 38

Saint Paul Minimum Wage: Baseline Report Karabarbounis, Lise, and Nath
25
81
11
4
Em
plo
yme
nt
in R
est
au
ran
ts
2001 2006 2011 2016
Full Service Limited Service
(a) Saint Paul2
58
11
14
Em
plo
yme
nt
in R
est
au
ran
ts
2001 2006 2011 2016
Full Service Limited Service
(b) Minneapolis
Figure 23: Employment (Thousands of Jobs) in Minneapolis and Saint Paul Restaurants
Figure 23 presents the (seasonally adjusted) number of jobs in the restaurant industry.
Mirroring the trends in the number of establishments, employment has grown at a roughly
similar rate for the two types of establishments in Saint Paul. In Minneapolis, employment in
full-service restaurants has grown faster over time than employment in limited-service restau-
rants.
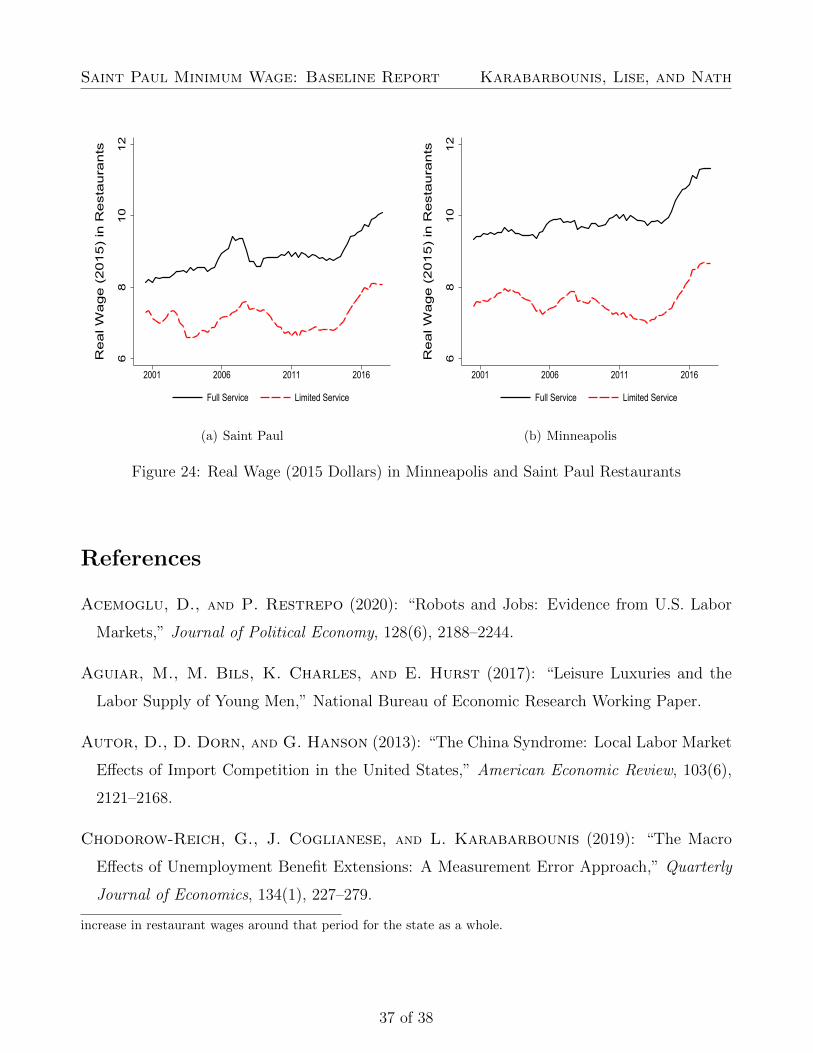
In Figure 24, we present the four-quarter moving average of real wages in the restaurant
industry.19 Wages in full-service restaurants are roughly 1 to 1.5 dollars higher than wages
in limited-service restaurants, so we expect the minimum wage to affect more the latter type
of establishments. We also note that wages in Minneapolis exceed wages in Saint Paul for
both types of establishments. Finally, wages in both cities and types of establishments have
increased substantially since 2014.20
19The QCEW aims to include non-wage cash payments, such as bonuses and tips, in its measure of wages.However, for workers in the restaurant industry, these components are likely to be underreported. Federal lawallows employers to count tips in applying the full minimum wage. Minnesota, however, prohibits employers fromcounting tips for purposes of either the state or federal minimum. The minimum wage increase in the city ofSaint Paul refers to the wage excluding tips.
20In 2014, the state of Minnesota increased its minimum wage above the federal level. We also observe an
36 of 38
Saint Paul Minimum Wage: Baseline Report Karabarbounis, Lise, and Nath
68
10
12
Re
al W
ag
e (
20
15
) in
Re
sta
ura
nts
2001 2006 2011 2016
Full Service Limited Service
(a) Saint Paul6
81
01
2
Re
al W
ag
e (
20
15
) in
Re
sta
ura
nts
2001 2006 2011 2016
Full Service Limited Service
(b) Minneapolis
Figure 24: Real Wage (2015 Dollars) in Minneapolis and Saint Paul Restaurants
References
Acemoglu, D., and P. Restrepo (2020): “Robots and Jobs: Evidence from U.S. Labor
Markets,” Journal of Political Economy, 128(6), 2188–2244.
Aguiar, M., M. Bils, K. Charles, and E. Hurst (2017): “Leisure Luxuries and the
Labor Supply of Young Men,” National Bureau of Economic Research Working Paper.
Autor, D., D. Dorn, and G. Hanson (2013): “The China Syndrome: Local Labor Market
Effects of Import Competition in the United States,” American Economic Review, 103(6),
2121–2168.
Chodorow-Reich, G., J. Coglianese, and L. Karabarbounis (2019): “The Macro
Effects of Unemployment Benefit Extensions: A Measurement Error Approach,” Quarterly
Journal of Economics, 134(1), 227–279.
increase in restaurant wages around that period for the state as a whole.
37 of 38
Saint Paul Minimum Wage: Baseline Report Karabarbounis, Lise, and Nath
Daly, M., B. Hobijn, and J. Pedtke (2017): “Disappointing Facts about the Black-White
Wage Gap,” Federal Reserve Bank of San Francisco Economic Letter.
Davis, S., and J. Haltiwanger (2014): “Labor Market Fluidity and Economic Perfor-
mance,” National Bureau of Economic Research Working Paper.
Wilson, V., and W. Rodgers (2016): “Black-White Wage Gaps Expand With Rising Wage
Inequality,” Economic Policy Institute Report.
38 of 38