The Round-the-Clock Market for U.S. Treasury Securities · The Round-the-Clock Market for U.S....
24
FRBNY ECONOMIC POLICY REVIEW / JULY 1997 9 The Round-the-Clock Market for U.S. Treasury Securities Michael J. Fleming he U.S. Treasury securities market is one of the most important financial markets in the world. Treasury bills, notes, and bonds are issued by the federal government in the pri- mary market to finance its budget deficits and meet its short-term cash-management needs. In the secondary mar- ket, the Federal Reserve System conducts monetary policy through open market purchases and sales of Treasury secu- rities. Because the securities are near-risk-free instruments, they also serve as a benchmark for pricing numerous other financial instruments. In addition, Treasury securities are used extensively for hedging, an application that improves the liquidity of other financial markets. The Treasury market is also one of the world’s largest and most liquid financial markets. Daily trading volume in the secondary market averages $125 billion. 1 Trading takes place overseas as well as in New York, resulting in a virtual round-the-clock market. Positions are bought and sold in seconds in an interdealer market, with trade sizes starting at $1 million for notes and bonds and $5 million for bills. Competition among dealers and interdealer bro- kers ensures narrow bid-ask spreads for most securities and minimal interdealer brokerage fees. Despite the Treasury market’s importance, size, and liquidity, there is little quantitative evidence on its intraday functioning. Intraday analysis of trading volume and the bid-ask spread is valuable, however, for ascertain- ing how market liquidity changes throughout the day. Such information is important to hedgers and other market participants who may need to trade at any moment and to investors who rely on a liquid Treasury market for the pric- ing of other securities or for tracking market sentiment. Intraday analysis of price volatility can also reveal when new information gets incorporated into prices and shed light on the determinants of Treasury prices. Finally, analysis of price behavior can be used to test the intraday efficiency of the Treasury market by determining, for example, whether overseas price changes reflect new information that is subsequently incorporated into prices in New York. This article provides the first detailed intraday T
Transcript of The Round-the-Clock Market for U.S. Treasury Securities · The Round-the-Clock Market for U.S....

FRBNY ECONOMIC POLICY REVIEW / JULY 1997 9
The Round-the-Clock Market for U.S. Treasury SecuritiesMichael J. Fleming
he U.S. Treasury securities market is one of
the most important financial markets in the
world. Treasury bills, notes, and bonds are
issued by the federal government in the pri-
mary market to finance its budget deficits and meet its
short-term cash-management needs. In the secondary mar-
ket, the Federal Reserve System conducts monetary policy
through open market purchases and sales of Treasury secu-
rities. Because the securities are near-risk-free instruments,
they also serve as a benchmark for pricing numerous other
financial instruments. In addition, Treasury securities are
used extensively for hedging, an application that improves
the liquidity of other financial markets.
The Treasury market is also one of the world’s
largest and most liquid financial markets. Daily trading
volume in the secondary market averages $125 billion.1
Trading takes place overseas as well as in New York, resulting
in a virtual round-the-clock market. Positions are bought
and sold in seconds in an interdealer market, with trade
sizes starting at $1 million for notes and bonds and $5 million
for bills. Competition among dealers and interdealer bro-
kers ensures narrow bid-ask spreads for most securities and
minimal interdealer brokerage fees.
Despite the Treasury market’s importance, size,
and liquidity, there is little quantitative evidence on its
intraday functioning. Intraday analysis of trading volume
and the bid-ask spread is valuable, however, for ascertain-
ing how market liquidity changes throughout the day.
Such information is important to hedgers and other market
participants who may need to trade at any moment and to
investors who rely on a liquid Treasury market for the pric-
ing of other securities or for tracking market sentiment.
Intraday analysis of price volatility can also reveal when
new information gets incorporated into prices and shed
light on the determinants of Treasury prices. Finally, analysis
of price behavior can be used to test the intraday efficiency
of the Treasury market by determining, for example,
whether overseas price changes reflect new information
that is subsequently incorporated into prices in New York.
This article provides the first detailed intraday
T

10 FRBNY ECONOMIC POLICY REVIEW / JULY 1997
analysis of the round-the-clock market for U.S. Treasury
securities. The analysis, covering the period from April 4
to August 19, 1994, uses comprehensive data on trading
activity among the primary government securities dealers.2
Trading volume, price volatility, and bid-ask spreads are
examined for the three major trading locations—New
York, London, and Tokyo—as well as for each half-hour
interval of the global trading day. Price efficiency across
trading locations is also tested by examining the relationship
between price changes observed overseas and overnight
price changes in New York.
The analysis reveals that trading volume and price
volatility are highly concentrated in New York trading
hours, with a daily peak between 8:30 a.m. and 9 a.m. and a
smaller peak between 2:30 p.m. and 3 p.m. Bid-ask spreads
are found to be wider overseas than in New York and wider
in Tokyo than in London. Despite lower overseas liquidity,
overseas price changes in U.S. Treasury securities emerge as
unbiased predictors of overnight New York price changes.
THE STRUCTURE OF THE SECONDARY MARKET
Secondary trading in U.S. Treasury securities occurs prima-
rily in an over-the-counter market rather than through an
organized exchange.3 Although 1,700 brokers and dealers
trade in the secondary market, the 39 primary government
securities dealers account for the majority of trading vol-
ume (Appendix A).4 Primary dealers are firms with which
the Federal Reserve Bank of New York interacts directly in
the course of its open market operations. They include
large diversified securities firms, money center banks,
and specialized securities firms, and are foreign- as well
as U.S.-owned. Over time, the number of primary dealers
can change, as it did most recently with the addition of
Dresdner Kleinwort Benson North America LLC.
Among their responsibilities, primary dealers are
expected to participate meaningfully at auction, make rea-
sonably good markets in their trading relationships with the
Federal Reserve Bank of New York’s trading desk, and supply
market information to the Fed. Formerly, primary dealers
were also required to transact a certain level of trading volume
with customers and thereby maintain a liquid secondary
market for Treasury securities. Customers include nonpri-
mary dealers, other financial institutions (such as banks,
insurance companies, pension funds, and mutual funds),
nonfinancial institutions, and individuals. Although trading
with customers is no longer a requirement, primary dealers
remain the predominant market makers in U.S. Treasury
securities, buying and selling securities for their own
account at their quoted bid and ask prices.
Primary dealers also trade among themselves,
either directly or through interdealer brokers.5 Interdealer
brokers collect and post dealer quotes and execute trades
between dealers, thereby facilitating information flows in
the market while providing anonymity to the trading dealers.
For the most part, interdealer brokers act only as agents.
For their service, the brokers collect a fee from the trade
initiator: typically $12.50 per $1 million on three-month
bills (1/2 of a 100th of a point), $25.00 per $1 million on
six-month and one-year bills (1/2 and 1/4 of a 100th of a
point, respectively), and $39.06 per $1 million on notes
and bonds (1/8 of a 32nd of a point).6 The fees are nego-
tiable, however, and can vary with volume.
The exchange of securities for funds typically
occurs one business day after agreement on the trade.
Settlement takes place either on the books of a depository
institution or between depository institutions through the
Federal Reserve’s Fedwire securities transfer system. Clear-
ance and settlement activity among primary dealers and
other active market participants occurs primarily through
the Government Securities Clearance Corporation (GSCC).
The GSCC compares and nets member trades, thereby
reducing the number of transactions through Fedwire and
decreasing members’ counterparty credit risk.
The Treasury market is . . . one of the world’s
largest and most liquid financial markets.
Daily trading volume in the secondary market
averages $125 billion.

FRBNY ECONOMIC POLICY REVIEW / JULY 1997 11
Daily Trading Volume of U.S. Treasury Securities April to August 1994
Source: Author’s calculations, based on data from the Board of Governors of the Federal Reserve System.
Notes: The exhibit shows the mean daily volume of secondary trading in the cash market as reported to the Federal Reserve by the primary dealers. Because the reportingdata changed in July 1994, all figures are estimated based on full-year 1994 activity. The figures are also adjusted to eliminate double counting (trades between primary dealers are counted only once).
Total$125.5 billion
Customer–Primary Dealer$67.0 billion
Primary Dealer–Primary Dealer$58.5 billion
Interdealer Broker$53.5 billion
No Intermediary$4.9 billion
The level of trading activity among the various
Treasury securities market participants is extremely high
(see exhibit). Between April and August of 1994—the
period examined in this article—trades involving primary
dealers in the secondary market averaged about $125 billion
per day.7 More than half the volume involved primary
dealer trades with customers, with the remainder involv-
ing trades between primary dealers. The vast majority of
the $58.5 billion interdealer volume occurred through
interdealer brokers. Activity data from these brokers form
the basis of much of the analysis in this article (see box).
TRADING HOURS AND LOCATIONS
Trading hours for U.S. Treasury securities have lengthened
in line with the growth of the federal debt, the increase in
foreign purchases of Treasuries, and the globalization of
the financial services industry.8 Trading now takes place
twenty-two hours a day, five days a week (Chart 1).9 The
global trading day for U.S. Treasury securities begins at
8:30 a.m. local time in Tokyo, which is 7:30 p.m. New
York daylight saving time (DST).10 Trading continues
until roughly 4 p.m. local time in Tokyo (3 a.m. New
York), when trading passes to London, where it is 8 a.m.
This article analyzes interdealer broker data obtained fromGovPX, Inc., a joint venture of the primary dealers and sev-eral interdealer brokers set up under the guidance of the Pub-lic Securities Association (an industry trade group).a GovPXwas formed in 1991 to increase public access to U.S. Treasurysecurity prices (Wall Street Journal 1991).
GovPX consolidates and posts real-time quote andtrade data from five of the six major interdealer brokers,which together account for about two-thirds of the inter-dealer broker market. Posted data include the best bids andoffers, trade price and size, and aggregate volume traded forall Treasury bills, notes, and bonds. GovPX data are distrib-uted electronically to the public through several on-line ven-dors such as Bloomberg, Knight-Ridder, and Reuters.
The data for this article include the quote and tradedata for all “when-issued” and “on-the-run” securities in thecash market. When-issued securities are securities that have
INTERDEALER BROKER DATA
been announced for auction but not yet issued. On-the-runsecurities (also called active or current) are the most recentlyissued securities of a given maturity. Off-the-run (or inactive)securities, by contrast, are issued securities that are no longeractive. Daily volume data obtained from GovPX reveal that64 percent of interdealer trading is in on-the-run issues,12 percent is in when-issued securities, and 24 percent is inoff-the-run securities.
The period examined is April 4 to August 19, 1994.After holidays and missing data are excluded, ninety daysfrom this twenty-week period are left for analysis.b An averageof 2,702 trades a day were posted by GovPX in the sampleperiod, along with 9,888 bid-ask spreads. For tractabilitypurposes, the day is divided into half-hour periods. Tradinglocations are also assigned on the basis of the time of day aquote or trade was made (Chart 1). Appendix B discusses thedata in more detail, including data cleaning and processing.
aThe Public Securities Association has since changed its name to PSA, The Bond Market Trade Association.
bThe market was closed in New York on three days, in Tokyo on four days, and in London on an additional two days during this period. One daywas dropped because of missing data. End-of-day New York prices are used, when applicable, for the six overseas holidays to maintain as large asample as possible.

12 FRBNY ECONOMIC POLICY REVIEW / JULY 1997
Trading Times for U.S. Treasury Securities
Chart 1
Notes: The chart shows the breakdown by location of interdealer trading over the global trading day. Crossover times are approximate because interdealer trading occurs over the counter and may be initiated from anywhere. All timesare New York daylight saving time.
����������������������������������������������������������������������������������������������������������������������������������������������������������������
��������
��������
6 p.m.
6 a.m.
Noon Midnight
London
9 p.m.3 p.m.
3 a.m.9 a.m.
New York Tokyo
At about 12:30 p.m. local time in London, trading passes
to New York, where it is 7:30 a.m. Trading continues in
New York until 5:30 p.m.
Although it is convenient to think of trading
occurring in three distinct geographic locations, a trade
may originate anywhere. For example, business hours
among the locations overlap somewhat: traders in London
may continue to transact in their afternoon while morning
activity picks up in New York. Traders may also transact
from one location during another location’s business
hours. In fact, some primary dealers have traders working
around the clock, but all from a single location (Stigum
1990, p. 471).
Regardless of location, the trading process for
U.S. Treasuries is the same. The same securities are
traded by the same dealers through the same interdealer
brokers with the same brokerage fees. Trades agreed
upon during overseas hours typically settle as New York
trades do—one business day later in New York through
the GSCC.11
TRADING ACTIVITY BY LOCATION
Although the U.S. Treasury securities market is an over-
the-counter market with round-the-clock trading, more
than 94 percent of that trading occurs in New York, on
average, with less than 4 percent in London and less than
2 percent in Tokyo (Table 1).12 While each location’s share
of daily volume varies across days, New York hours always
comprise the vast majority (at least 87.5 percent) of daily
trading.13 This is not particularly surprising since Treasury
securities are obligations of the U.S. government: most
macroeconomic reports and policy changes of relevance
to Treasury securities are announced during New York
trading hours, and most owners of Treasury securities are
U.S. institutions or individuals.14
The share of U.S. Treasuries traded overseas,
while small, can vary substantially. London reached its
Source: Author’s calculations, based on data from GovPX, Inc.
Note: The table reports the percentage distribution of daily interdealer trading volume by location for on-the-run and when-issued securities.
Table 1 TRADING VOLUME OF U.S. TREASURY SECURITIESBY LOCATION April 4 to August 19, 1994
Tokyo London New York Mean 1.84 3.50 94.66Standard deviation 1.06 1.40 2.08Minimum 0.14 0.55 87.53Maximum 6.61 7.93 98.75
Although the U.S. Treasury securities
market is an over-the-counter market with
round-the-clock trading, more than 94 percent
of that trading occurs in New York, on
average, with less than 4 percent in London
and less than 2 percent in Tokyo.
FRBNY ECONOMIC POLICY REVIEW / JULY 1997 13
New York daylight saving time
Source: Author’s calculations, based on data from GovPX, Inc.
Notes: The chart shows the mean half-hourly interdealer trading volume as apercentage of mean daily interdealer trading volume for on-the-run and when-issued securities. The times on the horizontal axis indicate the beginning of intervals (for example, 9 a.m. for 9 a.m. to 9:30 a.m.).
6 p.m. 9 p.m. Midnight 3 a.m. 6 a.m. 9 a.m. Noon 3 p.m. 6 p.m.
Trading Volume of U.S. Treasury Securities by Half HourApril 4 to August 19, 1994
Chart 2
Percent
Tokyo New YorkLondon10
0
2
4
6
8
highest share of daily volume (7.9 percent) in the sample
period on Friday, August 19, 1994. Tokyo reached its
highest share (6.6 percent) on Friday, July 1, 1994. News
reports indicate that dollar-yen movements drove overseas
activity on both days. Overseas activity was also relatively
high on July 1 because of a shortened New York session
ahead of the July 4 weekend.
A more thorough examination of news stories on
days when the overseas locations were particularly active or
volatile suggests several reasons why U.S. Treasuries trade
overseas:
• late afternoon New York activity spills over to theoverseas trading locations (April 6);
• overnight activity in the foreign exchange marketimpacts the Treasury market (June 24);
• other overnight events occur—for example, commentsare made by a government official during overseashours (June 8);
• news is released during overnight hours—for instance,a U.S. newspaper article appears during overseas hours(June 21);
• overseas investors are active during overseas hours(August 17);
• central bank intervention occurs during overseashours (May 10).
Overseas locations thus allow traders to adjust positions in
response to overnight events and give foreign investors and
institutions the opportunity to trade during their own
business hours.
On a typical weekday, trading starts at 7:30 p.m.
New York DST with relatively low volume throughout
Tokyo hours (Chart 2). Volume picks up somewhat when
London opens at 3 a.m. (New York DST) and remains fairly
steady through London trading hours. Volume jumps higher
in the first half hour of New York trading (7:30 a.m. to
8 a.m.), then spikes upward in the next half hour of trading.
Volume reaches a daily peak between 8:30 a.m. and 9 a.m.
Except for a small peak from 10 a.m. to 10:30 a.m., volume
generally falls until the 1 p.m. to 1:30 p.m. interval.
Volume rises again to a peak between 2:30 p.m. and 3 p.m.,
then quickly tapers off, with trading ending by 5:30 p.m.
New York DST.
The pattern of U.S. Treasuries trading between
8:30 a.m. and 3 p.m. parallels that of equity markets trad-
ing. Several studies of equity securities (such as Jain and
Joh [1988] and McInish and Wood [1990]) have found
Overseas locations . . . allow traders to adjust
positions in response to overnight events and give
foreign investors and institutions the opportu-
nity to trade during their own business hours.
14 FRBNY ECONOMIC POLICY REVIEW / JULY 1997
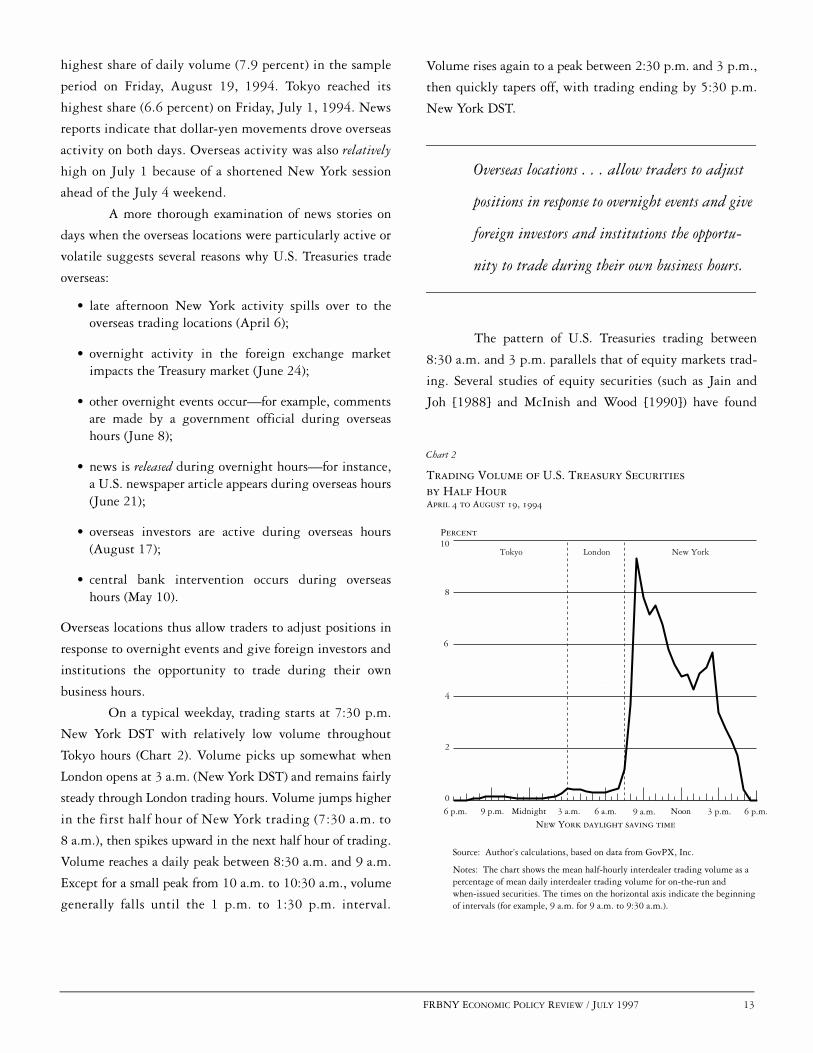
Trading Volume of U.S. Treasury Securities by MaturityApril 4 to August 19, 1994
Chart 3
Source: Author’s calculations, based on data from GovPX, Inc.
Note: The chart shows the mean interdealer trading volume by maturity as apercentage of the mean total interdealer trading volume for on-the-run securities.
�������������������
������������������������������������������������������������������������������������������
������������������������������
����������� ��
�
Six-month bill6.4
One-year bill10.1
Thirty-year bond2.7
Three-year note7.7
Ten-year note17.4
Cash-management bill1.0
Three-month bill7.4
Two-year note21.3
Five-year note26.0
that daily volume peaks at the opening of trading, trails off
during the day, then rises again at the close. Jain and Joh
(1988) speculate that news since the prior close may drive
morning volume, while afternoon volume may reflect the
closing or hedging of open positions in preparation for the
overnight hours.
In the U.S. Treasury securities market, the daily
peak between 8:30 a.m. and 9 a.m. is at least partially
explained by the important macroeconomic reports
(including employment) released at 8:30 a.m. (Fleming
and Remolona 1996). The opening of U.S. Treasury futures
trading at 8:20 a.m. on the Chicago Board of Trade (CBT)
is probably also a factor in this peak. The slight jump in
volume between 10 a.m. and 10:30 a.m. may be a response
to the 10 a.m. macroeconomic reports. The peak in volume
between 2:30 p.m. and 3 p.m. coincides with the closing of
U.S. Treasury futures trading at 3 p.m. There is little
evidence that activity picks up during the Federal Reserve’s
customary intervention time (11:30 a.m. to 11:45 a.m.)15
or during the announcement of Treasury auction results
(typically 1:30 p.m. to 2 p.m.).
TRADING ACTIVITY BY MATURITY
To this point, the volume statistics have been examined
without regard to the particular issues making up the
total volume. However, there is significant variation in
trading activity by maturity for the most recently issued,
or on-the-run, Treasury securities (Chart 3). The five-year
note is the most actively traded security, accounting for
more than one-fourth (26 percent) of on-the-run volume.
The two- and ten-year notes are close behind, with shares
of 21 percent and 17 percent, respectively, while the
three-year note accounts for 8 percent.16 The one-year bill
accounts for 10 percent, the three-month bill for 7 percent,
the six-month bill for 6 percent, and the occasionally
issued cash-management bill for 1 percent.17 The bellwether
thirty-year bond accounts for less than 3 percent of total
on-the-run volume.18
The value of outstanding on-the-run securities by
maturity cannot explain the level of trading by maturity.
Auction sizes over the period examined were reasonably
similar by maturity with three-month, six-month, five-
year, ten-year, and thirty-year auctions running in the
There is significant variation in trading
activity by maturity for the most recently issued,
or on-the-run, Treasury securities.
A breakdown of trading volume by maturity for
each of the three locations reveals that the most
significant difference across locations is the
dearth of U.S. Treasury bill trading overseas.

FRBNY ECONOMIC POLICY REVIEW / JULY 1997 15
Trading Volume of U.S. Treasury Securities by Location and MaturityApril 4 to August 19, 1994
Chart 4
Source: Author’s calculations, based on data from GovPX, Inc.
Note: The chart shows the mean interdealer trading volume by maturity as a percentage of the mean total interdealer trading volume in each location for on-the-run securities.
���������������������������������������������������������������������
�������������������������
All bills0.7���������
������������������������������������������������������������������������������������������������������������
������������������������������
���������
������������������������������������������������������������������������������������������������������������������������������������������������
������������������������������Three-year
note11.6
Thirty-year bond7.7
Three-year note7.1
Ten-year note17.0
All bills1.3
Ten-year note17.3
Ten-year note16.2
Thirty-year bond2.6
Thirty-year bond4.1Three-year
note17.7
Tokyo
New York
London
All bills27.2
Two-year note31.2
Two-year note20.3
Two-year note36.8
Five-year note26.1
Five-year note25.6
Five-year note29.5
$11.0 billion to $12.5 billion range and one-, two-, and
three-year auctions running in the $16.5 billion to $17.5 bil-
lion range. When the auctions that were reopenings of previ-
ously auctioned securities are taken into account, volume
outstanding is actually higher for the relatively lightly
traded three-month, six-month, and thirty-year securities.
A breakdown of trading volume by maturity for
each of the three locations reveals that the most significant
difference across locations is the dearth of U.S. Treasury
bill trading overseas (Chart 4). Although Treasury bills
(the one-year, six-month, three-month, and cash-management
issues) represent 27 percent of trading in New York, they
represent just 1 percent of trading in both London and
Tokyo. On most days, in fact, not a single U.S. Treasury
bill trade is brokered during the overseas hours. The distri-
bution of overseas trading in Treasury notes is reasonably
similar to that of New York, although the two-year note is
the most frequently traded overseas (as opposed to the five-
year note in New York) and heavier relative volume is evident
in the three-year note. The thirty-year bond is traded more
intensively overseas relative to total volume—particularly
in Tokyo, where it represents nearly 8 percent of total volume.
A distributional breakdown of trading in each
maturity by location (Table 2) confirms that bill volume is
extremely low overseas. London trades less than 0.4 percent
of the total daily volume for each bill (on average) and
Tokyo trades less than 0.2 percent. In contrast, London
trades 3 to 6 percent of daily volume for the two-, five-,
ten-, and thirty-year securities, and more than 9 percent for
the three-year note. Tokyo trades 2 to 4 percent of daily

16 FRBNY ECONOMIC POLICY REVIEW / JULY 1997
volume for each of the notes, and more than 6 percent for
the thirty-year bond. Although volumes vary substantially
across trading locations, a plot of daily volume by half hour
(not shown) would reveal a very similar intraday pattern for
each of the notes and bonds. Like bill trading, when-issued
trading is low overseas and particularly so in Tokyo.
Because of the limited overseas trading in bills and when-
issued securities, the remainder of the analysis will treat
on-the-run notes and bonds exclusively.
PRICE VOLATILITY
Analyzing intraday price volatility leads to an improved
understanding of the determinants of Treasury prices. As
noted by French and Roll (1986), price volatility arises not
only from public and private information that bears on
prices but also from errors in pricing. The authors show,
however, that pricing errors are only a small component of
equity security volatility. This article contends that pricing
errors are probably an even smaller component of Treasury
security volatility because of the market’s greater liquidity.
The examination of price volatility is therefore largely an
examination of price movements caused by the arrival of
information. The process by which Treasury prices adjust
to incorporate new information is referred to in this article
as price discovery.
Price volatility is examined across days, trading
locations, and half-hour intervals of the day. Daily price
volatility is calculated as the absolute value of the differ-
ence between the New York closing bid-ask midpoint and
the previous day’s New York closing bid-ask midpoint.19
Price volatility for each trading location is calculated as the
absolute value of the difference between that location’s
closing bid-ask midpoint and the closing bid-ask midpoint
for the previous trading location in the round-the-clock
market. Half-hour price volatility is calculated as the abso-
lute value of the difference between the last bid-ask mid-
point in that half hour and the last bid-ask midpoint in the
previous half hour.20 Volatility is not calculated for two
different securities of similar maturity (there is a missing
observation when the on-the-run security changes after an
auction).
The vast majority of price discovery is found to
occur during New York hours, with relatively little price
discovery in Tokyo or London (Table 3). For example, the
five-year note’s expected price movement during Tokyo
hours is 6/100ths of a point, during London hours 6/100ths
Source: Author’s calculations, based on data from GovPX, Inc.
Note: The table reports the percentage distribution of daily interdealer trading volume by location and security type for on-the-run and when-issued securities.
Table 2 TRADING VOLUME OF U.S. TREASURY SECURITIESBY MATURITY AND LOCATION April 4 to August 19, 1994
Security Type Tokyo London New YorkCash-management bill
Mean 0.00 0.00 100.00Standard deviation 0.00 0.00 0.00
Three-month billMean 0.15 0.03 99.82Standard deviation 1.06 0.27 1.11
Six-month bill Mean 0.03 0.40 99.57Standard deviation 0.25 1.69 1.70
One-year billMean 0.01 0.23 99.76Standard deviation 0.12 1.00 1.01
Two-year noteMean 3.87 5.85 90.27Standard deviation 3.60 3.60 5.85
Three-year noteMean 3.07 9.23 87.71Standard deviation 2.67 6.33 7.27
Five-year noteMean 2.13 4.48 93.40Standard deviation 1.41 1.87 2.70
Ten-year noteMean 2.07 3.64 94.29Standard deviation 1.48 2.09 2.99
Thirty-year bondMean 6.37 5.95 87.68Standard deviation 5.99 4.72 8.81
When-issued billsMean 0.02 0.28 99.70Standard deviation 0.16 2.51 2.52
When-issued notes and bondsMean 0.92 1.80 97.28Standard deviation 1.29 2.16 2.75
The vast majority of price discovery is found to
occur during New York hours, with relatively
little price discovery in Tokyo or London.
FRBNY ECONOMIC POLICY REVIEW / JULY 1997 17
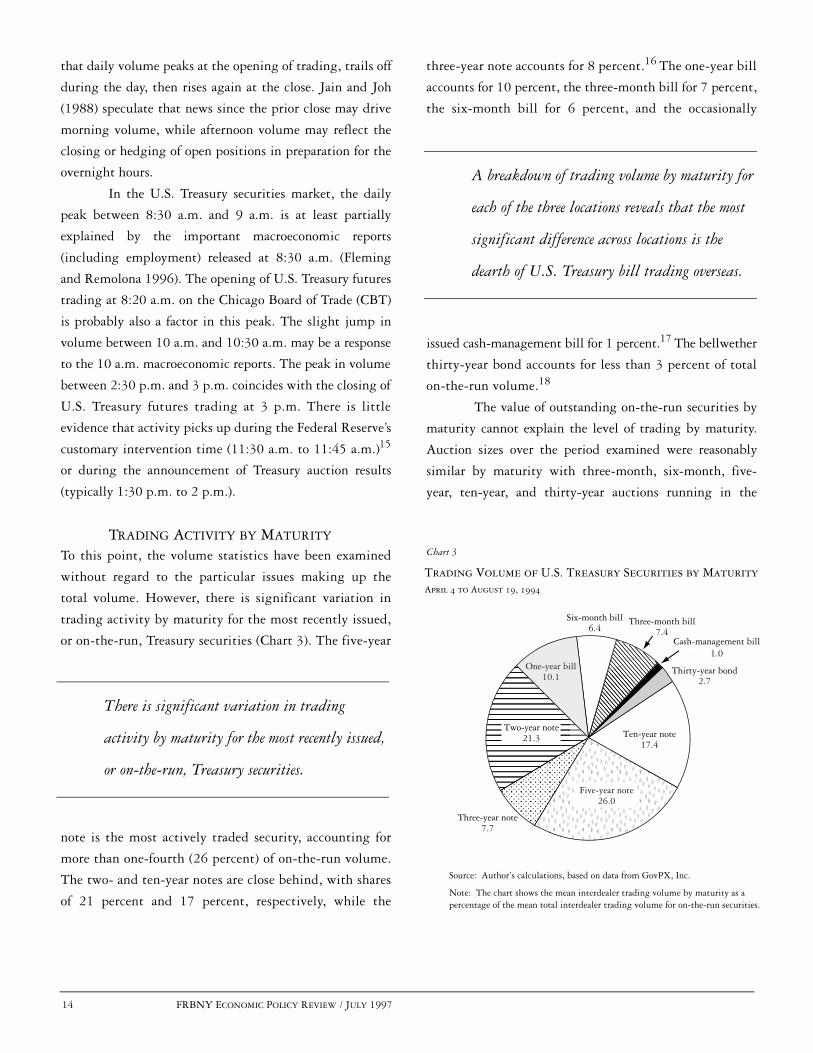
Price Volatility of U.S. Treasury Securities by Half HourApril 4 to August 19, 1994
Chart 5
Hundredths of a point
New York daylight saving time
Source: Author’s calculations, based on data from GovPX, Inc.
Notes: The chart shows the mean half-hourly price volatility for on-the-run notes and bonds. Volatility is calculated as the absolute value of the difference between the last bid-ask midpoint in that half hour and the last bid-ask midpoint in the previous half hour. For the 7:30 p.m. to 8 p.m. interval, the previous interval is considered 5 p.m. to 5:30 p.m. The times on the horizontal axis indicate the beginning of intervals (for example, 9 a.m. for 9 a.m. to 9:30 a.m.).
New YorkLondonTokyo
6 p.m. 9 p.m. Midnight 3 a.m. 6 a.m. 9 a.m. Noon 3 p.m. 6 p.m.
0
5
10
15
20
25
Three-yearnote
Ten-year note
Thirty-year bond
Two-year note
Five-yearnote
of a point, and during New York hours 27/100ths of a
point. By contrast, the daily expected price movement is
28/100ths of a point. For other securities as well, volatility is
similar for Tokyo and London but much higher for New York.
Like the findings for trading volume, these results
are not too surprising. Treasury securities are obligations of
the U.S. government, and most macroeconomic reports and
policy changes of relevance to the securities are announced
during New York trading hours. Studies of the foreign
exchange market have also found price volatility to be gen-
erally greater during New York trading hours, albeit to a
lesser extent than found here (Ito and Roley 1987; Baillie
and Bollerslev 1990).
An examination of price volatility by half-hour
interval (Chart 5) reveals that volatility is fairly steady
from the global trading day’s opening in Tokyo (7:30 p.m.
New York DST) through morning trading hours in London
(7 a.m. New York). Volatility picks up in early afternoon
London trading right before New York opens (7 a.m. to
7:30 a.m. New York). It then increases in the first hour of
New York trading (7:30 a.m. to 8:30 a.m.) and spikes
higher to reach its daily peak between 8:30 a.m. and 9 a.m.
A general decline is observed until the 12:30 p.m. to 1 p.m.
period, although there is a spike in the 10 a.m. to
10:30 a.m. period. Volatility then picks up again, reaches
a peak between 2:30 p.m. and 3 p.m., and falls off quickly
after 3 p.m. to levels comparable to those seen in the over-
seas hours. The intraday volatility pattern is similar across
maturities.
In their study of intraday price volatility in the
CBT’s Treasury bond futures market, Ederington and Lee
(1993) find that volatility peaks between 8:30 a.m. and
8:35 a.m. and is relatively level the rest of the trading day
(the trading day runs from 8:20 a.m. to 3 p.m.). The
authors observe, however, that price volatility shows no
increase between 8:30 a.m. and 8:35 a.m. on days when no
8:30 a.m. macroeconomic announcements are made. These
Source: Author’s calculations, based on data from GovPX, Inc.
Notes: The table reports price volatility for on-the-run notes and bonds. Values are in hundredths of a point. Daily price volatility is calculated as the absolute value of the difference between the New York closing bid-ask midpoint and the previous day’s New York closing bid-ask midpoint. Price volatility for each trading location is calculated as the absolute value of the difference between that location’s closing bid-ask midpoint and the closing bid-ask midpoint for the previous trading location in the round-the-clock market.
Table 3 PRICE VOLATILITY OF U.S. TREASURY SECURITIESApril 4 to August 19, 1994
Security Type Daily Tokyo London New YorkTwo-year note
Mean 10.68 2.91 2.12 9.94Standard deviation 9.91 2.61 2.00 9.39
Three-year noteMean 16.60 3.91 3.38 15.61Standard deviation 13.64 3.78 3.45 12.99
Five-year noteMean 28.08 6.10 5.69 26.63Standard deviation 23.43 5.55 5.93 22.19
Ten-year noteMean 43.40 8.00 8.73 43.10Standard deviation 37.22 8.30 8.66 35.93
Thirty-year bondMean 58.28 11.35 10.32 56.53Standard deviation 50.45 11.33 11.93 48.62
18 FRBNY ECONOMIC POLICY REVIEW / JULY 1997
findings give strong support to the hypothesis that the
8:30 a.m. to 9 a.m. volatility in the cash market is driven by
these announcements.21
The intraday pattern of price volatility has also
been studied for equity and foreign exchange markets.
Equity market studies (such as Wood, McInish, and Ord
[1985] and Harris [1986]) find volatility peaking at the
markets’ opening, falling through the day, and rising
somewhat at the end of trading. Again, we see a similar
pattern for U.S. Treasury securities if we limit our exami-
nation to the 8:30 a.m. to 3 p.m. period. Outside of this
period, price volatility is relatively low.
By contrast, the intraday volatility pattern in the
foreign exchange market is markedly different. Although
price volatility does peak in the morning in New York, the
second most notable peak is seen in the morning in Europe
and no volatility peak occurs in the New York afternoon
(Baillie and Bollerslev 1990; Andersen and Bollerslev
forthcoming). Although there is no official closing time for
the U.S. Treasury securities market, the market behaves in
some ways as if there were one, apparently because of the
fixed trading hours of Treasury futures and the predomi-
nance of U.S. news and investors in determining prices.
The similarities in the Treasury market between
intraday price volatility (Chart 5) and intraday volumes
(Chart 2) are striking. Both peak between 8:30 a.m. and
9 a.m., a period encompassing the 8:30 a.m. macroeco-
nomic announcements and following, by just ten minutes,
the opening of CBT futures trading. Both peak again
between 2:30 p.m. and 3 p.m., the last half hour of CBT
futures trading. Both show small peaks in the 10 a.m. to
10:30 a.m. period, when less significant macroeconomic
announcements are made. Volatility seems to jump
slightly in periods of Fed intervention (then 11:30 a.m.
to 11:45 a.m.) and when auction announcements are
made (typically 1:30 p.m. to 2 p.m.), but these movements
are secondary.
The relationship between trading volume and
price changes has also been studied extensively in other
financial markets.22 These studies consistently find trading
volume and price volatility positively correlated for a variety
of trading intervals. Most models attribute this relation-
ship to information differences or differences of opinion
among traders. New information or opinions become
incorporated in prices through trading, leading to the
positive volume-volatility relationship.
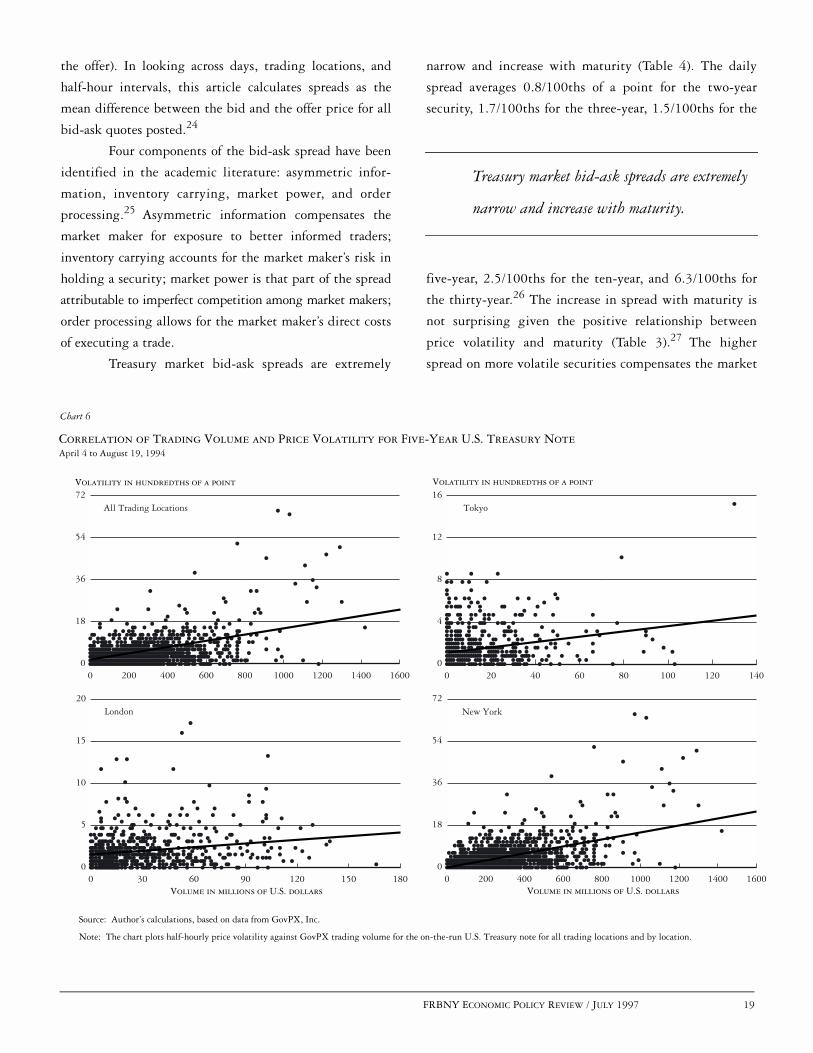
The volume-volatility relationship for U.S. Trea-
sury securities is depicted in Chart 6. The five-year note’s
trading volume is plotted against price volatility (as calcu-
lated in Chart 5) for every half-hour interval in the sample
period.23 The upward slope of the regression lines demon-
strates a positive relationship between volume and price
volatility. A positive relationship is also indicated by the
positive correlation coefficients (.57 for all trading locations
combined, .24 for Tokyo, .22 for London, and .51 for New
York), all of which are significant at the .01 level. The
same positive correlation between trading volume and
price volatility documented in other financial markets
holds for the U.S. Treasury market.
BID-ASK SPREADS
U.S. Treasury investors who may need to trade at any
moment or who rely on the market for pricing other
instruments or gauging market sentiment are concerned
with market liquidity. The bid-ask spread, which measures
a major cost of transacting in a security, is an important
indicator of market liquidity. The spread is defined as the
difference between the highest price a prospective buyer is
willing to pay for a given security (the bid) and the lowest
price a prospective seller is willing to accept (the ask, or
Although there is no official closing time for the
U.S. Treasury securities market, the market
behaves in some ways as if there were one,
apparently because of the fixed trading hours
of Treasury futures and the predominance of
U.S. news and investors in determining prices.
FRBNY ECONOMIC POLICY REVIEW / JULY 1997 19
Correlation of Trading Volume and Price Volatility for Five-Year U.S. Treasury NoteApril 4 to August 19, 1994
Chart 6
Volatility in hundredths of a point
Source: Author’s calculations, based on data from GovPX, Inc.
Note: The chart plots half-hourly price volatility against GovPX trading volume for the on-the-run U.S. Treasury note for all trading locations and by location.
0 200 400 600 800 1000 1200 1400 16000
18
36
54
72
0 20 40 60 80 100 120 1400
4
8
12
16Volatility in hundredths of a point
0 30 60 90 120 150 1800
5
10
15
20
Volume in millions of U.S. dollars Volume in millions of U.S. dollars0 200 400 600 800 1000 1200 1400 1600
0
18
36
54
72
All Trading Locations Tokyo
New YorkLondon
the offer). In looking across days, trading locations, and
half-hour intervals, this article calculates spreads as the
mean difference between the bid and the offer price for all
bid-ask quotes posted.24
Four components of the bid-ask spread have been
identified in the academic literature: asymmetric infor-
mation, inventory carrying, market power, and order
processing.25 Asymmetric information compensates the
market maker for exposure to better informed traders;
inventory carrying accounts for the market maker’s risk in
holding a security; market power is that part of the spread
attributable to imperfect competition among market makers;
order processing allows for the market maker’s direct costs
of executing a trade.
Treasury market bid-ask spreads are extremely
narrow and increase with maturity (Table 4). The daily
spread averages 0.8/100ths of a point for the two-year
security, 1.7/100ths for the three-year, 1.5/100ths for the
five-year, 2.5/100ths for the ten-year, and 6.3/100ths for
the thirty-year.26 The increase in spread with maturity is
not surprising given the positive relationship between
price volatility and maturity (Table 3).27 The higher
spread on more volatile securities compensates the market
Treasury market bid-ask spreads are extremely
narrow and increase with maturity.

20 FRBNY ECONOMIC POLICY REVIEW / JULY 1997
maker for increased asymmetric information and inventory-
carrying costs. The exception to this pattern—the five-year
note, which has a lower spread than the three-year note—
is likely attributable to the greater volume transacted in the
five-year note (Chart 3). Higher volume in a security leads
to economies of scale in order processing and is probably
associated with greater market maker competition.
Bid-ask spreads in the U.S. Treasury market are
comparable to those in the foreign exchange market but
significantly lower than those in the equity markets.
Bessembinder (1994) finds interbank bid-ask spreads of
0.064 percent for dollar-yen transactions and 0.062 percent
for dollar-pound transactions—roughly the size of the
spread on a thirty-year Treasury bond. Mean equity market
spreads are found to vary from 1.4 to 3.1 percent (Amihud
and Mendelson 1986; Stoll 1989; Laux 1993; Affleck-Graves,
Hegde, and Miller 1994), a range roughly 50 to 200 times
greater than that for on-the-run U.S. Treasury securities.
The substantially lower bid-ask spreads in the Treasury
market probably reflect lower asymmetric information
costs, lower order-processing costs, and lower market-power
costs. Market making for U.S. Treasuries is extremely com-
petitive, with a high number of trades, large trade sizes,
and limited private information.
New York spreads are lower than overseas spreads
for every U.S. Treasury note, and London spreads are nar-
rower than those in Tokyo. For example, the five-year note’s
spread is 1.5/100ths of a point in New York, 2.0/100ths
in London, and 2.5/100ths in Tokyo. The New York differ-
ences from Tokyo are statistically significant (at the .01 level)
for every note, and the New York differences from London
are statistically significant (at the .01 level) for the two-,
five-, and ten-year notes. The London-Tokyo differences
are statistically significant for the two- and three-year
notes (at the .01 level) and to a lesser extent for the five-
year note (at the .05 level).
Spreads are similar across trading locations for the
thirty-year bond. The mean spread is 6.4/100ths of a point
in New York, 6.3/100ths in London, and 5.9/100ths in
Tokyo. However, two cautions regarding the spreads are in
order: First, spreads are often not posted during the over-
seas hours, particularly in Tokyo.28 Second, the spreads
give no indication of the associated quantities bid or
offered, which may be lower in the overseas locations (but
are not part of this study’s data set).29 Cautions notwith-
standing, the higher relative volume of the thirty-year
bond in Tokyo might be expected to result in smaller
spread differences. Another factor may be the CBT’s
evening and overnight hours in the futures market—a
market dominated by the thirty-year bond.
Examining bid-ask spreads by half-hour intervals,
Source: Author’s calculations, based on data from GovPX, Inc.
Notes: The table reports interdealer bid-ask spreads for on-the-run notes and bonds. Values are in hundredths of a point. Spreads are calculated daily as the mean difference between the bid and the offer for all bid-ask quotes postedduring that location’s (or during all locations’) trading hours.
* Significantly different from Tokyo at the .05 level based on two-sided t-test.
** Significantly different from Tokyo at the .01 level based on two-sided t-test
# Significantly different from London at the .05 level based on two-sided t-test.
## Significantly different from London at the .01 level based on two-sided t-test.
Table 4BID-ASK SPREADS ON U.S. TREASURY SECURITIESApril 4 to August 19, 1994
Security TypeAll
Locations Tokyo London New YorkTwo-year note
Mean 0.83 1.37 1.12** 0.78 ** ##Standard deviation 0.14 0.58 0.38 0.15
Three-year noteMean 1.68 2.47 1.79** 1.65**Standard deviation 0.30 1.06 0.77 0.31
Five-year noteMean 1.53 2.48 2.04 * 1.47 ** ##Standard deviation 0.23 1.90 0.59 0.24
Ten-year noteMean 2.50 3.83 3.73 2.39 ** ##Standard deviation 0.36 1.21 1.13 0.38
Thirty-year bondMean 6.30 5.93 6.27 6.36Standard deviation 1.11 2.12 2.86 1.15
Bid-ask spreads in the U.S. Treasury market
are comparable to those in the foreign exchange
market but significantly lower than those
in the equity markets.

FRBNY ECONOMIC POLICY REVIEW / JULY 1997 21
Bid-Ask Spreads on U.S. Treasury Securities by Half HourApril 4 to August 19, 1994
Chart 7
Hundredths of a point
New York daylight saving time
Source: Author’s calculations, based on data from GovPX, Inc.
Notes: The chart shows the mean half-hourly interdealer bid-ask spread for on-the-run notes and bonds. Spreads are calculated daily as the mean difference between the bid and the offer for all bid-ask quotes posted during that half hour. The times on the horizontal axis indicate the beginning of intervals (for example, 9 a.m. for 9 a.m. to 9:30 a.m.).
New YorkLondonTokyo
6 p.m. 9 p.m. Midnight 3 a.m. 6 a.m. 9 a.m. Noon 3 p.m. 6 p.m.0
2
4
6
8
10
12
Thirty-year bond
Five-year note
Two-year note
Three-year note
Ten-year note
this article finds that the general pattern exhibited by the
three-, five-, and ten-year notes (and to a lesser extent the
two-year note) is of a triple “u” shape (Chart 7). The bid-ask
spread begins at its daily high with the start of trading in
Tokyo (7:30 p.m. New York DST). The spread drops
quickly, levels out, and rises toward the end of trading in
Tokyo (2 a.m. to 3 a.m. New York). The spread declines
from this early morning peak as London trading gets under
way, then rises again to a peak when trading passes to New
York (7 a.m. to 8 a.m.). The spread then falls again,
remains roughly level throughout the late morning and
early afternoon, and rises in the late afternoon as trading
drops off (4:30 p.m. to 5:30 p.m.).
This pattern is quite different from that found in
the foreign exchange market, but similar in some ways to
that in the equity markets. Bollerslev and Domowitz
(1993) find that the deutsche mark–dollar spread peaks
during the Far Eastern lunch break and reaches a low dur-
ing morning trading in Europe. U.S. equity market studies
(such as McInish and Wood [1992] and Brock and Kleidon
[1992]) have found that bid-ask spreads are highest at the
markets’ opening, fall through the day, and rise again at
the end of trading. U.S. Treasury notes follow the same
pattern in New York, but also seem to replicate it overseas.
The result is the triple-u-shaped pattern of Chart 7.
The pattern for the thirty-year bond is somewhat
different. Like the note spreads, the thirty-year bond
spread peaks at the opening in Tokyo and also peaks in the
morning, when New York opens. Unlike the note spreads,
however, the bond spread does not peak at the Tokyo close.
More striking is the afternoon behavior of the bond spread
in New York: it peaks between 1:30 p.m. and 2 p.m., then
declines during the rest of the afternoon. The CBT futures
market’s 3 p.m. closing may help explain this pattern.
Note, too, that the thirty-year bond is the only security
examined for which a substantial number of observations
are missing in the late afternoon of New York.30
Numerous studies have related bid-ask spreads to
trading activity and price volatility for a variety of financial
markets.31 These studies generally find a negative relation-
ship between volume and bid-ask spreads and a positive
relationship between price volatility and bid-ask spreads.
The volume-spread relationship probably reflects decreasing
order-processing costs, decreasing inventory-carrying costs,
and increasing market maker competition as volume
increases. The volatility-spread relationship likely reflects
Examining bid-ask spreads by half-hour
intervals, this article finds that the general
pattern exhibited by the three-, five-, and
ten-year notes (and to a lesser extent the
two-year note) is of a triple “u” shape.
22 FRBNY ECONOMIC POLICY REVIEW / JULY 1997
Spread in hundredthsof a point
Lowest
LowestVolume
Volatility
Highest
Highest
0
1
2
3
4
5
6All Trading Locations
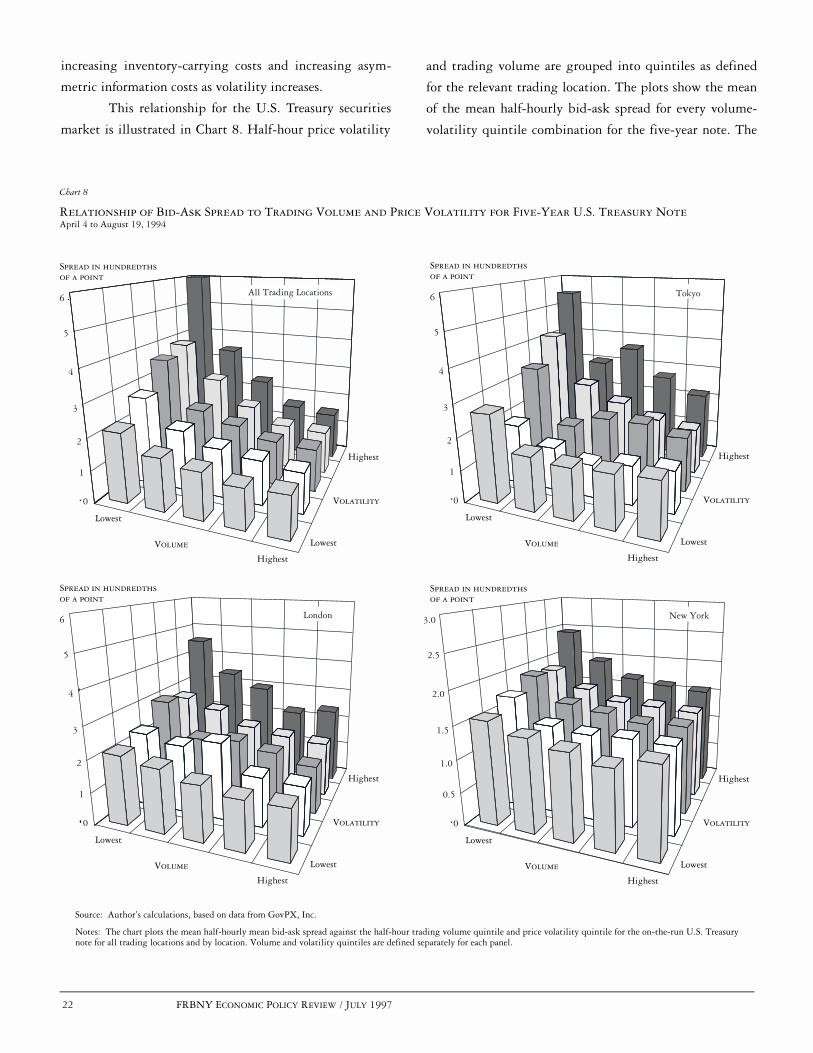
Chart 8
Relationship of Bid-Ask Spread to Trading Volume and Price Volatility for Five-Year U.S. Treasury NoteApril 4 to August 19, 1994
Source: Author’s calculations, based on data from GovPX, Inc.
Notes: The chart plots the mean half-hourly mean bid-ask spread against the half-hour trading volume quintile and price volatility quintile for the on-the-run U.S. Treasury note for all trading locations and by location. Volume and volatility quintiles are defined separately for each panel.
Spread in hundredthsof a point
Lowest
LowestVolume
Volatility
Highest
Highest
0
1
2
3
4
5
6 London
Spread in hundredthsof a point
Lowest
LowestVolume
Volatility
Highest
Highest
0
0.5
1.0
1.5
2.0
2.5
3.0 New York
Spread in hundredthsof a point
Lowest
LowestVolume
Volatility
Highest
Highest
0
1
2
3
4
5
6 Tokyo
increasing inventory-carrying costs and increasing asym-
metric information costs as volatility increases.
This relationship for the U.S. Treasury securities
market is illustrated in Chart 8. Half-hour price volatility
and trading volume are grouped into quintiles as defined
for the relevant trading location. The plots show the mean
of the mean half-hourly bid-ask spread for every volume-
volatility quintile combination for the five-year note. The

FRBNY ECONOMIC POLICY REVIEW / JULY 1997 23
chart reveals that higher price volatility is associated with
higher bid-ask spreads, and higher trading volume is
associated with lower bid-ask spreads. These simple rela-
tionships are confirmed by highly significant correlation
coefficients.32
PRICE EFFICIENCY REGRESSIONS
With low overseas trading volume, low overseas price
discovery, and high overseas bid-ask spreads, it is reason-
able to ask whether the overseas trading locations are
efficient. That is, are the price changes observed over-
seas a response to new information that later becomes
incorporated in prices in New York? Or does the relative
illiquidity of the overseas markets make price changes
there an unreliable guide to the path of future prices?
Those who have studied the U.S. Treasury market report
that large trades are not easily transacted overseas with-
out significant price concessions (Madigan and Stehm
1994; Stigum 1990). Furthermore, work by Neumark,
Tinsley, and Tosini (1991) uncovers evidence that over-
seas price changes of U.S. equity securities are not
efficient.33 They argue that higher overseas transaction
costs are a barrier to the transmission of small (but not
large) price signals.
However, overseas price efficiency might be expected
for several reasons. While volume is relatively low overseas,
a typical day still sees interdealer volume of more than
$450 million during Tokyo hours and nearly $900 million
Source: Author’s calculations, based on data from GovPX, Inc.
Notes: The table reports regression estimates of New York overnight price response to price movements during Tokyo hours for on-the-run notes and bonds. Reported standard errors are heteroskedasticity-consistent.
Table 5OVERNIGHT PRICE RESPONSE OF U.S. TREASURY SECURITIES TO TOKYO PRICE MOVEMENTSApril 4 to August 19, 1994
Two-Year Note Three-Year Note Five-Year Note Ten-Year Note Thirty-Year Bond
Intercept 0.00 0.00 0.00 0.00 0.00
(Standard error) (0.00) (0.00) (0.00) (0.00) (0.00)
0.97 0.89 0.85 0.89 0.94
(Standard error) (0.14) (0.10) (0.10) (0.11) (0.05)
Adjusted R-squared 0.50 0.39 0.36 0.30 0.58
Durbin-Watson statistic 1.61 2.00 1.76 1.70 1.90
Number of observations 86 82 85 87 83
Source: Author’s calculations, based on data from GovPX, Inc.
Notes: The table reports regression estimates of New York overnight price response to price movements during London hours for on-the-run notes and bonds. Reported standard errors are heteroskedasticity-consistent.
Table 6OVERNIGHT PRICE RESPONSE OF U.S. TREASURY SECURITIES TO LONDON PRICE MOVEMENTSApril 4 to August 19, 1994
Two-Year Note Three-Year Note Five-Year Note Ten-Year Note Thirty-Year Bond
Intercept 0.00 0.00 0.00 0.00 0.00
(Standard error) (0.00) (0.00) (0.00) (0.00) (0.00)
0.98 0.95 1.05 1.10 1.04
(Standard error) (0.07) (0.06) (0.07) (0.08) (0.05)
Adjusted R-squared 0.78 0.71 0.80 0.78 0.84
Durbin-Watson statistic 1.87 1.69 1.95 1.37 1.64
Number of observations 85 87 87 88 84
EÅEÅ
EÅ
24 FRBNY ECONOMIC POLICY REVIEW / JULY 1997
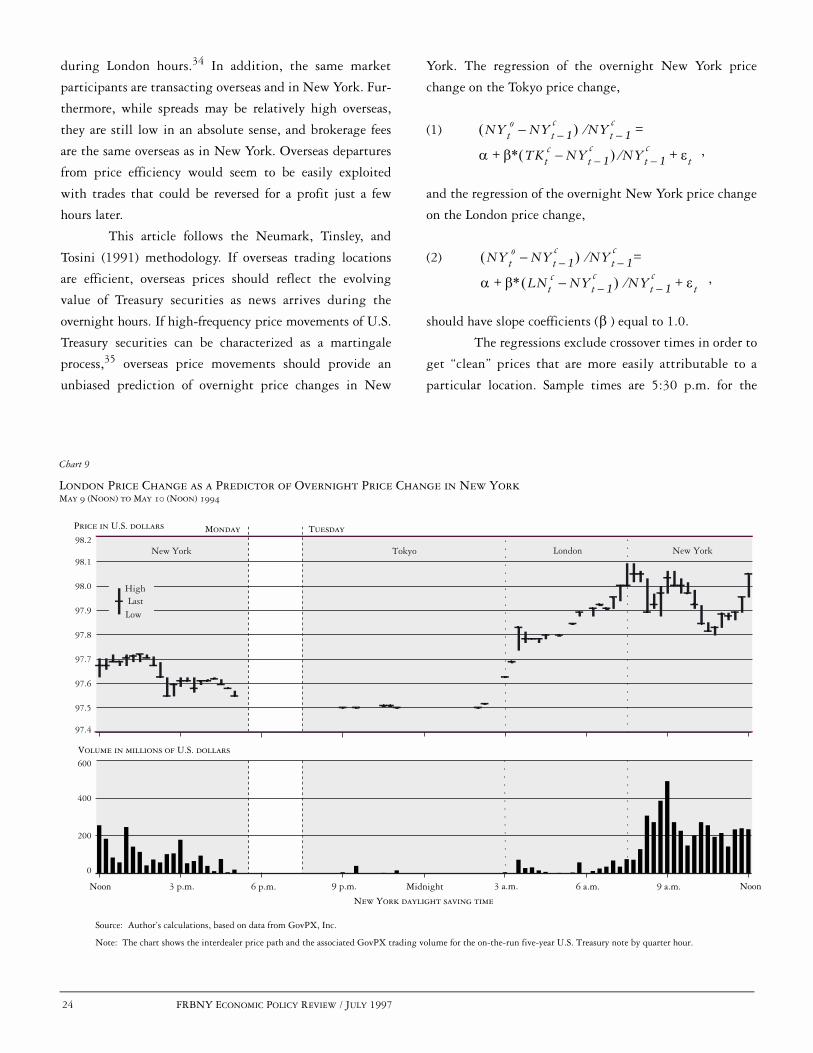
London Price Change as a Predictor of Overnight Price Change in New YorkMay 9 (Noon) to May 10 (Noon) 1994
Chart 9
Price in U.S. dollars
New York
Volume in millions of U.S. dollars
Noon 3 p.m. 6 p.m. 9 p.m. Midnight 3 a.m. 6 a.m. 9 a.m. Noon
New York daylight saving time
Source: Author’s calculations, based on data from GovPX, Inc.
Note: The chart shows the interdealer price path and the associated GovPX trading volume for the on-the-run five-year U.S. Treasury note by quarter hour.
Tokyo London New York
Monday Tuesday
0
200
400
600
97.4
97.5
97.6
97.7
97.8
97.9
98.0
98.1
98.2
High
LowLast
during London hours.34 In addition, the same market
participants are transacting overseas and in New York. Fur-
thermore, while spreads may be relatively high overseas,
they are still low in an absolute sense, and brokerage fees
are the same overseas as in New York. Overseas departures
from price efficiency would seem to be easily exploited
with trades that could be reversed for a profit just a few
hours later.
This article follows the Neumark, Tinsley, and
Tosini (1991) methodology. If overseas trading locations
are efficient, overseas prices should reflect the evolving
value of Treasury securities as news arrives during the
overnight hours. If high-frequency price movements of U.S.
Treasury securities can be characterized as a martingale
process,35 overseas price movements should provide an
unbiased prediction of overnight price changes in New
York. The regression of the overnight New York price
change on the Tokyo price change,
(1)
,
and the regression of the overnight New York price change
on the London price change,
(2)
,
should have slope coefficients ( ) equal to 1.0.
The regressions exclude crossover times in order to
get “clean” prices that are more easily attributable to a
particular location. Sample times are 5:30 p.m. for the
NYto NYt 1–
c–õ ô NYt 1–
ce
D Eó+
=
TKtc NYt 1–
c–õ ô NYt 1–
c Ht+e
NYto NYt 1–
c–õ ô NYt 1–
ce
D Eó+
=
LNtc NYt 1–
c–õ ô NYt 1–
c Ht+e
E

FRBNY ECONOMIC POLICY REVIEW / JULY 1997 25
Tokyo Price Change as a Predictor of Overnight Price Change in New YorkJune 24 (Noon) to June 27 (Noon), 1994
Chart 10
Price in U.S. dollars
New York
0
100
200
300
Volume in millions of U.S. dollars
Noon 3 p.m. 9 p.m. Midnight 3 a.m. 6 a.m. 9 a.m. Noon
New York daylight saving time
99.2
99.3
99.4
99.5
99.6
99.7
99.8
99.9
Source: Author’s calculations, based on data from GovPX, Inc.
Note: The chart shows the interdealer price path and the associated GovPX trading volume for the on-the-run five-year U.S. Treasury note by quarter hour.
Tokyo London New York
WeekendFriday Monday
High
LowLast
New York close, 2:30 a.m. (3:30 p.m. Tokyo time) for the
Tokyo close, 7 a.m. (noon London time) for the London
close, and 8 a.m. for the New York opening. Observations
are included only when all prices refer to the same security
(there is a missing observation when the on-the-run
security changes).
The Tokyo price movement regressions reveal that
the slope coefficient is insignificantly different from 1.0 in
all five maturities (Table 5). There is, therefore, insufficient
evidence to reject the null hypothesis that Tokyo price
changes are unbiased predictors of overnight price changes
in New York. Furthermore, the slope coefficient is signifi-
cantly different from zero (at the .01 level) in all five
maturities. U.S. Treasury security price movements in
Tokyo thus reflect new information that is subsequently
incorporated in New York prices.
Unsurprisingly, given the Tokyo results, the slope
coefficient for the London price movement regressions is
also insignificantly different from 1.0 in all five maturities
(Table 6). There is insufficient evidence to reject the null
hypothesis that London price changes are unbiased predic-
tors of overnight price changes in New York. In addition,
the slope coefficient is significantly different from zero (at
the .01 level) in all five maturities. U.S. Treasury security
price movements in London (from the New York close)
therefore reflect new information that is later incorporated
in New York prices.
PRICE EFFICIENCY CASE STUDIES
Two case studies now illustrate how large overseas price
changes in U.S. Treasury securities may be accurate indica-
tors of overnight New York price changes. The first study
26 FRBNY ECONOMIC POLICY REVIEW / JULY 1997
examines the largest price change observed in London hours
during the sample period—Tuesday, May 10, 1994, when
news reports suggested that European central banks and
Middle Eastern investors were purchasing U.S. Treasury
securities during London trading hours.
The global trading day opened quietly on May 10
with little activity in Tokyo (Chart 9). The five-year note
then rallied in London, jumping 48/100ths of a point
from the last Tokyo price to the last London price. The
price change was thus eight times the magnitude of the
expected price change during London hours (Table 3)
and nearly twice as large as the typical daily change. The
London price change was maintained when New York
opened at 7:30 a.m. While there was some price slippage
later in the morning, it is clear that the bulk of the
London price movement was not reversed when New
York opened.
The second study examines the largest price
change observed in Tokyo hours during the sample
period—June 27, 1994. Japanese Prime Minister Tsutomu
Hata resigned on Saturday, June 25. On Monday, June 27,
the dollar declined in the foreign exchange market to a new
post–World War II low of 99.50 yen. News stories indi-
cated that U.S. Treasury securities were sold by dealers
and overseas investors on fears that the Fed would boost
interest rates to halt the dollar’s fall.
The five-year note opened on June 27 down
slightly from the June 24 close (Chart 10). The price made
two further downward jumps: in the 8:30 p.m. to 8:45
p.m. and the 11:30 p.m. to 11:45 p.m. (New York time)
intervals. The note finished in Tokyo down 25/100ths of a
point, a drop that was four times the magnitude of the
expected price change during Tokyo hours and about as
large as a typical daily change. It fell a few more hun-
dredths in late morning London before New York opened.
While the price rose slightly in early New York trading,
most of the Tokyo price movement was maintained.
CONCLUSION
Although the secondary market for U.S. Treasury securities
operates around the clock, it behaves more like U.S. equity
markets, with limited trading hours, than like the round-
the-clock foreign exchange market. Trading volume and
price volatility are highly concentrated during New York
trading hours, with a daily peak between 8:30 a.m. and 9 a.m.
and a smaller peak between 2:30 p.m. and 3 p.m. During
these hours, the u-shaped patterns of trading volume, price
volatility, and the bid-ask spread are similar to patterns
found in the equity markets (but not in the foreign
exchange market). The preponderance of relevant news
during New York trading hours and the fixed hours of the
CBT’s futures market seem to be the most likely determi-
nants of these intraday patterns.
Trading volume outside of New York hours is rela-
tively low, with less than 2 percent of round-the-clock volume
attributable to Tokyo hours and less than 4 percent attributable
to London hours. Although prices have at times moved
significantly during the overseas hours, price volatility tends
to be significantly lower overseas than in New York. Bid-ask
spreads are higher overseas than in New York and higher in
Tokyo than in London. The spreads exhibit a triple u pattern
across the global trading day corresponding to the start and stop
of trading in the three trading locations.
Despite the relatively low trading volume, low
price discovery, and high bid-ask spreads during the overseas
hours, overseas price changes of U.S. Treasury securities can
effectively predict overnight price changes in New York.
Lower liquidity notwithstanding, the overseas trading
locations provide important information on the path of
U.S. Treasury security prices.

APPENDIX A: PRIMARY GOVERNMENT SECURITIES DEALERS
APPENDIX FRBNY ECONOMIC POLICY REVIEW / JULY 1997 27
BA Securities, Inc.Bear, Stearns & Co., IncBT Securities CorporationBZW Securities Inc.Chase Securities Inc.CIBC Wood Gundy Securities Corp.Citicorp Securities, Inc.Credit Suisse First Boston CorporationDaiwa Securities America Inc.Dean Witter Reynolds Inc.Deutsche Morgan Grenfell/C.J. Lawrence Inc.Dillon, Read & Co. Inc.Donaldson, Lufkin & Jenrette Securities CorporationDresdner Kleinwort Benson North America LLC.Eastbridge Capital Inc.First Chicago Capital Markets, Inc.Fuji Securities Inc.Goldman, Sachs & Co.Greenwich Capital Markets, Inc.HSBC Securities, Inc.
Aubrey G. Lanston & Co., Inc.Lehman Brothers Inc.Merrill Lynch Government Securities Inc.J.P. Morgan Securities, Inc.Morgan Stanley & Co. Incorporated NationsBanc Capital Markets, Inc.Nesbitt Burns Securities Inc.The Nikko Securities Co. International, Inc.Nomura Securities International, Inc.Paine Webber IncorporatedParibas CorporationPrudential Securities IncorporatedSalomon Brothers Inc.Sanwa Securities (USA) Co., L.P.SBC Warburg Inc.Smith Barney Inc.UBS Securities LLCYamaichi International (America), Inc.Zions First National Bank
The primary government securities dealers as of June 6, 1997, were as follows:
Source: Federal Reserve Bank of New York (1997).
28 FRBNY ECONOMIC POLICY REVIEW / JULY 1997 APPENDIX
APPENDIX B: DATA DESCRIPTION
GovPX, Inc., supplies real-time market information through on-linevendors by sending out a digital ticker feed, daily backup copiesof which are used in this study. The data contained in the feedprovide a precise history of the trading information sent toGovPX subscribers. Any posting errors made by the interdealerbrokers that are not filtered out by GovPX are included in thebackup files. Additionally, since the purpose of the digital feed isto refresh vendors’ screens, the data must be processed beforethey can be effectively analyzed.
When a trade occurs, two pieces of information are typi-
cally transmitted by GovPX. First, during the “workup stage,”
when traders are jumping into a transaction, GovPX posts the
news that a bid is being “hit” or that an offer is being lifted
(a “take”); it also posts price and volume information. Seconds
later, the total volume of the trade(s) is posted. Transactions
occurring through the same interdealer broker at the same price
and virtually the same time are thus counted as a single transac-
tion. Occasionally, there are several lines of data per transaction,
but sometimes there is only a single line.
For this analysis, the volume data are processed to ensure
that each trade is counted only once. The aggregate daily volume
provided with each trade is helpful in this regard. Aggregate daily
volume data provided separately from the ticker feed are also useful
in ensuring data accuracy. The study identifies 243,222 unique
transactions over the ninety-day sample period, or an average of
2,702 per day.
Prices in U.S. Treasury notes and bonds are quoted in 32nds
and can be refined to 256ths. Transaction prices, as well as bids and
offers, are converted to decimal form for this analysis. Pricing errors are
also screened from the data set using a two-step procedure. First, large
trade-to-trade price movements that revert a short time later and are
clearly erroneous are screened out. Second, prices that are more than
ten standard deviations from the daily price mean or daily bid-ask
midpoint mean are screened out. Just over one price per day is
dropped, leaving an average of 2,701 prices per day.
A multistep procedure is used to screen quotes from the
data set:
• Bids are first screened for large quote-to-quote movementsthat revert a short time later. This first screen drops anaverage of 4 quotes per day.
• As offers in the data set are quoted off of the bids, largepositive spreads are indistinguishable from small negativeones. Spreads calculated to be greater than 0.9 (but lessthan 1.0) are likely to be negative spreads that existedonly momentarily when quotes arrived from two differentbrokers. These quotes (an average of 115 per day) aredropped.
• One-sided quotes (a bid or an offer, but not both) are occa-sionally posted by dealers. This study makes no use of thesebids (an average of 366 per day) or offers (an average of 287per day).
• Finally, spreads with bid-ask midpoints more than ten stan-dard deviations from the daily bid-ask midpoint mean ordaily price mean are dropped, as are spreads more than tenstandard deviations from the daily spread mean. This processscreens out an average of 9 quotes per day.
As spreads posted by the interdealer brokers do not include the
brokerage fee charged to the transaction initiator, zero spreads
are common and can persist for lengthy periods. Quotes calcu-
lated to be zero are therefore kept in the data set. The data set
retains 889,936 quotes from the sample period, or an average of
9,888 per day.
Once the data are cleaned, they are summarized by half-hour
period using the digital feed’s minute-by-minute time stamp.
The final data set contains market information on each security
for each half hour of the sample period, including volume, last
price, and mean bid-ask spread. Because information on market
participants and trading location is not available, the trading
location is assigned according to the time the information is
posted (Chart 1).
ENDNOTES
NOTES FRBNY ECONOMIC POLICY REVIEW / JULY 1997 29
The author thanks GovPX, Inc., for its data. Mitch Haviv, Jean Helwege,Frank Keane, Jim Mahoney, Amy Molach, Stavros Peristiani, AnthonyRodrigues, and Jeff Stehm provided helpful comments, as did Federal ReserveBank of New York workshop and seminar participants. The research assistanceof Ray Kottler and Irene Pedraza is gratefully acknowledged.
1. In contrast, trading volume on the New York Stock Exchangeaverages only about $9.7 billion per day (New York Stock Exchange1995).
2. Initially, data for the period March 1–August 31, 1994, wereobtained from the data provider, GovPX, Inc. However, the period wasshortened to April 4–August 19 to eliminate differences in the dataformat and to ensure that daylight saving time did not go into effectduring the sample period.
3. Although Treasuries are listed on the New York Stock Exchange,trading volume of all debt issues there (corporate bonds as well as U.S.government securities) averaged just $28.6 million per day in 1994(New York Stock Exchange 1995). Odd-lot trading of Treasuries takesplace on the American Stock Exchange, with an average volume of just$14 million per day in 1994 (American Stock Exchange 1996).
4. See U.S. Department of the Treasury et al. (1992). More informationon the structure of the secondary market can be found in this source andin Bollenbacher (1988), Madigan and Stehm (1994), Stigum (1990), andU.S. General Accounting Office (1986).
5. The major interdealer brokers are Cantor Fitzgerald Inc., GarbanLtd., Hilliard Farber & Co. Inc., Liberty Brokerage Inc., RMJ SecuritiesCorp., and Tullett and Tokyo Securities Inc.
6. These are the fees reported by Stigum (1990). Communication withmarket participants suggests that these fees are very similar today.
7. It is estimated that primary dealers also trade $18.3 billion per day inU.S. Treasury futures, $6.1 billion in forwards, and $7.8 billion in options.Primary dealers’ outstanding financing transactions (repurchase agreements,loaned securities, and collateralized loans) averaged $850 billion to$875 billion over this period.
8. The debt stood at $4,645.8 billion on June 30, 1994, $3,051.0billion of which existed in the form of marketable securities; foreigninvestors accounted for 20.5 percent ($633.2 billion) of the $3,088.2billion held by private investors (Board of Governors of the FederalReserve System 1995).
9. Trading increases to twenty-three hours per day when New Yorkswitches to eastern standard time. There is no trading on weekends.
Other sources on overseas activity in U.S. Treasury securities includeMadigan and Stehm (1994) and Stigum (1990).
10. All of the intraday data examined in this study fall within a periodwhen New York and London times are daylight saving time. Japan hasnot adopted daylight saving time.
11. Financing transactions involving U.S. Treasury securities are alsoconducted in New York, regardless of the trading time for or location ofthe associated cash trade.
12. As explained in the data description sections (see box andAppendix B), trading locations are assigned according to the time ofday a trade was made. For example, a trade at 7:45 a.m. is consideredto be a New York trade even though it may have originated in London(or elsewhere). This convention may bias the summary statistics for theindividual trading locations. The similarity of this article’s findings toearlier estimates reported by Stigum (1990)—93 percent for NewYork, 4 to 5 percent for London, 1 to 2 percent for Tokyo—suggeststhat the distribution of trading activity by location has been relativelystable in recent years.
13. Similarly, Barclay, Litzenberger, and Warner (1990) find negligibletrading volume in Tokyo for U.S. stocks listed on the Tokyo StockExchange.
14. As noted earlier, foreign investors accounted for 20.5 percent of theU.S. Treasury securities held by private investors on June 30, 1994; thisamount increased to 30.3 percent as of September 30, 1996 (Board ofGovernors of the Federal Reserve System 1995 and 1997).
15. In January 1997, the customary intervention time was movedforward one hour to around 10:30 a.m.
16. Madigan and Stehm (1994) believe that the high level ofintermediate note activity is driven by hedging activity for swaptransactions and underwritings.
17. Cash-management bills are very short-term bills (maturing in, say,fourteen days) issued on an unscheduled basis to meet immediate cashflow needs.
18. Because data from one of the six interdealer brokers are not availablefor the analysis, the figures may present a biased picture of the interdealermarket. In particular, the excluded broker is regarded as being strongerin the longer term issues than the other interdealer brokers.
19. Although volatility results based on actual trade prices are similar,use of the bid-ask midpoint results in many fewer missing observations
30 FRBNY ECONOMIC POLICY REVIEW / JULY 1997 NOTES
ENDNOTES (Continued)
Note 19 continuedin the overseas half-hour intervals. In addition, although volatility iscalculated in terms of nominal price changes, percentage price changenumbers look very similar. This similarity occurs because Treasury notesand bonds are issued at a price close to 100 and the on-the-run securitiesexamined in this study are recently issued securities, by definition.
20. For the 7:30 p.m. to 8 p.m. interval, the previous interval isconsidered to be 5 p.m. to 5:30 p.m.
21. More recent findings for the cash market also support thishypothesis (Fleming and Remolona 1996, 1997).
22. Karpoff (1987) reviews the literature. Recent studies in this areainclude Bessembinder and Seguin (1993) and Jones, Kaul, and Lipson(1994).
23. The five-year note is chosen for this and subsequent analyses becauseit is the security that is most actively traded between the primary dealers.Results are similar for other securities.
24. Although spreads are calculated as the nominal difference betweenthe bid and the ask prices, percentage bid-ask spreads look very similar.Treasury notes and bonds are issued at a price close to 100 and the on-the-run securities examined in this study are recently issued securities, bydefinition. None of the spread calculations incorporates interdealerbroker fees.
25. McInish and Wood (1992) review the components of the bid-askspread and cite much of the relevant literature.
26. As noted earlier, data from one of the six interdealer brokers are notincluded in the analysis. The daily spread averages may therefore besomewhat inaccurate—particularly in the longer term issues, in whichthe excluded broker is considered to be more active than the otherinterdealer brokers.
27. The relationship between spread and maturity for U.S. Treasurysecurities has also been documented in Tanner and Kochin (1971),Garbade and Silber (1976), and Garbade and Rosey (1977).
28. No bid-ask quote for the thirty-year bond is recorded for 40 percentof the Tokyo half-hour periods in the sample.
29. Average trade sizes for notes and bonds are similar in the threetrading locations (although slightly lower in New York), however,suggesting that bid and offer quantities are similar.
30. For example, the 4:30 p.m. to 5 p.m. mean bid-ask spread is basedon eighty-eight days of data for the two-, three-, five-, and ten-year notes,but only seventy-five days of data for the thirty-year bond.
31. Equity market studies include Demsetz (1968), Tinic (1972), Tinicand West (1972), Benston and Hagerman (1974), and Branch and Freed(1977). Foreign exchange market studies include Bollerslev andDomowitz (1993), Bollerslev and Melvin (1994), and Bessembinder(1994). Treasury market studies include Garbade and Silber (1976) andGarbade and Rosey (1977). Both Treasury market studies use daily dataand do not have volume figures.
32. The spread-volume correlation coefficients are -.26 (alllocations), -.22 (Tokyo), -.24 (London), and -.14 (New York), allsignificant at the .01 level. The spread-volatility coefficients are.00 (all locations), .27 (Tokyo), .32 (London), and .18 (New York), allsignificant at the .01 level with the exception of the “all locations”coefficient. The insignificant coefficient for “all locations” results fromlow spreads in New York in spite of high price volatility.
33. The authors regress overnight price changes in New York onoverseas price changes from the New York close. They find that overseasprice changes are generally biased predictors of overnight New Yorkprice changes, but that they were unbiased immediately after the October1987 stock market crash.
34. Mean trading volumes of $470 million (Tokyo) and $893 million(London) for on-the-run and when-issued securities were calculated usingdata from GovPX, which covers roughly two-thirds of the interdealerbroker market.
35. When each successive price observation depends only on theprevious one plus a random disturbance term, the price series is said tofollow a random walk. Generally speaking, a martingale process is arandom walk that allows price volatility to vary over time. A martingaleis therefore a process in which past prices have no information beyondthat contained in the current price that is helpful in forecasting futureprices.

REFERENCES
NOTES FRBNY ECONOMIC POLICY REVIEW / JULY 1997 31
Affleck-Graves, John, Shantaram P. Hegde, and Robert E. Miller. 1994.“Trading Mechanisms and the Components of the Bid-Ask Spread.”JOURNAL OF FINANCE 49: 1471-88.
American Stock Exchange. 1996. 1996 AMERICAN STOCK EXCHANGE FACT
BOOK.
Amihud, Yakov, and Haim Mendelson. 1986. “Asset Pricing and the Bid-Ask Spread.” JOURNAL OF FINANCIAL ECONOMICS 17: 223-49.
Andersen, Torben G., and Tim Bollerslev. Forthcoming. “DM-DollarVolatility: Intraday Activity Patterns, Macroeconomic Announcements,and Longer Run Dependencies.” JOURNAL OF FINANCE.
Baillie, Richard T., and Tim Bollerslev. 1990. “Intra-Day and Inter-MarketVolatility in Foreign Exchange Rates.” REVIEW OF ECONOMIC
STUDIES 58: 564-85.
Barclay, Michael J., Robert H. Litzenberger, and Jerold B. Warner. 1990.“Private Information, Trading Volume, and Stock-Return Variances.”REVIEW OF FINANCIAL STUDIES 3: 233-53.
Benston, George J., and Robert L. Hagerman. 1974. “Determinants of Bid-Asked Spreads in the Over-the-Counter Market.” JOURNAL OF
FINANCIAL ECONOMICS 1: 353-64.
Bessembinder, Hendrik. 1994. “Bid-Ask Spreads in the Interbank ForeignExchange Markets.” JOURNAL OF FINANCIAL ECONOMICS 35: 317-48.
Bessembinder, Hendrik, and Paul J. Seguin. 1993. “Price Volatility, TradingVolume, and Market Depth: Evidence from Futures Markets.”JOURNAL OF FINANCIAL AND QUANTITATIVE ANALYSIS 28: 21-39.
Board of Governors of the Federal Reserve System. 1994-97. FEDERAL
RESERVE BULLETIN, various issues.
Bollenbacher, George M. 1988. THE PROFESSIONAL’S GUIDE TO THE U.S.GOVERNMENT SECURITIES MARKETS: TREASURIES, AGENCIES,MORTGAGE-BACKED INSTRUMENTS. New York: New York Instituteof Finance.
Bollerslev, Tim, and Ian Domowitz. 1993. “Trading Patterns and Prices inthe Interbank Foreign Exchange Market.” JOURNAL OF FINANCE 48:1421-43.
Bollerslev, Tim, and Michael Melvin. 1994. “Bid-Ask Spreads andVolatility in the Foreign Exchange Market.” JOURNAL OF
INTERNATIONAL ECONOMICS 36: 355-72.
Branch, Ben, and Walter Freed. 1977. “Bid-Asked Spreads on the AMEXand the Big Board.” JOURNAL OF FINANCE 32: 159-63.
Brock, William A., and Allan W. Kleidon. 1992. “Periodic Market Closureand Trading Volume.” JOURNAL OF ECONOMIC DYNAMICS AND
CONTROL 16: 451-89.
Demsetz, Harold. 1968. “The Cost of Transacting.” QUARTERLY JOURNAL
OF ECONOMICS 82: 33-53.
Ederington, Louis H., and Jae Ha Lee. 1993. “How Markets ProcessInformation: News Releases and Volatility.” JOURNAL OF FINANCE
48: 1161-91.
Federal Reserve Bank of New York. 1997. “Memorandum to all PrimaryDealers and Recipients of the Weekly Press Release on DealerPositions and Transactions,” May 8.
Fleming, Michael J., and Eli M. Remolona. 1996. “Price Formation andLiquidity in the U.S. Treasuries Market: Evidence from IntradayPatterns Around Announcements.” Federal Reserve Bank of NewYork Research Paper no. 9633, October.
———. 1997. “What Moves the Bond Market?” Federal Reserve Bankof New York Research Paper no. 9706, February.
French, Kenneth R., and Richard Roll. 1986. “Stock Return Variances: TheArrival of Information and the Reaction of Traders.” JOURNAL OF
FINANCIAL ECONOMICS 17: 5-26.
Garbade, Kenneth D., and Irene Rosey. 1977. “Secular Variation in theSpread between Bid and Offer Prices on U.S. Treasury Coupon Issues.”BUSINESS ECONOMICS 12: 45-9.
Garbade, Kenneth D., and William L. Silber. 1976. “Price Dispersion in theGovernment Securities Market.” JOURNAL OF POLITICAL ECONOMY
84: 721-40.
Harris, Lawrence. 1986. “A Transaction Data Study of Weekly andIntradaily Patterns in Stock Returns.” JOURNAL OF FINANCIAL
ECONOMICS 16: 99-117.
Ito, Takatoshi, and V. Vance Roley. 1987. “News from the U.S. and Japan:Which Moves the Yen/Dollar Exchange Rate?” JOURNAL OF
MONETARY ECONOMICS 19: 255-77.
Jain, Prem C., and Gun-Ho Joh. 1988. “The Dependence between HourlyPrices and Trading Volume.” JOURNAL OF FINANCIAL AND
QUANTITATIVE ANALYSIS 23: 269-83.
32 FRBNY ECONOMIC POLICY REVIEW / JULY 1997 NOTES
REFERENCES (Continued)
Jones, Charles M., Gautam Kaul, and Marc L. Lipson. 1994. “Transactions,Volume, and Volatility.” REVIEW OF FINANCIAL STUDIES 7: 631-51.
Karpoff, Jonathan M. 1987. “The Relation between Price Changes andTrading Volume: A Survey.” JOURNAL OF FINANCIAL AND
QUANTITATIVE ANALYSIS 22: 109-26.
Laux, Paul A. 1993. “Trade Sizes and Theories of the Bid-Ask Spread.”JOURNAL OF FINANCIAL RESEARCH 16: 237-49.
Madigan, Brian, and Jeff Stehm. 1994. “An Overview of the SecondaryMarket for U.S. Treasury Securities in London and Tokyo.” Board ofGovernors of the Federal Reserve System Finance and EconomicsDiscussion Series, no. 94-17, July.
McInish, Thomas H., and Robert A. Wood. 1990. “An Analysis ofTransactions Data for the Toronto Stock Exchange.” JOURNAL OF
BANKING AND FINANCE 14: 441-58.
______. 1992. “An Analysis of Intraday Patterns in Bid/Ask Spreads forNYSE Stocks.” JOURNAL OF FINANCE 47: 753-64.
Neumark, David, P.A. Tinsley, and Suzanne Tosini. 1991. “After-HoursStock Prices and Post-Crash Hangovers.” JOURNAL OF FINANCE 46:159-78.
New York Stock Exchange. 1995. FACT BOOK FOR THE YEAR 1994.
Stigum, Marcia. 1990. THE MONEY MARKET. Homewood, Ill.:Dow Jones-Irwin.
Stoll, Hans R. 1989. “Inferring the Components of the Bid-Ask Spread:Theory and Empirical Tests.” JOURNAL OF FINANCE 44: 115-34.
Tanner, J. Ernest, and Levis A. Kochin. 1971. “The Determinants of theDifference between Bid and Ask Prices on Government Bonds.”JOURNAL OF BUSINESS 44: 375-9.
Tinic, Seha M. 1972. “The Economics of Liquidity Services.” QUARTERLY
JOURNAL OF ECONOMICS 86: 79-93.
Tinic, Seha M., and Richard R. West. 1972. “Competition and the Pricingof Dealer Service in the Over-the-Counter Stock Market.” JOURNAL
OF FINANCIAL AND QUANTITATIVE ANALYSIS 7: 1707-27.
U.S. Department of the Treasury, Securities and Exchange Commission, andBoard of Governors of the Federal Reserve System. 1992. JOINT REPORT ON
THE GOVERNMENT SECURITIES MARKET. January.
U.S. General Accounting Office. 1986. “U.S. Treasury Securities: TheMarket’s Structure, Risks, and Regulation.” GAO/GGD-86-80BR,August.
Wall Street Journal. 1991. “Several Firms Plan to Start Service on BondPrices.” June 12.
Wood, Robert A., Thomas H. McInish, and J. Keith Ord. 1985. “AnInvestigation of Transactions Data for NYSE Stocks.” JOURNAL OF
FINANCE 40: 723-39.
The views expressed in this article are those of the authors and do not necessarily reflect the position of the FederalReserve Bank of New York or the Federal Reserve System. The Federal Reserve Bank of New York provides no warranty,express or implied, as to the accuracy, timeliness, completeness, merchantability, or fitness for any particular purpose ofany information contained in documents produced and provided by the Federal Reserve Bank of New York in any form ormanner whatsoever.