The Roles of Disorder, Attitudes Toward the Legal System ...
55
University of New Mexico UNM Digital Repository Sociology ETDs Electronic eses and Dissertations 6-26-2015 e Roles of Disorder, Aitudes Toward the Legal System, and Neighborhood Satisfaction in the Intervention During Neighborhood Problems Erin Coleman Follow this and additional works at: hps://digitalrepository.unm.edu/soc_etds is esis is brought to you for free and open access by the Electronic eses and Dissertations at UNM Digital Repository. It has been accepted for inclusion in Sociology ETDs by an authorized administrator of UNM Digital Repository. For more information, please contact [email protected]. Recommended Citation Coleman, Erin. "e Roles of Disorder, Aitudes Toward the Legal System, and Neighborhood Satisfaction in the Intervention During Neighborhood Problems." (2015). hps://digitalrepository.unm.edu/soc_etds/10
Transcript of The Roles of Disorder, Attitudes Toward the Legal System ...

University of New MexicoUNM Digital Repository
Sociology ETDs Electronic Theses and Dissertations
6-26-2015
The Roles of Disorder, Attitudes Toward the LegalSystem, and Neighborhood Satisfaction in theIntervention During Neighborhood ProblemsErin Coleman
Follow this and additional works at: https://digitalrepository.unm.edu/soc_etds
This Thesis is brought to you for free and open access by the Electronic Theses and Dissertations at UNM Digital Repository. It has been accepted forinclusion in Sociology ETDs by an authorized administrator of UNM Digital Repository. For more information, please contact [email protected].
Recommended CitationColeman, Erin. "The Roles of Disorder, Attitudes Toward the Legal System, and Neighborhood Satisfaction in the Intervention DuringNeighborhood Problems." (2015). https://digitalrepository.unm.edu/soc_etds/10

i
Erin R. Coleman Candidate Department of Sociology Department This thesis is approved, and it is acceptable in quality and form for publication: Approved by the Thesis Committee: Dr. María Vélez, Chairperson Dr. Christopher Lyons Dr. Brian Soller

ii
THE ROLES OF DISORDER, ATTITUDES TOWARD THE
LEGAL SYSTEM, AND NEIGHBORHOOD SATISFACTION IN THE INTERVENTION DURING NEIGHBORHOOD
PROBLEMS
by
ERIN R. COLEMAN
BACHELOR OF ARTS LOYOLA UNIVERSITY
NEW ORLEANS
THESIS
Submitted in Partial Fulfillment of the Requirements for the Degree of
Master of Arts
Sociology
The University of New Mexico Albuquerque, New Mexico
May, 2015

iii
ACKNOWLEDGEMENTS
I would like to acknowledge Dr. María Vélez for her mentorship and guidance, which allowed me to complete my Master’s thesis. I would also like to acknowledge Dr. Christopher Lyons and Dr. Brian Soller for their comments and guidance on previous drafts. Thank you to all who helped me accomplish my goal.

iv
THE ROLES OF DISORDER, ATTITUDES TOWARD THE LEGAL SYSTEM, AND NEIGHBORHOOD SATISFACTION
IN THE INTERVENTION DURING NEIGHBORHOOD PROBLEMS
by
Erin R. Coleman
B.A., Loyola University New Orleans, 2010 M.A., University of New Mexico, 2015
ABSTRACT
A key idea in the communities and crime literature is that residents need to take
ownership and intervene as a strategy to solve community problems including
crime. This process is part of a larger concept called community social organization,
which refers to the ability of a neighborhood to achieve collective goals like public
safety. It is important to understand what predicts intervention at the micro-‐level as
individuals will likely not react the same to similar neighborhood characteristics.
How do individual perceptions of neighborhood characteristics influence a resident
to intervene during a neighborhood problem? Furthermore, do perceptions of these
characteristics motivate individuals to intervene informally or formally to
neighborhood problems? I use a survey of Oakland, CA residents and employ logistic
regression to test how perceptions of disorder, attitudes toward the legal system,
and neighborhood satisfaction influence individuals’ willingness to intervene during
neighborhood problems. I find that these perceptions influence the likelihood that
individuals will intervene during a neighborhood problem and that they work
differently for informal and formal intervention.

v
TABLE OF CONTENTS
LIST OF FIGURES ................................................................................................... vi
LIST OF TABLES ..................................................................................................... vii
CHAPTER 1 INTRODUCTION .............................................................................. 1
CHAPTER 2 INTERVENING IN NEIGHBORHOOD PROBLEMS ................. 5
Disorder ....................................................................................................................... 6
Attitudes Toward the Legal System .............................................................................. 9
Neighborhood Satisfaction........................................................................................... 11
CHAPTER 3 DATA & METHODS ......................................................................... 14
Data.............................................................................................................................. 14
Dependent Variables .................................................................................................... 14
Independent Variables ................................................................................................. 15
Controls ....................................................................................................................... 17
Analytic Strategy .......................................................................................................... 18
Missing Data ................................................................................................................ 19
CHAPTER 4 RESULTS ............................................................................................ 20
Descriptives .................................................................................................................. 20
General Intervention .................................................................................................... 23
Informal Intervention ................................................................................................... 30
Formal Intervention ..................................................................................................... 33
CHAPTER 5 DISCUSSION & CONCLUSION ..................................................... 37
REFERENCES ........................................................................................................... 43

vi
LIST OF FIGURES
Figure 1: Social Disorder and the Likelihood of Intervention ..................................... 26
Figure 2: Physical Disorder and the Likelihood of Intervention ................................. 27

vii
LIST OF TABLES
Table 1: Descriptives ................................................................................................... 22-23
Table 2: Regression on the Willingness to Intervene .................................................. 29-30
Table 3: Regression on Informal Intervention ............................................................. 32-33
Table 4: Regression on Formal Intervention ............................................................... 35-36

1
CHAPTER 1
INTRODUCTION
A key idea in the communities and crime literature is that residents need to
take ownership and intervene as a strategy to solve community problems including crime.
This process is part of a larger concept called community social organization, which
refers to the ability of a neighborhood to achieve collective goals like public safety
(Bursik 1988). To investigate how intervention matters for community problem solving,
most scholars conceptualize it as a neighborhood-level process. That is, neighborhoods
are thought to vary in their ability to intervene to solve problems. One way this has been
examined is via the work on collective efficacy. Sampson, Raudenbusch, and Earls
(1997) conceptualize collective efficacy as neighborhood-level social cohesion, mutual
trust among neighbors, and residents’ willingness to intervene. They find that the
presence of collective efficacy decreases violent crime in neighborhoods (Sampson et al.
1997).
The current study is primarily concerned with the intervention aspect of
community social organization, or the “willingness to intervene”, as this is pinnacle to
crime control in neighborhoods. Unfortunately, the macro-level focus common in social
organization research neglects variation within the neighborhood regarding the decision
to intervene. That is, individuals within neighborhoods vary in their likelihood that they
will take ownership and intervene during neighborhood problems. First, neighborhood
residents need to perceive a situation as a problem. Second, they need to decide whether
and how they will intervene (Hirsh and Lyons 2010). Because individuals have to
perceive situations as problems, not everyone will interpret the same situation negatively

2
or even give it the same level of importance (Browning, Soller, Gardner, and Brooks-Gun
2013). The exclusion of micro-level research on the willingness to intervene is
problematic given that the decision to intervene is likely made at the individual level.
Perhaps just as important as the ecological factors that determine intervention
are the perceptions people hold toward their neighborhoods. This study is concerned with
how individual perceptions of their neighborhoods influence whether they intervene after
identifying a problem. How one feels about their neighborhood and the processes within
it may shed light on variation within individuals mobilizing against neighborhood
problems. Sharkey (2006) points to the inherent difficulty that scholars face when trying
to understand how neighborhood context influences individual behavior and urges us to
account for individual agency within social contexts such as neighborhoods to account
for variation in individual behavior. I thus take seriously the notion that subjective
appraisals of neighborhood dynamics will influence the odds of an individual intervening
during a neighborhood problem.
To address this gap in the literature, I examine a sample of residents in
Oakland, CA during the early 1980s to determine what drives individual-level
intervention during neighborhood problems. Drawing on the literature on urban
communities, I pay particular attention to three factors that may predict the odds of
intervention. First, I focus on perceptions of disorder, which could be trash on the streets,
open drug-use, or abandoned buildings in the neighborhood. Some research finds that
disorder in neighborhoods impacts perceptions of safety among residents and decreases
collective intervention in neighborhoods (Skogan 1992). Second, research suggests that
attitudes toward the legal system influence whether residents mobilize sanctioned social

3
control to combat problems and crime in neighborhoods (Kirk and Matsuda 2011; Kirk
and Papachrsitos 2011; Sampson and Bartuch 1998). And lastly, Silver and Miller (2004)
find that increases in quality of life predict higher levels of informal intervention in
neighborhoods by using neighborhood satisfaction as a potential determinant of
intervention.
Not only do I conceptualize intervention as a function of perceptions of
neighborhood characteristics, I also investigate whether these perceptions influence the
use of informal methods to intervene (e.g., talk with neighbors, attend neighborhood
meetings) or more formal methods (e.g., call the police, call the city). It may be that
certain perceptions, such as negative attitudes toward the police, will decrease the
likelihood that an individual will call upon formal methods of intervention and increase
the likelihood of informal methods of intervention. The point here is that certain
appraisals of neighborhood dynamics may work differently in their ability to influence
the strategies residents use to combat neighborhood problems.
This study is unique in several ways. First, the questions regarding resident
responses to identified neighborhood problems are non-hypothetical. By asking the
respondent what they actually did after they identified an issue, this study is better able to
determine how perceptions shape individual mobilization, and provides a truer picture of
how residents react to problems. Second, many surveys that lend themselves to
measurements of collective efficacy (Sampson et al. 1997) ask respondents how they
think their neighbor would intervene. Although this approach is perhaps better able to
measure social cohesion and mutual trust, it does not capture the potential mechanisms
that motivate an individual to intervene and not their neighbor. This is an important

4
distinction because perceptions do not always mirror reality. One may perceive or assume
that a neighbor would or would not intervene, but that may be inaccurate. Having direct
measures of individual intervention allows me to better understand the potential
mechanisms that influence people to get involved. I estimate a series of logistic
regressions to assess the possible influences individual perceptions have on the decision
to mobilize around identified neighborhood problems.

5
CHAPTER 2
INTERVENING IN NEIGHBORHOOD PROBLEMS
One of the most robust findings in the communities and crime literature is that
the willingness to intervene during neighborhood problems decreases crime in
neighborhoods (Sampson et al 1997). It is therefore important to understand what
motivates individuals to get involved and take ownership over neighborhood dynamics as
this helps increase social organization in communities. Neighborhood characteristics
predict levels of social organization in neighborhoods but these conditions cannot be
measured at the individual level. Therefore I rely on how residents subjectively appraise
their neighborhoods to better understand how perceptions of neighborhood characteristics
influence individuals to intervene. Furthermore, I differentiate between informal and
formal strategies of intervention to better understand how perceptions of different
neighborhood dynamics may influence individuals to use different methods of
intervention.
I pay attention to two types of strategies individuals use to intervene: informal
and formal. Informal intervention (or informal social control) refers to a neighborhood’s
ability to curb crime by regulating the behavior of residents and socializing residents to
be law-abiding (Bursick and Grasmick 1993; Sampson and Groves 1989; Vélez 2014).
Formal social control focuses on how the police are called to address problems in the
neighborhood (Holmes et al. 2008) and on people’s willingness to call the police in
response to a problem or victimization (Doyle and Lukenbill 1991; Goudriaan,
Wittebrood, and Nieuwbeerta 2005; Greenberg and Beach 2004; Slocum et al. 2010).
Other bodies of research in this area focus on mobilizing the law, which could involve

6
calling the police or even a lawyer to settle a dispute (Baumer 2002; Black 1973 1976
1983; Gottfredson and Hindelang 1979).1
Below I review the relevant literature regarding how disorder, attitudes toward
the legal system, and neighborhoods satisfaction may influence the willingness to
intervene, and how each may differentially impact the strategies individuals use when
they do intervene.
Disorder
Skogan (1992) identifies two types of neighborhood disorder: physical and
social. Social disorder refers peoples’ behavior in a neighborhood such as open drug-use,
hostility, and other anti-social behaviors. Physical disorder refers to things like
abandoned buildings in the neighborhood and trash on the streets. Disorder may increase
resident’s fear of crime thereby impacting whether residents intervene during a problem
by possibly affecting their perception of safety to do so, or their perception that
intervening will accomplish their goal (Skogan 1992). This means that disorder likely
affects whether or not someone intervenes, and it also may affect the strategies
individuals utilize if they do decide to intervene.
Disorder sets in motion processes that likely impinge upon informal
intervention. This is evident from the finding that high levels of disorder within in a
neighborhood increase fear of crime (Lee 1981; Markowitz et al. 2001; Perkins and
Taylor 1996; Skogan 1992), which in turn breaks down a neighborhood’s ability to
1 Public social control is a neighborhood’s ability to solicit resources from the mayor’s office, public resources such as funds for various cleanup efforts (Medoff and Sklar 1994), and to relate with city officials who tend to the needs of a community (Vélez 2001). Although formal and public control are similar, nuances emphasize that agents of formal social control such as police are state-operated, whereas public social control focuses more on the resources provided by banks giving loans, and communities having relationships with the mayor’s office or other public offices (Vélez 2001). For the purpose of this paper, the term ‘formal’ social control will embody both public and formal.

7
exercise informal social control in their neighborhood by negatively impacting cohesion
(Markowitz et al. 2001). Skogan (1992) finds that the consequences of disorder, both
physical and social, are detrimental for neighborhoods. Specifically, he identifies disorder
as causing withdrawal and lack of cooperation between residents, and it also undermines
the housing market, which encourages resident mobility and decreases ties within the
community thought to foster collective efficacy.
Disorder likely impacts the use of formal and public interventions (or formal
social control). Formal interventions are an important strategy for communities to curb
crime and disorder in the neighborhood, and has received some attention in the
criminology literature (Bursik and Grasmick 1993; Sampson, Morenoff, and Gannon-
Rowley 2002; Vélez 2001). For a community to employ formal social control it must
have relationships with public officials and the police department that are outside the
community (Bursick and Grasmick 1993; Vélez 2001). In disadvantaged neighborhoods
in particular, relationships with public officials provide important resources to combat
neighborhood disorder because these neighborhoods often lack the internal resources to
do so (Vélez 2001). Even the most affluent neighborhoods must rely on public officials
for disorder grievances; however, the levels of disorder in these neighborhoods never
reach those in disadvantaged neighborhoods (Peterson and Krivo 2010; Skogan 1992).
There is evidence that formal social control and resources provided by the city
can help eliminate disorder; however, there is relatively little research on how disorder
impacts the use of formal social control. Some neighborhoods experience lack of formal
social control. In addition, the presence of formal controls may not provide residents with
the resources needed to curb crime and disorder (Black, 1983; Carr et al., 2007). Without

8
resources, neighborhoods may lack the ability to address building dilapidation, removal
of abandoned cars, and unsightly disorder such as graffiti and trash on the streets.
Securing help from city-led institutions contributes to a neighborhood’s ability to keep
their community free from these types of problems (Medoff and Sklar 1994; Skogan
1992). Having high-levels of disorder may be the product of a lack of relationships with
formal controls and resources.
I have several hypotheses for social and physical disorder. One predicted
outcome is a curvilinear relationship between perceived levels of disorder and individuals
taking action. Skogan (1992:69) identifies this relationship to be as follows: as disorder
increases so will residents’ willingness to combat it; however, at a certain level of
disorder residents may become too debilitated and their willingness and ability to do
something about it decreases. Those who perceive high levels of disorder may be
demoralized and suffer from distrust. In sum, the curvilinear relationship between
intervention and perceptions of disorder predicts that at low levels of perceived disorder
individuals would have no reason to engage in solving the problem as they may not
perceive low levels of disorder as something to mobilize around. At very high levels of
disorder individuals are less likely to engage in solving the problem; it is in the middle
where perceptions of disorder motivate individuals to intervene on behalf of their
neighborhood (Skogan 1992).
Furthermore, levels of neighborhood disorder may elicit differential modes of
social control. Perhaps residents that identify high levels of disorder are less likely to use
informal social control as Skogan (1992) predicts. If disorder causes community
withdrawal and residential mobility, then the ability for a community to come together to

9
control neighborhood affairs may be weakened. Consistent with some of the legal
cynicism literature, residents who live in neighborhoods suffering from high levels of
disorder may be more inclined to utilize formal control mechanisms over informal ones
(Avakame et al. 2006; Carr et al. 2007; Putnam 1993). For instance, Avakame et al.
(2006) found that residents within disadvantaged neighborhoods called the police more
often than middle-class residents living in less-disadvantaged neighborhoods in response
to problems. Furthermore, in Putnam’s (1993) study of democracy in Italy, he found that
because residents in southern Italy lacked the neighborhood ties and cohesion needed to
exert informal social control they relied on formal social control to address issues in the
community. Although the aforementioned research does not use levels of disorder to
predict outcomes, they do find that disadvantaged neighborhoods, often characterized as
having higher levels of disorder, is a key predictor for decreased intervention. These
outcomes may indicate that individuals residing in neighborhoods experiencing high
levels of disorder have not been able to maintain ties and trust with their neighbors,
which are needed to effectively control their neighborhood, and therefore would have to
rely on more formal mechanisms of social control.
Contrary to the above mentioned research I expect to find a curvilinear
relationship for all types of intervention. Previous research has neglected to test for this
relationship and I believe that testing for the curvilinear effect will provide a more
complete picture of how disorder impacts intervention. I expect to find the curvilinear
relationship for both types of disorder and for all types of intervention.
Attitudes Toward the Legal System

10
I draw from the literature on legal cynicism to conceptualize why these
attitudes will impact intervention. Recent research on legal cynicism refers to the
perception that the legal system, often experienced via the police, is illegitimate,
unresponsive, and unable to deter crime in neighborhoods (Kirk and Matsuta 2011; Kirk
and Papachristos 2011). Kirk and Matsuda (2011) found that high levels of legal
cynicism decreased collective efficacy thereby decreasing the ability to exert informal
social control in the neighborhood. In another illustration of how perceptions of the legal
system impact informal social control, Silver and Miller (2004) found that satisfaction
with the police is a source of increased informal social control within neighborhoods.
Specifically, they found that when residents viewed the police as a viable local resource,
they were more willing to intervene informally. They hypothesized that this may be due
to residents perceiving their neighborhoods as places worth defending and felt a
responsibility to maintain order when they thought neighborhood resources were
available and responsive (Silver and Miller 2004).
The influence of attitudes toward the legal system on employing formal social
control is complicated. On the one hand, many scholars demonstrate how individuals
(Avakame et al. 1999; Black 1983) are less willing to report crime when formal social
controls are considered illegitimate and unresponsive. On the other hand, communities
that suffer from social disorganization call upon formal social controls to curb crime and
disorder due to a lack of informal social controls (Carr et al. 2007; Putnam 1994). When
neighborhoods lack the mechanisms to informally control their neighborhoods, formal
social controls can be another option for relief.

11
Illustrating the complex relationship between attitudes toward the legal system
and formal social control, Carr et al. (2007) find in their qualitative study of three
neighborhoods in Philadelphia that although youth in the neighborhood reported negative
attitudes toward the police, their recommendations for decreasing crime was to have a
larger and tougher police presence in the neighborhood. This study shows that individuals
can hold negative attitudes toward the legal system and yet hold contrary positive
attitudes toward its utility (i.e., performance of the legal system). This distinction may
have implications for how scholars measure attitudes toward the legal system and I
therefore separate perceived levels of the fairness of the legal system from the
perceptions that the legal system is performing well. Research has shown there is a
difference between perceptions of performance and perceptions of fairness with regard to
legal institutions (Tyler 2004). In other words, a person can believe in the fairness of the
legal system without necessarily perceiving the legal system as performing well, and vice
versa.
I hypothesize that an increase in favorable attitudes toward the fairness of
formal social control will positively influence whether residents react by calling the
police or city in response to problems and disorder. Favorable attitudes toward the
performance of the legal system may decrease residents’ willingness to call upon formal
methods of social control owing to their sense that the system works properly and
therefore requires no prompting.
Neighborhood Satisfaction
Neighborhood satisfaction depends on evaluations of the physical and social
characteristics of the neighborhood and also on the ease of use of services in the

12
neighborhood (Ringel and Finkelstein 1991).2 Following Silver and Miller’s (2004)
finding that when residents consider their neighborhoods to be decent places to live they
engage in more informal social control, I use a measure of neighborhood satisfaction to
predict the likelihood of individual intervention. Silver and Miller (2004) urged future
research to identify specific ‘use values’3 such as proximity to local services and
satisfaction with institutions such as schools, to develop a better understanding of how
satisfaction with these resources may increase attachment to neighborhoods thereby
increasing informal social control.
The current study focuses on perceptions of neighborhood and therefore, the
perceptions of physical and social characteristics and ease of use of services that
individuals have toward their neighborhood are used as predictors of intervention.
Motivation to include neighborhood satisfaction derives from an idea that being satisfied
with one’s neighborhood and the institutions within it may indicate a sense of reciprocity
causing residents to feel more of an obligation to enforce social rules/norms/codes. If
residents report high levels of satisfaction in their neighborhood it may signify higher
levels of social organization within the community, whereby they will be better able to
collectively control problems using informal social control mechanisms.
2 There is debate in the literature regarding the difference between neighborhood attachment and neighborhood satisfaction and the utility, if there is one, in separating them. Scholars have concluded that although neighborhood attachment and neighborhood satisfaction are highly correlated, they do indeed embody different things (Ringel and Finkelstein 1991). Neighborhood attachment refers to “a complex system of friendship and kinship networks and formal and informal associational ties rooted in family life and ongoing socialization processes." (Kasarda and Janowitz 1974: 329; see also Taylor 1996). That said, neighborhood attachment is often measured by the presence of family or friends in the neighborhood or the time spent living in the neighborhood, but this study is more concerned with perceptions and not the presence of an actual relationship. 3 Logan and Molotch (1987) first identified ‘use value’ as a property of a place. Individuals use that place to access other resources. For instance a place or residence will have a higher ‘use value’ if it provides access to better schools.

13
Although there is a plethora of research on neighborhood satisfaction, scant
research considers how it relates to the use of informal social control at the macro- or
micro-level. That said, Silver and Miller (2004) concluded that perceptions of good
quality of life increase informal social control at the neighborhood level. Scholars who
examine neighborhood satisfaction have long concerned themselves with the
determinants of satisfaction, but research neglects the outcomes of varying levels of
satisfaction. How one feels about their neighborhood, and their perceptions of satisfaction
with it are important; those who report higher satisfaction may feel more ownership over
neighborhood dynamics. It may be that they are satisfied because they are involved, or it
may be that their satisfaction relates to outside resources in the neighborhood that help
keep the community safe and disorder-free.
How neighborhood satisfaction shapes formal intervention is unclear in the
literature. However, Lee and Guest’s (1983) study is instructive. They find that higher
socioeconomic statuses and less dense neighborhoods yield higher levels of
neighborhood satisfaction. These advantages are structural in nature and point to the
existence of formal relationships to access the resources needed to realize community
goals. Although intervention is not a commonly discussed variable in the neighborhood
satisfaction literature, surely a community goal is to have a crime-free environment and
residents’ willingness to intervene during problems is pinnacle to realizing that goal.
I hypothesize that higher levels of neighborhood satisfaction will predict
residents acting to rectify perceived neighborhood problems informally due to a sense of
responsibility to maintain order. I do not expect a relationship between neighborhood
satisfaction and formal social control.

14
CHAPTER 3
DATA & METHODS
Data
Data for this project come from the Study of Race, Crime, and Social Policy in
Oakland, CA. (Street, 1976-1982).4 This study collected information from eight ethnic
neighborhoods in Oakland to better understand racial and ethnic disparities in crime. The
combined sample of residents is derived from a citywide sample (in which residents are
not connected to any particular neighborhood) and a sample of residents living in eight
different neighborhoods. The sample in this study is 1,930; however, the final sample size
for the current study is 1,799 after recoding.5 The survey does not ask what the
respondent thinks their neighbor would do or even what respondent would do. It asks
them what they did providing a better picture of intervention than asking why they think
their neighbor would do during a problem. Respondents were able to be more specific
when reporting their actions allowing for differentiation between formal and informal
intervention. Furthermore, the survey has adequate measures for individual perceptions
4 Although the data are over 20 years old, their effectiveness in measuring non-hypothetic reactions to disorder, and their ability to measure individual attitudes and perceptions of both the legal system and neighborhood characteristics are unrivaled in available data for testing how perceptions influence the odds individuals will intervene, and also for separating informal and formal strategies of intervention. 5 Cases were dropped from the analysis if they were missing for the dependent variables. Additional cases were dropped if they were missing on their race/ethnicity or their gender because those variables were used to impute other missing data. More information on missing data is provided in the following sections.

15
about their neighborhoods, levels of both social and physical disorder, the functioning of
the legal system, and neighborhood satisfaction.
Dependent Variables
I measure intervention with three dichotomous variables. The first dependent
variable asks respondents to rate the levels of disorder in their neighborhood; after
identifying the problems they perceived, they were asked whether they “did anything”
about the problem. Respondents could answer yes=1 or no=0 to this question. This
variable is referred to as “general intervention” as it does not specify what the respondent
did exactly about the problem, just that they did “something”.
Respondents were then asked “what” they did to intervene. Respondents who
intervened informally answered that they intervened by talking with neighbors about the
problem, got involved themselves with the problems, or went to neighborhood meetings
to address the problems. Respondents answered yes=1 or no=0. Respondents who reacted
formally reported intervening by calling the police, or calling the city about the problem.
Respondents answered yes=1 or no=0. Answers to these questions are not mutually
exclusive.
Independent Variables
Below are descriptions of each key independent variable. All independent
variables are scales that are standardized to assess how each respondent’s score deviates
from the mean.
Social and Physical Disorder: Respondents were asked to rate the level of
disorder in their neighborhood. Social and physical disorders are separated as the
literature suggests that different types of disorder may yield different reactions from

16
residents (Skogan 1992). Respondents were read a list of types of disorder that happen in
some neighborhoods and the interviewer asked the respondent to rate (on a scale from 0
to 100) how big a problem they perceived each item on the list to be in their
neighborhood. For social disorder, respondents were asked to rate: noisy neighbors;
troublemakers on street; reckless drivers in area; problems of drug use; and racial
conflict. A standardized scale was created from the responses to these problems (α=.76).
Physical disorder is measured by respondents rating how big a problem the
following neighborhood attributes are in their neighborhood: poor care of homes and
yards; abandoned houses and buildings; streets in bad repair; abandoned cars; and poor
street lighting. A scale was created from residents’ responses (α=.75). Physical and social
disorder are highly correlated (r= .73) and will therefore be tested in separate models to
account for multicollinearity. A quadratic is introduced in order to examine whether
residents become too debilitated by high levels of both social and physical disorder at a
certain level of disorder.
Perceptions of the Legal System: Two domains were used to measure
perceptions of the legal system. First, respondents answered questions about their
perceptions of the fairness of the legal system. Second, respondents were asked how well
they perceived the legal system to perform their duties. Respondents were asked to rate
the fairness the average: police officer, district attorney, judge, public defender, and
private lawyer show toward people like yourself. Respondents’ answers could range from
0 to 100 with a zero representing absolute unfairness and one hundred representing
absolute fairness. In addition, respondents were asked, “how fair a trial can members of
the following groups get in Alameda County?” Using the 0 to 100 scale, respondents

17
rated the fairness of a trial for: working class people like bus drivers; Asians; unemployed
poor like welfare people; Hispanic people; Black people; and for American Indians.
These answers where then combined to create a standardized scale (α=.91). Respondents
answered similar questions regarding the performance of the average police officer,
district attorney, judge, public defender, and private lawyer. Answers to these questions
were combined into a standardized scale (α=.72).
Perceptions of Neighborhood Satisfaction: For neighborhood satisfaction,
respondents were asked how satisfied they were with various elements in their
neighborhoods, with 0 representing no satisfaction and 100 representing complete
satisfaction. Respondents were asked to rate how satisfied they were with the quality of
schools; convenience of shopping; convenience of transportation; safety of the
neighborhood; housing for the money; racial composition; having friends in the
neighborhood; and living in Oakland. There are 8 items in the satisfaction standardized
scale (α=0.71).
Controls
I begin with demographic controls that may be associated with the odds of
intervention. Sex is measured as a dummy variable (female=1; male=0). Age is captured
by the year the respondent reported as their birth subtracted from the year the survey was
administered and ranges from 16 to 90. Income is measured with 9 categories, ranging
from 1 for no income and 9 as the largest income category.6 All race categories are
measured as mutually exclusive dummy variables representing white, black, Hispanic and
Asian. Respondents who chose ‘other’ as a racial category were dropped from the
6 Income categories as follows (1=No income; 2=Up to $5,000; 3=Up to $8,000; 4=Up to $12,000; 5=Up to $18,000; 6=Up to $25,000; 7=Up to $35,000; 8=Up to $45,000; 9=Up to $45,000; 10=Over $45,000)

18
analysis due to their small sample size (N=27). Education is measured with a categorical
variable ranging from 1 to 10.7
In addition to demographic controls research points to residential mobility,
years residing in the neighborhood, and having friends and family within the
neighborhood as affecting residents’ willingness to intervene in a neighborhood problem
(Shaw and McKay 1942; Sampson et al 1997). Fear of crime is another variable thought
to influence a person’s willingness to use social control mechanisms (Markowitz et al.
2001) and is in the model to assess its influence over individual decision-making.
Residential mobility is measured by the respondent answering how likely they
were to move from the neighborhood. A Likert-type scale was used where definitely
move=1 and definitely not move=5. Years in the neighborhood was operationalized by
subtracting the year the respondent moved into the neighborhood from the year of the
survey. Respondents who reported having friends and/or family in the neighborhood were
coded yes=1 and no=0 for having ties in the neighborhood. Fear of crime is a scale
comprised of a Likert scale asking the respondent about how likely they felt to be a
victim of a certain crime in their neighborhood and how much crime they perceived in
their neighborhood (α=.91).8
Analytic Strategy
Due to the dichotomous nature of the dependent variables. I use logistic
regression for this analysis. I adjust for where respondents live by coding if they are a
7 Education categories as follows: (1=None; 2=Some grade school; 3=8th grade or junior high; 4=Some high school; 5=High school diploma or equivalent; 6=Some college; 7=Bachelor’s degree; 8=Master’s degree; 9= Ph. D.; 10= Law or Medicine degree. 8 The scale consists of the following questions: Level of crime in the neighborhood; chances of being burglarized; chances of being robbed; chances of having car stolen; chances having car vandalized; chances of being de-frauded; chances of assaulted; chances of raped; chances of money stolen at work; chances of a hit & run accident; chances of injured by drunk driver; chances of theft from R’s car.

19
part of the citywide sample=0 or neighborhood sample=1. Furthermore, I use robust
standard errors due to residents being clustered in neighborhoods.
Missing Data
Many of the scales that make up the independent variables had missing data. In
order to keep as many cases as possible, I used the mi impute regress command in
STATA to predict the values of the missing variables. Using this command, STATA is
able to create several imputations and then average across the imputations to replace the
missing values with predicted values (this study includes fifteen imputations per variable
with the rseed set at 1234). To predict missing values for certain individuals, the mi
impute regress command uses demographic information of respondents. The sex,
neighborhood and race/ethnicity were used to predict the value that the individual may
have answered given their demographic information. Further motivation to impute the
missing values is that all the questions were asked regardless of respondents’ answers to
previous questions. This technique is well used in micro level data and is thought to be an
adequate modeling system to deal with missing data. Data must be missing less than 50%
of the time for this to be an adequate modeling system (Schafer and Olsen 1998).

20
CHAPTER 4
RESULTS
Descriptives
Table 1 reports the basic descriptive patterns with my data.9 The first
dependent variable captures residents’ general intervention in neighborhood problems. A
total of about 39.00% of residents reported intervening. Respondents then had the option
of reporting how they intervened (informally or formally); 22.07% of respondents
reported informal interventions, and 18.62% reported formal interventions when
problems arose.
Given that my measures of social disorder, physical disorder, performance of
the legal system, fairness of the legal system, and neighborhood satisfaction are indices
their means will be at zero. I will therefore give examples of their non-standardized sub-
components. Residents did not report very high levels of social disorder in their
neighborhoods. For example, the average resident had a score of 27.19 (S.D. = 26.52) for
“noisy neighbors”. The highest average for the sub-components was for “reckless
drivers” (32.90; S.D. = 30.58). The lowest average for the sub-components of social
disorder was for “racial conflict in neighborhood” (12.67; S.D. = 20.44). The lowest
average for the sub-components of physical disorder was for “abandoned houses and
9 I report the unstandardized descriptives for the sub-components of the scales to allow for a more intuitive interpretation of the mean, standard deviation, minimum, and maximum.
21
buildings” (11.24; S.D. = 20.68). The highest average reported for the subcomponents of
physical disorder was for “poor care of homes and yards” (29.37; S.D. = 28.34).
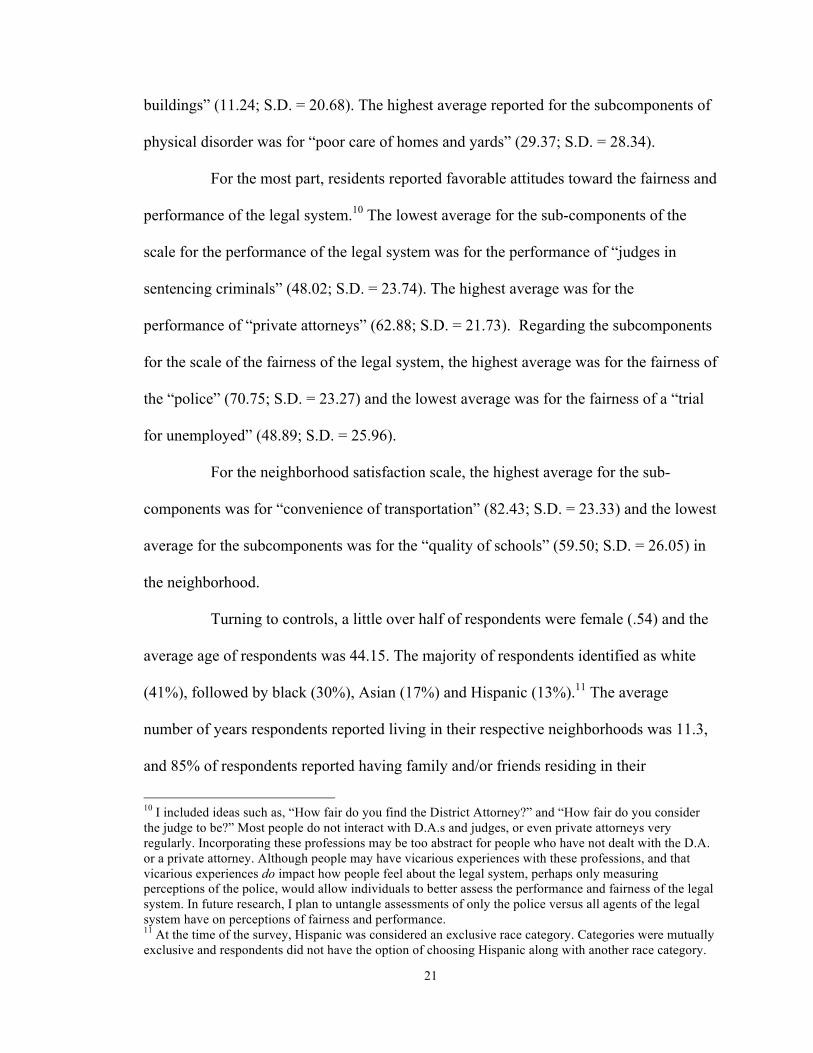
For the most part, residents reported favorable attitudes toward the fairness and
performance of the legal system.10 The lowest average for the sub-components of the
scale for the performance of the legal system was for the performance of “judges in
sentencing criminals” (48.02; S.D. = 23.74). The highest average was for the
performance of “private attorneys” (62.88; S.D. = 21.73). Regarding the subcomponents
for the scale of the fairness of the legal system, the highest average was for the fairness of
the “police” (70.75; S.D. = 23.27) and the lowest average was for the fairness of a “trial
for unemployed” (48.89; S.D. = 25.96).
For the neighborhood satisfaction scale, the highest average for the sub-
components was for “convenience of transportation” (82.43; S.D. = 23.33) and the lowest
average for the subcomponents was for the “quality of schools” (59.50; S.D. = 26.05) in
the neighborhood.
Turning to controls, a little over half of respondents were female (.54) and the
average age of respondents was 44.15. The majority of respondents identified as white
(41%), followed by black (30%), Asian (17%) and Hispanic (13%).11 The average
number of years respondents reported living in their respective neighborhoods was 11.3,
and 85% of respondents reported having family and/or friends residing in their
10 I included ideas such as, “How fair do you find the District Attorney?” and “How fair do you consider the judge to be?” Most people do not interact with D.A.s and judges, or even private attorneys very regularly. Incorporating these professions may be too abstract for people who have not dealt with the D.A. or a private attorney. Although people may have vicarious experiences with these professions, and that vicarious experiences do impact how people feel about the legal system, perhaps only measuring perceptions of the police, would allow individuals to better assess the performance and fairness of the legal system. In future research, I plan to untangle assessments of only the police versus all agents of the legal system have on perceptions of fairness and performance. 11 At the time of the survey, Hispanic was considered an exclusive race category. Categories were mutually exclusive and respondents did not have the option of choosing Hispanic along with another race category.

22
neighborhood (social ties/neighborhood attachment). The average for the probability of
respondents moving from their neighborhood is nearly 4. This indicates that the average
resident will “probably not move”. The average of 5.53 for education indicates the
average resident has a high school diploma. The average resident has an income of a little
over $18,000 a year. Finally, the average resident had a score of 41.01 for the fear of
crime scale (SD=23.39), which means residents reported moderate levels of fear of being
victimized.

23
Table&1:&Descriptives&Mean S.D Min Max
Dependent'VariablesDo&something .39 < 0 1Informal .22 < 0 1Formal .19 < 0 1
ControlsSex&(female=1) .54 < 0 1Age 44.15 16.93 16 90Income 5.30 1.90 1 9Black&(=1) .30 < 0 1Hispanic&(=1) .13 < 0 1White&(=1) .41 < 0 1Asian&(=1) .17 < 0 1Education 5.53 1.82 1 10Probability&of&R&moving* 3.99 1.22 0 5*(1=definitely-move)-(5=definitely-not-move)Years&in&the&Neighborhood 11.30 15.05 0 82Fear&of&Crime 41.01 23.39 0 100Friends/family&in&neighborhood .85 < 0 1
Independent'VariablesNeighborhood&Satisfaction .00 .61 <2.6 1.09--Quality-of-schools 59.50 26.05 0 100--Convenience-of-shopping 76.14 26.26 0 100--Convenience-of-transportation 82.43 23.33 0 100--Good-housing-for-the-money 69.52 25.42 0 100--Friends-in-the-neighborhood 65.95 29.76 0 100--Racial-Composition-of-neighborhood 74.39 24.69 0 100--Living-in-Oakland 71.67 28.36 0 100--Safety-of-neighborhood 61.25 27.59 0 100

24
General Intervention
Table 2 presents the results for the baseline logistic regression predicting the
likelihood of individuals intervening in response to a neighborhood problem. Baseline
results in model 1 show controls largely working in the expected direction, although
resident mobility is non-significant. Years residing in the neighborhood increases the
likelihood of individuals intervening in neighborhood problems (p<.01); having friends
Table&1:&Descriptives&continutedMean S.D Min Max
Social&Disorder .00 .73 <.91 2.44!!Noisy!Neighbors 27.19 30.05 0 100!!Trouble!makers!on!street 26.52 29.57 0 100!!Problem!of!drugs 29.73 31.29 0 100!!Reckless!drivers 32.90 30.58 0 100!!Racial!conflict!in!neighborhood 12.67 20.44 0 100Physical&Disorder .00 .71 <.79 3.18!!Poor!care!of!homes!and!yards 29.37 28.34 0 100!!Abandoned!houses!and!buildings 11.24 20.68 0 100!!Streets!in!bad!repair 23.57 26.88 0 100!!Abandoned!cars 17.62 24.03 0 100!!Poor!street!lighting 20.87 27.87 0 100Performance&of&Legal&System 0.00 0.68 <2.51 1.93!!Oakland!police!department 62.05 23.27 0 100!!The!district!attorney 53.91 22.06 0 100!!Judges!in!sentencing!criminals 48.02 23.74 0 100!!Public!defender 55.58 21.70 0 100!!Private!attorneys 62.88 21.73 0 100Fairness&of&Legal&System .00 .71 <2.76 1.7!!Of!police 70.75 23.27 0 100!!Of!district!attorneys 65.52 21.50 0 100!!Of!judge 64.95 22.14 0 100!!Of!public!defender 63.82 21.86 0 100!!Of!private!attorneys 70.61 22.40 0 100!!Fair!trial!for!working!class 68.51 19.72 0 100!!Fair!trial!for!unemployed 48.89 25.96 0 100!!Fair!trial!for!Hispanics 53.26 23.40 0 100!!Fair!trial!for!black!people 54.71 24.09 0 100!!Fair!trial!for!American!Indians 51.47 24.86 0 100!!Fair!trial!for!Asians 64.38 20.69 0 100N=1,799

25
and/or family residing in the neighborhood also increases the likelihood of intervention
(p<.05). Those with a higher education are more likely to intervene (p<.001). When fear
of crime increases, so does the likelihood of intervening (p<.001). This finding is
contrary to prior work; however, as evidenced by the next few models, fear of crime
becomes non-significant when disorder is entered into the model, suggesting that fear of
crime is confounded by the levels of disorder in a neighborhood. The strongest predictor
of non-intervention is identifying as Asian. Those identifying themselves as Asian (with
white as the reference group) are about 53% less likely to intervene (p<.001).
Model 2 introduces levels of social disorder into the model. Of note, the
relationship between fear of crime and the willingness to intervene disappears.12 Model 2
indicates the predicted curvilinear relationship between social disorder and the
willingness to intervene. As social disorder increases, so does the likelihood of
intervention; however, once social disorder reaches a certain level, the ability of the
residents to intervene is dampened. Figure 1 illustrates the curvilinear effect social
disorder has on general intervention. The figure, based on the final model for general
intervention, with all other variables held at their means, indicates that at very high levels
of social disorder (roughly 2 standard deviations above the mean) the likelihood of
intervention starts to decrease.13 The relationship between social disorder and
intervention is essentially linear until perceptions of disorder reach extreme levels. At
roughly one standard deviation above the mean the slope for intervention becomes
relatively flat, also supporting the idea that social disorder is largely mobilizing. There is
12 Fear of crime and social disorder were correlated at .37 and fear of crime remains significant when both social and physical disorder are left out of the model. 13 This estimate is derived from the bivariate relationship between social disorder and general wiliness to intervene, and is based on z-scores of the disorder scale.

26
substantively a small difference between those at one standard deviation above the mean
and those at two standard deviations above the mean. Unfortunately these data do not
allow for actual neighborhood characteristics so it is difficult to ascertain the impact of
these characteristics on individual perceptions of social disorder. What I can derive from
my data are some basic demographics for those who perceive levels of social disorder
that become debilitating. Interestingly those respondents who perceive levels of social
disorder to be very high (4.5 percent of respondents) are distributed throughout all
income and education categories, indicating that income and education may not be a
factor for perceived levels of disorder. For education, however, the highest percentages of
those perceiving very high levels of social disorder fall in the middle of the education
distribution and have either a high school diploma or equivalent (24.7%) and some
college (28.4%). Furthermore, the gender of those reporting such high levels disorder are
almost split down the middle (male=45%; female=55%), which is representative of the
sample distribution of gender. The above mentioned findings indicate that perceptions of
disorder are not uniform across demographics.
In regards to those who fall beyond the tipping point, nearly 45% reported
black as their race, compared to 32% of whites; 18% of Hispanics; and 5% of Asians. In
fact, one of the strongest predictors of individuals perceiving high levels of social
disorder is reporting black as their race/ethnicity.14 Blacks are disproportionately
represented in the perceived levels of disorder that go beyond the levels that motivate
individuals to intervene. Interestingly, the only race/ethnicity category that had an effect
on the likelihood of intervention was individuals identifying as Asian; Asians are less
likely compared to whites to intervene in every model presented. 14 This finding is based on a regression on social disorder not shown.

27
Figure 1: Social Disorder and The Likelihood of Intervention
Model 3 introduces physical disorder in place of social disorder to assess the
extent to which social and physical disorder work differently. Because physical and
social disorder are highly correlated, they cannot be in the model together (r=0.73). The
same curvilinear relationship exists with physical disorder as it does with social disorder.
Increases in physical disorder increase the likelihood of resident intervention, but only to
a point. When physical disorder reaches very high levels (roughly 3.5 standard deviations
above the mean), residents’ likelihood of intervention decreases. The tipping point for
physical disorder is much higher than for social disorder suggesting that physical disorder
has more of a mobilizing effect for intervention than social disorder. Even at the observed
highest levels of physical disorder, the likelihood of intervention is still greater than at
very low levels of physical disorder (1 standard deviation below the mean). Only 2.2% of
individuals perceived physical disorder at levels higher than 3.5 standard deviations
above the mean. Figure 2 illustrates the influence of physical disorder on general
intervention. Noting that residents report higher levels of physical disorder than social
0
0.2
0.4
0.6
0.8
1
1.2
-‐1 0 1 1.5 2 3
Odds of Intervention
Social Disorder Standard Deviation
General
Informal
Formal

28
disorder (maximum social disorder has a Z-score of 2.44 versus physical disorder having
a maximum Z-score of 3.18), the curvilinear relationship remains indicating that both
physical and social disorder have the greatest mobilizing effect at moderate/high levels of
disorder and tail off toward very high levels of disorder. The mobilizing effect of disorder
on general intervention is consistent with both social and physical disorder; at low levels
of each, disorder does not increase the likelihood of intervention and as disorder starts to
increase, it increases the likelihood of intervention.
Here again we see the same demographic distribution of those on the high ends
of physical disorder. Blacks are disproportionately represented as perceiving debilitating
levels of physical disorder (53%), while only 20% reported white, 18% reported
Hispanic, and 9% reported Asian. Such a distribution may be a result of blacks living in
more disadvantaged neighborhoods characterized as having high levels of disorder.
Similar patterns hold for gender, income, and education.
Figure 2: Physical Disorder and the Likelihood of Intervention
0
0.2
0.4
0.6
0.8
1
1.2
1.4
-‐1 0 1 1.5 2 2.5 3
Odds of Intervention
Physical Disorder Standard Deviation
General
Informal
Formal
29
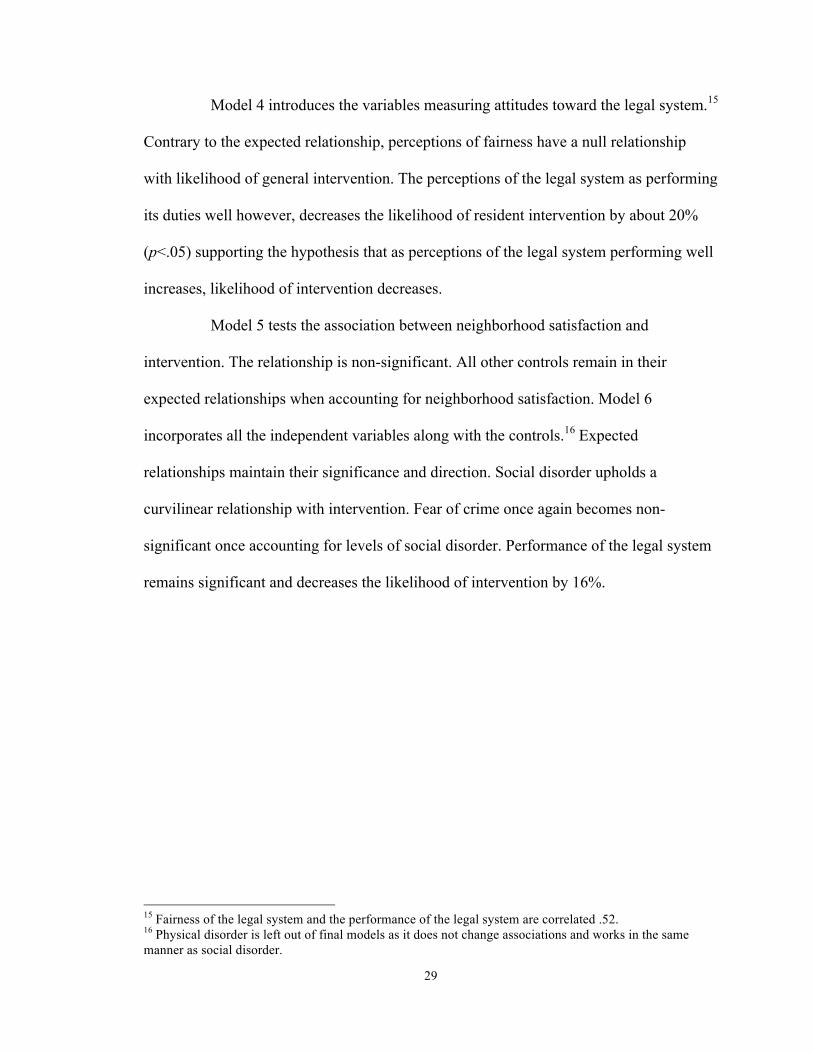
Model 4 introduces the variables measuring attitudes toward the legal system.15
Contrary to the expected relationship, perceptions of fairness have a null relationship
with likelihood of general intervention. The perceptions of the legal system as performing
its duties well however, decreases the likelihood of resident intervention by about 20%
(p<.05) supporting the hypothesis that as perceptions of the legal system performing well
increases, likelihood of intervention decreases.
Model 5 tests the association between neighborhood satisfaction and
intervention. The relationship is non-significant. All other controls remain in their
expected relationships when accounting for neighborhood satisfaction. Model 6
incorporates all the independent variables along with the controls.16 Expected
relationships maintain their significance and direction. Social disorder upholds a
curvilinear relationship with intervention. Fear of crime once again becomes non-
significant once accounting for levels of social disorder. Performance of the legal system
remains significant and decreases the likelihood of intervention by 16%.
15 Fairness of the legal system and the performance of the legal system are correlated .52. 16 Physical disorder is left out of final models as it does not change associations and works in the same manner as social disorder.
30
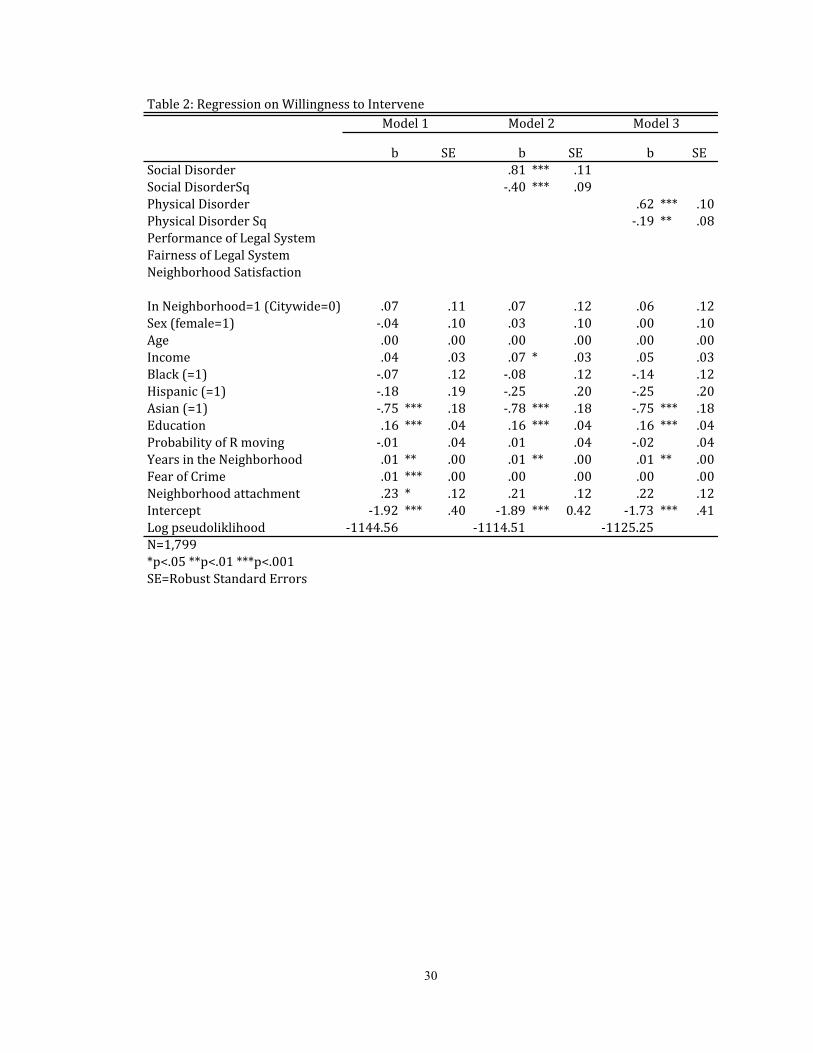
Table&2:&Regression&on&Willingness&to&Intervene&
b SE b SE b SESocial&Disorder .81 *** .11Social&DisorderSq >.40 *** .09Physical&Disorder .62 *** .10Physical&Disorder&Sq >.19 ** .08Performance&of&Legal&SystemFairness&of&Legal&SystemNeighborhood&Satisfaction
In&Neighborhood=1&(Citywide=0) .07 .11 .07 .12 .06 .12Sex&(female=1) >.04 .10 .03 .10 .00 .10Age .00 .00 .00 .00 .00 .00Income .04 .03 .07 * .03 .05 .03Black&(=1) >.07 .12 >.08 .12 >.14 .12Hispanic&(=1) >.18 .19 >.25 .20 >.25 .20Asian&(=1) >.75 *** .18 >.78 *** .18 >.75 *** .18Education .16 *** .04 .16 *** .04 .16 *** .04Probability&of&R&moving >.01 .04 .01 .04 >.02 .04Years&in&the&Neighborhood .01 ** .00 .01 ** .00 .01 ** .00Fear&of&Crime .01 *** .00 .00 .00 .00 .00Neighborhood&attachment .23 * .12 .21 .12 .22 .12Intercept >1.92 *** .40 >1.89 *** 0.42 >1.73 *** .41Log&pseudoliklihood >1144.56 >1114.51 >1125.25N=1,799*p<.05&**p<.01&***p<.001SE=Robust&Standard&Errors
Model&1 Model&2 Model&3

31
Informal Intervention
I now turn my attention to the types of strategies individuals use to address
problems in their neighborhoods. Table 3, model 1 tests the association between the
controls and the use of informal social control. The relationships between education and
respondents identifying as Asian remain significant and in the same direction. Resident
mobility is also still associated with the use of informal social control. The relationship
between fear of crime and the use of informal social control is not supported in this
model.
Model 2 introduces social disorder. The curvilinear relationship remains
between social disorder and the use of informal social control. In model 2, social disorder
Table&2:&Regression&on&Willingness&to&Intervene&(continued)
Social&DisorderSocial&DisorderSqPhysical&DisorderPhysical&Disorder&SqPerformance&of&Legal&SystemFairness&of&Legal&SystemNeighborhood&Satisfaction
In&Neighborhood=1&(Citywide=0)Sex&(female=1)AgeIncomeBlack&(=1)Hispanic&(=1)Asian&(=1)EducationProbability&of&R&movingYears&in&the&NeighborhoodFear&of&CrimeNeighborhood&attachmentInterceptLog&pseudoliklihoodN=1,799*p<.05&**p<.01&***p<.001SE=Robust&Standard&Errors
Table&2:&Regression&on&Willingness&to&Intervene&(continued)
b SE b SE b SE.87 *** .11Y.40 *** .10
Y.23 * .09 Y.23 ** .09.09 .09 .15 .09
Y.13 .09 .14 .09
.08 .11 .07 .11 .07 .12Y.06 .10 Y.04 .10 .02 .10.00 .00 .00 .00 .00 .00.04 .03 .04 .03 .08 * .03Y.06 .13 Y.06 .12 Y.05 .13Y.17 .19 Y.17 .19 Y.25 .20Y.74 *** .18 Y.75 *** .18 Y.77 *** .18.16 *** .04 .16 *** .04 .15 *** .04Y.01 .04 .00 .04 .00 .04.01 ** .00 .01 ** .00 .01 ** .00.01 *** .00 .01 ** .00 .00 .00.24 * .12 .24 * .12 .21 .12
Y1.92 *** .40 Y1.97 *** .41 Y1.86 *** .41Y1141.23 Y1143.45 Y1110.45
Model&6Model&4 Model&5

32
is positive and significant (p<.01) meaning that as social disorder increases, so does the
use of informal social control and once levels of disorder reach a tipping point of roughly
1.5 standard deviations above the mean residents again become less likely to intervene
informally. Again there is little difference between those at one standard deviation above
the mean and those at two standard deviations above the mean suggesting that social
disorder levels out at high levels and only decreases when perceived levels of social
disorder are extreme. Model 3 tests the same relationship with physical disorder in the
place of social disorder. All relationships remain; however, the curvilinear relationship
between physical disorder and informal intervention is not supported.17
Model 4 introduces variables capturing perceptions of the legal system. Neither
fairness nor performance of the legal system affects the use of informal social control.
Model 5 introduces neighborhood satisfaction into the model. As hypothesized,
neighborhood satisfaction increases the likelihood of informal intervention (odds
ratio=1.29; p<.01). Model 6 incorporates all independent variables along with controls in
the model. Interestingly, the coefficient for neighborhood satisfaction increases from .26
to .45 indicating a possible suppression effect in previous models.
17 Although the quadratic for physical disorder is not significant, calculating the tipping point from the bivariate coefficients of physical disorder regressed on informal intervention suggests that if it were significant, the tipping point would be 3.37, which is a score not observed in these data.

33
Table&3:&Regression&on&Informal&Intervention&
b SE b SE b SESocial&Disorder .42 *** .12Social&Disorder&Sq @.25 * .11Physical&Disorder .31 ** .12Physical&Disorder&Sq @.03 .09Performance&of&Legal&SystemFairness&of&Legal&SystemNeighborhood&Satisfaction
In&Neighborhood=1&(Citywide=0) .05 .13 .05 .14 .03 .14Sex&(female=1) @.10 .12 @.07 .12 @.07 .12Age .00 .00 .00 .00 .00 .00Income .08 ** .03 .10 ** .03 .09 ** .03Black&(=1) .03 .14 .04 .14 @.02 .14Hispanic&(=1) @.05 .23 @.08 .23 @.10 .23Asian&(=1) @.71 ** .22 @.72 *** .22 @.70 *** .22Education .14 ** .04 .13 ** .04 .14 ** .04Probability&of&R&moving .05 .05 .06 .05 .05 .05Years&in&the&Neighborhood .01 * .00 .01 * .00 .01 * .00Fear&of&Crime .00 .00 .00 .00 @0.00 .00Neighborhood&Attachement& .18 .14 .16 .14 .16 .14Intercept @2.79 *** 0.48 @2.74 *** .48 @2.67 *** .49Log&pseudoliklihood @916.77 @910.52 @911.89N=1,799*p<.05&**p<.01&***p<.001SE=Robust&Standard&Errors
Model&1 Model&2 Model&3

34
Formal Intervention
I now turn attention to the formal strategies residents use to combat
neighborhood problems (Table 4). Model 1 tests the association between the use of
formal social control and the controls. Education, fear of crime, and resident mobility all
increase the likelihood of residents using formal social control in response to a
neighborhood problem.
Models 2 and 3 introduce the disorder variables. The relationship between
education and the use of formal social control becomes non-significant, as does fear of
crime. The curvilinear relationships remain between social and physical disorder and the
Table&3:&Regression&on&Informal&Intervention&
Social&DisorderSocial&Disorder&SqPhysical&DisorderPhysical&Disorder&SqPerformance&of&Legal&SystemFairness&of&Legal&SystemNeighborhood&Satisfaction
In&Neighborhood=1&(Citywide=0)Sex&(female=1)AgeIncomeBlack&(=1)Hispanic&(=1)Asian&(=1)EducationProbability&of&R&movingYears&in&the&NeighborhoodFear&of&CrimeNeighborhood&Attachement&InterceptLog&pseudoliklihoodN=1,799*p<.05&**p<.01&***p<.001SE=Robust&Standard&Errors
Table&3:&Regression&on&Informal&Intervention&
b SE
W.03 .11.03 .10
.05 .13W.10 .12.00 .00.08 * .03.04 .14W.04 .23W.70 *** .22.14 ** .04.05 .05.01 ** .00.00 .00.18 .14
W2.79 *** .48W916.71
Model&4
b SE
.26 *** .10
.05 .13W.12 .12.00 .00.08 * .03.04 .03W.06 .23W.70 *** .22.13 ** .04.03 .05.01 * .00.00 .00.16 .14
W2.70 *** .48W913.52
Model&5
b SE.60 *** .13W.27 * .12
W.07 .11.03 .10.45 *** .12
.04 .14W.08 .12.00 .00.10 ** .03.04 .14W.12 .23W.71 *** .22.12 ** .04.03 .05.01 .00.00 .00.12 .14
W2.60 *** .48W902.44
Model&6

35
use of formal social control as in previous models for intervention. The tipping point for
social disorder must reach 1.5 standard deviations above the mean before decreasing the
likelihood of formal intervention. Perceived physical disorder must reach very high levels
(roughly 3 standard deviations above the mean) before its mobilizing influence starts to
decrease. Model 3, shows that Asians are no different than whites after physical disorder
is taken into account.
Model 4 tests the association between attitudes toward the legal system and
formal intervention. Interestingly, the performance of the legal system has no significant
effect. This contradicts previous hypotheses that attitudes toward the legal system would
matter more for formal intervention compared to informal or just general intervention.
Model 5 tests the association between the controls and neighborhood
satisfaction. Neighborhood satisfaction has no effect on the use of formal social control,
which supports the hypothesis that neighborhood satisfaction may be more important for
the use of informal versus formal social control.
Model 6 incorporates all independent variables. In Model 4, attitudes toward
the legal system had no affect on formal intervention. Once all variables are entered into
the model, increases in attitudes favorable to the fairness of the legal system increase the
likelihood of formal intervention. Residents who find the legal system to be fair are 1.25
(p<.05) times more likely to intervene by calling the police or city about the perceived
neighborhood problem. Again, there is likely a suppression effect when all variables are
not included in the model.

36
Table&4:&Regression&on&Formal&Intervention&
b SE
Social&Disorder
Social&DisorderSq
Physical&Disorder
Physical&Disorder&Sq
Performance&of&Legal&System
Fairness&of&Legal&System
Neighborhood&Satisfaction
In&Neighborhood=1&(Citywide=0) .16 .14
Sex&(female=1) K.02 .13
Age .00 .00
Income .02 .04
Black&(=1) .00 .15
Hispanic&(=1) K.11 .24
Asian&(=1) K.44 ** 0.22
Education .09 * 0.04
Probability&of&R&moving K.01 .05
Years&in&the&Neighborhood .01 ** 0.00
Fear&of&Crime .01 * 0.00
Neighborhood&attachment .11 .14
Intercept K2.40 *** .50
Log&pseudoliklihood K848.38
N=1,799
*p<.05&**p<.01&***p<.001
SE=Robust&Standard&Errors
Model&1
b SE
.86 *** .13
K.45 *** .12
.16 .15
.06 .13
.00 .00
.01 .04
K.02 .15
K.18 .24
K.45 * .22
.08 .05
.02 .05
.01 ** .00
.00 .00
.07 .14
K2.35 *** .50
K826.92
Model&2
b SE
.60 *** .13
K.22 * .10
.15 .14
.03 .13
.00 .00
K.01 .04
K.07 .15
K.17 .24
K.42 .22
.09 .05
K.01 .05
.01 *** .00
.00 .00
.09 .14
K2.22 ** .50
K836.67
Model&3

37
Table&4:&Regression&on&Formal&Intervention&(continued)
Social&DisorderSocial&DisorderSqPhysical&DisorderPhysical&Disorder&SqPerformance&of&Legal&SystemFairness&of&Legal&SystemNeighborhood&Satisfaction
In&Neighborhood=1&(Citywide=0)Sex&(female=1)AgeIncomeBlack&(=1)Hispanic&(=1)Asian&(=1)EducationProbability&of&R&movingYears&in&the&NeighborhoodFear&of&CrimeNeighborhood&attachmentInterceptLog&pseudoliklihoodN=1,799*p<.05&**p<.01&***p<.001SE=Robust&Standard&Errors
Table&4:&Regression&on&Formal&Intervention&(continued)
b SE
W.18 .11.17 .10
.16 .14W.02 .13.00 .00W.02 .04.04 .15W.08 .24W.42 .22.09 .04.00 .05.01 ** .00.01 ** .00.12 .14
W2.42 *** .50W846.53
Model&4Table&4:&Regression&on&Formal&Intervention&(continued)
b SE
W.19 .10
.16 .14
.00 .13
.00 .00W.01 .04W.01 .15W.09 .24W.44 * .22.10 * .05.01 .05.01 ** .00.01 * .00.12 .14
W2.49 *** .51W846.62
Model&5
b SE.88 *** .14W.42 *** .12
W.16 .11.24 * .11.01 .12
.16 .15
.06 .13
.00 .00
.01 .04
.05 .15W.14 .24W.42 .22.08 .05.02 .05.01 ** .00.00 .00.09 .14
W2.39 *** .51W824.24
Model&6
38
CHAPTER 5
DISCUSSION & CONCLUSION
To better understand variation in the decision to mobilize during a
neighborhood problem I assessed the extent to which resident perceptions of
neighborhood characteristics influenced the likelihood they would intervene.
Furthermore, I used these perceptions to predict the use of informal and formal methods
of intervention. The first sets of analyses explore how perceptions of disorder,
perceptions of the legal system, and neighborhood satisfaction influence an individual’s
response to perceived neighborhood issues. As mentioned in the methods section, the
data employed in this study are unique in that they asked residents to identify whether
they actually did something in response to their identified neighborhood problems instead
of what they or their neighbors would do hypothetically.
Before delving into my findings, I will quickly summarize the results of the
regarding the similarities and differences across intervention outcomes. The variables of
social and physical disorder predicted all types of intervention. Social disorder
consistently had a curvilinear effect for general intervention, informal intervention, and
formal intervention. Physical disorder had a curvilinear effect on general intervention and
formal intervention, but not for informal intervention. Attitudes toward the legal system
and neighborhood satisfaction did not have consistent effects across the different types of
intervention. Increases in perceptions that the legal system performed well decreased the
likelihood of general intervention and had no effect on informal or formal intervention.
Perceptions that the legal system is fair only increased the likelihood of formal
intervention and had no effect on general or informal intervention. Residents who were

39
satisfied with their neighborhoods were more likely to use informal intervention only and
had no effect on general or formal intervention. Below I discuss the implications of these
findings.
The consistent curvilinear effect of disorder on intervention means that as
disorder increases, so does the willingness of individuals to exercise social control in
response to it, but only to a point. When disorder reaches a high level, residents’ ability
may be decreased due to lack of resources to intervene or to a perception that disorder has
reached limits too far to be dealt with by an individual.
Social disorder and physical disorder are separated to determine whether they
elicit different forms of intervention. Interestingly, my data do not observe the tipping
point for physical disorder and the likelihood of informal intervention; however the
curvilinear effect is observed for general willingness to intervene and formal intervention.
This may indicate that physical disorder is mainly a motivating factor for informal
strategies to decrease physical disorder in individuals’ neighborhoods. This finding has
several implications for the study of disorder. First, it may suggest that social and
physical disorder should be separated when studying the impact of disorder on
communities and individuals and that disaggregating disorder may have implications for
choices regarding the type of intervention adopted. Second, it may indicate that when it
comes to physical disorder, residents may have more faith in their neighbors and
themselves to deal with the problems than they do with social disorder. One finding in the
literature states that disorder causes fear of crime (Lee 1981; Skogan 1992). Perhaps
social disorder causes more fear in individuals than does physical disorder. Fear of crime
has been linked to lessening community satisfaction (Hartnagel 1979) thereby eroding

40
ties and cohesion in a neighborhood which in turn decreases the ability and maybe the
perception that anything can be done about the problem. This may be truer for social
disorder than for physical disorder at least when it comes to dealing with problems
informally, which would explain the lack of a curvilinear effect for physical disorder on
informal intervention. Another interesting implication for the lack of a curvilinear effect
for physical disorder on informal intervention is that high levels of physical disorder
might be a proxy for neighborhood disadvantage. As previously hypothesized by Skogan
(1992), exercising informal social control could be compromised in highly disadvantaged
neighborhoods due to erosions of ties within the community needed to effectively use
informal social control. Again, the fact that social and physical disorder work differently
points to the importance of separating types of disorder when looking at their effects as
they seem to elicit different reactions from individuals.
The current study separated perceptions of the fairness from perceptions of the
performance of the legal system to assess whether these constructs of legal cynicism
work differently in mobilizing residents to intervene. Separating the performance from
the fairness of the legal system proved wise in this analysis based on the opposite effects
they elicit on the use of social control. Further studies regarding legal cynicism should
take the results of this analysis into account when measuring legal cynicism.
For general intervention, those who perceived the legal system to be performing
well were 21% less likely to call the police or call the city about neighborhood problems.
If individuals perceive the legal system to be performing adequately, they may be less
likely to intervene themselves as they assume formal social controls will address the

41
problem. However, this relationship only remained for general intervention and was
absent in models for informal or formal intervention.
Perceptions of the fairness of the legal system had an effect on formal
intervention but only when all variables are in the model. As perceptions of fairness
increased, individuals were 1.25 times more likely to call the police or the city to
intervene (formal intervention). This makes sense, as individuals would be less likely to
call upon formal social control if they thought those agencies were acting unfair in their
dealings with citizens.
As hypothesized, neighborhood satisfaction increased the likelihood that
individuals would use informal social control in response to neighborhood problems.
Although neighborhood satisfaction never reached significance in other analyses, it did
predict the specific use of informal social control in response to disorder. It may not be
enough to simply measure neighborhood attachment as years lived in the neighborhood
and whether residents have family and friends living in the neighborhood, but also how
satisfied they are with their neighborhood. Neighborhood satisfaction may foster a sense
of reciprocity between neighbors that allows for more informal social control. It takes
collective action to maintain a neighborhood and neighborhood satisfaction may be the
result of prior relationships in the neighborhood that give rise to more informal social
control in the neighborhood.
The inability to establish causality is one of the limitations of the current study.
Although this analysis sheds light on the predictors of individual intervention, cross-
sectional data are limited in their ability to contribute to knowledge on causal
relationships. As an example, it may be that having experiences with successful

42
intervention yields neighborhood satisfaction. Moreover, there is likely to be
considerable endogeneity among my independent variables, impacting the way they work
in shaping intervention. For instance, favorable attitudes towards the legal system likely
are shaped by how satisfied one is with their neighborhood. In a regression analysis not
shown, I find support for this in that increases in favorable attitudes regarding the fairness
and performance of the legal system predicted higher levels of neighborhood satisfaction.
I encourage future work to disentangle the causal sequence related to informal social
control.
This study seeks to advance our understanding of how neighborhoods are
experienced at the individual-level. In order for a community to experience social
cohesion and social organization, individuals need to decide to intervene on behalf of the
common goal. To this end, scant research has been devoted to linking micro-level action
to macro-level outcomes such as collective efficacy. The current study bridges this gap
by providing evidence that individuals are more or less likely to get involved in
neighborhood problems depending on their perceptions of structural neighborhood
conditions and their perceptions of the effectiveness of social controls. It also further
demonstrates the importance of perceptions predicting intervention net of other variables
that are thought to contribute to levels of social control in communities. My results points
to the importance of subjective appraisals of neighborhood characteristics as determinants
of the likelihood of individuals getting involved to combat neighborhood problems. Such
appraisals also differentially impact the strategies individuals use when they do decide to
intervene in behalf of the common good. When residents positively appraise
43
neighborhood characteristics they will mobilize against neighborhood problems.
Otherwise, residents and their neighborhoods will spiral into disorder and decline.

44
REFERENCES
Avakame, Edem F., James J. Fyfe and Candice Mccoy. 1999. “Did You Call the Police? What Did They Do?” An Empirical Assessment of Black’s Theory of Mobilization of Law.” Justice Quarterly 16(4): 765-792.
Baumer, Eric P. 2002. “Neighborhood Disadvantage and Police Notification By Victims of Violence.” Criminology 40(3): 579-616. Bellair, Paul E. 1997. “Social Interaction and Community Crime: Examining the Importance of Neighbor Networks.” Criminology 35(4): 677-704. Black, Donald J. 1973. “The Mobilization of Law.” The Journal of Legal Studies 2(1): 125-149. Black, Donald J. 1976. The Behavior of Law. San Diego, CA: Academic Press. Black, Donald J. 1983. “Crime As Social Control.” American sociological review: 34-45. Browning, Christopher R., Brian Soller, Margo Gardner, and Jeanne Brooks-Gunn. 2013. “’Feeling Disorder’ as a Comparative and Contingent Process: Gender, Neighborhood Conditions, and Adolescent Mental Health.” Journal of Health and Social Behavior 54(3): 296-314. Bursik, Robert J. Jr. 1988. “Social Disorganization and Theories of Crime and Delinquency: Problems and Prospects.” Criminology 26(4): 519-552. Bursik, Robert J. Jr. and Harold G. Grasmick. 1993. Neighborhoods and Crime: The Dimensions of Effective Community Control. Boston: Lexington Books. Carr, Patrick J., Laura Napolitano and Jessica Keating. 2007. “We Never Call the Cops and Here is Why: A Qualitative Examination of Legal Cynicism in Three Philadelphia Neighborhoods.” Criminology 45(2): 445-477. Doyle, Daniel P. and David F. Luckenbill. 1991. “Mobilizing Law in Response to Collective Problems: A Test of Black’s Theory of Law.” Law & Society Review 25(1): 103-116. Greenberg, Martin S. and Scott R. Beach. 2004). “Property Crime Victims' Decision to Notify the Police: Social, Cognitive, and Affective Determinants.” Law and Human Behavior 28(2): 177-186. Gottfredson, Michael R. and Michael J. Hindelang. 1979. “A Study of the Behavior of Law.” American Sociological Review: 3-18.

45
Goudriaan, Heike, Karin Wittebrood, and Paul Nieuwbeerta. 2006. “Neighbourhood Characteristics and Reporting Crime Effects of Social Cohesion, Confidence in Police Effectiveness and Socio-Economic Disadvantage.” British Journal of Criminology 46(4): 719-742. Hartnagel, Timothy F. 1979. “The Perception and Fear of Crime: Implications for Neighborhood Cohesion, Social Activity, and Community Affect.” Social Forces 58(1): 176-193. Hirsh, Beth and Christopher J. Lyons. 2010. “Perceiving Discrimination on the Job: Legal Consciousness, Workplace Context, and the Construction of Race Discrimination.” Law and Society Review 44 (2):269-98. Holmes, Malcolm D., Brad W. Smith, Adrienne B. Freng, and Ed A. Muñoz. 2008. “Minority Threat, Crime Control, and Police Resource Allocation in the Southwestern United States.” Crime & Delinquency 54(1): 128-152. Kasarda, John D. and Morris Janowitz. 1974. “Community Attachment in Mass Society.” American Sociological Review: 328-339. Kirk, David S. and Mauri Matsuda. 2011. “Legal Cynicism, Collective Efficacy, and The
Ecology of Arrest.” Criminology 49(2): 443-472. Kirk, David S. and Andrew V. Papachristos. 2011. “Cultural Mechanisms and the
Persistence of Neighborhood Violence.” American Journal of Sociology 116(4): 1190-1233.
Lee, Barrett A. 1981. “The Urban Unease Revisited: Perceptions of Local Safety and Neighborhood Satisfaction Among Metropolitan Residents.” Social Science Quarterly 62(4): 611-629. Lee, Barrett A. and Avery M. Guest. 1983. “Determinants of Neighborhood Satisfaction: A Metropolitan-Level Analysis.” The Sociological Quarterly 24(2): 287-303. Logan, John R. and Harvey L. Molotch. 2007. Urban Fortunes: The Political Economy of
Place. University of California Press. Markowitz, Fred E., Paul E. Bellair, Allen E. Liska, and Jianhoung Liu. 2001. “Extending
Social Disorganization Theory: Modeling the Relationships Between Cohesion, Disorder, and Fear.” Criminology 39(2): 293-319.
Medoff, Peter and Holly Sklar. 1994. Streets of Hope: The Fall and Rise of an Urban Neighborhood. Boston: South End Press.

46
Perkins, Douglas D. and Ralph B. Taylor. 1996. “Ecological Assessments of Community Disorder: Their Relationship to Fear of Crime and Theoretical Implications.” American Journal of Community Psychology 24(1): 63-107.
Peterson, Ruth D. and Laurie J. Krivo. 2010. Divergent Social Worlds: Neighborhood Crime and the Racial-Spatial Divide. Russell Sage Foundation. Putnam, Robert D., Robert Leonardi, and Raffaelle Y. Nanetti. 1994. Making Democracy Work: Civic Traditions in Modern Italy. Princeton University Press. Ringel, Norman B. Jonathan C. Finkelstein. 1991. “Differentiating Neighborhood
Satisfaction and Neighborhood Attachment Among Urban Residents.” Basic and Applied Social Psychology 12(2): 177-193.
Sampson, Robert J. and Dawn J. Bartusch. 1998. “Legal Cynicism and (Subcultural?)
Tolerance of Deviance: The Neighborhood Context of Racial Differences.” Law and Society Review: 777-804.
Sampson, R. J., & Groves, W. B. (1989). Community Structure and Crime: Testing Social-Disorganization Theory. American journal of sociology, 774-802. Sampson, Robert J., Jeffrey D. Morenoff, and Thomas Gannon-Rowley. 2002.
“Assessing” Neighborhood Effects”: Social Processes and New Directions in Research.” Annual Review of Sociology 28:443-78.
Sampson, Robert J., Stephen W. Raudenbush, and Felton Earls. 1997. “Neighborhoods
and Violent Crime: A Multilevel Study of Collective Efficacy. Science 277(5328): 918-924.
Schafer, J. L., & Olsen, M. K. (1998). Multiple Imputation for Multivariate Missing-Data Problems: A Data Analyst's Perspective. Multivariate behavioral research 33(4), 545-571. Sharkey, Patrick T. 2006. “Navigating Dangerous Streets: The Sources and
Consequences of Street Efficacy.” American Sociological Review 71(5): 826-846. Shaw, Clifford R. and Henry D. McKay. 1942. Juvenile Delinquency and Urban Areas.
Chicago, Ill. Silver, Eric and Lisa L. Miller. 2004. “Sources of Informal Social Control in Chicago Neighborhoods.” Criminology 42(3): 551-584. Skogan, Wesley G. 1992. Disorder and decline: Crime and the spiral of decay in
American neighborhoods. University of California Press.
47
Slocum, Ann L. E. E., Terrance J. Taylor, Bradley T. Brick, and Finn-Aage Esbensen. 2010. “Neighborhood Structural Characteristics, Individual-level Attitudes, and Youths’ Crime Reporting.” Criminology 48(4): 1063-1100.
Street, Lloyd. Study of Race, Crime, and Social Policy in Oakland, California, 1976- 1982. ICPSR09961-v1. Ann Arbor, MI: Inter-university Consortium for Political and Social Research [distributor], 2000. http://doi.org/10.3886/ICPSR09961.v1 Taylor, Ralph B. 1996. “Neighborhood Responses to Disorder and Local Attachments:
The Systemic Model of Attachment, Social Disorganization, and Neighborhood Use Value.” Sociological Forum 11(1): 41-74.
Tyler, Tom R. 2004. “Enhancing Police Legitimacy.” The Annals of the American Academy of Political and Social Science 593(1): 84-99. Vélez, María B. 2014. "Informal Social Control." In Encyclopedia of Criminology and Criminal Justice, pp. 2490-2500. Springer New York. Vélez, María B. 2001. “The Role of Public Social Control in Urban Neighborhoods: A Multilevel Analysis of Victimization Risk.” Criminology 39(4): 837-864.