The role of the Sunda Strait in the glacial to Holocene...
109
1 The role of the Sunda Strait in the glacial to Holocene development of the eastern tropical Indian Ocean hydrography Dissertation zur Erlangung des Doktorgrades der Naturwissenschaften Dr. rer. nat. im Fachbereich Geowissenschaften der Universität Bremen vorgelegt von Riza Yuliratno Setiawan Bremen, August 2015
Transcript of The role of the Sunda Strait in the glacial to Holocene...

1
The role of the Sunda Strait in the glacial to Holocene
development of the eastern tropical Indian Ocean
hydrography
Dissertation
zur Erlangung des Doktorgrades der Naturwissenschaften
Dr. rer. nat.
im Fachbereich Geowissenschaften
der Universität Bremen
vorgelegt von
Riza Yuliratno Setiawan
Bremen, August 2015

2
Tag des öffentlichen Kolloquiums
31.09.2015
15:15 Uhr, GEO Hörsaal 1550
Gutachter der Dissertation
Prof. Dr. Dierk Hebbeln
Prof. Dr. Heiko Pälike
Prüfer
Prof. Dr. Tobias Mörz
PD Dr. Christian Winter
Weitere Mitglieder des Prüfungsausschusses
Dr. Mahyar Mohtadi
Maren Bender

3
N a m e : Riza Yuliratno Setiawan Datum : 04.08.2015
Anschrift : MARUM- Center for Marine Environmental Sciences
E r k l ä r u n g
Hiermit versichere ich, dass ich
1. die Arbeit ohne unerlaubte fremde Hilfe angefertigt habe
2. keine anderen als die von mir angegebenen Quellen und Hilfsmittel benutzt habe und
3. die den benutzten Werken wörtlich oder inhaltlich entnommenen Stellen als solche kenntlich
gemacht habe.
Bremen, den 04.08.2015
Riza Yuliratno Setiawan
4
ACKNOWLEDGEMENTS
I would like to thank my supervisors Prof. Dierk Hebbeln, Dr. Mahyar Mohtadi, Dr. Stephan
Steinke and Prof. Michal Kucera for being so incredibly patient and supportive. I would like to
thank Dr. Jeroen Groeneveld, Dr. Henning Kuhnert and Cornelia Kwiatkowski. I have greatly
enjoyed working with you and I have learnt an enormous amount on the Mg/Ca and Ba/Ca
analyses and ICP-OES. Thank you also to Dr. Ed Hathorne and Dr. Katharina Pahnke for
introducing me to the neodymium world and providing me many supports.
Thank you also needs to go to those organisations from which I received funding, namely the
Deutscher Akademischer Austauschdienst (DAAD), MARUM and, GLOMAR for funding this
research and also for providing excellent opportunities for research training courses and career
development. It was privilege to be a student in the Department of Geosciences, GLOMAR-
MARUM, University of Bremen. The staffs and the PhD students were very helpful and
supportive.
A huge thanks to the members of the working group of Marine Sedimentology "AG Hebbeln":
Gema Martínez Méndez, Claudia Wienberg, Jürgen Titschack, Daniela Pittauer, Lydie Dupont,
Martin Bartels, Lelia Matos, M. Yusuf Awaluddin, Florian Boxberg, Martina Hollstein, Roshan
Zaidan, and Hiske Fink. Special thank you needs to go to my office mates, Carmen Friese, Inka
Meyer, and Jan-Berend Stuut. You all have provided me a perfect working environment. You
have all been fantastic.
Finally a big thank you to my amazing family. To my wife and daughter: Venny and Alyssa,
my parents: Amin Sutaryo and Surati, my little brothers: Yosi, Oni, and Ifan, who have lovingly
and steadfastly supported and encouraged me throughout the years. I could not have done this
without your endless love and support. Furthermore, thank you goes to CATOR group and
Indonesian community in Bremen for your friendships. Family and friends support and
encouragement have played a major role in completing what will be my last ever thesis.

5
CONTENTS
Abstract 9
Zusammenfassung 11
1 Introduction
1.1. The Indonesian Seas and major climate phenomena 13
1.2. Eastern tropical Indian Ocean 17
1.3 Paleoceanographic reconstruction of the eastern tropical Indian Ocean 19
1.3.1. Paleogeographic changes since the Last Glacial Maximum (LGM) 21
1.4. Dissertation objectives 22
1.5. Dissertation structure and contribution to publications 24
2 Regional Hydrography
2.1. Ocean circulation 27
2.2. Water masses 28
3 Materials and Methods
3.1. Materials of study and sediment sampling 30
3.2. Methods
3.2.1. Accelerator mass spectrometry (AMS) dating 30
3.2.2. Stable isotope, Mg/Ca and Ba/Ca analyses 31
3.2.3. Neodymium and strontium isotope analyses
3.2.3.1. Neodymium extraction from mixed planktonic
foraminifera 32
3.2.3.2. Neodymium and Strontium extraction
from detrital fraction 32
3.2.3.3. Neodymium and strontium isotope measurements 32
3.2.4. X-Ray Fluorescence (XRF) core scanning 33
6
4 The consequences of opening the Sunda Strait on the hydrography of the eastern
tropical Indian Ocean 34
1. Introduction 35
2. Study Area 36
3. Materials and Method
3.1. Sediment cores GeoB 10042-1 and GeoB 10043-3 39
3.2. Radiocarbon dating 39
3.3. Stable Isotope and Mg/Ca Analyses 41
3.4. X-Ray Fluorescence (XRF) Core Scanning 43
3.5. Spliced records and published data 43
4. Results
4.1. Age Model 44
4.2. Shell 18O and Mg/Ca ratio of G. ruber s.s. 46
4.3. Seawater 18O (δ18Osw) 47
4.4. XRF Measurements 47
5. Discussion
5.1. Hydrologic conditions off the Sunda Strait prior to the Sunda Shelf
flooding (10 kyr BP) 49
5.2. The flooding of the Sunda Shelf 53
5.3. Hydrologic conditions off the Sunda Strait after the Sunda Shelf
Flooding 54
5.4. The impact of the Sunda Strait opening on regional hydrography 55
6. Conclusion 57
5 Modification of the deep water neodymium isotope composition along
the eastern margin of the tropical Indian Ocean 58
1. Introduction 59

7
2. Study Area 60
3. Materials and Methods
3.1. Sediment cores GeoB 10042-1 and GeoB 10043-3 62
3.2. Age Model 63
3.3. Neodymium and strontium isotope analyses
3.3.1. Neodymium extraction from mixed planktonic foraminifera 63
3.3.2. Neodymium and Strontium extraction from detrital fraction 63
3.3.3. Column chromatography and isotope measurement 64
4. Results
4.1. Neodymium Isotope Composition of Mixed Planktic Foraminifera 64
4.2. Neodymium and Strontium Isotope Composition of the Detrital
Silicates 65
5. Discussion
5.1. Modification of the foraminifera εNd off the Sunda Strait 69
5.2. Variability of the detrital εNd off the Sunda Strait 73
6. Conclusion 75
6 Testing the applicability of G. sacculifer Ba/Ca as an indicator
of freshwater discharge in the eastern tropical Indian Ocean
1. Introduction 77
2. Study Area 79
3. Materials and Methods
3.1. Surface sediments samples 80
3.2. Cleaning of foraminifera shells 80
3.3. Measurement 82
3.4. Calculation of seawater 18O 82
4. Results
4.1. Planktic foraminifera G. sacculifer element to calcium ratios 83
4.2. Planktic foraminifera G. sacculifer 18Osw 86
5. Discussion 86
5.1. Testing G. sacculifer Ba/Ca as a proxy for salinity 87

8
5.2. Testing G. sacculifer Ba/Ca as an indicator for marine productivity 89
6. Conclusion 93
7 Synthesis 95
8 Outlook 97
9 References 99
9
Abstract
The eastern tropical Indian Ocean (ETIO) off southern Indonesia is a very important region for
the global thermohaline circulation as it hosts the exit pathway of the Indonesian Throughflow
(ITF). From this region cool and fresh ITF waters are advected by the South Equatorial Current
(SEC) to the Indian Ocean. Consequently, the ITF water freshens the Indian Ocean.
Nevertheless, the hydrology condition was different during the Last Glacial Maximum (LGM).
During this period the sea level was low and the Sunda Shelf was an exposed land. Marine
records and simulation study suggest that the exposure of the Sunda Shelf caused a significant
reduction in convection over the Indonesian region, resulting arid condition and saltier sea
surface condition off south Java. Armed with two sedimentary archives collected from the ETIO
off the Sunda Strait, this dissertation investigates the evolution of hydrological changes in the
ETIO during the past ~40 kyr B.P. with respect to the flooding of the Sunda Shelf. Furthermore,
this dissertation examines the applicability of planktic foraminifera Ba/Ca ratio as a tracer for
freshwater discharge.
New results of Mg/Ca-based sea surface temperature (SST), seawater δ18O (δ18Osw), and XRF-
Ti/Ca ratio of GeoB 10042-1 and GeoB 10043-3 collected from off the Sunda Strait revealed
that the region has experienced prominent hydrological changes during the past ~40 kyr B.P.
The results show that sea surface conditions off the Sunda Strait were cooler and saltier
conditions during the last glacial compared to the Holocene, and support previous finding that
suggests slowdowns of the Atlantic meridional overturning circulation (AMOC) during the
Heinrich stadials 1-3 and the Younger Dryas have caused dry conditions in the ETIO region.
Whereas during the Holocene sea surface conditions off the Sunda Strait exhibit warmer and
fresher conditions, particularly after the opening of the Sunda Strait at ~10 kyr B.P. This fresher
sea surface condition is maintained until today as a consequence of persistent transport of low
salinity Java Sea water into the ETIO via the Sunda Strait.

10
Novel millennial-scale reconstruction of past bottom water conditions (foraminifera εNd) show
distinct modifications of the bottom water (2171 m) off the Sunda Strait during the past 19 kyr.
Modifications of the bottom water during the last deglaciation and the Holocene correspond to
a strong- and a weak thermocline ITF flow, respectively. Furthermore, the results imply that
the variability of the detrital εNd data off the Sunda Strait is susceptible to the ITF flow and large
terrigenous material supply from the Sunda Strait.
Planktic foraminifera Ba/Ca ratio has been recently used to reconstruct modern and past
freshwater discharge. The application of this proxy is based on the observation that suggests
that the Ba/Ca ratio of seawater is directly incorporated into foraminifera calcite, and river water
has a distinctly higher Ba/Ca ratio than seawater. However, cleaning experiments results on
planktic foraminifera G. sacculifer collected from the ETIO revealed that the Ba/Ca ratio of G.
sacculifer cannot be used as a tracer for modern and past salinity changes due to the appearance
of seasonal upwelling complicates the interpretation of the proxy.

11
Zusammenfassung
Seewärts vor Süd-Indonesien befindet sich der östliche tropische Indische Ozean (ETIO). Diese
Ozeanregion ist von besonderer Bedeutung für die globale thermohaline Ozeanzirkulation, da
sich hier der Durchgang des indonesischen Durchflusses (ITF) befindet. In dieser Region
werden kühle und salzarme ITF Gewässer mit dem Südäquatorialstrom (SEC) in den Indischen
Ozean advektiert. Durch den Einfluss der ITF Gewässer erniedrigt sich der Salzgehalt im
Indischen Ozean. Die Hydrologie war jedoch während des letzten glazialen Maximums (LGM)
anders. Während dieser Zeit war der Meeresspiegel niedrig und der Sunda Schelf lag frei.
Marine Archive und Simulationsstudien zeigen, dass die Freilegung des Sunda Schelfes zu
einer signifikanten Verringerung der Konvektion innerhalb der indonesischen Region führte.
Dadurch kam es zu verringertem Niederschlag und einer salzigeren Meeresoberfläche seewärts
vor Süd-Java. Mit Hilfe von zwei Sedimentarchiven, die aus der Region ETIO seewärts der
Sundastraße gezogen wurden, untersucht diese Dissertation die Entwicklung der
hydrologischen Veränderungen im ETIO während der letzten ~ 40 ka in Bezug auf die
Überflutung des Sunda-Schelfes. Darüber hinaus untersucht die Dissertation die
Anwendbarkeit von Ba/Ca-Verhältnissen in planktischen Foraminiferenschalen als einen Proxy
für Süßwassereintrag.
Neue Ergebnisse der Mg/Ca-basierten Meeresoberflächentemperatur (SST), Meerwasser 18O
(δ18Osw) und XRF-Ti/Ca-Verhältnis von den Sedimentkernen GeoB 10042-1 und 10043-3
GeoB ergeben, dass die Gewässer vor der Sundastraße bedeutenden hydrologischen
Veränderungen während der vergangenen ~ 40 ka unterlagen. Die
Meeresoberflächentemperaturen waren kühler und das Oberflächenwasser war salziger
während der letzten Eiszeit im Vergleich zum Holozän. Diese Ergebnisse unterstützen die
frühere Feststellung, dass die Verlangsamung der Atlantischen meridionalen
Umwälzbewegung (Atlantic overturning circulation = AMOC) während der Heinrich Stadialen

12
1-3 und der jüngeren Dryas zu niederschlagsärmeren Bedingungen in der ETIO-Region geführt
hat. Im Gegensatz dazu herrschten während des Holozäns wärmere und salzärmere
Meeresoberflächenbedingungen vor der Sundastraße vor, insbesondere nach der Eröffnung der
Sundastraße vor ~ 10 ka. Diese salzärmeren Meeresoberflächenbedingungen halten sich bis
heute als Folge des anhaltenden Transportes von salzarmen Javasee-Gewässern in die ETIO
Region über die Sundastraße.
Neue jahrtausend-skalige Rekonstruktionen von vergangenen Tiefenwasserbedingungen
(Foraminiferen εNd) zeigen deutliche Modifikationen im Tiefenwasser (2170 m) seewärts der
Sundastraße während der letzten 19 ka. Diese Modifikationen des Tiefenwassers entsprechen
jeweils stärkeren und schwächeren thermoklinen ITF-Flüssen. Darüber hinaus lassen die
Ergebnisse erkennen, dass die Variabilität der εNd-Daten seewärts der Sundastraße anfällig für
den ITF-Fluss und großem terrigenen Materialeintrag von der Sundastraße ist.
Das Ba/Ca-Verhältnis in planktischen Foraminiferenschalen wurde kürzlich verwendet, um
modernen und vergangenen Süßwassereintrag zu rekonstruieren. Die Anwendung dieses
Proxies basiert auf folgenden Beobachtungen: Das Ba/Ca-Verhältnis von Seewasser baut sich
direkt in das Kalzit der Foraminiferenschalen ein und Flusswasser hat ein deutlich höheres
Ba/Ca-Verhältnis als Meerwasser. Allerdings zeigen Reinigungs-Experimente an der
planktischen Foraminifere G. sacculifer, die aus dem ETIO gesammelt wurde, dass das Ba/Ca-
Verhältnis in den Schalen der G. sacculifer nicht als Anzeiger für moderne und vergangene
Salinitäts-Veränderungen verwendet werden kann. Dies hängt damit zusammen, dass das
Vorkommen von saisonalem Auftrieb die Interpretation des Proxies verkompliziert.

13
1. Introduction
1.1. The Indonesian Seas and major climate phenomena
The Indonesian Seas play a significant role in the global climate as they lie beneath the major
atmospheric deep convection center (Neale and Slingo, 2003; Qu et al., 2005; Kida and
Richards, 2009) and within the Indo-Pacific Warm Pool (IPWP), the region of the warmest
(>28°C) global sea surface temperatures (SSTs) (Pierrehumber, 2000). As a consequence, the
Indonesian region provides heat and water vapor for the globe (Qu et al., 2005). Most
importantly, the Indonesian Seas are the only low-latitude oceanic connection between the
Pacific and Indian Oceans, known as the Indonesian throughflow (ITF). Today the estimated
ITF transport is ~15 Sv (1 Sv = 106 m3 s-1) and roughly 80% of that is transported via the main
pathway, the Makassar Strait (Gordon et al., 2010). From the Makassar Strait, the ITF water
can exit via Lombok Strait or circulate through the Banda and Flores Seas and enter the Indian
Ocean via Ombai Strait or Timor Passage (Sprintall et al. 2014).
The Indonesian Seas are also situated at the center of the Australian-Indonesian Monsoon
(AIM) system. The sea surface currents in the Indonesian Seas flow according to the seasonally
reversing monsoon winds (Figure 1). Furthermore, this monsoon system has been suggested to
impact sea surface conditions of the Indonesian Seas (Figure 1; e.g. Setiawan and Kawamura,
2011a; Setiawan and Habibi, 2011b). The southeast monsoon (SEM) (June–August) is
associated with the dry season due to southeasterly winds from Australia carrying warm and
dry air across Indonesia (Figure 1a). Whereas the northwest monsoon (NWM) is associated
with the wet season as westerlies from the Asian continent carry warm and moist air to the
Indonesian region (Figure 1b) (Susanto et al., 2006). In addition, also the ITF reveals a seasonal
pattern with maximum ITF transport occurring during the SEM (e.g. Meyers et al., 1995).

14
Figure 1. Monthly mean SST superimposed with sea surface wind (QuikSCAT) (m/s) in (a) August and (b) February (Qu et al., 2005). During the SEM season the southeasterly winds blow from Australia northwestward towards the Asian continent. The SEM winds induce significant sea surface cooling in the internal Indonesian Seas and the ETIO. While during the NWM season the northwesterly winds blow from the Asian continent to Australia. During this season prominent sea surface cooling only appears in the South China Sea.
The Indonesian Seas are significantly influenced by the El Niño–Southern Oscillation (ENSO)
and the Indian Ocean Dipole (IOD). The ENSO and IOD are primary controlling factors of
interannual variability of the climate over the Indonesia region (Gordon et al., 2003; Saji et al.
1999). ENSO is a climate variability associated with a disturbance of the Walker circulation
over the tropical Pacific Ocean (Figure 2; Rasmusson and Carpenter, 1982). During the warm
El Niño phase of ENSO, the position of maximum rainfall in the Indo-Pacific Warm Pool
(IPWP) shifts eastward towards the central and eastern Pacific Ocean following an eastward
15
displacement of warmest SSTs (Figure 2) (Hendon, 2003; McBride et al., 2003). As a result,
the Indonesian region experiences drought conditions and a strong SEM. In contrast to El Niño,
La Niña conditions are characterized by intensified trade winds and warmer SSTs than usual in
the IPWP. During La Niña the Walker circulation is much stronger, with a strong rising branch
over Indonesia, bringing increased rainfall over the region (McBride et al., 2003). With respect
to ITF, simulation and observation studies indicate a weaker ITF during El Niño in response to
the Pacific trade-wind relaxations (Gordon et al., 1999). However, the relationship between
ENSO and ITF at the exit portals is less clear as the ITF transport in the Lombok Strait, Ombai
Strait, and Timor passage is also subject to Indian Ocean variability (Sprintall and Révelard,
2014).
The IOD is a zonal-asymmetric equatorial variability of SST (western cold-eastern warm)
across the basin of the Indian Ocean (Saji et al., 1999; Webster et al., 1999). A positive phase
of IOD is characterized by negative SST anomalies in the equatorial southeastern Indian Ocean
and positive SST anomalies in the equatorial western Indian Ocean, and vice versa for a
negative IOD phase. A positive IOD develops and peaks in the months from June-
October/November (Meyers et al., 2007; Cai et al., 2013; Wang et al., 2015). During the
positive IOD, normal convective activities over the eastern Indian Ocean shift westward (Liu
et al., 2013), inducing heavy rainfall over the summer monsoon regions of eastern Africa and
India (Ashok et al., 2004) and severe drought in Indonesia (Webster et al., 1999).
The IOD often interacts and frequently occurs with ENSO events (Figure 3), indicating the
interactive nature of the two major climate phenomena (e.g. Yuan et al., 2011). Figure 3b and
3f show the strongest SST anomaly patterns occur for El Niño with positive IOD and for La
Niña with negative IOD, respectively. In both figures, the equatorial Pacific SST anomaly
indicates the widest band of latitude and the Java–Sumatra upwelling zone suggests the
strongest signal along the coast (Meyers et al., 2007). For instance, the strong El Niños in 1997

16
and 2006 occurred concurrently with IODs, causing severe drought in Indonesia–Australia and
floods in East Africa (Luo et al., 2010).
Figure 2. Generalized Walker Circulation (December-February) during neutral (top), El Niño (middle), La Niña (bottom) conditions. During neutral condition convection associated with rising branches of the Walker Circulation is found over the Maritime continent, northern South America, and eastern Africa. During El Niño events, overlaid on map of average sea surface temperature anomalies. Anomalous ocean warming in the central and eastern Pacific (orange) help to shift a rising branch of the Walker Circulation to east of 180°, while sinking branches shift to over the Maritime continent and northern South America. During La Niña events, anomalous ocean cooling (blue-green) in the central and eastern Pacific Ocean and warming over the western Pacific Ocean enhance the rising branch of the Walker circulation over the Maritime Continent and the sinking branch over the eastern Pacific Ocean. Enhanced rising motion is also observed over northern South America, while anomalous sinking motion is found

17
over eastern Africa (https://www.climate.gov/news-features/blogs/enso/walker-circulation-ensos-atmospheric-buddy).
Figure 3. Composite maps of SST anomalies averaged for June-November (Meyers et al., 2007). The strongest SST anomaly patterns occur for El Niño with positive IOD (3b) and La Niña with negative IOD (3f). In the ETIO, the Java–Sumatra upwelling zone has the strongest signal during these events.
1.2. Eastern tropical Indian Ocean
The region of eastern tropical Indian Ocean region (ETIO) is a pivotal region as it hosts the exit
portals of the ITF (e.g. Sprintall et al., 2014). Recent studies suggest that the ITF transport via
Lombok Strait, Ombai Strait, and Timor Passage is about 2.6 Sv, 4.9 Sv, and 7.5 Sv,
respectively (Sprintall et al., 2009). Around 88% ITF water transported to the ETIO exits the
18
Indian Ocean through the Agulhas Current after a 50-year period (Song et al., 2004), thereby
forming an integral part of the global ocean conveyor belt (Talley and Sprintall, 2005).
The ETIO is also characterized by the presence of upwelling along the south coasts of Sumatra-
Java-Lesser Sunda Island chain (Susanto et al., 2001). The existence of upwelling during the
SEM has been suggested to enhance marine productivity (Hendiarti et al., 2004; Susanto and
Marra, 2005) and pelagic fish catch (Hendiarti et al., 2005) in the ETIO region off south Java.
With respect to ocean dynamics, upwelling is an important process influencing the mixed layer
depth and barrier layer thickness in the ETIO region by uplifting the thermocline (Du et al.,
2008). During a positive IOD event the ETIO region off Sumatra and Java experiences a strong
SST depression (-3°C) initiated by an anomalous upwelling (Du et al., 2008). As a result,
unusual high chlorophyll a concentrations are observed (Susanto and Marra, 2005; Iskandar et
al., 2009), reflecting enhanced marine productivity in the region. In line with the IOD, ENSO
also has been suggested to influence the strength of Sumatra-Java upwelling, with strong El
Niño induces high chlorophyll a concentration (Susanto et al., 2001). These observations imply
that upwelling in the ETIO region off Sumatra-Java is sensitive to IOD and ENSO (Meyers et
al., 2007).
The ETIO is a region where precipitation (P) exceeds over evaporation (E) throughout the year
(Hendon, 2003). Qu and Meyers (2005) suggest that a large P-E is confined to the coastal region
of Indonesia, with a maximum >10 mm day-1 observed near the coast of Sumatra. According to
Mohtadi et al. (2014), central-western Sumatra receives higher average monthly rainfall (~360
mm per month) compared to northwestern Sumatra (~135 mm per month). Furthermore they
suggest that the contribution of the AIM to the total rainfall is insignificant in central and
northern Sumatra. Hence, the ETIO regions off northern and central Sumatra are suitable areas
to study the evolution of the hydrological changes without any significant biases introduced by
AIM or ENSO (Mohtadi et al., 2014).

19
1.3. Paleoceanographic reconstruction of the eastern tropical Indian Ocean
Over the past decade, a number of paleoceanographic studies based on marine sedimentary
archives have been published from different sites in the ETIO region. The longest time scale of
reconstruction (300 kyr) was provided by sediment core SO139-74KL collected from off
southern Sumatra (Lückge et al., 2009). Lückge et al. (2009) have used X-ray fluorescence,
total organic carbon, and C37 alkenones to investigate past changes in marine productivity,
freshwater budget, and SST at orbital time scales. The most important finding from this study
is that during the past 300 kyr enhanced marine paleoproductivity in the ETIO region was
directly related to strengthening of upwelling during SEM and periods of increased Northern
Hemisphere summer insolation at a precessional cyclicity. In contrast, during insolation minima
the atmospheric pressure gradient relaxed and monsoon winds weakened, decreasing the
intensity of upwelling and marine productivity. Further they suggest that the good
correspondence between paleoproductivity and solar insolation at precessional frequency is
similar to today’s seasonal upwelling off Sumatra and Java. This finding is in agreement with
a study by Mohtadi et al. (2011a) that suggests that the upwelling off southern Java changed in
accordance with upwelling of the Arabian Sea through variations in the strength of large-scale
cross-equatorial boreal summer winds in response to Northern Hemisphere summer insolation.
Multidecadal to centennial-scale variability of the south Java upwelling during the past 2 kyr
has been investigated by Steinke et al. (2014). This study suggests that upwelling was generally
strong during the Little Ice Age (LIA) and weak during the Medieval Warm Period (MWP) and
the Roman Warm Period (RWP). Furthermore the study reveals that periods of strengthened
upwelling and more intense austral winter monsoon winds over southern Indonesia are
associated with reduced East Asian summer monsoon (EASM) rainfall over north/central China
during the last 2 kyr. This new study supports previous findings that suggest the importance of
large-scale Australian/Indonesian cross-equatorial boreal summer winds in governing the
20
intensity of south Sumatra-Java upwelling. However, the influence of IOD on the upwelling
variability off southern Indonesia cannot be resolved yet.
The past variability of IOD in the ETIO region is not well studied. Until today there are only
three publications (Abram et al., 2007; 2009; Kwiatkowski et al., 2015) discussing the
variations of IOD during the Holocene and one publication for the past 24 kyr (Niedermeyer et
al., 2014). Abram et al. (2007; 2009) suggest that a good correspondence between the Asian
monsoon system and IOD is implied by a longer duration of positive IOD events during stronger
Asian summer monsoon. They also argue that sea surface cooling during a positive IOD event
is constrained by the cross-equatorial wind reversal at the end of the Asian summer monsoon
season, resulting in an abrupt termination of Ekman upwelling along the coast of Sumatra and
Java. Abram et al. (2007; 2009) further postulate that the reversal winds may have played an
important role in controlling the timing of peak cooling during positive IOD events during the
Holocene. This finding supports the proxy record of plant wax stable hydrogen (δD) from off
northwest Sumatra that suggests the Holocene variability of rainfall in the ETIO is coupled to
changes in the IOD variations (Niedermeyer et al., 2014). Furthermore, a study by Kwiatkowski
et al. (2015) shows a thermocline shoaling off western Sumatra during the positive IOD-like
mean state.
Another important finding on hydrological changes in the ETIO region has been reported from
the non-ENSO and monsoon regions, central and northern Sumatra (Mohtadi et al., 2014).
Mohtadi et al. (2014) found that saltier sea surface conditions and reduced rainfall in the ETIO
during Heinrich stadials and the Younger Dryas were due to a weakened and easterly
displacement of the Hadley Circulation as a response to a slowdown of the Atlantic meridional
overturning circulation (AMOC). Furthermore, they suggest that zonally asymmetric changes
within the Indian Ocean were not the primary control on Indian Ocean hydrology during these
periods.

21
1.3.1. Paleogeographic changes since the Last Glacial Maximum (LGM)
The Sunda Shelf is an important region in the IPWP as it forms the world’s second largest
submerged shelf (Molengraaff, 1921; Dickerson, 1941). The Sunda Shelf is located in the
western Indonesian Archipelago and is surrounded by the coastal areas of Vietnam, Cambodia
and Thailand, the Peninsular Malaysia, Singapore, and Indonesia (Hanebuth and Stattegger,
2004). Palaeoclimate records and simulation experiments show that both the exposure and the
flooding of the Sunda Shelf have influenced the regional hydroclimate (Linsley et al., 2010;
DiNezio and Tierney, 2013; Griffiths et al., 2013). During the Last Glacial Maximum (LGM),
when sea level was approximately −123 m lower than today (Hanebuth et al., 2009), the Sunda
Shelf was an exposed land-mass (so-called “Sundaland”) connecting the islands of Borneo,
Java, and Sumatra with continental Asia (Hanebuth et al., 2011). During this period Sundaland
rainforests covered a greater area than today (Cannon et al., 2009; Hanebuth et al., 2011) while
intertidal marine communities were being pushed seaward (Hanebuth et al., 2011). A simulation
study suggests that the exposure of the Sunda Shelf altered the atmospheric circulation by
weakening the Indian Ocean Walker Circulation, which was accompanied by increased aridity
in the ETIO and higher sea surface salinity (SSS) south of Java (DiNezio and Tierney, 2013).
Previous studies suggest that the Sunda Shelf was inundated during rapid deglacial sea-level
rise (Hanebuth et al., 2000; Sathiamurthy and Voris, 2006). Around 14 kyr B.P. meltwater pulse
1A (MWP-1A) produced a sea level rise of 16 m within 300 years over the Sunda Shelf
(Hanebuth et al., 2000). At ~ 9.5 kyr B.P. the flooding of the Sunda shelf reached the shallowest
point, the Karimata Strait, allowing the connection of water masses of the South China Sea and
the southern Makassar Strait via the Java Sea (Hanebuth et al., 2000; Sathiamurthy and Voris,
2006). As a result, the flooding affected the regional hydrology of the Makassar Strait (Linsley
et al., 2010), the Timor Sea (Xu et al., 2008), the Savu Sea (Dubois et al., 2014), and in Flores
(Griffiths et al., 2009; 2013). Moreover, some studies suggest that the flooding of the Sunda

22
Shelf influenced the ITF by changing a surface-dominated to a thermocline-dominated flow
(Linsley et al., 2010; Xu et al., 2008).
1.4. Dissertation objectives
Hydrological changes in the eastern tropical Indian Ocean on different time scales have been
investigated using marine sediment proxy and model simulation. Several studies have invoked
flooding of the Sunda Shelf as well as opening of the Sunda Strait at ~ 10 kyr as possible drivers
for changes in upper ocean condition in the eastern tropical Indian Ocean (Mohtadi et al., 2010a;
2010b; Lückge et al., 2009). Simulation studies show that the Sunda Strait transports a
significant amount of low salinity Java Sea water into the Indian Ocean, impacting background
state of the sea surface conditions in the region (Putri, 2005; Du and Qu, 2010). However, to
date the impact of the opening of the Sunda Strait on sea surface conditions and the hydrological
evolution off the Sunda Strait are not well constrained from marine sedimentary-based
reconstructions in the ETIO.
The neodymium isotopic composition (143Nd/144Nd ratio, expressed as εNd) of planktic
foraminifera has been successfully used to reconstruct past changes in oceanic circulation
(Piotrowski et al., 2012; Osborne et al., 2014) and has been shown to reliably record the isotopic
composition of bottom waters (Roberts et al., 2012; Kraft et al., 2013; Molina-Kescher et al.,
2014). The εNd of water masses is mainly controlled by the isotopic composition of the
surrounding land masses at their origin. Specifically weathering and erosion of continental
rocks ultimately have been suggested to play a primary role in controlling the εNd of dissolved
Nd in the oceans (Frank, 2002). The residence time of Nd in seawater is shorter than the mixing
times of the oceans (200–1000 years) (Tachikawa et al., 1999; Arsouze et al., 2009; Rempfer
et al., 2011). Until today past changes in the εNd of bottom water in the ETIO and the impact of
the opening of the Sunda Strait on bottom water are not known.

23
Foraminifera Ba/Ca ratio is a new geochemical proxy for continental runoff and freshwater
discharges (Hall and Chan, 2004; Weldeab et al., 2007; Schmidt and Lynch Stieglitz, 2011). It
has been suggested that one of the primary sources of Ba in the oceans is riverine input due to
dissolved Ba is enriched in riverine water compared to seawater (Weldeab et al., 2007). Since
the early Holocene, specifically after the opening of the Sunda Strait at ~10 kyr B.P., sea surface
conditions in the ETIO off the Sunda Strait are characterized by fresher surface conditions due
to a continues import of low salinity Java Sea water. Thus, with respect to the Ba/Ca proxy, the
modern oceanographic setting of the ETIO appears to be suitable its application. However, until
to date no study on the Ba/Ca ratio in the ETIO have been reported.
The central purpose of this dissertation is to investigate hydrological changes in the eastern
tropical Indian Ocean and to relate the changes to the opening of the Sunda Strait at ~10 kyr.
The specific objectives of this dissertation are as follows:
1. How did sea surface conditions in the eastern tropical Indian Ocean off the Sunda Strait
vary during the past ~40 kyr and respond to the opening of the Sunda Strait?
2. How did bottom water in the eastern tropical Indian Ocean off the Sunda Strait vary during
the past ~19 kyr? What are the factors inducing modification of the bottom water
(foraminifera εNd) off the Sunda Strait?
3. Can the planktic foraminifera G. sacculifer Ba/Ca ratio be used as a tracer for present and
past freshwater discharges in the ETIO off the Sunda Strait? What is the effect of using
different reductive reagents on the G. sacculifer Ba/Ca ratio?
In order to tackle the above research questions two sediment cores (GeoB 10042-1 and GeoB
10043-3) and ten surface sediment samples collected from the ETIO region off the Sunda Strait
and off western and southern Sumatra have been selected, respectively, permitting a detailed
reconstruction of the hydrological changes off the Sunda Strait and providing first Ba/Ca ratios
for the ETIO.
24
1.5. Dissertation structure and contribution to publications
Chapters 1-3 provide a general introduction of the research topic, the study area, and the
materials and methods used in this study. Chapters 4-5 of this dissertation are written in a
scientific style and format fitted for journal publication, and are thus presented as self-contained
studies. Chapter 6 provides a technical report on Ba/Ca ratio cleaning experiment. Finally,
chapter 7 and 8 provide a synthesis of the dissertation and an outlook.
Chapter 4: The consequences of opening the Sunda Strait on the hydrography of the
eastern tropical Indian Ocean (re-submitted after revision to Paleoceanography)
R. Y. Setiawan, M. Mohtadi, J. Southon, J. Groeneveld, S. Steinke, D. Hebbeln
This chapter presents and discusses temporal variability of the Mg/Ca-based sea surface
temperatures (SSTs; based on Mg/Ca measurements on Globigerinoides ruber sensu stricto
(s.s.)), seawater δ18O (δ18Osw; based on δ18O and Mg/Ca measurements on G. ruber s.s.), and
the terrigenous supply (based on XRF-Ti/Ca ratios) in the eastern tropical Indian Ocean during
the past ~40 kyr. Of particular interest here are evidence of the impacts of the opening of the
Sunda Strait on these parameters. The results show that since the opening of the Sunda Strait at
~10 kyr B.P. SST and δ18Osw off the Sunda Strait indicate warmer and fresher surface conditions
compared during the last glacial, suggesting persistent advection of low salinity Java Sea water.
Contributions: In this chapter R. Y. Setiawan contributed to perform all laboratory works.
Specifically, the laboratory works include XRF and Mg/Ca measurements on bulk sediment
and planktic foraminifera G. ruber s.s. R. Y. Setiawan wrote the paper with significant editorial
contribution from all co-authors.
Chapter 5: Modification of the deep water neodymium isotope composition along the
eastern margin of the tropical Indian Ocean (in preparation)
R. Y. Setiawan, E. C. Hathorne, K. Pahnke, M. Mohtadi, D. Hebbeln

25
This chapter presents and discusses the temporal variability of the bottom water circulation
(based on planktic foraminifera εNd) during the past ~19kyr, and investigates the factors
inducing modification of the bottom water circulation and the provenance of the detrital
materials off the Sunda Strait. The results demonstrate that during the last glacial and the period
between ~7.7 and ~2.6 kyr B.P. bottom water off the Sunda Strait experienced significant
modifications presumably due to a strong flow of the thermocline ITF and a large supply of
terrigenous materials at ~10 kyr B.P., respectively. Furthermore, the results indicate that the
South Java Current and ITF may have played a role in governing the temporal variability of the
detrital εNd.
Contributions: In this chapter R. Y. Setiawan contributed to perform major laboratory works
such as (1) neodymium (Nd) isotope analyses on mixed planktic foraminifera at the GEOMAR
Helmholtz Centre for Ocean Research Kiel (2) and on bulk sediments at the Max Planck
Research Group for Marine Isotope Geochemistry, Institute for Chemistry and Biology of the
Marine Environment (ICBM), University of Oldenburg. K. Pahnke contributed to the strontium
(Sr) isotope analyses and total digestion. R. Y. Setiawan wrote the paper with constructive
comments from all co-authors.
Chapter 6: Testing the applicability of G. sacculifer Ba/Ca in the eastern tropical Indian
Ocean (technical report)
R. Y. Setiawan, M. Mohtadi, J. Groeneveld, S. Steinke, H. Kuhnert, D. Hebbeln
Chapter 6, for the first time, investigates and discusses the applicability of the G. sacculifer
Ba/Ca ratio as a tracer for present and past freshwater discharge in the eastern tropical Indian
Ocean. The results suggest that the Ba/Ca ratio of G. sacculifer cannot be used as a tracer for
freshwater discharge as the presence of seasonal upwelling complicates the interpretation of the
proxy. In addition, a series of cleaning experiments were performed to test the use of reductive
solutions of hydrazine, hydroxylamine, and DTPA for Ba/Ca ratio extraction. According to the

26
results of cleaning experiment, hydroxylamine and a cleaning protocol proposed by Barker et
al. (2003) can be used to extract Ba/Ca ratio of G. sacculifer.
Contributions: For this chapter R. Y. Setiawan performed all laboratory works. J. Groeneveld
and H. Kuhnert designed the cleaning experiment and R. Y. Setiawan wrote the report with
significant editorial contribution from all co-authors.

27
2. Regional Hydrography
2.1. Ocean circulation
Today the large-scale circulation in the ETIO is dominated by the South Equatorial Current
(SEC) (Qu and Meyers, 2005). The SEC is a vertical water mass extending from surface to the
abyss in the eastern Indian Ocean (Talley and Sprintall, 2005). It advects the fresher ITF water
westward across the Indian Ocean and flows centered at 12°S (Figure 4) (Talley and Sprintall,
2005; Talley et al., 2011).
Figure 4. Dashed arrow off southern Sumatra and Java depict the direction of the South Java Current (Sprintall et al., 2010). Solid lines denote the ITF pathways in the Indonesian Seas, and the directions of SEC and LC.
The most important ocean circulation in the ETIO and the Indonesian Seas is the ITF (Figure
4). There are two major routes of the ITF within the Indonesian Seas. The first route is through
the Sulawesi Sea into the Makassar Strait, and the second route is via the Maluku Sea into the
Lifamatola Strait, or directly through the Halmahera Sea into the internal Seram and Banda
Seas. From the Makassar Strait ITF directly exits through the Lombok Strait, whereas from the
28
Banda Sea the ITF exits into the east Indian Ocean via Timor Passage, or via the Ombai Strait
and then through the Sumba Strait and the Savu Strait (Gordon and Fine, 1996; Hautala et al.,
1996; Sprintall et al., 2009). Recently, a new ITF branch through the South China Sea and the
Karimata Strait has been found (Susanto et al., 2010) and some studies suggest that this small
inflow has strong seasonal variability and influence on vertical structure of the main ITF
(Tozuka et al., 2009; Fang et al., 2010; Susanto et al., 2013).
Another important current system in the ETIO is the South Java Current (SJC) and
UnderCurrent (SJUC) (Quadfasel and Cresswell, 1992; Sprintall et al., 2010). These current
systems play a significant role in distributing freshwater into and out of the southeast Indian
Ocean (Sprintall et al., 2010). The SJC is a semi-permanent eastward surface flow and
transports warm and fresh waters from the high rainfall, warm pool region of the eastern
equatorial Indian Ocean up to the Savu Sea and Ombai Strait (Figure 4) (Sprintall et al., 2010).
The direction of SJC is reversed only during the SEM season. Sprintall et al. (2010) suggest
that the driving force of SJC is interplay processes by various mechanisms relate to remotely
driven Kelvin waves, Ekman dynamics, the ITF, and topographic effects.
The SJUC flows eastward at depths of 200-1000 m and is driven by remotely Kelvin waves
forced in the equatorial Indian Ocean that travel along the coastal waveguide of Sumatra,- Java
and the Lesser Sunda Islands. The properties and velocities of the SJUC are different from the
SJC. The SJUC transports high salinity, low oxygen North Indian Intermediate Water (NIIW)
eastward reaching the Ombai Strait (Sprintall et al., 2010).
2.2. Water masses
A major water mass that dominates the upper layer (0-150 m) off the Sunda Strait is the Java
Sea water mass (Putri, 2005). This water mass is characterized by low salinity (<34 psu) and
high SST (>29°C) (Putri, 2005). In the eastern Indian Ocean, the total ITF transport is composed
of the Indonesian Throughflow Water (ITW) in the upper layer (0-500 m) and the Indonesian

29
Intermediate Water (IIW) at deeper layer (>500-1500 m) (Talley and Sprintall, 2005). Both the
ITW and IIW are characterized by low salinity (~34.55 psu) and high silica that can be traced
along the SEC. Below 1500 m to the bottom, the water column off the eastern Indian Ocean is
comprised of the upper Indian Deep Water (IDW). This water mass is characterized by high
salinity (>34.6) and cold temperature (<4°C) (Atmadipoera et al., 2009). In the Indian Ocean,
the IDW ranges from 500–3800 m in the southern portion of the Indian Ocean to 2000–3800 m
in the north, with a core at ~2400 m (Martin and Scher, 2006).

30
3. Materials and Methods
3.1. Materials of study and sediment sampling
Materials used in this study include the sediment cores (GeoB 10042-1 and GeoB 10043-3)
collected from off the Sunda Strait and ten surface sediment samples (Table 1 in chapter 6)
collected from off Sumatra during the RV Sonne Expedition 184 in 2005 (Hebbeln et al., 2005).
Cores GeoB 10042-1 and GeoB 10043-3 were retrieved from 2454 m and 2171 m, respectively.
The core length of GeoB 10042-1 is 540 cm while core GeoB 1043-3 is 390 cm long. Both
consist of nannofossil oozes and have ash layers in the upper 18 cm and in the bottom of the
cores at a depth between 370 and 382 cm (GeoB 10043-3) and at 470 cm (GeoB 10042-2).
The ten surface sediment samples were retrieved from depths between 911 and 2605 m. In this
study, these surface samples were used to perform Ba/Ca analyses.
The working halves of cores GeoB 10042-1 and GeoB 10043-3 were sub-sampled at 5 cm
intervals for Mg/Ca analyses. For the analyses of the foraminifera neodymium isotopic
composition (εNd) only core GeoB 10043-3 was sampled at 5 cm interval. While for the detrital
εNd and detrital strontium isotope (87Sr/86Sr) analyses both cores were sampled only at specific
time slices (the Heinrich stadial 1, the Bølling-Allerød, the Younger Dryas, and the early and
late Holocene). In addition, XRF analyses were also conducted on the archive halves of cores
GeoB 10042-1 and GeoB 10043-3.
3.2. Methods
3.2.1. Accelerator mass spectrometry (AMS) dating
The age models for GeoB 10042-1 and GeoB 10043-3 are based on the radiocarbon ages of
planktic foraminifera (Table 1 in chapter 4). For this analysis, G. ruber s.s. and G. sacculifer
(without the sac-like final chamber) were picked from the >150 μm fraction. Radiocarbon
dating was performed at the Keck Carbon Cycle Accelerator Mass Spectrometry, University of

31
California, Irvine (UCI). All AMS 14C ages were converted to 2σ calendar ages with the CALIB
7.0 software using the Marine13 calibration dataset (Reimer et al., 2013) (Table 1 in chapter 4)
with a regional reservoir correction of 100 years (Southon et al., 2013).
3.2.2. Stable isotope, Mg/Ca and Ba/Ca analyses
For the stable oxygen isotope ( 18O) and Mg/Ca analyses, around 30-40 individuals of G. ruber
s.s. were picked from the 250-355 μm size fraction. The samples were then gently crushed using
two glass plates, homogenized, and split. About two-third of the tests was used for Mg/Ca
analysis and the remaining one- third was used for 18O analysis. The 18O measurements were
carried out using a Finnigan MAT 251 mass spectrometer at the MARUM, University of
Bremen. Long-term standard deviation of the carbonate standard is <0.07‰. The 18O results
are reported relative to the international Pee-Dee Belemnite (PDB) Standard.
For the Mg/Ca analyses, the gently crushed tests were cleaned according to a cleaning protocol
suggested by Barker et al. (2003). After chemical cleaning, samples were measured with an
inductively coupled plasma–optical emission spectrometer (ICP-OES) (720 Agilent
Technology Series) at the MARUM, University of Bremen. The Mg/Ca ratio values are
reported as mmol mol-1. The average 1σ error for the Mg/Ca analyses on an external standard
measured along with the analyses for cores GeoB 10042-1 and GeoB 10043-3 is 0.04 mmol
mol-1.
For the Ba/Ca analyses, approximately 30-40 individuals of G. sacculifer (without the sac-like
final chamber) were picked from the 250-355 μm size fraction and gently cracked using glass
plates. All test fragments were split into five aliquots and these aliquots were subjected to
various cleaning steps. Similar to the Mg/Ca analyses, cleaned samples were then measured
with an Agilent 720 ICP-OES. The Ba/Ca values are reported as μmol mol-1. The average 1σ
error for the Ba/Ca analyses on external standard and ECRM 752-1 standard are 0.02 μmol mol-

32
1 and 0.1 μmol mol-1, respectively. It is important to note here that the sample reproducibility
was not measured due to insufficient sample amount.
3.2.3. Neodymium and strontium isotope analyses
3.2.3.1. Neodymium extraction from mixed planktonic foraminifera
In order to reconstruct the bottom water Nd isotopic composition (εNd), approximately 20 to 75
mg of mixed planktic foraminifera tests >250 μm were picked and gently cracked using two
glass plates. Samples were then cleaned using a method developed by Boyle (1981) and
modified (scaled up for larger samples) by Vance and Burton (1999) and Vance et al. (2004).
After cleaning, samples were dissolved in HNO3 and aliquots were separated for element
(particularly Al/Ca, Mn/Ca, Fe/Ca), rare earth element (REE) and Nd isotope analyses.
3.2.3.2. Neodymium and Strontium extraction from detrital fraction
In order to investigate the sediment provenance, 50 mg of the freeze-dried and homogenized
sediment samples were leached using 25% (v/v) acetic acid and 0.02 M hydroxylamine
hydrochloride (HH). The leached sediment samples were then digested in closed
polytetrafluorethylene (PTFE) vessels using a mixture of concentrated HF-HNO3-HClO4. The
dissolved samples were then subjected to standard element purification procedures for
neodymium and strontium.
3.2.3.3. Neodymium and strontium isotope measurements
Nd isotope measurements were performed using a Nu plasma MC-ICPMS at GEOMAR and a
Neptune Plus MC-ICPMS at the Institute for Chemistry and Biology of the Marine
Environment (ICBM), University of Oldenburg. The Nd isotopic composition signature is
reported as εNd, which corresponds to the deviation of a measured 143Nd/144Nd of a sample from
the Chondritic Uniform Reservoir (CHUR) value of 0.512638 (Jacobsen and Wasserburg,
1980) (εNd = {(143Nd/144Nd) sample / (143Nd/144Nd) CHUR -1} × 10,000). The Sr isotopes were

33
also measured at ICBM and the results were normalized to the widely accepted value of NIST
SRM987 standard with an 86Sr/88Sr ratio of 0.710245. The external reproducibility (2σ) of the
143Nd/144Nd at GEOMAR was between 0.3 and 0.6 εNd units, while at ICBM was between 0.2
and 0.3 εNd units. The 2σ of 87Sr/86Sr measurement at ICBM ranged between 0.00001 and
0.00002.
3.2.4. X-Ray Fluorescence (XRF) core scanning
Elemental XRF scanners are commonly used to detect chemical compositions in sediments as
it offers a rapid and non-destructive analyses of a suite of elements at the surface of split cores.
The XRF measurements were performed on cores GeoB 10042-1 and GeoB 10043-3, and were
carried out with XRF Core Scanner I and II at MARUM, University of Bremen. For the GeoB
10042-1 the measurements were conducted at 2 cm intervals, whereas for the GeoB 10043-3 1
cm intervals have been applied. For this study the elemental ratio of titanium to calcium (Ti/Ca;
logarithmic scale) was used as a proxy to determine past changes in terrestrial input.
34
4. The consequences of opening the Sunda Strait on the hydrography of the eastern
tropical Indian Ocean
Riza Yuliratno Setiawan1*, Mahyar Mohtadi1, John Southon2, Jeroen Groeneveld1,3, Stephan Steinke1, Dierk Hebbeln1 1 MARUM – Center for Marine Environmental Sciences, University of Bremen, Bremen, Germany 2 Earth System Science Department, University of California, Irvine, CA 92697, USA 3Alfred-Wegener Institute, Helmholtz Center for Polar and Marine Research, Potsdam,
Germany
Accepted in Paleoceanography on 30 September 2015
Abstract
The advection of relatively fresh Java Sea water through the Sunda Strait is presently
responsible for the low-salinity ‘‘tongue’’ in the eastern tropical Indian Ocean with salinities
as low as 32‰. The evolution of the hydrologic conditions in the eastern tropical Indian Ocean
since the last glacial period, when the Sunda shelf was exposed and any advection via the Sunda
Strait was cut off, and the degree to which these conditions were affected by the Sunda Strait
opening are not known. Here we have analyzed two sediment cores (GeoB 10042-1 and GeoB
10043-3) collected from the eastern tropical Indian Ocean off the Sunda Strait that cover the
past ~40,000 years. We investigate the magnitude of terrigenous supply, sea surface
temperature (SST) and seawater δ18O (δ18Osw) changes related to the sea level-driven opening
of the Sunda Strait. Our new spliced records off the Sunda Strait show that during the last
glacial, average SST was cooler and δ18Osw was higher than elsewhere in the eastern tropical
Indian Ocean. Seawater δ18O decreased ~0.5‰ after the opening of the Sunda Strait at ~10 kyr
BP accompanied by a SST increase of 1.7°C. We suggest that fresher sea surface conditions
have persisted ever since due to a continuous transport of low salinity Java Sea water into the
eastern tropical Indian Ocean via the Sunda Strait that additionally increased marine
productivity through the concomitant increase in terrigenous supply.

35
1. Introduction
The Sunda Shelf in the Indo-Pacific Warm Pool (IPWP) is one of the largest shelves in the
world with less than 70 m water depth. During the Last Glacial Maximum (LGM), when global
sea level was ~130 m below the present level, the wide Sunda Shelf was exposed forming a
huge land mass also known as Sundaland [Tija, 1980; Pelejero et al., 1999; Hanebuth et al.,
2000]. Model results suggest that the exposure of the Sunda Shelf altered the atmospheric
circulation by weakening the Indian Ocean Walker Circulation, which was accompanied by
increased aridity in the eastern tropical Indian Ocean and higher sea surface salinity (SSS) south
of Java [DiNezio and Tierney, 2013].
Marine and terrestrial proxy data suggest that the Sunda Shelf was flooded at ~9.5 kyr BP due
to eustatic sea level rise [Hanebuth et al., 2000; 2011; Griffiths et al., 2009; 2013; Linsley et
al., 2010]. The flooding of the shelf has been suggested to affect seawater 18O and rainfall in
regions to the east and southeast of the Sunda Shelf, in the Timor Sea [Xu et al., 2008] and the
Savu Sea [Dubois et al., 2014], in Flores [Griffiths et al., 2009; 2013], and in the Makassar
Strait [Linsley et al., 2010]. However, temperature and rainfall proxy records from Sulawesi
[Russell et al., 2014] and from sites to the west and north of the Sunda Shelf do not show a sea-
level related variability on glacial-interglacial timescales; e.g., in Borneo [Carolin et al., 2013;
Dubois et al., 2014] and western Sumatra [Maloney, 1980; Mohtadi et al., 2014; Niedermeyer
et al., 2014; Stuijts et al., 1988; van der Kaars et al., 2010]. Records from south of the Sunda
Shelf are equivocal [Kershaw et al., 2007; Mohtadi et al., 2011a]. Moreover, some results
suggest that the flooding of the Sunda Shelf influenced the Indonesian Throughflow (ITF) by
changing a surface-dominated to a thermocline-dominated flow [Linsley et al., 2010; Xu et al.,
2008]. In the absence of any influence of the relatively fresh South China Sea (SCS) water, that
today adds to the ITF through the Java Sea, glacial ITF transport was dominated by warmer and
saltier surface flow [Xu et al., 2008].

36
The effect of the Sunda Shelf flooding and the opening of the Sunda Strait at ~9.5 kyr BP on
the hydrology of the eastern tropical Indian Ocean is not well known. Presently, the Sunda Strait
is the most important link between the Java Sea and the Indian Ocean as it transports warm,
low salinity Java Sea water into the eastern tropical Indian Ocean [Putri, 2005]. This advection
of relatively fresh water has significant impacts particularly on the upper ocean stratification in
the eastern tropical Indian Ocean off the Sunda Strait [Putri, 2005; Du and Qu, 2010]. Data
from a sedimentary record to the Northwest of the Sunda Strait imply that during periods of
lower sea level prior to the Holocene the input of less-saline waters via the Sunda Strait was cut
off and saltier sea surface condition prevailed in the eastern tropical Indian Ocean [Mohtadi et
al., 2010a; b]. Here we study two additional marine sedimentary archives collected in the
eastern tropical Indian Ocean off the Sunda Strait with a higher temporal resolution and more
accurate age model for the past 40 kyr to understand the influence of an exposed or a flooded
Sunda Shelf on the regional hydrology. Records of bulk sedimentary element composition
together with stable oxygen isotope ( 18O) and Mg/Ca ratio of the planktic foraminifera
Globigerinoides ruber sensu stricto (s.s.) are used to unravel changes in the regional hydrology
of the eastern tropical Indian Ocean related to sea level changes and the resulting
exposure/flooding of the Sunda Shelf.
2. Study Area
Today the eastern tropical Indian Ocean is greatly influenced by the Australian-Indonesian
monsoon (AIM) system. The dynamics of the seasonally reversing monsoon winds over the
study area impacts oceanic circulation, sea surface temperature (SST), and SSS along the
southern coasts of Java and Sumatra [Susanto et al., 2001; Qu and Meyers, 2005; Du et al.,
2005; 2008]. During the northwest monsoon (NWM) season (December–February), winds
blow from the Eurasian continent, pass the South China Sea and the Bay of Bengal and carry
warm and moist air to Indonesia [Gordon, 2005; Qu et al., 2005]. Along the coasts of Sumatra

37
and Java, the almost year-round eastward flowing South Java Current carries low-salinity, warm
water from the eastern equatorial Indian Ocean off Sumatra into the southeast Indian Ocean
[Du et al., 2005; Sprintall et al., 2009; 2010]. The direction of the SJC is reversed only during
the southeast monsoon (SEM) season (June–September), carrying higher salinity water flows
westward [Sprintall et al., 2010] (Fig. 1a). During this time southeasterly winds blow from
Australia and carry warm and dry air to Indonesia [Gordon, 2005; Qu et al., 2005]. A striking
feature during the SEM is the appearance of wind-induced upwelling centered south of Java
[Susanto et al., 2001].
Figure 1. Annual mean maps of (a) sea surface salinity (psu) [Zweng et al., 2013] and (b) sea surface temperature (°C) [Locarnini et al., 2013] obtained from the World Ocean Atlas 2013. The Sunda Strait is indicated by black arrow in the maps. Grey, black, purple, and orange dots denote the positions of GeoB 10042-1 and GeoB 10043-3 (this study), MD98-2165 [Levi et al., 2007], and GeoB 10069-3 [Gibbons et al., 2014], respectively. White, blue, yellow and black stars show the positions of SO189-119KL, SO189-39KL [Mohtadi et al., 2014], GeoB 10038-4 [Mohtadi et al., 2010a; b], and sediment trap JAM1-3 [Mohtadi et al., 2009]. White dashed arrows in the Java Sea and off the southern Sumatra and Java depict the movement of low salinity water and the direction of the South Java Current [Sprintall et al., 2010]. White solid lines denote ITF pathways.

38
The eastern tropical Indian Ocean is a region where precipitation (P) exceeds evaporation (E)
throughout the year [Hendon, 2003]. Moreover, Qu and Meyers (2005) suggest that a large P-
E difference is confined to the coastal region of Indonesia, with a maximum >10 mm day-1
occurring near the coast of Sumatra. This large P-E creates a strong salinity-induced
stratification in the surface waters. Further south in the monsoon region of southern Indonesia,
the rainy season is principally linked to the NWM due to the southward progression of the
Intertropical Convergence Zone (ITCZ), while the dry season peaks during the SEM [Aldrian
and Susanto, 2003; Hendon, 2003].
Another important oceanic circulation component in the study area is the ITF. The ITF
transports Pacific Ocean water into the Indian Ocean via multiple passages within the
Indonesian Seas [Vranes and Gordon, 2005; Gordon et al., 2010]. Presently, the estimated
transport is ~15 Sv (1 Sv = 106 m3 s-1) and roughly 80% of that is transported via the main
pathway, the Makassar Strait [Gordon et al., 2010]. The ITF modifies the heat and freshwater
budgets and air–sea heat fluxes of the Pacific and Indian Oceans, and may play a role in ENSO
and Asian monsoon climate phenomena [Gordon et al., 2003]. The relatively cool and fresh
ITF exits the Indonesian Seas through Timor Passage, Lombok and Ombai Straits and flows
westward across the Indian Ocean near 12°S [Gordon et al., 2010].
Modern oceanographic observations show that the Java Sea water, characterized by low salinity
and high temperature water, is the dominant water mass passing through the Sunda Strait
continuously during the entire year [Putri, 2005]. Moreover, a recent modelling study suggests
that from the annual mean southward transport of 0.6 Sv through the Karimata Strait [Gordon
et al., 2012], about 0.5 Sv passes later on through the Sunda Strait [Du and Qu, 2010].
Combined with runoff from Java and Sumatra, this transport is responsible for the low-salinity
‘‘tongue’’ in the SJC with salinities as low as 32‰ (Fig. 1) [Wijffels et al., 1996], that can
extend as far as 13°S [Gingele et al., 2002; Ding et al., 2006]. The large amount of freshwater

39
in this region results in the development of a thick barrier layer, a layer that separates the base
of the mixed-layer from the thermocline. The presence of the barrier layer in the study area
impedes the intrusion of thermocline waters to the mixed-layer during the upwelling season and
reduces its effect on the SST [e.g. Du et al., 2005].
3. Materials and Method
3.1. Sediment cores GeoB 10042-1 and GeoB 10043-3
The two gravity cores GeoB 10042-1 (7°06.81’S 104° 38.58’E, 2454 m water depth, core
length: 540 cm) and GeoB 10043-3 (7°18.57’S 105°03.53’E, 2171 m water depth, core length:
390 cm) were collected from west of the Sunda Strait during the SO-184 field campaign with
the German RV SONNE in 2005 (Fig. 1) [Hebbeln et al., 2005]. Both cores, GeoB 10042-1
and GeoB 10043-3, consist of nannofossil ooze. In core GeoB 10043-3 a turbidite layer is
observed from 225–232 cm depth.
3.2. Radiocarbon dating
For radiocarbon dating the surface-dwelling planktic foraminifera species Globigerinoides
ruber sensu stricto (s.s.) and Globigerinoides sacculifer (without the sac-like final chamber)
were hand-picked under a binocular microscope from the >150 μm fraction. The abundance of
these species within the cores was generally low, and occasionally both species were combined
to obtain a sufficient amount of datable material. Samples were then measured at the Keck
Carbon Cycle Accelerator Mass Spectrometry Laboratory, University of California, Irvine
(UCI). Raw 14C ages were converted to 2σ calendar ages with the CALIB 7.0 software using
the Marine13 calibration dataset [Reimer et al., 2013] (Table 1) with a regional reservoir
correction of 100 years [Southon et al., 2013].

40
Table 1. AMS 14C and calendar ages obtained from planktic foraminifera shells in cores GeoB 10042-1 and GeoB 10043-3. References: (1) [Southon et al., 2013], (2) this study.
UCIAMS #
Depth (cm) 14C_age (yrs BP)
Error Calendar Age (yrs BP)
1σ Species Reference
GeoB 10042-1
89145 8 3895 20 3751 65 G. ruber, G. sacculifer 1
98276 13 4225 40 4201 91 G. sacculifer 1
98279 18 4440 50 4491 89 G. sacculifer 1
98281 23 4580 15 4670 124 G. sacculifer 1
98284 33 4675 45 4798 81 G. sacculifer 1
98288 38 4885 20 5078 78 G. sacculifer 1
98291 43 5015 25 5259 67 G. sacculifer 1
103693 100 6130 45 6460 76 G. ruber, G. sacculifer 2
127996 163 7740 60 8108 82 G. ruber, G. sacculifer 2
103694 200 8440 50 8917 89 G. ruber, G. sacculifer 2
130252 213 8885 45 9460 49 G. ruber, G. sacculifer 2
130253 238 11830 60 13223 74 G. ruber, G. sacculifer 2
127997 243 13065 30 14909 140 G. ruber, G. sacculifer 2
130254 263 13760 60 15949 120 G. ruber, G. sacculifer 2
103695 300 16620 90 19454 139 G. ruber, G. sacculifer 2
103696 400 24210 130 27797 113 G. ruber, G. sacculifer 2
103698 470 30750 750 34286 677 G. ruber, G. sacculifer 2
103700 500 32390 660 35834 712 G. ruber, G. sacculifer 2
GeoB
10043-3
89142 13 545 35 84 59 G. ruber, G. sacculifer 1
89143 18 640 35 177 70 G. ruber, G. sacculifer 1
98502 23 1150 25 627 37 G. sacculifer 1
98506 28 1570 35 1029 62 G. ruber 1
98508 33 2070 25 1539 65 G. sacculifer 1
98510 38 2240 15 1741 59 G. sacculifer 1
98518 43 2525 30 2076 71 G. sacculifer 1

41
98520 48 2760 30 2370 65 G. sacculifer 1
103701 150 6520 20 6914 64 G. ruber, G. sacculifer 2
103702 200 8330 70 8769 129 G. ruber, G. sacculifer 2
103703 223 9140 90 9767 158 G. ruber, G. sacculifer 2
127998 273 13265 35 15215 78 G. ruber, G. sacculifer 2
103705 300 15235 50 17937 95 G. ruber, G. sacculifer 2
127999 328 19280 45 22632 106 G. ruber, G. sacculifer 2
103706 367 29740 490 33321 106 G. ruber, G. sacculifer 2
103707 385 31140 240 34580 233 G. ruber, G. sacculifer 2
3.3. Stable Isotope and Mg/Ca Analyses
The cores GeoB 10042-1 and GeoB 10043-3 were sampled every 5 cm for the planktic
foraminifera G. ruber s.s. in order to conduct stable oxygen isotope ( 18O) and Mg/Ca analyses.
Approximately 30-40 individuals of G. ruber s.s. collected from the 250-355 μm size fraction
were firstly gently cracked using glass plates, then homogenized and split. About two-third of
the material was used for Mg/Ca analysis and the remaining one- third was used for 18O
analysis. The 18O measurements were carried out using a Finnigan MAT 251 mass
spectrometer at the MARUM, University of Bremen. Long-term standard deviation of the
carbonate standard is <0.07‰. The 18O results are reported relative to the international Pee-
Dee Belemnite (PDB) Standard.
For Mg/Ca analysis, we followed the foraminifera cleaning procedure proposed by Baker et al.
[2003]. The samples were rinsed five times with de-ionized water and two times with methanol,
with ultrasonic treatment after each rinse. In the following step, organic matter was oxidized by
adding a NaOH-buffered 1%-H2O2 reagent to the samples and placed in a hot water bath for 10
minutes with a few seconds in an ultrasonic bath. After repeating this step, the samples were
rinsed and transferred into new acid-cleaned vials. Then, the samples underwent a weak acid
leaching (0.001 M QD HNO3) with 30 seconds ultrasonic treatment after which the samples

42
were dissolved using 0.075 M QD HNO3, centrifuged for 10 minutes at 6000 rpm, and
transferred into new acid cleaned vials. Mg/Ca measurements were conducted with an Agilent
720 Inductively Coupled Plasma Optical Emission Spectrometer (ICP-OES) housed at the
Department of Geosciences, University of Bremen. The Mg/Ca ratio values are reported as
mmol mol-1. The instrumental precision during measurement was monitored by analysis of an
in-house standard solution, which was measured after every fifth sample. The average 1σ error
for the Mg/Ca analyses on an external standard measured along with the analyses for cores
GeoB 10042-1 and GeoB 10043-3 is 0.04 mmol/mol. Sample reproducibility based on replicate
samples for GeoB 10043-3 (n=15) and GeoB 10042-1 (n=15) is ±0.13 mmol/mol and ±0.31
mmol/mol, respectively.
Mg/Ca ratio values were converted to temperature (T) following the equation proposed by
Anand et al. [2003] for G. ruber (250–350μm):
Mg/Ca = 0.38 exp(0.09*T) (1)
According to sediment trap and core-top studies by Mohtadi et al. (2007; 2009; 2011b), G.
ruber s.s. records mean annual mixed-layer conditions between 0 and 30 m and the dissolution
effect on this species is negligible in the study area. This finding is supported by the presence
of aragonitic pteropods throughout our cores that further declines any significant role of calcite
dissolution in altering the primary signal preserved in the planktic foraminifera shells. Surface
sediment and culture studies have shown a significant effect of salinity on the Mg/Ca ratio of
planktic foraminifera shells [e.g. Kisakürek et al., 2008; Mathien-Blard and Bassinot, 2009;
Arbuszewski et al., 2010]. However, the effect of salinity remains a matter of debate due to the
overriding effect of dissolution [see e.g. Hertzberg and Schmidt, 2013], lack of in-situ
measurements or unrealistic laboratory conditions. Core top studies suggest that shell Mg/Ca
of planktic foraminifera is biased only in hyper-saline conditions when salinity surpasses 36

43
psu [Ferguson et al., 2008; Gibbons et al., 2014]; an out of reach threshold for the rain-laden
eastern tropical Indian Ocean.
The stable oxygen isotope composition of foraminifera calcite is a function of temperature and
the isotopic composition of the ambient seawater ( 18Osw). In order to calculate the seawater
18O ( 18Osw), we used the 18O-temperature equation of Bemis et al. [1998]:
T (°C) = 14.9 – 4.8 ( 18Occ - 18Osw) (2)
where 18Occ and T are the measured 18O of calcite and Mg/Ca-based temperature,
respectively. The values were then converted to Standard Mean Ocean Water (SMOW) and
corrected for sea-level changes as proposed by Waelbroeck et al. [2002]. The errors of the
Mg/Ca-based temperature and 18Osw reconstructions are estimated by propagating the errors
introduced by Mohtadi et al. [2014]. The resulting errors for temperature and 18Osw are on
average ~1°C and 0.3 ‰, respectively.
3.4. X-Ray Fluorescence (XRF) Core Scanning
We used the XRF Core Scanner 1 at the MARUM, University of Bremen, to perform
measurements on both cores, GeoB 10042-1 and GeoB 10043-3, in 1 cm-resolution. The
scanner uses a KEVEX Psi Peltier Cooled Silicon Detector and a KEVEX X-ray Tube
52500008-02 with the target material molybdenum (Mo). In this study we use the elemental
ratio of titanium to calcium (Ti/Ca; logarithmic scale) as a proxy to detect past changes in
terrestrial input [Mohtadi et al., 2010a; b] to our sites GeoB 10042-1 and GeoB 10043-3.
3.5. Spliced records and published data
The age-depth models for both cores were generated with a Bayesian approach using the Bacon
software [Blaauw and Christen, 2011]. This method divides a core into sections and models the

44
accumulation rate for each of these sections (Fig. 2). Afterward we generated a spliced record
for each proxy in both cores by averaging data in 500- year, non-overlapping bins and will refer
to the spliced records when discussing our results.
By comparing our record to the other published data from the eastern tropical Indian Ocean by
Levi et al. [2007] and Gibbons et al. [2014], we recalculated SST and 18Osw in those records
by applying equations (1) and (2). Thus, the resulting values differ from those in the original
publications. The binned data were then generated using the same method described above.
4. Results
4.1. Age Model
The age models for sediment cores GeoB 10042-1 and GeoB 10043-3 are based on 18 and 16
calibrated radiocarbon dates, respectively, measured on the mixed-layer dwelling planktic
foraminifera species G. ruber and/or Globigerinoides sacculifer (Table 1; Figure 2). The upper
50 cm of both cores spans the last 5.2 kyr (GeoB 10042-1) and 2.3 kyr (GeoB 10043-3), have
previously been studied by Southon et al. [2013]. In this study we provide 11 (GeoB 10042-1)
and 8 (GeoB 10043-3) new radiocarbon dates.
The resulting age-depth models suggest that cores GeoB 10042-1 and GeoB 10043-3 cover the
past 39.4 and 34.4 kyr and indicate that the average sedimentation rates of cores GeoB 10042-
1 and GeoB 10043-3 are 23.4 cm kyr-1 and 16.4 cm kyr-1. Both sediment cores have a distinct
ash layer (GeoB 10043-3: 13-18 cm; GeoB 10042-1: 6-8 cm core depth) that has been linked
to the Krakatau eruption in 1883 [Southon et al., 2013]. In addition, another ash layer is
observed in core GeoB 10043-3 at a depth between 370 and 382 cm and in core GeoB 10042-
1 at 470 cm (Fig. 3).
Both cores reveal low glacial sedimentation rates ranging between 3.4 and 19 cm kyr-1 (GeoB
10042-1) and between 3.1 and 11.9 cm kyr-1 (GeoB 10043-3) compared to the much higher

45
Holocene sedimentation rates of 14.7 to 54.3 cm kyr-1 (GeoB 10042-1) and of 9.7 to 33.7 cm
kyr-1 (GeoB 10043-3). Using the age-depth model of GeoB 10042-1, we found a hiatus
indicated by a dramatic increase in the sedimentation rate from 3.6 to 31 cm kyr-1 around 10
kyr BP associated with abrupt changes in 18O and Ti/Ca log ratio (Fig 3).
Figure 2. Age-depth model of the GeoB 10042-1 (top) and GeoB 10043-3 (bottom). The turbidite layer in GeoB 10043-3 is between 225 and 232 cm. Blue lines in both age models denote the envelope of 2σ errors. Dashed red line indicates the position of a hiatus.

46
Figure 3. (a) Sedimentation rates (shaded area), 18O (dashed line), and Ti/Ca ratio (solid line) of GeoB 10042-1. Crosses denote the positions of volcanic ash layers at 5 cm and 470 cm. The dashed red line shows the position of a hiatus. Triangles indicate AMS 14C dating points. (b) Same as top but for GeoB 10043-3. Black stars depict the locations of volcanic ash layer at 10-12 cm and 370-382 cm. The red line and shaded bar show the position of the turbidite layer.
4.2. Shell 18O and Mg/Ca ratio of G. ruber s.s.
The 18O values of G. ruber s.s. from cores GeoB 10042-1 and GeoB 10043-3 display a similar
variability over the time they overlap (Figs. 3, 4a). In the following, the last glacial and the
Holocene always refer to periods >10 kyr BP and <10 kyr BP, respectively. Average last glacial
18O values of GeoB 10042-1 and GeoB 10043-3 are -0.92‰ and -0.96‰ and average 18O
values during the Holocene are -2.34‰ (GeoB 10042-1) and -2.46‰ (GeoB 10043-3). During
the last glacial, the average values of Mg/Ca ratio for both cores are 3.58 mmol mol-1 (GeoB
10042-1) and 3.78 mmol mol-1 (GeoB 10043-3) (Figs. 3, 4b). The averages Mg/Ca ratio values
of both cores during the Holocene are 4.18 (GeoB 10042-1) and 4.22 mmol mol-1 (GeoB 10043-

47
3). Estimated Mg/Ca-based SSTs recorded in both sediment cores show a similar pattern for
the past ~40 kyr (Fig. 4b). During the last glacial, average SSTs for cores GeoB 10042-1 and
GeoB 10043-3 are 24.9°C and 25.5°C (Fig. 4c). During the Holocene, both SSTs show similar,
slightly warmer average values of 26.6°C (GeoB 10042-1) and 26.7°C (GeoB 10043-3).
Deglacial warming of 2-3°C reached maximum values during the early Holocene at around 9
kyr BP. Subsequently SSTs decreased by about 1°C between 9 and 7 kyr BP followed by a
slight increase towards the present.
4.3. Seawater 18O (δ18Osw)
During the last glacial, the average δ18Osw values of GeoB 10042-1 and GeoB 10043-3 are
almost identical within the error, i.e. 0.65‰ and 0.69‰ (Figs. 3, 4d). Likewise, similar average
δ18Osw values of 0.26‰ (GeoB 10042-1) and 0.23‰ (GeoB 10043-3) are observed for the
Holocene. In GeoB 10043-3, δ18Osw values remain stable during the course of the last
deglaciation until the Younger Dryas (12.8-11.5 kyr) when there is a marked increase, whereas
the δ18Osw record of GeoB 10042-1 reveals a ~0.5‰ increase during the early deglaciation.
4.4. XRF Measurements
In general, both sediment cores indicate similar first order variability in the Ti/Ca log ratio
during the past ~40 kyr (Figs. 3, 4e). In both sediment cores the Ti/Ca log ratios are much lower
during the last glacial compared to the Holocene. The peak of the Ti/Ca log ratio occurred
during the early Holocene. The Ti/Ca log ratios in both cores GeoB 10042-1 and GeoB 10043-
3 show a declining trend from the early to mid-Holocene (8-4 kyr BP) followed by a slight
increase afterward.

48
Figure 4. (a) G. ruber s.s δ18O, (b) G. ruber s.s Mg/Ca ratio, (c) SST calculations based on b, (d) δ18Osw calculated from a and c, and (e) Ti/Ca (logarithmic scale) of the GeoB 10042-1 (gray) and GeoB 10043-3 (black). Purple, green, red, blue, and orange curves are splice records of a, b, c, d and e. Black (grey) triangles denote AMS 14C dating points for the GeoB 10043-3 (GeoB 10042-1). Shaded bars indicate LGM, Heinrich stadials (HS) 1-4 and the Younger Dryas (YD). Green stars and the green dot denote the positions of turbidite and volcanic ash layers.

49
5. Discussion
5.1. Hydrologic conditions off the Sunda Strait prior to the Sunda Shelf flooding (10 kyr BP)
During the last glacial, SST variability off the Sunda Strait (Fig. 5a) is similar to other Mg/Ca-
based SST reconstructions from the eastern tropical Indian Ocean (Fig. 5b-c) [Mohtadi et al.,
2010a; 2014; Levi et al., 2007; Xu et al., 2008]. Furthermore, short-term variations in our SST
reconstructions are within the range of SST variability described for the upwelling region
covering the south Sumatra-Java-Lesser Sunda Island chain region (between ~23° and 29°C).
Reconstructed SSTs from the non-upwelling region off north and central Sumatra are 2-3°C
warmer, ranging from ~25° to 30°C [Mohtadi et al., 2014] (Fig. 5c). Within our age model
uncertainty (Fig. 2), the onset of deglacial SST warming in our records (~17-18 kyr BP)
coincides with warming over Antarctica [Jouzel et al., 2007] and the atmospheric CO2 rise
[Monnin et al., 2001], in line with other records of the eastern tropical Indian Ocean [Levi et
al., 2007; Xu et al., 2008; Mohtadi et al., 2010a; 2014; Gibbons et al., 2014].
In order to better reconstruct the hydroclimate conditions off the Sunda Strait we suggest Ti/Ca
values reflect terrigenous input and continental runoff, where high Ti/Ca values indicate
increased runoff [e.g. Mohtadi et al., 2010b; 2011a] (Fig. 6e). Ideally, there should be an inverse
relationship between Ti/Ca and δ18Osw if both parameters are controlled by changes in rainfall
and P-E. However, the overall increasing trend in Ti/Ca indicative of increasing terrigenous
input during the last glacial (Fig. 6e) is not paralleled by any trend in our reconstructed glacial
δ18Osw (Fig. 6a). This mismatch is not unexpected as Ti/Ca and runoff in this region include a
strong seasonal signal caused by monsoonal precipitation during the NWM from December to
March [Mohtadi et al., 2009; 2010b, 2011a]. In contrast, results from sediment surface samples
and a nearby sediment trap suggest that Mg/Ca ratio in G. ruber reflects mean annual surface
conditions [Mohtadi et al., 2009; 2011b]. Thus, our reconstructed δ18Osw is interpreted to reflect
a mixed signal of the monsoon and non-monsoon seasons. Besides the potential bias introduced

50
by the different seasonality of the two sets of data, it is likely that δ18Osw off the Sunda Strait is
additionally controlled by varying intrusion of saltier waters from below during the SEM
upwelling season. Variability in δ18Osw in this region is also influenced by the changing
direction of the South Java Current during different seasons (see section 2, study area). In
summary, while the δ18Osw records from the more enclosed, non-upwelling basins in west and
northwest of Sumatra are likely to reflect P-E in the past [Mohtadi et al., 2014], G. ruber-based
δ18Osw reconstructions off southwest Sumatra and from the monsoon-influenced region in
Indonesia, characterized by seasonal upwelling and changing surface current directions, should
be interpreted with caution as a proxy for changing rainfall or P-E.
Within the age uncertainty of our records during the last glacial, δ18Osw values increase during
the Heinrich stadials and the Younger Dryas (Fig. 6a) accompanied by a slight SST increase of
1-2°C (Fig. 5a) that has been also observed in other δ18Osw and SST records from both the non-
upwelling areas (Figs. 5c and 6c) and upwelling areas (Figs. 5b and 6b) of the eastern tropical
Indian Ocean [Levi et al., 2007; Mohtadi et al., 2010a; 2014; Gibbons et al., 2014]. This finding
suggests widespread changes in the Indonesian hydroclimate during the millennial-scale cold
periods of the Northern Hemisphere and supports previous inferences of a modified
atmospheric circulation in the topics. Model simulations suggest a weakened and easterly
displaced Hadley Circulation as a response to a weak Atlantic Meridional Overturning
Circulation [Zhang and Delworth, 2005], or a reorganization of the Hadley Circulation and a
southward displacement of the ITCZ [Gibbons et al., 2014; Mohtadi et al., 2014]. Further
support for a southward displacement of the ITCZ during Heinrich stadials is provided by the
speleothem records from the IPWP: Borneo speleothems suggest anomalous dry conditions
[Carolin et al., 2013] while speleothem records from Flores [Ayliffe et al., 2013] and northern
Australia [Denniston et al., 2013] imply anomalous wet conditions during the Heinrich stadials.
According to model simulations of the Heinrich stadials [Gibbons et al., 2014; Mohtadi et al.,
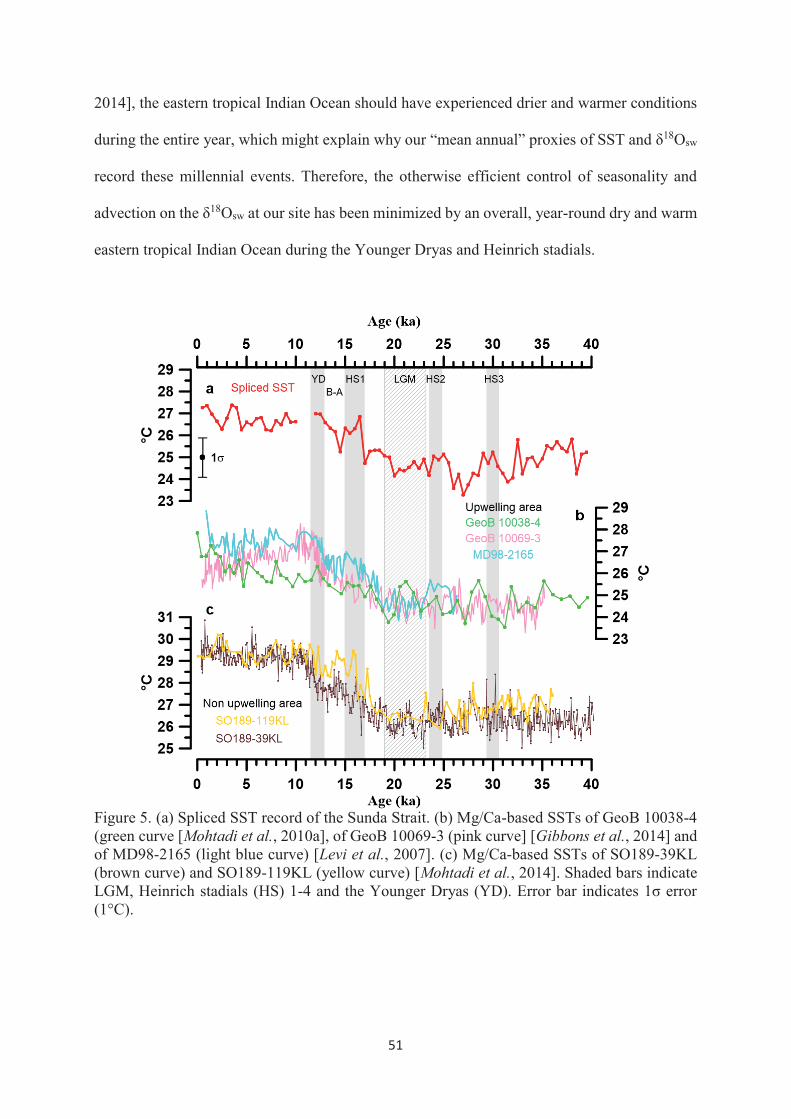
51
2014], the eastern tropical Indian Ocean should have experienced drier and warmer conditions
during the entire year, which might explain why our “mean annual” proxies of SST and δ18Osw
record these millennial events. Therefore, the otherwise efficient control of seasonality and
advection on the δ18Osw at our site has been minimized by an overall, year-round dry and warm
eastern tropical Indian Ocean during the Younger Dryas and Heinrich stadials.
Figure 5. (a) Spliced SST record of the Sunda Strait. (b) Mg/Ca-based SSTs of GeoB 10038-4 (green curve [Mohtadi et al., 2010a], of GeoB 10069-3 (pink curve] [Gibbons et al., 2014] and of MD98-2165 (light blue curve) [Levi et al., 2007]. (c) Mg/Ca-based SSTs of SO189-39KL (brown curve) and SO189-119KL (yellow curve) [Mohtadi et al., 2014]. Shaded bars indicate LGM, Heinrich stadials (HS) 1-4 and the Younger Dryas (YD). Error bar indicates 1σ error (1°C).
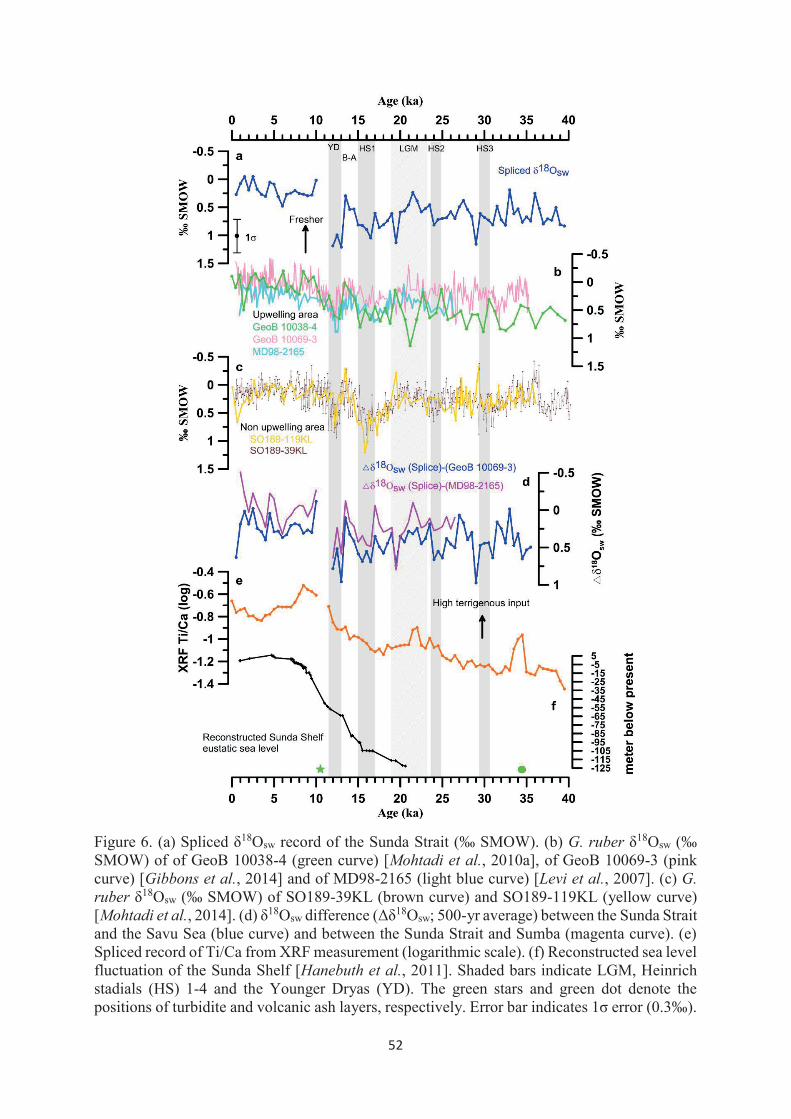
52
Figure 6. (a) Spliced δ18Osw record of the Sunda Strait (‰ SMOW). (b) G. ruber δ18Osw (‰ SMOW) of of GeoB 10038-4 (green curve) [Mohtadi et al., 2010a], of GeoB 10069-3 (pink curve) [Gibbons et al., 2014] and of MD98-2165 (light blue curve) [Levi et al., 2007]. (c) G. ruber δ18Osw (‰ SMOW) of SO189-39KL (brown curve) and SO189-119KL (yellow curve) [Mohtadi et al., 2014]. (d) δ18Osw difference (Δδ18Osw; 500-yr average) between the Sunda Strait and the Savu Sea (blue curve) and between the Sunda Strait and Sumba (magenta curve). (e) Spliced record of Ti/Ca from XRF measurement (logarithmic scale). (f) Reconstructed sea level fluctuation of the Sunda Shelf [Hanebuth et al., 2011]. Shaded bars indicate LGM, Heinrich stadials (HS) 1-4 and the Younger Dryas (YD). The green stars and green dot denote the positions of turbidite and volcanic ash layers, respectively. Error bar indicates 1σ error (0.3‰).

53
5.2. The flooding of the Sunda Shelf
According to our results, the final (or full) opening of the Sunda Strait occurred at ~10 kyr BP
(Figs. 4-6). While in other records changes on millennial timescales are much more prominent
than on glacial-interglacial scale [Mohtadi et al., 2010a; 2014; Gibbons et al., 2014;
Niedermeyer et al., 2014], our δ18Osw record together with that of the nearby core GeoB 10038-
4 [Mohtadi et al., 2010a] reveal fresher conditions since 10 kyr BP compared to the last glacial
period (Fig. 6a-c). We attribute this freshening to the inflow of the relatively fresh Java Sea
waters through the Sunda Strait at this time. Due to island topographies, almost all of the large
rivers in Indonesia drain into the Java Sea and are characterized by fresher conditions compared
to the surrounding seas and oceans. The opening of the Sunda Strait with shallow sill depths of
only 20-40 m in the east enabled the transport of the fresh Java Sea waters to our core sites.
The spliced Ti/Ca record provides more evidence of this opening during the last deglaciation
and shows a prominent change in the terrigenous material supply associated with the rapid sea
level rise on the Sunda Shelf between 11 and 9.5 kyr BP (Fig. 6f). The marked change in Ti/Ca
around 10 kyr BP is not preserved in a sedimentary archive off south Java [Mohtadi et al.,
2011a, not shown]. The increase in Ti/Ca during this period suggests an enhanced supply of
terrigenous material from the formerly exposed Sunda Shelf towards our core sites via the
Sunda Strait that corresponds to the inundation of inner Sunda Shelf region at ~10.8 kyr BP [for
details see Sathiamurthy and Boris, 2006; Hanebuth et al., 2011]. Furthermore, sedimentation
rates at both sites also indicate a marked change from ~3.5 to 31 cm kyr-1 (GeoB 10042-1) and
from ~9.8 to 22.5 cm kyr-1 (GeoB 10043-3) at this time (Fig. 3). This change is accompanied
by a turbidite layer in core GeoB 10043-3 and a hiatus in core GeoB 10042-1 indicating possible
erosive mass wasting and slope instability related to the rapid sea level rise and the opening of
the Sunda Strait. After the opening, higher sedimentation rates are sustained at site closer to the
Sunda Strait and support the inference of additional sediment supply through the Sunda Strait.

54
Finally, terrigenous proxy records show an increase in kaolinite and quartz content in the nearby
core BAR9442 during the Holocene that has also been related to the opening of the Sunda Strait
[Gingele et al., 2002].
5.3. Hydrologic conditions off the Sunda Strait after the Sunda Shelf flooding
After the opening of the Sunda Strait at ~10 kyr BP, SST varied from ~26.3° to 27.4°C. Previous
studies suggest no ubiquitous Holocene SST evolution in the eastern tropical Indian Ocean
region, where some suggest a clear cooling trend to the present [Gibbons et al., 2014], others
interpret a continuous warming trend [Mohtadi et al., 2010a; b] or no trend during the Holocene
[Levi et al., 2007; Xu et al., 2008; Mohtadi et al., 2014] similar to our new data off the Sunda
Strait (Fig. 5). The available Holocene SST data do not reveal a distinct geographical pattern
and might be additionally biased by different temporal resolutions of these records.
The Holocene δ18Osw records off the Sunda Strait characterizing the “open-Sunda-Strait-
setting” differ from other records from the eastern tropical Indian Ocean when comparing
average glacial and interglacial values. In general lower δ18Osw values during the post-
compared to the pre-opening of the Sunda Strait indicate the permanent influence of the Java
Sea waters on the hydrology at our core sites. However, the lack of correspondence between
δ18Osw and Ti/Ca during the Holocene suggests another control on these parameters. In addition
to P-E, the pattern of the Holocene Ti/Ca record is similar to the Ti/Ca record in the nearby core
GeoB 10038-4 [Mohtadi et al., 2010b] and appears to follow insolation changes with maximum
values during the early Holocene and minimum values at ~3 kyr BP. This is similar to various
monsoonal proxy-archives that are inferred to reflect the monsoon strength during a particular
season [Dykoski et al., 2005; Fleitmann et al., 2007; Mohtadi et al., 2011a]. This trend in Ti/Ca
values is not evident in the δ18Osw record (as discussed in section 5.1) and may reflect
differences in the seasonality of these two proxies and other hydrographic controls on seawater
18O.

55
5.4. The impact of the Sunda Strait opening on regional hydrography
The contrast between our proxy records off the Sunda Strait and those in other eastern tropical
Indian Ocean records on glacial-interglacial timescales suggesting an overriding control of sea-
level related changes on the hydrology off the Sunda Strait. Present-day sea surface conditions
in the eastern tropical Indian Ocean off the Sunda Strait are always fresher than the Lombok
basin off Sumba and the Savu Sea further to the east by ~1 psu (Fig. 1). To track this difference
over the past ~40 kyr, we calculated the δ18Osw difference (Δδ18Osw) between the Sunda Strait
and the Savu Sea (GeoB 10069-3; blue curve in Fig. 6d) and between the Sunda Strait and the
Sumba area (MD98-2165; magenta curve in Fig. 6d). During the Holocene, the δ18Osw values
are indistinguishable within error. During the last glacial, there is a difference between the
Sunda Strait sites and the other eastern tropical Indian Ocean sites related to the larger glacial
δ18Osw values off the Sunda Strait (Fig. 6a) compared to the glacial δ18Osw values at other sites
that remained stable (Fig. 6b-c). During the last glacial, δ18Osw values in the Savu Sea are fresher
than elsewhere, possibly due to the position of the Savu Sea record sits near the major exit
passage of the relatively fresh ITF (Fig. 6b). This is also shown in the Δδ18Osw contrast between
the Sunda Strait and Savu Sea that has been larger than the average difference between the
Sunda Strait and the Lombok Basin off Sumba over the past 40 kyr (Fig. 6d).
Model simulations of the LGM climate suggest that the exposure of the Sunda Shelf resulted in
cooling over the Maritime Continent that weakened the Walker Circulation over the Indian
Ocean and led to a stronger upwelling in the eastern tropical Indian Ocean [DiNezio et al., 2011;
DiNezio and Tierney, 2013]. However, available proxy records of past upwelling and
productivity in the eastern tropical Indian Ocean do not support strong upwelling in our study
area during the last glacial [De Deckker and Gingele, 2002; Lückge et al., 2009; Mohtadi et al.,
2010b]. Whether the higher glacial δ18Osw values off the Sunda Strait reflect stronger upwelling
of deeper and saltier waters in this region or a stronger influence of the saltier surface Indian

56
Ocean is not known, and will require additional reconstructions of water mass distributions and
upwelling histories for the eastern tropical Indian Ocean. It is important to note that differences
between δ18Osw values at different locations are greatest during Heinrich stadials and the
Younger Dryas even though the pattern of change in individual records is generally similar
(Fig. 6d, increasing δ18Osw). This suggests a stronger zonal gradient in the hydrological cycle
of the eastern tropical Indian Ocean during these times that might reflect changes in the
atmospheric circulation (Walker and Hadley circulation and the position of the ITCZ, see above
and [DiNezio and Tierney, 2013; Gibbons et al., 2014; Mohtadi et al., 2014]). Overall, it is not
clear to what degree different mechanisms were responsible for the similarities between proxy
records from various eastern tropical Indian Ocean sites during the Holocene. Nevertheless, our
data indicate that the opening of the Sunda Strait at ~10 kyr BP was a major control on these
records, as the fresher Java Sea waters and the resulting fresh water cap introduced into the
eastern tropical Indian Ocean reduced local upwelling intensity during the Holocene.
Paleoproductivity reconstructions based on diatoms [Romero et al., 2012] and organic carbon
[Lückge et al., 2009] in two cores off the Sunda Strait suggest that marine productivity during
the Holocene was higher compared to the last glacial. Apparently this higher marine
productivity is due to an additional input of (terrigenous) nutrients through the Sunda Strait
[Gingele et al., 2002; Mohtadi et al., 2010b; Romero et al., 2012].
Another notable change after the opening of the Strait is a decrease in thermocline temperatures
recorded in a nearby core off the Sunda Strait [Mohtadi et al., 2010b]. It is possible that the
opening of the Sunda Strait and the subsequent addition of freshwater to this area facilitated the
development of the barrier layer (see section 2 for details) and a diverging evolution of the
thermocline and surface temperatures during the Holocene. The degree to which this freshwater
forcing might have been responsible for the observed changes in the upper water column has to
be explored by a (transient) model-data assessment in future studies.

57
6. Conclusion
We have reconstructed sea surface conditions of the eastern tropical Indian Ocean off the Sunda
Strait for the past 40,000 years. Our results show a major change in hydrology off the Sunda
Strait with fresher conditions during the Holocene compared to the last glacial period. The
surface ocean was cooler and saltier than elsewhere in the eastern tropical Indian Ocean prior
to the opening of the Sunda Strait with average SST of 25°C and seawater δ18O of ~0.7‰. The
opening of the Sunda Strait at ~10 kyr BP altered surface hydrology with the inflow of low
salinity Java Sea water into the eastern tropical Indian Ocean changing average seawater δ18O
and SST by ~-0.5‰ and 1.7°C. Our results suggest that the opening of the Sunda Strait and the
increase in terrigenous supply may have been responsible for higher marine productivity in the
eastern tropical Indian Ocean during the Holocene.
Acknowledgments
We are grateful to M. Segl, B. Meyer-Schack, and S. Pape for technical assistance. R.Y.
Setiawan acknowledges financial support from the Deutscher Akademischer Austauschdienst
(DAAD grant A/10/7596). This study was supported by the German Ministry of Education and
Research (project PABESIA) and the Deutsche Forschungsgemeinschaft (DFG grant
HE3412/15-1). The data of this study are archived and can be retrieved at PANGAEA
(www.pangaea.de).

58
5. Modification of the deep water neodymium isotope composition along the eastern
margin of the tropical Indian Ocean (In preparation)
Riza Yuliratno Setiawan1*; Ed C. Hathorne2; Katharina Pahnke3; Mahyar Mohtadi1; Dierk Hebbeln1 1MARUM – Center for Marine Environmental Sciences, University of Bremen, Bremen, Germany 2GEOMAR Helmholtz Centre for Ocean Research Kiel, Kiel, Germany 3Max Planck Research Group for Marine Isotope Geochemistry, Institute for Chemistry and Biology of the Marine Environment (ICBM), University of Oldenburg, Oldenburg, Germany
*E-mail: [email protected]
Abstract
The eastern tropical Indian Ocean (ETIO) is an important region for the global thermohaline
circulation as it hosts the exit passages of the Indonesian Throughflow (ITF). With respect to
global sea level rise during the last deglaciation, the Sunda shelf flooding and the opening of
the Sunda Strait at ~10 kyr have been suggested to impact the ITF flow and sea surface
conditions of the eastern tropical Indian Ocean (ETIO), respectively. Nonetheless, the impact
of opening the Sunda Strait on deep waters is still unknown until today. Here we study two
sediment cores GeoB 10042-1 (2454 m water depth) and GeoB 10043-3 (2171 m water depth)
collected from the ETIO off the Sunda Strait. We analyzed the neodymium isotope ratio
(143Nd/144Nd, expressed as εNd) of authigenic coatings of mixed planktic foraminifera and of
detrital silicates. Our new data show prominent modifications on the bottom water (foraminifera
εNd) off the Sunda Strait during the last deglaciation and the Holocene coincided with a strong-
and a weak thermocline ITF flow, respectively. In addition, large terrigenous material input
driven by the opening of the Sunda Strait might partly modify our Holocene foraminifera εNd.
Moreover, our new detrital εNd data indicate to be more sensitive to the deep ITF flow and to
the opening of the Sunda Strait.

59
1. Introduction
The Indonesian throughflow (ITF) plays a significant role in the global thermohaline circulation
by transporting water mass and heat from the Pacific to the Indian Oceans (Gordon 2005). As
a consequence, this transport has been suggested to impact the state of the Pacific and Indian
Oceans (Sprintall et al., 2014; Sprintall and Revelard, 2014) and global climate system (Qu et
al., 2005). Today, the ITF transports cool and fresh upper thermocline North Pacific waters to
the Indian Ocean via multiple passages of the Indonesian Seas (Gordon et al., 2003) and is
influenced by freshwater flow from the Java Sea. However, the conditions were different during
the Last Glacial Maximum (LGM). Without any influence from the low salinity Java Sea water,
the ITF transport was dominated by warm, saltier surface flow (Xu et al., 2008).
The Sunda Shelf flooding at ~9.5 kyr has been suggested to alter the hydrographic conditions
of the seas around Indonesia (Linsley et al., 2010; DiNezio and Tierney, 2013). This shelf
flooding reconnected the South China Sea and the Makassar Strait and allows the transport of
low salinity Java Sea into the eastern tropical Indian Ocean (ETIO) through the opening of the
Sunda Strait. The opening of the Sunda Strait is of particular interest because it has been
suggested to impact past and modern oceanography in the ETIO off the Sunda Strait (Putri,
2005; Setiawan et al., 2015). However, the impact of the opening of the Sunda Strait on bottom
water is unknown until today.
The radiogenic neodymium isotope composition (εNd) is an important water mass tracer as it
can be used to reconstruct past changes of deep ocean circulation, such as in the Indian Ocean
(e.g. Jeandel et al., 1998; Frank et al., 2006; Martin and Scher, 2006; Piotrowski et al., 2009;
Wilson et al., 2012). Neodymium isotopes have a shorter residence time (~500 years) than the
global ocean mixing time (e.g. Tachikawa et al., 1999; 2003) and are insensitive to biological
fractionation (Jeandel et al., 1995; Frank, 2002). This short residence time makes the isotopic
composition of Nd a suitable quasi-conservative water mass tracer. A water mass acquires its
60
Nd isotopic composition from the surrounding continents through weathering processes and the
dissolved εNd in the ocean is a function of water mass flow path (Frank, 2002).
Previous studies have shown that the spatial variability of the εNd in the surface waters of the
ETIO off Indonesia ranges from -9.9 to -1.5 εNd units (Amakawa et al., 2000), whereas the
distribution of εNd in water column ranges from -7.3 to -2.2 εNd units (Jeandel et al., 1998).
Furthermore, both studies have indicated that the high seawater εNd values in the ETIO waters
reflect the strong influence of the Indonesian volcanic islands on the seawater εNd. A study by
Ehlert et al. (2011) reveals that radiogenic εNd values dominated the Java-Nusa Tenggara Lesser
Sunda Islands and suggests that the ITF plays an important role for the distribution of high
radiogenic εNd in the ETIO. Recently, Stumpf et al. (2015) suggest that the detrital εNd of eastern
Indian Ocean is sensitive to changes in ITF intensity and documented an intensification of the
ITF during the early MIS3 until 47.4 kyr. Nevertheless, high-resolution records of bottom water
εNd in the ETIO during the last deglaciation are still lacking. Here, for the first time, we present
a reconstruction of bottom water Nd isotope compositions obtained from the authigenic
coatings of planktonic foraminifera and of detrital silicates in the ETIO covering the past 19
kyr. We provide evidence that the opening of the Sunda Strait and the ITF exerted pronounced
modifications on the bottom water εNd in the ETIO off the Sunda Strait. Our results reveal that
the detrital silicates are sensitive to ocean current in the region.
2. Study Area
Today the eastern tropical Indian Ocean (ETIO) off southern Indonesia is strongly influenced
by the Australian-Indonesian Monsoon (AIM) system. The dynamics of the seasonally
reversing AIM winds have prominent impacts on the oceanic circulation over the study area.
During the northwest monsoon (NWM) season (December–February), the winds blow from the
Eurasian continent, over the South China Sea and the Bay of Bengal and carry warm and moist
air to Indonesia (Gordon, 2005; Qu et al., 2005). Along the coasts of Sumatra and Java, the

61
eastward flowing South Java Current (SJC) carries low-salinity, warm water from the eastern
equatorial Indian Ocean off Sumatra into the southeast Indian Ocean for 8 months of the year
(Du et al., 2005; Sprintall et al., 2009; 2010). During the southeast monsoon (SEM) season
(June–September) the direction of the SJC is reversed, carrying higher salinity southeast Indian
Ocean water westward (Sprintall et al., 2010) (Fig. 1). During this time of the year southeasterly
winds blow from Australia and carry warm and dry air to Indonesia (Gordon, 2005; Qu et al.,
2005) and wind-induced upwelling centered south of Java occurs (Susanto et al., 2001).
The Indonesian throughflow (ITF) transports Pacific Ocean water into the Indian Ocean via
multiple passages within the Indonesian Seas (Gordon et al., 2010; Vranes and Gordon, 2005),
forming the return pathway in the global thermohaline circulation (e.g. Sprintall et al., 2014).
The main pathways of the ITF in the west are the Sulawesi Sea and Makassar Strait, whereas
in the east the ITF passes through the Maluku and Halmahera Seas (e.g. Gordon et al., 2010).
The ITF flows westward as part of the South Equatorial Current (SEC) entering the Agulhas
current system and eventually the Atlantic Ocean (Talley and Sprintall, 2005).
The ITF water masses are the Indonesian Throughflow Water (ITW) in the upper layer (0-500
m) and of the Indonesian Intermediate Water (IIW) at a deeper layer (~600-1500 m) (Talley
and Sprintall, 2005). Both the ITW and IIW are characterized by low salinity and high silica
that can be traced along the SEC. In the Indian Ocean the IIW is defined in a latitude band
between 8°S and 18°S, with a core at 14°S. Furthermore, the IIW is formed as a result of
diapycnal mixing between water masses from the North Pacific and South Pacific that occurred
in the Banda Sea (Talley and Sprintall, 2005). Below 1500 m to the bottom, the water column
off the eastern Indian Ocean is comprised of the upper Indian Deep Water (IDW) (Talley and
Sprintall, 2005; Atmadipoera et al., 2009). This water mass is characterized by high salinity
(>34.6) and cold temperature (<4°C) (Atmadipoera et al., 2009). In the Indian Ocean, the IDW

62
ranges from 500–3800 m in the southern portion of the Indian Ocean to 2000–3800 m in the
north, with a core at ~2400 m (Martin and Scher, 2006).
Fig. 1. Grey and black dots denote the location of GeoB 10042-1 and GeoB 10043-3, respectively. Black stars indicate the stations of seawater εNd measurements (Jeandel et al., 1998). Circles and numbers show the positions of surface sediment samples and the values of clay-sized detrital εNd of corresponding surface samples (Ehlert et al., 2011). Black box denotes the location of sediment core FR10/95-GC5 (Ehlert et al., 2011). Solid line indicates the pathway of the ITF. Dashed lines show the direction of South Java Current (Sprintall et al., 2010) and South Equatorial Current (SEC).
3. Materials and Methods
3.1. Sediment cores GeoB 10042-1 and GeoB 10043-3
The two gravity cores GeoB 10042-1 (7°06.81’S 104° 38.58’E, 2454 m water depth, core
length: 540 cm) and GeoB 10043-3 (7°18.57’S 105°03.53’E, 2171 m water depth, core length:
390 cm) were collected from west of the Sunda Strait during the SO-184 field campaign with
the German RV SONNE in 2005 (Fig. 1; Hebbeln et al., 2005). Both cores consist of

63
nannofossil ooze. A small turbidite layer is observed in GeoB 10043-3 at a depth of 225–232
cm.
3.2. Age Model
The age model for both cores is based on radiocarbon dating of the surface-dwelling planktic
foraminifera species Globigerinoides ruber sensu stricto (s.s.) and Globigerinoides sacculifer
(without the sac-like final chamber) from the >150 μm fraction. Details on the datings are
published in Setiawan et al. (2015).
3.3. Neodymium and strontium isotope analyses
3.3.1. Neodymium extraction from mixed planktonic foraminifera
In order to reconstruct the bottom water Nd isotopic composition (εNd), approximately 20 to 75
mg of mixed planktic foraminifera tests >250 μm were hand picked. Tests were then gently
cracked using two glass plates and any visible contaminant grains removed. Samples were then
treated with ultrasonication repeatedly in de-ionized water and once with methanol to remove
clays and silicate particles. After that, organic matter was removed by oxidation using a hot
H2O2–NaOH solution. A reductive solution of hydrazine was applied to remove
ferromanganese oxide. The samples were then dissolved in dilute nitric acid (<0.5M HNO3). A
few larger samples were split into 2 aliquots and one was reductively cleaned following Vance
et al. (2004) adapted from Boyle (1981). The dissolved samples were then centrifuged and the
supernatant was immediately siphoned off to prevent the leaching of remaining phases. Then,
the supernatant was dried and re-dissolved in 1 ml 2% nitric acid, a small aliquot taken for
elemental analysis and the remainder purified for Nd isotope analysis.
3.3.2. Neodymium and Strontium extraction from detrital fraction
We also analyze detrital εNd to investigate the sediment provenance of cores GeoB 10042-1 and
10043-3. Briefly, in order to remove carbonate, the freeze-dried and homogenized sediment
64
samples were leached using 25% (v/v) acetic acid and 0.02 M hydroxylamine hydrochloride
(HH). The leached sediment was then digested in closed PTFE vessels. The samples and the
certified standard BCR-2 (50 mg) as well as a blank were treated with 1 mL HNO3 over night
to oxidize any organic matter. After that 2 mL HF and 2 mL HClO4 were added and the vessels
were closed and heated in an oven for 12 h at 180°C. All acids were of suprapure quality. After
digestion acids were evaporated on a heated metal block (180°C), residues were redissolved
and fumed off three times with 3 mL half-concentrated HCl, and finally taken up in 1N HNO3.
3.3.3. Column chromatography and isotope measurement
We applied a two-step ion chromatography to separate Nd and Sr from other elements using
AG50W-X12 resin. Then, Nd and Sr were purified using Eichorm Ln Spec resin and Sr Spec
resin, respectively. Nd isotope measurements were performed using a Nu plasma MC-ICPMS
at GEOMAR and a Neptune Plus MC-ICPMS at the Institute for Chemistry and Biology of the
Marine Environment (ICBM), University of Oldenburg, Germany. Sr isotopes were measured
at ICBM. For instrumental mass bias, the measured 143Nd/144Nd ratios were corrected to a
146Nd/144Nd ratio of 0.7219 and normalized to the accepted 143Nd/144Nd of 0.512115 for the
JNdi-1 standard (Tanaka et al., 2000). Measured 87Sr/86Sr ratios were mass bias corrected with
86Sr/88Sr of 0.1194 and were normalized to the widely accepted value of 0.710245 (NIST
NBS987). The external reproducibility (2σ) of the 143Nd/144Nd at GEOMAR was between 0.3
and 0.6 εNd units, while at ICBM was between 0.2 and 0.3 εNd units. The 2σ of 87Sr/86Sr
measurement at ICBM ranged between 0.00001 and 0.00002 (Table 2).
4. Results
4.1. Neodymium Isotope Composition of Mixed Planktic Foraminifera
The mixed planktic foraminifera εNd has been shown in numerous settings to reliably record the
isotopic composition of bottom waters (Roberts et al., 2012; Piowtroski et al.,2012; Kraft et al.,
65
2013; Molina-Kescher et al., 2014). The foraminifera εNd of core GeoB 10043-3 shows a
distinct change from the glacial to the Holocene (Fig. 2 and Table 1). During the last glacial,
the foraminifera εNd along the Sumatra-Java continental margin exhibits more radiogenic εNd
values (-3.0<εNd< -2.0) compared to the mid-late Holocene (past 5 kyr B.P.; εNd < -3.0).
Interestingly, the foraminifera εNd values were rather stable at around -3.8 through the past ~2.4
kyr.
4.2. Neodymium and Strontium Isotope Composition of the Detrital Silicates
In general, the Nd isotopic compositions (εNd) of detrital silicate of cores GeoB 10042-1 and
GeoB 10043-3 demonstrate similar trend compared to detrital 87Sr/86Sr (Fig. 2). The detrital εNd
values in both cores are more radiogenic during the last glacial, with average εNd of -3.2 and -
4.3 respectively for GeoB 10042-1 and GeoB 10043-3. While during the Holocene, the average
detrital εNd are -5.3 (GeoB 10042-1) and -6.6 (GeoB 10043-3). The late Holocene period in both
cores is marked by the least radiogenic εNd values.
During the past 22 kyr the variability of detrital 87Sr/86Sr of both cores ranges from more
radiogenic values (0.715) during the Holocene to less radiogenic (0.707) during the last glacial
(Fig. 2c). However, there is a disagreement in the late Holocene value where detrital 87Sr/86Sr
of GeoB 10043-3 indicates unradiogenic value of 0.707.

66
Table 1. Measurement results of foraminifera εNd.
Depth (cm)
Age (kyr)
Foraminifera εNd (Non Red; Kiel) 2σ Foraminifera εNd
(Red; Oldenburg) 2σ Foraminifera εNd (Non Red; Oldenburg) 2σ
18 0,21 -3,8 0,2 23 0,62 -3,9 0,2 -3,2 0,3 28 1,02 -3,8 0,2 38 1,75 -3,8 0,2 43 2,07 -3,8 0,2 48 2,36 -3,8 0,2 53 2,57 -3,4 0,2 58 2,79 -3,6 0,2 63 3,00 -3,8 0,2 68 3,23 -3,7 0,2 73 3,47 -4,3 0,2 78 3,69 -3,4 0,2 83 3,92 -3,0 0,2 88 4,15 -3,9 0,2 93 4,37 -3,1 0,2 98 4,60 -3,4 0,2
103 4,84 -3,6 0,2 108 5,06 -3,1 0,2 113 5,28 -3,5 0,2 118 5,51 -3,3 0,2 123 5,73 -2,9 0,2 128 5,96 -3,4 0,2 133 6,20 -3,0 0,2 138 6,42 -3,1 0,2 148 6,86 -2,7 0,2 153 7,06 -3,2 0,2 158 7,22 -2,9 0,2 168 7,60 -3,0 0,2 173 7,79 -2,3 0,0 183 8,19 -2,5 0,2 188 8,39 -2,8 0,2 193 8,57 -2,4 0,2 198 8,76 -2,6 0,2 208 9,15 -2,9 0,2 238 11,61 -2,4 0,2 243 12,12 -2,3 0,2 253 13,14 -2,2 0,2 258 13,66 -2,5 0,2 263 14,17 -2,4 0,7 268 14,68 -2,2 0,2 -2,2 0,2 273 15,19 -2,4 0,2 -1,9 0,3 -2,1 0,1 283 16,14 -2,5 0,2 -2,0 0,1 288 16,69 -2,7 0,2 303 18,28 -3,0 0,2 308 19,00 -2,9 0,2

67
Table 2. Measurement results of detrital εNd and detrital 87Sr/86Sr
Core Depth (cm) Age (kyr) Detrital εNd 2σ Detrital 87Sr/86Sr 2σ
GeoB 10042-1 23 4,64 -7,1 0,3 0,715870247 1,6665E-05 208 9,19 -5,9 0,2 0,713071058 1,0973E-05 228 9,84 -4,7 0,3 0,711154846 1,6665E-05 233 10,00 -3,5 0,3 0,709561295 1,6665E-05 238 13,24 -2,8 0,3 0,708241799 1,6665E-05 243 14,70 -1,9 0,2 0,707054116 1,6665E-05 258 15,68 -0,9 0,2 0,707455004 1,6665E-05 268 16,37 -4,5 0,3 0,709658037 1,6665E-05 313 20,47 -4,5 0,3 0,709920532 1,6665E-05 328 21,74 -4,4 0,2 0,709238038 1,6665E-05
GeoB 10043-3 78 3,69 -6,6 0,3 0,707648598 1,6665E-05 243 12,12 -4,6 0,3 0,710482993 1,6665E-05 248 12,63 -4,1 0,2 0,710590855 1,6665E-05 258 13,66 -4,8 0,3 0,711115735 1,6665E-05 263 14,17 -5,3 0,3 0,712181092 1,0973E-05 278 15,63 -3,1 0,3 0,70795216 1,0973E-05 288 16,69 -4,7 0,2 0,709801962 1,0973E-05 318 20,80 -3,2 0,3 0,70776255 1,6665E-05
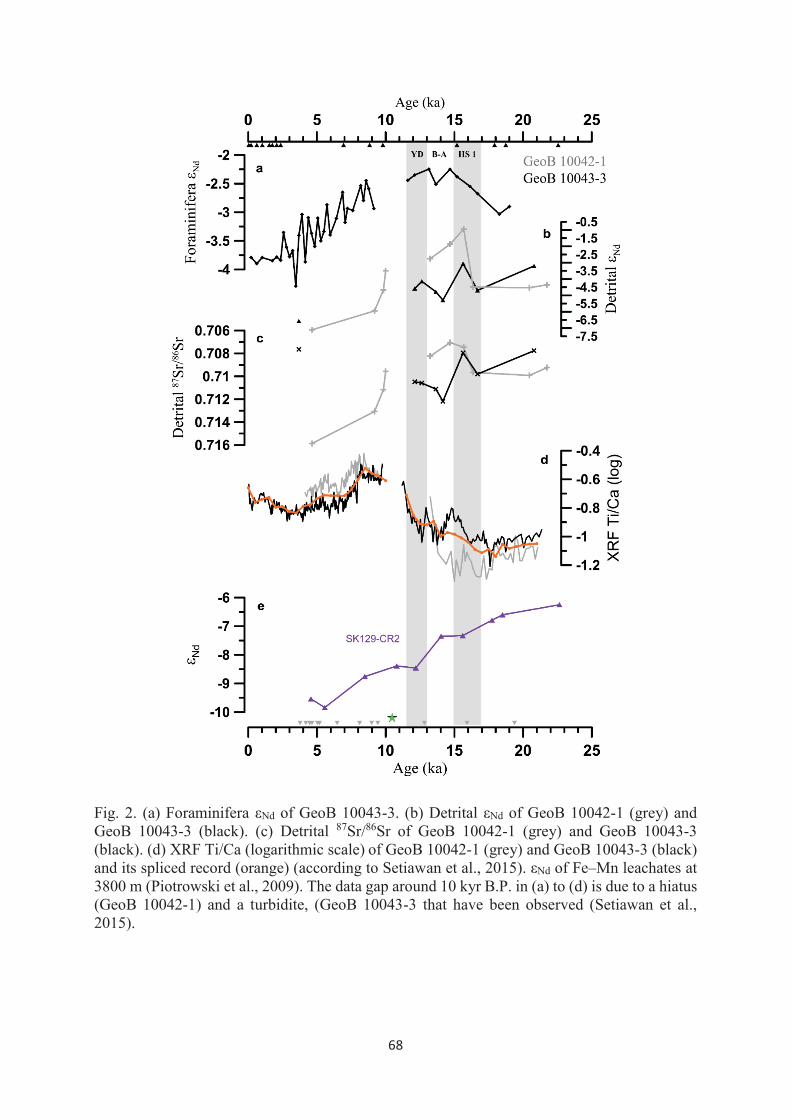
68
Fig. 2. (a) Foraminifera εNd of GeoB 10043-3. (b) Detrital εNd of GeoB 10042-1 (grey) and GeoB 10043-3 (black). (c) Detrital 87Sr/86Sr of GeoB 10042-1 (grey) and GeoB 10043-3 (black). (d) XRF Ti/Ca (logarithmic scale) of GeoB 10042-1 (grey) and GeoB 10043-3 (black) and its spliced record (orange) (according to Setiawan et al., 2015). εNd of Fe–Mn leachates at 3800 m (Piotrowski et al., 2009). The data gap around 10 kyr B.P. in (a) to (d) is due to a hiatus (GeoB 10042-1) and a turbidite, (GeoB 10043-3 that have been observed (Setiawan et al., 2015).

69
Fig. 3. Detrital εNd versus 87Sr/86Sr of cores GeoB 10042-1 (dots) and GeoB 10043-3 (crosses) and of surface sediment samples collected along north and central Sumatra, south Sumatra and Java, and in the Timor Sea (Ehlert et al., 2011).
5. Discussion
5.1. Modification of the foraminifera εNd off the Sunda Strait
Our foraminifera εNd data from the ETIO off the Sunda Strait exhibit significant variability
during the past 19 kyr (Fig. 2a). In contrast, during the past ~2.4 kyr foraminifera εNd values
show less variable with an average εNd value of -3.8. This present day εNd value is within the
range for the measured seawater εNd values at a depth between 450 m and 1500 m nearby our
core location (St. 20 in Fig. 1; Table 3) and is within the range for the modern Indonesian
Intermediate Water (IIW; -3.8<εNd<-5.2) (Jeandel et al., 1998). Below 2000 m to the bottom
the seawater εNd values range between εNd = -6.0 and εNd = -7.3. As the studied area is an active

70
upwelling region, we hypothesize that the deep waters (upper IDW) at our core site (2171 m)
acquired the radiogenic isotope signatures from the surface and intermediate waters through
vertical transport of particles. We further hypothesize that sinking particles not only adsorbed
the dissolved Nd isotope composition of the intermediate water and but also released the Nd.
In the end it will influence the Nd isotope composition of deep waters. It is unlikely that the
source for the radiogenic seawater εNd at depth of 2171 m is from a Nd release from seafloor
sediments or pore waters (e.g. Elderfield and Sholkovitz, 1987) as the seawater εNd values below
our core (depths > 2400 m) show less radiogenic values ranging from -7.1 to -6.0 (St. 20 in Fig.
1; Table 3). In addition, the increase of Nd concentration with depth at St. 20 (Fig. 1; Table 3)
suggests that . Furthermore, less variable in the foraminifera εNd values during the past ~2.4 kyr
suggests no alteration of the bottom waters at our core site.
During the period between ~18 and ~15 kyr foraminifera εNd data show an uninterrupted
increase trend from εNd = -3.0 to εNd = -2.2. The high radiogenic εNd values are observed during
this period compared to modern εNd value. The average εNd during this period is -2.5, and is
offset 1.3 εNd unit from the modern εNd value of the upper IDW (εNd = -3.8). Interestingly, these
last glacial values are in good accordance with the water column εNd data from the Sumba Strait
(St. 49 in Fig. 1; Jeandel et al., 1998). In accordance with this observation, the flow of cool,
fresh thermocline ITF has been suggested to intensify during the last deglaciation (see Holbourn
et al., 2011 for details). Therefore it is plausible that the radiogenic seawater εNd of the Sumba
Strait may have been transported by a smooth increase of the ITF flow reaching our core and
our foraminifera recorded this εNd signature. As a result, during the last glacial the εNd of bottom
water at our core site resembles the intermediate depth of seawater εNd of the Sumba Strait. In
addition, enhanced intensity in the thermocline ITF flow closely relates to enhanced NW
monsoon in Indonesia (Gordon et al., 2003). The presence of fresher Java Sea water at the
southern Makassar Strait during the NW monsoon prohibited the transport of warm, saltier

71
surface ITF flow. As a consequence, sea surface of the ETIO off southern Indonesia is cool and
fresh (Song and Gordon, 2004).
Table 3. Seawater εNd of the eastern Indian Ocean (Jeandel et al., 1998).
During the period between ~7.7 and ~2.6 kyr, the εNd value of upper IDW at our core site is
modified. As shown in Fig. 2a, our foraminera εNd values demonstrate a gradual change from
εNd = -2.3 (7.7 kyr) to εNd = -3.4 (2.6 kyr). The average εNd during this period is -3.3, 0.5 εNd
unit offset from the present-day value of the upper IDW (εNd = -3.8). We postulate that the
general trend of the decreased foraminera εNd values may reflect the reduced contribution of the
intermediate waters of the Sumba Strait at our core site. The foraminera εNd values also exhibit
high variability during this period. We hypothesize that this variability might be a result of an
Station Latitude (°N) Longitude (°E) water depth (m) εNd 2σ
10 -16,3 117,366667 104 -5,3 0,2
-16,3 117,366667 180 -5,2 0,4
-16,3 117,366667 402 -4,8 0,3
-16,3 117,366667 700 -4,8 0,2
-16,3 117,366667 999 -5,3 0,6
-16,3 117,366667 1999 -5 0,2
-16,3 117,366667 3003 -6,1 0,2
20 -11,5 115,95 59 -4,5 0,5
-11,5 115,95 99 -3,4 0,5
-11,5 115,95 200 -2,9 0,4
-11,5 115,95 452 -3,7 0,4
-11,5 115,95 701 -3,6 0,3
-11,5 115,95 1099 -3,6 0,3
-11,5 115,95 1501 -3,8 0,3
-11,5 115,95 2499 -6 0,3
-11,5 115,95 3000 -6,1 0,2
-11,5 115,95 5000 -7,3 0,2
-11,5 115,95 5353 -7,1 0,2
49 -9 123 500 -2,8 0,2
-9 123 546 -2,8 0,3
-9 123 600 -2,2 0,2
-9 123 791 -2,5 0,2

72
additional terrigenous input from the Sunda Shelf. According to our previous study (Setiawan
et al., 2015), the final (or full) opening of the Sunda Strait occurred at ~10 kyr. The Ti/Ca record
provides evidence of this opening during the last deglaciation that clearly shows a prominent
change in the terrigenous material supply associated with the rapid sea level rise on the Sunda
Shelf between 11 and 9.5 kyr (Fig. 2d). The sharp increase in Ti/Ca during this period suggests
a massive supply of terrigenous material from the formerly exposed Sunda Shelf towards our
core sites via the Sunda Strait that corresponds to the inundation of inner Sunda Shelf region at
~10.8 kyr BP, resulted a turbidite layer in core GeoB 10043-3 and a hiatus in core GeoB 10042-
1. When the terrigenous material sinks to the bottom, it released Nd and changed the Nd isotopic
composition of the deep water off the Sunda Strait.
In order to investigate the influence other water masses of the Indian Ocean, we compare our
foraminifera εNd to Nd isotopes of Fe–Mn leachates from the equatorial Indian Ocean (3800 m)
(Piotrowski et al., 2009). Piotrowski et al. (2009) provides insight into glacial-interglacial
evolution of the bottom water εNd of the equatorial Indian Ocean, although the evidence is
lacking during the late Holocene (Fig. 2e). In brief, Piotrowski et al. (2009) suggest that more
Atlantic waters reaching the Indian Ocean during the Holocene than the last glacial. This
suggestion is based on the observation that shows the identical εNd values in magnitude and
direction between the deep central Indian Ocean (SK129-CR2) and the South Atlantic deep
Cape Basin (RC11-83/TNO57-21) during glacial-interglacial timescales, with εNd variability
between -6 (Glacial) and -9.5 (Holocene). They hypothesized that this similarity is an indication
of the North Atlantic Deep Water (NADW) propagation into the Indian Ocean via the Southern
Ocean, more specifically more (less) NADW waters reaching the Indian Ocean during the
Holocene (the last glacial). However, a pronounced lack of correspondence between our εNd
record and the equatorial Indian Ocean εNd record during the past 19 kyr suggests that our εNd
record represents regional hydrography without any significant influence from deep-water

73
circulation of the Indian Ocean. Indeed, our new results suggest that εNd of authigenic coatings
of planktic foraminifera at 2171 m is sensitive to the ITF thermocline flow.
5.2. Variability of the detrital εNd off the Sunda Strait
In order to investigate changes in the sediment provenance, we compare our detrital εNd and
87Sr/86Sr data to the previously published εNd and 87Sr/86Sr data from the region. As shown in
Fig. 3, the distribution of our detrital εNd and 87Sr/86Sr values is within the range as the detrital
clay-size fractions of core top sediments off southern Sumatra and Java (Ehlert et al., 2011),
except for the late Holocene. Our detrital εNd and 87Sr/86Sr values vary between -4.9 and -0.8
and between 0.707 and 0.715, respectively. Within the ETIO there is a distinct isotopic
signature between southern Sumatra/Java (gray triangles) and northern and central Sumatra
(purple diamonds and black dots), Timor Sea (brown stars), and northeast Australia (pink
triangles). Based on the clay-sized detrital εNd and 87Sr/86Sr, Ehlert et al. (2011) suggest there is
only one sedimentary province for the radiogenic εNd values and less radiogenic 87Sr/86Sr in the
Indonesian Archipelago. In the southern Indonesia, this province covers the south Sumatra-
Java-Lesser Sunda Island chain region, whereas in the northern site it covers the Java Sea,
Makassar Strait, and Banda Sea. From this observation and considering that our study area is
strongly influenced by the Australian-Indonesian Monsoon system, we suggest that the source
for the radiogenic detrital εNd in our cores is possibly either from the sediments of the Sunda
Arc volcanics continental margin off south Sumatra and Java or from the Java Island. This
region as well as the Indonesian islands mainly consist of Tertiary to Quaternary volcanic rocks
(Vroon et al., 1995) and has been recognized as a source for the radiogenic εNd value (Jeandel
et al., 1998; Lacan and Jeandel, 2005; Frank et al., 2006).
Ehlert et al. (2011) show that off south Java is characterized by more radiogenic clay-sized
detrital εNd values ranging from -0.8 to 0.7 (Fig. 1). Whereas off Sumatra is characterized by
less radiogenic clay-sized detrital εNd values ranging from -13.1 to -2.5. Nearby the Sunda Strait,

74
the values of the clay-sized detrital εNd are -4.0 and -4.4. These values are in good agreement
with the average value of the detrital εNd of cores GeoB 10042-1 and GeoB 10043-3 during the
LGM (εNd= -4.0), suggesting the same sediment provenance possibly from the continental
margin off south Sumatra and Java. During the HS 1 our detrital εNd values altered. A significant
change in the detrital εNd value (from -4.5 to -0.9) is observed in core GeoB 10042-1. We
postulate that this radiogenic detrital sediment (detrital εNd = -0.9) probably originated from
south Java and transported to our core by deep currents, possibly by a strong ITF flow at deeper
depths. The deepest exit portal of the ITF in the eastern Indian Ocean is via Timor Passage
(1250 m eastern sill depth at the Leti Strait and 1890 m at the western end). Thus, it is possible
that during the HS 1 the detrital sediments off Java were transported to core GeoB 10042-1 by
a strong ITF flow at ~1900 m. It is likely that the elevated ITF flow during the HS 1 occurred
not only at the thermocline depth (see section 5.1) but also at ~1900 m depth.
Detrital sediments can also be delivered to our cores via wind. Grain-size analyses from off
south Java suggest that sediments deposited during the HS 1 contain coarser terrigenous
components, suggesting an eolian source of the terrigenous sediment fraction (Mohtadi et al.,
2011). Therefore it is also possible that the more radiogenic detrital εNd value (-0.9) in GeoB
10042-1 during the HS 1 was a result of wind transport, possibly from the Java Island. For both
hypotheses we speculate that much of the detrital sediments were deposited at core GeoB
10042-1 as the change in the GeoB 10043-3 detrital εNd value is not robust. We further postulate
that it is unlikely that the radiogenic detrital εNd was transported to our cores through river
runoff as the model simulations and marine sediment proxies suggest that the ETIO experienced
reduced rainfall and warmer conditions during the HS 1 as a consequence of southward
migration of the ITCZ (Gibbons et al., 2014; Mohtadi et al., 2014).
During the Holocene the detrital εNd and detrital 87Sr/86Sr values of GeoB 10042-1 show a
prominent change (from -3.5 to -7.1 εNd units and from 0.709 to 0.715), indicating a change in

75
the provenance of the sediment. In addition, the Holocene detrital εNd value of GeoB 10043-3
also indicates an unradiogenic value (-6.6) compared to the last glacial. We suggest that a sharp
change in the sediment provenance at our cores was triggered by the opening of the Sunda Strait
at ~10 kyr (see section 5.1). As indicated in Fig. 2d, the transported sediments into our cores
presumably contained unradiogenic detrital εNd, possibly from Sumatra (Ehlert et al., 2011),
and hence resulted less radiogenic detrital εNd values. However, we cannot unambiguously
explain an offset in the 87Sr/86Sr value of GeoB 10043-3 during the Holocene. During this period
the 87Sr/86Sr value of GeoB 10043-3 indicates unradiogenic value (0.707).
6. Conclusion
We have investigated the modification of bottom water εNd in the eastern tropical Indian Ocean
off the Sunda Strait. Our foraminifera εNd suggests no alteration of the bottom waters (2171 m)
during the past ~2.4 kyr. Furthermore our new εNd data show that pronounced modifications of
the bottom water at our core site occurred during the period between ~7.7 and ~2.6 kyr and
during the last deglaciation as consequences of a strong- and a weak thermocline ITF flow,
respectively. Our detrital εNd and detrital 87Sr/86Sr values are also in good agreement with the
core top clay-sized detrital εNd and 87Sr/86Sr values from south Sumatra and Java, suggesting
that the source for the radiogenic detrital εNd in our cores is presumably from the sediments of
the Sunda Arc volcanics continental margin off south Sumatra and Java. Moreover we postulate
that a sharp change in the detrital εNd (GeoB 10042-1) off the Sunda Strait during the HS 1
might reflect stronger ITF flow at a depth of ~1900 m. Meanwhile, variability of the detrital εNd
during the Holocene indicates a prominent change in the provenance of the sediment. The XRF
Ti/Ca ratio data suggest that the opening of the Sunda Strait at ~10 kyr B.P. might be responsible
for the changes in the sediment provenance during this period.

76
Acknowledgments
We are grateful to M. Schulz and P. Böning for technical assistance. R.Y. Setiawan
acknowledges financial support from the Deutscher Akademischer Austauschdienst (DAAD
grant A/10/7596). This study was supported by the German Ministry of Education and Research
(project PABESIA) and the Deutsche Forschungsgemeinschaft (DFG grant HE3412/15-1). The
data of this study are archived and can be retrieved at PANGAEA (www.pangaea.de).

77
6. Testing the applicability of G. sacculifer Ba/Ca as an indicator of freshwater discharge
in the eastern tropical Indian Ocean
R. Y. Setiawan, M. Mohtadi, J. Groeneveld, S. Steinke, H. Kuhnert, D. Hebbeln
Technical Report
Abstract
The Ba/Ca ratio of planktic foraminifera carbonate serves as a new geochemical proxy for
seawater Ba/Ca and thus providing information on modern and past salinity and freshwater
discharge. In this study we have investigated the applicability of Ba/Ca ratio of core-top G.
sacculifer collected from the eastern tropical Indian Ocean (ETIO) for paleoceanographic
reconstructions. In doing so, we conducted a series of cleaning experiments for Ba/Ca
extraction by using different reductive solutions. Our new results suggest that the Ba/Ca ratio
of G. sacculifer cannot be utilized as a tracer for modern and past salinity changes in the ETIO
region off the Sunda Strait. We suggest that the existence of seasonal upwelling adds an
additional signal to the seawater Ba/Ca in the ETIO, and thus complicates the interpretation of
G. sacculifer Ba/Ca as a freshwater tracer. Moreover, our cleaning experiment results show that
the cleaning protocol of Barker et al. (2003), DTPA, and hydroxylamine can be used to extract
valuable Ba/Ca ratios from planktic foraminifera shells.
1. Introduction
Ba/Ca ratios of planktic foraminifera have been used to trace modern and past salinity changes
(Bahr et al., 2013; Saraswat et al, 2013; Schmidt and Lynch Stieglitz, 2011; Weldeab et al.,
2007; Hall and Chan, 2004). The main reason to use this ratio is that Ba/Ca ratio in foraminiferal
shells reflects the seawater barium (Ba) concentration as the Ba concentration in
estuarine/coastal settings is elevated relative to the open ocean and inversely correlated with
salinity (Lea and Spero, 1994). In addition, the incorporation of Ba into foraminifera shells is
independent of temperature, salinity, pH, and symbiont photosynthesis (Hönisch et al., 2011;
Lea and Spero, 1994; 1992), thus, making it a seemingly well suited salinity indicator. Ba is
supplied to the oceans through riverine input (Edmond et al., 1979; Shaw et al., 1998; Hanor,

78
2000) and hydrothermal vents (von Damm et al., 1985; Elderfield and Schultz, 1996). The
mineral barite (BaSO4) has been suggested as the primary carrier of particulate Ba in the water
column (Dehairs et al., 1980; Bishop, 1988; Dymond et al., 1992) and it precipitates in the water
column, on the sea floor and within marine sediments (Griffith and Paytan, 2012). Within the
water column the euphotic zone is typically enriched in particulate Ba compared to the deep
ocean (Dehairs et al., 1980; Collier and Edmond, 1984) and the enrichment is associated with
the oxygen minimum zone (Paytan and Griffith, 2007). Therefore upwelling regions usually
contain high Ba concentrations what possibly also can influence the Ba/Ca ratio of planktic
foraminifera (Saraswat et al, 2013).
Ba/Ca ratios extracted from foraminiferal shells can be biased by contaminant phases such as
clay minerals, organic matter, or ferromanganese coatings. Hence, the removal of those
contaminants requires a multiple step cleaning procedure of the samples. Commonly two
different cleaning methods to extract reliable Ba/Ca ratio from foraminifera shells are used
(Bahr et al., 2013; Schmidt and Lynch Stieglitz, 2011; Weldeab et al., 2007; Martin and Lea,
2002; Lea and Boyle, 1991). The major difference between these two methods is in the use of
an additional step using diethylenetriamine-pentaacetic acid (DTPA) (Martin and Lea, 2002;
Lea and Boyle, 1993; 1991). DTPA has been suggested to effectively remove sedimentary
barite that associated with shells, a potential source of contamination (Lea and Boyle, 1993;
1991). However, Martin and Lea (2002) also suggest that the effect of employing reductive and
DTPA cleanings might bias the measured Mg/Ca, Cd/Ca, Ba/Ca, and Mn/Ca ratios on two
different benthic species show inconsistent results. On the other hand other authors (Bahr et al.,
2013; Schmidt and Lynch Stieglitz, 2011; Weldeab et al., 2007) have omitted the DTPA
cleaning step due to its corrosiveness that can cause shell dissolution. In the perspective of
foraminifera cleaning, another cleaning protocol proposed by Barker et al. (2003) to clean
foraminifera for Mg/Ca measurements has been widely used is. According to their cleaning
79
experiments, a reductive cleaning step systematically lowered the foraminifera Mg/Ca ratio by
10-15%. Thus their proposed cleaning method for foraminifera does not include a reductive
step. Nonetheless, this finding contrasted the study of Martin and Lea (2002) that suggested
that a reductive step does not reduce the values of the Mg/Ca ratio in foraminifera.
Here, for the first time, we examine the applicability of Ba/Ca ratio of planktic foraminifera G.
sacculifer as a tracer for freshwater discharge in the region of eastern tropical Indian Ocean
(ETIO) off the Sunda Strait. In this study we also conducted a set of cleaning experiments on
ten surface sediment samples collected from off Sumatra to constrain the most suitable cleaning
method for the analysis of Ba/Ca in planktic foraminifera. This region is particularly appropriate
to address this issue as there is a persistent advection of low salinity Java Sea waters into the
investigated area. However, our new data suggest that G. sacculifer Ba/Ca ratios cannot be used
to trace freshwater discharge into the ETIO.
2. Study Area
Surface sediment samples used in the present study have been collected from the eastern
tropical Indian Ocean (ETIO) off Sumatra (Fig. 1). Today, the ETIO is a region where
precipitation (P) exceeds over evaporation (E) (Hendon, 2003). Qu et al. (2005) suggest that
the rainy season over ETIO region off southern Sumatra is principally linked to the northwest
monsoon (NWM) (December-February) season due to the southward progression of the
Intertropical Convergence Zone (ITCZ). During this season the winds blow from the Eurasian
continent, pass the South China Sea and the Bay of Bengal, carrying large amounts of moisture
to Indonesia and causing heavy rainfall over the region (Gordon, 2005; Qu et al., 2005). In
contrast, the dry season is associated with the southeast monsoon (SEM) (June-August) season
(Aldrian and Susanto, 2003; Hendon, 2003). During the SEM season the southeasterly winds
carry warm and dry air from Australia that also generate coastal upwelling along the south
coasts of the Java-Lesser Sunda Island chain (Susanto et al., 2001). This upwelling only occurs

80
during the southeast monsoon season and has been suggested to enhance chlorophyll a
concentration (Hendiarti et al., 2004; Susanto and Marra, 2005) as well as pelagic fish catch
(Hendiarti et al., 2005) in the region off south Java.
Modern oceanography shows a persistent advection of low-salinity Java Sea waters into the
ETIO via the Sunda Strait. Together with runoff from Java and Sumatra, this freshwater
advection is responsible for the low-salinity ‘‘tongue’’ (32‰) in the ETIO of the Sunda Strait
(Gingele et al., 2002; Ding et al., 2006). Furthermore, this freshwater discharge has been
suggested to generate a maximum transport of suspended material during the transition phase
between the rainy and dry seasons (March and April) (Hendiarti et al., 2004).
3. Materials and Methods
3.1. Surface sediments samples
A total of 69 surface sediment samples were collected from the ETIO off western and southern
Indonesia during the expeditions of RV SONNE 184 and 189 in 2005 and 2006, respectively
(Hebbeln et al., 2005; Wiedicke-Hombach et al., 2007). In the present study we only analyzed
10 surface sediment samples from off western and southern Sumatra. The locations and detailed
information of the investigated surface samples are presented in Fig. 1 and Table 1
(supplementary material).
3.2. Cleaning of foraminifera shells
We used Globigerinoides sacculifer (without sac) from 10 surface sediment samples in order
to test the effect of reductive cleaning solution on the Ba/Ca ratio (Table 1; supplementary
material). For each surface sediment sample approximately 30-40 individuals of G. sacculifer
were picked from the 250-355 μm size fraction and then were gently cracked using glass plates.
81
Then, all shell fragments were split into five aliquots and these split aliquots were subjected to
five different cleaning methods.
For the first aliquot we cleaned the tests of G. sacculifer using the cleaning procedure proposed
by Barker et al. (2003) and we named it as a “Mg/Ca” cleaning. In brief, the samples were
ultrasonically cleaned five times with de-ionized water and twice with distilled methanol to
remove detrital and clay particles. Organic matter was oxidized by adding a NaOH-buffered
1%-H2O2 reagent to the samples and placed in a hot water bath for 10 minutes with a few
seconds in an ultrasonic bath. After repeating this step, samples were rinsed and transferred into
new acid-cleaned vials. Samples then underwent a weak acid leaching (0.001 M QD HNO3)
with 30 seconds ultrasonic treatment. Following this step, samples were dissolved using 0.075
M QD HNO3, centrifuged for 10 minutes at 6000 rpm, transferred into new acid cleaned vials
and diluted with water.
For another three aliquots we modified the cleaning procedure of Barker et al. (2003) by adding
a reductive step after the oxidation step. In this reductive step we performed a set of experiments
by employing two different reductive reagents, i.e. hydrazine and hydroxylamine, and DTPA
(diethylene triamine penta-acetic acid). Each of the three aliquots received a different solution
during this reductive treatment. The detailed composition of each reductive solution is given in
Table 2. For experiments with hydrazine and hydroxylamine we added 100 μl of each solution
into two aliquots, whereas for the DTPA only 50 μl was added to an aliquot. In the following
step, these three samples were placed in a hot bath (~98 °C) for 30 minutes and were sonicated
briefly every 2 minutes. After this step all reductive reagents and DTPA were removed and the
samples were rinsed 3 times with de-ionized water. For the next steps, i.e. weak acid leaching
and dissolution, we followed Barker et al. (2003).
Finally, for the last aliquot we purely cleaned the shells only using de-ionized water for all
cleaning steps of Barker et al (2003).

82
Table 2. Detailed reductive solutions used in this study.
Reductive reagent Composition Reference
100 μL of buffered hydrazine solution
750 μL anhydrous hydrazine (NH2NH2) + ~0.5 N (~0.25 M) ammonium citrate (C6H17N3O7) + 10 mL concentrated (~30%) ammonium hydroxide (NH4OH)
Martin and Lea (2002)
100 μL of hydroxylamine solution
0.2 M NH2OH + 1 M CH3COONa Shen et al. (2001), Steinke et al. (2010)
50 μL of buffered DTPA (diethylene triamine penta-acetic acid)
0.01N (0.002 M) DTPA + 0.1N sodium hydroxide (NaOH)
Martin and Lea (2002)
3.3. Measurement
For the five different cleaning experiments G. sacculifer Ba/Ca ratios were measured using an
Agilent 720 Inductively Coupled Plasma Optical Emission Spectrometer (ICP-OES) housed at
the Department of Geosciences, University of Bremen. The Ba/Ca values are reported as μmol
mol-1. The instrumental precision during measurement was monitored by analysis of an in-
house standard solution, which was measured after every fifth sample, as well as the ECRM
752-1 standard (Greaves et al., 2008). The average 1σ error for the Ba/Ca analyses on external
standard and ECRM 752-1 standard are 0.02 μmol mol-1 and 0.1 μmol mol-1, respectively. It is
important to notice that we did not measure reproducibility due to insufficient sample material.
3.4. Calculation of seawater 18O
All of the G. sacculifer Mg/Ca ratios of surface sediment samples used in this study have been
measured by Mohtadi et al. (2011). According to Mohtadi et al. (2011) G. sacculifer data
83
represent mean annual mixed-layer conditions at ~50 m. In order to calculate the seawater 18O
( 18Osw), we used the 18O-temperature equation of Bemis et al. (1998):
T (°C) = 14.9 – 4.8 ( 18Occ - 18Osw) (2)
where 18Occ and T are the measured 18O of calcite and Mg/Ca-based temperature,
respectively. The values were then converted to Standard Mean Ocean Water (SMOW). The
errors of the calculations of Mg/Ca-based temperature and 18Osw are estimated by propagating
the errors introduced by Mohtadi et al. (2014). The resulting errors for temperature and 18Osw
are on average 1°C and 0.23 ‰, respectively.
4. Results
4.1. Planktic foraminifera G. sacculifer element to calcium ratios
The results of Ba/Ca ratio measurements of five different cleaning protocols are given in Table
1 and shown in Fig. 1. In general most of the Ba/Ca ratio values of different cleaning methods
show a consistent pattern. The G. sacculifer Ba/Ca ratio values cleaned with hydroxylamine
and of Mg/Ca cleaning are always higher than Ba/Ca values cleaned with water. Whereas Ba/Ca
values cleaned with hydrazine and DTPA are always lower than that cleaned with water.
For the Mg/Ca cleaning and the cleaning experiment with water the values of Ba/Ca ratio range
between 1.59 and 7.60, and between 1.45 and 3.53 μmol mol-1, respectively. Whereas for the
cleaning experiment using reductive solutions (Table 2), the Ba/Ca ratio values vary between
1.28 and 73.39 μmol mol-1. This extremely high value (73.39 μmol mol-1) is found in the GeoB
10033-3 (cleaning experiment with hydrazine). Another high Ba/Ca ratio value (12.32 μmol
mol-1) is also appeared in GeoB 10042-2 (cleaning experiment with hydrazine).
Most of the values of G. sacculifer Al/Ca ratio are under detection limit (negative values). The
Mn/Ca ratio values of G. sacculifer vary between 0.4 and 682.24 μmol mol-1. Our results
84
revealed that there are only two surface sediment samples (GeoB 10033-3 and GeoB 10034-3)
which have high Mn/Ca value > 100 μmol mol-1 (Table 1). For the Fe/Ca ratios, our data also
show that most of the values are negative and only two surface sediment samples (GeoB 10038-
3 and SO189-02MC) which have Fe/Ca ratio value > 100 μmol mol-1. Overall, there is no
significant correlation between these three element ratios and Ba/Ca ratio (r2 ≤ 0.01; not shown).

85
Fig. 1. Annual mean maps of (a) sea surface temperature (°C) (Locarnini et al., 2013) and (b) sea surface salinity (psu) (Zweng et al., 2013) obtained from the World Ocean Atlas 2013.

86
Black dots show the positions of surface sediment samples used in this study. Blue, cyan, green, yellow, and red bars are the values of Ba/Ca ratios resulted from cleaning experiments with hydrazine, water, hydroxylamine, DTPA, and of normal cleaning, respectively.
4.2. Planktic foraminifera G. sacculifer 18Osw
The 18Osw values of G. sacculifer from all surface sediment samples used in this study range
between 0.01 and 0.43 (‰ SMOW). The lowest and highest values are observed in GeoB
10036-3 and GeoB 10033-3, respectively.
5. Discussion
An issue in using elemental ratios as paleo-proxies is the possibility of contamination caused
by silicate material during foraminifera cleaning (Barker et al., 2003) and/or post-depositional
Mn-rich carbonate (Pena et al., 2005; 2008). Such contaminations can be assessed through
Al/Ca ratio of foraminifera to detect silicate contamination and through Mn/Ca and Fe/Ca ratios
to detect contamination by Mn-rich carbonate or early diagenetic ferromanganese oxides. We
used the criteria of Ni et al. (2007) that suggests Al/Ca ratio of <100 μmol mol-1 indicates not
contamination by silicates. We also used a threshold of Boyle (1983) and Boyle and Rosenthal
(1996) that suggests that a Mn/Ca ratio of 100-150 μmol mol-1 is not contaminated by MnCO3.
Our data show that there are two surface sediment samples containing high Al/Ca ratio values,
i.e. GeoB 10033-3 cleaned with hydrazine and GeoB 10038-3 of normal cleaning. In addition,
Mn/Ca ratios of GeoB 10034-3 (normal cleaning and cleaned with water) also exhibit high
values. Therefore we discarded the Ba/Ca ratio values of these samples when discussing our
results. We also excluded all of the Ba/Ca ratio values of GeoB 10040-3 and GeoB 10039-3 as
the values show an opposite trend compared to general pattern resulted from the experiments
(see section 4.1).

87
Higher Fe/Ca ratio values are observed in cleaning experiment with hydroxylamine in GeoB
10038-3 and SO189-02MC. However, we assume that Ba/Ca analyses for these surface samples
were unaffected by silicate contamination as the Al/Ca ratio values are under the detection limit
of the ICP-OES. Overall, the elemental ratios of the contamination indicators (Mn/Ca and Fe/Ca
ratios) suggest that our G. sacculifer Ba/Ca ratio can be used for further analyses.
5.1. Testing G. sacculifer Ba/Ca as a proxy for salinity
Although seawater Ba concentration for the investigated area is unknown, we examined the
applicability of G. sacculifer Ba/Ca ratio as a proxy for paleo-salinity by comparing it to the G.
sacculifer δ18Osw from the same surface sediment samples. Compared to GeoB 10033-3, GeoB
10034-3, and SO189-11MC, the positions of surface sediments GeoB 10036-3, GeoB 10038-
3, GeoB 10039-3, GeoB 10041-3, GeoB 10042-2, and SO189-02MC are suitable for this
investigation as these sediments geographically should be influenced by the transport of low
salinity Java Sea water into the ETIO via the Sunda Strait (Fig. 1). This inference is in
accordance with the observation (Table 1) that demonstrates the G. sacculifer δ18Osw values of
GeoB 10033-3, GeoB 10034-3, and SO189-11MC are on average higher (0.23-0.43 ‰)
compared to those located near the Sunda Strait (0.01-0.40 ‰). In addition, precipitation and
runoff in Sumatra and Java are enhanced during NWM season, hence, we expect that the
transported freshwater to the Sunda Strait is enriched in Ba.
In line with our expectation the average Ba/Ca ratio value of each different cleaning method for
surface sediments located in the proximity of the Sunda Strait indicates slightly higher Ba/Ca
ratio values compared to surface sediments located far from the Sunda Strait (Table 3), with an
exception in Ba/Ca value cleaned with hydrazine that shows identical value. It is important to
note here that we excluded Ba/Ca values of GeoB 10042-2 in this calculation. Even if we added
this surface sample to the calculation, the yielded difference in the average Ba/Ca for two
different locations becomes larger. Indeed, this finding strengthens our assumption that the

88
fresher Java Sea waters transported to the Sunda Strait are slightly enriched in Ba concentration.
However, this observation may also lead to a suggestion that G. sacculifer Ba/Ca in the GeoB
10042-2 as well as G. sacculifer Ba/Ca of the surface samples close to the Sunda Strait are
substantially affected by the upwelling and from the advection of fresher Java Sea waters.
In line with our expectation the average Ba/Ca ratio value of each different cleaning method for
surface sediments located in the proximity of the Sunda Strait indicates slightly higher Ba/Ca
ratio values compared to surface sediments located far from the Sunda Strait (Table 3), with an
exception in Ba/Ca value cleaned with hydrazine that shows identical value. It is important to
note here that we excluded Ba/Ca values of GeoB 10042-2 in this calculation. Even if we added
this surface sample to the calculation, the yielded difference in the average Ba/Ca for two
different locations becomes larger. Indeed, this finding strengthens our assumption that the
fresher Java Sea waters transported to the Sunda Strait are slightly enriched in Ba concentration.
However, this observation may also lead to a suggestion that G. sacculifer Ba/Ca in the GeoB
10042-2 as well as G. sacculifer Ba/Ca of the surface samples close to the Sunda Strait are
substantially affected by the upwelling and from the advection of fresher Java Sea waters.
Table 3. Average Ba/Ca ratio values of different cleaning experiments for surface sediments located proximal to and distal from the Sunda Strait.
Average Ba/Ca ratio value cleaned with Hydrazine
(μmol mol-
1)
Water
(μmol mol-1)
Hydroxylamine
(μmol mol-1)
DTPA
(μmol mol-1)
Mg/Ca cleaning
(μmol mol-1) Surface sediments location:
Near the Sunda Strait (GeoB 10036-3, GeoB 10038-3, GeoB 10041-3, and SO189-02MC)
1.63 2.30 2.79 2.05 3.48
Far from the Sunda Strait (GeoB 10033-3, GeoB 10034-3, SO189-11MC)
1.64 2.14 2.49 1.51 3.05

89
The correlation plot between G. sacculifer δ18Osw and G. sacculifer Ba/Ca of different cleaning
procedures for surface sediments nearby the Sunda Strait is shown in Fig. 2. Positive
correlations are observed in Ba/Ca of Mg/Ca cleaning (r2=0.65, n=4), in Ba/Ca cleaned with
water (r2=0.97, n=5) and hydroxylamine (r2=0.57, n=6). However, we expect that higher Ba/Ca
ratios should correspond to lower δ18Osw values. Hence, we suggest that the Ba/ca ratios do not
represent salinity. A weak correlation is also observed between G. sacculifer δ18Osw values and
the values of Ba/Ca ratios cleaned with hydrazine (r2<0.01, n=4) and DTPA (r2=0.27, n=4). In
summary, according to our new results, we suggest that G. sacculifer Ba/Ca cannot be applied
as a tracer for freshwater discharge in the ETIO off the Sunda Strait due to the fact that Ba/Ca
ratio of G. sacculifer appears to be influenced not only by freshwater discharge and but also by
upwelling. Moreover, cleaning experiments, as indicated by Table 3, suggest that a Mg/Ca
cleaning method introduced by Barker et al. (2003), DTPA and hydroxylamine can be used to
extract Ba/Ca ratio from the planktic foraminifera shells for the region of ETIO due to their
reliability to preserve seawater Ba/Ca. The similar Ba/Ca values between “freshwater
discharge” region (proximity to the Sunda Strait) and “non-freshwater discharge” region (distal
from the Sunda Strait) in the hydrazine experiment imply that this reductive reagent cannot be
used for cleaning the Ba/Ca foraminifera.
5.2. Testing G. sacculifer Ba/Ca as an indicator for marine productivity
In order to investigate the potential use of G. sacculifer Ba/Ca as a proxy for marine productivity
we compare our Ba/Ca data to the published data of marine productivity indicators in the ETIO
like bulk content of organic carbon (Corg.), the isotopic composition of nitrogen (δ15N)
(Baumgart et al., 2010), opal contentand planktic foraminifera G. ruber δ13C (Mohtadi et al.,
2011). Our comparison suggests that there is a lack of correlation between G. sacculifer Ba/Ca
and those marine productivity indicators (Fig. 3). For Ba/Ca cleaned with reductive reagents of
hydrazine and hydroxylamine, and DTPA the resulted r2 are 0.07, 0.04, and 0.31, respectively.

90
Furthermore, the r2 for Ba/Ca cleaned with water and of normal cleaning are 0.09 and 0.12,
respectively. Although we do not have values for Ba/Ca ratio cleaned with hydrazine and
DTPA, interestingly, the Ba/Ca ratios of GeoB 10042-2, which is located closed to the south
Java upwelling core, differs from the other samples. The Ba/Ca ratios of GeoB 10042-2 indicate
higher values than the other regions (Fig. 1 and Table 1)
Fig. 2. Correlation plots between G. sacculifer seawater δ18O (‰ SMOW) and G. sacculifer Ba/Ca ratios of different cleaning experiments.
Congruent with this observation opal concentration in surface sediment GeoB 10042-2 also
exhibits a relatively high concentration (5.2 %) compared to other surface sediment samples
used in this study (Table 1). The highest opal concentration (7.2 %) in the studied area is found
in GeoB 10038-3. In addition to opal, a systematic trend in concentration is pronounced in the

91
region off Sumatra, with higher (lower) concentration is observed in the southern (northern)
Sumatra. Mohtadi et al. (2007) suggest that opal is a reliable proxy for marine productivity in
the ETIO as its spatial distribution is tightly coupled to the south Java-Lesser Sunda Island
upwelling that occurs during SEM season. In corroboration with this suggestion a sediment trap
study by Romero et al. (2009) also revealed that the highest flux of opal occurred during the
SEM season (>150 mg m-2 d-1). Furthermore, according to the findings of Mohtadi et al. (2007)
there is a strong NW-SE gradient in the spatial distribution of opal concentration in the ETIO.
High opal concentrations of 6.37, 7.26, and 9.02 % are found in the surface sediments off south
Java, Lombok Basin, and in the Savu Sea, respectively, whereas low opal concentrations (≤ 4.2
%) are observed in the surface sediments off western Sumatra, where the upwelling influence
is diminished.
It is likely that high Ba/Ca ratio values in GeoB 10042-2 are strongly coupled to the south Java
upwelling. During the upwelling season the primary productivity in the regions off south Java
and Lesser Sunda Island chain are increased. The upwelling-induced chlorophyll a bloom leads
to enhanced barite precipitation and flux in the water column (Ganeshram et al., 2003; Paytan
and Griffith, 2007). Therefore it is plausible that the higher Ba/Ca ratios of G. sacculifer in
GeoB 10042-2 may reflect higher seawater Ba concentration in the region. However, as the
position of GeoB 10042-2 is also close to the Sunda Strait, we believe that the higher value of
Ba/Ca ratios in G. sacculifer may also be influenced by freshwater advection of Java Sea waters
into the Sunda Strait (detailed explanation in the next section). In order to validate this
observation a similar study on other multiple planktic foraminifera species collected from the
upwelling region of southern Java-Lesser Sunda Island chain (e.g. southern Bali, Lombok and
Sumba) is ultimately needed.

92
Fig. 3. Correlation plots between G. sacculifer seawater δ18O (‰ SMOW) and G. sacculifer Ba/Ca ratios of different cleaning experiments.

93
Spatial distribution of the surface sediment δ15N off Sumatra also shows similar NW-SE
gradient as opal (GeoB 10033-3, GeoB 10034-3, GeoB 10040-3 and GeoB 10041-3; Table 1).
In addition, the δ15N values also exhibits a nearshore-offshore trend (GeoB 10036-3, GeoB
10039-3, GeoB 10038-3, GeoB 10041-3, and GeoB 10040-3). For both patterns the highest
δ15N value is observed in the GeoB 10041-3 (6.0 ‰). Unfortunately, the δ15N data of GeoB
10042-2 was not available, hence, we cannot suggest whether this increase relates to upwelling
or not. Higher values for both parameters are found in the GeoB 10033-3, GeoB 10034-3, and
SO189-11MC, which are located distal from the upwelling region. This finding suggests that
upwelling is a not major contributor for the high values of Corg. and G. sacculifer δ13C.
Meanwhile, spatial distribution of the Corg. and G. sacculifer δ13C shows an opposite trend
compared to opal concentration. Higher values for both parameters are found in the GeoB
10033-3, GeoB 10034-3, and SO189-11MC, which are located distal from the upwelling region.
This finding suggests that upwelling is a not major contributor for the high values of Corg. and
G. sacculifer δ13C.
6. Conclusion
Our present study investigates the potential use of Ba/Ca ratio of planktic foraminifera G.
sacculifer to trace modern and past salinity and productivity in the ETIO off Sumatra. Our new
data provide evidence that the Ba/Ca ratio of G. sacculifer cannot be used to reconstruct
freshwater discharge. Furthermore, the results indicate that the Ba/Ca ratio of G. sacculifer has
a potential to trace modern and past marine productivities in the ETIO off south Java and Lesser
Sunda Islands. We also have conducted a set of cleaning experiment on planktic foraminifera
G. sacculifer to test the use of reductive solutions of hydrazine, hydroxylamine, and DTPA for
Ba/Ca ratio extraction. According to our experiment results, we conclude that a cleaning
94
protocol of Barker et al. (2003), DTPA, and hydroxylamine can be used to extract Ba/Ca ratio
from planktic foraminifera tests in the ETIO.
Acknowledgments
We are grateful to S. Pape for technical assistance. R.Y. Setiawan acknowledges financial
support from the Deutscher Akademischer Austauschdienst (DAAD grant A/10/7596). This
study was supported by the German Ministry of Education and Research (project PABESIA)
and the Deutsche Forschungsgemeinschaft (DFG grant HE3412/15-1). The data of this study
are archived and can be retrieved at PANGAEA (www.pangaea.de).

95
7. Synthesis
This study provides new evidence and understanding on hydrological changes in the eastern
tropical Indian Ocean (ETIO). There are two pivotal findings resulting from this study. First,
the new reconstruction of sea surface conditions off the Sunda Strait for the past ~40 kyr reveals
that the ETIO has experienced saltier sea surface condition, as indicated by high values of
seawater δ18O (δ18Osw), and decreased precipitation (low Ti/Ca ratio) during Heinrich stadials
1-3 and the Younger Dryas (YD) (Mohtadi et al., 2010a; b; Mohtadi et al., 2014). In contrast,
off the Sunda Strait sea surface waters were less saline (indicated by low δ18Osw) during the
Holocene compared to the last glacial. Moreover, results of this study provide robust evidence
suggesting that the opening of the Sunda Strait at ~10 kyr is a primary factor inducing fresher
surface condition in the ETIO region off the Sunda Strait through a persistent transport of low
salinity Java Sea water. Consequently, the variability of the δ18Osw values off the Sunda Strait
should be interpreted with caution as a proxy for changing rainfall or P-E.
The second pivotal finding of this study is a novel millennial-scale reconstruction of past bottom
water conditions off the Sunda Strait. This study underlines the potential of using the
neodymium isotope ratio (εNd) of authigenic coatings of mixed planktic foraminifera and of
detrital silicates as tracers for the ITF flow and sediment provenance in the ETIO, respectively.
For the first time, results of this study provide an evidence for modifications of the deep-water
neodymium isotope composition (indicated here by foraminifera εNd) off the Sunda Strait
during the past ~19 kyr. Furthermore, results of this study also reveal that foraminifera εNd and
detrital εNd are sensitive to large terrigenous input and the ITF flow.
Based on the two pivotal findings mentioned above, it is clear that the opening of the Sunda
Strait has played an important role in the hydrology development of the ETIO. Moreover, this
study provides robust evidence on the impacts of the opening of the Sunda Strait on the surface
and bottom water hydrography, and shows that the ETIO is a sensitive region to climate

96
changes. These two studies promote the importance of using different proxies for the hydrology
development investigations and most importantly, results of this study lay the foundation for
future research in the region.
This study also shows that in the ETIO the Ba/Ca ratio of the planktic foraminifera G sacculifer
does not serve as a suitable tracer for modern and past freshwater discharge as seawater Ba/Ca
in this region is also influenced by upwelling. It is likely that the modern oceanographic setting
off south Sumatra and Java complicates the use of G. sacculifer Ba/Ca to trace modern and past
changes in freshwater discharge. Furthermore, results of cleaning experiment demonstrate that
the G. sacculifer Ba/Ca ratio values of different cleaning methods show a consistent pattern,
i.e. the Ba/Ca ratio values cleaned with hydroxylamine and of normal cleaning are always
higher than Ba/Ca values cleaned with water. Whereas Ba/Ca values cleaned with hydrazine
and DTPA are always lower than those cleaned with water. Also, reductive solution of
hydroxylamine and cleaning protocol of Barker et al. (2003) can be used to extract Ba/Ca from
planktic foraminifera shells.

97
8. Outlook
The eastern tropical Indian Ocean (ETIO) has been investigated intensively during the past
decade. Foremost among these investigations is the reconstruction of sea surface conditions
based on fossil planktic foraminifera G. ruber s.s. (Mohtadi et al., 2007; 2009; 2010a; 2010b;
2011a; 2011b; 2014; Kwiatkowski et al., 2015). However, until today only the study presented
here provides a robust evidence on the persistent transport of low salinity Java Sea water via
the Sunda Strait throughout the Holocene as reflected in the variability of 18Osw data.
Simulation and observation studies suggest that the strength of the transport of low salinity Java
Sea water is influenced by the Australian-Indonesian Monsoon (AIM) winds (Putri, 2005), and
this freshwater flux influences the South Java Current (SJC) by lowering surface salinity down
to 32‰ (Wijffels et al., 1996). Therefore, it is essential to reconstruct the Holocene variability
of 18Osw on a set of thermocline and deeper dwelling foraminifera (e.g. P. obliquiloculata, N.
dutertrei, G. tumida and G. truncatulinoides) that calcify at different depths in order to constrain
the impact of freshwater advection on the deeper water column. Such a study may suggest that
a prominent freshening at thermocline depth implies a stronger freshwater advection due to
anomalous SEM winds and may serve as the first study in deciphering the Holocene water
column stratification of the ETIO in great detail.
It is well known that the ETIO is influenced by complex climate systems like ENSO and IOD
and it has been suggested that G. ruber s.s. reflects annual mean mixed-layer conditions
between 0 and 30 m in this region (Mohtadi et al., 2009; 2011b). For long-term research goals,
it is necessary to conduct long-term in situ observations paired with a quantitative analysis of
planktic foraminifera fluxes in order to ground-truth the extent to which this proxy is controlled
by different climate phenomena. Furthermore, it is also vital to reconstruct long-term IOD
variability from the non-ENSO and monsoon region (off northern and central Sumatra) in order
to gain a comprehensive knowledge on the evolution of IOD.

98
The use of the radiogenic neodymium isotope composition (εNd) in this study provides novel
insights about the modification of the bottom waters (as reflected in foraminiferal εNd data)
during the past 19 kyr. Indeed, results of this study lay the foundation for future research in the
ETIO as this is the first study in utilizing foraminfera εNd for bottom water reconstruction in the
region. However, the long-term (glacial-interglacial) variability and modification of bottom
water εNd are still unknown. It is critical to investigate the long-term variability of the bottom
water εNd as the ETIO region is the only tropical pathway of the global thermohaline circulation.
Talley and Sprintall (2005) suggest that the deepest ITF pathway is through the Maluku Sea
into the Banda Sea, and then exiting via Leti and Timor Straits (1250 and 1890 m). Thus,
variability of the bottom water εNd at depths of 1250 m and 1890 m may partly reflect the
thermohaline circulation and thus, might reveal its sensitivity to climate changes. Also, core top
foraminifera εNd data for the ETIO region are not available to date. Hence, it is also necessary
to perform neodymium isotope analyses on core top foraminifera in order to better constrain
the signature of bottom water εNd and to investigate the influence of boundary exchange on
bottom water εNd in the ETIO region (Lacan and Jeandel, 2005).
99
9. References
Abram, N. J., M. K. Gagan, Z. Liu, W. S. Hantoro, M. T. McCulloch, and B. W. Suwargadi (2007), Seasonal characteristics of the Indian Ocean Dipole during the Holocene epoch, Nature, 445(7125), 299-302.
Abram, N. J., H. V. McGregor, M. K. Gagan, W. S. Hantoro, and B. W. Suwargadi (2009), Oscillations in the southern extent of the Indo-Pacific Warm Pool during the mid-Holocene, Quaternary Science Reviews, 28(25–26), 2794-2803.
Aldrian, E., and R. D. Susanto (2003), Identification of three dominant rainfall regions within Indonesia and their relationship to sea surface temperature. International Journal of Climatology, 23, 1435–1452.
Amakawa, H., D. S. Alibo, and Y. Nozaki (2000), Nd isotopic composition and REE pattern in the surface waters of the eastern Indian Ocean and its adjacent seas, Geochimica et Cosmochimica Acta, 64(10), 1715-1727.
Anand, P., H. Elderfield, and M. H. Conte (2003), Calibration of Mg/Ca thermometry in planktonic foraminifera from a sediment trap time series, Paleoceanography, 18, 1050, doi:10.1029/2002PA000846.
Arbuszewski, J., P. deMenocal, A. Kaplan, and E. C. Farmer (2010), On the fidelity of shell-derived 18Oseawater estimates, Earth and Planetary Science Letters, 300, 185-196.
Arsouze, T., J. C. Dutay, F. Lacan, and C. Jeandel (2009), Reconstructing the Nd oceanic cycle using a coupled dynamical – biogeochemical model, Biogeosciences, 6(12), 2829-2846.
Atmadipoera, A., R. Molcard, G. Madec, S. Wijffels, J. Sprintall, A. Koch-Larrouy, I. Jaya, and A. Supangat (2009), Characteristics and variability of the Indonesian throughflow water at the outflow straits, Deep Sea Research Part I: Oceanographic Research Papers, 56(11), 1942-1954.
Ayliffe, L. K., et al. (2013), Rapid interhemispheric climate links via the Australasian monsoon during the last deglaciation, Nature Communications, 4, doi: 10.1038/ncomms3908.
Barker, S., M. Greaves, and H. Elderfield (2003), A study of cleaning procedures used for foraminiferal Mg/Ca paleothermometry, Geochemistry, Geophysics, Geosystems, 4(9), 1-20.
Bemis, B. E., H. J. Spero, J. Bijma, and D. W. Lea (1998), Reevaluation of the oxygen isotopic composition of planktonic foraminifera: Experimental results and revised paleotemperature equations, Paleoceanography, 13, 150-160.
Bishop, J. K. B. (1988), The barite-opal-organic carbon association in oceanic particulate matter, Nature, 332(6162), 341-343.

100
Blaauw, M., and J. A. Christen (2011), Flexible paleoclimate age-depth models using an autoregressive gamma process. Bayesian Analysis, 6, 457-474.
Boyle, E. A. (1981), Cadmium, zinc, copper, and barium in foraminifera tests, Earth and Planetary Science Letters, 53(1), 11-35.
Bush, A. B. G., and R. G. Fairbanks (2003), Exposing the Sunda shelf: Tropical responses to eustatic sea level change, Journal of Geophysical Research Atmospheres, 108, 4446, doi: 10.1029/2002JD003027.
Cannon, C. H., R. J. Morley, and A. B. G. Bush (2009), The current refugial rainforests of Sundaland are unrepresentative of their biogeographic past and highly vulnerable to disturbance, Proceedings of the National Academy of Sciences, 106(27), 11188-11193.
Carolin, S. A., K. M. Cobb, J. F. Adkins, B. Clark, J. L. Conroy, S. Lejau, J. Malang, and A. A. Tuen (2013), Varied Response of Western Pacific Hydrology to Climate Forcings over the Last Glacial Period, Science, 340, 1564-1566.
De Deckker, P., and F. X. Gingele (2002), On the occurrence of the giant diatom Ethmodiscus rex in an 80-ka record from a deep-sea core, southeast of Sumatra, Indonesia: implications for tropical palaeoceanography, Marine Geology, 183, 31-43.
Denniston, R. F., K.-H. Wyrwoll, Y. Asmerom, V. J. Polyak, W. F. Humphreys, J. Cugley, D. Woods, Z. LaPointe, J. Peota, and E. Greaves (2013), North Atlantic forcing of millennial-scale Indo-Australian monsoon dynamics during the Last Glacial period, Quaternary Science Reviews, 72, 159-168.
DiNezio, P. N., A. Clement, G. A. Vecchi, B. Soden, A. J. Broccoli, B. L. Otto-Bliesner, and P. Braconnot (2011), The response of the Walker circulation to Last Glacial Maximum forcing: Implications for detection in proxies, Paleoceanography, 26, PA3217, doi: 10.1029/2010pa002083.
DiNezio, P. N., and J. E. Tierney (2013), The effect of sea level on glacial Indo-Pacific climate, Nature Geoscience, 6, 485-491.
Ding, X., F. Bassinot, F. Guichard, Q. Y. Li, N. Q. Fang, L. Labeyrie, R. C. Xin, M. K. Adisaputra, and K. Hardjawidjaksana (2006), Distribution and ecology of planktonic foraminifera from the seas around the Indonesian Archipelago, Marine Micropaleontology, 58, 114–134.
Du, Y., T. Qu, and G. Meyers (2008), Interannual Variability of Sea Surface Temperature off Java and Sumatra in a Global GCM, Journal of Climate, 21, 2451-2465.
Du, Y., T. Qu, G. Meyers, Y. Masumoto, and H. Sasaki (2005), Seasonal heat budget in the mixed layer of the southeastern tropical Indian Ocean in a high-resolution ocean general circulation model, Journal of Geophysical Research Oceans, 110, 1978-2012.

101
Dubois, N., D. W. Oppo, V. V. Galy, M. Mohtadi, S. van der Kaars, J. E. Tierney, Y. Rosenthal, T. I. Eglinton, A. Lückge, and B. K. Linsley (2014), Indonesian vegetation response to changes in rainfall seasonality over the past 25,000 years, Nature Geoscience, 7, 513-517.
Dykoski, C. A., R. L. Edwards, H. Cheng, D. Yuan, Y. Cai, M. Zhang, Y. Lin, J. Qing, Z. An, and J. Revenaugh (2005), A high-resolution, absolute-dated Holocene and deglacial Asian monsoon record from Dongge Cave, China, Earth and Planetary Science Letters, 233, 71-86.
Dymond, J., E. Suess, and M. Lyle (1992), Barium in Deep-Sea Sediment: A Geochemical Proxy for Paleoproductivity, Paleoceanography, 7(2), 163-181.
Ehlert, C., M. Frank, B. A. Haley, U. Böniger, P. De Deckker, and F. X. Gingele (2011), Current transport versus continental inputs in the eastern Indian Ocean: Radiogenic isotope signatures of clay size sediments, Geochemistry, Geophysics, Geosystems, 12(6), 1-17.
England, M. H., and F. Huang (2005), On the Interannual Variability of the Indonesian Throughflow and Its Linkage with ENSO. Journal of Climate, 18, 1435–1444.
Fan, W., Z. Jian, F. Bassinot, and Z. Chu (2013), Holocene centennial-scale changes of the Indonesian and South China Sea throughflows: Evidences from the Makassar Strait, Global and Planetary Change, 111, 111-117.
Ferguson, J. E., G. M. Henderson, M. Kucera, and R. E. M. Rickaby (2008), Systematic change of foraminiferal Mg/Ca ratios across a strong salinity gradient, Earth and Planetary Science Letters, 265, 153-166.
Ffield, A., K. Vranes, A. L. Gordon, R. D. Susanto, and S. L. Garzoli (2000), Temperature variability within Makassar Strait, Geophyical. Research Letters, 27, 237-240.
Fleitmann, D., et al. (2007), Holocene ITCZ and Indian monsoon dynamics recorded in stalagmites from Oman and Yemen (Socotra), Quaternary Science Reviews, 26, 170-188.
Frank, M. (2002), Radiogenic isotopes: tracers of past ocean circulation and erosional input, Reviews of Geophysics, 40(1), 1-1-1-38.
Frank, M., N. Whiteley, T. van de Flierdt, B. C. Reynolds, and K. O'Nions (2006), Nd and Pb isotope evolution of deep water masses in the eastern Indian Ocean during the past 33 Myr, Chemical Geology, 226(3–4), 264-279.
Gibbons, F. T., D. W. Oppo, M. Mohtadi, Y. Rosenthal, J. Cheng, Z. Liu, and B. K. Linsley (2014), Deglacial δ18O and hydrologic variability in the tropical Pacific and Indian Oceans, Earth and Planetary Science Letters, 387, 240-251.
Gingele, X. F., P. De Deckker, A. Girault, and F. Guichard (2002), History of the South Java Current over the past 80 ka, Palaeogeography, Palaeoclimatology, Palaeoecology, 183, 247-260.
Gordon, A. L., R. D. Susanto, and A. Ffield (1999), Throughflow within Makassar Strait, Geophysical Research Letters, 26(21), 3325-3328.

102
Gordon, A. L., R. D. Susanto, and K. Vranes (2003), Cool Indonesian throughflow as a consequence of restricted surface layer flow, Nature, 425(6960), 824-828.
Gordon, A. L., J. Sprintall, H. M. Van Aken, D. Susanto, S. Wijffels, R. Molcard, A. Ffield, W. Pranowo, and S. Wirasantosa (2010), The Indonesian throughflow during 2004–2006 as observed by the INSTANT program, Dynamics of Atmospheres and Oceans, 50, 115-128.
Gordon, A. L., R. D. Susanto, and K. Vranes (2003), Cool Indonesian throughflow as a consequence of restricted surface layer flow, Nature, 425, 824-828.
Greaves, M., et al. (2008), Interlaboratory comparison study of calibration standards for foraminiferal Mg/Ca thermometry, Geochemistry, Geophysics, Geosystems, 9, Q08010, doi:10.1029/2008GC001974.
Griffith, E. M., and A. Paytan (2012), Barite in the ocean – occurrence, geochemistry and palaeoceanographic applications, Sedimentology, 59(6), 1817-1835.
Griffiths, M. L., et al. (2009), Increasing Australian-Indonesian monsoon rainfall linked to early Holocene sea-level rise, Nature Geoscience, 2, 636-639.
Griffiths, M. L., R. N. Drysdale, M. K. Gagan, J.-x. Zhao, J. C. Hellstrom, L. K. Ayliffe, and W. S. Hantoro (2013), Abrupt increase in east Indonesian rainfall from flooding of the Sunda Shelf ~9500 years ago, Quaternary Science Reviews, 74, 273-279.
Hall, J. M., and L. H. Chan (2004), Ba/Ca in Neogloboquadrina pachyderma as an indicator of deglacial meltwater discharge into the western Arctic Ocean, Paleoceanography, 19(1), 1-9.
Hanebuth, T., K. Stattegger, and P. M. Grootes (2000), Rapid Flooding of the Sunda Shelf: A Late-Glacial Sea-Level Record, Science, 288, 1033-1035.
Hanebuth, T. J. J., and K. Stattegger (2004), Depositional sequences on a late Pleistocene–Holocene tropical siliciclastic shelf (Sunda Shelf, southeast Asia), Journal of Asian Earth Sciences, 23(1), 113-126.
Hanebuth, T. J. J., K. Stattegger, and A. Bojanowski (2009), Termination of the Last Glacial Maximum sea-level lowstand: The Sunda-Shelf data revisited, Global and Planetary Change, 66(1–2), 76-84.
Hanebuth, T. J. J., H. K. Voris, Y. Yokoyama, Y. Saito, and J. Okuno (2011), Formation and fate of sedimentary depocentres on Southeast Asia's Sunda Shelf over the past sea-level cycle and biogeographic implications, Earth-Science Reviews, 104, 92-110.
Hebbeln, D., and cruise participants (2006), Report and preliminary results of RV SONNE Cruise SO-184, Pabesia, Durban (South Africa) - Cilacap (Indonesia) - Darwin (Australia), July 8th - September 13th, 2005, 142 pp, Universität Bremen.
Hendon, H. H. (2003), Indonesian Rainfall Variability: Impacts of ENSO and Local Air–Sea Interaction, Journal of Climate, 16, 1775-1790.

103
Hertzberg, J. E. and M.W. Schmidt (2013), Refining Globigerinoides ruber Mg/Ca paleothermometry in the Atlantic Ocean, Earth and Planetary Science Letters, 383, 123-133.
Holbourn, A., W. Kuhnt, and J. Xu (2011), Indonesian Throughflow variability during the last 140 ka: the Timor Sea outflow, Geological Society, London, Special Publications, 355(1), 283-303.
Iskandar, I., S. A. Rao, and T. Tozuka (2009), Chlorophyll a bloom along the southern coasts of Java and Sumatra during 2006, International Journal of Remote Sensing, 30(3), 663-671.
Jeandel, C., J. K. Bishop, and A. Zindler (1995), Exchange of neodymium and its isotopes between seawater and small and large particles in the Sargasso Sea, Geochimica et Cosmochimica Acta, 59(3), 535-547.
Jeandel, C., D. Thouron, and M. Fieux (1998), Concentrations and isotopic compositions of neodymium in the eastern Indian Ocean and Indonesian straits, Geochimica et Cosmochimica Acta, 62(15), 2597-2607.
Jouzel, J., et al. (2007), Orbital and Millennial Antarctic Climate Variability over the Past 800,000 Years, Science, 317, 793-796.
Kershaw, A. P., S. van der Kaars, and J. R. Flenley (2007), The Quaternary history of far eastern rainforests, in Tropical Rainforest Responses to Climatic Change, pp. 77-115, Springer Berlin Heidelberg.
Kisakürek, B., A. Eisenhauer, F. Böhm, D. Garbe-Schönberg, and J. Erez (2008), Controls on shell Mg/Ca and Sr/Ca in cultured planktonic foraminiferan, Globigerinoides ruber (white), Earth and Planetary Science Letters, 273, 260-269.
Kraft, S., M. Frank, E. C. Hathorne, and S. Weldeab (2013), Assessment of seawater Nd isotope signatures extracted from foraminiferal shells and authigenic phases of Gulf of Guinea sediments, Geochimica et Cosmochimica Acta, 121(0), 414-435.
Kwiatkowski, C., M. Prange, V. Varma, S. Steinke, D. Hebbeln, and M. Mohtadi (2015), Holocene variations of thermocline conditions in the eastern tropical Indian Ocean, Quaternary Science Reviews, 114(0), 33-42.
Lacan, F., and C. Jeandel (2005), Neodymium isotopes as a new tool for quantifying exchange fluxes at the continent–ocean interface, Earth and Planetary Science Letters, 232(3–4), 245-257.
Lea, D. W., and H. J. Spero (1994), Assessing the reliability of paleochemical tracers: Barium uptake in the shells of planktonic foraminifera, Paleoceanography, 9(3), 445-452.
Levi, C., L. Labeyrie, F. Bassinot, F. Guichard, E. Cortijo, C. Waelbroeck, N. Caillon, J. Duprat, T. de Garidel-Thoron, and H. Elderfield (2007), Low-latitude hydrological cycle and rapid climate changes during the last deglaciation, Geochemistry, Geophysics, Geosystems, 8, Q05N12. doi: 10.1029/2006GC001514.

104
Linsley, B. K., Y. Rosenthal, and D. W. Oppo (2010), Holocene evolution of the Indonesian throughflow and the western Pacific warm pool, Nature Geoscience, 3, 578-583.
Locarnini, R. A., A. V. Mishonov, J. I. Antonov, T. P. Boyer, H. E. Garcia, O. K. Baranova, M. M. Zweng, C. R. Paver, J. R. Reagan, D. R. Johnson, M. Hamilton, and D. Seidov, 2013. World Ocean Atlas 2013, Volume 1: Temperature. S. Levitus, Ed., A. Mishonov Technical Ed.; NOAA Atlas NESDIS 73, 40 pp.
Luo, J.-J., R. Zhang, S. K. Behera, Y. Masumoto, F.-F. Jin, R. Lukas, and T. Yamagata (2010), Interaction between El Niño and Extreme Indian Ocean Dipole, Journal of Climate, 23(3), 726-742.
Lückge, A., M. Mohtadi, C. Rühlemann, G. Scheeder, A. Vink, L. Reinhardt, and M. Wiedicke (2009), Monsoon versus ocean circulation controls on paleoenvironmental conditions off southern Sumatra during the past 300,000 years, Paleoceanography, 24, PA1208, doi:1210.1029/2008PA001627.
Maloney, B. K. (1980), Pollen analytical evidence for early forest clearance in North Sumatra, Nature, 287, 324-326.
Martin, P. A., and D. W. Lea (2002), A simple evaluation of cleaning procedures on fossil benthic foraminiferal Mg/Ca, Geochemistry, Geophysics, Geosystems, 3(10), 1-8.
Mathien-Blard, E. and F. Bassinot (2009), Salinity bias on the foraminifera Mg/Ca thermometry: Correction procedure and implications for past ocean hydrographic reconstructions, Geochemistry, Geophysics, Geosystems, 10, Q12011, doi:12010.11029/12008GC002353.
Martin, E. E., and H. Scher (2006), A Nd isotopic study of southern sourced waters and Indonesian Throughflow at intermediate depths in the Cenozoic Indian Ocean, Geochemistry, Geophysics, Geosystems, 7(9),1-14.
McBride, J. L., M. R. Haylock, and N. Nicholls (2003), Relationships between the Maritime Continent Heat Source and the El Niño–Southern Oscillation Phenomenon, Journal of Climate, 16, 2905-2914.
Meyers, G., R. J. Bailey, and A. P. Worby (1995), Geostrophic transport of Indonesian throughflow, Deep Sea Research Part I: Oceanographic Research Papers, 42(7), 1163-1174.
Mohtadi, M., S. Steinke, J. Groeneveld, H. G. Fink, T. Rixen, D. Hebbeln, B. Donner, and B. Herunadi (2009), Low-latitude control on seasonal and interannual changes in planktonic foraminiferal flux and shell geochemistry off south Java: A sediment trap study, Paleoceanography, 24, PA1201, doi:10.1029/2008PA001636.
Mohtadi, M., S. Steinke, A. Lückge, J. Groeneveld, and E. C. Hathorne (2010a), Glacial to Holocene surface hydrography of the tropical eastern Indian Ocean, Earth and Planetary Science Letters, 292, 89-97.

105
Mohtadi, M., A. Lückge, S. Steinke, J. Groeneveld, D. Hebbeln, and N. Westphal (2010b), Late Pleistocene surface and thermocline conditions of the eastern tropical Indian Ocean, Quaternary Science Reviews, 29, 887-896.
Mohtadi, M., D. W. Oppo, S. Steinke, J.-B. W. Stuut, R. De Pol-Holz, D. Hebbeln, and A. Lückge (2011a), Glacial to Holocene swings of the Australian-Indonesian monsoon, Nature Geoscience, 4, 540-544.
Mohtadi, M., D. W. Oppo, A. Lückge, R. DePol-Holz, S. Steinke, J. Groeneveld, N. Hemme, and D. Hebbeln (2011b), Reconstructing the thermal structure of the upper ocean: Insights from planktic foraminifera shell chemistry and alkenones in modern sediments of the tropical eastern Indian Ocean, Paleoceanography, 26, PA3219, doi:3210.1029/2011pa002132.
Mohtadi, M., M. Prange, D. W. Oppo, R. De Pol-Holz, U. Merkel, X. Zhang, S. Steinke, and A. Lückge (2014), North Atlantic forcing of tropical Indian Ocean climate, Nature, 509, 76-80.
Molina-Kescher, M., M. Frank, and E. Hathorne (2014), South Pacific dissolved Nd isotope compositions and rare earth element distributions: Water mass mixing versus biogeochemical cycling, Geochimica et Cosmochimica Acta, 127(0), 171-189.
Monnin, E., A. Indermühle, A. Dällenbach, J. Flückiger, B. Stauffer, T. F. Stocker, D. Raynaud, and J.-M. Barnola (2001), Atmospheric CO2 Concentrations over the Last Glacial Termination, Science, 291, 112-114.
Neale, R., and J. Slingo (2003), The Maritime Continent and Its Role in the Global Climate: A GCM Study, Journal of Climate, 16(5), 834-848.
Ni, Y., G. L. Foster, T. Bailey, T. Elliott, D. N. Schmidt, P. Pearson, B. Haley, and C. Coath (2007), A core top assessment of proxies for the ocean carbonate system in surface-dwelling foraminifers, Paleoceanography, 22(3), 1-14.
Niedermeyer, E. M., A. L. Sessions, S. J. Feakins, and M. Mohtadi (2014), Hydroclimate of the western Indo-Pacific Warm Pool during the past 24,000 years, Proceedings of the National Academy of Sciences, 111, 9402-9406.
Osborne, A. H., D. R. Newkirk, J. Groeneveld, E. E. Martin, R. Tiedemann, and M. Frank (2014), The seawater neodymium and lead isotope record of the final stages of Central American Seaway closure, Paleoceanography, 29(7), 715-729.
Paillard, D., L. Labeyrie, and P. Yiou (1996), Macintosh Program performs time-series analysis, Eos Transactions AGU, 77, 379–379.
Pelejero, C., M. Kienast, L. Wang, and J. O. Grimalt (1999), The flooding of Sundaland during the last deglaciation: imprints in hemipelagic sediments from the southern South China Sea, Earth and Planetary Science Letters, 171, 661-671.
106
Pena, L. D., E. Calvo, I. Cacho, S. Eggins, and C. Pelejero (2005), Identification and removal of Mn-Mg-rich contaminant phases on foraminiferal tests: Implications for Mg/Ca past temperature reconstructions, Geochemistry, Geophysics, Geosystems, 6(9), 1-25.
Pena, L. D., I. Cacho, E. Calvo, C. Pelejero, S. Eggins, and A. Sadekov (2008), Characterization of contaminant phases in foraminifera carbonates by electron microprobe mapping, Geochemistry, Geophysics, Geosystems, 9(7), 1-12.
Piotrowski, A. M., A. Galy, J. A. L. Nicholl, N. Roberts, D. J. Wilson, J. A. Clegg, and J. Yu (2012), Reconstructing deglacial North and South Atlantic deep water sourcing using foraminiferal Nd isotopes, Earth and Planetary Science Letters, 357–358(0), 289-297.
Piotrowski, A. M., V. K. Banakar, A. E. Scrivner, H. Elderfield, A. Galy, and A. Dennis (2009), Indian Ocean circulation and productivity during the last glacial cycle, Earth and Planetary Science Letters, 285(1–2), 179-189.
Putri, M. R. (2005), Study of Ocean Climate Variability (1959-2002) in the Eastern Indian Ocean, Java Sea and Sunda Strait Using the HAMburg Shelf Ocean Model, Dissertation, Univ. Hamburg, 104 pp.
Qu, T., and G. Meyers (2005), Seasonal Characteristics of Circulation in the Southeastern Tropical Indian Ocean, Journal of Physical Oceanography, 35(2), 255-267.
Qu, T., Y. Du, J. Strachan, G. Meyers, and J. Slingo (2005), Sea surface temperature and its variability in the Indonesian region. Oceanography, 18, 50–61.
Rasmusson, E. M., and T. H. Carpenter (1982), Variations in Tropical Sea Surface Temperature and Surface Wind Fields Associated with the Southern Oscillation/El Niño, Monthly Weather Review, 110(5), 354-384.
Reimer, P. J., et al. (2013), IntCal13 and Marine13 Radiocarbon Age Calibration Curves 0–50,000 Years cal BP. Radiocarbon, 55, 1869-1887.
Rempfer, J., T. F. Stocker, F. Joos, J.-C. Dutay, and M. Siddall (2011), Modelling Nd-isotopes with a coarse resolution ocean circulation model: Sensitivities to model parameters and source/sink distributions, Geochimica et Cosmochimica Acta, 75(20), 5927-5950.
Roberts, N. L., A. M. Piotrowski, H. Elderfield, T. I. Eglinton, and M. W. Lomas (2012), Rare earth element association with foraminifera, Geochimica et Cosmochimica Acta, 94(0), 57-71.
Romero, O. E., M. Mohtadi, P. Helmke, and D. Hebbeln (2012), High interglacial diatom paleoproductivity in the westernmost Indo-Pacific Warm Pool during the past 130,000 years, Paleoceanography, 27, PA3209, doi:3210.1029/2012pa002299.
Russell, J. M., H. Vogel, B. L. Konecky, S. Bijaksana, Y. Huang, M. Melles, N. Wattrus, K. Costa, and J. W. King (2014), Glacial forcing of central Indonesian hydroclimate since 60,000 y B.P, Proceedings of the National Academy of Sciences, 111, 5100-5105.

107
Saji, N. H., B. N. Goswami, P. N. Vinayachandran, and T. Yamagata (1999), A dipole mode in the tropical Indian Ocean, Nature, 401(6751), 360-363.
Schmidt, M. W., and J. Lynch-Stieglitz (2011), Florida Straits deglacial temperature and salinity change: Implications for tropical hydrologic cycle variability during the Younger Dryas, Paleoceanography, 26(4), 1-16.
Setiawan, R. Y., and A. Habibi (2011), Satellite Detection of Summer Chlorophyll-a Bloom in the Gulf of Tomini, Selected Topics in Applied Earth Observations and Remote Sensing, IEEE Journal of, 4(4), 944-948.
Setiawan, R. Y., and H. Kawamura (2011), Summertime Phytoplankton Bloom in the South Sulawesi Sea, Selected Topics in Applied Earth Observations and Remote Sensing, IEEE Journal of, 4(1), 241-244.
Setiawan, R. Y., M. Mohtadi, J. Southon, J. Groeneveld, S. Steinke, D. Hebbeln (2015), The consequences of opening the Sunda Strait on the hydrography of the eastern tropical Indian Ocean, Paleoceanography: under review after revision.
Song, Q., A. L. Gordon, and M. Visbeck (2004), Spreading of the Indonesian Throughflow in the Indian Ocean, Journal of Physical Oceanography, 34(4), 772-792.
Southon, J., M. Mohtadi, and R. De Pol-Holz (2013), Planktic Foram Dates from the Indonesian Arc: Marine 14C Reservoir Ages and a Mythical AD 535 Volcanic Eruption. Radiocarbon, 55, 1869-1887.
Sprintall, J., and A. Révelard (2014), The Indonesian Throughflow response to Indo-Pacific climate variability, Journal of Geophysical Research: Oceans, 119(2), 1161-1175.
Sprintall, J., A. L. Gordon, A. Koch-Larrouy, T. Lee, J. T. Potemra, K. Pujiana, and S. E. Wijffels (2014), The Indonesian seas and their role in the coupled ocean-climate system, Nature Geosci, 7(7), 487-492.
Sprintall, J., S. Wijffels, R. Molcard, and I. Jaya (2010), Direct evidence of the South Java Current system in Ombai Strait, Dynamics of Atmospheres and Oceans, 50, 140-156.
Sprintall, J., S. E. Wijffels, R. Molcard, and I. Jaya (2009), Direct estimates of the Indonesian Throughflow entering the Indian Ocean: 2004–2006, Journal of Geophysical Research Oceans, 114, C07001, doi:10.1029/2008JC005257.
Steinke, S., M. Kienast, J. Groeneveld, L.-C. Lin, M.-T. Chen, and R. Rendle-Bühring (2008), Proxy dependence of the temporal pattern of deglacial warming in the tropical South China Sea: toward resolving seasonality, Quaternary Science Reviews, 27, 688-700.
Steinke, S., M. Prange, C. Feist, J. Groeneveld, and M. Mohtadi (2014), Upwelling variability off southern Indonesia over the past two millennia, Geophysical Research Letters, 41(21), 7684-7693.

108
Stuijts, I., J. C. Newsome, and J. R. Flenley (1988), Evidence for late quaternary vegetational change in the Sumatran and Javan highlands, Review of Palaeobotany and Palynology, 55, 207-216.
Stumpf, R., S. Kraft, M. Frank, B. Haley, A. Holbourn, and W. Kuhnt (2015), Persistently strong Indonesian Throughflow during marine isotope stage 3: evidence from radiogenic isotopes, Quaternary Science Reviews, 112(0), 197-206.
Susanto, R. D., Z. Wei, R. Adi, B. Fan, S. Li, and G. Fang (2013), Observations of the Karimata Strait througflow from December 2007 to November 2008, Acta Oceanologica Sinica, 32, 1-6.
Susanto, R. D., G. Fang, I. Soesilo, Q. Zheng, F. Qiao, Z. Wei, and B. Sulistyo (2010), New Surveys of a Branch of the Indonesian Throughflow, Eos Transactions AGU, 91, 261-263.
Susanto, R. D., and J. Marra, (2005), Effect of the 1997/98 El Niño on chlorophyll a variability along the southern coasts of Java and Sumatra. Oceanography, 18, 124–127.
Susanto, R. D., A. L. Gordon, and Q. Zheng (2001), Upwelling along the coasts of Java and Sumatra and its relation to ENSO, Geophysical Research Letters, 28, 1599-1602.
Susanto, R. D., T. S. Moore, and J. Marra (2006), Ocean color variability in the Indonesian Seas during the SeaWiFS era, Geochemistry, Geophysics, Geosystems, 7(5), 1-16.
Tachikawa, K., C. Jeandel, and M. Roy-Barman (1999), A new approach to the Nd residence time in the ocean: the role of atmospheric inputs, Earth and Planetary Science Letters, 170(4), 433-446.
Tachikawa, K., V. Athias, and C. Jeandel (2003), Neodymium budget in the modern ocean and paleo-oceanographic implications, Journal of Geophysical Research: Oceans, 108(C8), 1-13.
Talley, L. D., and J. Sprintall (2005), Deep expression of the Indonesian Throughflow: Indonesian Intermediate Water in the South Equatorial Current, Journal of Geophysical Research: Oceans, 110(C10), 1-30.
Tjia, H. D. (1980), The Sunda Shelf, SE Asia. Zeitschrift für Geomorphologie, 24, 405–427.
Vance, D., A. E. Scrivner, P. Beney, M. Staubwasser, G. M. Henderson, and N. C. Slowey (2004), The use of foraminifera as a record of the past neodymium isotope composition of seawater, Paleoceanography, 19(2), 1-17.
van der Kaars, S., F. Bassinot, P. De Deckker, and F. Guichard (2010), Changes in monsoon and ocean circulation and the vegetation cover of southwest Sumatra through the last 83,000 years: The record from marine core BAR94-42, Palaeogeography, Palaeoclimatology, Palaeoecology, 296, 52-78.
Vranes, K., and A. L. Gordon (2005), Comparison of Indonesian Throughflow transport observations, Makassar Strait to eastern Indian Ocean, Geophysical Research Letters, 32, L10606, doi:10.1029/2004GL022158.

109
Vroon, P. Z., M. J. van Bergen, G. J. Klaver, and W. M. White (1995), Strontium, neodymium, and lead isotopic and trace-element signatures of the East indonesian sediments: provenance and implications for banda arc magma genesis, Geochimica et Cosmochimica Acta, 59(12), 2573-2598.
Waelbroeck, C., L. Labeyrie, E. Michel, J. C. Duplessy, J. F. McManus, K. Lambeck, E. Balbon, and M. Labracherie (2002), Sea-level and deep water temperature changes derived from benthic foraminifera isotopic records, Quaternary Science Reviews, 21, 295-305.
Weldeab, S., D. W. Lea, R. R. Schneider, and N. Andersen (2007), 155,000 Years of West African Monsoon and Ocean Thermal Evolution, Science, 316(5829), 1303-1307.
Wilson, D. J., A. M. Piotrowski, A. Galy, and I. N. McCave (2012), A boundary exchange influence on deglacial neodymium isotope records from the deep western Indian Ocean, Earth and Planetary Science Letters, 341–344(0), 35-47.
Xu, J., A. Holbourn, W. Kuhnt, Z. Jian, and H. Kawamura (2008), Changes in the thermocline structure of the Indonesian outflow during Terminations I and II, Earth and Planetary Science Letters, 273, 152-162.
Yuan, D., J. Wang, T. Xu, P. Xu, Z. Hui, X. Zhao, Y. Luan, W. Zheng, and Y. Yu (2011), Forcing of the Indian Ocean Dipole on the Interannual Variations of the Tropical Pacific Ocean: Roles of the Indonesian Throughflow, Journal of Climate, 24(14), 3593-3608.
Zhang, R., and T. L. Delworth (2005), Simulated Tropical Response to a Substantial Weakening of the Atlantic Thermohaline Circulation, Journal of Climate, 18, 1853-1860.
Zweng, M. M, J.R. Reagan, J. I. Antonov, R. A. Locarnini, A.V. Mishonov, T. P. Boyer, H. E. Garcia, O. K. Baranova, D. R. Johnson, D. Seidov, M. M. Biddle (2013), World Ocean Atlas 2013, Volume 2: Salinity. S. Levitus, Ed., A. Mishonov Technical Ed.; NOAA Atlas NESDIS 74, 39 pp.