THE ROLE OF SWI IN DETECTING ABNORMAL OXYGEN … · [email protected] THE ROLE OF SWI IN DETECTING...
42
MR Research Facility, Wayne State University, Detroit, Michigan [email protected] THE ROLE OF SWI IN DETECTING ABNORMAL OXYGEN SATURATION AND MICROBLEEDS IN STROKE E. Mark Haacke, PhD
Transcript of THE ROLE OF SWI IN DETECTING ABNORMAL OXYGEN … · [email protected] THE ROLE OF SWI IN DETECTING...
MR Research Facility, Wayne State University, Detroit, Michigan [email protected]
THE ROLE OF SWI IN DETECTING
ABNORMAL OXYGEN SATURATION AND
MICROBLEEDS IN STROKE
E. Mark Haacke, PhD

Disclosures
Dr. Haacke is affiliated with:
Wayne State University, McMaster University,
University of Saskatoon, Loma Linda University,
Case Western Reserve University, East China
Normal University, and Northeast University.
The MRI Institute for Biomedical Research
MR Innovations, Inc.
Clinical applications of SWI and SWIM
See www.swim-mri.com
Our work in Detroit at Wayne State University
See www.mrc.wayne.edu

David Utriainen, for image analysis
Sean Sethi, MS, for image analysis
Meng Li, MS, for perfusion analysis
Jaladhar Neelavalli, PhD for SWIM support
Zhifeng Kou, PhD for TBI data
Sagar Buch, PhD for oxygen saturation measures
Saifeng Liu, PhD for advances in SWIM processing
Xia Shuang, MD for SWI stroke data
Meiyun Wang, MD for DE SWI data
And for a tremendous effort on STAGE Yongsheng Chen
Acknowledgements

SWI
Haacke EM et al. Susceptibility weighted imaging. Magnetic Resonance in
Medicine, 52: 612; 2004.
Susceptibility Weighted Imaging from a single
echo sequence with a long TE of 20ms at 3T
Enhances the presence of ferritin, hemosiderin and deoxyhemoglobin
Exquisite images showing venous structures and CMBs (cerebral microbleeds)
Using the venous signal, one can more easily see changes in deoxyhemoglobin in stroke

Cerebral amyloid angiopathy
50µ objects can manifest as 1mm3 objects

MRI scan date: 2013.01.04
MRI scan date: 2013.01.11
Two scans from the same stroke patient
MTT
SWI
SWIMTT
Images courtesy of Luo Yu MD, The Branch of Shanghai First Hospital

Venous
Thrombosis:
before
treatment
and after
thrombolysis
Guangbin Wang M.D.
Shandong Medical Imaging
Research Institute
T1 T2
PRE POST
SWI SWIM
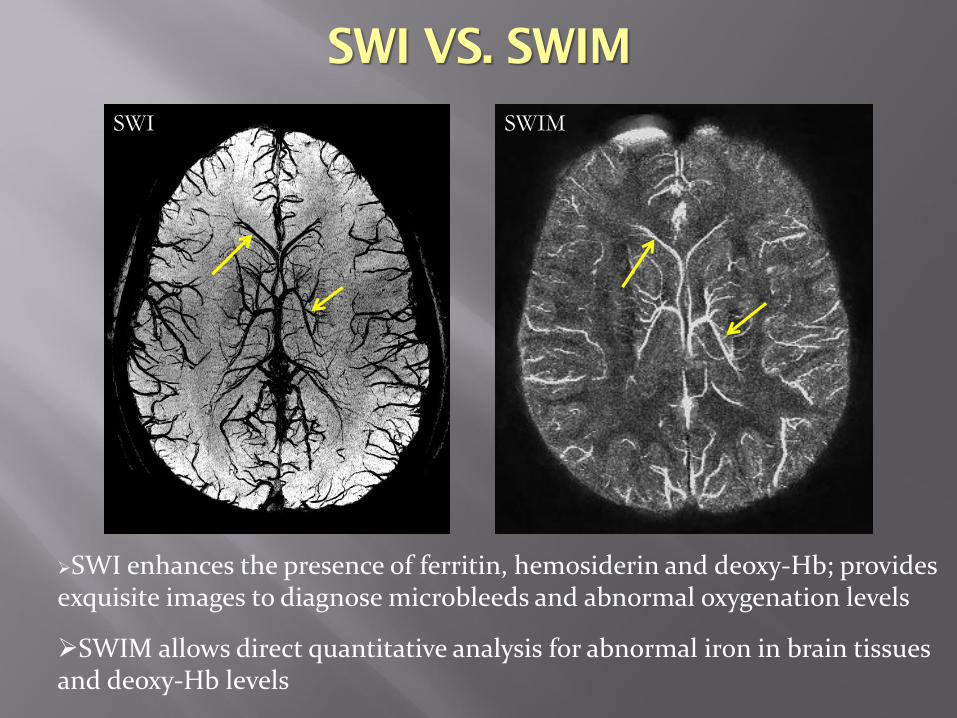
SWI enhances the presence of ferritin, hemosiderin and deoxy-Hb; provides exquisite images to diagnose microbleeds and abnormal oxygenation levels
SWIM allows direct quantitative analysis for abnormal iron in brain tissues and deoxy-Hb levels
SWI VS. SWIM

Minimum intensity projection of SWI over 28 slices
SWI PRE
CAFFEINE
SWI POST
CAFFEINE
SWI as a high resolution BOLD imaging method
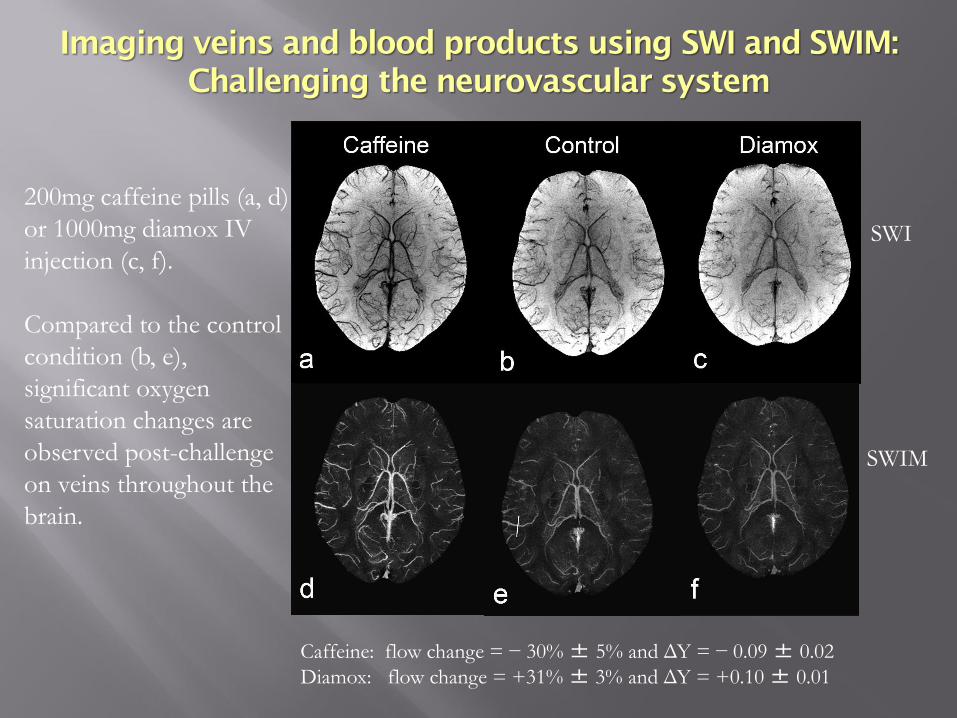
200mg caffeine pills (a, d)
or 1000mg diamox IV
injection (c, f).
Compared to the control
condition (b, e),
significant oxygen
saturation changes are
observed post-challenge
on veins throughout the
brain.
SWI
SWIM
Imaging veins and blood products using SWI and SWIM:
Challenging the neurovascular system
Caffeine: flow change = − 30% ± 5% and ΔY = − 0.09 ± 0.02
Diamox: flow change = +31% ± 3% and ΔY = +0.10 ± 0.01

a
b
c
MIPs of SWIM data over 8mm. The data where collected at 3T with TE=14.3ms and a voxel size 0.5x0.5x0.5mm3.
Future Directions:
OXYGEN EXTRACTION FRACTION

Green - deoxyhemoglobin levels in the veins
Blue represents iron in the basal ganglia and midbrain
Whole brain iron oxygen extraction fraction

Materials and Methods
Subjects 26 patients with cerebral hemisphere ischemic stroke (screened
from 78 cases) 30 healthy volunteers age and sex matched
Criteria All patients had SWI, DWI and MRA DWI high signal、ADC low signal, suggests acute ischemic stroke Only unilateral hemisphere involvement (contralateral served as
control) Cortical veins of bilateral hemispheres are easy to visualize
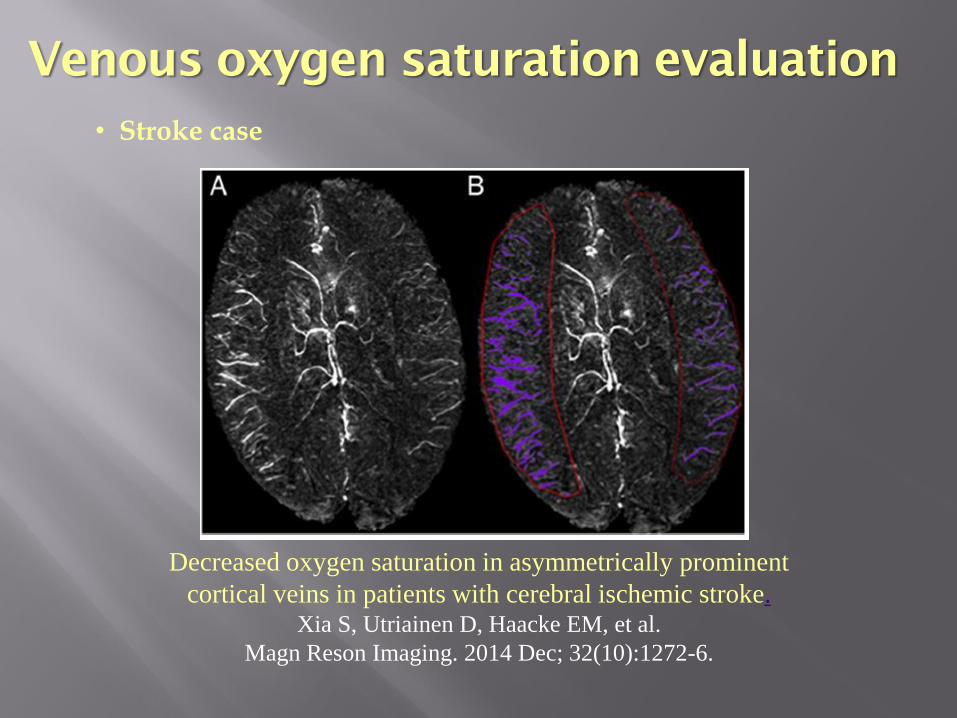
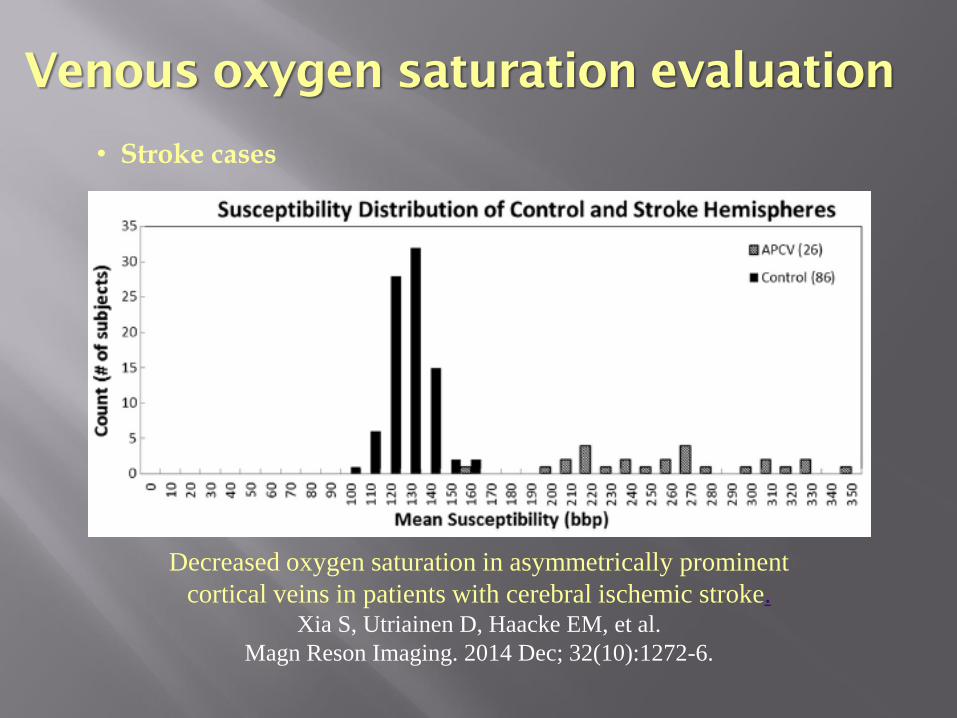
Venous oxygen saturation evaluation
• Stroke case
Decreased oxygen saturation in asymmetrically prominent
cortical veins in patients with cerebral ischemic stroke.Xia S, Utriainen D, Haacke EM, et al.
Magn Reson Imaging. 2014 Dec; 32(10):1272-6.
Venous oxygen saturation evaluation
• Stroke cases
Decreased oxygen saturation in asymmetrically prominent
cortical veins in patients with cerebral ischemic stroke.Xia S, Utriainen D, Haacke EM, et al.
Magn Reson Imaging. 2014 Dec; 32(10):1272-6.

Venous oxygen saturation
evaluation
• Stroke case
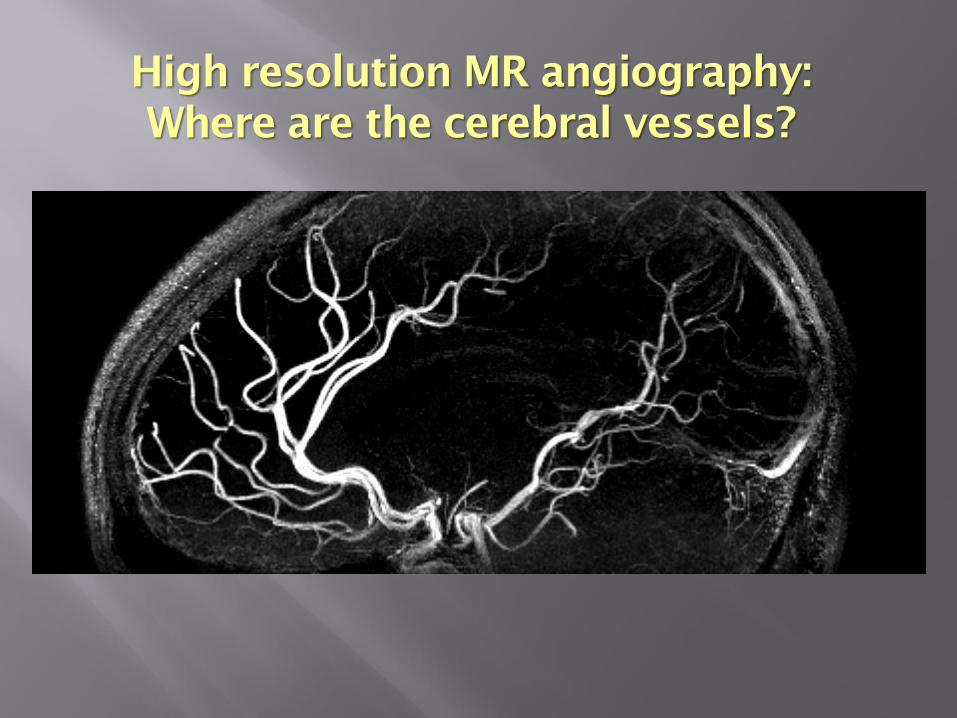
High resolution MR angiography:
Where are the cerebral vessels?

11) Salamon, G., 1971. Atlas of the arteries of the human brain. Sandoz, Paris.
250μ x 250μ x 500μ MRA using a contrast agent, 15 minute scan

Visualizing Small Arteries
Small arteries around 250 microns and possibly even smaller
are becoming visible (see thalamic arteries)
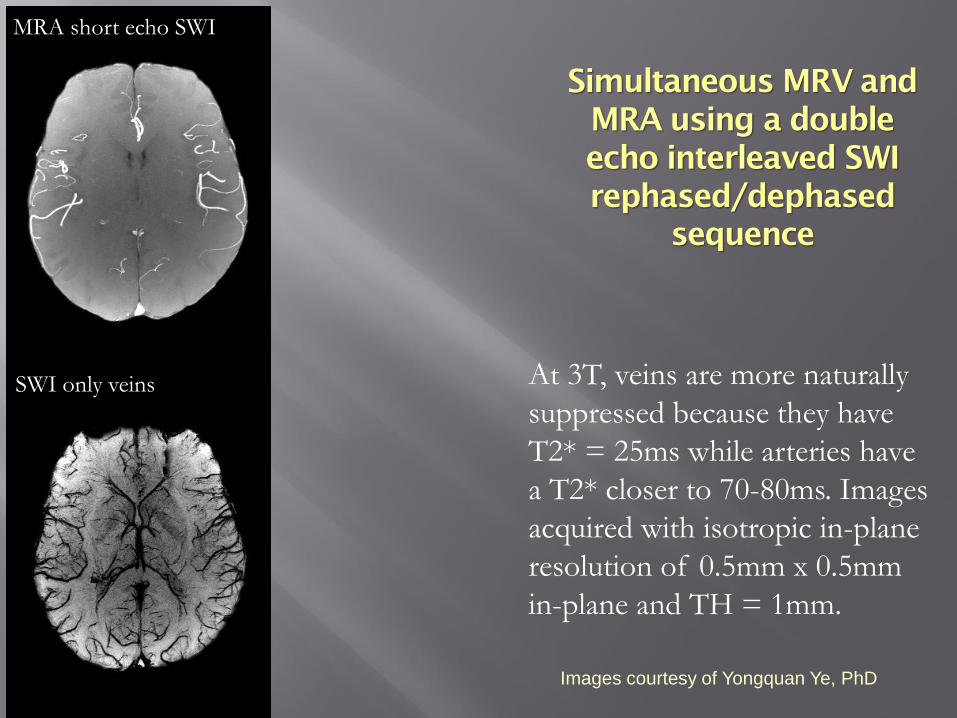
MRA short echo SWI
SWI only veins At 3T, veins are more naturally
suppressed because they have
T2* = 25ms while arteries have
a T2* closer to 70-80ms. Images
acquired with isotropic in-plane
resolution of 0.5mm x 0.5mm
in-plane and TH = 1mm.
Images courtesy of Yongquan Ye, PhD
Simultaneous MRV and
MRA using a double
echo interleaved SWI
rephased/dephased
sequence

Simultaneous MRV and
MRA using a double
echo interleaved SWI
rephased/dephased
sequence
MRA short echo SWI RP-DP MRA
SWI only veins
With no contrast agent
the interleaved double
echo sequence offers
excellent background
suppression to give a
superb MRA and SWI.
Images courtesy of Yongquan Ye, PhD
RP-DP MRA
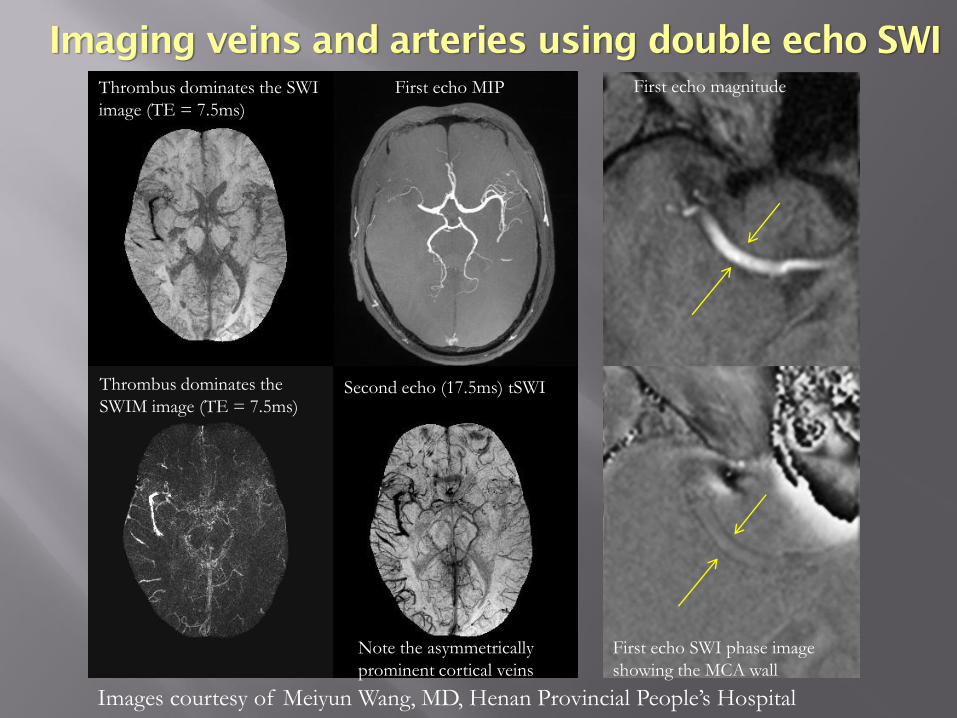
Imaging veins and arteries using double echo SWI
Thrombus dominates the SWI
image (TE = 7.5ms)
Note the asymmetrically
prominent cortical veins
Thrombus dominates the
SWIM image (TE = 7.5ms)
First echo MIP
Second echo (17.5ms) tSWI
First echo magnitude
First echo SWI phase image
showing the MCA wall
Images courtesy of Meiyun Wang, MD, Henan Provincial People’s Hospital

Stroke case for a young woman in her mid 30s
FLAIR PWI (1st) SWI mIP MRA
CBV CBF MTT TTP
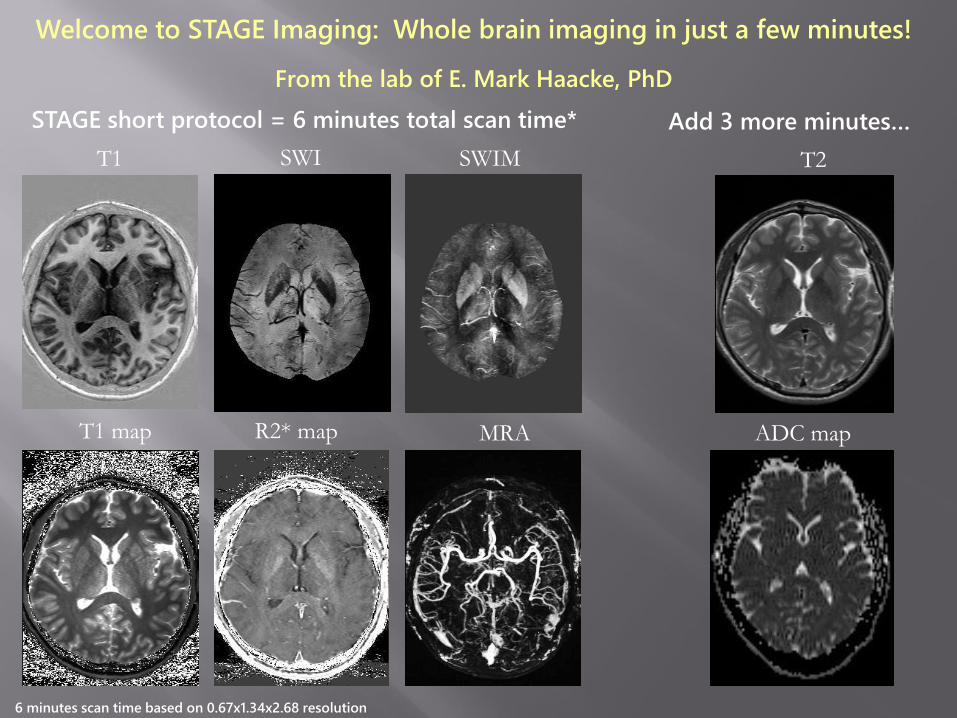
STAGE short protocol = 6 minutes total scan time*
Welcome to STAGE Imaging: Whole brain imaging in just a few minutes!
From the lab of E. Mark Haacke, PhD
T1 SWI SWIM
T1 map R2* map MRA
T2
ADC map
Add 3 more minutes…
6 minutes scan time based on 0.67x1.34x2.68 resolution


Imaging the whole brain within 5 minutes with STAGE A provides
not only the usual conventional images such as:
• A) T1W, PDW, and T2* weighted images but also
• B) a T1 MAP, PD MAP, R2* MAP and over and above this
• C) SWI, MRA and SWIM images and finally the potential for
• D) Tissue segmentation for CSF, GM, WM, arteries and veins
Strategically Acquired
Gradient Echo Imaging or
STAGE Imaging

The rapid STAGE protocol consists of collecting the data with a
resolution of:
0.67 x 1.3 x 2.7mm3 and 48 (64) partitions.
The basic protocol consists of the follow SWI scans:
• B1: TE=7.5ms/18.5ms, FA=6o, 2 (2.5) minutes
• B2: TE =7.5ms/17.5ms, FA = 24o, 2 (2.5) minutes
• B3: TE=5ms rephased/17.5ms dephased, FA=24o, 4 minutes
• Data Processing done by SPIN software from MR Innovations.
STAGE 2 A and B Imaging
The rapid STAGE protocol can be augmented by adding:
• One of FLAIR or SPIN ECHO 2D or 3D scans in 2 minutes
• DWI in 2 minutes
and for stroke cases, if thought appropriate
• PWI in 2 minutes
Data Processing done by SPIN software from MR Innovations.
Augmented STAGE Imaging

STAGE for an old stroke case
SWI, tSWI and SWIM images from the FA=6o, TE=17ms data.
These images represent a mIP/MIP of 11 slices
The hypointense area in the left brain on SWI which has a positive susceptibility on
SWIM indicates a hemorrhage or an abnormal vein in this area.
SWI SWIM True SWI


Dr. Mark Haacke and Yongsheng Chen
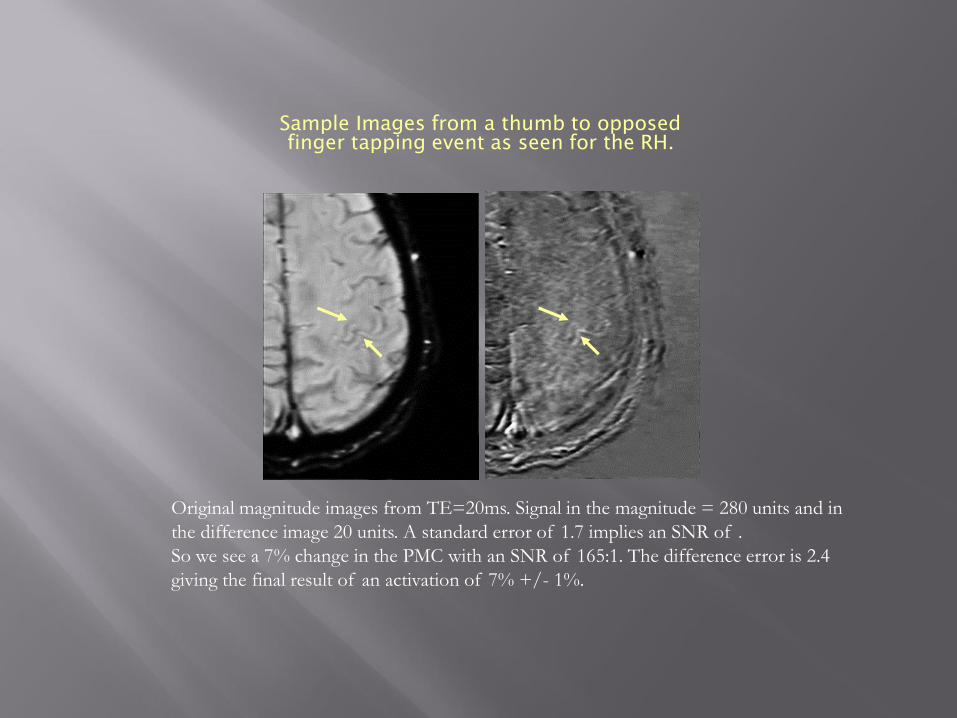
Sample Images from a thumb to opposed
finger tapping event as seen for the RH.
Original magnitude images from TE=20ms. Signal in the magnitude = 280 units and in
the difference image 20 units. A standard error of 1.7 implies an SNR of .
So we see a 7% change in the PMC with an SNR of 165:1. The difference error is 2.4
giving the final result of an activation of 7% +/- 1%.
Future Directions
Imaging atherosclerosis for stroke patients in
The carotid arteries
The MCAs
Imaging vulnerable plaque
Imaging the entire vasculature with SWI by using a USPIO such as Ferumoxytol and the MICRO imaging protocol

Carotid vessel wall plaque, TE = 5ms
Imaging vessel wall using SWI and SWIM
TE = 15.6ms
0.5mm x 0.5mm x 1mm
sagittal acquisition
8 minutes without parallel
imaging
2008 time frame
0.37 radian phase shift
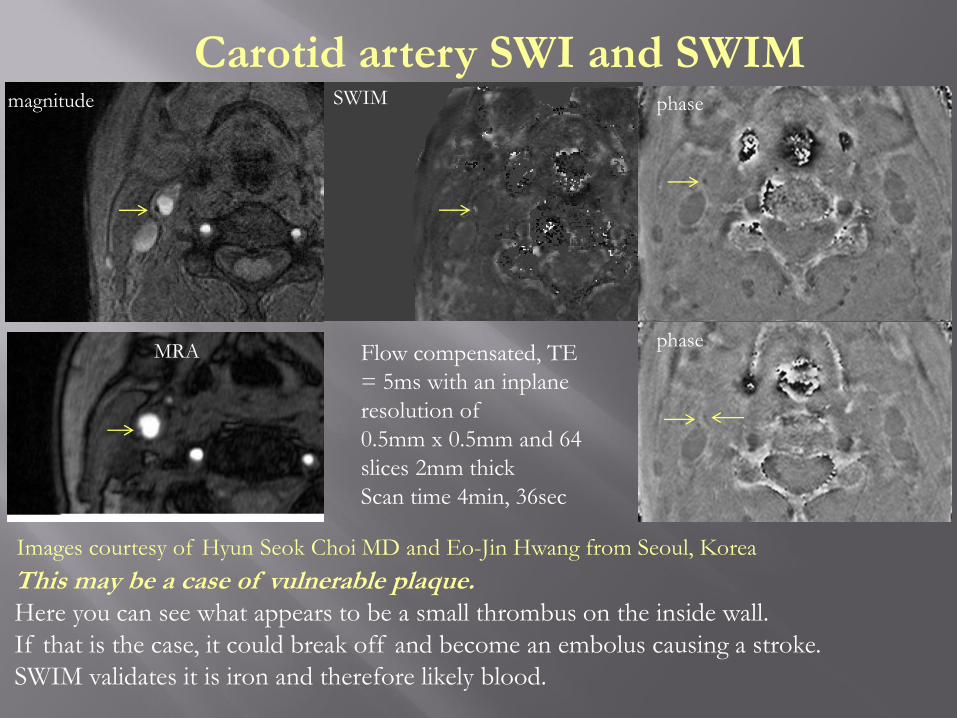
Carotid artery SWI and SWIM
This may be a case of vulnerable plaque. Here you can see what appears to be a small thrombus on the inside wall.
If that is the case, it could break off and become an embolus causing a stroke.
SWIM validates it is iron and therefore likely blood.
magnitude SWIM
MRA
phase
phaseFlow compensated, TE
= 5ms with an inplane
resolution of
0.5mm x 0.5mm and 64
slices 2mm thick
Scan time 4min, 36sec
Images courtesy of Hyun Seok Choi MD and Eo-Jin Hwang from Seoul, Korea

A B C
MICRO
“Microvascular In-vivo Contrast Revealed Origins”
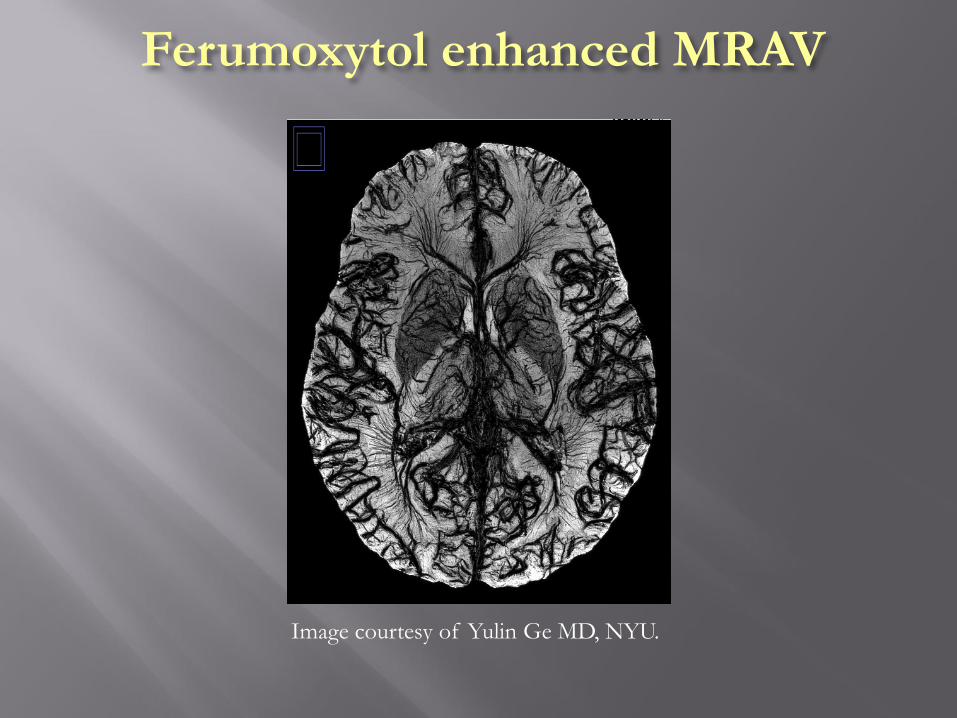
Ferumoxytol enhanced MRAV
Image courtesy of Yulin Ge MD, NYU.

The process of separating arteries from
veins from pre/post Ferumoxytol images.
MICRO data acquired at 7T with TE = 8ms and a
resolution of 100μm x 200μm x 1.25mm.
(A) MIP of pre-contrast original magnitude image
(1st echo) showing the arterial signal (red).
(B) Post 4mg/kg Ferumoxytol MICRO image.
(C) Basal ganglia arteries from the cadaver brain
work of Georges Salamon (1971).
(D) mIP of pre-contrast SWI shows veins only.
(E) Post-Ferumoxytol SWI (2mg/kg) showing both
veins and arteries including small arterioles
(red arrowheads) and venules (blue
arrowheads).
(F) Post-contrast QSM showing higher
susceptibility values in veins than in arteries.
Our goal is to track both arteries and veins, and use
this to study microvascular disease at 3T.
Arteries, arterioles and venules are now visible
thanks to the susceptibility contrast and blooming
effect from Feuromxytol.
A B C
D E F

Conclusions
SWI offers new possibilities for studying stroke
SWI/PWI mismatch suggests collateral flow and potentially better outcomes
SWI detection of CMBs may impact treatment
Stroke patients should be imaged at the acute stage and again before discharge a week later in order to better understand patient recovery
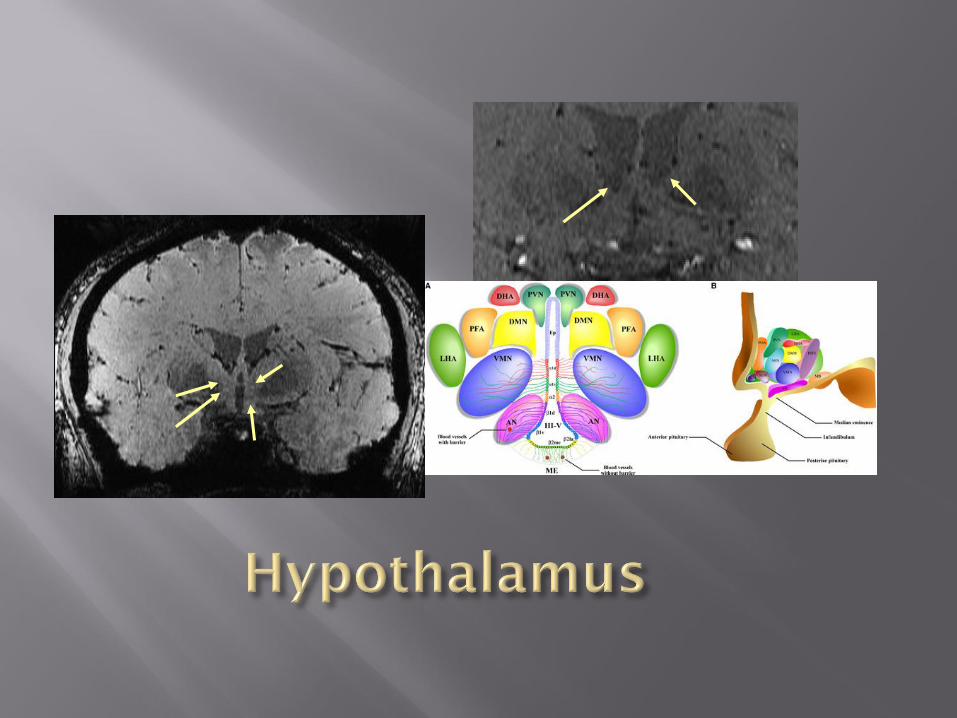
STAGE imaging can be used to: image stroke in less than 10 minutes, image thalamic nuclei and possibly in the future for fMRI
Microvascular imaging is possible with USPIO and SWI to image vessels down to 50-100μ in diameter