The Role of Superannuation in the Financial Sector and in ... · the role of superannuation in the...
34
THE ROLE OF SUPERANNUATION IN THE FINANCIAL SECTOR AND IN AGGREGATE SAVING: A REVIEW OF RECENT TRENDS Malcolm Edey Robin Foster Ian Macfarlane Research Discussion Paper 9112 December 1991 Economic Group Reserve Bank of Australia An earlier version of this paper was presented at the Third Annual Melbourne Money and Finance Conference, 6-7 December 1991.
Transcript of The Role of Superannuation in the Financial Sector and in ... · the role of superannuation in the...
THE ROLE OF SUPERANNUATION IN THE FINANCIAL SECTOR AND IN AGGREGATE SAVING: A REVIEW OF RECENT TRENDS
Malcolm Edey Robin Foster
Ian Macfarlane
Research Discussion Paper 91 12
December 1991
Economic Group
Reserve Bank of Australia
An earlier version of this paper was presented at the Third Annual Melbourne Money and Finance Conference, 6-7 December 1991.
ABSTRACT
Assets with superannuation funds represented the fastest growing of the major components of household wealth during the 1980s. This paper reviews the causes of that growth, and its effects on private saving and on the pattern of financial intermediation. It is found that the growth of superannuation funds during this period was mainly a result of the funds' high earnings rates; there was relatively little change in the net rate of new contributions by members. This fact makes it hard to argue that growth of the superannuation sector came at the expense of other types of financial intermediaries. The relative stability of members' contributions also helps to explain why superannuation has not yet had a noticeable effect on the level of private saving.

TABLE OF CONTENTS
1. Introduction
2. Growth of the Superannuation Sector
3. Superannuation and the Financial Sector
4. Superannuation and Aggregate Saving
5. Conclusions
Appendix: Data Sources
References
THE ROLE OF SUPERANNUATION IN THE FINANCIAL SECTOR AND IN AGGREGATE SAVING: A REVIEW OF RECENT TRENDS
Malcolm Edey, Robin Foster and Ian Macfarlane
1. INTRODUCTION
Assets held by superannuation funds grew during the 1980s at annual rates averaging about 20 per cent, making this the fastest-growing of the major components of household wealth. Several factors contributed to this rapid growth, the most important of which was probably the high rate of earnings on superannuation funds during the decade. The sector was also influenced by a number of regulatory changes, including two major sets of changes to the taxation arrangements (in 1983 and 1988) and the move to award-based superannuation following the 1986 National Wage Case. The net result of all these factors was that superannuation assets were rising not only at a much faster rate than incomes, but were also growing relative to the assets of the financial system as a whole, notwithstanding the rapid expansion of financial intermediaries' balance sheets during the decade. At the same time, it is widely recognised that the growth of superannuation did not lead to a rise in the private sector's saving rate.
These developments have prompted a lot of discussion about two sets of issues: the likely long-term effect of superannuation on private saving, and the effect which the growth in relative importance of superannuation might have on other parts of the financial system. This paper does not try to address these questions directly, but attempts the more basic task of setting out a detailed factual background to the issues. It does so by reviewing, first, the growth of the superannuation sector and its causes; secondly, the role of superannuation in the financial sector as a whole; and thirdly, the relationship between superannuation and aggregate saving.
2. GROWTH OF THE SUPERANNUATION SECTOR
Historical data on superannuation are subject to a considerable amount of imprecision due to the very large number of small funds not adequately covered by data collections~, and the difficulty of avoiding double counting of funds' assets. The latter problem arises from the widespread practice of funds having part of their portfolios managed by other funds. In studying longer-term trends in this form of saving there is a strong case for ignoring distinctions between superannuation and life assurance. National accounts and flow-of-funds estimates have normally combined the two because of their conceptual similarity, and because of the difficulty of separating out that part of life offices' business that relates to superannuation. Clearly a significant part of the growth in superannuation has been at the expense of more traditional life assurance business, and for the most part this paper treats the two together (with the exception of the next paragraph).
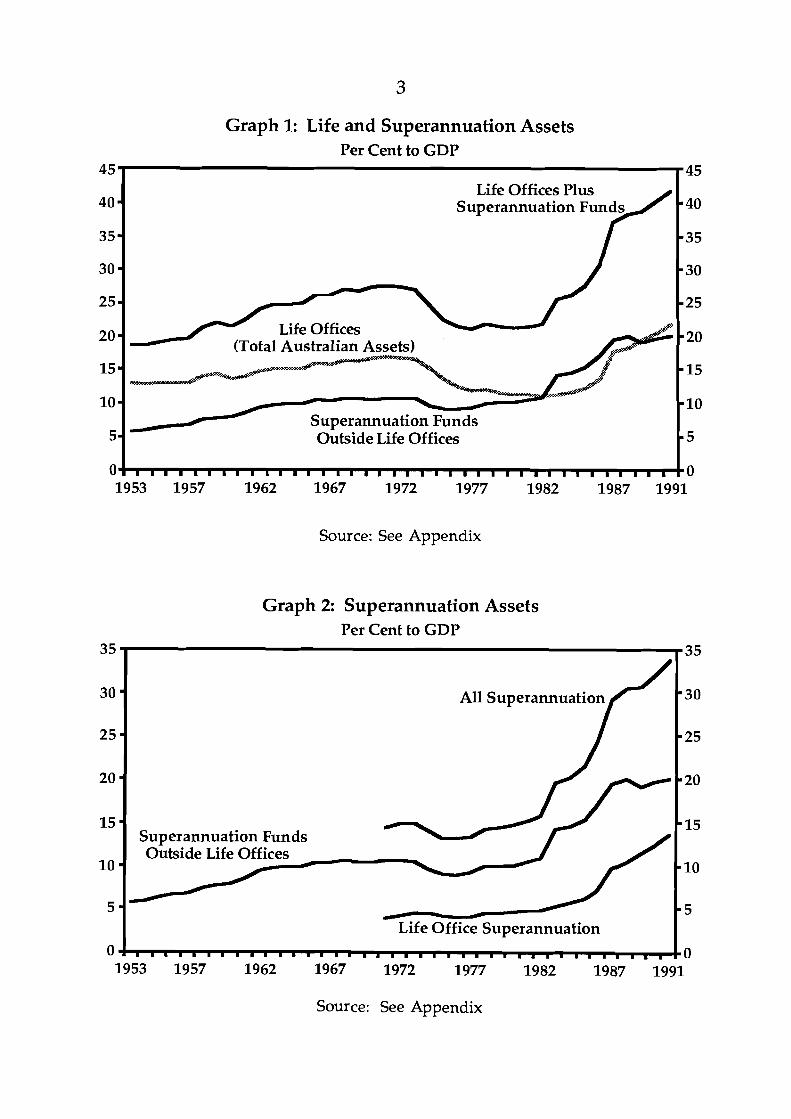
Graph 1 shows that by 1991 the total assets of superannuation and life office businesses amounted to 42 per cent of GDP ($160 billion). Currently, these assets are divided about equally between funds administered by life offices and others. The latter include those administered by banks, merchant banks and other specialist managers, as well as separately constituted funds (for example, company funds). Assets associated with the life offices' "ordinary business" have fallen from around 13 per cent of GDP in the early 1970s to around 8 per cent in 1991. Superannuation narrowly-defined has therefore grown more rapidly than the broader aggregate (Graph 2).
1 There are currently over 100,000 superannuation funds in Australia, many of them with only one or two members.
Source: See Appendix
Graph 1: Life and Superannuation Assets Per Cent to GDP
Graph 2: Superannuation Assets Per Cent to GDP
45
40
35 - 30 - 25 - 20 =
15
10 - 5-
0
3 5 3 5
30 = All Superannuation
25 - 20 =
15 - Superannuation Funds
10 =
5 - Life Office Superannuation
0 1 1 l . . . . 1 . 1 1 . . . 1 . . . 1 l l l l l l l . I . I l , l I l l . l 0 1953 1957 1962 1967 1972 1977 1982 1987 1991
Source: See Appendix
1953 1957 1962 1967 1972 1977 1982 1987 1991
Life Offices Plus
I I I I I I I I I I I I I I I I I I I I I I . I I I I I I I I I I I I I I I
45
40
- 35 - 30 - 25 20
= 15
- 10 - 5 0
To some extent the available data may overstate growth of superannuation during the 1980s because of the increasing number of private sector funds brought into the data collections*, and because there has been an increasing tendency during the 1980s for funds to value their assets at market prices rather than historical cost. On the other hand, exclusion of unfunded public sector schemes would contribute to some understatement of the size of superannuation throughout the period. It has been estimated, for example, that the Commonwealth Superannuation Scheme has unfunded liabilities of about $33 billion3, and various State government schemes also have significant unfunded liabilities, thought to be at least as large.
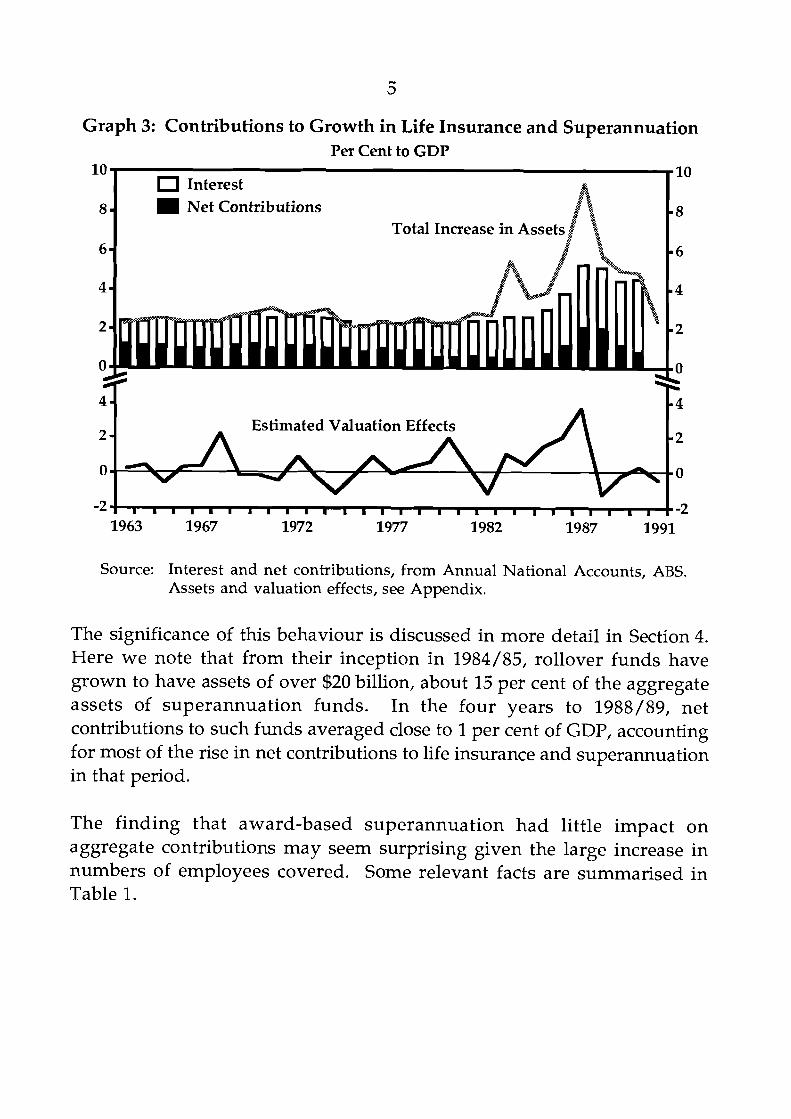
Major contributions to the growth of life insurance and superannuation assets are shown in Graph 3. Given the large swings that have occurred in total assets (relative to GDP), there has been surprisingly little variation in net contributions by members. These fell during the 1970s, following tightening of the very favourable taxation arrangements under which employee contributions had been tax deductible. The level of contributions picked up again during the middle of the 1980s. Although this pick-up occurred at around the time of the move to award-based superannuation, it seems to have been mainly due to something entirely different - the growth of "rollover" funds following the 1983/84 tax changes. These seem to have had the effect of retaining funds in the superannuation system for longer than would otherwise have been the case, thus bringing a temporary increase in net contributions as net outflows were slowed.
2 Major breaks in coverage occurred in 1983 and 1987. 3 Commonwealth Superannuation Scheme: A report on long-term costs by the Australian Government Actuary, May 1990.
Graph 3: Contributions to Growth in Life Insurance and Superannuation Per Cent to GDP
Net Contributions Total Increase in Asset
Estimated Valuation Effects
1963 1967 1972 1977 1982 1987 1991
Source: Interest and net contributions, from Annual National Accounts, ABS. Assets and valuation effects, see Appendix.
The significance of this behaviour is discussed in more detail in Section 4. Here we note that from their inception in 1984/85, rollover funds have grown to have assets of over $20 billion, about 15 per cent of the aggregate assets of superannuation funds. In the four years to 1988/89, net contributions to such funds averaged close to 1 per cent of GDP, accounting for most of the rise in net contributions to life insurance and superannuation in that period.
The finding that award-based superannuation had little impact on aggregate contributions may seem surprising given the large increase in numbers of employees covered. Some relevant facts are summarised in Table 1.
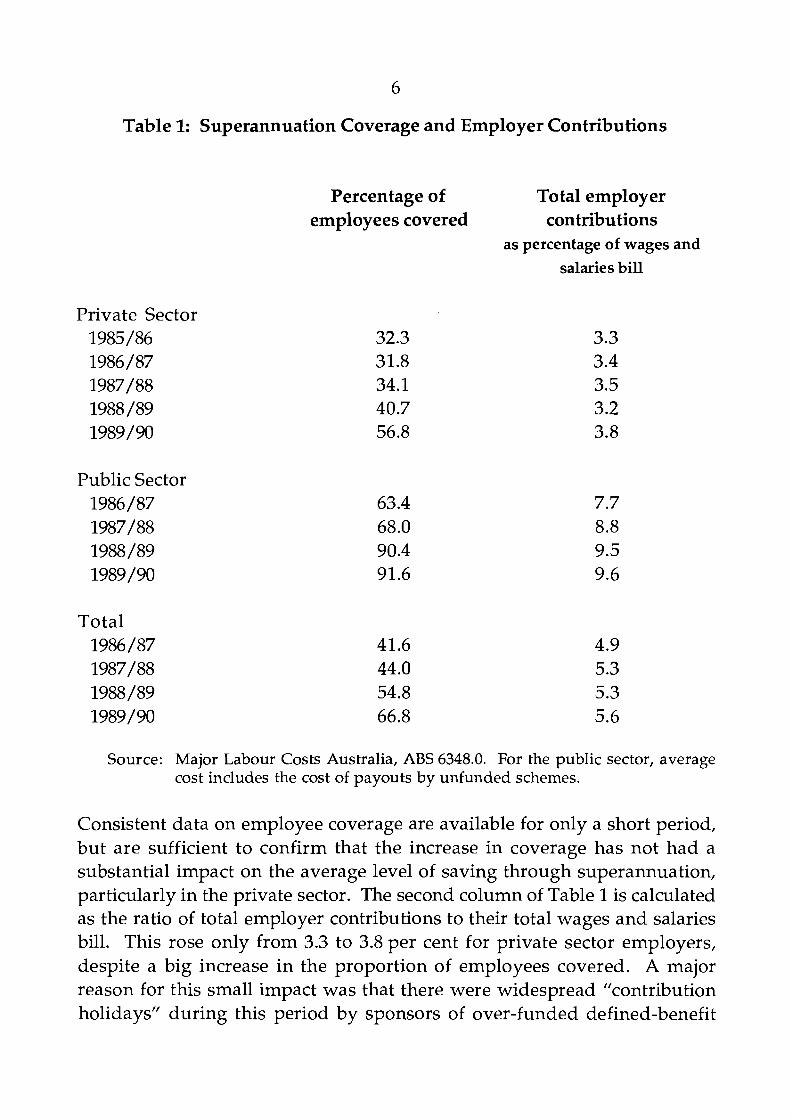
Table 1: Superannuation Coverage and Employer Contributions
Percentage of Total employer employees covered contributions
as percentage of wages and salaries bill
Private Sector 1985/86 1986/87 1987/88 1988 /89 1989/90
Public Sector 1986/87 1987/88 1988/89 1989/90
Total 1986/87 1987/88 1988/89 1989/90
Source: Major Labour Costs Australia, ABS 6348.0. For the public sector, average cost includes the cost of payouts by unfunded schemes.
Consistent data on employee coverage are available for only a short period, but are sufficient to confirm that the increase in coverage has not had a substantial impact on the average level of saving through superannuation, particularly in the private sector. The second column of Table 1 is calculated as the ratio of total employer contributions to their total wages and salaries bill. This rose only from 3.3 to 3.8 per cent for private sector employers, despite a big increase in the proportion of employees covered. A major reason for this small impact was that there were widespread "contribution holidays" during this period by sponsors of over-funded defined-benefit
schemes. High earnings rates enabled employers to reduce or suspend contributions to such schemes, and in some cases to withdraw surplus funds. Another factor is that there might have been some absorption of the 3 per cent award increase into existing superannuation arrangements in the private sector, even though the National Wage Case ruling stipulated that the increase was not to be abso:rbed.
It can be seen from a comparison of Graphs 1 and 3 that the fall in the ratio of superannuation assets to GDP in the 1970s was not a result of any fall-off in nominal asset growth, which continued steadily right through the decade. Rather, it was a result of the failure of asset growth to keep pace with inflation, which was itself mainly due to the fact that interest earnings did not rise sufficiently to maintain real returns. The fact that real interest rates were often negative in the 1970s (and that share prices did not regain their 1968 level until 1984) made it difficult for funds to continue growing in real terms.
The opposite situation occurred during the 1980s. The nominal interest earnings of funds rose considerably, to more than double those of the 1970s, while inflation fell. Rising asset prices also made a substantial contribution to growth, although to some extent the rise in book values of assets may have included belated recognition of asset price increases that had occurred during the 1970s. The residual gap between "contributions plus interest'' and the rise in total assets, shown in Graph 3, implicitly represents the contribution of capital gains to the growth of funds' total assets; this was consistently a major contributor to growth during the decade and in some years was the largest contributor.
As a consistency check on this conclusion, the lower panel of Graph 3 calculates one important component of capital gains by applying changes in the All-Ordinaries Index to funds' aggregate equity holdings at the beginning of each year. The correlation between this estimate and the residual estimate of capital gains is quite close for most of the 1980s, but not in the earlier decades when it was common for funds to value their assets at historical cost.
The data thus point to the conclusion that much of the historically observed variation in the size of the superannuation sector has been driven by
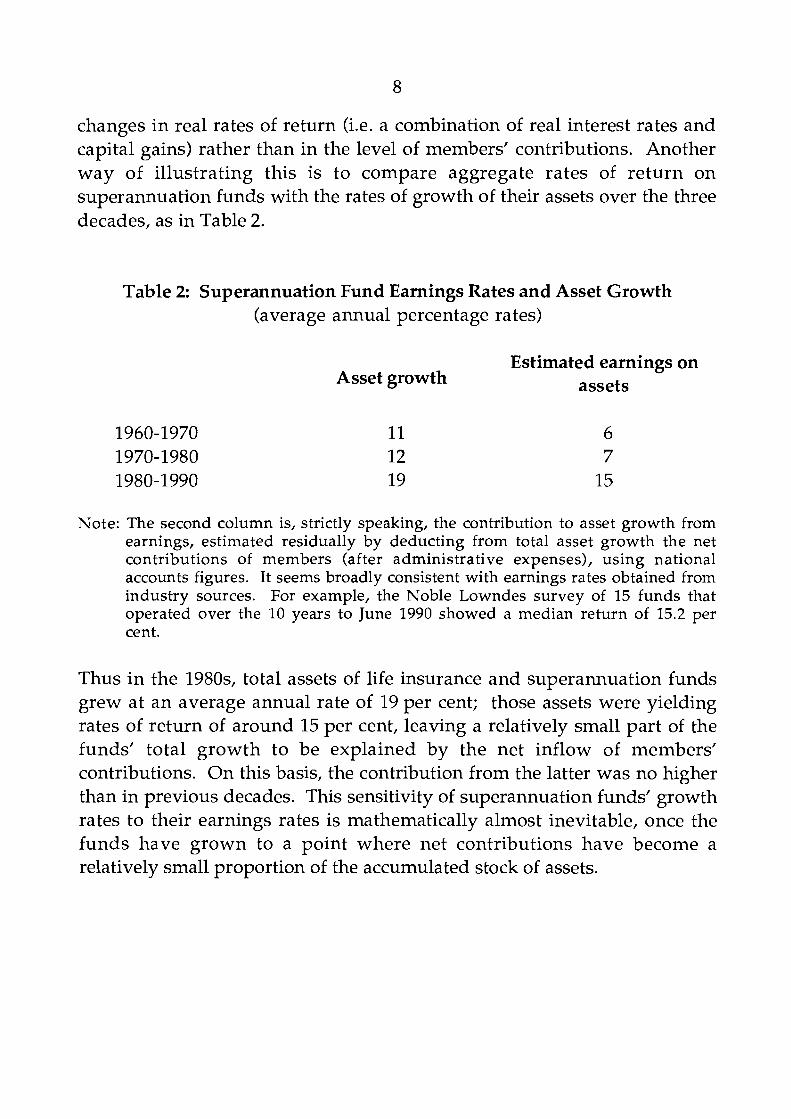
changes in real rates of return (i.e. a combination of real interest rates and capital gains) rather than in the level of members' contributions. Another way of illustrating this is to compare aggregate rates of return on superannuation funds with the rates of growth of their assets over the three decades, as in Table 2.
Table 2: Superannuation Fund Earnings Rates and Asset Growth (average annual percentage rates)
Estimated earnings on Asset growth assets
Note: The second column is, strictly speaking, the contribution to asset growth from earnings, estimated residually by deducting from total asset growth the net contributions of members (after administrative expenses), using national accounts figures. It seems broadly consistent with earnings rates obtained from industry sources. For example, the Noble Lowndes survey of 15 funds that operated over the 10 years to June 1990 showed a median return of 15.2 per cent.
Thus in the 1980s, total assets of life insurance and superannuation funds grew at an average annual rate of 19 per cent; those assets were yielding rates of return of around 15 per cent, leaving a relatively small part of the funds' total growth to be explained by the net inflow of members' contributions. On this basis, the contribution from the latter was no higher than in previous decades. This sensitivity of superannuation funds' growth rates to their earnings rates is mathematically almost inevitable, once the funds have grown to a point where net contributions have become a relatively small proportion of the accumulated stock of assets.
3. SLTPERANNUATION AND THE FINANCIAL SECTOR
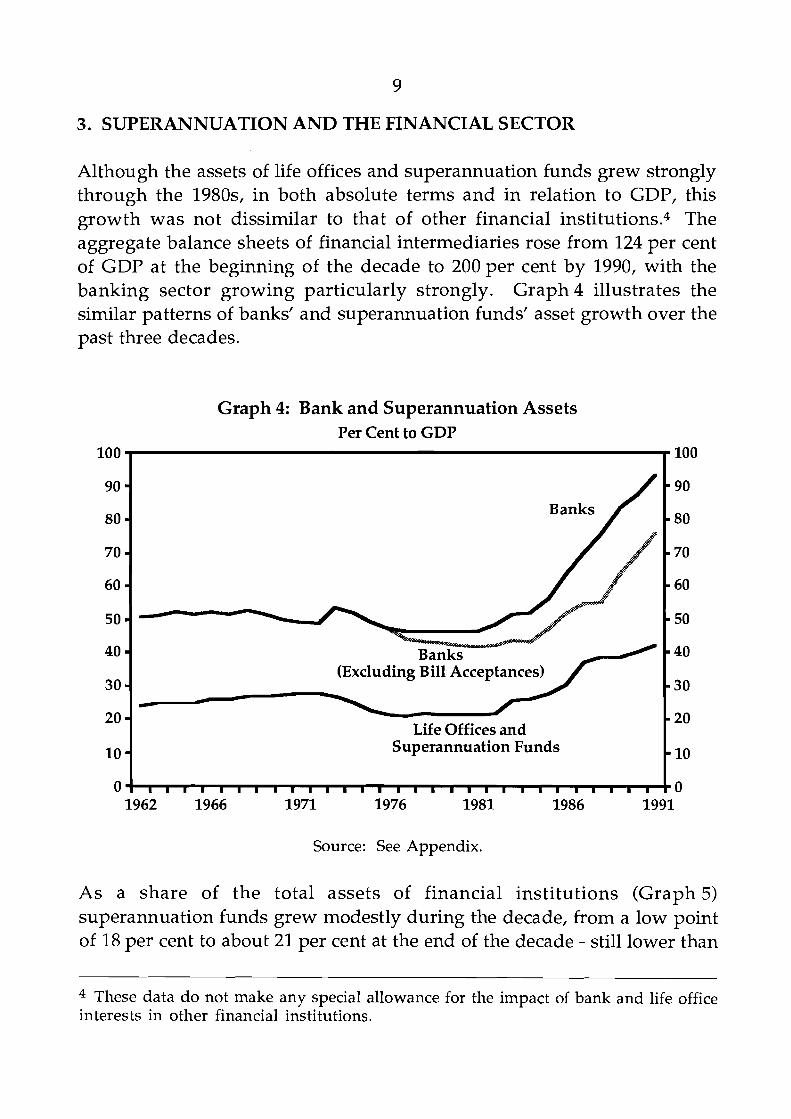
Although the assets of life offices and superannuation funds grew strongly through the 1980s, in both absolute terms and in relation to GDP, this growth was not dissimilar to that of other financial institutions.4 The aggregate balance sheets of financial intermediaries rose from 124 per cent of GDP at the beginning of the decade to 200 per cent by 1990, with the banking sector growing particularly strongly. Graph 4 illustrates the similar patterns of banks' and superannuation funds' asset growth over the past three decades.
Graph 4: Bank and Superannuation Assets Per Cent to GDP
Source: See Appendix.
As a share of the total assets of financial institutions (Graph 5) superannuation funds grew modestly during the decade, from a low point of 18 per cent to about 21 per cent at the end of the decade - still lower than
100
- 90 - 80 - 70 - 60 - 50 - 40 - 30 - 20 - 10 0
100
90 - 80 - 70 - 60 - 50
40 - 30 - 20 - 10 - 0
4 These data do not make any special allowance for the impact of bank and life office interests in other financial institutions.
Banks (Excluding Bill Acceptances)
Life Offices and Superannuation Funds
1 1 1 1 1 1 1 1 1 1 1 1 1 1 1 1 1 1 1 I I I I m I ~ I ~ I
1962 1966 1971 1976 1981 1986 1991
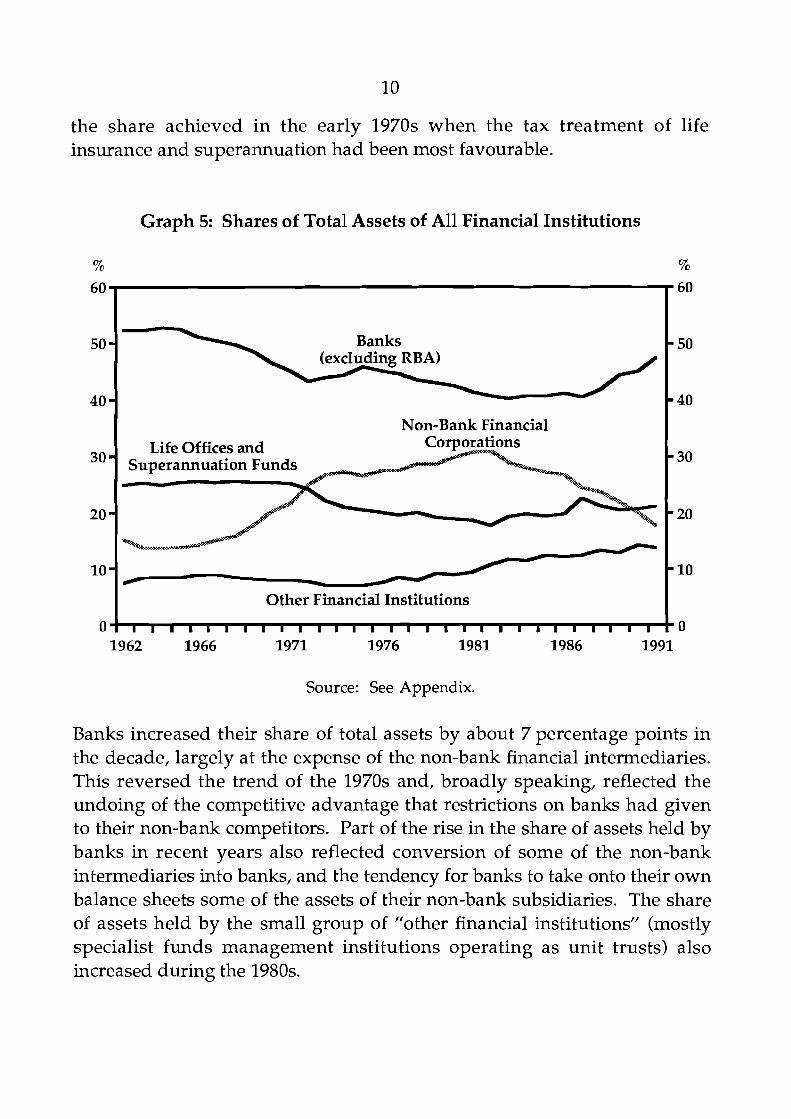
the share achieved in the early 1970s when the tax treatment of life insurance and superannuation had been most favourable.
Graph 5: Shares of Total Assets of All Financial Institutions
Source: See Appendix.
% %
Banks increased their share of total assets by about 7 percentage points in the decade, largely at the expense of the non-bank financial intermediaries. This reversed the trend of the 1970s and, broadly speaking, reflected the undoing of the competitive advantage that restrictions on banks had given to their non-bank competitors. Part of the rise in the share of assets held by banks in recent years also reflected conversion of some of the non-bank intermediaries into banks, and the tendency for banks to take onto their own balance sheets some of the assets of their non-bank subsidiaries. The share of assets held by the small group of "other financial institutions" (mostly specialist funds management institutions operating as unit trusts) also increased during the 1980s.
60
- 50
- 40
60
50 -
40 - Life Offices and - 30
- 20
- 10
Other Financial Institutions
0 l l l l l l l l l l l l l l l l l l l l l l l l l l l l l 0 1962 1966 1971 1976 1981 1986 1991
Non-Bank Financial

The parallel expansions in the balance sheets of superannuation funds and financial intermediaries in general, occurred for related reasons. It has been argued in Section 2 that the acceleration in growth of superannuation funds was largely a result of the increased rates of return earned by those funds - a combination of high real interest rates and rapidly rising asset prices. These latter phenomena were closely linked to the expansion of financial intermediaries' credit which occurred at the same time. Although it is hard to identify the "exogenous" disturbances which would fully explain all this behaviour, the 1980s were characterised by balance sheet growth more rapid than nominal GDP in each of the major sectors - the household as well as the corporate and financial sectors5 - and in that sense, the growth of superannuation and life offices was not unusual for the period.
Growth of superannuation has led some commentators to focus on the extent of competition between the superannuation sector and other financial intermediaries. On this issue, it is helpful to draw a distinction between the different types of markets in which these institutions compete for funds. At one end of the spectrum, banks offer deposits which come within statistical definitions of the money aggregates and which closely accord with the textbook functions of money. Monetary theory has traditionally emphasised that the demand for such assets is based on transactions requirements, and hence linked in aggregate to nominal income or spending.6
At the other end of the spectrum are assets and claims which are held as investments or as a store of long-term savings. In practice, of course, a range of assets is available to households, providing varying combinations of both characteristics. There would nonetheless seem to be a reasonably clear dividing line between superannuation funds, which are primarily concerned with longer-term savings, and other financial institutions, which primarily provide transactions balances and financial intermediation
5 For a general discussion of why the ratio of financial assets to GDP fell through the 50s, 60s and 70s, and then rose strongly in the 1980s, see Grenville (1991). For a discussion of credit growth and corporate behaviour during the 1980s, see Macfarlane (1989). Callen (1991) discusses household behaviour and presents estimates of the expansion of the household sector's aggregate balance sheet during the decade. 6 This literature is reviewed in Ostroy and Starr (1990).
services. Competition between these core areas of business is probably fairly limited because it is unlikely that households would consider the two types of assets to be close substitutes. Differences in household behaviour with respect to the two types of assets were noted by Dilnot (1990), in a study of the pattern of households' asset holdings. He found that significant differences in savings across income groups tended to be reflected in their holdings of superannuation assets, but not in their holdings of deposits. This was argued to be consistent with the need for households to maintain minimal transactions balances, while longer-term savings were held in superannuation funds or other assets. The exception was the very high income category of households, which did hold large deposit balances.
Differences in the core businesses of banks and superannuation funds are emphasised by looking at the differing balance sheet structures of the two sets of institutions. On the liabilities side, banks differ by being able to issue deposit instruments for which there is a well developed market, and hence to engage in more-or-less continuous liability management.7 On the other hand, balance sheets of life offices and superannuation funds effectively represent policyholders' equity, the size and growth of which is predominantly determined by the net inflow of contributions and the rate of earnings on their assets. Generally the borrowings of these funds are quite small, being limited by trust deeds and other regulatory requirements. This is not to say that these institutions don't compete for funds. They compete to raise their net contributions, often on the basis of their recent earnings records, and they can also compete for the increasingly important "discretionary" component of members' equity such as in rollover funds and insurance bonds. But they do not engage in liability management in the same sense as banks.
On the assets side, the major compositional difference is, of course, the importance of direct lending by banks, comprising more than 50 per cent of their total domestic assets, or 75 per cent if bill financing is included. Life and superannuation funds, by contrast, are relatively small direct lenders. Further details are provided in Graphs 6 and 7.
7 Banks have always had a reasonable degree of control over the asset side of their balance sheets but, as argued by Battellino and McMillan (1989), it was not until financial deregulation that they could manage the liabilities side as well, by effectively competing for funds at market rates.
Given their generally long-term focus, life and superannuation funds have traditionally held a significant proportion of their balance sheets in fixed assets (mostly property) and equities; together these account for about 40 per cent of total assets. It is only in the last few years that they have acquired significant holdings of assets overseas, now about 10 per cent of the aggregate portfolio. Like banks, life offices and superannuation funds have also held a substantial proportion of their assets in Commonwealth Government securities, and semi- and local government securities, although this has gradually declined over time with the removal of the 30/20 rule and the diminishing stock of CGS outstanding relative to GDP in recent years. Mortgage lending, once a substantial part of the balance sheets of life offices, has declined to very low levels.
The data in Graph 6 also show about a third of total life and superannuation fund assets categorised as "other". These "other" assets include deposits with financial institutions, holdings of bank bills and CDs, and loans to the public sector. Available data do not allow these asset holdings to be separately identified for life and superannuation funds as an aggregate, but recent data on superannuation funds outside life offices do provide a detailed breakdown of asset holdings for that group. Details are provided in Table 3.
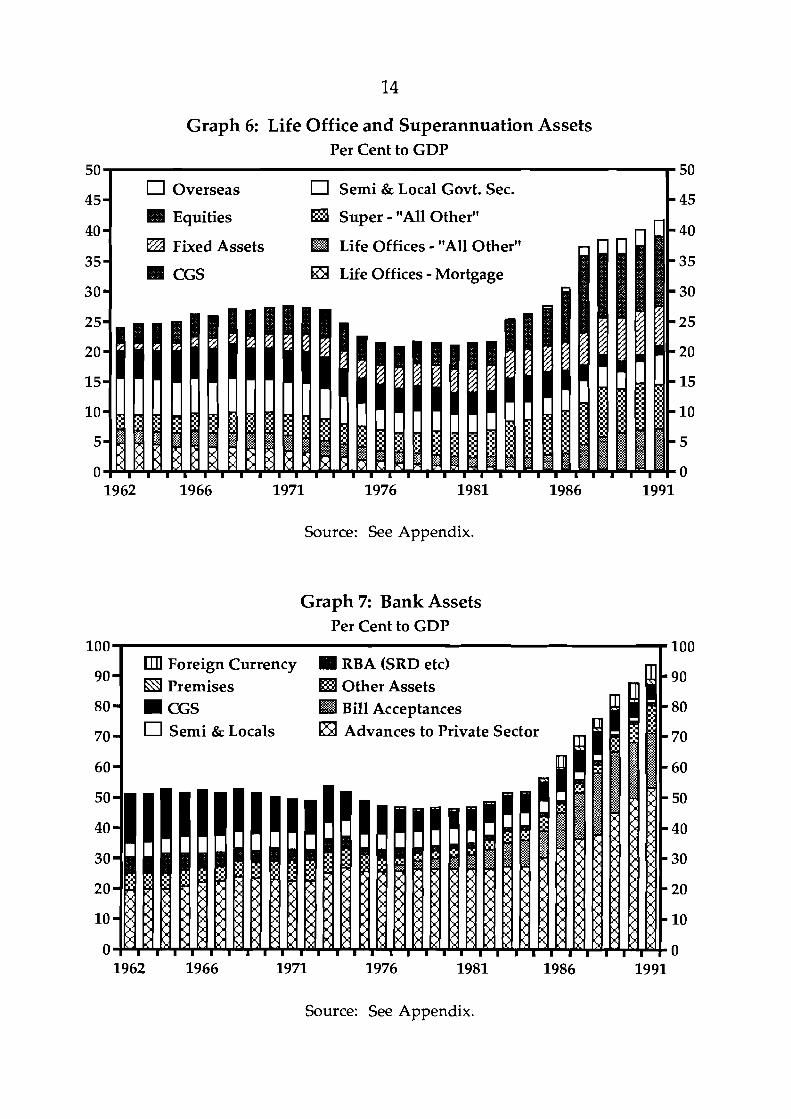
Graph 6: Life Office and Superannuation Assets Per Cent to GDP
4 5 Overseas
-v
I Fixed Assets
Semi & Local Govt. Sec.
Super - "All Other"
Life Offices - "All Other"
Life Offices - Mortgage
1962 1966 1971 1976 1981 1986 1991
Source: See Appendix.
Graph 7: Bank Assets Per Cent to GDP
i n n . . i n n A....
m] Foreign Currency W RBA (SRD etc) Other Assets 9 0
Bill Acceptances 80 Semi & Locals Advances to Private Sector 70
60
50
4 0
30
2 0
10
0 1962 1966 1971 1976 1981 1986 1991
Source: See Appendix.
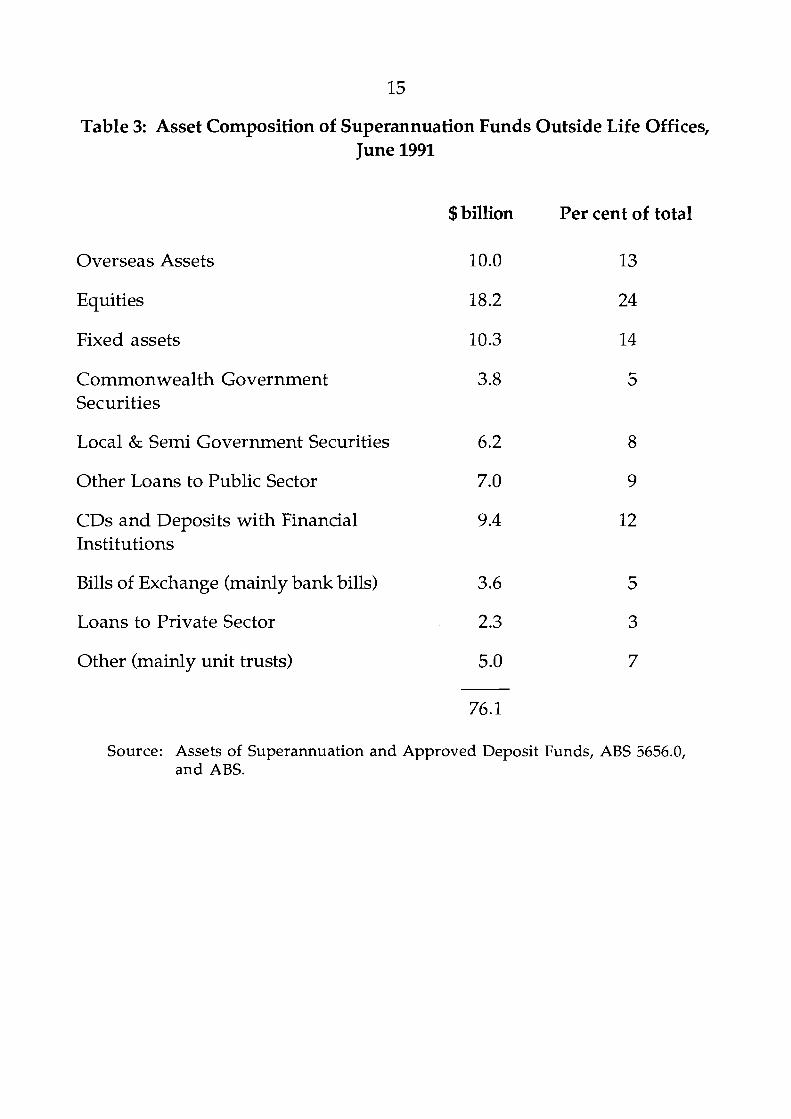
Table 3: Asset Composition of Superannuation Funds Outside Life Offices, June 1991
$ billion Per cent of total
Overseas Assets
Equities
Fixed assets
Commonwealth Government Securities
Local & Semi Government Securities
Other Loans to Public Sector
CDs and Deposits with Financial Institutions
Bills of Exchange (mainly bank bills)
Loans to Private Sector
Other (mainly unit trusts)
Source: Assets of Superannuation and Approved Deposit Funds, ABS 5656.0, and ABS.
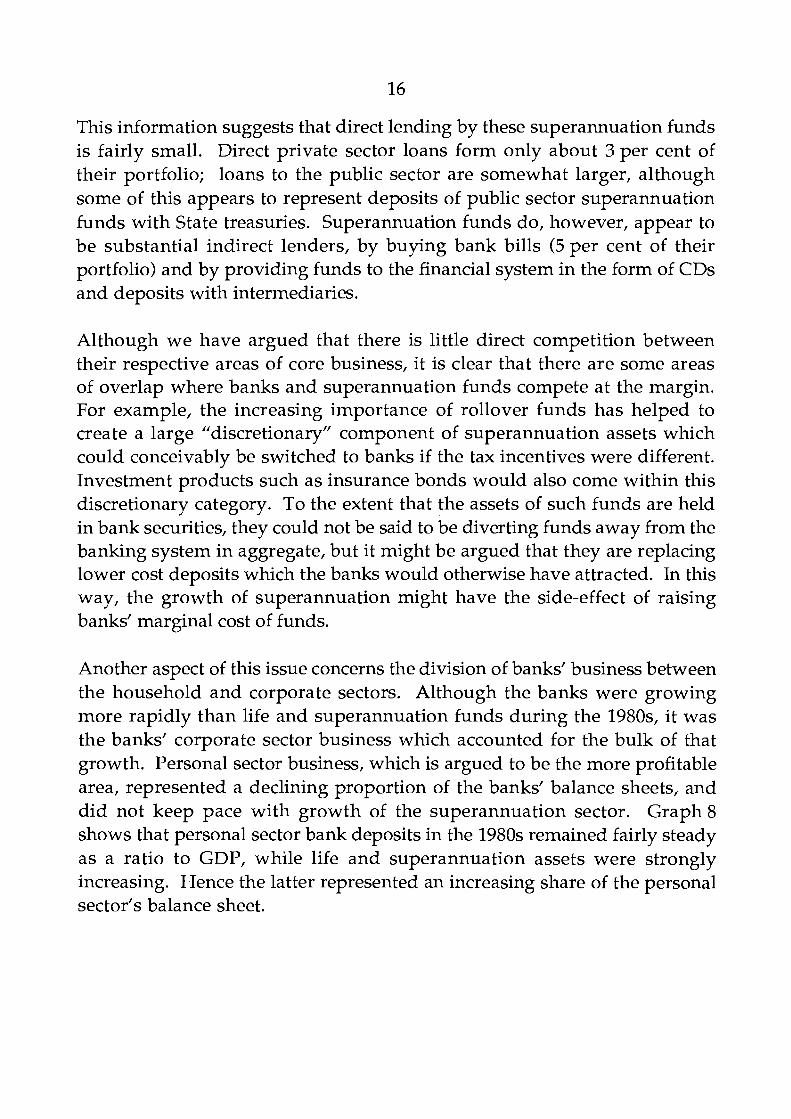
This information suggests that direct lending by these superannuation funds is fairly small. Direct private sector loans form only about 3 per cent of their portfolio; loans to the public sector are somewhat larger, although some of this appears to represent deposits of public sector superannuation funds with State treasuries. Superannuation funds do, however, appear to be substantial indirect lenders, by buying bank bills (5 per cent of their portfolio) and by providing funds to the financial system in the form of CDs and deposits with intermediaries.
Although we have argued that there is little direct competition between their respective areas of core business, it is clear that there are some areas of overlap where banks and superannuation funds compete at the margin. For example, the increasing importance of rollover funds has helped to create a large "discretionary" component of superannuation assets which could conceivably be switched to banks if the tax incentives were different. Investment products such as insurance bonds would also come within this discretionary category. To the extent that the assets of such funds are held in bank securities, they could not be said to be diverting funds away from the banking system in aggregate, but it might be argued that they are replacing lower cost deposits which the banks would otherwise have attracted. In this way, the growth of superannuation might have the side-effect of raising banks' marginal cost of funds.
Another aspect of this issue concerns the division of banks' business between the household and corporate sectors. Although the banks were growing more rapidly than life and superannuation funds during the 1980s, it was the banks' corporate sector business which accounted for the bulk of that growth. Personal sector business, which is argued to be the more profitable area, represented a declining proportion of the banks' balance sheets, and did not keep pace with growth of the superannuation sector. Graph 8 shows that personal sector bank deposits in the 1980s remained fairly steady as a ratio to GDP, while life and superannuation assets were strongly increasing. Hence the latter represented an increasing share of the personal sector's balance sheet.
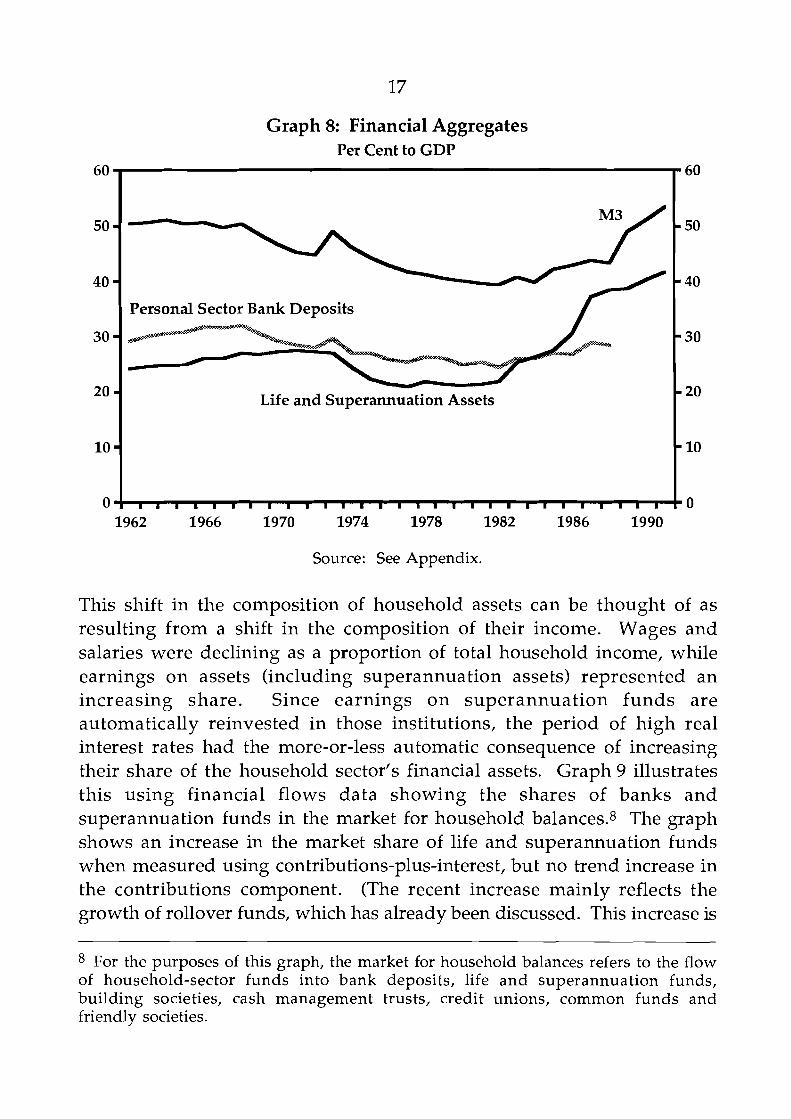
Graph 8: Financial Aggregates Per Cent to GDP
Source: See Appendix.
This shift in the composition of household assets can be thought of as resulting from a shift in the composition of their income. Wages and salaries were declining as a proportion of total household income, while earnings on assets (including superannuation assets) represented an increasing share. Since earnings on superannuation funds are automatically reinvested in those institutions, the period of high real interest rates had the more-or-less automatic consequence of increasing their share of the household sector's financial assets. Graph 9 illustrates this using financial flows data showing the shares of banks and superannuation funds in the market for household balances.8 The graph shows an increase in the market share of life and superannuation funds when measured using contributions-plus-interest, but no trend increase in the contributions component. (The recent increase mainly reflects the growth of rollover funds, which has already been discussed. This increase is
60
- 50
- 40
- 30
= 20
= 10
0
60
50 - 40 - 30 -
20 -
10 =
0
8 For the purposes of this graph, the market for household balances refers to the flow of household-sector funds into bank deposits, life and superannuation funds, building societies, cash management trusts, credit unions, common funds and friendly societies.
1962 1966 1970 1974 1978 1982 1986 1990
Personal Sector Bank Deposits
Life and Superannuation Assets
l t l I l l l t l l l l t B l l t l ~ l l I l l ~ 1 1 ~ I
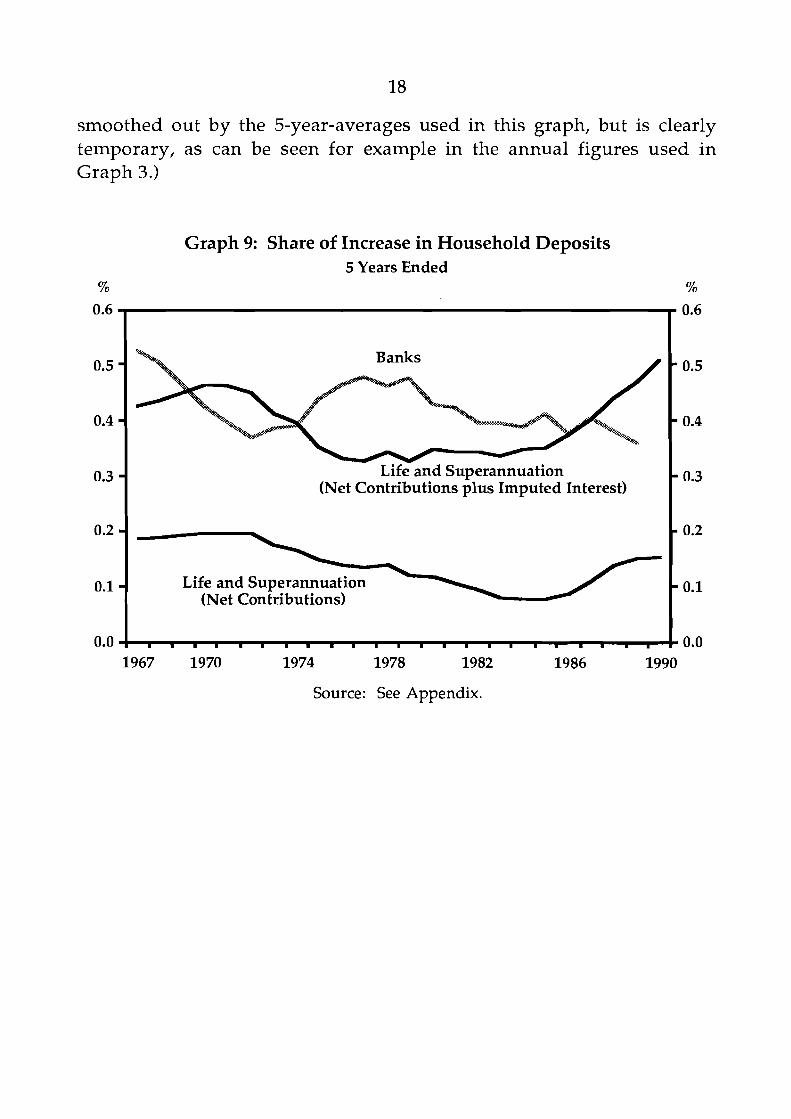
smoothed out by the 5-year-averages used in this graph, but is clearly temporary, as can be seen for example in the annual figures used in Graph 3.)
Graph 9: Share of Increase in Household Deposits 5 Years Ended
% %
Source: See Appendix.
I
m
m
m
m
I . . . l I . . . . I l . . . I I . . . l . I
Banks
Life and Superannuation (Net Contributions plus Imputed Interest)
Life and Superannuation (Net Contributions)
m
m
m
m
m
4. SLTPERANNUATION AND AGGREGATE SAVING
It is widely recognised that the growth of superannuation assets in the 1980s did not coincide with an increase in private saving rates. There is some dispute as to whether saving rates actually fell during the decade or merely remained steady, with conclusions differing depending upon which of a range of savings aggregates is looked at. The behaviour of the main alternative aggregates was reviewed in recent studies by Edey and Britten- Jones (1990) and by EPAC (1988). Generally speaking, the narrower measures, which exclude households' claims on corporate earnings from the definition of income, or which deduct estimates of depreciation from private income, tend to show falling saving rates over recent years; the broader measures favoured by Edey and Britten-Jones show saving rates having remained fairly flat, particularly when measured in inflation-adjusted terms.
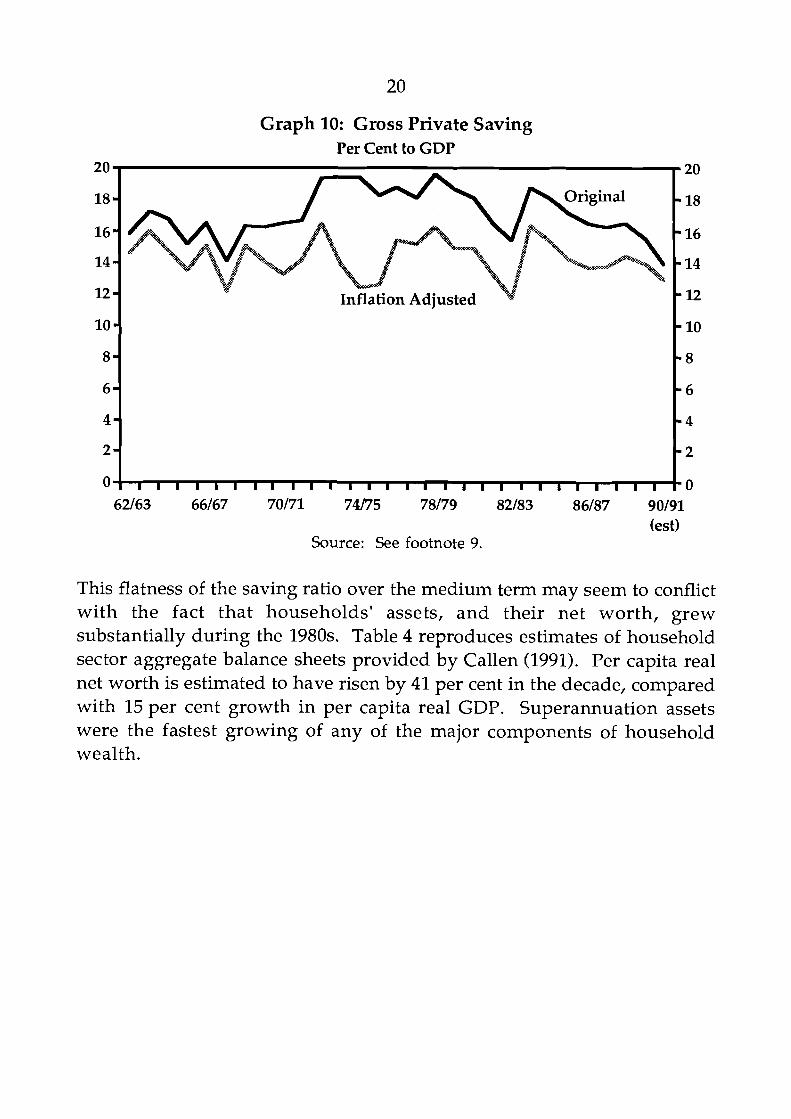
Their preferred measure, gross private sector saving adjusted for inflation, expressed as a ratio to GDP, is reproduced and updated in Graph 10.9 These updated estimates continue the pattern of earlier years, with saving rates appearing to fluctuate around their long-term average in accordance with fluctuations in national income. Broadly consistent with some form of consumption smoothing by households, the saving rate generally falls when income is below its trend and rises when it is above trend. There seems to have been no obvious tendency, on this measure, for the average saving rate to shift significantly between cycles.
9 The data sources and methods for this calculation are set out in Research Discussion Paper 9004, Reserve Bank of Australia.
Graph 10: Gross Private Saving Per Cent to GDP
62/63 66/67 70171 74/75 78/79 82/83 86/87 90/91 (est)
Source: See footnote 9.
This flatness of the saving ratio over the medium term may seem to conflict with the fact that households' assets, and their net worth, grew substantially during the 1980s. Table 4 reproduces estimates of household sector aggregate balance sheets provided by Callen (1991). Per capita real net worth is estimated to have risen by 41 per cent in the decade, compared with 15 per cent growth in per capita real GDP. Superannuation assets were the fastest growing of any of the major components of household wealth.
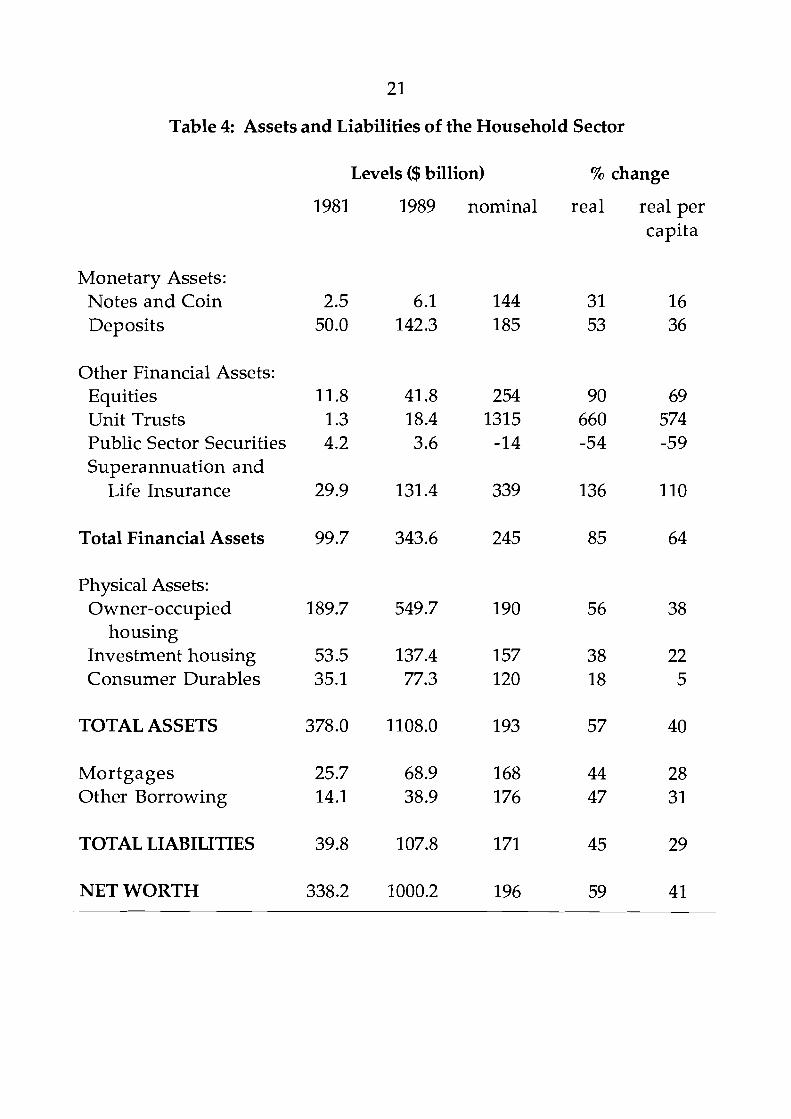
Table 4: Assets and Liabilities of the Household Sector
Levels ($ billion) % change
1981 1989 nominal real real per capita
Monetary Assets: Notes and Coin 2.5 6.1 144 31 16 Deposits 50.0 142.3 185 53 36
Other Financial Assets: Equities 11.8 41.8 254 90 69 Unit Trusts 1.3 18.4 1315 660 574 Public Sector Securities 4.2 3.6 -14 -54 -59 Superannuation and
Life Insurance 29.9 131.4 339 136 110
Total Financial Assets 99.7 343.6 245 85 64
Physical Assets: Owner-occupied 189.7 549.7 190 56 38
housing Investment housing 53.5 137.4 157 38 22 Consumer Durables 35.1 77.3 120 18 5
TOTAL ASSETS 378.0 1108.0 193 57 40
Mortgages 25.7 68.9 168 44 28 Other Borrowing 14.1 38.9 176 47 31
TOTAL LIABILITIES 39.8 107.8 171 45 29
NET WORTH 338.2 1000.2 196 59 41
There seem to be two main reasons why the rapid growth of households' superannuation assets did not lead to higher rates of private saving: one is largely definitional, and the other behavioural. The definitional reason is that a large part of the growth in superannuation assets was contributed by capital gains. Under national accounting conventions these do not count as income, and hence do not contribute to the recorded saving aggregates. A similar point could be made with respect to the effect of capital gains on owner-occupied housing. This definitional point partly explains why the household sector's net assets-to-income ratio could rise when their saving ratio did not?
The behavioural reason is concerned with the other major contributor to superannuation growth - the high real interest rates of the 1980s. While high real interest rates add to household income from one source (the return on their interest-bearing assets), they correspondingly detract from the after-interest income of debtor households and of the corporate sector. The income-effect on saving by these groups would therefore tend to offset the addition to saving achieved through reinvestment of superannuation funds' earnings. Indeed, a plausible case could be made that the net of all these effects is close to zero, given that the private sector's net interest income position is a relatively small proportion of their total income.11 This effect is reinforced, in the case of defined-benefit schemes, by the fact that high interest earnings can be offset by reduced employer contributions; the data presented in Section 2 suggest that this was an important effect in the second half of the 1980s.
These two sets of considerations suggest that changes in the growth of superannuation funds' assets, to the extent that they are due to changes in
10 Whether or not capital gains should be included in national accounting measures of income is a matter for debate. Eisner (1988) supported their inclusion, but theoretical arguments by Hayashi (1989) and others suggest that households do not respond to capital gains in the same way as they do to other forms of income. Some empirical support for this view is reviewed by Edey and Britten-Jones (1990). l1 The counterargument could perhaps be made that reinvestment of superannuation funds' earnings is a form of forced saving which cannot easily be offset by reducing saving elsewhere; hence the income effect of a change in interest rates on saving would be positive. However, empirical evidence reviewed by Edey and Britten-Jones shows little overall support for significant interest rate effects on saving. In a theoretical context, Summers (1981) makes a general case that net income effects on saving arising from changes in interest rates are likely to be small.

earning rates, are not likely to have a major impact on national saving aggregates. But the more fundamental question is whether or not aggregate saving is affected by changes in members' contributions. This is much harder to answer, because significant sustained shifts in contribution rates have not yet been observed. Overseas evidence reviewed by Stemp (1988) seemed to gve some support to the proposition, although the debate there is far from settled.12
In the Australian context, the argument essentially boils down to two sets of issues: the substitutability between superannuation and other forms of saving; and the effect of the superannuation system (including its interaction with other aspects of the retirement incomes system) on behaviour around retirement. The first question asks whether households offset rises in superannuation contributions by simultaneously reducing other forms of saving; the second asks whether they are likely to offset their current superannuation saving by reducing saving later in life.
On the first issue, there is generally thought to be some degree of substitutability between the different forms of saving, particularly for high income households. Provided this substitutability is less than perfect, an enforced increase in private contributions would raise the private sector's saving rate, particularly if it brings in low income earners who would not otherwise have saved. Unfortunately the experience with award superannuation in the late 1980s cannot easily be used as a test case for this proposition, because it has not yet produced a significant lift in net contributions.
The second issue, concerning saving by those close to retirement age, has been raised as a matter of concern in several studies.13 These have pointed out that the interaction of the income tax system with means-testing of age pensions, creates extremely high effective marginal tax rates for those at or near retirement. These high marginal tax rates apply both to income earned prior to retirement, and to the income yielded by assets accumulated as self-provision for retirement (with the exception of the family home).
12 Opposing views on this issue are propounded by Venti and Wise (1987) and by Gravelle (1991). 13 See for example Freebairn, Porter and Walsh (1988), Anstie and Freebairn (1989), Carmichael and Plowman (1985) and Podger (1986).
Particularly for those in the middle income range or below, this is argued to have the effect of discouraging labour force participation in the ages around retirement, and encouraging the decumulation of assets in order to qualify for the age pension. The effects are exacerbated by the still-favourable treatment given to lump-sum superannuation benefits, which facilitate the phenomenon of "double dipping".
Without going into the detailed arguments for or against these propositions, it can be seen that some of the more obvious facts do seem consistent with such effects. For example:
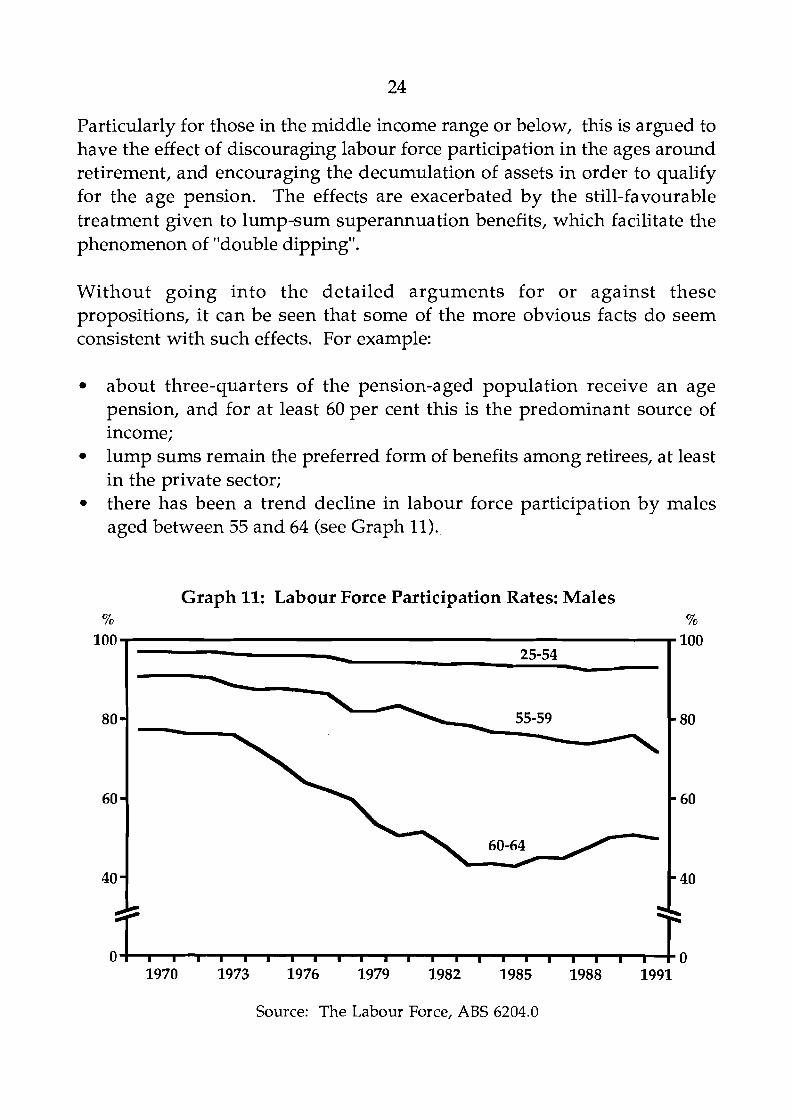
about three-quarters of the pension-aged population receive an age pension, and for at least 60 per cent this is the predominant source of income; lump sums remain the preferred form of benefits among retirees, at least in the private sector; there has been a trend decline in labour force participation by males aged between 55 and 64 (see Graph 11).
Graph 11: Labour Force Participation Rates: Males % %
Source: The Labour Force, ABS 6204.0
As further evidence of significant incentives to qualify for the age-pension, Anstie and Freebairn (1989) note the unusual distribution of non-home assets among pension-aged households. Using Department of Social Security statistics for 1988 they report that 73 per cent of this group had assets below $50,000, 22 per cent had assets above $155,000, and only 5 per cent fell within the large middle range. This was interpreted as being strongly suggestive of incentives to qualify for the age pension by reducing assets. On the basis of such behaviour it could plausibly be argued that higher current contributions by younger workers would, to a large extent, lead to higher dissaving by those workers when they approach retirement, unless other aspects of the tax and benefits systems are also changed.
The recent introduction of rollover funds, designed partly to retain lump sum payouts within the superannuation system, seems to have had only temporary success in restraining these outflows, as has already been noted in section 2. Available data on gross flows, presented in Graph 12, suggest that the growth of rollovers has been associated with substantially increased gross flows in both directions (since a lump sum withdrawn from one fund and placed in a rollover fund would count as both an outflow and an inflow to the system); but there has not been a sustained change in the net flows. Growth of insurance bonds also contributed to the increase in gross flows. The rise in gross flows suggests that, at the margin, funds in the superannuation system have become much more mobile or discretionary from the point of view of the household sector.
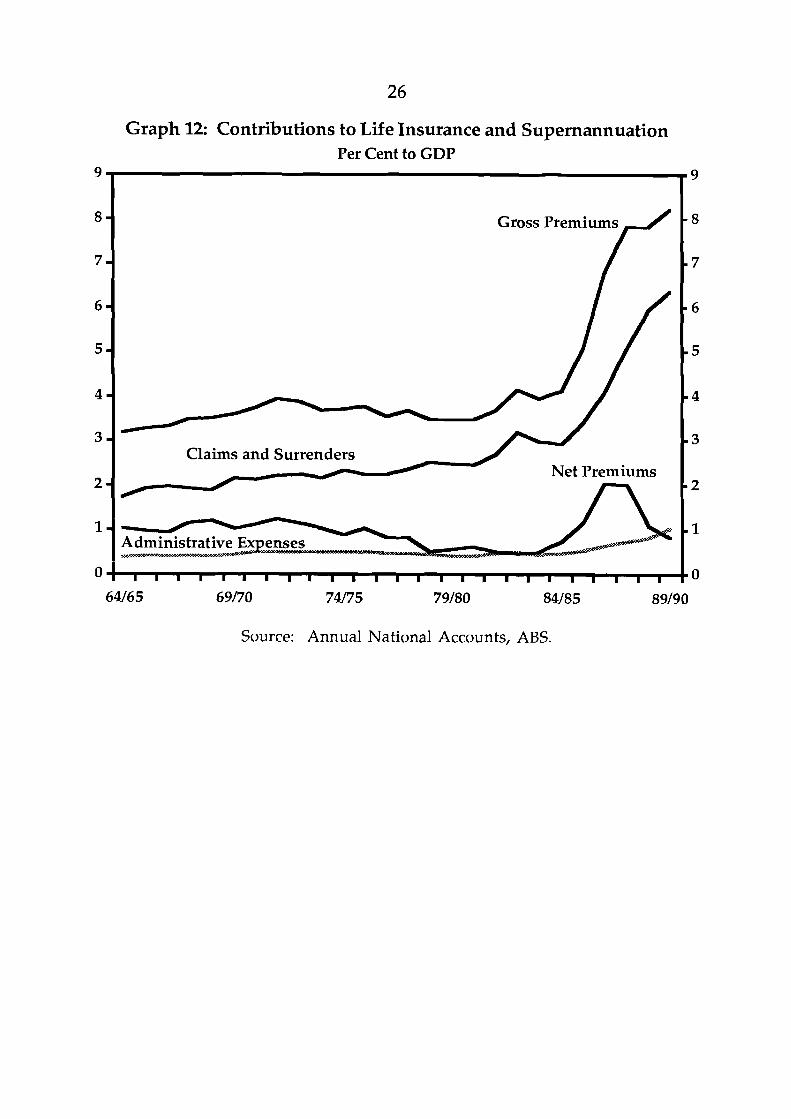
Graph 12: Contributions to Life Insurance and Supernannuation Per Cent to GDP
9
m Gross Premiums
m
I
m
m . Net Premiums
m
m
I I I I I I I I I I I I I I I I I I I I 1 I I I I
Source: Annual National Accounts, ABS.
5. CONCLUSIONS
The paper has argued that the implications of growth of the superannuation sector depend importantly on the sources of that growth. In the 1980s, most of the growth occurred through high earnings rates, rather than through a high level of net contributions by members. Indeed, most of the medium-term variation in growth of superannuation funds has come from variations in real rates of return.
This historical fact has a strong influence on the paper's conclusions about the implications of growth in superannuation for the financial sector and for aggregate saving. The fact that superannuation funds did not attract significant increases in contributions makes it hard to argue that their growth in the 1980s occurred at the expense of other financial institutions. However, superannuation funds did increase as a share of the household sector's holdings of financial assets, largely through the mechanical effect of reinvestment of funds' earnings at high real rates of interest. The paper argued that superannuation funds and financial intermediaries have largely been competing in different markets, although rollover and other discretionary funds have recently emerged as an area where the superannuation sector may be competing more directly with banks for funds. At the margin, this may have had the effect of increasing the banks' cost of funds by reducing a potential source of lower cost deposits.
The fact that high superannuation savings were largely a result of high real interest rates also helps to explain why aggregate savings did not increase when superannuation savings did. High real interest rates appear to have had little net effect on saving but, by redistributing income from debtors to creditors, increased that part of saving that was occurring through superannuation. The paper does not offer a strong view on whether or not a lift in member contributions would significantly raise private saving. The 1980s do not provide a good test case of this proposition because a sustained lift in aggregate contributions did not occur.
APPENDIX: DATA SOURCES
Unless otherwise indicated, all flow data are on a financial year basis, and stock data are as at end financial year.
1. Asset levels
(a) Life offices
The original data source for total assets, and components, is the Quarter ly Statistical Bullet in (Appendices H and J), published by the Insurance and Superannuation Commission. These are reproduced in a more aggregated form in the Reserve Bank of Australia Bullet in (Table C.15) and Occasional Paper 8 (Table 3.15).
Life offices total "Superannuation assets" are available from June 1989, from "Assets of superannuation and approved deposit funds" (ABS Cat. no. 5656). Data for earlier years are estimated by apportioning changes in life offices' total Australian assets on the basis of smoothed changes in the share of the "Balance of Revenue account" accounted for by "superannuation" business. The latter are obtained from ISC annual reports.
(b) Superannuation funds outside life offices
From June 1988, total assets for these funds are obtained from "Assets of superannuation and approved deposit funds" (ABS Cat. no. 5656). Earlier data are derived from Reserve Bank financial flow estimates reproduced in Occas ional Paper 8 (Table 3.16). Major breaks occur in 1983, due to increased coverage of private funds, and in 1987, prior to the introduction of the new ABS survey.
(C) Banks
Total banking sector assets are published in Reserve Bank of Australia Bul l e t i n , (Table B.l, D.3) and Occasional Paper 8 (Tables 3.7, 3.8 and 3.9). Personal sector deposits are defined as the sum of Savings Bank deposits

and personal deposits with Major Trading Banks. The latter are obtained from the half-yearly classification of deposits by industry, last published as Table D.10, Reserve Bank of Australia Bulletin, November 1988.
(d) Other financial institutions
Total assets of other financial institutions, and of the financial sector as a whole, are published in Reserve Bank of Australia Bulletin, (Table D.5) and Occasional Paper 8 (Table 3.4).
2. "Rollover" funds
Asset levels are obtained from TPF&C ADFIAnnuity League Table. Net contributions to such funds are estimated as the change in assets less assumed earnings; earnings are assumed to accrue at a rate equal to the peld on three month bank bills.
3. Valuation effects
Equity valuation effects in Graph 3 are estimated as the change in the ASE "All Ordinaries" index over the year multiplied by the value of shares held at the beginning of that year. The latter are obtained from the sources listed under l(a) and l(b) above.
4. Household financial assets
Market shares shown in Graph 9 are calculated as shares of the increase in total household financial balances. The figures are 5-year averages, and the total market for household balances is defined as the sum of household financial balances with banks, life and superannuation funds, building societies, cash management trusts, credit unions, common funds and friendly societies. These figures are comparable with those in the Financial Flow Estimates (Reserve Bank Bulletin, November 1989).
REFERENCES
Anstie, R. and J. Freebairn (19891, "Retirement Incomes Policy", presented at the Economic Society of Australia Annual Conference, University of Adelaide, 10-13 July 1989.
Battellino, R. and N. McMillan (19891, "Changes in the Behaviour of Banks and their Implications for Financial Aggregates", in Studies in Money and Credit, Reserve Bank of Australia, 1989.
Callen, T. (19911, "The Balance Sheet of the Household Sector in the 1980~"~ Reserve Bank of Australia Bulletin, November 1991.
Carmichael, J. and K. Plowman (19851, "Income Provision in Old Age", Australian Economic Review, 3/1985.
Dilnot, A.W. (19901, "The Distribution and Composition of Personal Sector Wealth in Australia", Australian Economic Review, 1/1990.
Economic Planning Advisory Council (19881, "Trends in Private Saving", Council Paper No. 36, December 1988.
Edey, M.L. and M. Britten-Jones (19901, "Saving and Investment", in The Australian Macro-economy in the 1980s, Reserve Bank of Australia, 1990.
Eisner, R. (19881, "Extended Accounts for National Income and Product", Journal of Economic Literature, 1988.
Freebairn, J., M. Porter and C. Walsh (19881, Spending and Taxing: Australian Reform Options, Allen and Unwin, Sydney, 1988.
Gravelle, J.G. (19911, "Do Individual Retirement Accounts Increase Savings?", Journal of Economic Perspectives, Spring 1991.
Grenville, S.A. (19911, "The Evolution of Financial Deregulation", in The Deregulation of Financial Intermediaries, Reserve Bank of Australia, 1991.
Hayashi, F. (1989), "Is Japan's Saving Rate High?", Federal Reserve Bank of Minneapolis Quarterly Review, Spring 1989.
Macfarlane, I.J. (1989), "Money, Credit and the Demand for Debt", Reserve Bank of Australia Bulletin, May 1989.
Ostroy, J.M. and R.M. Starr (1990), "The Transactions Role of Money" in Handbook of Monetary Economics, edited by B.M. Friedman and F.H. Hahn, North Holland, 1990.
Podger, A.S. (1986), "The Economics of Superannuation", Australian Economic Review, 3/1986.
Stemp, P.J. (1988), "Tax Concessions for Occupational Superannuation: Implications for Aggregate Saving", Discussion Paper No. 185, Centre for Economic Policy Research, Australian National University, January 1988.
Summers, L.H. (1981), "Capital Taxation and Accumulation in a Life-Cycle Growth Model", American Economic Review, 1981.
Venti, S.F. and D.A. Wise (1987), "Have IRAs Increased U.S. Saving?: Evidence from Consumer Expenditure Surveys", NBER Discussion Paper 2217, April 1987.