The role of sediments in the fate of microcystins in ... · guidance in sample analysis methods in...
140
The role of sediments in the fate of microcystins in aquatic systems Haihong Song B. Sc. North China Electric Power University M. Sc. National Sun Yat-Sen University China This thesis is presented for the degree of Doctor of Philosophy of The University of Western Australia School of Civil, Environmental and Mining Engineering 2015
Transcript of The role of sediments in the fate of microcystins in ... · guidance in sample analysis methods in...

The role of sediments in the fate of
microcystins in aquatic systems
Haihong Song B. Sc. North China Electric Power University
M. Sc. National Sun Yat-Sen University China
This thesis is presented for the degree of Doctor of Philosophy
of The University of Western Australia
School of Civil, Environmental and Mining Engineering
2015


i
Abstract Microcystins, potent toxins produced by cyanobacteria, occur widely in aquatic
systems across the world, and are a known environmental and public health hazard.
Therefore, it is important to understand their fate in aquatic systems. As an important
component of aquatic systems, sediments play multiple roles in the distribution and
natural attenuation of microcystins. However, systematic studies identifying the effects
of environmental variables on the variability of microcystins in lake sediments are
lacking, and the contribution of sediments to the removal of these toxins in the water body
are not yet clear. Hence, this research aimed to: (a) investigate the variability of
microcystins in lake sediments; and (b) identify the relative contribution of the
biodegradation and adsorption ability of sediments to the removal of microcystins from
the water. As research into microcystins in lake sediments has been hindered by the lack
of an effective analysis method, a further aim of this study was to develop a method to
quantify these toxins in sediment samples using supercritical carbon dioxide.
The first part of this research involved a field study, analysing microcystin
concentrations in lake sediments and their correlation with environmental variables.
Microcystins were detected in all sediment samples, even at one of the sampling sites
with negligible cyanobacterial biomass present in the water. The concentration of these
toxins in lake sediments had a weak, but significant correlation with intracellular
microcystins, total microcystins and cyanobacterial biomass in the water. Furthermore,
their variability of in lake sediments could be explained by a combination of total
microcystins in the water, cyanobacterial biomass in the water, pH and temperature.
In the second part of this research, changes in the concentration of microcystin-LR
(MCLR) in the water in the presence of sediments were quantified in a laboratory
experiment. The results of this experiment showed that each time MCLR was added to
sterile lake water in the presence of sediments, MCLR concentration decreased
ii
significantly following an exponential decay curve, with no observed lag phase.
Comparison between different treatment conditions implied that the adsorption and
biodegradation ability of sediments caused the MCLR removal and that biodegradation
was the dominant mechanism.
The final part of this research investigated the use of supercritical carbon dioxide in
quantifying microcystins in sediment samples. A protocol was developed which included
the optimisation of extraction conditions using supercritical carbon dioxide. This protocol
was use to quantify microcystin concentrations in natural field samples. The results
showed that for sediment samples with added MCLR, the conventional method recovered
more spiked MCLR but fewer microcystin variants. In contrast, supercritical carbon
dioxide with water as modifier extracted a higher amount of total microcystins.
Overall, this research highlights the wide occurrence of microcystins in the sediments
of the studied lake, and the biodegradation ability of sediments to remove microcystins
quantitatively from the water. This study suggests that researchers and water management
authorities should include sediments when assessing the potential hazards and fate of
microcystins in aquatic systems.

iii
Acknowledgements Foremost, I thank Professor Anas Ghadouani and Assistant Professor Elke Reichwaldt
for their supervision. Their scientific guidance, ongoing encouragement and continued
enthusiasm made this research possible. I also express my appreciation to the China
Scholarship Council and The University of Western Australia (UWA) for awarding me
scholarships that made this PhD study possible. My sincere thanks to UWA for providing
an excellent learning environment and research facilities.
I sincerely thank Dr Brad Berven and Professor George Koutsantonis for generously
sharing the Supercritical Fluid Extractor with me and patiently training me to use it.
Thank you to Dianne Krikke at the Environmental Research Laboratory for her technical
support of my laboratory work; to Som Cit Si Nang and Dani Barrington for their
guidance in sample analysis methods in the laboratory; to Weiyi Wang, Azra Daud, Liah
Coggins and Elke Reichwaldt for their assistance during the field sampling. Thank to Drs
Krystyna Haq and Michael Azariadis for providing wonderful workshops on writing and
their support during my writing journey; and to Laura Firth, Kevin Murray and Robin
Miline from UWA Centre for Applied Statistics for their valuable statistical advice; to Dr
Kristin Argall of Wordthreads Editing for providing editing services according to the
Institute for Professional Editors’ Guidelines for Editing Research Theses. My special
thanks go to the staff in the UWA Student Support Services Center for providing stress
management strategies during the writing process. Many thanks go to my fellow
colleagues in SESE for their scientific support and friendship.
Most importantly, I would like to thank my family, especially my beloved husband
Weiyi Wang, for their unconditional love and support. They are always the rock of my
life.

iv
State of candidate contribution
DECLARATION FOR THESIS CONTAINING PUBLISHED WORK AND/OR WORK
PREPARED FOR PUBLICATION
This work was the outcome of research completed during the course of my enrolment
for the degree of Doctor of Philosophy at the School of Civil, Environmental and Mining
Engineering, UWA. The main body of the thesis (Chapters 2–4) is a compilation of three
papers written for journal publication. Each chapter is a stand-alone manuscript,which
includes an abstract, an introduction, materials and methods, a presentation of results and
a discussion of results. The introductory Chapter 1 presents an overview of the basic
background, motivation and objectives of the study to provide a context for Chapters 2–
4. The major findings of this work and suggestions for future work are summarised in
Chapter 5.
Chapter 2, titled “The effects of environmental variables on the spatial and temporal
variability of microcystins in aquatic systems” by Haihong Song, Elke S. Reichwaldt,
Anas Ghadouani, is accepted by Toxins.
Chapter 3, titled “Contribution of sediments in the removal of microcystin-LR from the
water” by Haihong Song, Elke S. Reichwaldt, Anas Ghadouani, Toxicon,
10.1016/j.toxicon.2014.02.019.
Chapter 4, titled “Extraction of microcystins from lake sediments using supercritical
carbon dioxide” by Haihong Song, Brad Berven, Elke S. Reichwaldt, Anas Ghadouani,
is submitted to Toxins.
The material presented in this thesis reflects solely my original ideas and interpretations.
I completed all the work under the supervision of Professor Anas Ghadouani and
Assistant Professor Elke Reichwaldt. For Chapter 4, Dr. Brad Berven provided training

v
for the use of supercritical fluid extractor and the methodology to identify the extracted
chemicals suspected to be microcystin variants.
Student signature
_______________
Coordinating supervisor signature
________________
Co-supervisor signature
________________

vi
Contents
Abstract……………………………………………………………….…………………i
Acknowledgements………………………………………………………………….…iii
State of candidate contribution………………………………………………………..iv
Contents………………………………………………………………………...…........vi
List of abbreviations………………………………………………………...………....ix
List of figures…………………………………………………………………………...xi
List of tables……………………………………………………………………....…..xiii
Publications arising from this thesis…………………………………………………xiv
Conference presentations arising from this thesis……………………..……………xv
Chapter 1. Introduction……………………………………………….……………1
1.1 Background………………………………………………………………..…….3
1.2 Cyanobacteria and cyanobacterial blooms………………….…………………...5
1.3 Cyanobacterial toxins …………………….………………………………..........8
1.4 Microcystins……………………………………………………………………10
1.5 Sediments………………………………………..……………………………..11
1.6 Fate of microcystins in aquatic systems…….……………………….…………13
1.6.1 Microcystin occurrence in aquatic systems……………………………………13
1.6.2 Biodegradation of microcystins…………………….……………………….....14
1.6.3 Adsorption of microcystins to sediments……………………………...……….16
1.7 Microcystins in the sediments ………………………………………………….19
1.7.1 Occurrences of microcystins in the sediments………………………………….19
1.7.2 Factors affecting the occurrence of microcystins in sediments……………..…21
1.7.3 Analysis of microcystins in lake sediments………………………...………….22
1.8 Research aims and hypothesises………………………..………………………26
1.9 Thesis overview……………………………………….………………………..31
Chapter 2. The effects of environmental variables on the spatial and temporal
variability of microcystins in the sediments…………………………....33
2.1 Abstract……………………………..…………………………………………..35
2.2 Introduction…………………………………………………………………….36
2.3 Materials and methods………………………………….………………………39
2.3.1 Study site………………………………………………………………..….…..39
2.3.2 Sampling and sample analyses…………………………………………………40

vii
2.4 Results………………………………………………………………………….46
2.4.1 Temporal and spatial variability of microcystin concentration in sediments….46
2.4.2 Temporal and spatial variability of environmental variables……..…………...49
2.4.3 Correlation between microcystins in the sediments and environmental
variables…………………………………………………..…………………….50
2.4.4 Prediction of microcystin concentrations in sediments from environmental
variables………………………………………………………………...………51
2.5 Discussion………………………………………………………………………52
2.6 Acknowledgements…………………………………………………..………...56
Chapter 3. Contribution of sediments in the removal of microcystin-LR from the
water……………………………………………………………………....57
3.1 Abstract…………………………………………………………………………59
3.2 Introduction…………………………………...………………………………..60
3.3 Material and methods…………………………………………………………..62
3.3.1 Experimental design…………………………………………………………...62
3.3.2 Sampling…………………………………….……………..………………......64
3.3.3 Experimental set-up……………………………………………….……..…….64
3.3.4 Sediment analysis……………….…………………..…..……………………..65
3.3.5 MCLR analysis………..……………………………….……………….……...66
3.3.6 Data analysis…………………………………………………...……………....66
3.4 Results…………………………………...……………………………………..67
3.4.1 Overall contribution of sediments to the removal of MCLR from the
water……………………………………………………………..…………....67
3.4.2 Adsorption ability versus biodegradation ability of sediments……….……….70
3.4.3 Contribution of water versus contribution of sediment to the removal of MCLR
from water…………………………………….………………………..…….70
3.5 Discussion…………………….……………………………..………….….….71
3.6 Acknowledgements…………………………………………………………….74
Chapter 4. Extraction of microcystins from lake sediments using supercritical
carbon dioxide…………………………………….………………….…75
4.1 Abstract……………………………………………..………………………..…77
4.2 Introduction………………………………………………………………...…..78
4.3 Materials and methods………………………….……………………………....81
4.3.1 Natural and spiked sediment samples……………………………….…………83
4.3.2 Supercritical fluid extraction…………………………….………………….….83

viii
4.3.3 Conventional extraction method………………………………………….…....85
4.3.4 Microcystin analysis…………………………………………..…………….…85
4.4 Results……………………………………………………………………...…..86
4.4.1 Optimisation of modifiers……………………..…………………………....…86
4.4.2 Optimisation of extraction pressure…………………….…..…………………89
4.4.3 Optimisation of equilibration time…………………….………….…….….….90
4.4.4 Comparison between the supercritical fluid extraction and conventional
extraction method…………………………………………………………..…90
4.5 Discussion………………….…………………………………………………..92
4.6 Acknowledgements…………………………………………………………….94
Chapter 5. Conclusions and recommendations……….………………………….95
5.1 Significance of contribution……………………………………………………97
5.2 Variability of microcystins in the sediments…………….……………….…....101
5.3 Contribution of sediments to the removal of microcystins from the
water………………………………………………………….…………….….102
5.4 Quantification of microcystins in the sediments using supercritical carbon
dioxide….………………………………………………………………..……104
5.5 Policy and management implications………………..………………………..105
Literature cited…………………………………………………………………........108

ix
List of abbreviations °C Degree Celsius
ANOVA Analysis of variance
c(CB overlying) Concentration of cyanobacterial biomass in overlying water
c(CB surface) Concentration of cyanobacterial biomass in surface water
c(tMC) Concentration of total microcystins
CB Cyanobacterial biomass
chl-a Chlorophyll-a
cm Centimetre
d.f. Degree of freedom
d.m. Dry mass
DDT Dichlorodiphenyltrichloroethane
EDTA Ethylenediaminetetraacetic acid
h Hour
HPLC High-performance liquid chromatography
MCLR Microcystin-LR
MCs Microcystins
m Meter
min Minute
mm Millimetre
MMPB 2-methyl-3-methoxy-4-phenyl-butyric acid
OM Organic matter
p Probability
PAHs Polycyclic aromatic hydrocarbons
PCBs Polychlorinated biphenyls

x
PDA Photodiode array
R2 Coefficient of determination
SFE Supercritical fluid extraction
SPE Solid phase extraction
spp. Species
SPSS Statistical package for the social sciences
TFA Trifluoroacetic acid
tMC Total microcystins
TN:TP ratio Ratio of total nitrogen to total phosphorus concentration
UWA The University of Western Australia
v/v Volume/volume
WHO World Health Organization

xi
List of figures Figure 1.1: Impact of human activities on freshwater resources (modified after
Kundzewicz et al. (2007)). .............................................................................. 4
Figure 1.2: Examples of freshwater systems impacted by proliferating cyanobacterial
blooms (Paerl and Paul, 2012). ....................................................................... 6
Figure 1.3: Structure of microcystin-LR, where L-Leu is L-leucine, D-Me-Asp is D-erythro-
β-methlaspartic acid, L-Arg is L-arginine, Adda is (2s,3s,8s,9s)-3-amino-9-
methoxy-2,6,8-trimethyl-10-phenyldeca-4(E), 6(E)-dienoic acid, D-Glu is D-
glutamic acid, Mdha is N-methyl-dehydroalanine, and D-Ala is D-alanine
(Fang et al., 2011). ........................................................................................ 10
Figure 1.4: Map of the world showing where microcystins have been detected in
freshwater (Si Nang, 2012). .......................................................................... 11
Figure 1.5: A schematic diagram of the natural routes of detoxification of microcystins in
aquatic systems. ............................................................................................. 14
Figure 1.6: Carbon dioxide pressure-temperature phase diagram (Leitner, 2000). ........ 25
Figure 1.7: Framework showing the connection between study aims and the main chapters
of the thesis ................................................................................................... 29
Figure 2.1: Study site and wind conditions. (A) Map of Lake Yangebup with sampling
sites (coordinates for sites 1-4 are 32°07'21"S, E115°49'45", 32°07'07"S,
115°49'31"E, 32°6'50"S, 115°49'43"E and 32°07'11"S, 115°50'07"E
respectively) ; (B) Wind speed and direction for the sampling days and the
two antecedent days for each month. Wind measurements were taken at 9 am
and 3 pm of each day, resulting in 4 measurements for each month, represented
by a line with either a dot or an arrow in wind direction (from: Reichwaldt et
al 2013, which is a study that was performed in parallel to the study presented
here)………………………………………………………………………...47
Figure 2.2: Microcystin concentration (MCs) in sediments ( ● ), total microcystin
concentration in water (▲) and cyanobacterial biomass (CB) (○) in water as
a function of time at sites 1 - 4 (S1 - S4). CB in water is the calculated mean
between CB in surface and overlying water. * indicates missing value for
cyanobacterial biomass. Error bars represent one standard error (with n = 3 for
MC concentration in sediments and n = 2 for CB biomass in water). .......... 47
Figure 2.3: Spatial (A) and temporal variability (B) of microcystin concentrations in lake
sediments. Boxes represent the 25th and 75th percentiles; solid lines within

xii
the boxes mark the median, dashed lines indicate the mean. Whiskers
represent the largest and smallest observed values excluding the outliers.
Filled circles represent outliers (>1.5 box lengths) (n=15). .......................... 48
Figure 3.1: Mean removal of MCLR from the water by (A) sterile lake water with (▲)
and without sediments (●); (B) sterile lake water with sediments without a
microbial inhibitor for three consecutive additions. Numbers denote the
respective additions; curves of best fit are first order exponential decay:
addition 1: c(MCLR) = c(MCLR)0 -0.057t (adj. R2 = 0.908, p < 0.05); addition
2: c(MCLR) = c(MCLR)0 -0.04t (adj. R2 = 0.997, p < 0.05); addition 3: c(MCLR)
= c(MCLR)0 -0.05t (adj. R2 = 0.939, p < 0.05); (C) sterile lake water with
sediments with (▲) and without aeration (●); (D) sterile lake water with
sediments with (▲) and without a microbial inhibitor (●); curves of best fit
are first order exponential decay for the treatment without addition of
microbial inhibitor: c(MCLR) = c(MCLR)0 -0.057t (adj. R2 = 0.908, p < 0.05)
and linear regression for the treatment with addition of microbial inhibitor:
c(MCLR) = 91.52 – 0.29t (adj. R2 = 0.838, p < 0.05); (E) non-sterile lake water
(●) and sterile lake water with sediments (▲). Error bars represent standard
errors in all panels (n = 4). Data of the following treatments are shown twice
within this figure to simplify comparisons: Treatment 3 (▲) is shown in
panels A, C and E; Treatment 5 (●) is shown in panels B and D. ............... 69
Figure 4.1: Extraction procedure for microcystins from sediments using supercritical
carbon dioxide. .............................................................................................. 83
Figure 4.2: Microcystins extracted from spiked sediment samples using supercritical
carbon dioxide with different modifiers: methanol (10%), methanol (8.7%) +
water (1.3%), and water (10%). “*” represents no detectable level of MCLR.
Error bar represent the standard errors of replicates (n = 3). ........................ 87
Figure 4.3: The first 20 min of the high performance liquid chromatogram of extracted
microcystin variants using supercritical carbon dioxide from spiked sediment
samples with different modifiers: (A) 10% water; (B) 8.7% methanol + 1.3%
water. “*” represent microcystin variants other than MCLR. ....................... 88
Figure 4.4: Total microcystins extracted from spiked sediment samples using supercritical
carbon dioxide with different extraction pressures when all other extraction

xiii
conditions are the same. Error bar represents the standard error of replicates
(n = 3). ........................................................................................................... 89
Figure 4.5: Total microcystins extracted from spiked sediment samples using supercritical
carbon dioxide with different equilibration times when all other extraction
conditions are the same. Error bar represents the standard error of replicates
(n = 3). ........................................................................................................... 90
Figure 4.6: Microcystins extracted from spiked sediment samples using the conventional
and supercritical fluid (SFE) methods. Error bar represents the standard error
of replicates (n = 3). ...................................................................................... 92
Figure 5.1: Conceptual framework of the study aims and main findings of the study. MCs
refers to microcystins; CB refers to cyanobacterial biomass ........................ 99
List of tables Table 1.1: Examples of harm caused by cyanobacterial toxins to humans and animals. . 9
Table 1.2: Particle size classification by the Wentworth Grade Scale (after Schöne et al.
(2010). ........................................................................................................... 13
Table 1.3: Reported occurrences of microcystins in the sediments. ............................... 20
Table 1.4: Summary of available methods used for the analysis of microcystins in lake
sediments. ...................................................................................................... 24
Table 1.5: Thesis structure .............................................................................................. 31
Table 2.1: Physicochemical parameter means in each sampling month in Lake Yangebup.
-indicates no measurement due to failure of the probe. DO means dissolved
oxygen………………………………………………………………………41
Table 2.2: Particle size fractions of sediment samples at each sampling site………….. 42
Table 2.3: Statistical results for differences between sites (one-way ANOVA or Kruskal-
Wallis ANOVA on ranks) and between months (repeated-measures ANOVA
or Friedman repeated-measures ANOVA on ranks) of microcystin
concentrations in the sediments and other environmental variables in the
sediments and water. * indicates p < 0.05. n.s. means not significant. ......... 49
Table 2.4: Pearson’s correlation values (R) between microcystin concentrations (MC) in
the sediments (µg/g d.m.) and environmental variables…………………….51
Table 3.1: Experimental design and incubation conditions. ........................................... 64

xiv
Publications arising from this thesis
SONG, H., Coggins, L., REICHWALDT, E. S. & GHADOUANI, A. 2015. The
importance of lake sediments as a pathway for microcystin dynamics and in
shallow eutrophic lake. Toxins, (accepted).
SONG, H., REICHWALDT, E. S. & GHADOUANI, A. 2014. Contribution of sediments
in the removal of microcystin-LR from the water. Toxicon,
10.1016/j.toxicon.2014.02.019.
SONG, H., BERVEN, B., REICHWALDT, E. S. & GHADOUANI, A. 2014. Extraction
of microcystins from lake sediments using supercritical carbon dioxide. Toxins,
(submitted).
REICHWALDT, E. S., SONG, H. & GHADOUANI, A. 2014. Effects of the distribution
of a toxic Microcystis bloom on the small scale patchiness of zooplankton. PLOS
ONE, 8, E66674.

xv
Conference presentations arising from this thesis
SONG, H., REICHWALDT, E. S. & GHADOUANI, A. 2012. The role of sediments in
the removal of microcystin-LR from the water. 2012 ASLO Aquatic Sciences
Meeting, Lake Biwa, Otsu, Shiga, Japan.
REICHWALDT, E. S., HAIHONG, S. & GHADOUANI, A. 2012. Toxic cyanobacterial
blooms as drivers for the heterogeneous distribution of zooplankton in a small,
shallow lake. 2012 ASLO Aquatic Sciences Meeting, Lake Biwa, Otsu, Shiga,
Japan.

1
Chapter 1. Introduction

2
This page has been left blank intentionally.

CHAPTER 1: INTRODUCTION
3
1.1 Background
Freshwater is regarded as the most essential of natural resources as it is indispensable
for all forms of life. It is required by all terrestrial life and is needed in almost all human
activities. Access to water, sanitation and a healthy environment are basic human rights
that must be respected (United Nations Committee, 2003). The right to water must
encompass both the quality and quantity of water provision. However, rapid population
growth combined with poverty, industrialisation, urbanisation and agricultural
intensification is leading to a global water crisis (Vorosmarty et al., 2010).
The impending water crisis will affect both developing and developed countries. It is
estimated that approximately one-third of the world’s population currently lives in
countries experiencing moderate to high water stress, and it is forecasted that by 2025 as
much as two-thirds of a much-larger world population could be under stress conditions –
that is, using more than 20% of their available resources to compensate for the rise in
population and water use (Arnell, 2004). There are three main factors influencing water
stress: (1) changes in water availability due to climate change; (2) changes in water
withdrawals due to trends in socio-economic drivers; and (3) the threat of pollution from
urban-industrial-agricultural development (Alcamo et al., 2010).
Climate change can have direct and significant impacts on water availability and
quality through high water temperatures, increased precipitation intensity and longer
periods of low flows (Reichwaldt and Ghadouani, 2012). Climate change therefore
exacerbates many problems caused by water pollution, including its impact on
ecosystems, human health, water system reliability and operating costs for water supply
and water treatment (Kundzewicz et al., 2007, Ghadouani and Coggins, 2011).
Anthropogenic climate change is only one of many pressures on freshwater systems. For

4
example, human activities can also affect freshwater resources – both quantity and quality
– in various ways (Figure 1.1).
Figure 1.1: Impact of human activities on freshwater resources (modified after Kundzewicz et al. (2007)).
The combined pressure from natural forces and human activities on surface waters may
provide a competitive advantage to cyanobacteria, leading to an increase in the spatial
and temporal extent of cyanobacterial blooms (Hudnell, 2010). As cyanobacteria biomass
is responsible for a range of amenities, water-quality and treatment problems, the mass
occurrence of cyanobacterial blooms is increasingly attracting the attention of
environment agencies, water authorities, and human and animal health organisations.
Furthermore, some species of cyanobacteria can produce toxins that are hazardous to
human and animal health.
The presence of cyanobacterial toxins in water bodies poses a serious problem.
Numerous planktonic (Takamura et al., 1984, Head et al., 1999, Pal et al., 2007, Welker
et al., 2007) and benthic cyanobacterial blooms (Brunberg and Boström, 1992, Hitzfeld
Freshwater Water use Water timing Water management Water quality & quantity
Human Activity Technology Laws & regulations Population & life style Industry & agriculture
Climate Change Temperature Solar radiation Hydrological cycle Atmospheric CO2
& O3
Anthropogenic forces
Consequences

CHAPTER 1: INTRODUCTION
5
et al., 2000, Latour and Giraudet, 2004, Verspagen et al., 2004, Verspagen et al., 2005,
Ma et al., 2010, Misson and Latour, 2012) can produce toxic peptides and alkaloids.
Ingestion of these cyanotoxins has been linked to liver, ingestive and skin diseases,
neurological impairment and even death of animals (Spoerke and Rumack, 1985, Fraga
et al., 1988, Edwards et al., 1992, Anderson et al., 1996, Mez et al., 1997, Codd et al.,
1999, Bretz et al., 2002, Chen and Chou, 2002, Taleb et al., 2003, Kirkpatrick et al., 2004,
Green et al., 2004, Arena et al., 2004, de Figueiredo et al., 2004, Abouabdellah et al.,
2008, Dörr et al., 2010). The tragic death of 76 patients in a haemodialysis clinic in Brazil
in 1996 was connected to the presence of cyanobacterial toxins in the water used for the
dialysis, and a high incidence of primary liver cancer in China has been attributed to
drinking water contaminated with cyanobacterial toxins (Ueno et al., 1996, Pouria et al.,
1998, Carmichael, 2001, Azevedo et al., 2002). Cyanobacterial toxins are therefore a
major threat to the use of freshwater ecosystems and reservoirs for drinking water,
irrigation and freshwater fishing and recreational purposes. In order to assess and manage
the risk to public health and potential threat to the ecosystem’s organisms, the fate of
cyanobacterial toxins in aquatic systems needs to be clearly understood.
1.2 Cyanobacteria and cyanobacterial blooms
Cyanobacteria (blue-green algae) are ubiquitous inhabitants of aquatic and terrestrial
environments, and natural populations of these organisms occur away from human
influence (Codd et al., 1994). As the earliest oxygen-producing organisms (Bartram et
al., 1999), cyanobacteria have an extensive evolutionary history. Fossil evidence indicates
that they may have emerged as early as 3.5 billon years ago and they have been abundant
for over 2.5 billion years (Summons et al., 1999, Schopf, 2000). The lengthy history and
variable environmental conditions under which cyanobacteria evolved have resulted in
the adaptation of some cyanobacterial taxa to extreme environments, and collectively they

6
are widely dispersed across the globe (Badger et al., 2006). They exist across a multitude
of hot, cold, alkaline, acidic and terrestrial environments, and can proliferate to be the
dominant primary producers in freshwater, estuarine and marine ecosystems (Mur et al.,
1999). These organisms also respond to cultural eutrophication by the development of
massive populations, including blooms, scums and mats (Sutcliffe and Jones, 1992)
(Figure 1.2).
Figure 1.2: Examples of freshwater systems impacted by proliferating cyanobacterial blooms (Paerl and Paul, 2012).
A cyanobacterial bloom results from the rapid increase in the population of
cyanobacteria in an aquatic system. Enrichment (particularly nitrogen and phosphorus)
associated with urban-industrial-agricultural development promotes accelerated
eutrophication, which in turn favours the periodic proliferation and dominance of harmful
blooms of cyanobacteria (Anderson et al., 2002, Heisler et al., 2008, Paerl and Paul, 2012,
Sinang et al., 2013, Duong et al., 2013). Some cyanobacterial blooms can cause adverse

CHAPTER 1: INTRODUCTION
7
effects, including oxygen depletion, reduced water quality aesthetics, clogging of fish
gills and toxicity. In addition, climate change is a potential catalyst for the extension and
intensification of cyanobacterial blooms (Huber et al., 2012). In recent years, as a result
of anthropogenic eutrophication and climate change, the frequency and intensity of
cyanobacterial blooms have apparently increased, increasing the threat to ecological and
public health as well as affecting the aesthetic appearance of the environment
(Carmichael, 1992, Carmichael, 2001, Paerl and Huisman, 2009, Paerl et al., 2011, Paerl
and Paul, 2012, Reichwaldt and Ghadouani, 2012, Lewitus et al., 2012, O’Neil et al.,
2012).
Warm weather may cause cyanobacterial bloom directly or indirectly (Paerl and
Huisman, 2009). Generally, cyanobacteria grow better at higher temperatures, although
there are exceptions at lower temperatures (Elliott, 2012). It has also been suggested that
higher temperatures will cause earlier and longer potential bloom periods and lead to
possible range expansions (Moore et al., 2008; Paerl and Paul, 2012). Indirectly, warm
weather induces many changes that is advantageous for cyanobacterial growth. The
changes include increasing stratification, enhanced nutrient loading caused by changed
rainfall pattern, the decrease of wind speed, light availability to phytoplankton which may
all enhance the probability of cyanobacterial dominance over the other phytoplankton
(Zhang et al., 2011; Reichwaldt and Ghadouani 2011).
It is possible that cyanobacteria possess many unique characteristics that may allow
them to dominate the phytoplankton communities in a changed climate. These
characteristics include: (1) the ability to grow in warmer temperatures; (2) buoyancy, due
to gas vesicles production; (3) high affinity for, and ability to store, phosphorus; (4)
nitrogen-fixation; (5) akinete production and associated life history characteristics; and
(6) light capture at low intensities and a range of wavelengths (Carey et al,. 2014).
However, cyanobacteria are a diverse group with different characteristics, and will

8
respond to different aspects of climate change. There will most likely also be regional
differences in which cyanobacterial taxa dominate.
1.3 Cyanobacterial toxins
Cyanobacterial blooms not only affect the taste, odour and appearance of the water, but
more significantly, some blooms can produce toxins which cause acute and possibly
chronic health problems in humans and a range of aquatic and terrestrial animals (Table
1.1). The majority of cyanobacterial toxins are considered to be secondary metabolites
and are classified into three groups according to their chemical structures and effect on
the human body. For example, cylindrospermopsin can cause gastrointestinal symptoms
or kidney disease; neuroxins can affect the nervous system and hepatotoxin can affect the
liver. Exposure to these toxins can either directly kill the organisms or decrease their
resistance to bacterial or viral infections. The ecological and economic impacts of
cyanobacterial toxins will most likely worsen as the frequency of cyanobacterial blooms
increases in many countries as a result of nutrient eutrophication.

CHAPTER 1: INTRODUCTION
9
Table 1.1: Examples of harm caused by cyanobacterial toxins to humans and animals.
Affected organisms
Routes of exposure
Signs and symptoms References
Humans Drinking water Gastrointestinal illness, Liver cancer
(Ueno et al., 1996, Chorus et al., 2000, Griffiths and Saker, 2003)
Recreational water,
Pneumonia (Van Apeldoorn et al., 2007)
Haemodialysis Acute liver failure (Pouria et al., 1998, Azevedo et al., 2002)
Contact with M. aeruginosa scum
Sore throat, headaches, blistered mouth, diarrhoea and vomiting
(Turner et al., 1990)
Microcystis scum ingestion
Skin rashes, mouth blisters and severe thirst
(Pearson, 1990)
Terrestrial Animals
Exposure to cyanobacteria
Insects killed (Hiripi et al., 1998)
Liver necrosis in birds, leading to death
(Matsunaga et al., 1999)
Exposed to MCLR
Liver damage in mice (Ito et al., 1997)
Drinking water containing microcystins
Liver and kidney damage in rats
(Heinze, 1999, Milutinovic et al., 2002)
Microcystis and Oscillatoria scum ingestion
Death (sheep, dogs) (Codd and and Beattie, 1991 Hunter and Roberts, 1991)
Aquatic Animals
Cell ingestion and exposure to toxins
Microcystin bioaccumulation in tissues of mussels, crayfish, fish et al.; behaviour changes in zooplankton communities
(Williams et al., 1997, Amorim and Vasconcelos, 1999, Vasconcelos, 2001, Liu et al., 2002, Papadimitriou et al., 2012, Gutiérrez-Praena et al., 2013, Ghadouani et al., 1998, Ghadouani and Pinel-Alloul, 2002, Ghadouani et al., 2003, Ghadouani et al., 2004, Ghadouani et al., 2006, Reichwaldt et al., 2013)

10
1.4 Microcystins
Microcystins are a group of cyanobacterial toxins produced by certain species of
cyanobacteria such as Microcystis spp., Anabaena spp., Nostoc spp., and Oscillatoria spp.
They are considered to be one of the most toxic groups of cyanobacterial toxins (Tricarico
et al., 2008, Cordeiro-Araújo and Bittencourt-Oliveira, 2013). The general structure of
microcystins is cyclo-(D-Ala1-X2-DMeAsp3-Z4-Adda5-D-Glu6-Mdha7), where X and
Y are L-amino acids that vary between microcystin variants (Carmichael, 1997) (Figure
1.3). So far, over 90 different microcystin variants have been identified and the number
continues to increase due to better instruments and detection methods (Hotto et al., 2008).
Different variants of microcystins have caused great concern due to their hepatotoxicity.
Figure 1.3: Structure of microcystin-LR, where L-Leu is L-leucine, D-Me-Asp is D-erythro-β-methlaspartic acid, L-Arg is L-arginine, Adda is (2s,3s,8s,9s)-3-amino-9-methoxy-2,6,8-trimethyl-10-phenyldeca-4(E), 6(E)-dienoic acid, D-Glu is D-glutamic acid, Mdha is N-methyl-dehydroalanine, and D-Ala is D-alanine (Fang et al., 2011).
Microcystins have been widely reported across the world (Figure 1.4) and many more
occurrences are reported daily by water resources authorities. They have caused livestock,
pet and wildlife deaths and have been implicated in human injury and death through
drinking water and dialysis fluid (Codd et al., 1999, Chorus et al., 2000, Palikova et al.,
2013, Tian et al., 2013). Due to the potential for chronic toxicity from microcystins, the

CHAPTER 1: INTRODUCTION
11
World Health Organization (WHO) has established a guideline value of 1 µg/L and 20
µg/L for total microcystin-LR (MCLR) in drinking water (WHO, 1998) and recreation
water (WHO, 2003) respectively. Therefore, to avoid the potential health risk to humans
and animals, scientists and water authorities should understand the natural degradation
and elimination pathways of microcystins with the aim of reducing the risks associated
with these pollutants.
Figure 1.4: Map of the world showing where microcystins have been detected in freshwater (Si Nang, 2012).
1.5 Sediments
Following their formation, lakes accumulate sediments in a continual process that in
many cases has spanned several thousand years or longer. Sediments are heterogeneous
mixtures that include mineral phases and detrital organic matter (Misson et al., 2012).
Most sediments in surface waters derive from surface erosion and comprise a mineral
component, arising from the erosion of bedrock, and an organic component, arising
during soil-forming processes including biological and microbiological production and
decomposition. An additional organic component may be added by biological activity
within the water body (Schöne et al., 2010).
Canada
USA
South America
Africa
Europe
China
Australia
New Zealand

12
Sediments play a complex role in ecosystem functioning and the provision of
ecosystem services. At the sediment-water interface, they form an integral part of the
ecosystem because they are affected by a continuous flux of physical, chemical and
biological components between the sediment, interstitial water and the overlying water.
The role of sediment as a sink for pollutants and a source of contaminants that potentially
influence the quality of receiving waters has been well recognised (Rodríguez et al., 2007).
Particle size, settling speed and mineralogy are essential characteristics of individual
sedimentary particles. Finer sedimentary particles generally do not exist in isolation, and
in the overlying water they are usually present as aggregates of particles, that is, as flocs.
In contrast, coarser-grained particles usually do not aggregate and are present as
individual particles. Properties of a floc, such as size and density, are often significantly
different from those of the individual particles making up the floc (Sharma et al., 2012).
The most obvious property of sediment is the size of its particles. There is no
universally accepted scale for the classification of particles according to their sizes. In
North America, the Wentworth Grade Scale (Table 1.2) is commonly used; elsewhere,
the International Grade Scale is preferred (Schöne et al., 2010). There are minor
differences between the two scales, and it is therefore important to note which scale has
been selected and to use it consistently (Schöne et al., 2010).

CHAPTER 1: INTRODUCTION
13
Table 1.2: Particle size classification by the Wentworth Grade Scale (after Schöne et al. (2010).
Particle description Particle size (mm) Cobble 256-64 Gravel 64-2 Very coarse sand 2-1 Coarse sand 1-0.5 Medium sand 0.5-0.25 Fine sand 0.125-0.063 Silt 0.062-0.004 Clay 0.004-0.00024
Sediment properties, including particle size, often vary greatly throughout a sediment
bed in the horizontal and vertical directions. Sediment types can change rapidly in the
horizontal direction from coarse sands (where currents and wave action are strong) to
fine-grained muds (where currents and wave action are small). They also can change
rapidly in the vertical direction. For example, during strong storms, layers of coarse sands
may be deposited on top of finer sediments. During quiescent conditions, this coarse layer
may then be covered by fine sediments (Sharma et al., 2012).
The properties of sediments can influence their capacity to adsorb and degrade
microcystins in aquatic systems. These properties include organic matter content (living
biomass of microorganisms, fresh and partially decomposed residues, and humus) and
particle size fraction (sand, slit and clay) (Miller et al., 2001, Mohamed et al., 2006, Chen
et al., 2008, Munusamy et al., 2012).
1.6 Fate of microcystins in aquatic systems
1.6.1 Microcystin occurrence in aquatic systems
Microcystins occur in four parts of the aquatic system: within the cyanobacterial cells
(Jones and Orr, 1994), in the water (Carmichael, 2001), in aquatic organisms (Chen and
Xie, 2005, Song et al., 2007a) and in sediments (Klitzke et al., 2010). They are normally
confined within the cyanobacterial cells and enter the surrounding water after lysis and
cell death (Watanabe et al., 1992a). The amount of intracellular toxins produced within
the cells is influenced by various environmental factors like temperature (Davis et al.,

14
2009), light intensity (Kaebernick et al., 2000), phosphorus (Rinta-Kanto et al., 2009a)
and nitrogen (Long et al., 2001) concentration, TN:TP ratio (Vezie et al., 2002), iron level
(Sevilla et al., 2010) and the presence of other competing phytoplankton (Engström-Öst
et al., 2011). Dissolved microcystins are not very stable under natural conditions (Welker
et al., 2001). There are several processes that can affect the persistence of the dissolved
microcystins in aquatic systems. In the water, these include photolysis, uptake by aquatic
animals leading to bioaccumulation, adsorption to suspended particles and biodegradation
by bacterial communities in the water (Corbel et al., 2014) (Figure 1.5).
Figure 1.5: A schematic diagram of the natural routes of detoxification of microcystins in aquatic systems.
1.6.2 Biodegradation of microcystins
Biodegradation can affect the fate of microcystins in aquatic systems (Dziga et al., 2013)
and it has been reported in lake water (Jones and Orr, 1994, Lahti et al., 1997, Edwards
et al., 2008, Ho et al., 2012b, Ho et al., 2012c), lake sediments (Cousins et al., 1996, Holst
et al., 2003, Song et al., 2014), estuaries (Lemes et al., 2008), sand filters (Bourne et al.,
Microcystins Biodegradation Bioaccumulation
Photolysis Bloom
Bacteria Biodegradation Adsorption
Sediments
Bacteria

CHAPTER 1: INTRODUCTION
15
2006), various biofilms (Saito et al., 2003, Babica et al., 2005, Wu et al., 2010) and
artificial media (Ji et al., 2009). Bacteria capable of degrading cyanobacterial toxins have
been isolated from water, sediments, sand filters, coastal lagoons and even an operating
anthracite bio-filter (Jones et al., 1994, Bourne et al., 1996, Takenaka and Watanabe,
1997, Park et al., 2001, Holst et al., 2003, Chen et al., 2007, Eleuterio and Batista, 2010,
Ho et al., 2012b). Therefore, the biodegradation of microcystins should be of great
importance when studying the natural attenuation of microcystins, particularly its
detoxification mechanism.
It has been suggested that exposure to microcystins drives changes in the structure and
physiology of bacterial communities, which in turn degrade microcystins (Giaramida et
al., 2013). Studies have shown that a history of pre-exposure to cyanobacterial bloom and
microcystins is closely related to the lag phase of biodegradation (Edwards et al., 2008,
Jones and Orr, 1994, Lam et al., 1995a, Christoffersen et al., 2002, Li et al., 2012).
Generally, the biodegradation of microcystins is characterised by a prolonged lag phase
that ranges from a few days to several weeks followed by a rapid decomposition of toxins.
Other factors influencing the ability of bacteria to biodegrade microcystins include
nutrient conditions and temperature. For example, the degradation capability of a biofilm
was shown to be stimulated by nitrate but inhibited by ammonium and glucose (Babica
et al., 2005). Park et al (2001) reported that isolated microcystin-degrading bacteria were
strongly dependent on temperature, with the maximum rate of degradation occurring at
30°C (Park et al., 2001). In one Australian study, it was observed that biodegradation of
microcystin-LR in source water only occurred at 24 °C in spring, while in summer it only
occurred at 14°C (Ho et al., 2012b). It has also been shown that microcystin removal in a
saturated sediment column was higher in temperatures ranging between 16 °C and 32 °C
than below 11°C (Klitzke and Fastner, 2012). Wang et al. (2007) and Ho et al. (2007)
also reported that higher temperature increased the ability of sediments to biodegrade

16
microcystins. It may be that higher temperatures increase the metabolic activity, and by
extension the biodegradation ability, of bacteria.
Additionally, clay and organic matter in the sediments can increase the capacity of
sediments to degrade microcystins. Lam et al. (1995b) reported that in soils with sandy
material, microcystins showed no degradation over 20 days while in soils with higher clay
or higher organic content, their concentration did show a decrease that could be attributed
to biodegradation. Chen et al. (2010) found that glucose addition had no statistically
significant effect on the anoxic biodegradation of microcystins, which implied that
organic carbon content is not a major factor affecting anoxic biodegradation of MCs in
aquatic sediments. The study of Park et al. (2001) suggested that added organic nutrients
competed with microcystins as a source of carbon and energy and therefore inhibited the
degradation of microcystins. In contrast, Holst et al. (2003) found that glucose addition
could stimulate the anoxic biodegradation of microcystins in sediment slurries. The
contradictory results may be due to the bacteria capable of degrading microcystins are
different. It may also because carbon can stimulate bacterial activity by providing an
essential source of carbon and energy for microcystin degrading bacteria while an extra
carbon source may prevent bacteria from degrading microcystin (Chen et al., 2010). The
effect of nitrogen on the degradation rate of microcystins are also contradictory. Chen et
al., 2010 found that microcystin degradation was not coupled to de-nitrification in their
experiments. Differently, Holst et al. (2003) found that the addition of NO3-N
significantly stimulated microcystin degradation under anoxic conditions, and suggested
that this process was coupled to denitrification.
1.6.3 Adsorption of microcystins to sediments
The capability of sediments to adsorb microcystins has been confirmed in batch
adsorption experiments in the laboratory (Mohamed et al., 2007, Munusamy et al., 2012,

CHAPTER 1: INTRODUCTION
17
Song et al., 2014). For example, Rivasseau et al. (1998) reported that as little as 10% of
microcystins were adsorbed on suspended articles and 7% on sandy sediments during a
three-day experiment. However, although these studies clearly indicated that adsorption
by sediments contributes to the detoxification of microcystins under natural conditions,
the significance of adsorption compared to other detoxification mechanisms is not yet
clear.
Adsorption of microcystins to sediments occurs when microcystins bind to the surface
of a sediment, usually at a specific site. However, the mechanisms for the adsorption of
microcystins onto lake sediment are still unclear. Wu et al (2011) observed that the
adsorption of microcystins onto sediments usually involved relatively weak
intermolecular forces and had small energy requirements for hydrogen bonding. They
concluded that the adsorption of microcystins onto sediments was a physisorption process.
However, according to Chen et al. (2006b), the adsorption mechanism of microcystins in
soils and sediments involves not only physical adsorption, but also chemical binding with
the metal ions on the surfaces of the soil and sediment particles. For instance, due to the
nitrogen and oxygen atoms present in their structure, microcystins can chelate with the
metal ions in clay.
The presence of clay and organic matter enhances the capacity of sediments to adsorb
microcystins (Mohamed et al., 2007, Grut macher et al., 2010). It has been reported that
during the sediment passage of microcystins, the adsorption coefficients of microcystins
for fine-grained aquifer materials containing clay and organic matter was much higher
than that for filter sand (Grut macher et al., 2010). The important contribution of clay and
organic matter in sediments to the adsorption of microcystins was further confirmed in
the study by Mohamed et al. (2007). In this study of the Nile River, Egypt, the capacity
of sediments to adsorb microcystins was significantly correlated to their clay and organic
matter, but not their sand or silt content. Other studies have also demonstrated the link

18
between a sediment’s ability to adsorb microcystins and its organic matter and clay
content (Donati et al., 1994, Rapala et al., 1994, Lambert et al., 1996, Morris et al., 2000,
Miller et al., 2001). Additionally, Wu et al (2011) have shown that organic matter in
sediments has a two-fold effect on the adsorption process. For sediments with lower levels
of organic matter (i.e. less than 8%), the adsorption of microcystins decreased with
increasing organic matter and was dominated by the competition for adsorption sites
between the toxins and the organic matter. In contrast, microcystin adsorption to organic-
rich (i.e. more than 8%) sediments increased with increasing organic matter and was
dominated by the interaction between the toxins and the adsorbed organic matter.
Other factors influencing the capacity of sediments to adsorb microcystins include pH,
temperature and salinity. Miller et al. (2001) observed increased adsorption of
microcystins at lower pH values in buffered systems. This result was supported by Liu et
al. (2008), who reported that the adsorption of microcystin-LR and microcystin-LW
decreased significantly with increased pH. Wu et al. (2011) and Munusamy et al. (2012)
also confirmed that the adsorption of microcystin-LR onto sediments and clay was pH
dependent (i.e. adsorption decreased with increasing pH). Wu et al. (2011) suggested that
pH influenced the surface charge heterogeneity of the sorbate (microcystin-LR) and
sorbents (sediments and clay). Wu et al. (2011) also found that temperature influenced
the adsorption capacity of sediments differently and depended on their organic matter
content nts. Sediments with higher levels of organic matter (i.e. more than 8%) a stronger
adsorption capacity at higher temperatures, while sediments with lower levels of organic
matter (i.e. less than 8%) showed the opposite tendency. With regards to salinity, it is
reported that increasing salinity may enhance the adsorption ability of sediments and soils
to cyanobacterial toxins by increasing a solution’s ionic strength (Miller et al., 2001).

CHAPTER 1: INTRODUCTION
19
1.7 Microcystins in the sediments
1.7.1 Occurrences of microcystins in the sediments
Microcystins have been found in a variety of sediments, particularly those in eutrophic
lakes with a history of toxic cyanobacterial blooms (Table 1.3). The occurrence of
microcystins in sediments has multiple consequences. For example, they have been
shown to affect benthic organisms living in these sediments (Montagnolli et al., 2004,
Mohamed et al., 2007). Hazards caused by microcystins in lake sediments should be of
particular concern in shallow aquatic systems where the interaction between water and
sediment is greater.
Sediments may play an important role in the fate of microcystins. On the one hand,
sediments can act as a sink for microcystins. For example, cyanobacterial cells from the
water can settle on the sediments and release microcystins when they lyse (Wörmer et al.,
2011). Microcystins can also accumulate in sediments through their adsorption from
water (Tsuji et al., 2001) and the sinking of fecal pellets from aquatic life (Sivonen and
Jones, 1999). On the other hand, sediments can be a source of cyanobacterial cells and
microcystins in water via reinvasion (Verspagen et al., 2004). In addition, sediments can
also facilitate the biodegradation of microcystins (Chen et al., 2010). Therefore,
sediments should not be neglected when considering the fate of microcystins in aquatic
systems.
Understanding the mechanisms by which sediments remove microcystins in the water
is important. This includes a quantification of the relative contribution of biodegradation
and adsorption by sediments. Hence, one aim of the present study is to quantify the
sediment’s contribution to the removal of microcystins from the water and compare the
relative contribution of the biodegradation and adsorption abilities of sediments in the
removal of microcystins from the water.

20
Table 1.3: Reported occurrences of microcystins in the sediments.
Sediment depth (cm)
Microcystins concentration (µg/g)
Place References
0-5 0.017-0.35 Brno reservoir, Czech Republic
(Babica et al., 2006)
0-5 0-1.95 Dianchi Lake, China (Wu et al., 2012)
0-10 25-300* Quitzdorf Reservoir, Germany
(Ihle et al., 2005)
0-10 0.039-0.092 Nile River, Egypt (Mohamed et al., 2007)
0-20 20.4-168.1 Taihu Lake, China (Chen et al., 2008)
0-30 0.08-2.33 Tsukui Lake, Japan (Tsuji et al., 2001)
0-30 0-0.12 Donghu Lake, China (Chen et al., 2006a) * µg/L
Although previous studies have reported the temporal and spatial variability of
microcystins in sediments, there has little agreement between researchers. Babica et al.
(2006) observed high microcystin concentrations in sediments during spring, followed by
a decrease until the summer months when cyanobacterial biomass in the water was at a
maximum. This finding agreed with Ihle et al. (2005). In contrast, Chen et al. (2008)
found that the highest microcystin concentrations in sediments usually occurred during
summers, when cyanobacterial biomass and microcystin production were at maximum.
For vertical distribution, Latour et al. (2007) found high concentrations of microcystins
not only at the sediment’s surface but also at depths of 25–35 cm and 70 cm. Chen et al.
(2008) investigated the distribution and annual variations of microcystins in sediments in
Lake Taihu, China, and found that microcystins were mainly distributed on the surface of
sediments, and their concentration decreased with increasing sediment depth.

CHAPTER 1: INTRODUCTION
21
1.7.2 Factors affecting the occurrence of microcystins in sediments
Many factors can contribute to the variability of microcystins in lake sediments. First,
the occurrence of microcystins in lake sediments can be attributed to the presence of
cyanobacterial cells in these sediments, and microcystins have been reported in the
presence of toxic cyanobacteria in a variety of sediments (Mez et al., 1997, Ihle et al.,
2005, Mohamed et al., 2007, Kim et al., 2010, Rinta-Kanto et al., 2009b). Similarly,
microcystin concentrations in the Nile River and irrigation canal sediments correlated to
the total count of cyanobacteria in the water, particularly Microcystis, and microcystins
within phytoplankton cells at most sampling sites (Mohamed et al., 2007). Second, the
occurrence of microcystins in sediments can be caused by the sedimentation of
microcystin-containing particles in the water. Such a process was studied in three
reservoirs located in Central Spain and the result identified sedimentation as a major
destination of the toxins (Wörmer et al., 2011). Third, the adsorption of dissolved
microcystins can be affected by the physicochemical properties of sediments and
microcystin concentrations in the water (Miller et al., 2001, Chen et al., 2006b, Mohamed
et al., 2007, Wu et al., 2011, Munusamy et al., 2012).
In summary, in addition to cyanobacterial biomass in sediments, other environmental
variables – such as cyanobacterial biomass and microcystins in the water – could
contribute to the variability of microcystins in the sediments. Although it is important to
understand the correlation between the variability of microcystins in lake sediments and
potential contributing environmental factors in order to better understand the fate of
microcystins in aquatic systems, studies in this area are lacking. Hence, another aim of
the current study was to examine the temporal and spatial variability of microcystins in
sediments to detect any correlation between their variability and other environmental
factors such as the concentration of cyanobacterial biomass and microcystins in the water.

22
1.7.3 Analysis of microcystins in lake sediments
1.7.3.1 Conventional solvent methods
While understanding the occurrence of microcystins in lake sediments is important, the
process was hindered by the lack of a suitable quantification method to measure
microcystins in sediment samples. Conventional methods to extract microcystins from
sediments usually involve the use of chemical solvents (Table 1.4). Babica et al. (2006)
evaluated different extraction approaches and investigated recoveries for a range of
sediment types, toxin variants, and extraction solvents. They found that extraction with
5% acetic acid in 0.2% trifluoroacetic acid (TFA)-methanol was the most appropriate for
sediments with different organic material contents. Chen and co-workers (2006a)
introduced an improved extraction method based on aqueous solutions of strong chelator,
EDTA-sodium, which are thought to displace adsorbed toxins from metal ions on
inorganic particle surfaces. Extraction efficiencies were reported to be around 90% for a
range of sediment and soil samples. Recovery rates using these solvent-based extraction
methods seem to be satisfactory, but they are time consuming and a clean-up step is
usually needed which is costly and may result in the loss of microcystins.
1.7.3.2 MMPB method
The MMPB (2-methyl-3-methoxy-4-phenylbutyric acid) method is widely considered
to be an effective analytical procedure for the total quantification of microcystins in lake
sediments. This technique involves cleavage of the chemically unique C20 amino acid-
amino acid (2S, 3S, 8S, 9S)-3-amino-9-methoxy-2, 6, 8-trimethyl-10-phenyldeca-4, 6-
dienoic acid (Adda) to form MMPB for indirect quantification of the total microcystins.
The MMPB method was applied to sediment samples collected from Japanese lakes and
microcystins were detected in six of the eleven samples (Tsuji et al., 2001). However,
there is still a significant problem with this method, because the necessary very low

CHAPTER 1: INTRODUCTION
23
reaction temperature of -78°C is difficult to achieve and involves oxidation of the
microcystins to form MMPB by ozonolysis. In addition, as this method involves the
conversion of microcystins, only total toxin concentrations can be detected, which is
impractical when information about the concentration of microcystin variants is required.
1.7.3.3 Lemieux oxidation method
Free/extractable MCs refers to the microcystin fractions which are readily extracted
without changing their molecular structures. They are usually loosely adsorbed onto
sediments and can be easily redissolved in the aqueous phase (Wu et al., 2012). For the
determination of free/extractable and total microcystins in lake sediment, an analytical
procedure based on a combination of solvent extraction and Lemieux oxidation was
developed (Wu et al., 2012). In this study, a sequential solvent extraction using 50% (v/v)
methanol and EDTA-sodium pyrophosphate was selected as the optimal extraction
solvent for free microcystin analysis. After the extraction, the purified extracts and
sediment residuals underwent optimised Lemieux oxidation to determine the total
microcystins in lake sediments. Unfortunately, information regarding the effects of the
primary factors such as reaction conditions and sediment characteristics (i.e. organic
matter) on the oxidation efficiency was not provided by Wu et al. (2012). As for the
MMPB method, this method only applies to the measurement of total microcystin.
Therefore, the development of an effective, time-saving and more selective detection
method was urgently needed to reliably quantify microcystin concentrations in sediment
samples.

24
Table 1.4: Summary of available methods used for the analysis of microcystins in lake sediments.
Method
Solvent/Pathway
Shortcomings
References
Conventional solvent methods
5% (v/v) acetic acid in methanol containing 0.1% or 0.2% (v/v) trifluoroacetic acid (TFA)
Use of large amount of chemical solvents, time consuming, clean-up procedure is required
(Tsuji et al., 2001, Babica et al., 2006, Mohamed et al., 2007)
5% (v/v) acetic acid (Ihle et al., 2005)
0.1 M EDTA–0.1 M Na4P2O7
(Chen et al., 2006a, Chen et al., 2006b)
MMPB method
Ozonolysis of the Adda moiety to form MMPB for indirect quantification of the total microcystins
Toxin structure is destroyed and only total toxin concentrations can be detected
(Tsuji et al., 2001)
Lemieux oxidation method
Sequential solvent extraction using 50% (v/v) methanol and 0.1 M EDTA–0.1 M Na4P2O7 followed by optimised Lemieux oxidation for determination of total microcystins
Only total toxin concentrations can be detected
(Wu et al., 2012)
1.7.3.4 Supercritical fluid extraction – a potential method
Extraction of organic compounds using supercritical fluids as solvents is gaining
increased attention. Supercritical fluid extraction (SFE) is based on the use of unique
physicochemical features of supercritical fluids that are in the state between liquid and
gas (Figure 1.6). The density of a supercritical fluid is typically 102–103 times that of the
gas. Consequently, molecular interactions increase due to shorter intermolecular
distances. However, the diffusion coefficients and viscosity of the fluid, although density
dependent, remain more like that of a gas. The ‘liquid-like’ behaviour of a supercritical
fluid results in greatly enhanced solubilising capabilities when compared to the
corresponding liquid. These properties allow for similar solvent strengths to liquids but

CHAPTER 1: INTRODUCTION
25
greatly improved mass-transfer properties that facilitate rapid extraction rates and more
efficient extraction due to a better penetration of the matrix. Supercritical fluid extraction
technology has been applied in extracting organic compounds from solid matrices for
analytical work (Anitescu and Tavlarides, 2006). In general, SFE has a number of
potential advantages including more rapid extraction rates, more efficient extractions,
increased selectivity, and the potential to quantify a combined analyte fractionation.
Figure 1.6: Carbon dioxide pressure-temperature phase diagram (Leitner, 2000).
Among various supercritical fluids used for extraction, supercritical carbon dioxide is
the most widely used since it is non-toxic, non-flammable, non-corrosive, easy to handle
and allows supercritical operation at low pressures and near room temperature. It is
therefore is widely applied in the analysis of compounds in environmental samples
(Sunarso and Ismadji, 2009). Supercritical carbon dioxide has been used on various soils
and sediments to analyse contamination by a plethora of chemicals like PCBs, PAHs,

26
DDT, dioxins and furans, and pesticides in order to extract contaminants (Anitescu and
Tavlarides, 2006). Application of this technique has been also reported for the
determination of pesticides in complex matrices such as soils, sediment and water
samples (after a solid-phase extraction), plant materials, animal tissues and food items
(Camel, 1998).
Pyo and co-workers used the SFE technique to extract microcystins from lysed algal
bloom samples in a series of studies which proved the advantages and practical use of
supercritical carbon dioxide in the extraction of microcystins (Pyo and Shin, 1999, Pyo,
1999, Pyo and Shin, 2001, Pyo et al., 2004). However, so far, to our best knowledge, no
study has attempted to use SFE to extract microcystins from sediments and soils.
Therefore, the third aim of the present study was to evaluate the applicability and
efficiency of SFE for the extraction of microcystins from lake sediments.
1.8 Research aims and hypothesises
Overall, the objective of this study was to identify the role of sediments in the fate of
microcystins in shallow aquatic systems (Figure 1.7). More specifically, this study aimed
to:
1. identify the temporal and spatial variability of microcystins in the sediments of
a shallow lake and determine any correlations between this variability and
environmental variables. This part of research was based on the hypothesis that
the variability of microcystins in lake sediments is influenced by a combination
of environmental variables
2. quantify the significance of the sediment’s contribution to the removal of
microcystins from the water and compare the relative contribution of the
biodegradation and adsorption abilities of sediments to the removal of
microcystins from the water. This part of study was based on the hypothesis

CHAPTER 1: INTRODUCTION
27
that sediments can significantly contribute to the natural attenuation of
microcystins in water
3. evaluate the applicability and efficiency of SFE as a method for
quantifying microcystin concentrations in lake sediments. This part of study
was based on the hypothesis that supercritical carbon dioxide has the potential
to be applied in the quantification of microcystin in these sediments.

28

29
Figure 1.7: Framework showing the connection between study aims and the main chapters of the thesis
CB in sediments
MCs in sediments
Sediments
Chapter 2: To identify the temporal and spatial variability of microcystins in the sediments of a shallow lake and determine the correlation of the variability with environmental variables (Aim 1).
CB in water
MCs in water
Water
Chapter 4: To evaluate the applicability and efficiency of supercritical carbon dioxide in the quantification of microcystins from lake sediments (Aim 3).
Chapter 3: To quantify the significance of the sediment’s contribution to the removal of microcystins from the water column and compare the relative contribution of the biodegradation and adsorption abilities of sediments to the removal of microcystins from the water column (Aim 2).
CH
APT
ER
1: INTR
OD
UC
TION

This page has been left blank intentionally.
CHAPTER 1: INTRODUCTION
31
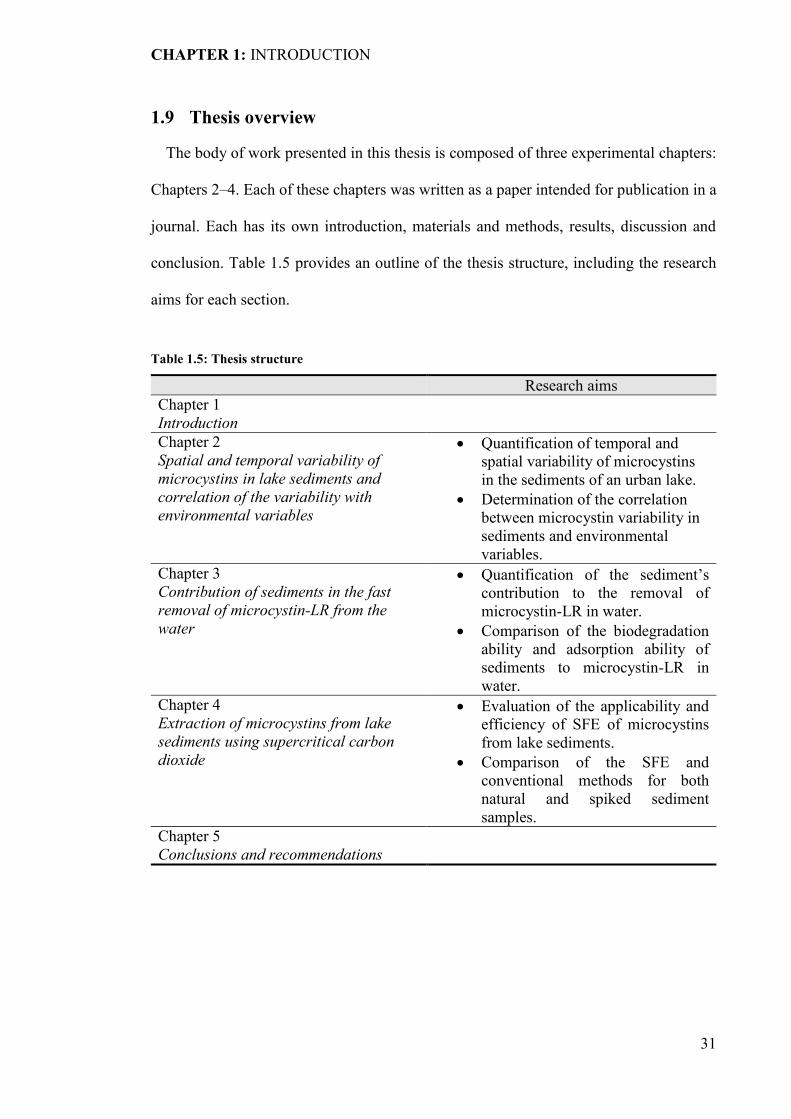
1.9 Thesis overview
The body of work presented in this thesis is composed of three experimental chapters:
Chapters 2–4. Each of these chapters was written as a paper intended for publication in a
journal. Each has its own introduction, materials and methods, results, discussion and
conclusion. Table 1.5 provides an outline of the thesis structure, including the research
aims for each section.
Table 1.5: Thesis structure
Research aims Chapter 1 Introduction
Chapter 2 Spatial and temporal variability of microcystins in lake sediments and correlation of the variability with environmental variables
Quantification of temporal and spatial variability of microcystins in the sediments of an urban lake.
Determination of the correlation between microcystin variability in sediments and environmental variables.
Chapter 3 Contribution of sediments in the fast removal of microcystin-LR from the water
Quantification of the sediment’s contribution to the removal of microcystin-LR in water.
Comparison of the biodegradation ability and adsorption ability of sediments to microcystin-LR in water.
Chapter 4 Extraction of microcystins from lake sediments using supercritical carbon dioxide
Evaluation of the applicability and efficiency of SFE of microcystins from lake sediments.
Comparison of the SFE and conventional methods for both natural and spiked sediment samples.
Chapter 5 Conclusions and recommendations

This page has been left blank intentionally.

Chapter 2. The effects of environmental variables on the spatial and temporal variability of microcystins in the sediments
SONG, H., REICHWALDT, E. S. & GHADOUANI, A. 2014. The effects of
environmental variables on the spatial and temporal variability of microcystins in
lake sediments. Toxions, (submitted).

This page has been left blank intentionally.

CHAPTER 2: VARIABLITY OF MICROCYSTINS IN LAKE SEDIMENTS
35
2.1 Abstract
Microcystins are toxins produced by cyanobacteria. They occur in aquatic systems
across the world and their occurrence is expected to increase in frequency and magnitude.
As microcystins are hazardous to humans and animals, it is essential to understand their
fate in aquatic systems in order to control the health risks. While the occurrence of
microcystins in sediments has been widely reported, the factors influencing their
occurrence and variability are not yet well understood. In the present study, microcystin
concentrations in lake sediments and their correlation with environmental variables were
analysed. Microcystins were detected in all sediment samples, with concentrations
ranging from 0.06 to 0.78 µg equivalent microcystin-LR/g sediments (dry mass). The
concentration of microcystins in the sediments had weak but significant correlation with
the concentration of intracellular microcystins, total microcystins and cyanobacterial
biomass in the surface water. The combination of total microcystins in surface water,
cyanobacterial biomass in the water, pH and temperature accounted for 46.7% of the
variability of microcystins in sediments. The present study highlights the importance of
the interaction between water and sediments in the distribution of microcystins in aquatic
systems.
Keywords: Cyanobacterial bloom; Microcystins; Cyanobacterial biomass; Sediments;
Spatial variability; Temporal variability

CHAPTER 2: VARIABLITY OF MICROCYSTINS IN LAKE SEDIMENTS
36
2.2 Introduction
Microcystins are produced by certain species of cyanobacteria and are hazardous to
humans and animals. Considered to be the most toxic group of cyanobacterial toxins,
microcystins are inhibitors of specific protein phosphatases and can cause skin irritations,
allergic reactions and gastroenteritis (Žegura et al., 2011). Humans are primarily exposed
to microcystins via drinking water consumption and accidental ingestion of recreational
water (Chorus et al., 2000, Funari and Testai, 2008). Recreational exposure by skin
contact or inhalation to microcystins is now a recognised cause of a wide range of acute
illnesses which can be life-threatening (de la Cruz et al., 2011). While microcystins have
been reported across the world (Zurawell et al., 2005), the frequency of their occurrence
in aquatic systems is expected to rise as a result of climate change (Moore et al., 2008,
Paerl and Huisman, 2009, El-Shehawy et al., 2012, Reichwaldt and Ghadouani, 2012,
Paerl and Paul, 2012). To control their associated health risks, it is therefore essential to
understand their fate in aquatic systems.
In aquatic systems, microcystins can be present not only in the water but also in the
sediments. They have been reported in a variety of sediments, with or without the
occurrence of benthic cyanobacteria (Mez et al., 1997). Microcystins were found in six
of eleven sediment samples collected from four Japanese eutrophic lakes, at
concentrations ranging from 0.08 to 2.33 µg/g d.m. (Tsuji et al., 2001). Similarly,
sediment samples collected from Brno reservoir (Czech Republic) showed concentrations
between 0.016 and 0.474 µg/g d.m. (Babica et al., 2006). The occurrence of microcystins
in lake sediments indicates that sediments might play an important role in the fate of these
toxins in aquatic systems (Corbel et al., 2014, Song et al., 2014). As their occurrence in
lake sediments is also a potential hazard to benthic organisms – for example, by altering

CHAPTER 2: VARIABLITY OF MICROCYSTINS IN LAKE SEDIMENTS
37
the organisms’ metabolism (Montagnolli et al., 2004, Mohamed et al., 2006) – their wide
occurrence in lake sediments should be of concern.
Studies on the distribution of microcystins in sediments of aquatic systems are limited
because it is hard to quantify the amount of microcystins present in sediments (Tsuji et
al., 2001). Earlier study shows that, with conventional solvents for toxin extraction, the
extraction efficiency strongly depends on the extraction solvent and was affected by the
type of sediment and the structures of the microcystins (Babica et al., 2006). The MMPB
(2-methyl-3-methoxy-4-phenylbutyric acid) method is widely considered to be an
effective analytical procedure for the total quantification of microcystins in lake
sediments. However, the necessary very low reaction temperature of -78°C is hard to
achieve. EDTA- sodium pyrophosphate solution as an extraction solvent proved to be
highly efficient and achieved over 90% recovery with the sediment samples used in the
study of Chen et al (2006). The easily extractable microcystins in the upper layer of lake
sediments should be area requiring more focus due to the frequent interaction with the
water column and the easy access for aquatic animals.
Microcystin concentrations in sediments have been shown to be highly variable on a
temporal and spatial scale. High microcystin concentrations have been found in sediments
during spring, followed by a decrease until the summer months when cyanobacterial
biomass in the water was at a maximum (Babica et al., 2007; Ihle et al., 2005). In contrast,
Chen et al. (2008) have found that the highest microcystin concentrations in sediments
usually occur during summers, when cyanobacterial biomass and microcystin production
are at a maximum. Microcystins have been reported at different depths of sediments
(Latour et al. 2007; Tsuji et al. 2001) – for example, their concentration decreased with
increased depth of sediment in Lake Taihu, China (Chen et al. 2008). However, no studies
have been carried out into the spatial variability of microcystins in sediments across a
lake.

CHAPTER 2: VARIABLITY OF MICROCYSTINS IN LAKE SEDIMENTS
38
Many factors have the potential to contribute to the variability of microcystins in lake
sediments. Ihle et al. (2005) reported that microcystin concentrations in the sediments of
a shallow lake were correlated to Microcystis biomass in the sediments. Similarly,
microcystin concentrations in the sediments of the Nile River and irrigation canal
sediments were correlated to the total count of cyanobacteria, particularly Microcystis
spp., and intracellular microcystins in the water (Mohamed et al., 2007). The
concentration of microcystins in sediments can also be influenced by the sedimentation
of suspended particles with absorbed microcystins (Wörmer et al., 2011) and the
adsorption of dissolved microcystins from the water (Tsuji et al., 2001, Babica et al., 2006,
Mohamed et al., 2007, Chen et al., 2008, Munusamy et al., 2012, Song et al., 2014).
Furthermore, the properties of sediments can influence their capacity to adsorb and
degrade microcystins in aquatic systems. These properties include organic matter content
and particle size fraction (sand, slit and clay) (Miller et al., 2001, Mohamed et al., 2006,
Chen et al., 2008, Munusamy et al., 2012). Additionally, physicochemical parameters of
lake water such as temperature, salinity and pH can influence the capacity of sediments
to adsorb and degrade microcystins (Miller et al., 2001, Wang et al., 2007, Liu et al., 2008,
Wu et al., 2011). To date, however, systematic studies on the correlation between the
variability of microcystins in lake sediments and potential contributing environmental
factors are lacking.
The present study aims to identify the spatial and temporal variability of microcystins
in the upper layer of sediments of a shallow, eutrophic lake, and to determine the
environmental variables contributing to the variability. We hypothesized that the
variability of microcystin concentration in lake sediments can be predicted using a
combination of environmental variables such as cyanobacterial biomass in the sediments,
cyanobacterial biomass and microcystins in the water, physicochemical parameters of
lake water and sediment characteristics.

CHAPTER 2: VARIABLITY OF MICROCYSTINS IN LAKE SEDIMENTS
39
2.3 Materials and methods
2.3.1 Study site
This study was conducted at Lake Yangebup in Western Australia (32°6'40"S,
115°50'00"E). Lake Yangebup is a shallow, eutrophic, permanent lake with about 68.4
ha of open water and a mean water depth of 2.5 m (Arnold and Oldham, 1997). In a
previous study in 2008-2010, the range of total phosphorus and total nitrogen in the water
column of Lake Yangebup was 0.49-6.98 µM and 0.14-0.37 mM respectively (Si Nang,
2012). Toxic cyanobacterial blooms dominated by Microcystis spp. frequently occur in
this lake and microcystins are present in the water most of the year (Kemp and John,
2006, Reichwaldt et al., 2013, Sinang et al., 2013). The range of concentration of
microcystins in the water column was 1-66 µg equivalent microcystin-LR/L in a previous
study in 2008-2009 (Si Nang, 2012). Lake Yangebup is a groundwater through-flow lake
that receives groundwater from the east and discharges it to the west. The lake is usually
mixed and stratification only occurs on days that receive high insolation with wind speeds
< 6 m/s (Arnold and Oldham, 1997). It is surrounded by dense fringing vegetation and an
earlier investigation has reported the presence of a flocculate sediment layer covering a
more consolidated sediment (Arnold and Oldham, 1997).

CHAPTER 2: VARIABLITY OF MICROCYSTINS IN LAKE SEDIMENTS
40
Figure 2.1: Study site and wind conditions. (A) Map of Lake Yangebup with sampling sites (coordinates for sites 1-4 are 32°07'21"S, E115°49'45", 32°07'07"S, 115°49'31"E, 32°6'50"S, 115°49'43"E and 32°07'11"S, 115°50'07"E respectively) ; (B) Wind speed and direction for the sampling days and the two antecedent days for each month. Wind measurements were taken at 9 am and 3 pm of each day, resulting in 4 measurements for each month, represented by a line with either a dot or an arrow in wind direction (from: Reichwaldt et al 2013, which is a study that was performed in parallel to the study presented here).
2.3.2 Sampling and sample analyses
Samples were taken monthly between August and December 2010 from four shore sites
of Lake Yangebup (Figure 2.1A). Sampling sites were chosen because they could
surround the whole lake and they were accessible. All samples, taken between 7:30 am
and 1:30 pm from water at a depth of 0.6-0.7 m from the surface, were stored on ice in
the dark for transport to the laboratory. Temperature, pH, salinity and dissolved oxygen
were taken in-situ from 10 cm below the surface water (referred to as ‘surface water’) and
directly above the sediments (referred to as ‘overlying water’) with probes (WP-81; TPS-
DO2). There was no significant difference for these parameters (ANOVA, p > 0.05)
between sites and the average values of these parameters are given in Table 2.1. At each

CHAPTER 2: VARIABLITY OF MICROCYSTINS IN LAKE SEDIMENTS
41
site, measurements for both surface water and overlying water were taken above the
points where sediment samples were collected. Dissolved and intracellular toxins in
surface water samples as well as cyanobacterial biomass in surface water and overlying
water samples were quantified in the laboratory.
Table 2.1: Physicochemical parameter means in each sampling month in Lake Yangebup. - indicates no measurement due to failure of the probe. DO means dissolved oxygen.
Temperature (°C)
Salinity (mg/L)
DO (%)
DO (mg/L)
pH
August 15.8 945 54.6 5.6 8.4 September 18.4 950 55.6 5.2 8.7 October 21.1 1113 64.0 5.8 8.3 November 22.9 1204 - - 8.5 December 21.9 1239 - - 9.3
For each sampling site, three sediment samples (0–4 cm) were collected with a
transparent, polycarbonate sediment corer with a stainless-steel cutter (50 mm in
diameter). The detailed design of this sediment corer and the details of the sediment
sampling operation were given in Linge and Oldham (2002). In brief, to avoid disturbing
the sediment inside the corer, the corer was manually pushed into the lake sediments with
the handle removed, the tube filled with water and the top sealed with a plastic screw cap.
The sediments were then gently pushed out after siphoning off the overlying water
column. Sediments in each sample were thoroughly mixed for quantification of
cyanobacterial biomass, microcystin concentrations, and sediment characteristics. Wind
direction and speed data came from the Australian Bureau of Meteorology monitoring
station at Jandakot Airport, which is 3km from Lake Yangebup (Figure 2.1B).
Mean daily air temperature of 14 days before the sampling day, recorded by weather
stations located nearest to Lake Yangebup, was used as a substitute for surface water
temperature in the data analysis, because water temperature depends strongly on the time
of day when sampling takes place. Earlier studies reported a good correlation between
water temperature in shallow lakes and air temperature, and found that microcystin

CHAPTER 2: VARIABLITY OF MICROCYSTINS IN LAKE SEDIMENTS
42
concentration in the water could be best predicted by mean daily air temperature of the
preceding 14 days (Yen et al., 2007).
The analysis of particle size was adapted from Bowman and Hutka (2002). . The
adaptions included heating the samples for a quicker digestion of the organic matter and
removing the hydrogen peroxide by sequential dilution instead of evaporation. The
particle size distribution analyser used was the Malvern Mastersizer 2000 particle size
analyser with a Malvern Hydro 2000G automated wet dispersion accessory. Organic
matter, measured by loss-on-ignition, was analysed according to Heiri et al. (2001) but
with samples dried in an oven at 110°C overnight instead of freeze drying. The organic
matter content of sediments in Lake Yangebup ranged from 0.55% to 6.17%. With respect
to particle size distribution, all sediment samples were sand, consisting of coarse and fine
sand particles with a coarse sand content. of 88 ± 10.12%. The particle size distribution
for sediment samples at each sampling site are given at Table 2.2.
Table 2.2: Particle size fractions of sediment samples at each sampling site
Sampling sites
Clay % (< 2 µm)
Silt % (2-20 µm)
Fine sand % (20-200 µm)
Coarse sand % (200-2000 µm)
Total sand %
Site 1 0 0 13.12±6.45 86.88±6.45 100 Site 2 0 0 21.05±2.71 78.95±2.72 100 Site 3 0 0 10.66±2.88 89.40±2.88 100 Site 4 0 0 3.22±0.87 96.78±0.87 100
2.3.2.1 Analysis of dissolved microcystins in the water
Surface water samples, 900–1000 ml for each water sample, were first filtered through
pre-combusted GF/C filters (Whatman). Each filtrate was then applied to a solid phase
extraction (SPE) cartridge (Oasis HLB 6cc/500mg, Waters, Australia) with a flow rate <
10 ml per minute for cleaning and concentration. Afterwards, the cartridge was washed
with 5 ml of 10% and 20% (v/v) methanol in sequence before blowing a constant air flow
through the cartridge for drying. Microcystins were eluted from the cartridge with 5 ml
of 100% methanol + 0.1% trifluoroacetic acid (v/v). The elutes were dried with nitrogen

CHAPTER 2: VARIABLITY OF MICROCYSTINS IN LAKE SEDIMENTS
43
gas at 45°C before being re-dissolved in 1 ml of 30% acetonitrile (v/v) and analysed by
high-performance liquid chromatography (HPLC) with a photodiode detector (1.2 nm
resolution) (Waters Alliance 2695) and an Atlantis® T3 separation column (4.6x150mm
i.d, 3 µm, 100 Å). The HPLC gradient was identical to Lawton et al. (1994), but with a
maximum of 100% acetonitrile and therefore a longer run time of 37 min. Column
temperature was 37.5 ± 2.5 °C and the limit of detection was 1.12 ng. Our limit of
quantification was 3x the limit of detection. Peaks that showed a typical microcystin
absorption spectrum with a maximum at 238.8 nm were quantified by comparing the peak
area with the area of a known standard (microcystin-LR; Sapphire, Australia).
2.3.2.2 Analysis of intracellular microcystins in the water
Water samples were filtered on pre-combusted and pre-weighed GF/C filters
(Whatman). Filters were dried at 60°C for 24 hours (h) before being re-weighed to
quantify biomass and stored at -21°C until microcystin extraction. Before the extraction
of microcystins, the filters were thawed and re-frozen three times. The extraction was
achieved with 6 ml of 75% methanol (v/v) per filter. Filters were sonicated on ice for 25
min, followed by gentle shaking for another 25 min. The extracts were then centrifuged
at 3,273×g (Beckman and Coulter, Allegra X-12 Series) for 10 min. at room temperature.
Extracts were collected and filters were extracted two more times. After the three
extractions, the supernatants were combined and diluted with Milli-Q water to 20%
methanol (v/v) before they were applied to SPE cartridges (Oasis HLB 6cc/500mg,
Waters, Australia). The subsequent analysis procedure was identical to that used for the
dissolved microcystin analysis.
2.3.2.3 Analysis of total microcystins in the sediments
The method used for quantification of microcystins in the sediments was adapted from
Babica et al., 2006. In short, each freeze-dried sediment sample, 2.0-2.2 g (dry weight),

CHAPTER 2: VARIABLITY OF MICROCYSTINS IN LAKE SEDIMENTS
44
was extracted twice with 20 ml of 5% acetic acid in 0.2% trifluoroacetic acid - methanol
using an ultrasonic bath for 30 min. After each extraction, the centrifuge tube was
centrifuged for 10 min at 3,273×g (Allegra X-12, Beckman Coulter) and the supernatants
from both extractions were combined, diluted with Milli-Q water to 20% methanol (v/v)
and then applied to SPE cartridges (Oasis HLB 6cc/500mg, Waters, Australia). The
subsequent analysis procedures – such as the cleaning and concentration of microcystins
using SPE cartridges and the quantification of microcystins with HPLC – were identical
to those used for the dissolved microcystin analysis.
In a preliminary laboratory test, the recovery rate for microcystin-LR in the sediment
samples using the method described above is 87%, while a low recovery rate of 32% was
achieved using the EDTA method as described in Chen et al. (2006). Therefore, in the
current study, 5% acetic acid in 0.2% trifluoroacetic acid-methanol was adopted to extract
microcystins from the sediment samples. However, due to the limitation of this extraction
method, the microcystins in the sediments in this study represent the easily extractable
microcystins.
Throughout this study, we refer to the total concentration of microcystin variants per
sample as microcystin concentration. Total microcystin concentration (intracellular +
dissolved) is expressed as micrograms (microcystin-LR mass equivalents) per litre water,
intracellular microcystin concentration is expressed as micrograms (microcystin-LR mass
equivalents) per gram cyanobacterial dry mass and the total concentration of microcystin
variants per sediment (easily extractable microcystins) is micrograms (microcystin-LR
mass equivalents) per gram dry sediments.
2.3.2.4 Cyanobacterial biomass in the sediments and water
The cyanobacterial biomass of each water sample was measured in the laboratory with
a bench top version of the FluoroProbe (bbe Moldaenke, Germany) as µg chl-a/L (Beutler

CHAPTER 2: VARIABLITY OF MICROCYSTINS IN LAKE SEDIMENTS
45
et al., 2002, Ghadouani and Smith, 2005). A strong linear correlation was found between
the chlorophyll-a concentration measured with FluoroProbe and the chlorophyll-a
concentration measured with the standard method (R2 = 0.94, N = 32, p < 0.05) in an
earlier study (Si Nang, 2012). Sediment samples were washed with tap water until no
cyanobacteria colonies in the sediments could be observed microscopically. The tap water
was filtered through gauze (63 µm) to capture these colonies, which were then transferred
with 30 ml of deionized water into a 100 ml glass bottle. This washing procedure was
repeated twice and the cyanobacterial colonies were combined in a total of 100 ml
deionized water. The concentration of cyanobacterial biomass in this bottle was
quantified using the bench top version of the FluoroProbe (bbe Moldaenke, Germany) as
µg chl-a/L (Beutler et al., 2002, Ghadouani and Smith, 2005).
2.3.2.5 Statistical analyses
Differences between sites were analysed using a one-way analysis of variance
(ANOVA) when the data was normally distributed, and a Kruskal-Wallis ANOVA on
ranks with a Bonferroni t-test when the data failed the normality test. Differences between
months were analysed with a repeated-measures ANOVA with a Bonferroni t-test when
the data was normally distributed, and a Friedman repeated-measures ANOVA on ranks
with a Bonferroni t-test when the data failed the normality test (Table 2.1). Pearson’s
correlations were calculated to identify the correlation between the concentration of
microcystins in lake sediments and environmental variables (Table 2.2)
Multiple linear regression (stepwise) were carried out to identify the model that best
explained the variability in the concentration of microcystins in the sediments, with 0.05
as the probability of F-to-remove. Prior to the statistical analyses, the linearity of the
microcystin concentration in sediments and the environmental variables hypothesised to
control microcystin variability were tested by scatterplots. Both dependent and

CHAPTER 2: VARIABLITY OF MICROCYSTINS IN LAKE SEDIMENTS
46
independent variables were log-transformed and checked for normality by means of the
Shapiro-Wilk test. Partial correlation coefficients and part (semi-partial) correlation
coefficients were calculated to determine the specific portion of variance explained by a
given environmental variable in the multiple linear regression analysis. Statistical
analyses were conducted in SigmaPlot 11.0 (Systat Software Int.) and statistical package
for the social sciences (SPSS ) 17.0 (SPSS Inc.). Significance levels were set as p < 0.05
unless stated otherwise.
2.4 Results
2.4.1 Temporal and spatial variability of microcystin concentration in sediments
Microcystins were detected in all sediment samples, with their concentration ranging
from 0.06 (S2; Sept.) to 0.78 µg/g d.m (S2; Aug.) (Figure 2.2). The average microcystin
concentration in sediments decreased from August to September but increased from
September to December (Figure 2.3A). The lowest average concentration was observed
in September (0.13 µg/g d.m.) and the maximum average concentration was observed in
August (0.46 µg/g d.m.).

CHAPTER 2: VARIABLITY OF MICROCYSTINS IN LAKE SEDIMENTS
47
0
50
100
150
200
250
Aug Sep Oct Nov Dec
CB
in w
ater
(µg
chl-a
/L)
0
50
100
150
200
250S4
0.0
0.2
0.4
0.6
0.8
1.0
02468
1012
S1
Months
Aug Sep Oct Nov Dec
MC
s in
sed
imen
ts (µ
g/g
d.m
.)
0.0
0.2
0.4
0.6
0.8
1.0
MC
s in
wat
er (µ
g/L)
02468
1012
S3
*
S2
Figure 2.2: Microcystin concentration (MCs) in sediments (●), total microcystin concentration in water (▲) and cyanobacterial biomass (CB) (○) in water as a function of time at sites 1 - 4 (S1 - S4). CB in water is the calculated mean between CB in surface and overlying water. * indicates a very high value of 1113.2 µg chl-a/ L for cyanobacterial biomass in November. Error bars represent one standard error (with n = 3 for MC concentration in sediments and n = 2 for CB biomass in water).
The temporal variability of microcystin concentrations in sediments was different for
each sampling site (Figure 2.2). There was a significant difference in microcystin
concentration between months in the sediments at sites 1–3 but not at site 4 (Table 2.3)
where the smallest temporal variability of microcystins in sediments occurred (Figure
2.3B). Furthermore, the changes in microcystin concentrations in the sediment were
similar at sites 1 and 2 (Figure 2.2), where they decreased from August to September
followed by an increase in October and a decrease until December. In contrast, the
microcystin concentration in the sediments at site 3 decreased from August to September
but then increased until December. The maximum concentration of microcystin at site 3
was observed in December (Figure 2.2).

CHAPTER 2: VARIABLITY OF MICROCYSTINS IN LAKE SEDIMENTS
48
MonthAug Sep Oct Nov Dec
MC
s in
sed
imen
ts
(µg/
g d.
m.)
0.0
0.2
0.4
0.6
0.8
1.0A
SiteSite1 Site2 Site3 Site4
B
Figure 2.3: Spatial (A) and temporal variability (B) of microcystin concentrations in lake sediments. Boxes represent the 25th and 75th percentiles; solid lines within the boxes mark the median, dashed lines indicate the mean. Whiskers represent the largest and smallest observed values excluding the outliers. Filled circles represent outliers (>1.5 box lengths) (n=15).
The spatial variability of microcystin concentrations in sediments was different in each
month. In August, microcystin concentration in sediments at site 4 was significantly lower
than at any other site; in November and December, microcystin concentration was
significantly higher at site 3 than at any other sites (Table 2.3; Figure 2.2); and in
September and October, no significant differences in microcystin concentration between
sites were observed. The largest spatial variability of microcystins in sediments occurred
in August, while the smallest occurred in September (Figure 2.3A). On average, the
microcystin concentration in sediments was highest at site 3 and lowest at site 4 (Figure
2.3B).

CHAPTER 2: VARIABLITY OF MICROCYSTINS IN LAKE SEDIMENTS
49
Table 2.3: Statistical results for differences between sites (one-way ANOVA or Kruskal-Wallis ANOVA on ranks) and between months (repeated-measures ANOVA or Friedman repeated-measures ANOVA on ranks) of microcystin concentrations in the sediments and other environmental variables in the sediments and water. * indicates p < 0.05. n.s. means not significant.
Environmental variables Differences between months
Differences between sites
Microcystins in sediments (µg/g d.m.)
F(4,14) = 9.3 (site 1) * F(4,14) = 36.2 (site 2) * F(4,14) = 41.1 (site 3) * n.s. (site 4)
H=10.5 d.f. = 3 (Aug)*
n.s. (Sep) n.s. (Oct)
F(3,11) = 21.5 (Nov) * F(3,11) = 21.4 (Dec) *
Cyanobacterial biomass in sediments (µg chl-a/g d.m.)
F(4,14) = 9.9 (site 1) * n.s. (site 2) n.s. (site 3) F(4,14) = 3.9 (site 4) *
H = 8.8, d.f. = 3 (Aug)* F(3,11) = 8.6 (Sep) * n.s. (Oct) n.s. (Nov) H = 9.5, d.f. = 3 (Dec)*
Cyanobacterial biomass in surface water (µg chl-a/ L)
F(4,18) = 19.7 * H=11.2, d.f. = 3 *
Cyanobacterial biomass in overlying water (µg chl-a/L)
F(4,18) = 4.8 * n.s.
Intracellular microcystin concentration in water (µg/L)
F(4,19) = 10.9 * n.s.
Dissolved microcystin concentration in waters(µg/L)
χ2 = 11.8, d.f. = 4 * n.s.
Organic matter (%) F (4, 19) = 10.9* F (3,19) = 8.3*
2.4.2 Temporal and spatial variability of environmental variables
Cyanobacterial biomass in sediments varied significantly at sites 1 and 4 during the
study (Table 2.3), and was significantly different between sites in August (biomass at site
3 was significantly higher than at site 4), September (biomass at site 3 was significantly
higher than at sites 2 and 4) and December (biomass at site 2 was significantly higher
than at site 4) (Table 2.3).
Cyanobacterial biomass averaged over the water column (surface + overlying samples)
showed a similar temporal trend at all sites and was higher at site 3 compared to at all
other sites (Figure 2.2). On average, there were a significant difference in cyanobacterial
biomass in surface water between sites, with site 3 having a higher biomass than site 4

CHAPTER 2: VARIABLITY OF MICROCYSTINS IN LAKE SEDIMENTS
50
(Table 2.3), and between months, with a higher cyanobacterial biomass in December
compared to September, October and November (Table 2.3). While cyanobacterial
biomass in the overlying water was on average also significantly different between
months (higher in December than in September), there was no difference in
cyanobacterial biomass in the overlying water between the sites (Table 2.3).
Total microcystin concentration (intracellular + dissolved) in surface water showed a
similar trend to cyanobacterial biomass in the water (Figure 2.2). On average, intracellular
and dissolved microcystin concentrations in surface water were both significantly
different between months (Table 2.3), with December concentrations being higher
compared to all other months. On average, no difference was observed in intracellular
and dissolved microcystin concentration between sites (Table 2.3).
Organic matter content in sediment samples was different between sites, with site 3
having a higher content than sites 2 and 4, and between months, with the content being
significantly higher in December compared to all other months (Table 2.3).
2.4.3 Correlation between microcystins in the sediments and environmental variables
Linear correlations (Pearson’s correlations) were calculated between microcystin
concentration in sediments and other environmental variables (Table 2.4). Microcystin
concentration in the sediments had a weak but significant linear correlation with the
concentration of intracellular microcystins in the surface water (R2 = 0.103, p < 0.05),
total microcystins in the surface water (R2 = 0.091, p < 0.05), cyanobacterial biomass in
the surface water (R2 = 0.129, p < 0.05) and cyanobacterial biomass in the overlying water
(R2 = 0.225, p < 0.0001). A strong and significant correlation was observed between
cyanobacterial biomass in surface water and overlying water (R2 = 0.90, p < 0.05)
Table 2.4: Pearson’s correlation values (R) between microcystin concentrations (MC) in the sediments (µg/g d.m.) and environmental variables.

CHAPTER 2: VARIABLITY OF MICROCYSTINS IN LAKE SEDIMENTS
51
CB sediments
Intracell. MC
Dissolved MC
Total MC
CB overlying
CB surface
OM
MC sediments
-0.06 0.29 * 0.11 0.30* 0.47 * 0.36 * 0.21
Note: *: a significant correlation (p < 0.05); - : a negative relationship; CB sediments: cyanobacterial biomass in the sediments (µg chl-a /g d.m.); Intracell. MC: intracellular microcystin concentration in the surface water (µg/L); Dissolved MC: dissolved microcystin concentration in the surface water (µg/L); CB overlying: cyanobacterial biomass in the overlying water (µg chl-a/L); CB surface: cyanobacterial biomass in the surface water (µg chl-a/L); OM: the percentage of organic matter (weight) in the sediments.
2.4.4 Prediction of microcystin concentrations in sediments from environmental variables
The total concentration of microcystins in the surface water (c(tMC water)),
cyanobacterial biomass in overlying water (c(CB overlying)) and surface water (c(CB
surface)), pH, temperature and salinity in the water, were used to fit linear regression
models in order to determine which set of variables best explained patterns in the
concentration of microcystins in the sediments (c(MC sediments)). The best regression
model was:
Log c(MC sediments) = 11.023 + 0.329Log c(tMC water) + 0.221Log c(CB overlying)
– 9.975 Log pH – 1.015Log temperature (R2 = 0.467, p < 0.05, standard error of the
estimate = 0.232).
Total microcystins in the surface water, cyanobacterial biomass in the overlying water,
pH and temperature explained 46.7% of the variability of microcystins in the sediments.
Partial and part correlation coefficients revealed that cyanobacterial biomass in overlying
water explained 20.8% of the total variation while total microcystins in water explained
12.3% of the total variance. Physicochemical parameters (pH and temperature) explained
13.6% of the total variability.

CHAPTER 2: VARIABLITY OF MICROCYSTINS IN LAKE SEDIMENTS
52
2.5 Discussion
Microcystins were detected in all sediment samples in this study, even at site 4 where
only little cyanobacterial biomass occurred in the water in most months (Figure 2.2),
indicating the wide presence of microcystins in the lake’s sediments. Microcystins in lake
sediments have their origin in three main processes: (1) lysis of cyanobacterial cells in
sediments; (2) transfer from a dissolved status to sediments by adsorption; (3) grazing by
aquatic animals and the subsequent sinking of faecal pellets containing microcystins
(Chen et al., 2008). In our studied lake, cyanobacterial blooms were dominated by toxic
Microcystis spp. and microcystins in the water occur most of the year (Kemp and John,
2006, Sinang et al., 2013, Reichwaldt et al., 2013) which is consistent with our study.
Microcystins can therefore accumulate in the sediments as a result of the sediment’s long-
term exposure to cyanobacterial biomass at the bottom of the lake and microcystins in the
water. The occurrence of microcystins in lake sediments associated with cyanobacterial
bloom history has been reported in earlier studies (Tsuji et al., 2001, Ihle et al., 2005,
Babica et al., 2006, Mohamed et al., 2007, Chen et al., 2008).
Microcystin concentration in the sediments had weak but significant correlation
withthe concentration of intracellular toxins in the surface water and cyanobacterial
biomass in the overlying water (Table 2.2). In contrast, Mohamed et al. (2007) reported
a significant and strong correlation between the concentration of microcystins in
sediments and intracellular microcystins in water. Additionally, no significant correlation
between microcystin concentration and cyanobacterial biomass in sediments was
observed in the present study. This might be because the current study focused on the
upper layer of sediments in the shallow lake, where benthic populations of Microcystis
are exposed to dynamic interactions with the planktonic population through the
recruitment and sediment processes. These interactions can induce rapid modifications in
the benthic populations by depleting them or by introducing new colonies, thus making

CHAPTER 2: VARIABLITY OF MICROCYSTINS IN LAKE SEDIMENTS
53
the population of Microcystis microcystin concentrations in sediment more dynamic.
There is also increasing evidence that the microcystin dynamics in freshwater lakes
largely resulted from successional replacement of a multitude of cyanobacterial
genotypes that differ in microcystin production (Sivonen and Jones, 1999; Kurmayer et
al., 2004, Briand et al., 2008).
The temporal variability of microcystins in the lake’s sediments was site specific and
the spatial variability in their concentration was different in each sampling month.
Although a significant change of microcystin concentration occurred over time at sites 1–
3 during the sampling months, the pattern was different between sites (Figure 2.2).
Noticeably, a significant increase in the concentration of cyanobacterial biomass in the
water column, from August to December did not result in a significant change in the
concentration of microcystins in the sediments (Figure 2.2). Furthermore, we did not find
a correlation between cyanobacterial biomass in the sediments and microcystins in the
sediments. Instead, cyanobacterial biomass in the overlying water and total microcystin
concentrations in the surface water accounted for most of the variability in the
concentration of microcystins in the sediments. This highlights clearly that the variability
of microcystins in the sediments can be predicted by multiple environmental factors and
emphasises the important link between the water and sediment, with processes that take
place in the water exerting a strong influence on the sediment.
A multiple linear regression analysis revealed that the microcystin concentration in
sediments decreased with increasing pH and temperature. This result is in agreement with
previous studies reporting the influence of pH and temperature on the capacity of
sediments to adsorb and degrade microcystins. In these studies, it was observed that
higher temperatures increased the sediments’ capability to biodegrade microcystins,
aiding the removal of these toxins from aquatic systems (Wang et al., 2007, Ho et al.,
2007). This might because higher temperature could increase the metabolic activity of the

CHAPTER 2: VARIABLITY OF MICROCYSTINS IN LAKE SEDIMENTS
54
bacteria capable of degrading microcystins. Previous studies have also shown that lower
pH increases the capacity of sediments to adsorb microcystins (Miller et al., 2001, Liu et
al., 2008, Wu et al., 2011). Wu et al. (2012) suggested that pH acts in this way by
influencing the surface charge heterogeneity of microcystins and sediments. Overall,
cyanobacterial biomass in overlying water and total microcystin concentrations in the
water (the sum of dissolved microcystins and intracellular microcystins) accounted for
the most variability in the concentration of microcystins in the sediments. This finding
emphasises the important connection between the water and sediment, with processes
taking place in the water exerting a strong influence on the sediment.
Approximately 53% of the variability of microcystins in the sediments could not be
explained by the multiple linear regression analysis developed for this study. The
unexplained variability could be caused by other environmental factors. For example,
wind mixing is potentially an important contributing factor needing further consideration.
The wind speed during the sampling period ranged from 0.6 to 15.6 m/s with varying
wind directions (Figure 2.1B). As a result of a wind mixing, increased exchange of
microcystins between sediments and water could occur, with microcystins spreading
across the lake through water movement. The recruitment process could also explain the
high heterogeneity of microcystin concentrations observed on a temporal and spatial scale
(Latour et al., 2004, 2007) because Microcystis colonies might have a resuspension from
shallow zones and redeposition in deeper zones and therefore cause uneven distribution
of Microcystis population. In addition, biodegradation may play a key role in mediating
the fate of microcystins. Biodegradation of microcystins by bacteria has been reported in
lake water (Lahti et al., 1997, Edwards et al., 2008, Ho et al., 2012b, Ho et al., 2012c). A
previous study from 2010 to 2011 by Song et al. (2014) showed that sediments from Lake
Yangebup could contribute to the removal of microcystin-LR from the water by both the
biodegradation and adsorption ability of the sediment while biodegradation was shown to

CHAPTER 2: VARIABLITY OF MICROCYSTINS IN LAKE SEDIMENTS
55
be the dominant removal process. Therefore, the effect of the recruitment process and
bacterial communities on the distribution of microcystins in the sediments is required in
future studies. Such work should improve the prediction of the variability of microcystins
in the sediments.
The physical and chemical properties of sediments – for example, organic matter
content and particle size fraction (sand, slit and clay) – have the potential to influence
their capacity to adsorb and degrade microcystins (Miller et al., 2001, Mohamed et al.,
2006, Chen et al., 2008, Munusamy et al., 2012, Song et al., 2014). In the current study,
no clay was present in the sediments and no significant correlation between the
concentration of microcystins and organic matter content in sediments was observed
(Table 2.2). In contrast, Mohamed et al. (2007) observed that in the Nile River, Egypt,
the capacity of sediments to adsorb microcystins was significantly correlated to their clay
and organic matter content. Wu et al. (2011) found that the adsorption process for
microcystins to sediments mainly depended on a sediment’s organic matter. The
significance of organic matter and clay in the binding and degradation of microcystins to
soils and sediments has been reported in many other studies (Donati et al., 1994, Rapala
et al., 1994, Lam et al., 1995b, Lambert et al., 1996, Morris et al., 2000, Miller et al., 2001,
Grut macher et al., 2010).
The present study has highlighted the important role played by the interaction of water
and sediments in the distribution of microcystins in an aquatic system. Generally speaking,
the concentration of microcystins in the sediments was significantly correlated to the
concentration of intracellular microcystins and cyanobacterial biomass in the surface
water. A significant part (46.7%) of the variability of microcystins in lake sediments could
be explained by a combination of total microcystins in the surface water, cyanobacterial
biomass in the overlying water and physicochemical parameters of the water (pH and
temperature). However, the spatial variability of microcystins concentrations in

CHAPTER 2: VARIABLITY OF MICROCYSTINS IN LAKE SEDIMENTS
56
sediments was different in each sampling month and their temporal variability was site
specific.
For the management of bloom-prone water bodies, it is important to holistically
understand the fate of microcystins in the aquatic systems. Current studies and policies
focusing on microcystins in aquatic systems almost exclusively concentrate on the water
column while sediments are mostly neglected. However, there is strong evidence from
this and earlier studies that microcystins are widely present in sediments. Considering the
potential ecological hazards with the occurrence of microcystins in lake sediments,
researchers and water management authorities should include sediments when assessing
the potential hazards of microcystins in aquatic systems.To gain a broader understanding
of the occurrence of microcystins in the sediments, it will be necessary to further
investigate the variability of microcystins in different aquatic systems. As shown in the
current study, there is an important connection between the water and the sediments that
influences the distribution of microcystins in aquatic systems. However, the present study
was limited to a shallow lake where there is a relatively high interaction between water
and sediments. The correlation between the variability of microcystins in sediments and
environmental variables may differ in a deep lake. Therefore, different aquatic systems
need to be investigated to broaden this understanding.
2.6 Acknowledgements
This work was supported by the Australian Research Council Linkage Scheme
(LP0776571) and the Water Corporation of Western Australia. Haihong Song was
financially supported by a China Scholarship sponsored by the China Scholarship Council
and The University of Western Australia (UWA). The authors would like to thank the
UWA Centre for Applied Statistics for statistical advice and Dr Kristin Argall, Shian Min
Liau and Randica Jayasinghe for comments on an earlier draft.

Chapter 3. Contribution of sediments in the removal of microcystin-LR from the water
SONG, H., REICHWALDT, E. S. & GHADOUANI, A. 2014. SONG, H.,
REICHWALDT, E. S. & GHADOUANI, A. 2014. Contribution of sediments in the
removal of microcystin-LR from the water. Toxicon. 10.1016/j.toxicon.2014.02.019.

58
This page has been left blank intentionally.
CHAPTER 3: CONTRIBUTION OF SEDIMENTS IN THE REMOVAL OF MCLR
59
3.1 Abstract
Microcystins are produced by several species of cyanobacteria and can harm aquatic
organisms and human beings. Sediments have the potential to contribute to the removal
of dissolved microcystins from the water body through either adsorption to sediment
particles or biodegradation by the sediment’s bacterial community. However, the relative
contribution of these two removal processes remains unclear and little is known about the
significance of sediment’s overall contribution. To study this, changes in the
concentration of microcystin-LR (MCLR) in the presence of sediment, sediment with
microbial inhibitor, and non-sterile lake water were quantified in a laboratory experiment.
Our results show that, in the presence of sediment, MCLR concentration decreased
significantly in an exponential way without a lag phase, with an average degradation rate
of 9 µg/d in the first 24 h. This indicates that sediment can contribute to the removal of
MCLR from the water immediately and effectively. Whilst both, the biodegradation and
adsorption ability of the sediment contributed significantly to the removal of MCLR from
the water body, biodegradation was shown to be the dominant removal process. Also, the
sediment’s ability to degrade MCLR from the water was shown to be faster than the
biodegradation through the bacterial community in the water. The present study
emphasizes the importance of sediments for the removal of microcystins from a water
body. This will be especially relevant in shallow systems where the interaction between
the water and the sediment is naturally high. Our results are also useful for the application
of sediments to remove microcystins at water treatment facilities.
Keywords: Cyanobacterial toxins; Microcystins; Environmental fate; Sediment;
Biodegradation; Adsorption;

CHAPTER 3: CONTRIBUTION OF SEDIMENTS IN THE REMOVAL OF MCLR
60
3.2 Introduction
The occurrence of cyanobacterial blooms in aquatic systems poses a threat to the
ecosystem’s organisms and public health and cause extreme aesthetic problems
(Ghadouani and Coggins, 2011, Chorus et al., 2000, Ghadouani et al., 2003, Ghadouani
et al., 2006). Several genera of cyanobacteria, such as Microcystis spp., Anabaena spp.,
Nostoc spp., and Oscillatoria spp. can produce microcystins (Carmichael, 1997).
Microcystins have caused livestock, pet, and wildlife death across the world and have
also implicated human illness and death through water or dialysis fluid (Codd et al., 1999,
Chorus et al., 2000, Falconer, 2001, El-Shehawy et al., 2012). There are over 90
microcystin variants reported so far and microcystin-LR (MCLR) is among the most
common (Hotto et al., 2008). Because of the potential for chronic toxicity from
microcystins, the World Health Organization (WHO) has established a provisional
guideline value of 1 µg/L and 20 µg/L for total MCLR concentrations in drinking and
recreational water, respectively (WHO, 1998, WHO, 2003).
To assess the potential risk of human and animal exposure to microcystins, it is crucial
to understand the fate of microcystins in aquatic systems. Microcystins are produced
within the cyanobacterial cells and released into the surrounding water when cells lyse
under unfavourable conditions (Watanabe et al., 1992b). The toxins thus end up in a
dissolved form in the water body. However, dissolved microcystins in natural waters
usually do not last for long. Many processes can influence the persistence of the dissolved
microcystins in aquatic systems. In the water, these processes include photolysis, the up-
take by organisms, biodegradation by bacteria (Welker et al., 2001), and adsorption to
settling particles (Wörmer et al., 2011). Sediments also have the ability to remove
microcystins from the water. The two major processes for this are biodegradation by the

CHAPTER 3: CONTRIBUTION OF SEDIMENTS IN THE REMOVAL OF MCLR
61
bacterial community within the sediment and adsorption to sediment particles (Corbel et
al., 2014).
Adsorption of microcystins to sediments occurs when microcystins bind to the surface
of the sediments, usually at a specific site and previous studies have reported on the
presence of microcystins in natural sediment samples (Tsuji et al., 2001, Chen et al.,
2006a, Mohamed et al., 2007). The capability of sediments to adsorb microcystins was
further confirmed in batch experiments in the laboratory (Mohamed et al., 2007,
Munusamy et al., 2012). Also, Rivasseau et al. (1998) reported that after three days in
laboratory experiment only 10% of microcystins were adsorbed on suspended articles and
7% on the sandy sediments. However, although current studies clearly indicated that
adsorption on sediments contributes to the detoxification of the microcystins under
natural conditions, the significance of its contribution compared to the other
detoxification mechanisms is not yet clear.
Biodegradation is the second major process that influences the fate of microcystins in
aquatic systems (Dziga et al., 2013). Biodegradation of microcystins by bacteria was
reported in lake water (Jones and Orr, 1994, Lahti et al., 1997, Edwards et al., 2008, Ho
et al., 2012b, Ho et al., 2012c), lake sediments (Cousins et al., 1996, Holst et al., 2003),
estuarine water (Lemes et al., 2008), sand filters (Bourne et al., 2006), various biofilms
(Saito et al., 2003, Babica et al., 2005, Wu et al., 2010) and artificial media (Ji et al.,
2009). Meanwhile, bacteria capable of degrading cyanobacterial toxins have been isolated
from water, sand filters, coastal lagoon and even an operating anthracite bio-filter (Jones
and Orr, 1994, Bourne et al., 1996, Takenaka and Watanabe, 1997, Park et al., 2001, Holst
et al., 2003, Chen et al., 2007, Eleuterio and Batista, 2010, Ho et al., 2012b). Therefore,
Ho et al. (2012a) highlights biological treatment options to be implemented in treatment
plants for optimum cyanobacterial toxins removal.

CHAPTER 3: CONTRIBUTION OF SEDIMENTS IN THE REMOVAL OF MCLR
62
Understanding the underlying mechanisms for the contribution of sediments to the
removal of microcystins in the water is important; this includes a quantification of the
relative contribution of biodegradation and adsorption by sediments. Firstly, it helps to
understand the fate of microcystins in aquatic systems which may lead to better
management. Secondly, better treatment methods for microcystin-contaminated water
may be established based on the understanding of the natural attenuation mechanisms of
microcystins in the aquatic system. Gru zmacher et al. (2010) investigated the parameters
affecting microcystin elimination during sediment passage and found that adsorption of
microcystins played a minor role, while biodegradation was identified as the dominant
process. Their study used autoclaved sediments. However, an earlier study indicated that
autoclaving sediments might destroy soil structure, decrease the surface areas of clays, or
alter the surface charge of sandstones, and hence influence the capacity of sediments to
adsorb microcystins (Trevors, 1996). Therefore, the relative contribution of these two
removal processes in natural lake sediments needs to be further clarified.
Overall, the objective of our study is to identify the role of natural sediments in the
removal of microcystins from the water. More specifically, the study aims to (1) quantify
the contribution of the sediments to the removal of microcystins from the water; (2)
compare the relative contribution of biodegradation and adsorption ability of a sediment
to the removal of microcystins from the water. We studied this in a laboratory experiment
by bringing sediments and lake water from the field into the lab and exposing it to
different conditions.
3.3 Material and methods
3.3.1 Experimental design
The decay of dissolved microcystin was quantified in the laboratory by incubating a
commercially available variant, microcystin-LR (MCLR; Sapphire Bioscience,

CHAPTER 3: CONTRIBUTION OF SEDIMENTS IN THE REMOVAL OF MCLR
63
Australia), with different combinations of water and sediments from Lake Yangebup,
Western Australia. MCLR was added at an initial concentration of 20 µg/L and changes
in concentration were quantified under seven different treatment conditions (Table 3.1).
Different treatments were designed to test for the overall contribution of sediments, the
adsorption ability of sediments, the biodegradation ability of the sediments, and
biodegradation ability of lake water to remove MCLR from water. For example, MCLR
was added into sterile lake water with sediments to test the overall contribution of
sediments to the fate of MCLR. In contrast, a microbial inhibitor (10% sodium azide;
Alkali Metals Ltd.), was added together with MCLR into sterile lake water with sediments
to test the adsorption ability of sediments. Additionally, there were two controls. The
positive control in which MCLR was added into sterile lake water was to verify that there
was no decrease in MCLR in the absence of bacteria and sediment. The negative control,
in which no MCLR was added into sterile lake water with sediments, was to test if
unwanted natural microcystins was introduced into the experiment by using the lake water
and lake sediments. Each treatment was replicated four times, and the experiment ran for
two weeks.

CHAPTER 3: CONTRIBUTION OF SEDIMENTS IN THE REMOVAL OF MCLR
64
Table 3.1: Experimental design and incubation conditions.
Treatment
Non-sterile lake water
Sterile lake water
Raw sediments
Microbial inhibitor
MCLR
1 + * 2 + + - 3 + + * 4 + + *# 5 + + *** 6 + + + * 7 + *
+ Indicates incubation conditions for each treatment; * Indicates MCLR was added into the water once; *** Indicates MCLR was repeated added into the water for three times; - Indicates that MCLR was absent; # No aeration.
3.3.2 Sampling
Lake water and sediments for the laboratory experiment were collected from an urban
shallow lake, Lake Yangebup (32°6'40"S, 115°50'00"E), Perth, Western Australia.
Samples were collected in April during a toxic Microcystis bloom. The upper 8 cm of
sediment cores were collected with a transparent, polycarbonate sediment corer with a
stainless-steel cutter (50 mm in diameter). A 10 L water container was used to collect
surface water sample. Sediments and water collected were stored on ice and were
transported to the laboratory within two hours.
3.3.3 Experimental set-up
In the laboratory, sediment samples were thoroughly mixed and refrigerated overnight
at 4°C before the commencement of the experiment. All laboratory tools and glassware
were autoclaved before use, and preparation of the set-up was done in a laminar flow
cabinet to limit exposure to toxic vapours. All lake water was filtered with a GF/F filter
(0.7 µm, Whatman) prior to the experiment to remove suspended particles and
cyanobacterial cells but to keep the natural bacterial community. When sterile water was
used, the water was further filtered through a special capsule filter (0.8 µm/0.2 µm,

CHAPTER 3: CONTRIBUTION OF SEDIMENTS IN THE REMOVAL OF MCLR
65
AcroPak™ 500 Capsules with Supor® Membrane, Pall Corporation). When sediment
was required in a treatment, 200 g of the mixed sediment sample was placed in a 1500 ml
Erlenmeyer flask. Then 500 ml of either non-sterile or sterile lake water, which contained
20 µg/L MCLR, was added into the Erlenmeyer flask slowly to minimize the stirring of
sediment. All flasks were sealed with rubber stoppers with glass tubes that reached into
the water connected to air pumps for aeration unless otherwise stated. To avoid photolysis
of MCLR, all flasks were wrapped with aluminium foil and kept in dark conditions at 24
± 1°C.
A water sample of 5 ml was taken with a polyethylene syringe connected with a tube
by opening the flaks every 12 h to quantify the concentration of MCLR. The first water
samples were taken 1 h after the experiment commenced. Water samples were kept at -
20°C before quantification of MCLR with a High Performance Liquid Chromatography
(HPLC)-PDA system.
3.3.4 Sediment analysis
The sediment was analysed for particle size and organic matter content. The analysis
of particle size was adapted from Srivastava et al. (2013). The adaptions included heating
the samples for a quicker digestion of the organic matter and removing the hydrogen
peroxide by sequential dilution instead of evaporation. Organic matter by loss-on-ignition
was analysed according to Srivastava et al. (2013) but with samples dried in an oven at
110°C overnight instead of freeze drying. The organic matter content of sediments was
19.98 ± 0.45%. The results of particle size distribution show that all the sediment samples
were sand with a content of clay, silt, fine sand and coarse sand as 0%, 0%, 2.37 ± 1.07%
and 97.03 ± 1.07% respectively.
CHAPTER 3: CONTRIBUTION OF SEDIMENTS IN THE REMOVAL OF MCLR
66
3.3.5 MCLR analysis
Thawed water samples were centrifuged to remove any suspended particles before they
were applied to Solid Phase Extraction (SPE) cartridges (Waters Oasis HLB). SPE
cartridges were used for cleaning and concentrating microcystins. After application of the
samples, the SPE cartridges were rinsed with 10 ml of 10% (v/v) and 20% (v/v) methanol,
respectively. MCLR was eluted with 5 ml of 100% methanol + 0.1% trifluoroacetic acid
(TFA) (v/v) from the SPE cartridges into 6 ml glass vials. The glass vials were placed in
a water bath (40°C), and the liquid samples were evaporated to dryness under a mild
nitrogen stream. Dry samples were re-dissolved in 30% acetonitrile (v/v) for
quantification of MCLR in a Waters HPLC system (Alliance 2695) which was equipped
with PDA (1.2 nm resolution) and an Atlantis T3 3 µm column (4.6 x 150 mm i.d).
Mobile phases used for the HPLC were acetonitrile with 0.05% TFA (v/v) and Milli-Q
water with 0.05% TFA (v/v). The column temperature was maintained at 37.5 ± 2.5°C
and more details of the analysis method were described in Sinang et al. (2013). The limit
of detection per microcystin peak was 1.12 ng. MCLR was identified by PDA spectra at
238 nm and quantified by commercially available MCLR standard (Sapphire Bioscience,
Australia; purity ≥ 95%).
3.3.6 Data analysis
One Way Repeated Measures ANOVA or Friedman Repeated Measures ANOVA on
Ranks was performed to test for the difference in MCLR concentrations within each
treatment. T-test or Mann-Whitney Rank Sum Test was performed to compare the
difference in MCLR concentration of two treatments at the same sampling time. All
statistical analyses were conducted in SigmaPlot 11.0 (Systat Software Int.). Significance
levels were set as p < 0.05.

CHAPTER 3: CONTRIBUTION OF SEDIMENTS IN THE REMOVAL OF MCLR
67
3.4 Results
3.4.1 Overall contribution of sediments to the removal of MCLR from the water
No MCLR was detected in treatment 2, which served as negative control and in which
no MCLR was added. This indicated that the quantified MCLR in all the other treatments
did not originate from the lake water or sediments but was due to the addition of MCLR.
No significant removal of MCLR was detected in treatment 1 (Friedman Repeated
Measures ANOVA, χ2 = 29.2, d.f. = 10, p > 0.05), which served as positive control and in
which MCLR was added in sterile lake water (Figure 3.1A). The results indicate that no
significant removal of MCLR occurred in sterile lake water which means that the removal
of MCLR in any of the other treatments was due to the treatment conditions.
When MLCR was added in sterile lake water with sediment (treatment 3), MCLR
concentration decreased significantly from the commencement of the experiment (Figure
3.1A). The most rapid decrease occurred within the first 24 h with an average degradation
rate of 9 µg/d. MCLR concentration decreased significantly, without an observed lag
phase each time MCLR was added into the sterile lake water and sediment system (Figure
3.1B). The percentage of remaining MCLR over time after each MCLR addition indicated
an exponential decay regression wtt CC exp0 , where Ct equals the concentration of
MCLR at time as precents relative to the initial MCLR concentration, C0 equals 100%
and is the initial MCLR concentration, w equals first-order rate constant (h-1), and t equals
the time (hours) since the commencement of the experiment. MCLR half-life for spike
one, spike two and spike three was 13 h, 22 h and 21 h, respectively.
Aeration had a significant effect on the removal rate of MCLR added to sterile lake
water with sediments (Figure 3.1C). MCLR concentration in the treatment with aeration
became significantly lower than that in the treatment without aeration (treatment 4) from
hour 36 (Two sample t-test, t = -5.9, p < 0.001, d.f. = 6) until the end of the experiment.
Without aeration, MCLR concentration decreased quickly within the first 24 h (from 100%

CHAPTER 3: CONTRIBUTION OF SEDIMENTS IN THE REMOVAL OF MCLR
68
to 10%) but followed by a significant increase from 10% to 80%. MCLR concentration
then decreased consistently with an average degradation rate of 1.3 µg MCLR d-1. In
contrast, with aeration, MCLR concentration decreased from the beginning with a higher
degradation rate (3.8 µg/ d) than that without aeration.

CHAPTER 3: CONTRIBUTION OF SEDIMENTS IN THE REMOVAL OF MCLR
69
Figure 3.1: Mean removal of MCLR from the water by (A) sterile lake water with (▲) and without sediments (●); (B) sterile lake water with sediments without a microbial inhibitor for three consecutive additions. Numbers denote the respective additions; curves of best fit are first order exponential decay: addition 1: c(MCLR) = c(MCLR)0 -0.057t (adj. R2 = 0.908, p < 0.05); addition 2: c(MCLR) = c(MCLR)0 -0.04t (adj. R2 = 0.997, p < 0.05); addition 3: c(MCLR) = c(MCLR)0 -0.05t (adj. R2 = 0.939, p < 0.05); (C) sterile lake water with sediments with (▲) and without aeration (●); (D) sterile lake water with sediments with (▲) and without a microbial inhibitor (●); curves of best fit are first order exponential decay for the treatment without addition of microbial inhibitor: c(MCLR) = c(MCLR)0 -0.057t
(adj. R2 = 0.908, p < 0.05) and linear regression for the treatment with addition of microbial inhibitor: c(MCLR) = 91.52 – 0.29t (adj. R2 = 0.838, p < 0.05); (E) non-sterile lake water (●) and sterile lake water with sediments (▲). Error bars represent standard errors in all panels (n = 4). Data of the following treatments are shown twice within this figure to simplify comparisons: Treatment 3 (▲) is shown in panels A, C and E; Treatment 5 (●) is shown in panels B and D.

CHAPTER 3: CONTRIBUTION OF SEDIMENTS IN THE REMOVAL OF MCLR
70
3.4.2 Adsorption ability versus biodegradation ability of sediments
The addition of the microbial inhibitor had a significant effect on the removal of MCLR
added to sterile lake water with sediments (Figure 3.1D). In the presence of the microbial
inhibitor (treatment 6), MCLR concentration decreased following a linear curve (p < 0.05,
adjusted R2 = 0.838) with an average degradation rate of 1.75 µg MCLR/d. In contrast, in
the absence of the microbial inhibitor, MCLR concentration dropped significantly from
the commencement of incubation following a first order exponential decay curve (p <
0.05, adjusted R2 = 0.908) with an average degradation rate of 6.6 µg MCLR/d. Without
microbial inhibitor, MCLR concentration decreased to below detection level within the
first 36 h. In comparison, during this period of time, no significant reduction of MCLR
was observed with the addition of microbial inhibitor.
3.4.3 Contribution of water versus contribution of sediment to the removal of MCLR from water
Significant reduction of MCLR over time was observed in both non-sterile lake water
and sterile lake water with sediment (Figure 3.1E). Nevertheless, MCLR concentration
changed differently in these two treatments. A lag phase of 60 h was observed in non-
sterile lake water after which MCLR concentration decreased consistently with an
average degradation rate of 1.5 µg MCLR/d. In comparison, when MCLR was added in
sterile lake water with sediments, more than 90% removal of MCLR was observed within
the first 60 h of the experiment and the average degradation rate was 3.8 µg MCLR/d
(Figure 3.1E). Therefore, the removal of MCLR from the water by the sediment’s
adsorption and biodegradation ability was instant and much faster than the biodegradation
through bacteria from the water.

CHAPTER 3: CONTRIBUTION OF SEDIMENTS IN THE REMOVAL OF MCLR
71
3.5 Discussion
This study aimed to quantify the significance of the sediment’s contribution to the
removal of microcystins from the water and to differentiate between the relative
contributions of biodegradation ability and adsorption ability of sediments.
Microcystin-LR concentration decreased exponentially in the presence of sediment
with no observed lag phase. This is in contrast to earlier studies which documented lag
periods ranging from a few days to several weeks before microcystins were degraded
(Jones and Orr, 1994, Lam et al., 1995a, Chen et al., 2010). The length of the lag phase
in an earlier study depended on the concentration of bacteria, bacterial activity, initial
concentration of the toxin, and incubation temperature (Mazur-Marzec et al., 2009). The
rapid removal of MCLR with no lag phase in our study indicated the occurrence of
MCLR-degrading bacteria in the sediments of Lake Yangebup. This might be due to the
fact that the sediments used in this experiment were sampled during a Microcystis bloom
and therefore large amounts of microcystin-degrading bacteria might already have been
present in the sediment (Giaramida et al., 2013). The ability to remove MCLR did not
decrease during repeated MCLR addition in our experiment indicating that sediments can
significantly contribute to the removal of microcystins from a water body.
The addition of a microbial inhibitor to the sediment, leading to the quantification of
the adsorption ability of the sediment only, had a significant effect on the removal rate of
MCLR from the water. With a microbial inhibitor, MCLR concentration did not
significantly decrease within the first 36 h, while MCLR concentration decreased to under
detection level within the first 36 h in the absence of the inhibitor. As the latter treatment
represents the sum of adsorption and biodegradation, the difference between the two
curves indicated the contribution of the biodegradation ability of the sediment. This
emphasizes that the exponential decay of MCLR in the presence of sediment was mainly
caused by its biodegradation ability. However, although adsorption of MCLR was

CHAPTER 3: CONTRIBUTION OF SEDIMENTS IN THE REMOVAL OF MCLR
72
negligible compared to biodegradation at the start of the incubation, in the long term, a
significant loss of MCLR was observed due to adsorption (Figure 3.1D). This long-term
contribution of adsorption to the removal of MCLR from the water in our study is in
contrast to the results of Grut macher et al. (2010), where MCLR concentration did not
change significantly during contact with autoclaved sediment. The discrepancy is likely
due to differences in the texture, pH and organic matter content of the used sediment; also,
their sediment was autoclaved while a microbial inhibitor was used in our study.
Autoclaving can influence the adsorption ability of sediments by changing the sediment’s
structure (Trevors, 1996). In contrast, the use of sodium azide solution prevents microbial
activity within the soil without altering the adsorption properties of the soil (Miller et al.,
2001).
Our results indicated that biodegradation contributes more to the removal of MCLR
from water than adsorption, which has also been shown earlier for microcystin
elimination in sandy aquifer material (Grut macher et al., 2010) and in sand filters (Ho et
al., 2006). Biodegradation by microbial activity in sediments has also been reported as
the predominant process of the removal of other cyanobacterial toxins, e.g., nodularin
(Torunska et al., 2008). Therefore, this emphasizes the importance to consider the
biodegradation ability of sediments when using them in water treatment facilities to
remove microcystins.
Compared to the immediate and fast biodegradation of MCLR in the presence of
sediment, the biodegradation of MCLR by bacterial activity in the water in the absence
of sediment had a lower rate and a lag time of 60 h (Figure 3.1E). Similar results were
reported in earlier studies with microcystins incubated with water and sediments collected
from Taihu Lake in China (Chen et al., 2008); Furthermore, cylindrospermopsin
degradation only took place in the sediments but not in the water body (Klitzke et al.,
2010) and nodularin removal was more effective in the presence of the natural community

CHAPTER 3: CONTRIBUTION OF SEDIMENTS IN THE REMOVAL OF MCLR
73
of benthic bacteria than in seawater (Torunska et al., 2008). The more effective
biodegradation of MCLR in the presence of sediments in this study might indicate that
more efficient or a higher concentration of bacteria capable of degrading MCLR occur in
the sediments of Lake Yangebup than in the water.
Our study indicated that the indigenous microcystin-degrading bacterial community
from Lake Yangebup sediment preferred oxygen rich over low oxygen conditions. As
many lake sediments are completely deprived of oxygen for a prolonged period of time,
future research should evaluate the oxygen-need of microcystin-degrading bacteria
communities as this would help to identify the optimum function conditions for these
bacteria communities.
Previous studies investigated the effect of nutrients on the biodegradation rate of
microcystins and the results were contradictory. Chen et al., (2010) found that the addition
of glucose or low levels of NH4-N had no effect on the anoxic biodegradation of
microcystin, whereas the addition of NO3-N significantly inhibited the biodegradation.
Park et al. (2001) reported that added organic nutrients inhibited the degradation of
microcystins while Holst et al. (2003) found that glucose addition could stimulate the
anoxic biodegradation of microcystins in sediment slurries. Holst et al. (2003) found that
the addition of NO3-N significantly stimulated microcystin degradation under anoxic
conditions, and suggested that this process was coupled to denitrification while Chen et
al., 2010 reported the opposite. The contradictory results may be because different
bacterial communities were active in degrading microcystins. Therefore, to further
identify the optimum function conditions for the bacteria communities in the current study,
investigation on the effect of nutrients on the degradation rate of microcystins is
recommended for future study.
We can conclude from this study that (1) sediments contribute significantly to the
removal of microcystins from the water column; (2) whilst both the biodegradation and

CHAPTER 3: CONTRIBUTION OF SEDIMENTS IN THE REMOVAL OF MCLR
74
the adsorption ability of sediments can contribute significantly to the removal of
microcystins from the water column, biodegradation was shown to be the dominant
removal process. Our study indicates that biodegradation ability of sediments should be
more emphasized when sediments are considered to remove microcystins in water
treatment facilities; (3) sediments and water from Lake Yangebup, which experiences
frequent toxic Microcystis blooms, is rich in effectively microcystin-degrading bacteria.
These bacteria could be studied further to achieve optimized operational conditions to
remove microcystins effectively in water treatment facilities.
3.6 Acknowledgements
This work was supported by the Australian Research Council Linkage Scheme
(LP0776571) and the Water Corporation of Western Australia. Haihong Song was
financially supported by China Scholarship sponsored by the China Scholarship Council
and The University of Western Australia (UWA). The authors would like to thank UWA
Centre for Applied Statistics for statistical advice and Dr. Krystyna Haq and an
anonymous reviewer for comments on an earlier draft.

Chapter 4. Extraction of microcystins from lake sediments using supercritical carbon dioxide
SONG, H., REICHWALDT, E. S. & GHADOUANI, A. 2014. Extraction of microcystins
from lake sediments using supercritical carbon dioxide. Toxins (submitted)

This page has been left blank intentionally.

CHAPTER 4: EXTRACTION OF MICROCYSTINS FROM LAKE SEDIMENTS
77
4.1 Abstract
Microcystins are produced by certain species of cyanobacteria and they adversely
affect aquatic systems and human populations around the world. Understanding the fate
of microcystins in aquatic systems, both in water and in sediments, is essential for
managing the effects of these toxins. However, studying the fate of microcystins in lake
sediments has been greatly hindered by the lack of an effective analysis method. The
present study investigates whether the use of supercritical carbon dioxide has the potential
to be an effective method of extracting microcystins from lake sediment samples.
Extraction conditions and modifiers were first optimised using sediment samples which
were spiked with microcystin-LR. With extraction pressure set at 120 bar, extraction
temperature at 40°C, equilibration time at 30 min and water as the modifier, the highest
amount of total microcystins were extracted The supercritical extraction (SFE) method
with optimised extraction conditions was used for sediment samples spiked with
microcystin-LR and natural field sediment samples, and its extraction efficiency was
compared to the conventional extraction method. The conventional method recovered
more spiked microcystin-LR (recovery rate, which is the percentage of spiked
microcystin-LR recovered, was 69.6%) than the SFE method (recovery rate 4%), while
the SFE method was more effective in extracting microcystin variants that naturally
occurred in the sediment samples (0.72 µg/g d.m.) than the conventional method (0.28
µg/g d.m.). This study confirmed the capability of using supercritical carbon dioxide to
extract microcystins from sediments, as a complementary method to the conventional
method. As supercritical carbon dioxide and water are used but no chemical solvent or
clean-up procedure is needed, this method is environmentally friendly, time-saving and
cost-effective.

CHAPTER 4: EXTRACTION OF MICROCYSTINS FROM LAKE SEDIMENTS
78
Keywords: Microcystins; Microcystins extraction; Sediments; Environmental fate;
Supercritical extraction; Supercritical carbon dioxide
4.2 Introduction
Cyanobacteria (blue-green algae) inhabit aquatic and terrestrial environments
throughout the world and many species are known to produce cyanobacterial toxins
(Codd et al., 1994, El-Shehawy et al., 2012). The rapid increase in volume or
accumulation of cyanobacteria in an aquatic system can form cyanobacterial blooms.
These blooms not only affect water’s taste, odour and appearance, but more significantly,
they can produce cyanobacterial toxins which may cause acute and possibly chronic
health problems in humans and animals (Vasconcelos, 2001, Azevedo et al., 2002, Liu et
al., 2002, Žegura et al., 2011, de la Cruz et al., 2011).
Microcystins are one of the most commonly reported groups of toxins produced by
certain species of cyanobacteria such as Microcystis spp., Anabaena spp., Oscillatoria
spp. and Nostoc spp. They have been connected with numerous deaths of aquatic animals,
domestic animals and even human beings (Tricarico et al., 2008). So far, over 90 different
microcystin variants have been identified and the number continues to increase due to
improved instruments and detection methods (Hotto et al., 2008). Microcystins are cyclic
heptapeptides with the general structure: cyclo-(D-Ala1-X2-DMeAsp3-Z4-Adda5-D-
Glu6-Mdha7). The main differences in microcystin variants are due to the presence of
different amino acids in positions X and Z (Carmichael, 1997).
To assess the potential risk of human and animal exposure to microcystins, it is crucial
to understand the fate of these toxins in aquatic systems. While their fate in water has
been widely studied (Kotak et al., 1996, Hyenstrand et al., 2003, Moreno et al., 2004,
Ibelings et al., 2005, Ihle et al., 2005, Song et al., 2007b, Chen et al., 2008) and good
methods exist for extracting microcystins from cyanobacterial biomass (Lawton et al.,

CHAPTER 4: EXTRACTION OF MICROCYSTINS FROM LAKE SEDIMENTS
79
1994), only a limited number of studies have been carried out on the dynamics of
microcystins in lake sediments (Ihle et al., 2005, Chen et al., 2008). One reason for this
limited understanding is the lack of effective methods for quantifying microcystins in
sediment samples.
Current available methods for analysing microcystins from lake sediments include the
direct analysis and indirect analysis methods. Direct analysis usually involves the use of
various organic solvents, which are usually methanol with acetic acid or TFA, or EDTA-
sodium pyrophosphate solution (Tsuji et al., 2001, Ihle et al., 2005, Babica et al., 2006,
Chen et al., 2006a). These organic solvent-based extraction methods usually involve
clean-up and pre-concentration procedures, making them time consuming and expensive.
Tsuji et al. (2001) have described another method which involves the indirect detection
of microcystins. Using this indirect detection method, total microcystins were oxidised
into microcystin-specific fragment 2-methyl-3-methoxy-4-phenyl-butyric acid (MMPB)
which could be analysed by mass spectrometry. This method shortened the analysis time
and used less organic solvents. However this method only detects the total toxin
concentration and cannot be used to analyse microcystin variants. Another method,
combining solvent extraction and Lemieux oxidation, was developed by Wu et al. (2012).
In this optimised analytical procedure, a sequential solvent extraction using 50% (v/v)
methanol and EDTA-sodium pyrophosphate was selected as the optimal extraction
solvent for free microcystin analysis. After the extraction, the purified extracts and
sediment residuals were analysed by this optimised Lemieux oxidation method to
determine the total number of microcystins in lake sediments (Wu et al., 2012). As is the
case with the MMPB method, this method only measures total microcystins present.
Therefore, the development of an effective, time-saving and more selective detection
method is needed to reliably quantify the concentration of microcystin variants in
sediments.

CHAPTER 4: EXTRACTION OF MICROCYSTINS FROM LAKE SEDIMENTS
80
Supercritical fluid extraction (SFE) has emerged as a superior alternative technique for
the extraction of a variety of compounds from natural environments. The method takes
advantage of the unique physicochemical features of supercritical fluids, which are in a
state between the liquid and gas phase (Sunarso and Ismadji, 2009). The most commonly
employed supercritical solvent is carbon dioxide because it is non-toxic, non-flammable,
relatively inexpensive, and has a low critical temperature (304.1 K) and a moderate
critical pressure (7.38 MPa) (Medina, 2012). Extraction of targeted compounds from a
large number of materials by supercritical carbon dioxide has been widely studied (Mattea
et al., 2009, Herrero et al., 2010, Sahena et al., 2010). Compared with the conventional
extraction methods, the advantages of SFE is its reduced extraction time, reduced
consumption of organic solvents, production of cleaner extracts, and environmental
benignity (Huang et al., 2012).
In a series of studies by Pyo et al. (Pyo, 1999, Pyo and Shin, 2001, Pyo and Lim, 2006),
microcystin variants were successfully extracted from cyanobacterial biomass using
supercritical carbon dioxide. The simultaneous extraction and purification of
microcystins LR, RR and YR was also achieved using supercritical carbon dioxide (Pyo
et al., 2004). In these studies, the best extraction efficiency was observed at 40 °C. Pyo
and Shin (2001) suggested that the most suitable medium for the supercritical fluid
extraction of microcystins from cyanobacterial cells was a ternary mixed fluid (90%
carbon dioxide, 8.7% methanol and 1.3% water), with water playing an important role.
Supercritical carbon dioxide has also been used in the extraction of various chemical
contaminants from soils and sediments, including PCBs, PAHs, DDT, dioxins and furans,
and pesticides (Anitescu and Tavlarides, 2006). Therefore, the SFE method shows
potential regarding its application in the extraction of microcystins in sediments.
The aim of this study is to evaluate the applicability and efficiency of SFE in extracting
microcystins from lake sediments. As part of this evaluation, extraction conditions were

CHAPTER 4: EXTRACTION OF MICROCYSTINS FROM LAKE SEDIMENTS
81
optimised for an enhanced recovery rate of microcystins from lake sediments. A
comparison of SFE and conventional methods for both natural and spiked sediment
samples was conducted.
4.3 Materials and methods
Commercially available variant microcystin-LR (MCLR) (purity ≥ 95%, Sapphire
Bioscience, Australia) was added to natural sediment samples. Preliminary investigations
had detected the presence of microcystins variants in these samples. Spiked sediment
samples were used to optimise the extraction conditions (modifier, extraction pressure
and equilibration time) for the supercritical fluid extractor. The SFE method, conducted
under optimised extraction conditions, was used to extract microcystins from spiked
sediment samples and natural field sediment samples, and its extraction efficiency was
compared with that of the conventional extraction method. Differences in extraction
efficiency between different extraction conditions were analysed using a one-way
analysis of variance (ANOVA) in SigmaPlot 11.0 (Systat Software Int.). Significance
levels were set as p < 0.05.
4.3.1 Natural and spiked sediment samples
Sediments were collected from an urban shallow lake, Lake Yangebup (32°6'40"S,
115°50'00"E), in Perth, Western Australia. The upper 8 cm of the sediment layer was
collected with a sediment corer at random sites. In the laboratory, the collected sediments
were mixed, lyophilised to remove the water, sieved through a 212-µm mesh, and stored
at -20°C before use. This stored sediment sample was labelled ‘natural sediment sample’.
To prepare the spiked sediment sample, 4 g (dry weight) of natural sediment sample was
mixed with 10 ml of Milli-Q (Millipore, UK) water. The MCLR was then added to
achieve a concentration of 1.25 µg/g d.m. As 24 h has been shown to be a sufficient
equilibration time for the adsorption of microcystins to soils and sediments (Chen et al.,

CHAPTER 4: EXTRACTION OF MICROCYSTINS FROM LAKE SEDIMENTS
82
2006a), the spiked sample was placed on a shaker for 24 h to reach equilibrium before its
lyophilisation in a freeze dryer. The freeze-dried sample was labelled ‘spiked sediment
sample’ and stored at -20°C before use.
Toxic cyanobacterial blooms occur in Lake Yangebup most of the year (Kemp and
John, 2006, Reichwaldt et al., 2013) and microcystins were found in the sediments in
preliminary studies. Therefore, microcystin variants were believed to be present in the
natural sediment samples. As spiked sediment samples were prepared from natural
sediment samples, it was expected that these microcystin variants would also be present
in spiked sediment samples. To distinguish them from the spiked MCLR, these
microcystin variants were referred as ‘other microcystin variants’. The procedure for
extracting microcystins from sediments using supercritical carbon dioxide is shown in
Figure 4.1.
The particle size and organic matter of the sediment used to prepare the natural
sediment samples were analysed. The method used to analyse particle size was adapted
from Bowman and Hutaka (2002). The adaptions included heating samples to facilitate a
quicker digestion of the organic matter and removing the hydrogen peroxide by sequential
dilution instead of evaporation. The particle size distribution analyser used was
the Malvern Mastersizer 2000 particle size analyser with a Malvern Hydro 2000G
automated wet dispersion accessory. Organic matter content, using loss-on-ignition, was
analysed according to Heiri et al. (2001) but with samples dried in an oven at 110°C
overnight instead of freeze drying. The organic matter content of sediment was 1.33 ±
0.05%. The results for particle size distribution showed that all the sediment samples were
sand with a content of clay, silt, fine sand and coarse sand as 0%, 0%, 11.99 ± 3.52% and
88.01 ± 3.52% respectively.

CHAPTER 4: EXTRACTION OF MICROCYSTINS FROM LAKE SEDIMENTS
83
Figure 4.1: Extraction procedure for microcystins from sediments using supercritical carbon dioxide.
4.3.2 Supercritical fluid extraction
4.3.2.1 Supercritical fluid extractor
The extraction experiment was performed using a Hewlett-Packard 7680T SFE
Module. Food-grade carbon dioxide, 99.9% purity (BOC Gas Company, Australia) with
a flow rate of 1 ml/min, was used as solvent. A dry sediment sample (2.0–2.2 g) was
loaded into a stainless steel thimble, which was then pressured with supercritical carbon
dioxide after the addition of modifier. The supercritical carbon dioxide remained in the
thimber for a given equilibration time, followed by transfer of the solvent for an extraction
time of 15 min and then depressurized onto a trap (octadecyl silica) containing a
stationary phase. The trap was then washed with 5 ml of organic solvent, methanol +
0.01% TFA, and the dissolved extracts captured in glass vials.
Sediments mixed, lyophilized, sieved through a 212 µm opening size and stored at -20°C before use.
Sediments (2-2.2 g d.m.) and 10% water (w/w) loaded into SFE thimble.
Extraction with extraction conditions: extraction pressure = 120 bar, extraction temperature = 40 °C, equilibration time = 30 min, flow rate = 1 ml/min, extraction time = 15 min.
The trap was then washed with an organic solvent, methanol + 0.01% trifluoroacetic (TFA) (5 ml), to remove the dissolved compounds into glass vials.
The collected solvents in the glass vials were placed in a water bath (40°C), and the liquid samples were evaporated to dryness under a mild nitrogen stream.
Dry samples were re-dissolved in 1 ml 30% acetonitrile (v/v) for quantification of microcystin variants in HPLC-PDA.

CHAPTER 4: EXTRACTION OF MICROCYSTINS FROM LAKE SEDIMENTS
84
4.3.2.2 Optimisation of extraction conditions
In the study by Pyo and Shin (2001), an extraction temperature of 40°C achieved the
highest solubility of microcystins in supercritical carbon dioxide, so the extraction
temperature for this study was also set at 40°C. It was suggested that the modifier acts by
competing with target analytes for the active site of the sample matrix rather than by
increasing analyte solubility (Bowadt and Hawthorne, 1995). Therefore, the identity of
the modifier may have a larger impact on the extraction efficiency than its concentration.
In the studies by Pyo et al., a mixture of 90% carbon dioxide and 10% modifiers was
effective in extracting microcystins from cyanobacterial biomass (Pyo, 1999, Pyo and
Shin, 2001, Pyo and Lim, 2006). Therefore, this study also used 90% (v/v) carbon dioxide
as the solvent.
To compare modifiers, spiked sediment samples were extracted with supercritical
carbon dioxide with different modifiers (10%, v/v) with extraction pressure set at 205 bar,
extraction temperature at 40°C and equilibration time at 20 min. The modifiers evaluated
were 10% methanol, methanol (8.7%) mixed with water (1.3%), and 10% water.
Experiments were performed in triplicate.
The solvating strength of a supercritical fluid is related to its density, a parameter
primarily dependent upon pressure. For a given temperature, the fluid density is
proportional to its pressure; a correct choice of pressure may lead to selective extractions
(Camel, 1998). With the temperature set at 40°C, equilibration time at 20 min, and the
selected modifier and other extraction conditions the same, the extraction efficiency for
total microcystins in the spiked lake sediment were compared at extraction pressures
ranging from from 80 to 160 bar at 20-bar intervals. Each experiment was carried out in
triplicate. This pressure range was chosen based on the mechanical condition of the
supercritical fluid extractor used in the experiment. With the temperature set at 40°C and
the modifier and pressure selected, the extraction efficiency for total microcystins in the

CHAPTER 4: EXTRACTION OF MICROCYSTINS FROM LAKE SEDIMENTS
85
spiked lake sediment was compared for equilibration times of 10, 30 and 60 min. Each
experiment was carried out in triplicate.
4.3.3 Conventional extraction method
Sediment samples were extracted twice with 5% acetic acid in methanol containing
0.2% v/v TFA according to Babica et al. (2006), where conventional methods were
optimised. The extraction step was followed by centrifugation at 3500 g for 10 min. Forty
millilitres of pooled supernatants were diluted with 160 ml of deionised water to reach a
methanol concentration of less than 20% (v/v) before they were applied to Solid Phase
Extraction (SPE) cartridges (Oasis HLB 6cc/500mg, Waters, Australia). After application
of the samples, the cartridges were rinsed with 10 ml of 10% (v/v) methanol then 10 ml
of 20% (v/v) methanol. Microcystins were eluted with 5 ml of 100% methanol + 0.1%
TFA (v/v) from the SPE cartridges into 6-ml glass vials.
4.3.4 Microcystin analysis
The collected extracts in the glass vials from the supercritical fluid extractor were
placed in a water bath (40°C), and the liquid samples were evaporated to dryness under a
mild nitrogen stream. Dry samples were re-dissolved in 30% acetonitrile (v/v) for
quantification of MCLR in a Waters high performance liquid chromatography (HPLC)
system (Alliance 2695) which was equipped with a photo diode array (PDA) detector (1.2
nm resolution) and an Atlantis T3 3-µm column (4.6 x 150 mm i.d.). The mobile phases
used for the HPLC were acetonitrile with 0.05% TFA (v/v) and Milli-Q water with 0.05%
TFA (v/v). Column temperature was maintained at 37.5 ± 2.5°C. The limit of detection
per microcystin peak was 1.12 ng. The limit of quantification was 3x the limit of
detection. Microcystins were identified by their retention time and characteristic UV
absorption spectra (200–300 nm) and quantified by a commercially available MCLR
standard (Sapphire Bioscience, Australia; purity ≥ 95%).

CHAPTER 4: EXTRACTION OF MICROCYSTINS FROM LAKE SEDIMENTS
86
4.4 Results
4.4.1 Optimisation of modifiers
With 10% methanol as a modifier, no added MCLR was recovered from the spiked
sediment samples. However, 22.93 ng/g d.m. of other microcystin variants were
recovered (Figure 4.2). When 8.7% methanol and 1.3% water were used as a modifier,
46.9 ng/g d.m. of added MCLR (recovery rate: 3.75%) and 34.11 ng/g d.m. of other
microcystin variants were recovered from the sediment, suggesting that extraction ability
was enhanced with the addition of water. Extraction efficiency was further improved
when 10% water was used as a modifier (90% carbon dioxide and 10% water), with 61.4
ng/g d.m. of added MCLR (recovery rate: 3.75%) and 346.96 ng/g d.m. of other
microcystin variants recovered (Figure 4.2). Therefore, water was chosen as the modifier
for the optimisation of extraction conditions. When 10% water was used as modifier, the
HPLC gave a cleaner chromatogram when compared with 8.7% methanol and 1.3% water
(Figure 4.3).

CHAPTER 4: EXTRACTION OF MICROCYSTINS FROM LAKE SEDIMENTS
87
Figure 4.2: Microcystins extracted from spiked sediment samples using supercritical carbon dioxide with different modifiers: methanol (10%), methanol (8.7%) + water (1.3%), and water (10%). “*” represents no detectable level of MCLR. Error bar represent the standard errors of replicates (n = 3).

CHAPTER 4: EXTRACTION OF MICROCYSTINS FROM LAKE SEDIMENTS
88
’
Figure 4.3: The first 20 min of the high performance liquid chromatogram of extracted microcystin variants using supercritical carbon dioxide from spiked sediment samples with different modifiers: (A) 10% water; (B) 8.7% methanol + 1.3% water. “*” represent microcystin variants other than MCLR.
12.6
76
13.9
68
17.6
99
19.2
11
AU
0.00
0.02
0.04
0.06
0.08
0.10
0.12
Minutes0.00 2.00 4.00 6.00 8.00 10.00 12.00 14.00 16.00 18.00 20.00 22.00 24.00 26.00 28.00 30.00 32.00 34.00 36.00
* MCLR
MCLR
*
A
B
*
*
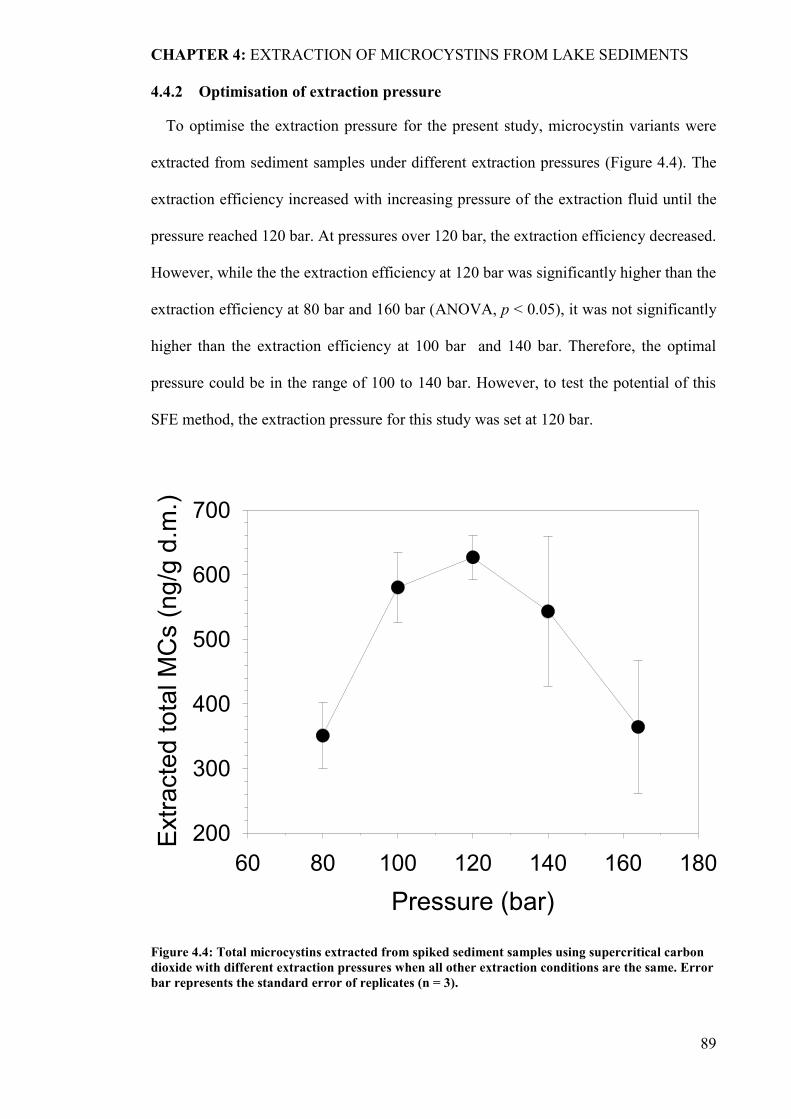
CHAPTER 4: EXTRACTION OF MICROCYSTINS FROM LAKE SEDIMENTS
89
4.4.2 Optimisation of extraction pressure
To optimise the extraction pressure for the present study, microcystin variants were
extracted from sediment samples under different extraction pressures (Figure 4.4). The
extraction efficiency increased with increasing pressure of the extraction fluid until the
pressure reached 120 bar. At pressures over 120 bar, the extraction efficiency decreased.
However, while the the extraction efficiency at 120 bar was significantly higher than the
extraction efficiency at 80 bar and 160 bar (ANOVA, p < 0.05), it was not significantly
higher than the extraction efficiency at 100 bar and 140 bar. Therefore, the optimal
pressure could be in the range of 100 to 140 bar. However, to test the potential of this
SFE method, the extraction pressure for this study was set at 120 bar.
Figure 4.4: Total microcystins extracted from spiked sediment samples using supercritical carbon dioxide with different extraction pressures when all other extraction conditions are the same. Error bar represents the standard error of replicates (n = 3).
Pressure (bar)60 80 100 120 140 160 180
Ext
ract
ed to
tal M
Cs
(ng/
g d.
m.)
200
300
400
500
600
700

CHAPTER 4: EXTRACTION OF MICROCYSTINS FROM LAKE SEDIMENTS
90
4.4.3 Optimisation of equilibration time
To optimise the equilibration time, microcystin variants were extracted from sediment
samples under different equilibration times. The total concentration of microcystins
recovered from spiked sediment increased significantly from 10 min to 30 min (ANOVA,
p < 0.05) but decreased significantly from 30 min to 60 min (ANOVA, p < 0.05) (Figure
4.5). With extraction pressure set at 120 bar, extraction temperature at 40°C and water as
the modifier, the highest amount of total microcystins were extracted. Therefore, 30 min
was chosen as the equilibration time for this study.
Figure 4.5: Total microcystins extracted from spiked sediment samples using supercritical carbon dioxide with different equilibration times when all other extraction conditions are the same. Error bar represents the standard error of replicates (n = 3).
4.4.4 Comparison between the supercritical fluid extraction and conventional extraction method
The extraction efficiency for both spiked sediment samples and natural sediment
samples were compared using the SFE and conventional extraction methods. For spiked
Equilibration Time (min)0 10 20 30 40 50 60 70
Ext
ract
ed to
tal M
Cs
(ng/
g d.
m.)
0
200
400
600
800
1000

CHAPTER 4: EXTRACTION OF MICROCYSTINS FROM LAKE SEDIMENTS
91
sediment samples, the extraction efficiency for spiked MCLR and other microcystin
variants were observed and compared. For natural sediment samples, the total
concentrations of recovered microcystin variants were observed and compared.
When spiked sediment samples were extracted with the conventional method, 0.87
µg/g d.m. of MCLR (recovery rate: 69.6%) and 0.28 µg/g d.m. of other microcystin
variants were recovered (Figure 4.6). In contrast the SFE method recovered 49.95 ng/g
d.m. of the added MCLR (recovery rate: 4%) and a total concentration of 0.72 µg/g d.m.
of other microcystin variants. The conventional method recovered a higher amount of
added MCLR but a lower amount of other microcystin variants present in natural
sediment when compared with the SFE method. For natural sediment samples, a total
concentration of 631 ng/g d.m. of microcystins were extracted with the SFE method while
conventional method extracted 246 ng/g d.m. In natural sediment samples, MCLR were
detected by both methods. Using the conventional method, an average of 14.25 ng/g d.m.
of MCLR was recovered. In comparison, the SFE method recovered an average of 57.37
ng/g d.m. of MCLR. Therefore, the SFE method extracted microcystin variants that
naturally occur in the sediments more effectively than the conventional method.

CHAPTER 4: EXTRACTION OF MICROCYSTINS FROM LAKE SEDIMENTS
92
Figure 4.6: Microcystins extracted from spiked sediment samples using the conventional and supercritical fluid (SFE) methods. Error bar represents the standard error of replicates (n = 3).
4.5 Discussion
A polar modifier is usually recommended for enhancing the solvating power of
supercritical carbon dioxide for polar organic compounds. Among a variety of different
modifiers for supercritical carbon dioxide, methanol is the most popular choice. However,
Pyo and Shin (2001) have suggested that the most suitable medium for SFE of
microcystins from cyanobacterial cells is a ternary mixed fluid (90% carbon dioxide,
8.7% methanol and 1.3% water) and that water plays an important role in this extraction
process (Pyo and Shin, 2001). The present study demonstrated that water as a modifier is
more effective than either 10% methanol or 8.7% methanol mixed with 1.3% water. This
might be because water has a higher dielectric constant than methanol (water: 84.4,
methanol: 35.74), and when water is used as modifier, the two functional groups of
opposite charge in the microcystins (NHCNH-N+H2 and COO-) can be separated more

CHAPTER 4: EXTRACTION OF MICROCYSTINS FROM LAKE SEDIMENTS
93
easily (Mohsen-Nia et al., 2010). The extent of separation of these two functional groups
with opposite charge in the microcystins can affect the solubility of the microcystins in
supercritical fluid carbon dioxide with water as a modifier (Pyo and Lim, 2006, Arnáiz et
al., 2012).
Pressure and temperature are the two most important physical parameters in SFE and
they have both theoretical and practical implications for the extraction process. Together
they define the density of the supercritical fluid. In this study, the optimised extraction
pressure should be between 100 bar and 140 bar , which is far lower than the pressure set
by(Pyo and Shin, 2001) (250 atm) to extract microcystin from cyanobacterial cells using
supercritical carbon dioxide with a mixture of water and methanol as modifier. In this
study, the highest pressure that could be maintained by the supercritical extractor was 160
bar when the extraction pressure was optimised, so extraction efficiencies higher than 160
bar were not tested. This is a limitation of this study, and further tests could be conducted
to find out whether the extraction efficiency can be improved at extraction pressures
higher than 160 bar.
In the present study, for spiked sediment samples, the conventional method recovered
more spiked MCLR but less other microcystin variants; for natural sediment samples,
supercritical carbon dioxide with water as a modifier extracted more microcystin variants,
including MCLR. This result indicates that chemical solvents used in the conventional
method are more effective than supercritical carbon dioxide in extracting microcystins on
the surface of sediment samples but less effective in extracting microcystins strongly
bound to sediments. Spiked analytes are situated on the surface of sample matrices and
have little time to migrate to strong binding sites. In contrast, native pollutants in
sediments are often in contact with the matrix for a longer time and are therefore more
likely to be associated with stronger binding sites than recently spiked pollutants (Bowadt
and Hawthorne, 1995). For native microcystins binding to sediments, supercritical carbon

CHAPTER 4: EXTRACTION OF MICROCYSTINS FROM LAKE SEDIMENTS
94
dioxide might be more powerful than chemical solvents when used in conventional
methods to break the bond between microcystins and sorptive sites in sediments.
Therefore, SFE method has an advantage in the extraction of microcystin variants in
natural sediments and can be used as a complementary method to the conventional
extraction method.
This is the first study to propose the use of supercritical carbon dioxide in the extraction
of microcystins from lake sediments. It confirmed the hypothesis that supercritical carbon
dioxide has the potential to extract microcystins from lake sediments. This study found
that supercritical carbon dioxide modified by water was effective in extracting
microcystins from natural sediment samples, which are typically difficult to extract using
the conventional method. Compared to the conventional method, SFE is a time-saving,
cheap and environmentally friendly method for the detection of microcystins in
sediments. Application of the SFE method will improve our understanding of the fate of
microcystins in sediments and aquatic systems.
4.6 Acknowledgements
This work was supported by the Australian Research Council Linkage Scheme
(LP0776571) and the Water Corporation of Western Australia. Haihong Song was
financially supported by a China Scholarship sponsored by the China Scholarship Council
and UWA. The authors would like to thank Professor George Koutsantonis for the use of
the Supercritical Fluid Extractor and Shian Min Liau and Randica Jayasinghe for
comments on an earlier draft.

Chapter 5. Conclusions and recommendations

This page has been left blank intentionally.
CHAPTER 5: CONCLUSIONS AND RECOMMENDATIONS
97
5.1 Significance of contribution
The study aimed to explore the role of sediments in the fate of microcystins in shallow
aquatic systems and to develop an effective method for quantifying microcystins in the
sediments. Microcystins occur in various aquatic systems across the world and they can
cause great harm to animals and humans. It is therefore important to understand their fate
in aquatic systems. As an important component of aquatic systems, sediments can play
multiple roles in the distribution and natural attenuation of microcystins. Hence, to better
manage the hazards of microcystins in aquatic systems, it is essential to understand their
variability in lake sediments and the role played by sediments in the natural attenuation
of these toxins in aquatic systems. In addition, developing an effective analysis method
for microcystins in sediment samples will facilitate better research in this area. To address
these issues, the study sought to answer three questions:
1. What are the main environmental variables contributing to the variability of
microcystins in sediments of a shallow lake (Aim 1)?
2. What is the relative contribution of the biodegradation ability and adsorption
ability of sediments to the removal of microcystins from the water (Aim 2)?
3. Can supercritical carbon dioxide extraction be used as a reliable method to
quantify microcystins in lake sediments (Aim 3)?
These three research questions are addressed in Chapters 2–4 of this thesis. The main
findings, which are chapter specific, have been summarised within the respective chapter
(Figure 5.1).

This page has been left blank intentionally.

Figure 5.1: Conceptual framework of the study aims and main findings of the study. MCs refers to microcystins; CB refers to cyanobacterial biomass
CB in sediments
MCs in sediments
Sediments
Chapter 2: To identify the temporal and spatial variability of microcystins in the sediments of a shallow lake and determine the correlation of the variability with environmental variables (Aim 1).
CB in water
MCs in water
Water
Chapter 4: To evaluate the applicability and efficiency of supercritical carbon dioxide in the quantification of microcystins from lake sediments (Aim 3).
Chapter 3: To quantify the significance of the sediment’s contribution to the removal of microcystins from the water column and compare the relative contribution of the biodegradation and adsorption abilities of sediments to the removal of microcystins from the water column (Aim 2).
Main findings: MCs in sediments had weak but significant correlation with total MCs and cyanobacterial biomass in water column; variability of MCs in sediments could be significantly explained by a combination of total MCs in water, cyanobacterial biomass in overlying water, pH and temperature (Aim 1).
Main findings: Supercritical carbon dioxide has the capacity to extract microcystins from sediments; supercritical carbon dioxide with water as modifier was more effective in quantifying MCs from natural sediment samples than conventional method (Aim 3).
Main findings: Sediments contribute to the removal of MCLR from the water column immediately, effectively and continuously, while both biodegradation ability and adsorption ability of sediments contribute significantly to the removal of MCLR from the water column, biodegradation was the dominant process (Aim 2).
CH
APT
ER
5: CO
NC
LUSIO
NS A
ND
REC
OM
MEN
DA
TION
S

This page has been left blank intentionally.

CHAPTER 5: CONCLUSIONS AND RECOMMENDATIONS
101
5.2 Variability of microcystins in the sediments
The variability of microcystin concentrations in lake sediments and its correlation with
environmental variables were analysed in Chapter 2. Microcystins occurred widely in the
sediments collected at an eutrophic shallow lake during a cyanobacterial bloom
dominated by Microcystis spp (Figure 2.2). The spatial variability of microcystin
concentrations in sediments was different in each sampling month and the temporal
variability of these toxins in the sediments was site specific (Figure 2.3). Microcystin
concentrations in lake sediments had weak but significant correlation with intracellular
microcystins in the water, total microcystins in the water and cyanobacterial biomass in
the water (Table 2.4). Analysis using a multiple linear regression model developed for
this study showed that a significant part of the variability of microcystins in lake
sediments (46.7%) could be explained by a combination of total microcystins in the water,
cyanobacterial biomass in the water and physicochemical parameters of the water (pH
and temperature).
While most research in this area has focused on microcystins in the water, the results
of this study showed that these toxins also widely occur in the sediments of a shallow
lake. Such results highlight the importance of studying microcystins present in sediments,
Microcystin concentrations in the sediments were significantly correlated to the
concentration of intracellular toxins in water and cyanobacterial biomass in water directly
above the sediments. This finding is in agreement with the study by Mohamed et al.
(2007). However, contrary to earlier studies (Mohamed et al., 2007 and Ihle et al., 2005),
this present study found no significant correlation between microcystins in sediments and
cyanobacterial biomass in sediments. Furthermore, a systematic study of the correlation
between the variability of microcystins and environmental variables showed that the
variability of microcystins in the sediments was influenced by multiple environmental

CHAPTER 5: CONCLUSIONS AND RECOMMENDATIONS
102
factors. These factors need to be considered when predicting the distribution of
microcystins in the sediments. For example, the multiple linear regression model
developed in this study indicated that processes in the water have a strong influence on
the distribution of microcystins in sediments.
To gain a broader understanding of the occurrence of microcystins in the sediments, it
will be necessary to further investigate the variability of microcystins in different aquatic
systems. As shown in the current study, there is an important connection between the
water and the sediments that influences the distribution of microcystins in aquatic systems.
However, the present study was limited to a shallow lake where there is a relatively high
interaction between water and sediments. The correlation between the variability of
microcystins in sediments and environmental variables may differ in a deep lake.
Therefore, different aquatic systems need to be investigated to broaden this understanding.
Additional environmental variables need to be considered to fully explain the
variability of microcystins in sediments. For example, 53% of the variability of
microcystins in the sediments could not be explained by the regression model developed
in this study. This variability could be caused by a number of environmental factors that
include wind mixing and the physical and chemical properties of sediments. What is clear
from this study is that the contribution of other environmental variables to the variability
of microcystins in sediments warrants further investigation.
5.3 Contribution of sediments to the removal of microcystins from the water
The significance of the sediment’s contribution to the removal of microcystins from
the water and the relative contribution of the biodegradation and adsorption ability of
sediments to the removal of microcystins from the water were studied in Chapter 3. In the
laboratory, changes in the concentration of MCLR in the presence of sediments (to test
the sum of adsorption ability and biodegradation ability), sediments with microbial

CHAPTER 5: CONCLUSIONS AND RECOMMENDATIONS
103
inhibitor (to test the adsorption ability of sediments) and non-sterile lake water (control)
were quantified (Table 3.1). When added to sediments, the concentration of MCLR in
sterile lake water decreased significantly in an exponential way, with no observed lag
phase (Figure 3.1). This result indicates that sediments contribute to the removal of
MCLR from water immediately, effectively and continuously. Comparison between the
treatments with bacterial inhibitor and without bacterial inhibitor indicated that the
exponential decay of MCLR in the presence of sediments was mainly caused by the
biodegradation ability of the bacterial community within the sediments (Figure 3.1). At
the start of incubation, the adsorption of MCLR was negligible when compared to its
biodegradation, but over time a significant loss of MCLR due to adsorption was observed.
Therefore, it can be concluded that while the biodegradation and adsorption ability of
sediments may contribute significantly to the removal of MCLR from the water,
biodegradation appears to be the dominant process.
Earlier studies have shown that sediments contribute to the removal of dissolved
microcystins from the water through adsorption to sediment particles or biodegradation
by the sediment’s bacterial community. This is the first study to compare these two
processes in the laboratory and identify that biodegradation is the dominant process. The
same result has been reported in studies on microcystin elimination in sandy aquifer
material (Grut macher et al., 2010), microcystin elimination in sand filters (Ho et al.,
2006) and the removal of other cyanobacterial toxins (Torunska et al., 2008). While these
studies observed that the biodegradation of microcystins was usually characterised by a
prolonged lag phase, this current study found no such lag phase. The difference in
findings might be due to the fact that the sediments used in this experiment were sampled
during a Microcystis bloom and MCLR-degrading bacteria may have been present in the
sediments. Nevertheless, this present study’s finding that sediments play a role in the
removal of microcystins from water helps us to better understand the environmental fate
CHAPTER 5: CONCLUSIONS AND RECOMMENDATIONS
104
of microcystins in aquatic systems and raises the possibility that these sediments could
be used to remove microcystins in water treatment facilities.
An important area of focus for future studies is the development of efficient technology
that uses sediments to effectively remove microcystins from water. Sediments with
different characteristics and from different aquatic environments could be considered in
these studies. This current study also demonstrated that bacteria present in sediments were
able to effectively facilitate the removal of microcystins through their biodegradation
ability. Hence, another focus for further investigation could be those bacterial
communities capable of biodegrading microcystins in sediments. Also, it would lead to a
better understanding of the bacterial communities in the sediments to look at the influence
of nutrients (e.g. C, N, P) on the growth of microcystin-degrading bacteria in the
sediments. Identification of these bacteria followed by research into optimising their
growth conditions may lead to an effective treatment technology for microcystin-
contaminated water bodies.
5.4 Quantification of microcystins in the sediments using supercritical carbon dioxide
The potential for the application of supercritical carbon dioxide in quantifying
microcystins from lake sediment samples was investigated in Chapter 4. Extraction
conditions and modifiers were first optimised using sediment samples spiked with
MCLR. The extraction efficiency of the SFE method under optimised extraction
conditions was then compared with the conventional extraction method using sediment
samples spiked with MCLR and natural field sediment samples. The conventional method
recovered more spiked MCLR (recovery rate 69.6%) than the SFE method (recovery rate
4%), while the SFE method was more effective in extracting microcystin variants that
naturally occurred in the sediment samples (0.72 µg/g d.m.) than the conventional method
(0.28 µg/g d.m.) (Figure 4.6).

CHAPTER 5: CONCLUSIONS AND RECOMMENDATIONS
105
As far as we know, this is the first study to raise the possibility of using supercritical
carbon dioxide to extract microcystins from lake sediments. It confirmed that supercritical
carbon dioxide is effective in extracting microcystins from lake sediments, and when
compared with the conventional method, SFE is a time-saving, cheap and
environmentally friendly method. This method shows great potential for furthering our
understanding of the fate of microcystins in sediments and aquatic systems.
In terms of using SFE technology to develop an effective method of quantifying
microcystins in the sediments, further research is needed. For example, the extraction
conditions for the SFE method developed in this study could be further optimised. In the
present study, extraction conditions were optimised using sediment samples with
consistent characteristics. These specific conditions may limit extraction efficiency when
the SFE method is applied to other types of sediment samples. Therefore, the optimisation
of extraction conditions for a range of sediments should be investigated. The optimisation
of extraction conditions for more microcystin variants is also suggested as a topic for
future study.
5.5 Policy and management implications
For the management of bloom-prone water bodies, it is important to holistically
understand the fate of microcystins in the aquatic systems. Current studies and policies
focusing on microcystins in aquatic systems almost exclusively concentrate on the water
column while sediments are mostly neglected. However, there is strong evidence from
this and earlier studies that microcystins are widely present in sediments. Considering the
potential ecological hazards with the occurrence of microcystins in lake sediments,
researchers and water management authorities should include sediments when assessing
the potential hazards of microcystins in aquatic systems.

CHAPTER 5: CONCLUSIONS AND RECOMMENDATIONS
106
The present study emphasizes the importance that sediments play for the removal of
microcystins from the water column. This will be especially important in shallow systems
where the interaction between the water column and the sediment is naturally high. The
results presented here add important information to our understanding of the fate of
microcystins in aquatic systems, and specifically on the two mechanisms responsible for
microcystin degradation at the water-sediment interface. This will inform the application
of sediments to remove microcystins at water treatment facilities. Hence, this study is of
high importance not only to the scientific community, but specifically also to
environmental engineers and water resource managers.
This work is of considerable importance from both process-level research and
management perspectives because nuisance blooms of microcystin-producing
cyanobacterial (mainly Microcystis spp.) are on the increase worldwide, and there is a
widespread need for both preventing the proliferation of blooms and mitigating the
negative impacts (i.e. toxicity) of existing blooms. The work is of dual importance from
an ecosystem-level perspective. It shows that the sources and fates of Microcystis are
closely coupled and mediated by closely linked (in time and space) physical-chemical-
biotic processes. It also shows that the amounts and distributions of toxins can be
predicted well from water column cyanobacterial (Microcystis spp.) biomass estimates
(when Microcystis spp. is the dominant cyanobacterial taxon), which was also recently
found by Otten et al (2012). This means that a water quality manager could get a fairly
good estimate of the potential toxicity (and its fate) of a water body simply by estimating
Microcystis biomass using conventional methods (i.e. cell counts, Chorophyll a
measurements).
Direct measurement of microcystins in the aquatic systems, particularly in the
sediments, is hard to achieve for water quality managers who often lack the expertise to
conduct biochemical and molecular analyses. It is therefore recommended that

CHAPTER 5: CONCLUSIONS AND RECOMMENDATIONS
107
cyanobacterial biomass and physical parameters (temperature, DO, pH) that impact the
distribution of microcystins in the aquatic systems be routinely measured to estimate the
microcystins in the water column and the sediments. Based on the level of microcystins
concentration in the aquatic systems, the water quality managers can determine the
actions that should be taken to remove microcystins from the aquatic systems.

LITERATURE CITED
108
Literature cited
ABOUABDELLAH, R., TALEB, H., BENNOUNA, A., ERLER, K., CHAFIK, A. & MOUKRIM, A. 2008. Paralytic shellfish poisoning toxin profile of mussels Perna perna from Southern Atlantic coasts of Morocco. Toxicon, 51, 780-786.
ALCAMO, J., FLORKE, M. & MARKER, M. 2010. Future long-term changes in global water resources driven by socio-economic and climatic changes. Hydrological Sciences Journal, 52, 247-275.
AMORIM, Б. & VASCONCELOS, V. 1999. Dynamics of microcystins in the mussel Mytilus galloprovincialis. Toxicon, 37, 1041-1052.
ANDERSON, D. M., GLIBERT, P. M. & BURKHOLDER, J. M. 2002. Harmful algal blooms and eutrophication: nutrient sources, composition, and consequences. Estuaries, 25, 704-726.
ANDERSON, D. M., KULIS, D. M., QI, Y.-Z., ZHENG, L., LU, S. & LIN, Y.-T. 1996. Paralytic shellfish poisoning in Southern China. Toxicon, 34, 579-590.
ANITESCU, G. & TAVLARIDES, L. L. 2006. Supercritical extraction of contaminants from soils and sediments. The Journal of Supercritical Fluids, 38, 167-180.
ARENA, P., LEVIN, B., FLEMING, L. E., FRIEDMAN, M. A. & BLYTHE, D. 2004. A pilot study of the cognitive and psychological correlates of chronic ciguatera poisoning. Harmful Algae, 3, 51-60.
ARNÁIZ, E., BERNAL, J., MARTÍN, M. T., NOZAL, M. J., BERNAL, J. L. & TORIBIO, L. 2012. Supercritical fluid extraction of free amino acids from broccoli leaves. Journal of Chromatography A, 1250, 49-53.
ARNELL, N. W. 2004. Climate change and global water resources: SRES emissions and socio-economic scenarios. Global Environmental Change, 14, 31-52.
ARNOLD, T. N. & OLDHAM, C. E. 1997. Trace-element contamination of a shallow wetland in Western Australia. Marine and Freshwater Research, 48, 531-539.
AZEVEDO, S. M. F. O., CARMICHAEL, W. W., JOCHIMSEN, E. M., RINEHART, K. L., LAU, S., SHAW, G. R. & EAGLESHAM, G. K. 2002. Human intoxication by microcystins during renal dialysis treatment in Caruaru—Brazil. Toxicology, 181–182, 441-446.
BABICA, P., BLAHA, L. & MARSALEK, B. 2005. Removal of microcystins by phototrophic biofilms - A microcosm study. Environmental Science and Pollution Research, 12, 369-374.
BABICA, P., KOHOUTEK, J., BLAHA, L., ADAMOVSKY, O. & MARSALEK, B. 2006. Evaluation of extraction approaches linked to ELISA and HPLC for analyses of microcystin-LR, -RR and -YR in freshwater sediments with different organic material contents. Analytical and Bioanalytical Chemistry, 385, 1545-1551.
BADGER, M. R., PRICE, G. D., LONG, B. M. & WOODGER, F. J. 2006. The environmental plasticity and ecological genomics of the cyanobacterial CO2 concentrating mechanism. Journal of Experimental Botany 57, 249-265.

LITERATURE CITED
109
BARTRAM, J., CARMICHAEL, W. W., CHORUS, I., JONES, G. & SKULBERG, O. M. 1999. Toxic cyanobacteria in water: A guide to their public health consequences, monitoring and management, London, UK, Spon Press.
BEUTLER, M., WILTSHIRE, K. H., MEYER, B., MOLDAENKE, C., LURING, C., MEYERHOFER, M., HANSEN, U. P. & DAU, H. 2002. A fluorometric method for the differentiation of algal populations in vivo and in situ. Photosynthesis Research, 72, 39-53.
BOURNE, D. G., BLAKELEY, R. L., RIDDLES, P. & JONES, G. J. 2006. Biodegradation of the cyanobacterial toxin microcystin LR in natural water and biologically active slow sand filters. Water Research, 40, 1294-1302.
BOURNE, D. G., JONES, G. J., BLAKELEY, R. L., JONES, A., NEGRI, A. P. & RIDDLES, P. 1996. Enzymatic pathway for the bacterial degradation of the cyanobacterial cyclic peptide toxin microcystin LR. Applied and Environmental Microbiology, 62, 4086-4094.
BOWADT, S. & HAWTHORNE, S. B. 1995. Supercritical fluid extraction in environmental analysis. Journal of Chromatography A, 703, 549-571.
BOWMAN, G. M. & HUTKA, J. 2002. Particle size analysis In: MCKENZIE, N. J., COUGHLAN, K. J. & CRESSWELL, H. P. (eds.) Soil physical measurement and interpretation for land evaluation. CSIRO Publishing.
BRETZ, C. K., MANOUKI, T. J. & KVITEK, R. G. 2002. Emerita analoga (Stimpson) as an indicator species for paralytic shellfish poisoning toxicity along the California coast. Toxicon, 40, 1189-1196.
BRIAND, E., GUGGER, M., FRANÇOIS, J.-C., BERNARD, C., HUMBERT, J.-F. & QUIBLIER, C. 2008. Temporal variations in the dynamics of potentially microcystin-producing strains in a bloom-forming Planktothrix agardhii (cyanobacterium) population. Applied and Environmental Microbiology, 74, 3839-3848.
BRUNBERG, A.-K. & BOSTRÖM, B. 1992. Coupling between benthic biomass of Microcystis and phosphorus release from the sediments of a highly eutrophic lake. Hydrobiologia, 375-385.
CAMEL, V. 1998. Supercritical fluid extraction as a useful method for pesticides determination. Analusis Magazine, 26, 99-111.
CAREY, C. C., IBELINGS, B. W., HOFFMANN, E. P., HAMILTON, D. P. & BROOKES, J. D. 2012. Eco-physiological adaptations that favour freshwater cyanobacteria in a changing climate. Water Research, 46, 1394-1407.
CARMICHAEL, W. W. 1992. Cyanobacteria secondary metabolites—the cyanotoxins. Journal of Applied Microbiology, 72, 445-459.
CARMICHAEL, W. W. 1997. The Cyanotoxins. In: CALLOW, J. A. (ed.) Advances in Botanical Research. Burlington: Elsevier.
CARMICHAEL, W. W. 2001. Health effects of toxin-producing cyanobacteria: "The CyanoHABs". Human and Ecological Risk Assessment, 7, 1393-1407.
CHEN, C. Y. & CHOU, H. N. 2002. A modified high-performance liquid chromatography method for analysis of PSP toxins in dinoflagellate, Alexandrium minutum, and shellfish from Taiwan. Food Research International, 35, 715-720.

LITERATURE CITED
110
CHEN, J. & XIE, P. 2005. Seasonal dynamics of the hepatotoxic microcystins in various organs of four freshwater bivalves from the large eutrophic lake Taihu of subtropical China. Environmental Toxicology and Pharmacology, 20, 572-584.
CHEN, J., XIE, P., ZHANG, D. & LEI, H. 2007. In situ studies on the distribution patterns and dynamics of microcystins in a biomanipulation fish - bighead carp (Aristichthys nobilis). Environmental Pollution, 147, 150-157.
CHEN, W., LI, L., GAN, N. & SONG, L. 2006a. Optimization of an effective extraction procedure for the analysis of microcytins in soils and lake sediments. Environmental Pollution, 143, 241-246.
CHEN, W., SONG, L., GAN, N. & LI, L. 2006b. Sorption, degradation and mobility of microcystins in Chinese agriculture soils: risk assessment for groundwater protection. Environmental Pollution, 144, 752-758.
CHEN, W., SONG, L., PENG, L., WAN, N., ZHANG, X. & GAN, N. 2008. Reduction in microcystin concentrations in large and shallow lakes: Water and sediment-interface contributions. Water Research, 42, 763-773.
CHEN, X., YANG, X., YANG, L., XIAO, B., WU, X., WANG, J. & WAN, H. 2010. An effective pathway for the removal of microcystin LR via anoxic biodegradation in lake sediments. Water Research, 44, 1884-1892.
CHORUS, I., FALCONER, I. R., SALAS, H. J. & BARTRAM, J. 2000. Health risks caused by freshwater cyanobacteria in recreational waters. Journal of Toxicology and Environmental Health, Part B: Critical Reviews, 3, 323-347.
CHRISTOFFERSEN, K., LYCK, S. & WINDING, A. 2002. Microbial activity and bacterial community structure during degradation of microcystins. Aquatic Microbial Ecology, 27, 125-136.
CODD, G. A., BELL, S. G., KAYA, K., WARD, C. J., BEATTIE, K. A. & METCALF, J. S. 1999. Cyanobacterial toxins, exposure routes and human health. European Journal of Phycology, 34, 405-415.
CODD, G. A., STEFFENSEN, D. A., BURCH, M. D. & BAKER, P. D. 1994. Toxic blooms of cyanobacteria in Lake Alexandrina, South Australia - learning from history. Austalian Journal of Marine Fresh Resouces, 45, 731-736.
CORBEL, S., MOUGIN, C. & BOUAÏCHA, N. 2014. Cyanobacterial toxins: Modes of actions, fate in aquatic and soil ecosystems, phytotoxicity and bioaccumulation in agricultural crops. Chemosphere, 96, 1-15.
CORDEIRO-ARAÚJO, M. K. & BITTENCOURT-OLIVEIRA, M. D. C. 2013. Active release of microcystins controlled by an endogenous rhythm in the cyanobacterium Microcystis aeruginosa. Phycological Research, 61, 1-6.
COUSINS, I. T., BEALING, D. J., JAMES, H. A. & SUTTON, A. 1996. Biodegradation of microcystin-LR by indigenous mixed bacterial populations. Water Research, 30, 481-485.
DAVIS, T. W., BERRY, D. L., BOYER, G. L. & GOBLER, C. J. 2009. The effects of temperature and nutrients on the growth and dynamics of toxic and non-toxic strains of Microcystis during cyanobacteria blooms. Harmful Algae, 8, 715-725.
DE FIGUEIREDO, D. R., AZEITEIRO, U. M., ESTEVES, S. M., GONÇALVES, F. J. M. & PEREIRA, M. J. 2004. Microcystin-producing blooms—a serious global public health issue. Ecotoxicology and Environmental Safety, 59, 151-163.

LITERATURE CITED
111
DE LA CRUZ, A. A., ANTONIOU, M. G., HISKIA, A., PELAEZ, M., SONG, W. H., O'SHEA, K. E., HE, X. X. & DIONYSIOU, D. D. 2011. Can we effectively degrade microcystins? - Implications on human health. Anti-Cancer Agents in Medicinal Chemistry, 11, 19-37.
DONATI, C., DRIKAS, M., HAYES, R. & NEWCOMBE, G. 1994. Microcystin-LR adsorption by powdered activated carbon. Water Research, 28, 1735-1742.
DÖRR, F. A., PINTO, E., SOARES, R. M. & FELICIANO DE OLIVEIRA E AZEVEDO, S. M. 2010. Microcystins in South American aquatic ecosystems: Occurrence, toxicity and toxicological assays. Toxicon, 56, 1247-1256.
DUONG, T., LE, T., DAO, T.-S., PFLUGMACHER, S., ROCHELLE-NEWALL, E., HOANG, T., VU, T., HO, C. & DANG, D. 2013. Seasonal variation of cyanobacteria and microcystins in the Nui Coc Reservoir, Northern Vietnam. Journal of Applied Phycology, 25, 1065-1075.
DZIGA, D., WASYLEWSKI, M., WLADYKA, B., NYBOM, S. & MERILUOTO, J. 2013. Microbial degradation of microcystins. Chemical Research in Toxicology, 26, 841-852.
EDWARDS, C., BEATTIE, K. A., SCRIMGEOUR, C. M. & CODD, G. A. 1992. Identification of anatoxin-A in benthic cyanobacteria (blue-green algae) and in associated dog poisonings at Loch Insh, Scotland. Toxicon, 30, 1165-1175.
EDWARDS, C., GRAHAM, D., FOWLER, N. & LAWTON, L. A. 2008. Biodegradation of microcystins and nodularin in freshwaters. Chemosphere, 73, 1315-1321.
ELLIOTT, J. A. 2012. Is the future blue-green? A review of the current model predictions of how climate change could affect pelagic freshwater cyanobacteria. Water Research, 46, 1364-1371.
EL-SHEHAWY, R., GOROKHOVA, E., PIÑAS, F. F. & CAMPO, F. F. D. 2012. Global warming and hepatotoxin production by cyanobacteria: What can we learn from experiments? Water Research, 46, 1420-1429.
ELEUTERIO, L. & BATISTA, J. R. 2010. Biodegradation studies and sequencing of microcystin-LR degrading bacteria isolated from a drinking water biofilter and a fresh water lake. Toxicon, 55, 1434-1442.
ENGSTRÖM-ÖST, J., REPKA, S. & MIKKONEN, M. 2011. Interactions between plankton and cyanobacterium Anabaena with focus on salinity, growth and toxin production. Harmful Algae, 10, 530-535.
FALCONER, I. R. 2001. Toxic cyanobacterial bloom problems in Australian waters: risks and impacts on human health. Phycologia, 40, 228-233.
FANG, Y.-F., HUANG, Y., YANG, J., WANG, P. & CHENG, G. 2011. Unique ability of BiOBr to decarboxylate d-Glu and d-MeAsp in the photocatalytic degradation of microcystin-LR in water. Environmental Science & Technology, 45, 1593-1600.
FRAGA, S., ANDERSON, D. M., BRAVO, I., REGUERA, B., STEIDINGER, K. A. & YENTSCH, C. M. 1988. Influence of upwelling relaxation on dinoflagellates and shellfish toxicity in Ria de Vigo, Spain. Estuarine, Coastal and Shelf Science, 27, 349-361.
FUNARI, E. & TESTAI, E. 2008. Human health risk assessment related to cyanotoxins exposure. Critical Reviews in Toxicology, 38, 97-125.

LITERATURE CITED
112
GHADOUANI, A., ALLOUL, B. P., ZHANG, Y. & PREPAS, E. E. 1998. Relationships between zooplankton community structure and phytoplankton in two lime-treated eutrophic hardwater lakes. Freshwater Biology, 39, 775-790.
GHADOUANI, A. & COGGINS, L. X. 2011. Science, technology and policy for water pollution control at the watershed scale: Current issues and future challenges. Physics and Chemistry of the Earth, Parts A/B/C, 36, 335-341.
GHADOUANI, A. & PINEL-ALLOUL, B. 2002. Phenotypic plasticity in Daphnia pulicaria as an adaptation to high biomass of colonial and filamentous cyanobacteria: experimental evidence. Journal of Plankton Research, 24, 1047-1056.
GHADOUANI, A., PINEL-ALLOUL, B., PLATH, K., CODD, G. A. & LAMPERT, W. 2004. Effects of Microcystis aeruginosa and purified microcystin-LR on the feeding behavior of Daphnia pulicaria. Limnology and Oceanography, 49, 666-679.
GHADOUANI, A., PINEL-ALLOUL, B. & PREPAS, E. E. 2003. Effects of experimentally induced cyanobacterial blooms on crustacean zooplankton communities. Freshwater Biology, 48, 363-381.
GHADOUANI, A., PINEL-ALLOUL, B. & PREPAS, E. E. 2006. Could increased cyanobacterial biomass following forest harvesting cause a reduction in zooplankton body size structure? Canadian Journal of Fisheries and Aquatic Sciences, 63, 2308-2317.
GHADOUANI, A. & SMITH, R. E. H. 2005. Phytoplankton distribution in Lake Erie as assessed by a new in situ spectrofluorometric technique. Journal of Great Lakes Research, 31, Supplement 2, 154 -167.
GIARAMIDA, L., MANAGE, P. M., EDWARDS, C., SINGH, B. K. & LAWTON, L. A. 2013. Bacterial communities' response to microcystins exposure and nutrient availability: Linking degradation capacity to community structure. International Biodeterioration & Biodegradation, 84, 111-117.
GREEN, D. H., LLEWELLYN, L. E., NEGRI, A. P., BLACKBURN, S. I. & BOLCH, C. J. S. 2004. Phylogenetic and functional diversity of the cultivable bacterial community associated with the paralytic shellfish poisoning dinoflagellate Gymnodinium catenatum. FEMS Microbiology Ecology, 47, 345-357.
GRIFFITHS, D. J. & SAKER, M. L. 2003. The Palm Island mystery disease 20 years on: A review of research on the cyanotoxin cylindrospermopsin. Environmental Toxicology, 18, 78-93.
GRUT MACHER, G., WESSEL, G., KLITZKE, S. & CHORUS, I. 2010. Microcystin elimination during sediment contact. Environmental Science & Technology, 44, 657-662.
GUTIÉRREZ-PRAENA, D., JOS, Á., PICHARDO, S., MORENO, I. M. & CAMEÁN, A. M. 2013. Presence and bioaccumulation of microcystins and cylindrospermopsin in food and the effectiveness of some cooking techniques at decreasing their concentrations: A review. Food and Chemical Toxicology, 53, 139-152.
HEAD, R. M., JONES, R. I. & BAILEY-WATTS, A. E. 1999. An assessment of the influence of recruitment from the sediment on the development of planktonic

LITERATURE CITED
113
populations of cyanobacteria in a temperate mesotrophic lake. Freshwater Biology, 41, 759-769.
HEINZE, R. 1999. Toxicity of the cyanobacterial toxin microcystin-LR to rats after 28 days intake with the drinking water. Environmental Toxicology, 14, 57-60.
HEIRI, O., LOTTER, A. & LEMCKE, G. 2001. Loss on ignition as a method for estimating organic and carbonate content in sediments: reproducibility and comparability of results. Journal of Paleolimnology, 25, 101-110.
HEISLER, J., GLIBERT, P. M., BURKHOLDER, J. M., ANDERSON, D. M., COCHLAN, W., DENNISON, W. C., DORTCH, Q., GOBLER, C. J., HEIL, C. A., HUMPHRIES, E., LEWITUS, A., MAGNIEN, R., MARSHALL, H. G., SELLNER, K., STOCKWELL, D. A., STOECKER, D. K. & SUDDLESON, M. 2008. Eutrophication and harmful algal blooms: A scientific consensus. Harmful Algae, 8, 3-13.
HERRERO, M., MENDIOLA, J. A., CIFUENTES, A. & IBÁÑEZ, E. 2010. Supercritical fluid extraction: Recent advances and applications. Journal of Chromatography A, 1217, 2495-2511.
HIRIPI, L., NAGY, L., KALMAR, T., KOVACS, A. & VOROS, L. 1998. Insect (Locusta migratoria migratorioides) test monitoring the toxicity of cyanobacteria, Amsterdam, PAYS-BAS, Elsevier.
HITZFELD, B. C., LAMPERT, C. S., SPAETH, N., MOUNTFORT, D., KASPAR, H. & DIETRICH, D. R. 2000. Toxin production in cyanobacterial mats from ponds on the McMurdo Ice Shelf, Antarctica. Toxicon, 38, 1731-1748.
HO, L., HOEFEL, D., SAINT, C. P. & NEWCOMBE, G. 2007. Isolation and identification of a novel microcystin-degrading bacterium from a biological sand filter. Water Research, 41, 4685-4695.
HO, L., MEYN, T., KEEGAN, A., HOEFEL, D., BROOKES, J., SAINT, C. P. & NEWCOMBE, G. 2006. Bacterial degradation of microcystin toxins within a biologically active sand filter. Water Research, 40, 768-774.
HO, L., SAWADE, E. & NEWCOMBE, G. 2012a. Biological treatment options for cyanobacteria metabolite removal – A review. Water Research, 46, 1536-1548.
HO, L., TANG, T., HOEFEL, D. & VIGNESWARAN, B. 2012b. Determination of rate constants and half-lives for the simultaneous biodegradation of several cyanobacterial metabolites in Australian source waters. Water Research, 46, 5735-5746.
HO, L., TANG, T., MONIS, P. T. & HOEFEL, D. 2012c. Biodegradation of multiple cyanobacterial metabolites in drinking water supplies. Chemosphere, 87, 1149-1154.
HOLST, T., JØRGENSEN, N. O. G., JØRGENSEN, C. & JOHANSEN, A. 2003. Degradation of microcystin in sediments at oxic and anoxic, denitrifying conditions. Water Research, 37, 4748-4760.
HOTTO, A. M., SATCHWELL, M. F., BERRY, D. L., GOBLER, C. J. & BOYER, G. L. 2008. Spatial and temporal diversity of microcystins and microcystin-producing genotypes in Oneida Lake, NY. Harmful Algae, 7, 671-681.
HUANG, Z., SHI, X.-H. & JIANG, W.-J. 2012. Theoretical models for supercritical fluid extraction. Journal of Chromatography A, 1250, 2-26.

LITERATURE CITED
114
HUBER, V., WAGNER, C., GERTEN, D. & ADRIAN, R. 2012. To bloom or not to bloom: contrasting responses of cyanobacteria to recent heat waves explained by critical thresholds of abiotic drivers. Oecologia, 169, 245-256.
HUDNELL, H. K. 2010. The state of U.S. freshwater harmful algal blooms assessments, policy and legislation. Toxicon, 55, 1024-1034.
HYENSTRAND, P., ROHRLACK, T., BEATTIE, K. A., METCALF, J. S., CODD, G. A. & CHRISTOFFERSEN, K. 2003. Laboratory studies of dissolved radiolabelled microcystin-LR in lake water. Water Research, 37, 3299-3306.
IBELINGS, B. W., BRUNING, K., DE JONGE, J., WOLFSTEIN, K., PIRES, L. M. D., POSTMA, J. & BURGER, T. 2005. Distribution of microcystins in a lake foodweb: No evidence for biomagnification. Microbial Ecology, 49, 487-500.
IHLE, T., JÄHNICHEN, S. & JÜRGEN, B. 2005. Wax and wane of Microcystis (cyanophyceae) and microcystins in lake sediments: a case study in Quitzdorf Reservoir Journal of Phycology, 41, 479-488.
ITO, E., KONDO, F., TERAO, K. & HARADA, K.-I. 1997. Neoplastic nodular formation in mouse liver induced by repeated intraperitoneal injections of microcystin-LR. Toxicon, 35, 1453-1457.
JI, R. P., LU, X. W., LI, X. N. & PU, Y. P. 2009. Biological degradation of algae and microcystins by microbial enrichment on artificial media. Ecological Engineering, 35, 1584-1588.
JONES, G. J. & ORR, P. T. 1994. Release and degradation of microcystin following algicide treatment of a Microcystis aeruginosa bloom in a recreational lake, as determined by HPLC and protein phosphatase inhibition assay. Water Research, 28, 871-876.
JONES, G. J., BOURNE, D. G., BLAKELEY, R. L. & DOELLE, H. 1994. Degradation of the cyanobacterial hepatotoxin microcystin by aquatic bacteria. Natural Toxins, 2, 228-235.
KAEBERNICK, M., NEILAN, B. A., BORNER, T. & DITTMANN, E. 2000. Light and the transcriptional response of the microcystin biosynthesis gene cluster. Applied and Environmental. Microbiology 66, 3387-3392.
KEMP, A. & JOHN, J. 2006. Microcystins associated with Microcystis dominated blooms in the Southwest wetlands, Western Australia. Environmental Toxicology, 21, 125-130.
KIM, S.-G., JOUNG, S.-H., AHN, C.-Y., KO, S.-R., BOO, S. M. & OH, H.-M. 2010. Annual variation of Microcystis genotypes and their potential toxicity in water and sediment from a eutrophic reservoir. FEMS Microbiology Ecology, 74, 93-102.
KIRKPATRICK, B., FLEMING, L. E., SQUICCIARINI, D., BACKER, L. C., CLARK, R., ABRAHAM, W., BENSON, J., CHENG, Y. S., JOHNSON, D., PIERCE, R., ZAIAS, J., BOSSART, G. D. & BADEN, D. G. 2004. Literature review of Florida red tide: Implications for human health effects. Harmful Algae, 3, 99-115.
KLITZKE, S., APELT, S., WEILER, C., FASTNER, J. & CHORUS, I. 2010. Retention and degradation of the cyanobacterial toxin cylindrospermopsin in sediments – The role of sediment preconditioning and DOM composition. Toxicon, 55, 999-1007.

LITERATURE CITED
115
KLITZKE, S. & FASTNER, J. 2012. Cylindrospermopsin degradation in sediments – The role of temperature, redox conditions, and dissolved organic carbon. Water Research, 46, 1549-1555.
KOTAK, B. G., ZURAWELL, R. W., PREPAS, E. E. & HOLMES, C. F. B. 1996. Microcystin-LR concentration in aquatic food web compartments from lakes of varying trophic status. Canadian Journal of Fisheries and Aquatic Sciences, 53, 1974-1985.
KUNDZEWICZ, Z. W., L.J. MATA, N.W. ARNELL, P. DÖLL, P. KABAT, B. JIMÉNEZ, K.A. MILLER, T. OKI, Z. SEN & SHIKLOMANOV, I. A. 2007. Freshwater resources and their management. In: M.L. PARRY, O.F. CANZIANI, J.P. PALUTIKOF, LINDEN, P. J. V. D. & HANSON, C. E. (eds.) Climate Change 2007: Impacts, adaptation and vulnerability. Contribution of working group II to the fourth assessment report of the intergovernmental panel on climate change. Cambridge UK: Cambridge University Press.
KURMAYER, R., CHRISTIANSEN, G., GUMPENBERGER, M. & FASTNER, J. 2005. Genetic identification of microcystin ecotypes in toxic cyanobacteria of the genus Planktothrix. Microbiology, 2005, 1525 - 1533.
LAHTI, K., RAPALA, J., FÄRDIG, M., NIEMELÄ, M. & SIVONEN, K. 1997. Persistence of cyanobacterial hepatotoxin, microcystin-LR in particulate material and dissolved in lake water. Water Research, 31, 1005-1012.
LAM, A. K. Y., FEDORAK, P. M. & PREPAS, E. E. 1995a. Biotransformation of the cyanobacterial hepatotoxin microcystin-LR, as determined by HPLC and protein phosphatase bioassay. Environmental Science & Technology, 29, 242-246.
LAM, A. K. Y., PREPAS, E. E., SPINK, D. & HRUDEY, S. E. 1995b. Chemical control of hepatotoxic phytoplankton blooms: Implications for human health. Water Research, 29, 1845-1854.
LAMBERT, T. W., HOLMES, C. F. B. & HRUDEY, S. E. 1996. Adsorption of microcystin-LR by activated carbon and removal in full scale water treatment. Water Research, 30, 1411-1422.
LATOUR, D. & GIRAUDET, H. 2004. Factors influencing the spatio-temporal distribution of benthic Microcystis aeruginosa colonies (cyanobacteria) in the hypertrophic Grangent Reservoir (Loire, France). Comptes Rendus Biologies, 327, 753-761.
LATOUR, D., SALENçON, M.-J., REYSS, J.-L. & GIRAUDET, H. 2007. Sedimentary imprint of Microcystis aeruginosa (cyanobacteria) blooms in Grangent reservoir (Loire, France). Journal of Phycology, 43, 417-425.
LAWTON, L. A., EDWARDS, C. & CODD, G. A. 1994. Extraction and high-performance liquid chromatographic method for the determination of microcystins in raw and treated waters. Analyst, 119, 1525-1530.
LEITNER, W. 2000. Green chemistry: Desinged to dissolve. Nature, 405, 129-130.
LEMES, G. A. F., KERSANACH, R., DA S. PINTO, L., DELLAGOSTIN, O. A., YUNES, J. S. & MATTHIENSEN, A. 2008. Biodegradation of microcystins by aquatic Burkholderia spp. from a South Brazilian coastal lagoon. Ecotoxicology and Environmental Safety, 69, 358-365.
LEWITUS, A. J., HORNER, R. A., CARON, D. A., GARCIA-MENDOZA, E., HICKEY, B. M., HUNTER, M., HUPPERT, D. D., KUDELA, R. M., LANGLOIS, G. W.,

LITERATURE CITED
116
LARGIER, J. L., LESSARD, E. J., RALONDE, R., JACK RENSEL, J. E., STRUTTON, P. G., TRAINER, V. L. & TWEDDLE, J. F. 2012. Harmful algal blooms along the North American west coast region: History, trends, causes, and impacts. Harmful Algae, 19, 133-159.
LI, J., SHIMIZU, K., MASEDA, H., LU, Z., UTSUMI, M., ZHANG, Z. & SUGIURA, N. 2012. Investigations into the biodegradation of microcystin-LR mediated by the biofilm in wintertime from a biological treatment facility in a drinking-water treatment plant. Bioresource Technology, 106, 27-35.
LIU, G., QIAN, Y., DAI, S. & FENG, N. 2008. Adsorption of microcystin LR and LW on suspended particulate matter (SPM) at different pH. Water, Air, & Soil Pollution, 192, 67-76.
LIU, Y., SONG, L., LI, X. & LIU, T. 2002. The toxic effects of microcystin-LR on embryo-larval and juvenile development of loach, Misguruns mizolepis Gunthe. Toxicon, 40, 395-399.
LONG, B. M., JONES, G. J. & ORR, P. T. 2001. Cellular microcystin content in N-limited Microcystis aeruginosa can be predicted from growth rate. Applied and Environmental Microbiology, 67, 278-283.
MA, T., GONG, S., ZHOU, K., ZHU, C., DENG, K., LUO, Q. & WANG, Z. 2010. Laboratory culture of the freshwater benthic gastropod Bellamya aeruginosa (Reeve) and its utility as a test species for sediment toxicity. Journal of Environmental Sciences, 22, 304-313.
MATSUNAGA, H., HARADA, K. I., SENMA, M., ITO, Y., YASUDA, N., USHIDA, S. & KIMURA, Y. 1999. Possible cause of unnatural mass death of wild birds in a pond in Nishinomiya, Japan: Sudden appearance of toxic cyanobacteria. Natural Toxins, 7, 81-84.
MATTEA, F., MARTÍN, Á. & COCERO, M. J. 2009. Carotenoid processing with supercritical fluids. Journal of Food Engineering, 93, 255-265.
MAZUR-MARZEC, H., TORUNSKA, A., BLONSKA, M. J., MOSKOT, M., PLINSKI, M., JAKÓBKIEWICZ-BANECKA, J. & WEGRZYN, G. 2009. Biodegradation of nodularin and effects of the toxin on bacterial isolates from the Gulf of Gdansk. Water Research, 43, 2801-2810.
MEDINA, I. 2012. Determination of diffusion coefficients for supercritical fluids. Journal of Chromatography A, 1250, 124-140.
MEZ, K., BEATTIE, K. A., CODD, G. A., HANSELMANN, K., HAUSER, B., NAEGELI, H. & PREISIG, H. R. 1997. Identification of a microcystin in benthic cyanobacteria linked to cattle deaths on alpine pastures in Switzerland. European Journal of Phycology, 32, 111-117.
MILLER, M. J., CRITCHLEY, M. M., HUTSON, J. & FALLOWFIELD, H. J. 2001. The adsorption of cyanobacterial hepatotoxins from water onto soil during batch experiments. Water Research, 35, 1461-1468.
MILUTINOVIC, A., SEDMAK, B., HORVAT-ZNIDARSIC, I. & SUPUT, D. 2002. Renal injuries induced by chronic intoxication with microcystins. Cellular & Molecular Biology Letters, 7, 139-41.
MISSON, B. & LATOUR, D. 2012. Influence of light, sediment mixing, temperature and duration of the benthic life phase on the benthic recruitment of Microcystis. Journal of Plankton Research, 34, 113-119.

LITERATURE CITED
117
MISSON, B., SABART, M., AMBLARD, C. & LATOUR, D. 2012. Benthic survival of Microcystis: Long-term viability and ability to transcribe microcystin genes. Harmful Algae, 13, 20-25.
MOHAMED, Z., EL-SHAROUNY, H. & ALI, W. 2007. Microcystin concentrations in the Nile River sediments and removal of microcystin-LR by sediments during batch experiments. Archives of Environmental Contamination and Toxicology, 52, 489-495.
MOHAMED, Z. A., EL-SHAROUNY, H. M. & ALI, W. S. M. 2006. Microcystin production in benthic mats of cyanobacteria in the Nile River and irrigation canals, Egypt. Toxicon, 47, 584-590.
MOHSEN-NIA, M., AMIRI, H. & JAZI, B. 2010. Dielectric constants of water, methanol, ethanol, butanol and acetone: measurement and computational study. Journal of Solution Chemistry, 39, 701-708.
MONTAGNOLLI, W., ZAMBONI, A., LUVIZOTTO-SANTOS, R. & YUNES, J. S. 2004. Acute effects of Microcystis aeruginosa from the Patos Lagoon estuary, Southern Brazil, on the microcrustacean Kalliapseudes schubartii (Crustacea:Tanaidacea). Archives of Environmental Contamination and Toxicology, 46, 463-469.
MOORE, S., TRAINER, V., MANTUA, N., PARKER, M., LAWS, E., BACKER, L. & FLEMING, L. 2008. Impacts of climate variability and future climate change on harmful algal blooms and human health. Environmental Health, 7, S4.
MORENO, I. M., MARAVER, J., AGUETE, E. C., LEAO, M., GAGO-MARTÍNEZ, A. & CAMEÁN, A. M. 2004. Decomposition of microcystin-LR, microcystin-RR, and microcystin-YR in water samples submitted to in vitro dissolution tests. Journal of Agricultural and Food Chemistry, 52, 5933-5938.
MORRIS, R. J., WILLIAMS, D. E., LUU, H. A., HOLMES, C. F. B., ANDERSEN, R. J. & CALVERT, S. E. 2000. The adsorption of microcystin-LR by natural clay particles. Toxicon, 38, 303-308.
MUNUSAMY, T., HU, Y.-L. & LEE, J.-F. 2012. Adsorption and photodegradation of microcystin-LR onto sediments collected from reservoirs and rivers in Taiwan: a laboratory study to investigate the fate, transfer, and degradation of microcystin-LR. Environmental Science and Pollution Research, 19, 2390-2399.
MUR, L. R., SKULBERG, O. M. & UTKILEN, H. 1999. Cyanobacteria in the environment. In: CHORUS, I. & BARTRAM, J. (eds.) Toxic cyanobacteria in water: A guide to their public health, consequences, monitoring and management. Suffolk: St.Edmundsbury Press.
O’NEIL, J. M., DAVIS, T. W., BURFORD, M. A. & GOBLER, C. J. 2012. The rise of harmful cyanobacteria blooms: The potential roles of eutrophication and climate change. Harmful Algae, 14, 313-334.
PAERL, H. W., HALL, N. S. & CALANDRINO, E. S. 2011. Controlling harmful cyanobacterial blooms in a world experiencing anthropogenic and climatic-induced change. Science of the Total Environment, 409, 1739-1745.
PAERL, H. W. & HUISMAN, J. 2009. Climate change: a catalyst for global expansion of harmful cyanobacterial blooms. Environmental Microbiology Reports, 1, 27-37.

LITERATURE CITED
118
PAERL, H. W. & PAUL, V. J. 2012. Climate change: Links to global expansion of harmful cyanobacteria. Water Research, 46, 1349-1363.
PAL, S., CHATTERJEE, S. & CHATTOPADHYAY, J. 2007. Role of toxin and nutrient for the occurrence and termination of plankton bloom--Results drawn from field observations and a mathematical model. Biosystems, 90, 87-100.
PALIKOVA, M., ONDRACKOVA, P., MARES, J., ADAMOVSKY, O., PIKULA, J., KOHOUTEK, J., NAVRATIL, S., BLAHA, L. & KOPP, R. 2013. In vivo effects of microcystins and complex cyanobacterial biomass on rats (Rattus norvegicus var. alba): Changes in immunological and haematological parameters. Toxicon, 73, 1-8.
PAPADIMITRIOU, T., KAGALOU, I. & LEONARDOS, I. 2012. Seasonally accumulation of microcystins in the various tissues of an endemic and protected fish species (Rutilus panosi) with different sizes. Clean-Soil Air Water, 40, 402 - 407.
PARK, H. D., SASAKI, Y., MARUYAMA, T., YANAGISAWA, E., HIRAISHI, A. & KATO, K. 2001. Degradation of the cyanobacterial hepatotoxin microcystin by a new bacterium isolated from a hypertrophic lake. Environmental Toxicology, 16, 337-343.
PEARSON, M. J. 1990. Toxic blue-green algae. Report of the National Rivers Authority Water Quality Series No. 2. Rushden,United Kingdom,: Stanley L. Hunt.
POURIA, S., DE ANDRADE, A., BARBOSA, J., CAVALCANTI, R. L., BARRETO, V. T. S., WARD, C. J., PREISER, W., POON, G. K., NEILD, G. H. & CODD, G. A. 1998. Fatal microcystin intoxication in haemodialysis unit in Caruaru, Brazil. The Lancet, 352, 21-26.
PYO, D. & LIM, C. 2006. Supercritical fluid extraction of microcysin LR from cyanobacteria using aqueous acetonitrile modifier. Journal of Liquid Chromatography and Related Technologies 29, 2691-2700.
PYO, D., OH, C. & CHOI, J. C. 2004. Simultaneous separation and purification of microcystin LR, RR, YR by using supercritical fluid extraction and column chromatography. Analytical Letters, 37, 2595-2608.
PYO, D. & SHIN, H. 1999. Supercritical fluid extraction of microcystins from cyanobacteria. Analytical Chemistry, 71, 4772-4775.
PYO, D. & SHIN, H. 2001. Supercritical fluid extraction of microcystin YR from cyanobacteria. Analytical Sciences, 17, 175-179.
PYO, K. P., HYUNDU SHIN,MYEONGHEE MOON 1999. Extraction of microcystins from cyanobacteria by acetic-acid modified supercritical CO2. Chromatographia 49, 539-06.
RAPALA, J., LAHTI, K., SIVONEN, K. & NIEMELA, S. I. 1994. Biodegradability and adsorption on lake sediments of cyanobacterial hepatotoxins and anatoxin-A. Letters in Applied Microbiology, 19, 423-428.
REICHWALDT, E. S. & GHADOUANI, A. 2012. Effects of rainfall patterns on toxic cyanobacterial blooms in a changing climate: Between simplistic scenarios and complex dynamics. Water Research, 46, 1372-1393.

LITERATURE CITED
119
REICHWALDT, E. S., SONG, H. & GHADOUANI, A. 2013. Effects of the distribution of a toxic Microcystis bloom on the small scale patchiness of zooplankton PLOS ONE, 8, E66674.
RINTA-KANTO, J. M., KONOPKO, E. A., DEBRUYN, J. M., BOURBONNIERE, R. A., BOYER, G. L. & WILHELM, S. W. 2009a. Lake Erie Microcystis: Relationship between microcystin production, dynamics of genotypes and environmental parameters in a large lake. Harmful Algae, 8, 665-673.
RINTA-KANTO, J. M., SAXTON, M. A., DEBRUYN, J. M., SMITH, J. L., MARVIN, C. H., KRIEGER, K. A., SAYLER, G. S., BOYER, G. L. & WILHELM, S. W. 2009b. The diversity and distribution of toxigenic Microcystis spp. in present day and archived pelagic and sediment samples from Lake Erie. Harmful Algae, 8, 385-394.
RIVASSEAU, C., MARTINS, S. & HENNION, M.-C. 1998. Determination of some physicochemical parameters of microcystins (cyanobacterial toxins) and trace level analysis in environmental samples using liquid chromatography. Journal of Chromatography A, 799, 155-169.
RODRÍGUEZ, E., ONSTAD, G. D., KULL, T. P. J., METCALF, J. S., ACERO, J. L. & VON GUNTEN, U. 2007. Oxidative elimination of cyanotoxins: Comparison of ozone, chlorine, chlorine dioxide and permanganate. Water Research, 41, 3381-3393.
SAHENA, F., ZAIDUL, I. S. M., JINAP, S., JAHURUL, M. H. A., KHATIB, A. & NORULAINI, N. A. N. 2010. Extraction of fish oil from the skin of Indian mackerel using supercritical fluids. Journal of Food Engineering, 99, 63-69.
SAITO, T., SUGIURA, N., ITAYAMA, T., INAMORI, Y. & MATSUMURA, M. 2003. Biodegradation of Microcystis and microcystins by indigenous nanoflagellates on biofilm in a practical treatment facility. Environmental Technology, 24, 143-151.
SCHÖNE, K., JÄHNICHEN, S., IHLE, T., LUDWIG, F. & BENNDORF, J. 2010. Arriving in better shape: Benthic Microcystis as inoculum for pelagic growth. Harmful Algae, 9, 494-503.
SCHOPF, J. W. 2000. The fossil record: tracing the roots of the cyanobacterial lineage. In: WHITTON, B. A. & POTTS, M. (eds.) The Ecology of Cyanobacteria: Their Diversity in Time and Space. Dordrecht: Kluwer Academic Publishers.
SEVILLA, E., MARTIN-LUNA, B., VELA, L., BES, M.T., , PELEATO, M. L. & FILLAT, M. F. 2010. Microcystin-LR synthesis as response to nitrogen: transcriptional analysis of the mcyD gene in Microcystis aeruginosa PCC7806. Ecotoxicology and Environmental Safety, 19, 1167-1173.
SHARMA, V. K., TRIANTIS, T. M., ANTONIOU, M. G., HE, X., PELAEZ, M., HAN, C., SONG, W., O’SHEA, K. E., DE LA CRUZ, A. A., KALOUDIS, T., HISKIA, A. & DIONYSIOU, D. D. 2012. Destruction of microcystins by conventional and advanced oxidation processes: A review. Separation and Purification Technology, 91, 3-17.
SIVONEN, K. & JONES, G. 1999. Cyanobacterial Toxins. In: CHORUS, I. & BERTRAM, J. (eds.) Toxic cyanobacteria in water: A guide to their public health consequences, monitoring and management. London: Spon Press.
SI NANG, S. C. 2012. Spatial and temporal synamics of cyanobacteria and microcystins in freshwater systems: implication for the management of wate resources. Doctor, The Univeristy of Western Australia.

LITERATURE CITED
120
SINANG, S., REICHWALDT, E. & GHADOUANI, A. 2013. Spatial and temporal variability in the relationship between cyanobacterial biomass and microcystins. Environmental Monitoring and Assessment, 185, 6379-6395.
SONG, H., REICHWALDT, E. S. & GHADOUANI, A. 2014. Contribution of sediments in the removal of microcystin-LR from water. Toxicon, 10.1016/j.toxicon.2014.02.019.
SONG, L., CHEN, W., PENG, L., WAN, N., GAN, N. & ZHANG, X. 2007a. Distribution and bioaccumulation of microcystins in water columns: A systematic investigation into the environmental fate and the risks associated with microcystins in Meiliang Bay, Lake Taihu. Water Research, 41, 2853-2864.
SONG, W., BARDOWELL, S. & O'SHEA, K. E. 2007b. Mechanistic study and the influence of oxygen on the photosensitized transformations of microcystins (cyanotoxins). Environmental Science & Technology, 41, 5336-5341.
SPOERKE, D. G. & RUMACK, B. H. 1985. Blue-green algae poisoning. Journal of Emergency Medicine, 2, 353-355.
SRIVASTAVA, A., SINGH, S., AHN, C.-Y., OH, H.-M. & ASTHANA, R. K. 2013. Monitoring approaches for a toxic cyanobacterial bloom. Environmental Science & Technology, 47, 8999-9013.
SUMMONS, R. E., JAHNKE, L. L., HOPE, J. M. & LOGAN, G. A. 1999. 2-Methylhopanoids as biomarkers for cyanobacterial oxygenic photosynthesis. Nature Australia, 400, 554-557.
SUNARSO, J. & ISMADJI, S. 2009. Decontamination of hazardous substances from solid matrices and liquids using supercritical fluids extraction: A review. Journal of Hazardous Materials, 161, 1-20.
SUTCLIFFE, D. W. & JONES, J. G. 1992. Eutrophication: research and application to water supply, Windermere,England, Freshwater Biological Association.
TAKAMURA, N., YASUNO, M. & SUGAHARA, K. 1984. Overwintering of Microcystis aeruginosa Kutz. in a shallow lake. Journal of Plankton Research, 6, 1019-1029.
TAKENAKA, S. & WATANABE, M. F. 1997. Microcystin LR degradation by Pseudomonas aeruginosa alkaline protease. Chemosphere, 34, 749-757.
TALEB, H., VALE, P. & BLAGHEN, M. 2003. Spatial and temporal evolution of PSP toxins along the Atlantic shore of Morocco. Toxicon, 41, 199-205.
TIAN, D., ZHENG, W., WEI, X., SUN, X., LIU, L., CHEN, X., ZHANG, H., ZHOU, Y., CHEN, H., ZHANG, H., WANG, X., ZHANG, R., JIANG, S., ZHENG, Y., YANG, G. & QU, W. 2013. Dissolved microcystins in surface and ground waters in regions with high cancer incidence in the Huai River Basin of China. Chemosphere, 91, 1064-1071.
TORUNSKA, A., BOLALEK, J., PLINSKI, M. & MAZUR-MARZEC, H. 2008. Biodegradation and sorption of nodularin (NOD) in fine-grained sediments. Chemosphere, 70, 2039-2046.
TREVORS, J. T. 1996. Sterilization and inhibition of microbial activity in soil. Journal of Microbiological Methods, 26, 53-59.
TRICARICO, E., BERTOCCHI, S., BRUSCONI, S., CASALONE, E., GHERARDI, F., GIORGI, G., MASTROMEI, G. & PARISI, G. 2008. Depuration of microcystin-

LITERATURE CITED
121
LR from the red swamp crayfish Procambarus clarkii with assessment of its food quality. Aquaculture, 285, 90-95.
TSUJI, K., MASUI, H., UEMURA, H., MORI, Y. & HARADA, K.-I. 2001. Analysis of microcystins in sediments using MMPB method. Toxicon, 39, 687-692.
TURNER, P. C., GAMMIE, A. J., HOLLINRAKE, K. & CODD, G. A. 1990. Pneumonia associated with contact with cyanobacteria. BMJ, 300, 1440-1441.
UENO, Y., NAGATA, S., TSUTSUMI, T., HASEGAWA, A., WATANABE, M. F., PARK, H.-D., CHEN, G.-C., CHEN, G. & YU, S.-Z. 1996. Detection of microcystins, a blue-green algal hepatotoxin, in drinking water sampled in Haimen and Fusui, endemic areas of primary liver cancer in China, by highly sensitive immunoassay. Carcinogenesis, 17, 1317-1321.
UNITED NATIONS COMMITTEE, O. E. S. A. C. R. 2003. The right to Water. 18.
VAN APELDOORN, M. E., VAN EGMOND, H. P., SPEIJERS, G. J. A. & BAKKER, G. J. I. 2007. Toxins of cyanobacteria. Molecular Nutrition & Food Research, 51, 7-60.
VASCONCELOS, V. 2001. Freshwater cyanobacteria and their toxins in Portugal. In: CHORUS, I. (ed.) Cyanotoxins—Occurrence, Causes, Consequences. Berlin: Springer.
VERSPAGEN, J. M. H., SNELDER, E. O. F. M., VISSER, P. M., HUISMAN, J., MUR, L. R. & IBELINGS, B. W. 2004. Recruitment of benthic Microcystis (cyanophyceae) to the water column: Internal buoyancy changes or resuspension? . Journal of Phycology, 40, 260-270.
VERSPAGEN, J. M. H., SNELDER, E. O. F. M., VISSER, P. M., JÖ, HNK, K. D., IBELINGS, B. W., MUR, L. R. & HUISMAN, J. E. F. 2005. Benthic–pelagic coupling in the population dynamics of the harmful cyanobacterium Microcystis. Freshwater Biology, 50, 854-867.
VEZIE, C., RAPALA, J., VAITOMAA, J., SEITSONEN, J. & SIVONEN, K. 2002. Effect of nitrogen and phosphorus on growth of toxic and nontoxic Microcystis strains and on intracellular microcystin concentrations. Microbial Ecolology, 43, 443-454.
VOROSMARTY, C. J., MCINTYRE, P. B., GESSNER, M. O., DUDGEON, D., PRUSEVICH, A., GREEN, P., GLIDDEN, S., BUNN, S. E., SULLIVAN, C. A., REIDY LIERMANN, C. & DAVIES, P. M. 2010. Global threats to human water security and river biodiversity. Nature, 467, 555-561.
WANG, H. X., HO, L., LEWIS, D. M., BROOKES, J. D. & NEWCOMBE, G. 2007. Discriminating and assessing adsorption and biodegradation removal mechanisms during granular activated carbon filtration of microcystin toxins. Water Research, 41, 4262-4270.
WATANABE, M. F., TSUJI, K., WATANABE, Y., HARADA, K.-I. & SUZUKI, M. 1992a. Release of heptapeptide toxin (microcystin) during the decomposition process of Microcystis aeruginosa. Natural Toxins, 1, 48-53.
WATANABE, M. M., KAYA, K. & TAKAMURA, N. 1992b. Fate of the toxic cyclic heptapeptides, the microcystins, from blooms of Microcystis (cyanobacteria) in a hypertrophic lake Journal of Phycology, 28, 761-767.

LITERATURE CITED
122
WELKER, M., ŠEJNOHOVÁ, L., NÉMETHOVÁ, D., HANS VON, D., JARKOVSKÝ, J. & MARŠÁLEK, B. 2007. Seasonal shifts in chemotype composition of Microcystis spp. communities in the pelagial and the sediment of a shallow reservoir. Limnology and Oceanography, 52, 609-619.
WELKER, M., STEINBERG, C. & JONES, G. 2001. Release and persistence of microcystins in natrual waters. In: CHORUS, I. (ed.) Cyanotoxins: Occurrence, causes, consequences. London: Springer.
WHO 1998. Health Criteria and Other Supporting Information. Guidelines for Drinking Water Quality. 2nd ed. Geneva, Switzerland: World Health Organization.
WHO 2003. Coastal and fresh waters. Guidlnes for safe recreational water environments. Geneva, Switzerland: World Health Organization.
WILLIAMS, D. E., DAWE, S. C., KENT, M. L., ANDERSEN, R. J., CRAIG, M. & HOLMES, C. F. 1997. Bioaccumulation and clearance of microcystins from salt water mussels, Mytilus edulis, and in vivo evidence for covalently bound microcystins in mussel tissues. Toxicon : official journal of the International Society on Toxinology, 35, 1617-25.
WÖRMER, L., CIRÉS, S. & QUESADA, A. 2011. Importance of natural sedimentation in the fate of microcystins. Chemosphere, 82, 1141-1146.
WU, X., WANG, C., XIAO, B., WANG, Y., ZHENG, N. & LIU, J. 2012. Optimal strategies for determination of free/extractable and total microcystins in lake sediment. Analytica Chimica Acta, 709, 66-72.
WU, X., XIAO, B., LI, R., WANG, C., HUANG, J. & WANG, Z. 2011. Mechanisms and factors affecting sorption of microcystins onto natural sediments. Environmental Science & Technology, 45, 2641-2647.
WU, Y., HE, J. & YANG, L. 2010. Evaluating adsorption and biodegradation mchanisms during the removal of microcystin-RR by periphyton. Environmental Science & Technology, 44, 6319-6324.
YEN, H., LIN, T., TSENG, I., TUNG, S. & HSU, M. 2007. Correlating 2-MIB and microcystin concentrations with environmental parameters in two reservoirs in South Taiwan. Water Science & Technology, 55, 33-41.
ŽEGURA, B., ŠTRASER, A. & FILIPIČ, M. 2011. Genotoxicity and potential carcinogenicity of cyanobacterial toxins – a review. Mutation Research, 727, 16-41.
ZHANG, M., DUAN, H., SHI, X., YU, Y. & KONG, F. 2012. Contributions of meteorology to the phenology of cyanobacterial blooms: implications for future climate change. Water Research, 46, 442-452.
ZURAWELL, R. W., HUIRONG, C., BURKE, J. M. & PREPAS, E. E. 2005. Hepatotoxic cyanobacteria: A review of the biological importance of microcystins in freshwater environments. Journal of Toxicology and Environmental Health, Part B: Critical Reviews, 8, 1-37.


![VorlesungImmunanalytik end.ppt [Kompatibilitätsmodus] · PDF fileCyanobacteria produce highly potent toxins,Cyanobacteria produce highly potent toxins, e.g. microcystins (hepatotoxic)](https://static.fdocuments.us/doc/165x107/5a7884767f8b9ae91b8b72fd/vorlesungimmunanalytik-endppt-kompatibilittsmodus-produce-highly-potent-toxinscyanobacteria.jpg)