THE ROLE OF RETIREE HEALTH INSURANCE IN THE … · We thank Bob Clark, ... We model the probability...
28
NBER WORKING PAPER SERIES THE ROLE OF RETIREE HEALTH INSURANCE IN THE EARLY RETIREMENT OF PUBLIC SECTOR EMPLOYEES John B. Shoven Sita Slavov Working Paper 19563 http://www.nber.org/papers/w19563 NATIONAL BUREAU OF ECONOMIC RESEARCH 1050 Massachusetts Avenue Cambridge, MA 02138 October 2013 We thank Bob Clark, Maria Fitzpatrick, Olivia Mitchell, Joseph Newhouse, Richard Zeckhauser, and participants at the NBER Conference on State and Local Health Plans for Active and Retired Public Employees for helpful comments; Alan Gustman and Nahid Tabatabai for providing assistance with the pension wealth data; and Brittany Pineros and Yong Yu for excellent research assistance. Our previous research on this topic was funded by Sloan Foundation and National Institute on Aging grants to the National Bureau of Economic Research. The views expressed herein are those of the authors and do not necessarily reflect the views of the National Bureau of Economic Research. NBER working papers are circulated for discussion and comment purposes. They have not been peer- reviewed or been subject to the review by the NBER Board of Directors that accompanies official NBER publications. © 2013 by John B. Shoven and Sita Slavov. All rights reserved. Short sections of text, not to exceed two paragraphs, may be quoted without explicit permission provided that full credit, including © notice, is given to the source.
Transcript of THE ROLE OF RETIREE HEALTH INSURANCE IN THE … · We thank Bob Clark, ... We model the probability...
NBER WORKING PAPER SERIES
THE ROLE OF RETIREE HEALTH INSURANCE IN THE EARLY RETIREMENTOF PUBLIC SECTOR EMPLOYEES
John B. ShovenSita Slavov
Working Paper 19563http://www.nber.org/papers/w19563
NATIONAL BUREAU OF ECONOMIC RESEARCH1050 Massachusetts Avenue
Cambridge, MA 02138October 2013
We thank Bob Clark, Maria Fitzpatrick, Olivia Mitchell, Joseph Newhouse, Richard Zeckhauser, andparticipants at the NBER Conference on State and Local Health Plans for Active and Retired PublicEmployees for helpful comments; Alan Gustman and Nahid Tabatabai for providing assistance withthe pension wealth data; and Brittany Pineros and Yong Yu for excellent research assistance. Our previousresearch on this topic was funded by Sloan Foundation and National Institute on Aging grants to theNational Bureau of Economic Research. The views expressed herein are those of the authors and donot necessarily reflect the views of the National Bureau of Economic Research.
NBER working papers are circulated for discussion and comment purposes. They have not been peer-reviewed or been subject to the review by the NBER Board of Directors that accompanies officialNBER publications.
© 2013 by John B. Shoven and Sita Slavov. All rights reserved. Short sections of text, not to exceedtwo paragraphs, may be quoted without explicit permission provided that full credit, including © notice,is given to the source.
The Role of Retiree Health Insurance in the Early Retirement of Public Sector EmployeesJohn B. Shoven and Sita SlavovNBER Working Paper No. 19563October 2013JEL No. I1,J2,J3,J4
ABSTRACT
Most private sector workers with employer-provided health insurance have a strong incentive to continueworking until Medicare eligibility in order to maintain group health coverage. However, most governmentemployees have access to retiree health coverage, which allows them access to group health coverageeven if they retire before Medicare eligibility. We study the impact of retiree health coverage on theprobability of stopping work among public sector workers between the ages of 55 and 64. We findthat, for state and local government employees, retiree health coverage raises the probability of stoppingwork by 5.1 percentage points (around 28 percent) between ages 60 and 64. However, we find no evidencethat retiree health coverage influences state and local employees’ decisions to stop work at ages 55-59,or that such coverage has an effect on the probability of stopping work for federal and military employees.
John B. ShovenDepartment of Economics579 Serra Mall at Galvez StreetStanford, CA 94305-6015and [email protected]
Sita SlavovAmerican Enterprise Institute1150 17th Street, NWWashington, DC [email protected]
1
I. Introduction
Public sector budgets have come under increasing pressure in recent years, mainly due to
the escalating cost of providing pension and health benefits to retirees. This financial burden is
exacerbated by the fact that many public sector pension plans contain strong incentives to retire
early, often well before age 65. In addition, public sector employers usually provide employees
with retiree health insurance, which allows former employees who meet certain age and service
requirements to participate in a group health plan. Retiree health insurance can facilitate early
retirement, thereby enhancing the effects of the retirement incentives in pension plans. As group
health insurance is typically available only through employment, most individuals with
employer-provided health coverage have an incentive to delay retirement until Medicare
eligibility – at age 65 – in order to maintain health care coverage.1 According to the Kaiser
Family Foundation (2013), among large firms providing employer-sponsored coverage, just over
a quarter also provide retiree coverage, and that fraction has fallen sharply over time. However,
workers who are eligible for retiree health coverage – including most public sector employees –
can maintain group coverage even if they retire before Medicare eligibility.
In this paper, we examine the impact of retiree health coverage on the retirement
decisions of public sector employees.2 Because retirement is difficult to measure directly, in our
empirical analysis, we use exit from a career job as a proxy for retirement. That is, we study
whether generous retiree health insurance is associated with an increased pre-Medicare job exit
rate among public sector employees with 5 or more years of job tenure. We model the
probability of stopping work at ages 55-64 as a function of the generosity of retiree health
1 In principle, the Consolidated Omnibus Budget Reconciliation Act (COBRA) allows workers to retire at age 63½
by giving them the right to them to buy into their former employer’s group health plan. However, while COBRA
gives workers access to group rates, it typically does not include an employer contribution. 2 Retiree health coverage may also reduce the need to save for retirement. A related paper (Clark and Mitchell 2013)
examines the impact of retiree health coverage on the saving decisions of public sector workers.

2
coverage, as well as controls for demographics, health, job characteristics, work history, and
pension plan retirement incentives. We focus on the decision to stop work before the age of 65
because retiree health coverage is most valuable for retirees in this group. Typically, a public
sector retiree health plan is the primary payer for pre-Medicare eligible retirees. When a retiree
becomes eligible for Medicare, however, he or she is required to enroll in Medicare, relying on
the retiree health plan only as a secondary payer (Clark and Morrill 2010).
To preview our results, we find that retiree health coverage raises the probability of
stopping work for state and local employees by 5.1 percentage points (around 28 percent)
between the ages of 60 and 64. This effect is somewhat larger than for private sector employees.
We find no evidence that retiree health coverage influences decision to stop work for federal and
military employees. Furthermore, we find no evidence of a link between retiree health coverage
and stopping work for public sector employees aged 55-59.
In the near future, the Affordable Care Act (ACA) will allow all individuals to purchase
group health insurance on state-run exchanges. In addition, many individuals will receive
subsidies towards their health insurance purchases. Because the exchanges make group health
insurance available outside of employment, the ACA effectively provides all individuals with
retiree health insurance. Thus, both public and private employers offering retiree health
coverage will find that the compensation packages they offer are less attractive to workers. In
response, we might expect to see state and local governments increase monetary compensation
for their employees while dropping retiree health coverage.
The remainder of this paper is organized as follows. Section II provides a summary of the
prior research on retiree health insurance and retirement and an overview of public sector retiree
health plans. Section III describes our data and methodology. Section IV presents our results.

3
Section V discusses the policy implications of our results in light of the ACA. Section VI
concludes.
II. Prior Research on Health Insurance and Retirement
The vast majority of public sector workers are covered by retiree health plans, which
allow them to purchase group health insurance after retirement. A number of studies have
examined the provisions of these plans. Federal employees continue to participate in the Federal
Employees Health Benefits (FEHB) program when they retire (U.S. Office of Personnel
Management 2013), and retirees receive the same employer contribution as current employees.
The FEHB program provides access to a range of different health plans, and in most cases, the
federal government contributes either 72 percent of the overall weighted average premium, or 75
percent of premium of the chosen plan, whichever is smaller. At the state and local levels, the
provisions of public sector retiree health plans – for example, employer contributions, co-pays,
and deductibles – vary considerably (see e.g., Clark and Morrill 2010; GAO 2007; Clark,
Morrill, and Riche 2011). Within each public sector health plan, deductibles, co-pays, and the
employer contribution rate are often adjusted from year to year depending on health care costs
and the plan’s finances. In recent years, many plans have become less generous along these
dimensions (see e.g., Franzel and Brown 2012).
In principle, the availability of retiree health coverage makes it easier for workers to
retire prior to Medicare eligibility. Thus, we would expect to observe higher job exit rates or
lower labor force participation among retiree-health eligible workers in their late 50s and early
60s. Indeed, prior studies of retiree health coverage have found such a relationship. These studies
typically take one of three approaches. The first approach is to use a structural life cycle model to
4
simulate retirement behavior both with and without retiree health coverage. Studies taking this
approach include Blau and Gilleskie (2006, 2008), Gustman and Steinmeier (1994), Lumsdaine
Stock and Wise (1996), and French and Jones (2011). A second approach is to use micro-data to
directly estimate the impact of retiree health coverage on retirement. This is the approach taken
by Blau and Gilleskie (2001), Kapur and Rogowski (2011), Marton and Woodbury (2007),
Karoly and Rogowski (1994), Robinson and Clark (2010), Strumpf (2010), Madrian (1994),
Mulvey and Nyce (2004), Marton and Woodbury (2013), Leiserson (2013), and Nyce et al.
(2013). These studies typically find larger effects than those based on structural models. Finally,
Gruber and Madrian (1995) adopt a third approach based on aggregate state-level data. During
the 1970s and 1980s, a number of states, as well as the federal government, adopted
“continuation of coverage” requirements that allowed workers to continue to participate in their
employers’ group health plans after leaving employment. Using variation in these laws across
states and time, they find that continuation of coverage requirements reduced the labor force
participation rate of pre-Medicare workers.
These earlier studies focus primarily on the retirement behavior of private sector workers.
While some public sector workers may have been included in the samples analyzed, they are not
the focus of the analysis and most likely constitute a small fraction of the sample. One exception
is Leiserson (2013), who finds that eligibility for retiree health insurance increases the
probability of job exit for Pennsylvania state employees. Studies that focus on public sector
workers are valuable in light of the large role that retiree health insurance plays in public sector
budget shortfalls. Our paper contributes in this area by studying the relationship between retiree
health insurance and job exit decisions for a broad sample of public sector workers.

5
Retiree health insurance may have a stronger effect for public sector workers because
these individuals also have access to relatively generous defined benefit (DB) pensions. On the
other hand, the value of public sector retiree health insurance may be diminished by the
uncertainty surrounding the finances of these programs. Public sector retiree health plans have
accrued large unfunded liabilities in recent years. For example, a recent survey of 61 cities’
retiree health plans reveals total liabilities of $126 billion with assets of only $8 billion (Pew
Charitable Trusts 2013). For state governments, another recent study reports unfunded liabilities
of $627 billion for fiscal year 2010 (Pew Center on the States 2012). In response to these
shortfalls, a number of public sector employers have made changes to their retiree health plans,
making them less generous. And, a survey of state retiree health plan administrators suggests that
these individuals expect further tightening of eligibility requirements and reductions employer
contributions in the future (Clark and Morrill 2010). This uncertainty about future benefits is
likely to reduce the responsiveness of retirement decisions to retiree health coverage.
III. Data and Methodology
We use data from the Health and Retirement Study (HRS) in our analysis. The HRS is a
biennial panel survey that is intended to be representative of older Americans. We restrict our
sample to four cohorts in the HRS: the original HRS group that entered the survey in 1992, the
War Baby and the Children of Depression groups that entered the survey in 1998, and the Early
Baby Boomer group that entered the survey in 2004. For each of these groups, we define the
baseline year as the year in which the group entered the survey. We drop all individuals who do
not respond to the survey, or who respond via a proxy, in the baseline wave. We also drop
individuals with less than 5 years of service on their current job as of the baseline wave.
6
Individuals with 5 or more years of service are more likely to be eligible for retiree health
insurance. Moreover, these individuals can be considered career employees, for whom stopping
work is more likely to represent retirement rather than a job change.
Most of the variables used in our analysis – including demographic information, work
history, net wealth, self-reported health, earnings, employer and retiree health coverage, pension
coverage, occupation, and industry – come from the RAND version of the HRS, and they are
collected at the respondent’s baseline wave. Earnings and wealth are converted to 2004 dollars
using the consumer price index (CPI) in the respondent’s baseline interview year.3 Net wealth
includes checking and savings accounts, certificates of deposit, bonds, stocks, mutual funds,
IRAs, Keogh accounts, housing, vehicles, businesses, and any other savings less debt. This value
is Winsorized at the 0.5 percent level to avoid influential outliers. To track job exits, we also use
information on work status (whether an individual is doing any work for pay) and age in
subsequent interviews. We merge information from the raw HRS on current and prior public
sector employment. In particular, we define an individual as a current state or local employee if
the individual is working for a state or local government as of the baseline interview. We employ
a similar definition to identify current federal and military employees.4 Remaining employees are
divided into two groups: private sector employees (who report no prior public sector
employment) and private sector employees with a public past (who report prior public sector
employment). We drop individuals who cannot be classified into these employment categories
due to missing data.
3 We use the CPI Research Series Using Current Methods (CPI-U-RS), available at
http://www.bls.gov/cpi/cpiursfe1978_2012.pdf. 4 A few individuals report multiple kinds of public employment – e.g., state/local and federal. We classify
individuals as federal employees if they report any current federal employment, as state/local employees if they
report current state/local but not federal employment, and as military if they report current military but not current
federal or state/local employment.
7
Individuals are classified into several categories according to their retiree health
insurance and employer health insurance coverage in the baseline wave:
(1) Individuals with no employer health insurance
(2) Individuals with employer health insurance but no retiree health insurance
(3) Private sector employees with employer and retiree health insurance
(4) Federal or military employees with employer and retiree health insurance
(5) State or local employees with employer and retiree health insurance
We drop all individuals who cannot be classified into one of these five groups due to missing
information. Theory predicts that individuals in groups (3)-(5) should have a higher departure
rate than individuals in group (2).
In estimating the impact of retiree health coverage on retirement, it is important to control
properly for retirement incentives in employer-sponsored pension plans. Failing to do so may
inflate the measured impact of retiree health coverage on retirement. More generous pension
coverage is likely to be correlated with the presence of retiree health coverage, and to induce
early retirement through the wealth effect. Our measure of net wealth described above does not
include employer-sponsored pension wealth. However, data on pension wealth are available as a
researcher-contributed supplement to the HRS (Gustman, Steinmeier, and Tabatabai 2012). This
dataset includes a measure of total pension wealth, including defined contribution (DC) wealth
and the expected present value of DB wealth, for each respondent. The measure is based on
individuals’ self-reports of pension wealth and expected pension income in the HRS, and it
covers both current and previous jobs.5 We match each respondent to his or her pension wealth,
converted to 2004 dollars using the CPI in the baseline wave interview year.
5 Pension wealth includes DC plan balances from the respondent’s current and prior jobs, the present value of
anticipated benefits from the respondent’s most important DB plan on the current job (prorated to the time of
8
In addition to the possible wealth effect of pensions, individuals who participate in
defined benefit pensions often face strong early retirement incentives resulting from the pattern
of benefit accrual. A drop in pension accrual is equivalent to a cut in wages and creates an
incentive to retire. Ideally, we would want to control for the change in defined benefit pension
wealth from continuing to work at any particular age.6 In the absence of such a measure, we
utilize an alternative approach. Typically, DB plans allow individuals to collect an actuarially
reduced benefit at the early retirement age and a “full” retirement benefit at the normal
retirement age. As discussed by Kotlikoff and Wise (1987), DB plans often incentivize job exit
at the early retirement age, and the incentive to leave grows even stronger at the normal
retirement age. The raw HRS data include self-reports of early and normal retirement ages for
respondents’ DB plans. We use the self-reports that are made in the baseline wave to determine
the retirement incentives an individual is likely to face at any given age following the baseline
wave.7
Another issue of concern is the possibility of selection on unobservables into jobs that
offer retiree health coverage. For example, individuals with a stronger preference for leisure
(who tend to retire earlier) may select into certain jobs, and these jobs may tend to offer retiree
health coverage as employees are more likely to value it (see French and Jones 2011). While it is
not possible to fully address this concern within the constraints of our data, excluding individuals
with less than 5 years of service minimizes the chances that the individuals in our dataset
interview), and the present value of anticipated benefits from DB plans in prior jobs. We replaced the pension
wealth values for a handful of individuals in our sample with revised values provided by the creators of the pension
wealth dataset. 6 Blau and Gilleskie (2008) are able to construct such a measure for the HRS by matching individuals to restricted
employer-provided pension plan information. However, we do not have access to these data. 7 For some individuals, the reported early retirement age is above the normal retirement age. In these instances, we
set the early retirement age equal to the normal retirement age. If the early retirement age is missing and the normal
retirement age is not, we again set the early retirement age equal to the normal retirement age. In either case, we are
implicitly assuming that early retirement is unavailable.

9
explicitly chose their jobs because of the retiree health coverage. Individuals who are more than
5 years away from retirement are less likely to think about retiree health coverage in evaluating
their compensation package.
We perform our main analysis at the person-wave level, and we use person-wave
observations in which the respondent’s age is between 55 and 64. As we cannot directly observe
retirement, the dependent variable in our analysis is an indicator for stopping work. It takes on
the value of zero if the respondent was working for pay in the previous wave and continues to
work for pay in the current wave. It takes on the value of 1 if the respondent was working for
pay in the previous wave and is no longer working for pay in the current wave. It is missing in
all other cases. We utilize only the first job exit for each respondent, dropping all subsequent
observations for a respondent after this occurs. Obviously stopping work does not always imply
retirement, as individuals may restart work later. However, we would expect it to be highly
correlated with retirement among the subset of people with at least 5 years of job tenure; that is,
departure from a career job in one’s late 50s or early 60s is highly likely to imply retirement.8
For each person-wave observation with a current age between 55 and 59, we construct a set of
DB pension status indicators that assign each person-year observation to one of the following
categories:9
8 Job tenure is based on a respondent’s job in the baseline wave. It is possible for an individual to switch jobs
between the baseline wave and a future wave, while remaining employed at the time of interview in all intervening
waves. If this occurs, our dependent variable would register a job exit when the individual leaves the new job, rather
than the job held in the baseline wave. However, we would expect such occurrences to be relatively rare. 9 The 1992 and 1998 waves of the HRS allow individuals to report information for up to three current employer-
sponsored retirement plans (either DB or DC). The 2004 wave allows individuals to report information for up to four
plans. The RAND HRS contains a relatively clean indicator for whether each reported plan is a DB, DC, or
combination plan. We code an individual as not covered by a DB pension if none of the reported plans are DB or
combination plans. We code an individual as eligible for a full retirement if he or she has reached the normal
retirement age for any of the plans that are coded as DB or combination plans. We code an individual as eligible for
an early retirement if he or she is not eligible for a full retirement benefit and has reached the early retirement age
for any of the plans that are coded as DB or combination plans. We code an individual as ineligible if he or she has
not reached the early eligibility age in any of the plans that are coded as DB or combination plans. Finally, we
10
(1) Individual is not covered by a DB pension on the current job in the baseline wave.
(2) Individual is covered by a DB pension on the current job in the baseline wave, but is
not eligible for an early retirement benefit.
(3) Individual is covered by a DB pension on the current job in the baseline wave, and is
eligible for an early, but not full, retirement benefit.
(4) Individual is covered by a DB pension on the current job in the baseline wave, and is
eligible for a full retirement benefit.
Relative to group (1), we would expect to see higher departure rates among individuals in groups
(3) and (4) as a result of the retirement incentives in DB plans.
Table 1 shows summary statistics for all the variables used in our analysis (except for the
occupational and industrial categories), for both the full sample and for public sector employees.
Compared to the full sample, public sector employees are more likely to be female and nonwhite,
and to have a college degree. They are more likely to have employer-provided health insurance,
retiree health insurance, and a defined benefit pension. Public sector employees tend to have
greater pension wealth and lower total (non-pension) assets. They are less likely to report fair or
poor health status. Finally, their earnings and years of service are slightly higher than those of
private sector workers.
We estimate logit models in which the dependent variable is our indicator for stopping
work. The key independent variables are a set of indicators for employer and retiree health
coverage, as defined earlier. We would expect the effect of retiree health to vary with age. For
example, one might expect retiree health coverage to have a stronger effect at age 62, when
individuals become eligible to claim a Social Security benefit. Ideally, we would want to interact
construct a separate indicator for individuals who report DB or combination plan coverage but have an
undetermined eligibility status due to missing information.
11
the retiree health indicators with a set of single-year age dummies, allowing their effects to vary
with age in the most flexible way possible. However, the number of public sector employees
with retiree health coverage at each single year of age is quite small. For state and local
employees, there are typically less than 350 observations at each age, and for federal and military
employees, there are typically fewer than 100 observations at each age. Thus, we cannot expect
to estimate, with a satisfactory degree of precision, the impact of public sector retiree health
insurance at each single year of age. To address this problem, we construct two broad age
dummies – one indicating an age between 55 and 59, and another indicating an age between 60
and 64. We interact these broad age dummies with the retiree health coverage indicators. We
also control for gender, race and ethnicity, education, marital status, number of children, fair or
poor self-reported health status, pension wealth, defined benefit pension status interacted with
the broad age dummies, a set of occupation dummies (based on the broad occupation categories
in the restricted HRS), a set of industry dummies, earnings and its square, years of service and its
square, total assets and its square, and a set of wave dummies. In our first set of regressions, we
include all person-wave observations. Next, we estimate the same set of regressions using only
observations on public sector employees. We cluster standard errors at the household level
throughout.
IV. Results
Table 2 shows the effect of retiree health coverage at ages 55-59, and at ages 60-64, for
all employees. The coefficients reported in this table are marginal effects.10
The first two
columns report results for a specification with no controls for personal and job characteristics, or
10
We only report the coefficients on the retiree health indicators and in some cases on the DB status indicators. Full
results are available upon request.

12
for pension wealth and status. That is, the only independent variables are the retiree health
coverage indicators interacted with broad age dummies. The second two columns report the
results for a specification that includes controls for personal and job characteristics, but no
controls for pension wealth and DB pension status. Finally, the last two columns include all
controls, including personal and job characteristics, pension wealth, and DB pension status. For
this specification, we also report the coefficients on DB pension status. The last two rows of the
table show the job exit rate at each age for the omitted categories of health insurance and DB
status – that is, for individuals with employer-provided health insurance and no retiree coverage,
and for individuals with no DB coverage.
The results in the final two columns (our preferred specification with all the controls)
suggest that retiree health coverage is associated with a significantly greater probability of
stopping work at ages 60-64 for both state and local, and private sector employees. However,
there is no evidence that retiree health coverage influences the job exit decisions of federal or
military employees. The lack of a statistically significant effect for this group may be due to the
small number of observations on federal and military employees. To be more specific, for state
and local employees, retiree health coverage raises the probability of stopping work by 5.1
percentage points (around 28 percent) at ages 60-64. This effect is somewhat larger than for
private sector employees. Among private sector employees, retiree health coverage raises the job
exit rate by 3.3 percentage points (around 18 percent) at ages 60-64. However, we find little
evidence that retiree health coverage has an effect on the retirement decisions of either public or
private sector employees at ages 55-59. (The effect of retiree health coverage is insignificant for
public sector employees and only significant at the 10 percent level for private sector
employees.) Interestingly, a lack of employer provided health insurance increases the probability
13
of stopping work (by 3.7 percentage points) at ages 55-59. This result is not surprising.
Individuals who lack employer-provided coverage are similar to those with retiree coverage in
the sense that they are not waiting for Medicare to retire.
Comparing the results in the last two columns of the table with those in the first four
columns indicates the importance of controlling for pension wealth and incentives. Controlling
for pension wealth and DB pension status reduces the measured effect of retiree health coverage
at ages 60-64 by about 1.5 percentage points for private sector employees and by almost 3
percentage points for state and local employees. In addition, it reduces the statistical significance
of retiree health coverage among the younger age group. The coefficients on the DB status
indicators in the last two columns have the expected signs. Eligibility for an early retirement
significantly raises the probability of stopping work among the older age group. Eligibility for a
full retirement has an even stronger effect in both the younger and older age groups. Finally,
being ineligible for benefits reduces the probability of stopping work. That is not surprising.
Compared to the omitted group of individuals with no DB coverage, those with DB coverage
who are ineligible for benefits may be incentivized to work longer to continue to accrue, and to
qualify for, benefits.
Table 3 presents the results from estimating the same model with single-year age
categories, rather than the broad age categories in Table 2. For state and local employees, the
effects of retiree health coverage appear to be concentrated at ages 61 and 64. For private sector
employees, they appear to be concentrated at age 60. However, we would not give too much
weight to these single-year age effects. As discussed in the previous section, the small number of
observations in each age-by-retiree health coverage cell does not allow us to estimate the single-
year age coefficients with much precision. We note, however, that the signs of the coefficients on
14
retiree health coverage are positive at almost all ages. This outcome is unlikely if the true values
of these coefficients are all zero.
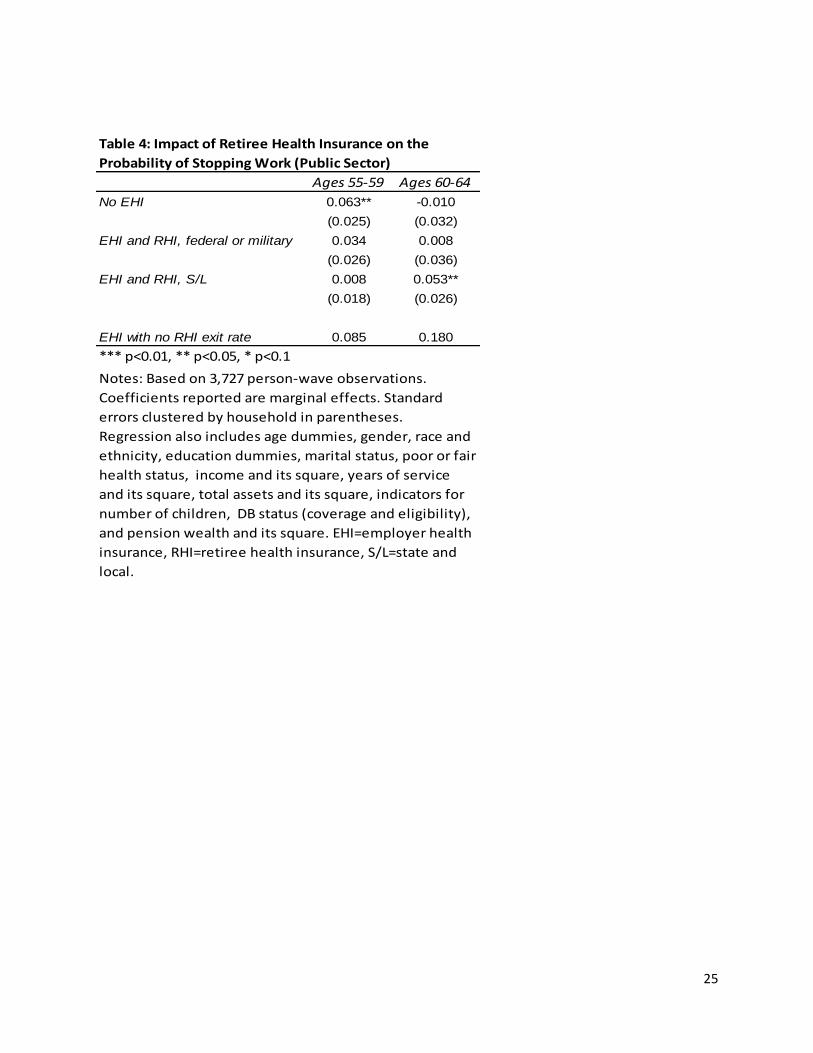
Table 4 presents the same results as the last two columns of Table 2, but using only
observations on public sector employees. Because many of the occupational and industrial
categories are sparse for this subsample, we exclude these controls from the regression. The
results for state and local workers are similar to those in Table 2, suggesting that retiree health
coverage raises the probability of stopping work by 5.3 percentage points (around 29 percent) at
ages 60-64, but has no statistically significant effect at ages 55-59. Again, there is no evidence
that retiree health coverage raises the probability of stopping work for federal and military
employees, possibly due to the small number of observations in this category. One caveat applies
to the results in this table. The fact that the vast majority of public sector employees are covered
by retiree health insurance raises some questions about the composition of the comparison group
with no retiree health coverage. These individuals may be part-time employees or contractors, or
they may simply be unaware that they have retiree health coverage. In the latter case, one might
expect these workers to behave as though they did not have retiree health coverage.
V. Policy Implications
The labor supply faced by employers, both in terms of the quality and quantity of labor
offered in the market, depends on the overall attractiveness of the jobs that they offer. This
attractiveness, in turn, depends on an entire vector of job attributes. Certainly, at the top of the
list is the compensation offered, but compensation includes both salary and benefits, with
benefits including retirement plans, health insurance, retiree health insurance, and other
considerations such as vacation accruals. Job attractiveness also depends on such things as

15
working conditions and job security. Traditionally, public sector jobs feature strong benefit
packages including defined benefit pensions, job security, and good health insurance coverage.
We have focused here on retiree health programs, which are nearly universal for public sector
workers, but which have become increasingly uncommon in the private sector.
The fact that public sector jobs offer relatively strong benefit packages allows them to
offer somewhat lower salaries and still compete in the overall job attractiveness that determines
labor supply. To simplify, public sector employment is characterized by high job security, strong
retirement (pension) and health benefits, and lower salary levels than are commonplace for jobs
with similar human capital requirements. People sort themselves out by their own tastes for job
security and benefits. In particular, individuals who are more risk averse and have lower rates of
time preference are more likely to appreciate the characteristics of state and local employment.
The Affordable Care Act (ACA) of 2010 will alter the equilibrium between state and
local employment and comparable private sector labor markets. By weakening the link between
employment and health insurance, the ACA reduces or eliminates the value of one of the key
benefits in the public sector employment package – the retiree health insurance benefit. The
reason that the value is reduced or eliminated is that workers will get this benefit or a similar
benefit whether they work in this sector or not. Public sector jobs will become relatively less
attractive unless employers adjust some other dimension of the employment package,
presumably salary levels. We elaborate on these changes below.
The ACA of 2010 breaks the connection between employment and health insurance for
many Americans, including, in particular, those who retire early before becoming eligible for
Medicare at 65. Beginning in 2014, every American will be able to buy health insurance through
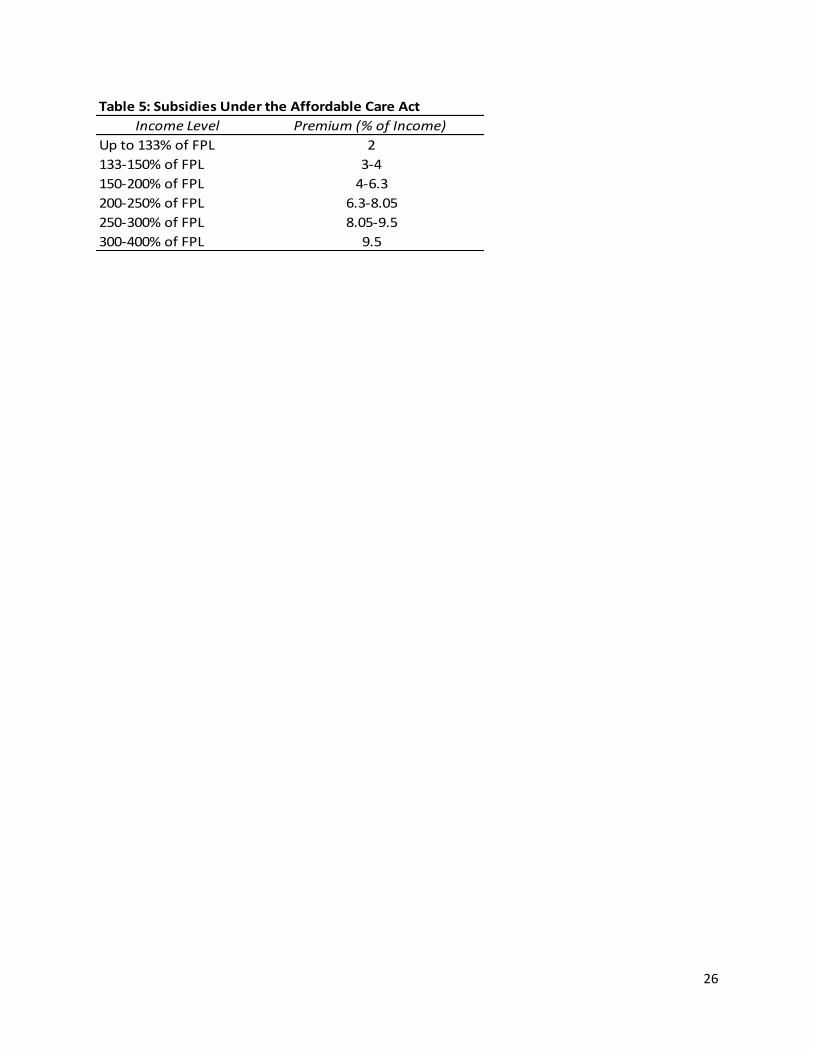
state-based exchanges. These purchases will be subsidized on a sliding scale for anyone whose
16
income is below 400 percent of the federal poverty level (FPL). The subsidies cover the majority
of Americans, including most people who retire in their 50s and 60s. To give an example of the
income levels that qualify for subsidies, note that the FPL in 2013 is $11,490 for single people
and $15,510 for married couples. Since the subsidies extend up to 400 percent of the FPL, that
means in 2014 they will extend to $46,879 for single individuals and $63,280 for married
couples, assuming a two-percent cost of living adjustment in the FPL for 2014. The sliding scale
of subsidies for health insurance purchases made through the state exchanges is shown in Table
5. These premiums apply to the purchase of the second lowest cost offering in the “silver plan
category.” The silver plan category is a set of plans which cover approximately 70 percent of the
total cost of medical care.
The net effect of offering subsidized health insurance through the exchanges is similar for
many Americans to offering retiree health insurance independent of work history. Consider a
60-year old single woman who decides to retire. Assume that she has worked in the private
sector for a company that did not offer retiree health benefits. However, if she has retirement
income of 250 percent of the 2014 FPL for single individuals (about $29,300 which may come
from either 401(k) withdrawals or a defined benefit pension plan), then she can obtain health
insurance through the exchange for 8.05% of her income, $2,490 per year or $207.53 per month.
This premium is well under half the cost of the insurance, so this is a heavily subsidized policy.
If her retirement income were instead only $23,440 (two times the FPL), then her premium cost
would be 6.3 percent of her income, or $123 per month. In either case, this woman effectively
has a very generous retiree health insurance package through the ACA initiated health exchange
system. When such coverage becomes universal in 2014, this will reduce or eliminate the value
17
of retiree health benefits for state and local jobs. Relative to private sector employment, public
sector jobs will no longer have better benefits, at least in this one dimension.
Public sector employers will have a couple of choices in how to respond to the ACA. If
they do nothing, their labor supply pool will deteriorate in terms of the size and quality of the
applicant pool. Public sector jobs will simply become less attractive relative to their private
sector counterparts. Governments could respond by raising salaries to restore their net
attractiveness in the labor market. They might decide to eliminate retiree health benefits and use
the money saved to finance the higher salaries. In fact, it would seem inefficient for
governments to spend money on retiree health benefits when similar policies are available
universally on the exchanges created by the ACA. The point here is not to predict exactly what
the governments will do, but simply to point out that the ACA will reduce the net attractiveness
of public sector jobs and unless there is a compensating adjustment, the quality of public sector
workers will suffer in the long run.
VI. Conclusions
This paper adds to the evidence that employer-sponsored retiree health insurance programs
lead to higher job exit rates among 60-64 year olds. In this sense, the results of this paper are
generally consistent with our earlier findings on employers in the private sector (Nyce et. al.
2013). There are several data limitations in the current paper. First, very few public sector
workers do not have retiree health benefits, making it more difficult to estimate the effect of
coverage within this group. Second, our measures of the retirement incentives in public sector
defined benefit pension plans are not as detailed as one would like. Finally, we are unable to
control fully for possible selection into jobs that offer retiree health coverage based on
18
unobservable characteristics. Overall, however, we find the evidence convincing that retiree
health plans have a significant and large impact on the probability of stopping work between
ages 60 and 64 in both the private and public sectors.
Given the growing evidence that retiree health programs lead to earlier retirement, it is
interesting to note that the Affordable Care Act (ACA) of 2010 offers what amounts to universal
retiree health. Under the ACA, beginning in 2014, all retirees under 65 will be able to purchase
group health coverage through the state-based exchanges, and those purchases will be subsidized
for all whose income in retirement is below 400 percent of the official poverty standard. The
research on retiree health programs, including this paper, suggests that the ACA will lead to
earlier retirements, particularly for those in the private sector who currently do not have access to
group health insurance in retirement before age 65.
The second ramification of the ACA is that it worsens the competitiveness of state and local
public sector jobs relative to private sector jobs without retiree health benefits. It does so by
making one of the benefits of public employment universally available. Our speculation is that
many state and local employers will drop retiree health benefits as a result. It makes little sense
to continue paying for something that many employees can get anyway (through the exchanges).
However, dropping retiree health benefits will not necessarily improve the budget pressures on
state and local governments, as the ACA worsens the relative attractiveness of state and local
jobs. In order to restore the overall attractiveness of these jobs and therefore maintain the quality
and quantity of applicant pools, some other job attribute – most likely salary – will have to be
improved.
19
References
Blau, David M. and Donna B. Gilleskie (2008). The Role of Retiree Health Insurance in the
Employment Behavior of Older Men. International Economic Review, 49(2), 475-514.
Blau, David M. and Donna B. Gilleskie (2006). Health Insurance and Retirement of Married
Couples. Journal of Applied Econometrics, 21(7), 935-953.
Blau, David M. and Donna B. Gilleskie (2001). Retiree Health Insurance and the Labor Force
Behavior of Older Men in the 1990s. Review of Economics and Statistics, 83(1), 64-80.
Clark, Robert L. and Melinda Sandler Morrill (2010). Retiree Health Plans in the Public Sector:
Is there a Funding Crisis? Northampton, MA: Edward Elgar Publishing Inc.
Clark, Robert L., Melinda Sandler Morrill, and Stephanie Riche (2011), Health Insurance for
Active and Retired City Employees: Asheville, Denver, and Oklahoma City. Center for
State and Local Government Excellence Issue Brief. Available at: http://slge.org/wp-
content/uploads/2012/01/NC-State-brief_Health-Insurance_Cities_12-068.pdf
Clark, Robert L. and Olivia Mitchell (2013). How Does Retiree Health Insurance Influence
Public Sector Employee Saving? Prepared for presentation at the NBER Conference on
State and Local Health Plans for Active and Retired Public Employees, August.
Franzel, Josh and Alexander Brown (2012). Understanding Finances and Changes in Retiree
Health Care. Government Finance Review, February, 59-63.
French, Eric and John Bailey Jones (2011). The Effects of Health Insurance and Self Insurance
on Retirement Behavior. Econometrica, 79(3), 693-732.
Gruber, Jonathan and Bridgette C. Madrian (1995). Health Insurance Availability and the
Retirement Decision. The American Economic Review, 85(4), 938-948.
Gustman, Alan L. and Thomas L. Steinmeier (1994). Employer Provided Health Insurance and
Retirement Behavior. Industrial and Labor Relations Review, 48(1), 124-140.
Gustman, Alan L., Thomas L. Steinmeier, and Nahid Tabatabai (2012). Enhancing Pension Data
Files for Modeling Health and Retirement and for the HRS User Community: 1992 to
2006. Available at: http://hrsonline.isr.umich.edu/.
Health and Retirement Study, public use dataset (2013). Produced and distributed by the
University of Michigan with funding from the National Institute on Aging (grant number
NIA U01AG009740). Ann Arbor, MI. Available at: http://hrsonline.isr.umich.edu/.
Kaiser Family Foundation (2013). Employer Health Benefits 2013 Annual Survey. Kaiser
Family Foundation and Health Research & Educational Trust 2013 Report. Available at:
20
http://kaiserfamilyfoundation.files.wordpress.com/2013/08/8465-employer-health-
benefits-20131.pdf.
Kapur, Kanika and Jeannette Rogowski (2011). How Does Health Insurance Affect the
Retirement Behavior of Women? Inquiry, 48(1), 51-67.
Karoly, Lynn A. and Jeannette Rogowski (1994). The Effect of Access to Post-Retirement
Health Insurance on the Decision to Retire Early. Industrial and Labor Relations
Review, 48(1), 103-123.
Kotlikoff, Laurence J. and David A. Wise (1987). The Incentive Effects of Private Pension
Plans. In Zvi Bodie, John B. Shoven, and David A. Wise (Eds.), Issues in Pension
Economics (pp. 283-340). Cambridge: National Bureau of Economic Research, Inc.
Leiserson, Greg (2013). Retiree Health Insurance and Job Separations: Evidence from
Pennsylvania State Employees. American Economic Journal: Economic Policy,
forthcoming.
Lumsdaine, Robin L., James H. Stock, and David A. Wise (1996). Retirement Incentives: The
Interaction between Employer-Provided Pensions, Social Security, and Retiree Health
Insurance. In Michael D. Hurd and Naohiro Yashiro (Eds.), The Economic Effects of
Aging in the United States and Japan (pp. 261-293). Chicago: University of Chicago
Press.
Madrian, Bridgette C. (1994). The Effect of Health Insurance on Retirement. Brookings Papers
on Economic Activity, 25(1), 181-232.
Marton, James, and Stephen A. Woodbury (2007). Retiree Health Benefit Coverage and
Retirement. In Dimitri B. Papadimitriou (Ed.), Government Spending on the Elderly (pp.
222-242). New York: Palgrave Macmillan.
Marton, James and Stephen A. Woodbury (2013). Retiree Health Benefits as Deferred
Compensation: Evidence from the Health and Retirement Study. Public Finance Review,
41(1), 64-91.
Mulvey, Janemarie and Steven Nyce (2004). Strategies to Retain Older Workers. In Robert L.
Clark and Olivia S. Mitchell (Eds.), Reinventing the Retirement Paradigm (pp. 111-132).
Oxford: Oxford University Press.
Nyce, Steven, Sylvester Schieber, John B. Shoven, Sita Slavov, and David A. Wise (2013). Does
Retiree Health Insurance Encourage Early Retirement? Journal of Public Economics,
104, 40-51.
Pew Center on the States (2010). The Trillion Dollar Gap: Underfunded state retirement systems
and the roads to reform. Pew Charitable Trusts Report, February. Available at:

21
http://www.pewstates.org/uploadedFiles/PCS_Assets/2010/Trillion_Dollar_Gap_Underfu
nded_State_Retirement_Systems_and_the_Roads_to_Reform.pdf.
Pew Center on the States (2012). The Widening Gap Update. Pew Charitable Trusts Issue Brief,
June. Available at:
http://www.pewstates.org/uploadedFiles/PCS_Assets/2012/Pew_Pensions_Update.pdf.
Pew Charitable Trusts (2013). A Widening Gap in Cities: Shortfalls in Funding for Pensions and
Retiree Health Care. Pew Charitable Trusts Report, January. Available at:
http://www.pewstates.org/uploadedFiles/PCS_Assets/2013/Pew_city_pensions_report.pd
f.
Robinson, Christina and Robert Clark (2010). Retiree Health Insurance and Disengagement from
a Career Job. Journal of Labor Research, 31(3), 247-262.
Gabriel Roeder Smith and Company, Consultants and Actuaries (2009). State of California
Retiree Health Benefits Program. Governmental Accounting Standards Board Nos. 43
and 45 Actuarial Valuation Report as of June 20, 2009. Available at:
http://sco.ca.gov/Press-Releases/2010/OPEB_February_2010.pdf.
Strumpf, Erin (2010). Employer-Sponsored Health Insurance for Early Retirees: Impacts on
Retirement, Health, and Health Care. International Journal of Health Care Finance and
Economics, 10(2), 105-147.
U.S. Government Accounting Office (2007). State and Local Government Retiree Benefits:
Current Status Benefit Structures, Protections, and Fiscal Outlook for Funding Future
Costs. Report to the Committee on Finance, U.S. Senate, GAO-07-1156. Available at:
http://www.gao.gov/new.items/d071156.pdf.
U.S. Office of Personnel Management (2013). Federal Employees: Guide Me. Guide to Federal
Employee Health Benefits. Available at: http://www.opm.gov/healthcare-
insurance/Guide-Me/Federal-Employees/.

22
Table 1: Summary Statistics
Variable Mean Std. Dev. Minimum Maximum Variable Mean Std. Dev. Minimum Maximum
Turnover 0.15 0.36 0 1 Turnover 0.16 0.37 0.00 1.00
Male 0.52 0.50 0 1 Male 0.47 0.50 0.00 1.00
White 0.81 0.39 0 1 White 0.76 0.43 0.00 1.00
Hispanic 0.06 0.24 0 1 Hispanic 0.06 0.23 0.00 1.00
Less than HS 0.14 0.35 0 1 Less than HS 0.07 0.25 0.00 1.00
GED 0.04 0.20 0 1 GED 0.04 0.19 0.00 1.00
HS diploma 0.31 0.46 0 1 HS diploma 0.24 0.43 0.00 1.00
Some college 0.24 0.42 0 1 Some college 0.21 0.41 0.00 1.00
College+ 0.27 0.44 0 1 College+ 0.45 0.50 0.00 1.00
Married 0.80 0.40 0 1 Married 0.78 0.42 0.00 1.00
No children 0.07 0.26 0 1 No children 0.09 0.28 0.00 1.00
1 child 0.09 0.28 0 1 1 child 0.10 0.31 0.00 1.00
2 children 0.30 0.46 0 1 2 children 0.30 0.46 0.00 1.00
3+ children 0.53 0.50 0 1 3+ children 0.51 0.50 0.00 1.00
Children unknown 0.00 0.07 0 1 Children unknown 0.01 0.08 0.00 1.00
Fair/poor health 0.10 0.30 0 1 Fair/poor health 0.07 0.25 0.00 1.00
No EHI 0.32 0.47 0 1 No EHI 0.18 0.38 0.00 1.00
EHI but no RHI 0.22 0.41 0 1 EHI but no RHI 0.20 0.40 0.00 1.00
EHI and RHI, private 0.32 0.47 0 1 EHI and RHI, private 0.00 0.00 0.00 0.00
EHI and RHI, federal or military 0.03 0.17 0 1 EHI and RHI, federal or military 0.13 0.33 0.00 1.00
EHI and RHI, state or local 0.11 0.32 0 1 EHI and RHI, state or local 0.50 0.50 0.00 1.00
Pension wealth ($2004) 114411 199545 0 3999787 Pension wealth ($2004) 182550 219303 0 1733396
No DB coverage 0.53 0.50 0 1 No DB coverage 0.25 0.43 0.00 1.00
DB coverage - ineligible 0.15 0.35 0 1 DB coverage - ineligible 0.17 0.38 0.00 1.00
DB coverage - early 0.11 0.31 0 1 DB coverage - early 0.15 0.35 0.00 1.00
DB coverage - full 0.19 0.39 0 1 DB coverage - full 0.37 0.48 0.00 1.00
DB coverage - missing status 0.03 0.18 0 1 DB coverage - missing status 0.06 0.23 0.00 1.00
Earnings ($2004) 43463 44499 0 1589326 Earnings ($2004) 45702 27115 0 265113
Total Assets (Winsorized, $2004) 312616 529451 -71248 4629110 Total Assets (Winsorized, $2004) 282649 416330 -71248 4267032
Federal employee 0.04 0.20 0 1 Federal employee 0.19 0.40 0.00 1.00
State or local employee 0.18 0.39 0 1 State or local employee 0.80 0.40 0.00 1.00
Military employee 0.00 0.03 0 1 Military employee 0.00 0.06 0.00 1.00
Private sector with public past 0.30 0.46 0 1 Private sector with public past 0.00 0.00 0.00 0.00
Private sector 0.47 0.50 0 1 Private sector 0.00 0.00 0.00 0.00
Age 59.29 2.73 55 64 Age 59.26 2.73 55.00 64.00
Years of service 17.98 9.17 5 46.2 Years of service 18.82 8.44 5.00 42.70
Full Sample
Notes: Based on 16,516 person-wave observations for the full sample and 3,727 person-wave observations for public sector employees. All variables except
age and DB pension eligibility measured in baseline wave. HS = high school, EHI=employer health insurance, RHI=retiree health insurance, DB=defined
benefit.
Public Sector Employees

23
Table 2: Impact of Retiree Health Insurance on the Probability of Stopping Work
Ages 55-59 Ages 60-64 Ages 55-59 Ages 60-64 Ages 55-59 Ages 60-64
No EHI 0.030*** -0.012 0.036*** -0.008 0.037*** 0.000
(0.008) (0.012) (0.009) (0.013) (0.010) (0.014)
EHI and RHI, private 0.028*** 0.064*** 0.021** 0.048*** 0.016* 0.033***
(0.009) (0.013) (0.008) (0.013) (0.009) (0.013)
EHI and RHI, federal or military 0.063*** 0.045 0.057** 0.035 0.027 -0.003
(0.023) (0.030) (0.023) (0.031) (0.021) (0.028)
EHI and RHI, S/L 0.022* 0.073*** 0.026** 0.081*** 0.007 0.051***
(0.012) (0.017) (0.012) (0.018) (0.011) (0.018)
DB coverage - ineligible -0.021*** -0.036**
(0.008) (0.015)
DB coverage - early 0.018 0.056***
(0.012) (0.017)
DB coverage - full 0.077*** 0.087***
(0.013) (0.014)
DB coverage - missing status 0.015 -0.014
(0.018) (0.024)
Personal/job characteristic controls? No No Yes Yes Yes Yes
Pension controls? No No No No Yes Yes
EHI with no RHI exit rate 0.083 0.184 0.083 0.184 0.083 0.184
No DB coverage exit rate 0.072 0.156 0.072 0.156 0.072 0.156
*** p<0.01, ** p<0.05, * p<0.1
Notes: Based on 16,516 person-wave observations. Coefficients reported are marginal effects. Standard errors
clustered by household in parentheses. Personal/job characteristic controls include age dummies, gender, race
and ethnicity, education dummies, marital status, poor or fair health status, occupation and industry dummies,
income and its square, years of service and its square, total assets and its square, and indicators for number of
children. Pension controls include DB status (coverage and eligibility) and pension wealth and its square.
EHI=employer health insurance, RHI=retiree health insurance, DB=defined benefit, S/L=state and local.

24
Table 3: Impact of Retiree Health Insurance on the Probability of Stopping Work
Age 55 Age 56 Age 57 Age 58 Age 59 Age 60 Age 61 Age 62 Age 63 Age 64
No EHI 0.065*** 0.035 0.059*** 0.026 0.006 0.069*** -0.007 -0.023 -0.072** 0.029
(0.021) (0.021) (0.020) (0.020) (0.023) (0.024) (0.025) (0.032) (0.035) (0.036)
EHI and RHI, private 0.020 0.025 0.014 0.004 0.008 0.055** 0.026 0.052* -0.005 0.033
(0.019) (0.019) (0.017) (0.018) (0.022) (0.021) (0.025) (0.031) (0.034) (0.035)
EHI and RHI, federal or military 0.048 -0.017 0.048 -0.011 0.038 0.038 0.059 -0.003 -0.090 -0.040
(0.047) (0.037) (0.040) (0.037) (0.052) (0.048) (0.053) (0.072) (0.075) (0.066)
EHI and RHI, S/L 0.013 0.011 0.010 0.037 -0.041 0.027 0.072** 0.023 0.023 0.126**
(0.025) (0.026) (0.022) (0.027) (0.026) (0.028) (0.035) (0.041) (0.045) (0.050)
EHI with no RHI exit rate 0.063 0.082 0.069 0.078 0.123 0.095 0.134 0.250 0.288 0.182
*** p<0.01, ** p<0.05, * p<0.1
Notes: Based on 16,516 person-wave observations. Coefficients reported are marginal effects. Standard errors clustered by
household in parentheses. Regression also includes age dummies, gender, race and ethnicity, education dummies, marital status,
poor or fair health status, occupation and industry dummies, income and its square, years of service and its square, total assets
and its square, indicators for number of children, DB status (coverage and eligibility), and pension wealth and its square.
EHI=employer health insurance, RHI=retiree health insurance, S/L=state and local.
25
Ages 55-59 Ages 60-64
No EHI 0.063** -0.010
(0.025) (0.032)
EHI and RHI, federal or military 0.034 0.008
(0.026) (0.036)
EHI and RHI, S/L 0.008 0.053**
(0.018) (0.026)
EHI with no RHI exit rate 0.085 0.180
*** p<0.01, ** p<0.05, * p<0.1
Notes: Based on 3,727 person-wave observations.
Coefficients reported are marginal effects. Standard
errors clustered by household in parentheses.
Regression also includes age dummies, gender, race and
ethnicity, education dummies, marital status, poor or fair
health status, income and its square, years of service
and its square, total assets and its square, indicators for
number of children, DB status (coverage and eligibility),
and pension wealth and its square. EHI=employer health
insurance, RHI=retiree health insurance, S/L=state and
local.
Table 4: Impact of Retiree Health Insurance on the
Probability of Stopping Work (Public Sector)
26
Table 5: Subsidies Under the Affordable Care Act
Income Level Premium (% of Income)
Up to 133% of FPL 2
133-150% of FPL 3-4
150-200% of FPL 4-6.3
200-250% of FPL 6.3-8.05
250-300% of FPL 8.05-9.5
300-400% of FPL 9.5