Molecular dynamics of two ester hydrolases: comparison using the BioSimGrid database
Upload
dangnguyetCategory
view
212download
0
Patrícia Costinha Marques
Degree in Biochemistry
The role of PGN hydrolases in the
ability of Staphylococcus aureus to
evade the host innate immune system
Dissertation to obtain the degree of Master in Biochemistry for
Health
Orientador: Sérgio R. Filipe, Professor Auxiliar, FCT/UNL
September 2017

ii

iii
Patrícia Costinha Marques
Degree in Biochemistry
The role of PGN hydrolases in the
ability of Staphylococcus aureus to
evade the host innate immune system
Dissertation to obtain the degree of Master in Biochemistry for
Health
Orientador: Sérgio R. Filipe, Professor Auxiliar, FCT-UNL
Juri:
Presidente: Prof. Doutora Maria Teresa Nunes Mangas Catarino
Arguente: Prof. Doutor Luís Jaime Gomes Ferreira da Silva Mota
Vogal: Prof. Doutor Sergio Raposo Filipe
Faculdade de Ciências e Tecnologias – Universidade Nova de
Lisboa
September 2017

iv

v
The role of PGN hydrolases in the ability of Staphylococcus aureus to evade the host innate
immune system
Copyright Patrícia Costinha Marques, FCT/UNL, UNL
A Faculdade de Ciências e Tecnologia e a Universidade Nova de Lisboa tem direito, perpétuo e sem limites
geográficos, de arquivar e publicar esta dissertação através de exemplares impressos reproduzidos em papel
ou de forma digital, ou por qualquer outro meio conhecido ou que venha a ser inventado, e de a divulgar
através de repositórios científicos e de admitir a sua cópia e distribuição com objectivos educacionais ou
de investigacao, não comerciais, desde que seja dado crédito ao autor e editor’.

vi

vii
Acknowledgements
Ao Professor Sérgio Filipe, deixo um grande obrigado por todo apoio e disponibilidade ao
longo deste ultimo ano; pela oportunidade de trabalhar no seu laboratório, pelos concelhos,
desafios e orientação essenciais para o desenvolvimento deste projeto.
Ao Gonçalo Covas, agradeço por toda a orientação e paciência, por apesar da distância ou
do trabalho inesgotável, fazer todos os possíveis para nos ajudar.
A Ana Rita Narciso e a Joana Figueiredo agradeço toda a ajuda e orientação no laboratório.
Ao pessoal dos laboratórios MGPI e MGPII, no ITQB, agradeço pelo acolhimento caloroso nos
laboratórios e por todo o conhecimento transmitido.
Ao pessoal do laboratório 333, deixo um grande obrigado pela eterna amabilidade com que
nos receberam e por todo o tempo disponibilizado, que tanto nos ajudou quando mais
precisávamos. Ao pessoal do laboratório 349, agradeço por todo o apoio e auxílio.
Aos meus colegas que me acompanharam durante todo o ano: António Lopez, Liliane
Raposo, Rúben Silva, Lígia Martins, Bruno Guerreiro e Diana Silva. Pelas cantigas e noites ao
luar, pela amizade inegável, pelo humor e companhia; deixo-vos um grande obrigado pelas
memórias e palavras que nunca vou esquecer.
Devo um enorme obrigado (e chocolate) a Jéssica Gomes, a minha parceira do crime, porque
esta viagem nunca teria sido a mesma sem a tua presença e humor. Por todo o conhecimento e
ajuda que me deste, pela eterna paciência para me explicar todas as minhas dúvidas, por mais
elementares que fossem; pela confiança e pelo respeito; e claro, por toda a amizade que me deste.
Girl, you know what to do: Go Forth and Conquer!
Aos meus amigos: começo pela Joana Coelho, sempre amável e de braços abertos, pelas
conversas no carro, pelos concelhos, por me ouvir e principalmente, pelo sorriso e carinho, devo-
te um eterno obrigado e desejo-te o mundo de oportunidades.
Ao pessoal do “D&D”, Marco Galvão, Reinaldo Muralha e Diogo Filipe, devo-vos um
grandessíssimo obrigado, pelas sessões de sábado à tarde, pelas noites de jogo, pelos copos no
café, e por toda a amizade e carinho que me entregaram sem rodeios.
A Rafael Fernandes, devo-te muito mais que um obrigado. Por seres uma presença irrefutável
que me amparou durante todos estes anos, sem nunca me deixar cair. Por partilhares o teu génio
e mestria comigo, e pelo porto de abrigo a que posso sempre voltar. For the thousands of worlds
that we have built, and the thousands more that shall be created.

viii
To Bart Selie, I can only thank you with my heart, for all the care and endless support you
offered me. For all your devotion, friendship and love that you delivered so selflessly, I will be
forever grateful.
À minha família, quero deixar um enorme obrigado, pelo apoio constante, pelos jantares
caóticos e espalhafatosos que tanto aquecem o coração, pelas palavras de coragem e de ânimo
que oferecem de sorriso rasgado.
E finalmente, aos meus pais, a quem devo o mundo. Pelo amor incondicional e por nunca
me deixarem cair; pela confiança, ajuda e sabedoria. Agradeço-vos o mundo que me entregaram,
e por nunca desistirem de mim.
Visions of warm sunlight
The songs we wrote on old days
With laughter spreading far and wide
We are children dreaming awake
-Raphael and the Thornes

ix
Resumo
Staphylococcus aureus é um microorganismo importante que pode ser encontrado na pele
e membranas mucosas do corpo humano. Apesar da habilidade de colonizar o hospedeiro humano,
a invasão deste patogénico para os tecidos pode originar severas condições de saúde. À medida
que antibióticos actuais perdem eficiência contra este patogénico, torna-se urgente o
desenvolvimento de novas estratégias de tratamento.
Peptidoglicano está presente em bactérias gram-negativas e gram-positivas, como uma
molécula fundamental para a estrutura celular. Trata-se também de uma molécula que denuncia a
presença da bactéria quando reconhecida por recetores inatos ao hospedeiro como proteínas
PGRP.
De modo a evitar deteção, S.aureus desenvolveu estratégias para evadir o reconhecimento
de PGN na superfície. Foi demonstrado que Atl (Atilano et al.), uma autolisina principal de
S.aureus, é capaz de aparar os fragmentos mais externos de peptidoglicano de modo a impedir a
ligação de PGRPs.
Este projecto foca-se no estudo da proteína SAOUHSC_00671 da estirpe S.aureus NCTC
8325-4, semelhante à Sle1, uma hidrolase capaz de aparar os fragmentos de PGN na divisão do
septo da bactéria. Neste projeto focou-se à purificação da proteína SAOUHSC_00671 e à
construção de mutantes knock-out de S.aureus, que carecem da sequencia codificante para
SAOUHSC_00671.
Termos-chave: Staphylococcus aureus, peptidoglicano, autolisinas, Sle1, SAOUHSC_00671

x

xi
Abstract
Staphylococcus aureus is an important microorganism that can be found on the skin and
mucous membranes of the human body. Despite its ability to colonize the human host, invasion
of this pathogen into the host tissue can lead to severe health conditions. As current antibiotics
become less effective in the combat to this pathogen, it becomes urgent to develop new strategies
of treatment.
Peptidoglycan is present in gram-negative and gram-positive bacteria alike, as a
fundamental molecule for cell structure. It is a telltale molecule that betrays the presence of the
bacteria when recognized by host innate immune receptors such as the PGRP proteins.
In order to avoid detection, S. aureus uses different strategies to circumvent recognition
of the PGN at its surface. It has been shown that Atl, a major autolysin of S. aureus, is able to trim
the outermost fragments of peptidoglycan in order to prevent the binding of PGRPs.
This project focused in studying the protein SAOUHSC_00671 from S. aureus NCTC
8324-5 strain, which belongs to the same protein family as SleI, a PGN hydrolase capable of
trimming PGN fragments at the staphylococcal division septum. This project aimed purify the
SAOUHSC_00671 protein and construct knock-out S. aureus mutants, which lack the coding
sequence for SAOUHSC_00671.
Keywords: Staphylococcus aureus, peptidoglycan, autolysins, Sle1, SAOUHSC_00671.

xii

xiii
Index
Acknowledgements ................................................................................................................... vii
Resumo ...................................................................................................................................... ix
Abstract ...................................................................................................................................... xi
Index ........................................................................................................................................ xiii
Index of Figures ......................................................................................................................... xv
Index of Tables........................................................................................................................ xvii
Abbreviations ............................................................................................................................xix
1 Introduction ..........................................................................................................................1
1.1 Staphylococcus aureus ..................................................................................................1
1.2 Peptidoglycan and PGRPs ............................................................................................2
1.3 PGN Hydrolases ...........................................................................................................3
1.4 S.aureus NCTC 8325-4 SAOUHSC_00671 .................................................................4
2 Materials and Equipment ......................................................................................................5
3 Procedures and Protocols .....................................................................................................7
3.1 E.coli competent cells ...................................................................................................7
3.2 S.aureus genomic DNA extraction ...............................................................................8
3.3 Amplification of gene 671 ............................................................................................8
3.4 Construction of pET21a vector for protein expression .................................................9
3.5 E.coli transformation .................................................................................................. 12
3.6 Colony Screening PCR ............................................................................................... 12
3.7 E.coli BL21(DE3) induction test ................................................................................ 13
3.8 SDS-PAGE Gel Electrophoresis ................................................................................. 14
3.9 Sanger Sequencing ..................................................................................................... 15
3.10 S.aureus competent cells............................................................................................. 15
3.11 Purification of Up and Down regions of gene 671...................................................... 16
3.12 Construction of pMAD vector for gene excision ........................................................ 18
3.13 S.aureus electroporation ............................................................................................. 20
3.14 Transduction protocol ................................................................................................. 20
3.15 Gene knock-out protocol ............................................................................................ 22
3.16 S.aureus genomic DNA extraction for PCR screening. .............................................. 23
3.17 PCR screening for gene knock-out confirmation ........................................................ 23
4 Results and Discussion ....................................................................................................... 27
4.1 Construction of pET21a-671 I .................................................................................... 27
4.2 Acquiring pET21a-671 I positive colonies. ................................................................ 29
4.3 Induction test of pET21a-671 I ................................................................................... 32

xiv
4.4 Sequencing of pET21a-671 I ...................................................................................... 33
4.5 Construction of pET21a-671 II ................................................................................... 34
4.6 Acquiring pET21a-671 II positive colonies ................................................................ 34
4.7 Induction test of pET21a-671 II A and B ................................................................... 36
4.8 Sequencing of samples pET21a-671 II A and B ......................................................... 39
4.9 Additional inductions of pET21a-671 II A ................................................................. 39
4.10 Acquiring positives of pMAD del 671........................................................................ 42
4.11 Sequencing of pMAD del 671 .................................................................................... 44
4.12 Integration of pMAD del 671 in NCTC 8325-4 genome ............................................ 44
4.13 Excision of pMAD del 671 ......................................................................................... 45
5 Conclusion ......................................................................................................................... 47
6 References .......................................................................................................................... 48
Anexes ....................................................................................................................................... 50

xv
Index of Figures
Figure 1.1 Prevalence of methicillin-resistant Staphylococcus aureus among patients with
bacteremia in Europe in 2007, as reported by the European Antimicrobial Resistance
Surveillance System(5). AT, Austria; BE, Belgium; BG, Bulgaria; CY, Cyprus; CZ, Czech
Republic; DE, Germany; DK, Denmark; EE, Estonia; ES, Spain; FI, Finland; FR, France; GR,
Greece; HR, Croatia; HU, Hungary; IE, Ireland; IL, Israel; IS, Iceland; IT, Italy; LT, Lithuania;
LU, Luxembourg; LV, Latvia; MT, Malta; NL, The Netherlands; NO, Norway; PL, Poland; PT,
Portugal; RO, Romania; SE, Sweden; SI, Slovenia; TR, Turkey; UK, United Kingdom. ............1
Figure 1.2: The structure of S. aureus peptidoglycan (11). The arrows indicate the cleavage
sites: 1 N-acetyl muramidase, 2 N-acetyl-β-D-glucosaminidase, 3 Nacetylmuramoyl-L-alanine
amidase, 4 L-alanoyl-D-glutamate endopeptídases and 5 interpeptide bridge endopeptidases
(e.g., lysostaphin). Abbreviations: GlcNAc N-acetylglucosamine, MurNAc N-acetylmuramic
acid ...............................................................................................................................................3 Figure 4.1: Amplification of gene 671. Expected length of amplified fragment is
approximately 850bp. 1 to 8- Amplified 671 insert. 9- control. ................................................. 27 Figure 4.2: Plasmid pET21a digested with restriction enzymes XbaI, EagI and NheI. 1-
Plasmid pET21a. 2- pET21a digested with XbaI. 3- pET21a digested with EagI. 4- pET21a
digested with NheI. 5- pET21a digested with XbaI and EagI. .................................................... 28 Figure 4.3: Cloning PCR of pET21a-671 I plasmid. Expected length of the amplified 671
insert is of 850bp, which verifies a successful insertion. 1- PCR product of pET21a-671 I. 2-
PCR product of auto-ligated pET21a. 3- PCR product of pET21a digested with XbaI and EagI.
4- pET21a digested with XbaI and EagI. 5- pET21a digested with Xbal. 6- PCR product of
pET21a. 7- pET21a. 8- Control. ................................................................................................. 29 Figure 4.4: Screening PCR for pET21a-671 I positives. 1 to 11- Amplification from
transformed Dh5α with pET21a-671 I. 12- Amplification from transformed Dh5α with auto-
ligated pET21a. 13- DNA ladder 14- Amplification from pET21a-671 I (positive control). 15-
Amplification from auto-ligated pET21a (negative control). 16- Amplification from pET21a
digested with XbaI and EagI. 17- Amplification from pET21a digested with XbaI. 18-
Amplification from pET21a. ...................................................................................................... 29 Figure 4.5: Restriction sites of NaeI in plasmid pET21a-671 I. ............................................ 30 Figure 4.6: Digestive profile of pET21a-671 I by NaeI. Digestion with NaeI enzyme will
result in three fragments for both pET21a-671 I and pET21a. The size difference in the smallest
fragment attests for a positive insertion of gene 671. 1- pET21a non-digested. 2- Digested
pET21a. 3- pET21a-671 I non-digested. 4- Digested pET21a-671 I. ......................................... 31 Figure 4.7: Optical density measurements along time of induction. 671+: culture induced
with 1mM IPTG. 671-: culture not induced (control) ................................................................. 32
Figure 4.8:SDS/PAGE gel of pET21a-671 I protein induction test. T0: time 0 of induction.
T3+: time 3-hour induced. T3-: time 3-hour non-induced. TON+: time overnight induced. TON-
: time overnight non-induced. .................................................................................................... 33 Figure 4.9:Sequencing of pET21a-671 I. A- Segment of sequencing traces assembled by
SeqMan software from Lasergene’s DNAStar and provided by STABvida laboratories. B:
Segment of in-silico sequence depicting the deleted nucleotides. .............................................. 33 Figure 4.10: Cloning PCR of pET21a-671 II plasmid. Expected size of amplified fragment is
approximately 850 bp, which verifies a proper insertion of gene 671. 1- PCR product of
pET21a-671 II 10μL. 2- PCR product of pET21a-671 II 7μL. 3- PCR product of pET21a-671 II
5μL. 4- PCR product of auto-ligated pET21a. 5- PCR product of pET21a digested with NheI
and EagI. 6- PCR product of pET21a. 7- Control. ...................................................................... 34 Figure 4.11: Colony Screening PCR of pET21a-671 II. 1 to 23- Amplification from
transformed Dh5α with pET21a-671 II. 24- Amplification from transformed Dh5α with auto-

xvi
ligated pET21a. 25- DNA Ladder. 26- Amplification from pET21a-671 II 10μL (positive
control). 27- Amplification from pET21a-671 II 7μL (positive control) 28- Amplification from
auto-ligated pET21a (negative control). 29- Amplification from pET21a. ................................. 35 Figure 4.12 Digestive profile of pET21a-671 II by NaeI. 1- pET21a non-digested. 2- Digested
pET21a. 3- pET21a-671 II A non-digested. 4- Digested pET21a-671 II A. 5- pET21a-671 II B
non-digested. 6- Digested pET21a-671 II B. .............................................................................. 36 Figure 4.13: SDS/PAGE gel of pET21a-671 II A protein induction test. 1- Time 0:00. 2-
Time 0:30 non-induced. 3- Time 0:30 induced. 4- Time 1:00 non-induced. 5- Time 1:00
induced. 6- Time 1:30 induced. 7- Time 1:30 non-induced. 8- Time 2:00 non-induced. 9- Time
2:00 induced. 10- Time 2:30 non-induced. 11- Time 2:30 induced. 12- Time 3:00 non-induced.
13- Time 3:00 induced. 14- Time ON non-induced. 15- Time ON induced. .............................. 37 Figure 4.14 Optical density measurements along time of induction. 671+: culture induced
with 1mM IPTG. 671-: culture not induced (control) ................................................................. 37
Figure 4.15: SDS/PAGE gel of pET21a-671 II B protein induction test. 1- T 0:00. 2- T 0:30
non-induced. 3- T 0:30 induced. 4- T 1:00 non-induced. 5- T 1:00 induced. 6- T 1:30 non-
induced. 7- T 1:30 induced. 8- T 2:00 non-induced. 9- T 2:00 induced. 10- T 2:30 non-induced.
11- T 2:30 induced. 12- T 3:00 non-induced. 13- T 3:00 induced. 14- T ON non-induced. 15- T
ON induced. ............................................................................................................................... 38 Figure 4.16: Optical density measurements along time of induction. 671+: culture induced
with 1mM IPTG. 671-: culture not induced (control). ................................................................ 38 Figure 4.17: SDS/PAGE gel of protein 671 induction. 1- Time 0 pET21a-671 II A. 2- Time 0
pET21a-671 II B. 3- Time 0 pET21a-671 I. 4- Time 0 pET21a. 5- Time 3 hours pET21a-671 II
A non-induced. 6- Time 3 hours pET21a-671 II A induced. 7- Time 3 hours pET21a-671 II B
non-induced. 8- Time 3 hours pET21a-671 II B induced. 9- Time 3 hours pET21a-671 I non-
induced. 10- Time 3 hours pET21a-671 I induced. 11- Time 3 hours pET21a non-induced. 12-
Time 3 hours pET21a induced. .................................................................................................. 39 Figure 4.18: Colony Screening PCR of pET21a-671 II A. 1 to 8- Amplification from
transformed BL21(DE3) with pET21a-671 II A. 9- Amplification from pET21a-671 II 10μL
(positive control). 10- Control .................................................................................................... 40
Figure 4.19: SDS/PAGE gel of pET21a-671 II A induction. 1- Time 0 hour Colony 1. 2-
Time 3 hours induced Colony 1. 3- Time 3 hours non-induced Colony 1. 4- Time 0 hour Colony
2. 5- Time 3 hours induced Colony 2. 6- Time 3 hours non-induced Colony 2. 7- Time 0 hours
Colony 3. 8- Time 3 hours induced Colony 3. 9- Time 3 hours non-induced Colony 3. ............ 41
Figure 4.20: Colony Screening PCR of pMAD del 671. 1 to 13- Amplification from
transformed DC10b with pMAD del 671. 14 DNA Ladder 15- Amplification from pMAD del
671 (positive control). 16- Amplification from auto-ligated pMAD. 17- Amplification from
pMAD digested with BamHI. 18- Amplification from pMAD digested with EcoRI. 19-
Amplification from pMAD del Sle1. 20- Amplification from pMAD. 21- Control.................... 42 Figure 4.21: Digestive Profile of pMAD del 671 by AvaI. 1- pMAD non-digested. 2- Digested
pMAD. 3- pMAD del 671 non-digested. 4- Digested pMAD del 671. 5- pMAD del 671 B non-
digested. 6- Digested pMAD del 671 B...................................................................................... 43
Figure 4.22: Integration Screening of pMAD del 671. 1- amplification pair negative
integration. 2- amplification pair positive for Up-region integration. 3- amplification pair with
mixed colonies. 4- amplification pair positive for Down-region integration. ............................. 45 Figure 4.23: PCR screening of NCTC Δ671. 1- amplification from screened sample A. 2-
amplification from screened sample B. 3- amplification from screened sample C. 4-
amplification from pMAD del 671. 5- amplification from NCTC 8325-4 wildtype. 6-
amplification from pMAD. 7- control. ...................................................................................... 46

xvii
Index of Tables
Table 3.1: Constitution of solutions RF1 and RF2…………………………........…………………....7
Table 3.2: Content of Master Mix solution for 671 amplification……………………………….8
Table 3.3: PCR conditions for 671 amplification. Number of cycles (a cycle comprising the
steps of Denaturation, Annealing and Extension) was of 30…………………………………….9
Table 3.4: Content of Master Mix solution for pET21a-671 I verification………………….….10
Table 3.5: PCR conditions for pET21a-671 I verification. Number of cycles (a cycle comprising
the steps of Denaturation, Annealing and Extension) was of 30…………………………….….10
Table 3.6: Content of Master Mix solution for pET21a-671 II verification…………………....11
Table 3.7: PCR conditions for pET21a-671 II verification. Number of cycles (a cycle
comprising the steps of Denaturation, Annealing and Extension) was of 30…………………...12
Table 3.8: Contents of Master Mix solution for Colony Screening PCR of E.coli colonies……13
Table 3.9: PCR conditions for Colony Screening PCR for E.coli colonies. Number of cycles (a
cycle comprising the steps of Denaturation, Annealing and Extension) was of 30…………….13
Table 3.10: Preparation of the Resolution Gel with 12,5% of Acrylamide…………………….14
Table 3.11: Preparation of the Stacking Gel with 4% Acrylamide……………………………..14
Table 3.12: Preparation of SDS/Page Protein Loading Buffer 5x. Sample stored at -20ºC…….15
Table 3.13: Forward and reverse primers for amplification of fragments Up and Down …….16
Table 3.14: Contents of Master Mix solution for Up and Down fragments amplification……..16
Table 3.15: PCR conditions for Up and Down cloning PCR. Number of cycles (a cycle
comprising the steps of Denaturation, Annealing and Extension) was of 30…………………...17
Table 3.16: Contents of Master Mix solution for overlapping PCR of Up and Down
fragments…………………………………………………………………………………..........17
Table 3.17: PCR conditions for Overlapping PCR of Up and Down regions. Number of cycles
(a cycle comprising the steps of Denaturation, Annealing and Extension) was of 30………….18
Table 3.18: Contents of Master Mix solution for pMAD del 671 verification…………………19
Table 3.19: PCR conditions for pMAD del 671 verification. Number of cycles (a cycle
comprising the steps of Denaturation, Annealing and Extension) was of 30…………………...19
Table 3.20: Preparation of 0,3GL Top and Bottom Agar. Medium was autoclaved at 120ºC for
40 minutes………………………………………………………………………………………20
Table 3.21: Preparation of Phage Top and Bottom Agar. Medium was autoclaved at 120ºC for
20 minutes……………………………………………………………………………………....20
Table 3.22: Preparation of Phage Buffer. Solution as sterilized with 0,22 μm filter…………..21
Table 3.23: Transduction mixtures prepared……………………………………………………22
Table 3.24: Contents of Master Mix solution for integration screening PCR…………………..24

xviii
Table 3.25: PCR conditions for integration screening PCR. Number of cycles (a cycle
comprising the steps of Denaturation, Annealing and Extension) was of 30……………...……24
Table 3.26: Contents of Master Mix solution excision verification PCR…………………..…..25
Table 3.27: PCR conditions for excision verification PCR. Number of cycles (a cycle
comprising the steps of Denaturation, Annealing and Extension) was of 30…………………...25
Table 4.1: Size comparison of DNA fragments produced by NaeI digestion…………………..31
Table 4.2: Size comparison (in bp) of DNA fragments produced by NaeI digestion…………..35
Table 4.3: Size comparison (in bp) of DNA fragments produced by AvaI digestion…………..43
Table 4.4: pMAD del 671 integration according to each set of primer…………………………44

xix
Abbreviations o APS – Ammonium persulfate
o BSI – Bloodstream Infections
o CFU – Colony Forming Units
o ddH2O – Bi-distilled water
o DNA – Deoxyribonucleic Acid
o dNTPs – Deoxyribonucleotides
o EDTA – Ethylenediamine tetra-acetic acid
o Fw - Foward
o g – Grams
o IE – Infective Endocarditis
o L - Liters
o LA – Luria-Bertani Agar
o LB – Luria-Bertani Broth
o M – Molar
o MCS – Multi Cloning Site
o mg – Milligrams
o mL – Milliliters
o MRSA – Methicillin-resistant Staphylococcus aureus
o nm – Nanometers
o OD – Over day
o OD600 – Optical Density at 600nm wavelength
o ON – Overnight
o PBP – Penicillin binding proteins
o PCR – Polymerase Chain Reaction
o PGRP – Peptidoglycan receptor proteins
o RPM – Rotations per minute
o RT – Room Temperature
o Rv - Reverse
o SA – Staphylococcus aureus
o SDS – Sodium Dodecyl Sulfate
o SDS/PAGE LB – Protein Loading Buffer
o ST – Sterile
o TAE – Tris- Acetate - EDTA
o TE – Tris-EDTA
o TSA – Tryptic Soy Agar
o TSB – Tryptic Soy Broth

xx
o w/v – weight per volume
o WT – Wild type
o X-gal – 5-bromo-4-3-indolyl-β-D-galactopyranoside
o μg – Micrograms
o μL – Microliters

1
1 Introduction
1.1 Staphylococcus aureus
Staphylococcus bacteria are gram-positive cocci that are commonly found in the form
irregular grape-like clusters. These organisms are widespread in nature, more specifically in the
skin and mucous membranes, such as the mouth, mammary glands and intestinal, genitourinary,
and upper respiratory tracts of mammals and birds (1). The relationship established between the
bacteria and the host is generally symbiotic, however, infiltration onto the host tissue can lead to
severe health conditions such as skin infections, Bloodstream Infections (BSI) (2) and infective
endocarditis (3).
The major incidence of Staphylococcus aureus related infections is in medical facilities
(4). Yilmaz et al. estimated that 42.1% of a series of 255 diagnosed cases of Staphylococcus
aureus Bacteremia (SAB), were originated from vascular catheters and other surgical site
infections. Healthcare associated SAB was defined in 55.7%.
Figure 1.1 Prevalence of methicillin-resistant Staphylococcus aureus among patients with bacteremia in
Europe in 2007, as reported by the European Antimicrobial Resistance Surveillance System(5). AT,
Austria; BE, Belgium; BG, Bulgaria; CY, Cyprus; CZ, Czech Republic; DE, Germany; DK, Denmark; EE,
Estonia; ES, Spain; FI, Finland; FR, France; GR, Greece; HR, Croatia; HU, Hungary; IE, Ireland; IL, Israel;
IS, Iceland; IT, Italy; LT, Lithuania; LU, Luxembourg; LV, Latvia; MT, Malta; NL, The Netherlands; NO,
Norway; PL, Poland; PT, Portugal; RO, Romania; SE, Sweden; SI, Slovenia; TR, Turkey; UK, United
Kingdom.
There is an increasing difficulty in treating these infections due to the acquired resistance of
these organisms to antimicrobial drugs (6,7). Klein et al. (4) estimated that the number of S.aureus
infections resistant to methicillin increased 119% in north-American hospital facilities from 1999
to 2005. Reports from the European Antimicrobial Resistance Surveillance System stated an

2
increase of the annual rate of found Methicilin Resistant S.aureus (MRSA) isolates, in European
countries during 1999-2006 (8).
S.aureus are majorly treated with administration of β-lactam antibiotics. These molecules
bind to the native penicillin-binding proteins (PBPs) present in the cell wall interrupting the
synthesis of peptidoglycan layer (9). In methicillin-resistant strains, the gene mecA codifies for an
additional, foreign, penicillin-binding protein (PBP2a) that prevents the binding of β-lactams and
ensures the peptidoglycan synthesis is not disrupted (10). Furthermore, MRSA tend to accumulate
and develop resistances to other antibiotics (9,10).
1.2 Peptidoglycan and PGRPs
Peptidoglycan is the principal component of bacterial cell wall and is composed of long
glycan chain made up of alternating amino sugars N-acetylglucosamine and N-acetylmuramic
acid, and cross-linked by short peptides of variable length and composition (11).
In gram-positive bacteria, this peptidoglycan is covered by a series of different molecules,
such as surface proteins, capsular polysaccharides (12) and wall-teichoic acids (13) (phosphate-rich
glycopolymers involved in resistance to environments stress and regulation of bacterial division)
This peptidoglycan, however, can be recognized by peptidoglycan recognition proteins
(PGRP), innate immunity molecules, as a pathogen-associated molecular pattern, or PAMP, and
trigger inflammatory response against the bacterial pathogen (14).
Insects possess two response pathways able to discern between gram-positive and gram-
negative bacteria (toll pathway for gram-positive bacteria, and Immune Deficiency pathway for
gram-negative bacteria). When stimulation of these two pathways occurs, there are activated a
series of responses, such as transcriptional regulators, antimicrobial peptides and signaling
cascades, specific to each pathway (15).
In mammals, PGRPs can act as antibacterial agents due to their bactericidal and/or
bacteriostatic activity, that is mediated by PGN hydrolytic activity (16), or by the binding of PGRPs
to targets on the bacterial cell surface, which causes the activation of specific bacterial two-
component systems (17).
How peptidoglycan is accessed by PGRPs is not yet fully known. PGN in gram-positive
bacteria is concealed by layers of proteins and glycopolymers. Additionally, Atilano et al. (18)
demonstrated that wall-teichoic acids play a vital role in limiting the access of Drosophila PGRP
to bacterial peptidoglycan. It is therefore, inferred that bacteria may have developed strategies of
evading the hosts PGRPs systems.

3
1.3 PGN Hydrolases
Bacteria organisms possess a variety of enzymes capable of cleaving bonds in polymeric
peptidoglycan. These are known as hydrolases. They play vital role in regulating cell wall growth
as well as other lysis phenomena. It has been documented the participation of PGN hydrolases in
the release of turnover products from E.coli peptidoglycan during cell growth (19).
PGN hydrolases have different cleavage sites. N.Acetylmuramyl-L-alanine amidases disrupt
the bond between MurNAc and N-terminal L-Alanine, thus separating the glycan strand from the
peptide (20). Carboxy- and endopeptidases hydrolyse amide bonds between amino acids. N-Acetyl-
β-D-muramidades (or N-acetylmuramidases) cleave the bond β1,4-glycosidic between residues
MurNAc and GlcNAc of peptidoglycan (20). This can occur in two different ways: hydrolysis of
the glycosidic bond by lysozymes results in terminal reducing MurNAc residue, whereas lytic
transglycosylases enacts a transglycosylation reaction that forms a 1,6-anhydro ring at the
MurNAc residue (20).
Figure 1.2: The structure of S. aureus peptidoglycan (11). The arrows indicate the cleavage sites: 1 N-
acetyl muramidase, 2 N-acetyl-β-D-glucosaminidase, 3 Nacetylmuramoyl-L-alanine amidase, 4 L-alanoyl-
D-glutamate endopeptídases and 5 interpeptide bridge endopeptidases (e.g., lysostaphin). Abbreviations:
GlcNAc N-acetylglucosamine, MurNAc N-acetylmuramic acid
The major autolysin of S.aureus is AtlA, composed of an amidase domain and a
glucosaminidase domain that, upon proteolytic cleavage, yield two active proteins: amidase (AM)
and glucosaminidase (GL) (21). The role of this protein is essentially in cell division regulation but
it has been documented the participation of AtlA in biofilm formation.
Additionally, Atilano et al. (22) has identified Atl as an essential protein in the concealment
of bacterial PGN at the cell surface from host detection. In this study is shown that an autolysin-
mediated “trimming” of PGN at cell surface, in which Atl partakes, renders the bacteria

4
inaccessible to host PGN receptors. As such, targeting bacterial autolysins to prevent their activity
may constitute a new strategy against these pathogens.
The hydrolase Sle1 (also known as Aaa) has also been characterized (23,24). Kajimura et al. (23)
demonstrated this protein as a N-acetylmuramyl-L-alanine amidase and assessed its crucial role
in the process of cell separation. Parallel to this study, Heilmann et al. (24) deduced the sequence
of Sle1 from homologous DNA sequences from S.aureus strain Col, which revealed three
identical domains highly homologous to the lysin motif (LysM) followed by a Chap domain in
the C-terminal of the protein. Lysin motifs and Chap domains are often found in cell wall
enzymes. (25,26,27)
1.3.1 S.aureus NCTC 8325-4 SAOUHSC_00671 Screening of the genome of S.aureus strain NCTC 8325-4 for similar proteins to Sle1,
revealed two putative autolytic proteins: SAOUHSC_00671 and SAOUHSC_00773. The former
revealed in its structure two LysM domains followed by a Chap domain, while the latter presented
one LysM domain and a Chap domain.
The focus of this project will consist in the purification of the putative protein codified by
SAOUHSC_00671 (abbreviated as gene 671 for this document) and the acquisition of knock-out
mutants NCTC 8325-4 Δ671 via pMAD vector.

5
2 Materials and Equipment
All S.aureus and E.coli strains were provided from the research laboratory that hosted the
student.
Cloning vector pET21a was chosen for the construction of the protein expression mutant
for E.coli BL21(DE3). Gene 671 was cloned to the Multi Cloning Site (MCS) with primers
NCTC671ClonFwXbaI (forward) and NCTC671ClonRvEagI (reverse), built in-silico with
Lasergene’s DNAStar software, SeqBuilder. Vector plasmid pET21a was provided from
Novagen.
Shuttle vector pMAD (Arnaud et al., 2004) selected for the construction of the Δ671
mutants for S.aureus NCTC 8325-4. Regions 1000bp Up and 1000bp Down of gene 671 were
cloned into the MCS.
All mutants and vectors in-silico sequences were built with Lasergene’s DNAStar
software, SeqBuilder, as well as the necessary primers. DNA template sequence of S.aureus
NCTC 8325-4 was downloaded from National Center for Biotechnology Information (NCBI).
All restriction enzymes and their respective buffers were provided by New England
Biolabs.
o 1kb plus DNA ladder (Thermo Scientific)
o 1kb GeneRuler DNA Ladder (Thermo Scientific, catalog number: SM0312
o 1 μl Loops (Sarstedt AG, catalog number: 86.1567.010 )
o 25 ml Glass (or plastic disposable) Pipettes (Normax, catalog number: 4.5434334 )
o 30% Acrylamide/Bis Solution (Bio-Rad Laboratories, catalog number: 161-0158 )
o 50 ml Falcon tubes (Sarstedt AG, catalog number: 62.548.004 )
o Ammonium persulfate (APS) [(NH4)2S2O8] (Sigma-Aldrich, catalog number:
A3678 )
o Bromophenol Blue sodium salt (Sigma-Aldrich, catalog number: B8026 )
o Calcium chloride dihydrate (CaCl2.2H2O) (Sigma-Aldrich, catalog number: C3306
)
o Clean Up Kit: Wizard SV Gel and PCR Clean-Up System (Promega Corporation,
catalog number: A9285)
o DreamTaq Hot Start DNA Polymerase (Thermo Scientific, catalog number:
EP1701)
o Ethanol (Merck Millipore Corporation, catalog number: 1.02371.1000 )
o Glycerol (Sigma-Aldrich, catalog number: G8898 )

6
o Hydrochloric acid (Merck Millipore Corporation, catalog number: 1.01834.2500 )
o Luria Agar (Miller`s LB agar) (LA) (VWR, catalog number: 84684.0500 )
o Luria Broth (Miller`s LB broth) (LB) (Sigma-Aldrich, catalog number: L3022 )
o Lysostaphin (Sigma-Aldrich, catalog number: L7386)
o Magnesium chloride hexahydrate (Sigma-Aldrich, catalog number: M9272 )
o Methylene Blue hydrate (Sigma-Aldrich, catalog number: 66720 )
o Miniprep Kit: Wizard Plus SV Minipreps DNA Purification Systems (Promega
Corporation, catalog number: A1465)
o Mini-PROTEAN® Comb, 10-well, 0.75 mm (Bio-Rad Laboratories, catalog
number: 165-3354 )
o N, N, N′, N′-Tetramethylethylenediamine (TEMED) (Sigma-Aldrich, catalog
number: T9281 )
o Nuclei Lysis Solution (Promega, catalog number: A7941)
o Petri dishes (Sarstedt AG, catalog number: 82.1473 )
o Phusion High-Fidelity PCR Master Mix with HF buffer (Thermo Scientific, catalog
number: F531S)
o Potassium hydroxide (KOH) (Sigma-Aldrich ,catalog number: P5958 )
o Precision Plus ProteinTM Dual Color Standards (PPPS) (Bio-Rad Laboratories,
catalog number: 1610374 )
o Protein Precipitation Solution (Promega, catalog number: A7953)
o Rubidium Chloride, RbCl (Sigma-Aldrich, catalog number: 7791-11-9)
o Sodium chloride (Merck Millipore Corporation, catalog number: 1.06444.1000 )
o Sodium Dodecyl Sulfate (Sigma-Aldrich, catalog number: L5750 )
o Spacer Plates with 0.75 mm Integrated Spacers (Bio-Rad Laboratories, catalog
number: 165-3310 )
o Tris (Trizma® base) (Sigma-Aldrich, catalog number: T1503 )
o Triton X-100 (Sigma-Aldrich, catalog number: T8787 )
o Tryptic Soy Agar plates (TSA) (VWR, catalog number: 84602.0500 )
o Tryptic Soy Broth (TSB) (BD, Bacto, catalog number: 211825 )

7
3 Procedures and Protocols
3.1 E.coli competent cells
For the preparation of E.coli Dh5α, DC10b and BL21(DE3) competent cells was prepared
the following solutions.
Table 3.1: Constitution of solutions RF1 and RF2.
RF1 Total Volume
200mL RF2
Total Volume
60mL
RbCl 2,4 g RbCl 0,072g
MnCl2. 4 H2O 1,98g CaCl2 . 2 H2O 0,66g
CaCl2 . 2 H2O 0,30g Glicerol 9g
Glycerol 30g MOPS 0,5M pH
6,8 1,2 mL
KAc 1M pH 7,5 6 mL
The pH of solutions RF1 and RF2 was corrected to 5,8 and 6,8, respectively and sterilized
with a 0,22 μm filter. Solutions were stored at 4ºC until used.
E.coli strains Dh5α, DC10b and BL21(DE3) were inoculated in 5mL of LB medium and
grown overnight at 37ºC with shaking.
The following day, 100μL of each overnight culture was retrieved and added to 100mL
of LB medium. Cultures were incubated at 37ºC with shaking and grown until OD600= 0,35 –
0,45. Upon reaching recommended OD, cultures were put on ice for 15 minutes. Samples were
then transferred to falcon tubes of 50 mL and centrifuged at 4 ºC for 15 minutes at 3500 rpm.
Supernatant of centrifuged samples was discarded and each pellet was re-suspended in
15mL of RF1 solution. Falcons were placed on ice for 15 minutes and then centrifuged at 4ºC for
15 minutes at 3500 rpm. Supernatants were discarded and each pellet was re-suspended in 4mL
of RF2 solution. Samples were placed on ice for 15 minutes.
800μL of glycerol 50% was added and the resulting solution was distributed into aliquots
of 200μL each. Samples were stored at -80 ºC.

8
3.2 S.aureus genomic DNA extraction
S. aureus strain NCTC 8325-4 was plated in plates of TSA and grown overnight at 37 ºC.
Confluent growth was scrapped from overnight plates with the help of 10μL loops, and
re-suspended in 50μL of EDTA pH 8. It was then added 1μL of Lysostaphin (10mg/mL) and 1μL
of RNase (10mg/mL). Mixture was incubated at 37ºC for 30 minutes.
After incubation, it was added 200μL of 50mM EDTA followed by 250μL of Nuclei Lysis
Solution. Mixture was incubated at 80ºC for 5 minutes and then cooled at room temperature.
It was then added 100μL of Protein Precipitation Solution to the solutions and vortex for
20 seconds. Samples were put on ice for 10 minutes and then centrifuged at top speed, for 20
minutes, at room temperature.
Resulting supernatant was transferred to a clean Eppendorf and added 420μL of
Isopropanol. Samples were centrifuged again at top speed for 30 minutes.
Carefully, the supernatant was poured off and the tube cleaned with absorbent paper.
Mixtures were added 250μL of 70% ethanol to wash the DNA pellet. It followed a new
centrifugation at top speed for 3 minutes.
Ethanol was aspirated using a clean absorbent paper and air-dried for 5 minutes. DNA
pellets re-suspended in 50μL of TE.
3.3 Amplification of gene 671
Gene 671 was amplified with the primers NCTC671ClonFwXbaI,
GCGTCTAGACATCACCATCACCATCACTCTACACAACAT, and NCTC671ClonRvEagI,
CGCGGCCGTTAATGGATGAATGCATAGC. Polymerase chain reaction was performed with
the following Master Mix and reaction conditions:
Table 3.2: Content of Master Mix solution for 671 amplification.
Master Mix 50μL
HF Phusion Buffer 5x 10μL
dNTP (10mM) 1μL
Primer Fw (10mM) 1μL

9
Primer Rv (10mM) 1μL
Phusion enzyme 0,5μL
MilliQ H2O 31,5μL
DNA template 1μL
Table 3.3: PCR conditions for 671 amplification. Number of cycles (a cycle comprising the steps of
Denaturation, Annealing and Extension) was of 30.
Step Temperature Time (min)
Initial Denaturation 98ºC 1:00
Denaturation 98ºC 0:10
Annealing 58ºC 0:30
Extension 72ºC 2:00
Final Extension 72 ºC 10:00
End 10 ºC --
The resulting amplified product was loaded into a 0,8% agarose gel and separated at
120mV for 40 minutes. Sequentially, sample was cleaned with a Clean Up kit.
It followed the digestion of the purified insert, 35μL of DNA was digested with 1μL of
restriction enzyme XbaI, 5μL of 10x NEBuffer CutSmart and water MiliQ to a total volume of
50μL. Mixture was kept overnight at a temperature of 37 ºC, after which, sample was cleaned
with Clean Up kit and re-suspended on 50μL water MilliQ. From the cleaned mixture was
retrieved a volume of 35μL and added 1μL of restriction enzyme EagI, 5μL of 10x NEBuffer 3.1
and water MilliQ to a total volume of 50μL. Digestion proceeded overnight at a temperature of
37 ºC, after which, mixture was purified with Clean Up kit and stored at a -20 ºC.
3.4 Construction of pET21a vector for protein expression
It was constructed two pET21a – 671 mutants intended for protein expression.
The first was denominated pET21a – 671 I and was constructed by digesting 35μL
(5,103μg) of purified plasmid DNA with 1,5μL of restriction enzyme XbaI, 5μL of 10x NEBuffer
CutSmart and water MilliQ to a total volume of 50μL. Digestion mixture was kept overnight at a

10
temperature of 37ºC, after which, sample was purified with Clean Up kit, and re-suspended in
50μL water MilliQ. From the purified sample was retrieved a volume of 35μL and added 1,5μL
of restriction enzyme EagI, 5μL of 10x NEBuffer 3.1 and water MilliQ to a total volume of 50μL.
Digestion was kept overnight at a temperature of 37 ºC, and purified with Clean Up kit afterwards.
Re-suspended in 50μL of water MilliQ.
Ligase reaction was prepared with 1μL of T4 Ligase enzyme, 2μL of 10x Ligase buffer,
10μL of digested plasmid pET21a and 7μL of digested insert 671. Auto-ligated sample was
prepared with the same volumes with the exception of digested insert 671, which was replaced
with 7μL MilliQ water. Mixture was kept overnight at room temperature and stored at -20 ºC. In
order to confirm a successful ligation, it was performed a PCR with the commercial primers T7
promoter and T7 terminator, and the enzyme DreamTaq. Master Mix solution were as follows:
Table 3.4: Content of Master Mix solution for pET21a-671 I verification.
Master Mix 20μL
DreamTaq Green Buffer 10x 2μL
dNTP (10mM) 0,4μL
Primer T7 promoter (20mM) 0,2μL
Primer T7 terminator (20mM) 0,2μL
DreamTaq enzyme 0,1μL
MilliQ H2O 14,1μL
DNA template 3μL
PCR conditions were as follows:
Table 3.5: PCR conditions for pET21a-671 I verification. Number of cycles (a cycle comprising the steps
of Denaturation, Annealing and Extension) was of 30.
Step Temperature Time (min)
Initial Denaturation 95 ºC 3:00
Denaturation 95 ºC 0:30
Annealing 53 ºC 0:30
Extension 72 ºC 1:30

11
Final Extension 72 ºC 5:00
End 10 ºC --
Following the PCR reaction, the product was loaded on a 0,8% agarose gel with 5μL of
RedSafe and separated at 120mV for 40 minutes.
The second plasmid was denominated pET21a – 671 II and was constructed by digesting
20μL (2,960μg) of purified plasmid DNA with 1,5μL of restriction enzyme NheI, 3μL of 10x
NEBuffer 2.1 and water MilliQ to a total volume of 30 μL. Digestion mixture was kept overnight
at a temperature of 37 ºC, after which, sample was purified with Clean Up kit, and re-suspended
in 50μL water MilliQ. From the purified sample was retrieved a volume of 20μL (521,2 ng) and
added 1μL of restriction enzyme EagI, 5μL of 10x NEBuffer 2.1 and water MilliQ to a total
volume of 30μL. Digestion was kept overnight at a temperature of 37 ºC, and neutralized by heat
inactivation at 65 ºC for 30 minutes.
Ligase reaction was prepared with 1μL of T4 Ligase enzyme, 2μL of 10x Ligase buffer,
3μL (3,909μg) of digested plasmid pET21a and the following volumes of digested insert 671:
10μL, 7μL, 5μL and 0μL (auto-ligated plasmid). Mixture was kept overnight at room temperature
and stored at -20 ºC.
In order to confirm a successful ligation, it was performed a PCR with the commercial
primers T7 promoter and T7 terminator, and the enzyme DreamTaq. Master Mix solution were
as follows:
Table 3.6: Content of Master Mix solution for pET21a-671 II verification.
Master Mix 20μL
DreamTaq Green Buffer 10x 2μL
dNTP (10mM) 0,4μL
Primer T7 promoter (20mM) 0,2μL
Primer T7 terminator (20mM) 0,2μL
DreamTaq enzyme 0,1μL
MilliQ H2O 14,1μL

12
DNA template 3μL
PCR conditions were as follows:
Table 3.7: PCR conditions for pET21a-671 II verification. Number of cycles (a cycle comprising the steps
of Denaturation, Annealing and Extension) was of 30.
Step Temperature Time (min)
Initial Denaturation 95 ºC 5:00
Denaturation 95 ºC 0:30
Annealing 53 ºC 0:30
Extension 72 ºC 2:30
Final Extension 72 ºC 5:00
End 10 ºC --
PCR product was loaded on 0,8% agarose gel with 5μL RedSafe and separated at 120mV
for 40 minutes.
3.5 E.coli transformation
Competent cells of the strain Dh5α were prepared according to the protocol previously
described (Section 3.1). Cells were retrieved from –80ºC storage and thawed in ice. Once
defrosted it was added 5μL of ligated DNA to the cell aliquots and placed on ice for 10 minutes.
Sequentially, samples were incubated at 42 ºC for 1 minute and then immediately placed
on ice for 5 minutes. After ice incubation, it was added 1mL LB to cell samples and incubated
under agitation at 37 ºC for 1 hour.
Samples were plated in LA plates supplemented with 100μg/mL of Ampicillin and
incubated overnight at 37 ºC.
3.6 Colony Screening PCR
Transformed colonies of E.coli were confirmed via PCR. From ON plates was streaked
several isolated colonies into fresh LA plates supplemented with 100μg/mL of Ampicillin and
incubated overnight. The grown colonies were streaked with the resource of a wooden toothpick
directly into the PCR tube.

13
PCR reaction was performed with the commercial primers T7 promoter and T7
terminator, and the enzyme DreamTaq. Master Mix solution were as follows:
Table 3.8: Contents of Master Mix solution for Colony Screening PCR of E.coli colonies.
Master Mix 20μL
DreamTaq Green Buffer 10x 2μL
dNTP (10mM) 0,4μL
Primer T7 promoter (20mM) 0,2μL
Primer T7 terminator (20mM) 0,2μL
DreamTaq enzyme 0,1μL
MilliQ H2O 17,1μL
PCR conditions were as follows:
Table 3.9: PCR conditions for Colony Screening PCR for E.coli colonies. Number of cycles (a cycle
comprising the steps of Denaturation, Annealing and Extension) was of 30.
Step Temperature Time (min)
Initial Denaturation 95 ºC 10:00
Denaturation 95 ºC 0:30
Annealing 53 ºC 0:30
Extension 72 ºC 2:30
Final Extension 72 ºC 5:00
End 10 ºC --
PCR product was run on 0,8% agarose gel with 5μL of RedSafe and separated at 120mV
for 40 minutes.
3.7 E.coli BL21(DE3) induction test
E.coli strain BL21(DE3) was transformed with pET21a plasmid according to stated
transformation protocol (Section 3.5). One isolated colony was inoculated in 3ml of LB medium
supplemented with 100μg/ml Ampicillin and incubated overnight at 37ºC under agitation.
14
Grown ON culture was diluted to 0,05 OD600 in 20mL of LB medium, supplemented with
100μg/mL, incubated at a temperature of 37 ºC and agitation of 150 rpm until it reached 0,5 OD600.
When culture reached recommended OD600, it was divided in equal volume to another
Erlenmeyer and added 1mM of IPTG. Nothing was added to the initial Erlenmeyer (negative
control).
Both cultures proceeded with incubation at 37 ºC under agitation of 150 rpm. Aliquots of
each cell culture were retrieved and stored at -20 ºC.
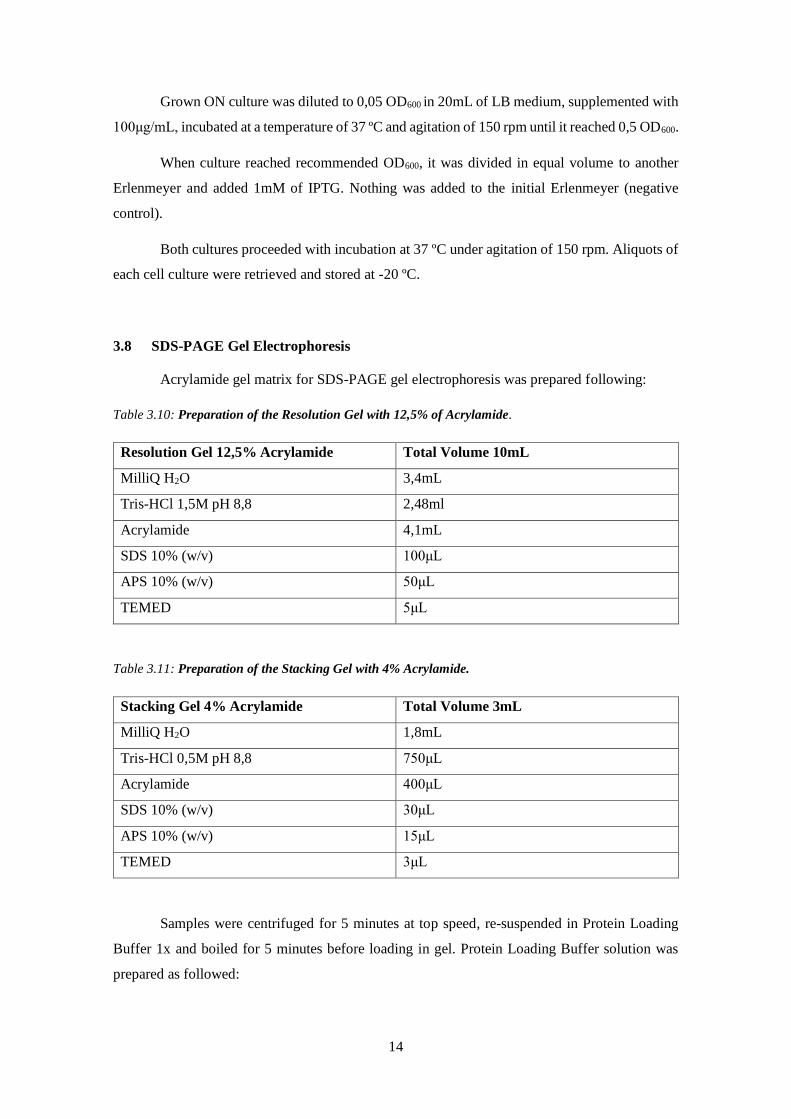
3.8 SDS-PAGE Gel Electrophoresis
Acrylamide gel matrix for SDS-PAGE gel electrophoresis was prepared following:
Table 3.10: Preparation of the Resolution Gel with 12,5% of Acrylamide.
Resolution Gel 12,5% Acrylamide Total Volume 10mL
MilliQ H2O 3,4mL
Tris-HCl 1,5M pH 8,8 2,48ml
Acrylamide 4,1mL
SDS 10% (w/v) 100μL
APS 10% (w/v) 50μL
TEMED 5μL
Table 3.11: Preparation of the Stacking Gel with 4% Acrylamide.
Stacking Gel 4% Acrylamide Total Volume 3mL
MilliQ H2O 1,8mL
Tris-HCl 0,5M pH 8,8 750μL
Acrylamide 400μL
SDS 10% (w/v) 30μL
APS 10% (w/v) 15μL
TEMED 3μL
Samples were centrifuged for 5 minutes at top speed, re-suspended in Protein Loading
Buffer 1x and boiled for 5 minutes before loading in gel. Protein Loading Buffer solution was
prepared as followed:

15
Table 3.12: Preparation of SDS/Page Protein Loading Buffer 5x. Sample stored at -20ºC.
Protein Loading Buffer 5x Total Volume 5mL
SDS 10% (w/v) 1mL
Glicerol 0,5mL
Tris 1M pH 6,8 0,8mL
Bromophenol Blue 0,2% (w/v) 0,1mL
β-Mercaptoethanol 0,5mL
MilliQ H2O 2,1mL
Band separation was performed at 80mV in 1x Tris-Glycine SDS Running Buffer for
approximately two hours. Gel was stained in Blue Safe overnight.
3.9 Sanger Sequencing
Sanger sequencing was provided by STABvida Laboratories, in FCT UNL campus.
(http://www.stabvida.com)
3.10 S.aureus competent cells
For the preparation of S.aureus competent cells was prepared a solution of Sucrose 0,5M,
filtered and stored at 4ºC until used.
S.aureus strain RN4220 was inoculated in 5mL of TSB medium and grown overnight at
37ºC.
The following day, overnight culture was diluted 1:200 ratio into 100mL of TSB medium
and incubated at 37ºC with shaking until OD600= 0,4-0,6. Upon reaching recommended OD,
cultures were transferred into four pre-cooled 50mL Falcon tubes and centrifuged at top speed,
4ºC for 15 minutes.
Supernatant of centrifuged samples was discarded and pellet re-suspended in 50mL of
sucrose 0,5M. Samples were centrifuged again at top speed, 4ºC for 15 minutes. Supernatant was
discarded and pellet re-suspended 25mL of sucrose 0,5M.
The content of each two Falcon tubes were combined, placed on ice for 15 minutes and
centrifuged again for 15 minutes at 4ºC.

16
Pellets were re-suspended in 300μL of sucrose 0,5M and all the content was combined
into one single Falcon tube. The resulting mixture was distributed into aliquots of 50μL and stored
at -80ºC.
3.11 Purification of Up and Down regions of gene 671
Regions 1kb Upstream and 1kb Downstream of gene 671 were amplified from genomic
DNA extracted from S.aureus NCTC 8325-4 with the following primers:
Table 3.11: Forward and reverse primers for amplification of fragments Up and Down
Up
NCTC671UpFwEcoRI (P1) CGC GCG AAT TCT GGG TAT TAT TAC
GTT GGC ATT G
NCTC671UpRegOver (P2) GGA GTG CCT TTG TAA TTA AAT AAA
TTG TAC TG
Down
NCTC671DwRegOver (P3) CAA TTT ATT TAA TTA CAA AGG GAC
TCC TCC
NCTC671DwRevBamHI (P4) CGC GGA TCC TTC TGA ACA TAT TAG
CAA GGT AAA G
Master Mix constitution and reaction conditions for both PCRs are as follows:
Table 3.12: Contents of Master Mix solution for Up and Down fragments amplification.
Master Mix 50μL
HF Phusion Buffer 5x 10μL
dNTP (10mM) 1μL
Primer Fw (P1 or P3) (10mM) 1μL
Primer Rv (P2 or P4) (10mM) 1μL
Phusion enzyme 051μL
MilliQ H2O 31,5μL

17
DNA template 1μL
Table 3.13: PCR conditions for Up and Down cloning PCR. Number of cycles (a cycle comprising the
steps of Denaturation, Annealing and Extension) was of 30.
Step Temperature Time (min)
Initial Denaturation 98ºC 1:00
Denaturation 98ºC 0:10
Annealing 58ºC 0:30
Extension 72ºC 2:00
Final Extension 72 ºC 10:00
End 10 ºC --
After PCR, all samples were loaded into a 0,8% agarose gel with 5μL RedSafe and
separated at 120mV for 40 minutes. Afterwards, the amplified product was cleaned using a Clean
Up kit.
Once inserts Up and Down were purified, it followed an Overlapping PCR with primers
NCTC671UpFwEcoRI (P1) as forward primer and NCTC671DwRevBamHI (P4) as reverse
primer. The resulting amplification will consist of inserts Up and Down combined into a single,
longer DNA fragment (UP-DOWN). PCR conditions and Master Mix constitution were as
follows:
Table 3.14: Contents of Master Mix solution for overlapping PCR of Up and Down fragments.
Master Mix 50μL
HF Phusion Buffer 5x 10μL
dNTP (10mM) 1μL
Primer Fw P1 (10mM) 1μL
Primer Rv P4 (10mM) 1μL
Phusion enzyme 0,5μL
MilliQ H2O 30,5μL

18
DNA template Up 1μL
DNA template Down 1μL
Table 3.15: PCR conditions for Overlapping PCR of Up and Down regions. Number of cycles (a cycle
comprising the steps of Denaturation, Annealing and Extension) was of 30.
Step Temperature Time (min)
Initial Denaturation 98ºC 1:00
Denaturation 98ºC 0:10
Annealing 58ºC 0:30
Extension 72ºC 4:00
Final Extension 72 ºC 10:00
End 10 ºC --
After PCR, all samples were loaded into a 0,8% agarose gel with 5μL RedSafe and
separated at 120mV for 40 minutes. Amplified band was cut from the gel and cleaned with a
Clean Up kit.
It followed the sequential digestion of the purified UP-DOWN insert. For the first reaction
6,35μL (800ng) of insert was digested with 1μL of restriction enzyme EcoRI, 3μL of 10x
NEBuffer 3.1 and water MiliQ to a total volume of 30μL. Mixture was kept overnight at a
temperature of 37 ºC, after which, sample was cleaned with Clean Up kit and re-suspended on
50μL water MilliQ, From the cleaned mixture was retrieved a volume of 20μL and added 1μL of
restriction enzyme BamHI, 5μL of 10x NEBuffer 3.1 and water MilliQ to a total volume of 50μL.
Digestion proceeded overnight at a temperature of 37 ºC, after which, mixture was purified with
Clean Up kit and stored at a -20 ºC.
3.12 Construction of pMAD vector for gene excision
The plasmid was denominated pMAD del 671 and was constructed by digesting 20μL
(1,066μg) of purified plasmid DNA with 1μL of restriction enzyme EcoRI, 5μL of 10x NEBuffer
3.1 and water MilliQ to a total volume of 30μL. Digestion mixture was kept overnight at a
temperature of 37 ºC, after which, sample was purified with Clean Up kit, and re-suspended in
50μL water MilliQ. From the purified sample was retrieved a volume of 20μL and added 1μL of
restriction enzyme BamHI, 5μL of 10x NEBuffer 3.1 and water MilliQ to a total volume of 50μL.

19
Digestion was kept overnight at a temperature of 37 ºC, and cleaned with Clean Up kit afterwards.
Re-suspended in 50μL of water MilliQ.
Ligase reaction was prepared with 1μL of T4 Ligase enzyme, 2μL of 10x Ligase buffer,
10μL (67ng) of digested plasmid pMAD and the following volumes of digested insert UP-
DOWN: 10μL, 7μL, 5μL and 0μL (auto-ligated plasmid). Mixture was kept overnight at room
temperature and stored at -20 ºC.
To confirm a successful ligation, it was performed a PCR with the primers pMAD1
(forward) and pMAD2 (reverse). PCR conditions and Master Mix constitution are as follows:
Table 3.16: Contents of Master Mix solution for pMAD del 671 verification.
Master Mix 20μL
DreamTaq Green Buffer 10x 2μL
dNTP (10mM) 0,4μL
Primer pMAD1 (10mM) 0,4μL
Primer pMAD2 (10mM) 0,4μL
DreamTaq enzyme 0,1μL
MilliQ H2O 16,7μL
DNA template 3μL
Table 3.17: PCR conditions for pMAD del 671 verification. Number of cycles (a cycle comprising the steps
of Denaturation, Annealing and Extension) was of 30.
Step Temperature Time (min)
Initial Denaturation 95 ºC 3:00
Denaturation 95 ºC 0:30
Annealing 53 ºC 0:30
Extension 72 ºC 3:00
Final Extension 72 ºC 5:00
End 10 ºC --

20
PCR product was loaded on a 0,8% agarose gel with 5μL of RedSafe and separated at
120mV for 40 minutes.
Once verified a successful ligation of pMAD del 671, the plasmid was transformed to
E.coli strain of DC10b according to the E.coli transformation protocol (section 3.5). Transformed
colonies were screened via Colony Screening PCR (section 3.6) with the primers pMAD1 and
pMAD2. Plasmid DNA was extracted with a Miniprep kit from positive colonies and stored at -
20ºC.
3.13 S.aureus electroporation
S.aureus competent cells were thawed in ice and 5μL of purified DNA plasmid was added
to the aliquot. Mixture was then transferred to a 0,2 cm BioRad Gene Pulser cuvette and incubated
on ice for 5 minutes.
Samples were then retrieved and pulsated once at 2500V, 25μF, 100Ω for 2,5 msec. Cells
were immediately rescued with 1mL of TSB medium and placed on ice for 15 minutes. Samples
were then incubated at 30 ºC, under agitation for 2 hours.
3.14 Transduction protocol
The following solutions were prepared:
Table 3.20: Preparation of 0,3GL Top and Bottom Agar. Medium was autoclaved at 120ºC for 40
minutes.
0,3GL Top Agar (Bottom Agar) pH 7,8 Concentration
Casamino Acids 3 g/L
Yeast Extract 3 g/L
NaCl 5,9 g/L
Sodium Lactate, 60% syrup/DL-Lactate Acid 3,3 mL/L
50% Glicerol 2 mL/L
Tri-Sodium Citrate 0,5 g/L
Agar for Top agar (for Bottom agar) 7,5 g/L (15 g/L)
Table 3.21: Preparation of Phage Top and Bottom Agar. Medium was autoclaved at 120ºC for 20
minutes.
Phage Top Agar (Bottom Agar) pH 7,8 Concentration
Casamino Acids 3 g/L

21
Yeast Extract 3 g/L
NaCl 5,9 g/L
Agar for Top agar (for Bottom agar) 5 g/L (15 g/L)
Table 3.8: Preparation of Phage Buffer. Solution as sterilized with 0,22 μm filter.
Phage Buffer Concentration
0,1M MgSO4 10 mL/L (1mM)
0,4M CaCl2 10 mL/L (4mM)
2,5M Tris pH 7,8 20 mL/L (50mM)
NaCl 5,9 g/L
Gelatin 1 g/L
All media and buffers were stored at 4ºC.
In order to make the phage lysate, a single colony of transformed S.aureus strain RN4220
was plated and incubated at 30ºC overnight.
It was retrieved two 10μL loops of confluent growth and re-suspended in 1mL of TSB
medium where it was added 5mM of CaCl2.
Several dilutions of Phage 80α lysate were prepared with Phage Buffer and kept at 4ºC.
Additionally, it was prepared 3mL of Phage Top Agar supplemented with 5mM CaCl2, 10μL of
cell suspension and 10μL of diluted phage lysate. The mixture was poured onto 20mL Bottom
Phage Agar plates sustained with 5mM of CaCl2. Plates were incubated overnight at 30ºC.
The following day, 4mL of Phage Buffer was added to plates showing confluent lysis and
place at 4ºC for one hour. Sequentially, the Phage Top Agar layer was collected into a Falcon
tube, vortexed and incubated at 4ºC for one hour. Mixture was then centrifuged at top speed for
15 minutes at 4ºC.
Supernatant was recovered and filtered with a 0,45μm filter and stored at 4ºC. As a
sterility control, 50μL of recovered phage lysate was plated on a TSA plate and incubated
overnight at 37ºC.
For the transduction procedure it was plated a single colony of the receiving strain of
S.aureus NCTC 8325-4 and incubated overnight at 30ºC.
The following day it was re-suspended two loops of the confluent growth in 1mL of TSB
medium supplemented with 5mM CaCl2.

22
It was poured into petri dishes 10mL of 0,3GL Bottom Agar containing 3x 10μg/mL
Erythromycin. After agar is set, it was poured a new layer of 20mL 0,3GL Bottom Agar without
antibiotic.
The following transduction mixtures were prepared:
Table 3.23: Transduction mixtures prepared.
Sample Culture (μL) Phage Lysate (μL) Phage Buffer μL
1 100 0,1 100
2 100 1 100
3 100 10 100
4 100 100 100
Control 100 - 100
Mixtures were incubated under agitation for 20 minutes at 37ºC.
Each transduction mixture was added to 3mL of Top Agar in a test tube, shaken and
immediately poured onto a prepared 0,3GL Bottom Agar plate. After solidified, plates were
incubated at 30ºC for 48 hours.
3.15 Gene knock-out protocol
For the integration step of gene knock-out procedure, inoculates of transduced strain of
S.aureus NCTC 8325-4 + pMAD del 671 were prepared in TSB medium supplemented with
10μg/ml of Erythromycin and incubated overnight at 30ºC. The following day, cultures were
diluted 1:1000 in fresh medium of TSB with 10μg/mL Erythromycin and incubated at 30ºC for a
period of 8 hours. After incubation over day, cultures were once again diluted at 1:1000 ratio in
TSB medium with 10μg/mL Erythromycin and incubated at 43ºC overnight.
The following day, grown cultures were plated in fresh plates of TSA medium
supplemented with 10μg/mL Erythromycin and 100μg/mL X-Gal with the following dilutions:
10-4, 10-5 and 10-6. Plates were then incubated overnight at 43ºC. The following day, isolated blue
colonies were stricken to fresh plates of TSA + 10μg/mL Erythromycin + 100μg/mL X-Gal and
incubated at 43ºC overnight.
Successful integration was confirmed via PCR of the genomic DNA extracted from the
stricken blue colonies (PCR conditions and procedure of genomic DNA extraction listed below,
sections 3.17 and 3.16, respectively).

23
Positive colonies with integrated pMAD del 671 plasmid were selected for the excision
step of gene knock-out procedure. Samples were inoculated in TSB medium with no antibiotic
and incubated at 30ºC overnight. The following day, cultures were diluted 1:500 in fresh TSB
medium with no antibiotic and incubated over day at 30ºC for a period of 8 hours. Afterwards,
cultures were diluted 10-4, 10-5 and 10-6 and plated in fresh plates of TSA + 100μg/mL X-Gal.
Plates were incubated at 43ºC overnight.
The following day, the same isolated white colonies were stricken in fresh plates TSA +
10μg/mL Erythromycin + 100μg/mL X-Gal as well as plates TSA + 100μg/mL X-Gal. Both set
of plates were incubated overnight at 37ºC.
After incubation, white colonies that did not grow in TSA medium supplemented with
Erythromycin were stricken into fresh plates of TSA + 100μg/mL X-Gal and incubated overnight
at 37ºC. The following day, genomic DNA of grown white colonies was extracted (section 3.16)
and a PCR (section 3.17) was performed to confirm the successful excision of the gene 671.
3.16 S.aureus genomic DNA extraction for PCR screening.
The following solutions were prepared:
• Alkaline Wash Solution
o 0,05M Sodium Citrate
o 0,5M NaOH
• 0,5M Tris-HCl pH 8,0
Cells were scraped from plates and re-suspended in 500μL of Alkaline Wash Solution
and followed by room temperature incubation for 20 minutes. Sequentially, samples were
centrifuged at top speed for 1 minute and the resulting pellet was washed with 500μL of 0,5M
Tris-HCl pH 8,0. A new centrifugation was performed and pelleted cells were re-suspended in
100μL of MilliQ water.
Samples were boiled for 10 minutes followed by centrifugation at top speed for 5 minutes.
Supernatant was then transferred to a new, clean Eppendorf and stored at -20ºC.
3.17 PCR screening for gene knock-out confirmation
A successful integration of the construct pMAD del 671 was verified by performing two
separated PCR screenings with two different sets of primers, of the extracted genomic DNA
samples. The first PCR screening was performed with the set of primers forward

24
“NCTC671UpFwEcoRI” (P1) and reverse pMAD2. The resulting amplification will verify if the
crossing over took place on the Up region of the 671 gene. The second set of primers consisted
of the forward primer pMAD1 and the reverse primer “NCTC671DwRevBamHI” (P4). This set
of primers will amplify for successful crossing over on the Down region of the gene 671.
The Master Mix constitution and PCR conditions for integration screening are as follows:
Table 3.24: Contents of Master Mix solution for integration screening PCR.
Master Mix 20μL
DreamTaq Green Buffer 10x 2μL
dNTP (10mM) 0,4μL
Primer P1/pMAD1 (10mM) 0,4μL
Primer pMAD2/P4 (10mM) 0,4μL
DreamTaq enzyme 0,1μL
MilliQ H2O 14,1μL
Genomic DNA 3μL
Table 3.25: PCR conditions for integration screening PCR. Number of cycles (a cycle comprising the
steps of Denaturation, Annealing and Extension) was of 30.
Step Temperature Time (min)
Initial Denaturation 95 ºC 10:00
Denaturation 95 ºC 0:30
Annealing 53 ºC 0:30
Extension 72 ºC 3:00
Final Extension 72 ºC 10:00
End 10 ºC --
After PCR, all samples were loaded into a 0,8% agarose gel with 5μL RedSafe and
separated at 120mV for 40 minutes.
For the verification of a successful excision of the gene 671 was performed a PCR
screening with the primers “NCTC671UpFwEcoRI” (P1) as forward primer and

25
“NCTC671DwRevBamHI” (P4) as reverse primer. The constitution of the reaction Master Mix
and the PCR conditions are as follows:
Table 3.26: Contents of Master Mix solution excision verification PCR.
Master Mix 20μL
DreamTaq Green Buffer 10x 2μL
dNTP (10mM) 0,4μL
Primer P1 (10mM) 0,4μL
Primer P4 (10mM) 0,4μL
DreamTaq enzyme 0,1μL
MilliQ H2O 14,1μL
Genomic DNA 3μL
Table 3.27: PCR conditions for excision verification PCR. Number of cycles (a cycle comprising the steps
of Denaturation, Annealing and Extension) was of 30.
Step Temperature Time (min)
Initial Denaturation 95 ºC 10:00
Denaturation 95 ºC 0:30
Annealing 53 ºC 0:30
Extension 72 ºC 2:00
Final Extension 72 ºC 10:00
End 10 ºC --
After PCR, all samples were loaded into a 0,8% agarose gel with 5μL RedSafe and
separated at 120mV for 40 minutes.

26

27
4 Results and Discussion
4.1 Construction of pET21a-671 I
As it was described in section 3.3, gene 671 was amplified from the extracted DNA of
S.aureus strain NCTC 8325-4. PCR reaction amplified a DNA fragment of approximately 800bp
which is in conformance with the in-silico sequence. As figure 4.1 demonstrates, the amplified
band is inferior to the 850bp ladder band and shows no other amplification products. Control
sample was performed with MilliQ water (last lane before ladder) and it displays no amplification.
Figure 4.1: Amplification of gene 671. Expected length of amplified fragment is approximately 850bp. 1
to 8- Amplified 671 insert. 9- control.
Cloning vector pET21a was extracted using a Miniprep kit from E.coli strain Dh5α and
digested with restriction enzymes XbaI, EagI and NheI.
In order to assess the integrity of the extracted and digested DNA, it was performed an
agarose gel (Figure 4.2) where pET21a non-digested was loaded next to the digested samples. All
lanes display two bands with no visible smears: the first band at 5000bp is in accordance to the
expected size of pET21a (which has approximately 5500bp) whereas the second band over the
12000bp ladder mark corresponds to super-coiled form of DNA.
All used enzymes have a unique restriction site that will linearize the circular plasmid,
and therefore display a band of the same weight as the circular plasmid. The existence of the
second band from the super-coiled form confirms an incomplete digestion.
850 bp
1 2 3 4 5 6 7 8 9

28
Figure 4.2: Plasmid pET21a digested with restriction enzymes XbaI, EagI and NheI. 1- Plasmid pET21a.
2- pET21a digested with XbaI. 3- pET21a digested with EagI. 4- pET21a digested with NheI. 5- pET21a
digested with XbaI and EagI.
Digested plasmid and insert 671 were ligated using a T4 Ligase enzyme. Considering the
gene 671 was inserted in the multiple cloning site of pET21a it is possible to verify a successful
ligation with the primers T7 promoter and T7 terminator, located upstream and downstream of
the MCS. PCR conditions are described in section 3.4 and the agarose gel is shown in figure 4.3.
The amplification product of a successful ligation will consist of a DNA fragment with
the approximate size of 850bp, as is shown in lane 1 of figure 4.3. The auto-ligated plasmid (lane
2) will amplify a DNA fragment of 300bp.
A plasmid digested with either XbaI, EagI or both enzymes will become linear and will
not allow any amplification. The existence of a 300bp band in lane 3 indicates the digestion of
pET21a with either XbaI or EagI was incomplete and the plasmid returned to its original circular
form.
In lane 6 is displayed the amplification of 300bp fragment that is expected of pET21a
plasmid.
1 2 3 4 5 6
5 000 bp
12 000 bp

29
Figure 4.3: Cloning PCR of pET21a-671 I plasmid. Expected length of the amplified 671 insert is of
850bp, which verifies a successful insertion. 1- PCR product of pET21a-671 I. 2-PCR product of auto-
ligated pET21a. 3- PCR product of pET21a digested with XbaI and EagI. 4- pET21a digested with XbaI
and EagI. 5- pET21a digested with Xbal. 6- PCR product of pET21a. 7- pET21a. 8- Control.
4.2 Positive colonies of pET21a-671 I.
The confirmed ligated pET21a-671 I was transformed into E.coli strain Dh5α according
to the protocol described in section 3.5. The auto-ligated pET21a was also transformed. Several
of the resulting colonies were stricken into fresh plates and screened via Colony Screening PCR
(section 3.6)
Figure 4.4: Screening PCR for pET21a-671 I positives. 1 to 11- Amplification from transformed Dh5α
with pET21a-671 I. 12- Amplification from transformed Dh5α with auto-ligated pET21a. 13- DNA ladder
14- Amplification from pET21a-671 I (positive control). 15- Amplification from auto-ligated pET21a
(negative control). 16- Amplification from pET21a digested with XbaI and EagI. 17- Amplification from
pET21a digested with XbaI. 18- Amplification from pET21a.
1 2 3 4 5 6 7 8
5 000 bp
850 bp
300 bp
1 2 3 4 5 6 7 8 9 10 11 12 13 14 15 16 17 18
850 bp

30
PCR conditions and Master Mix constitution were as it is described in section 3.6. From
a selection of 11 transformed Dh5α colonies with plasmid pET21a-671 I, only one showed the
amplification of the 800bp band respective to gene 671 (figure 4.4).
Positive colony of pET21a-671 I was stricken into fresh plate and plasmid DNA was
extracted with a Miniprep kit. It followed a digestion with restriction enzyme NaeI in order to
assess a Digestive Profile. Enzyme NaeI possesses three restriction sites as it is demonstrated in
figure 4.5.
Figure 4.5: Restriction sites of NaeI in plasmid pET21a-671 I.
It was digested 1μg of plasmid pET21a-671 I and plasmid pET21a that served as negative
control.
As it is shown in table 4.1, both plasmids will be digested into three DNA fragments
however, the smallest fragment of the empty pET21a (456bp) will have a significant size
difference when compared to the same fragment of pET21a-671 I (1197bp). This difference is
due to the inserted 671 gene and will be visible when separated by gel electrophoresis.

31
Table 4.1: Size comparison of DNA fragments produced by NaeI digestion.
pET21a pET21a-671 I
3336 3336
1588 1588
456 1197
Figure 4.6: Digestive profile of pET21a-671 I by NaeI. Digestion with NaeI enzyme will result in three
fragments for both pET21a-671 I and pET21a. The size difference in the smallest fragment attests for a
positive insertion of gene 671. 1- pET21a non-digested. 2- Digested pET21a. 3- pET21a-671 I non-
digested. 4- Digested pET21a-671 I.
The agarose gel in figure 4.6 depicts the digestion of both plasmids by NaeI. As it was
expected, the two plasmids display two bands of equal size: a first with 3000bp followed by the
second close to the 1650bp ladder band.
The last band of the sample pET21a is barely visible in the agarose gel but is clearly
below the 1000bp ladder mark. The positive sample pET21a-671 I, however, exhibits the third
band above the 1000bp which confirms the insertion of gene 671.
1 2 3 4
3 000 bp
1 650 bp
1 000 bp
500 bp

32
4.3 Induction test of pET21a-671 I
Positive plasmid pET21a-671 was transformed into E.coli strain BL21(DE3) as it was
described in section 3.5. One transformed colony was selected and inoculated in LB medium
supplemented with 100μg/ml Ampycilin, incubated overnight at 37ºC, 150rpm.
Protein induction test was performed according to section 3.7, with 1mM IPTG and
temperature 37ºC. Aliquots were retrieved at time 0 of induction, at 3-hour induction and
overnight induction. Optical density was also measured at the mentioned points.
Figure 4.7: Optical density measurements along time of induction. 671+: culture induced with 1mM
IPTG. 671-: culture not induced (control)
Retrieved samples were loaded into SDS/PAGE gel as is described in section 3.8.
Samples were run at 80 mV for approximately 2 hours (figure 4.8). Expected protein is of 26,6
kDa, according to SeqBuilder software from Lasergene’s DNAStar.
As it is depicted in figure 4.8, it is possible to discern an accentuated band in the induced
samples of pET21a-671 I. Considering the weight of said band, which stands above the 25 kDa
ladder mark, it can be correlated to the successful expression of protein 671.
0
0,1
0,2
0,3
0,4
0,5
0,6
0 5 10 15 20
OD
Time (h)
pET21a-671 I induction
671 + 671 -

33
Figure 4.8:SDS/PAGE gel of pET21a-671 I protein induction test. T0: time 0 of induction. T3+: time 3-
hour induced. T3-: time 3-hour non-induced. TON+: time overnight induced. TON-: time overnight non-
induced.
4.4 Sequencing of pET21a-671 I
Sanger sequencing of plasmid pET21a-671 I was also performed in order to verify
coherence with the in-silico sequence (section 3.9).
As it is demonstrated in figure 4.9, sanger sequencing exposed an interruption of
approximately 40bp in plasmid pET21a-671 I. This interruption implied the deletion of the
conserved RBS of pET21a as well as the start codon, which could potentially hinder the
expression of the protein.
T0 T3+
T3
- TON
+
TON
-
25 kDa
A
B
Figure 4.9:Sequencing of pET21a-671 I. A- Segment of sequencing traces assembled by SeqMan
software from Lasergene’s DNAStar and provided by STABvida laboratories. B: Segment of in-silico
sequence depicting the deleted nucleotides.

34
The cause of this deletion was due to the digestion of the cloning vector with the XbaI
enzyme instead of the NheI enzyme (figure 4.9 B). Digestion with enzyme NheI and EagI would
not interfere with the RBS and start codon.
4.5 Construction of pET21a-671 II
Similarly to the procedure in constructing plasmid pET21a-671 I, the new plasmid was
constructed by digesting with restriction enzyme NheI and EagI (as it was described in section
3.4) and ligated to the digested insert 671. Ligation of the XbaI /EagI digested 671 fragment with
NheI/EagI digested pET21a is only possible because XbaI and NheI possess compaible cohesive
ends. As it was shown in figure 4.2, NheI enzyme has a single restriction site that will linearize
digested plasmid.
A PCR was performed to verify pET21a-671 II ligation, demonstrated in figure 4.10. As it
was intended, samples of ligated pET21a-671 II (lanes 1, 2 and 3) display amplification of a DNA
fragment of approximately 850bp which corresponds to the inserted gene 671. Lane 4 displays a
band of roughly 300bp, which coincides with the expected amplification of auto-ligated pET21a.
The existence of amplification in digested pET21a implies that digestion with either NheI or EagI
was incomplete.
Figure 4.10: Cloning PCR of pET21a-671 II plasmid. Expected size of amplified fragment is
approximately 850 bp, which verifies a proper insertion of gene 671. 1- PCR product of pET21a-671 II
10μL. 2- PCR product of pET21a-671 II 7μL. 3- PCR product of pET21a-671 II 5μL. 4- PCR product of
auto-ligated pET21a. 5- PCR product of pET21a digested with NheI and EagI. 6- PCR product of pET21a.
7- Control.
4.6 Positive colonies of pET21a-671 II.
The confirmed ligated pET21a-671 II was transformed into E.coli strain Dh5α according
to the protocol described in section 3.5. The auto-ligated pET21a was also transformed. Several
1 2 3 4 5 6 7
850 bp
300 bp

35
of the resulting colonies were stricken into fresh plates and screened via Colony Screening PCR
(section 3.6)
Figure 4.11: Colony Screening PCR of pET21a-671 II. 1 to 23- Amplification from transformed Dh5α
with pET21a-671 II. 24- Amplification from transformed Dh5α with auto-ligated pET21a. 25- DNA
Ladder. 26- Amplification from pET21a-671 II 10μL (positive control). 27- Amplification from pET21a-
671 II 7μL (positive control) 28- Amplification from auto-ligated pET21a (negative control). 29-
Amplification from pET21a.
PCR conditions and Master Mix constitution were as it is described in section 3.6. From
the selected colonies transformed with pET21a-671 II screened via PCR, six displayed
amplification of 800bp DNA fragment respective to gene 671 (figure 4.11). It was selected four
of the positive colonies to proceed and performed a Digestive Profile with NaeI enzyme on two
samples, positives A and B. Plasmid pET21a was also digested as negative control.
As it was demonstrated in figure 4.5, NaeI enzyme possesses three restriction sites
digesting plasmid pET21a-671 II in three DNA fragments (table 4.2)
Table 4.2: Size comparison (in bp) of DNA fragments produced by NaeI digestion.
pET21a pET21a-671 II
3336 3336
1588 1588
447 1197
1 2 3 4 5 6 7 8 9 10 11 12 13 14 15 16 17 18 19 21 22 23 24 25 26 27 28 29
850 bp

36
Figure 4.12 Digestive profile of pET21a-671 II by NaeI.. 1- pET21a non-digested. 2- Digested pET21a.
3- pET21a-671 II A non-digested. 4- Digested pET21a-671 II A. 5- pET21a-671 II B non-digested. 6-
Digested pET21a-671 II B.
The agarose gel in figure 4.12 depicts the digestion of the three plasmids by NaeI. As it
was expected, all digested plasmids display two bands of equal size: a first with 3000bp followed
by the second close to the 1650bp ladder band.
The last band of sample pET21a is barely visible in the agarose gel but is clearly below
the 1000bp ladder mark. The positive samples pET21a-671 II A and B, however, exhibit the third
band above the 1000bp which confirms the insertion of gene 671.
4.7 Induction test of pET21a-671 II A and B
Both positive plasmids pET21a-671 II were transformed into E.coli strain BL21(DE3) as
it was described in section 3.5. One colony of each transformation was selected and inoculated in
LB medium supplemented with 100μg/ml Ampycilin, incubated overnight at 37ºC, 150rpm.
Protein induction test was performed according to section 3.7, with 1mM IPTG and
temperature 37ºC. Aliquots were retrieved every 30 minutes up to hour 4 of induction and the
last one at overnight induction. Optical density was also measured at the stated points.
Retrieved samples were loaded into SDS/PAGE gel as is described in section 3.8.
Samples were run at 80 mV for approximately 2 hours (figure 4.13). Expected protein is of 26,6
kDa, according to SeqBuilder software from Lasergene’s DNAStar.
As it is depicted in figure 4.13, it is possible to discern an accentuated band in the induced
samples of pET21a-671 II A. Considering the weight of said band, which stands above the 25
kDa ladder mark, it can be correlated to the successful expression of protein 671.
1 2 3 4 5 6
3 000 bp
1 650 bp
1 000 bp
500 bp

37
Figure 4.14 Optical density measurements along time of induction. 671+: culture induced with 1mM
IPTG. 671-: culture not induced (control)
0
1
2
3
4
5
6
7
0 2,5 5 7,5 10 12,5 15 17,5 20
OD
Time (h)
pET21a-671 II A
671 +
671 -
Figure 4.13: SDS/PAGE gel of pET21a-671 II A protein induction test. 1- Time 0:00. 2- Time 0:30 non-
induced. 3- Time 0:30 induced. 4- Time 1:00 non-induced. 5- Time 1:00 induced. 6- Time 1:30 induced.
7- Time 1:30 non-induced. 8- Time 2:00 non-induced. 9- Time 2:00 induced. 10- Time 2:30 non-induced.
11- Time 2:30 induced. 12- Time 3:00 non-induced. 13- Time 3:00 induced. 14- Time ON non-induced.
15- Time ON induced.
1 2 3 4 5 6 7
8 9 10 11 12 13 14 15
25 kDa
25 kDa

38
Figure 4.15: SDS/PAGE gel of pET21a-671 II B protein induction test. 1- T 0:00. 2- T 0:30 non-induced.
3- T 0:30 induced. 4- T 1:00 non-induced. 5- T 1:00 induced. 6- T 1:30 non-induced. 7- T 1:30 induced. 8-
T 2:00 non-induced. 9- T 2:00 induced. 10- T 2:30 non-induced. 11- T 2:30 induced. 12- T 3:00 non-
induced. 13- T 3:00 induced. 14- T ON non-induced. 15- T ON induced.
Figure 4.16: Optical density measurements along time of induction. 671+: culture induced with 1mM
IPTG. 671-: culture not induced (control).
0
1
2
3
4
5
6
0 2,5 5 7,5 10 12,5 15 17,5 20
OD
Time (h)
pET21a-671 II B
671 +
671 -
1 2 3 4 5 6 7
8 9 10 11 12 13 14 15
25 kDa
25 kDa

39
4.8 Sequencing of samples pET21a-671 II A and B
Sanger sequencing of plasmid pET21a-671 I was also performed in order to verify
coherence with the in-silico sequence. Commercial primers T7 promoter and T7 terminator were
used. Provided traces were assembled in Lasergene’s DNAStar software, SeqMan.
Assembly of sample A with in-silico sequence showed a 100% match and 99% match with
primers T7 promoter and T7 terminator respectively, and coherence was verified.
However, assembly of sample B with in-silico sequence displayed an interruption of 1
nucleotide in both provided traces, which implies a frame-shift in the plasmid sequence. This
frame-shift results in the loss of the original stop codon and, consequentially an extension of
approximately 30bp.
4.9 Additional inductions of pET21a-671 II A
After the first induction test validated plasmids pET21a-671 II A, pET21a-671 II B and
pET21a-671 I it was performed a new assay in order to compare protein expression between the
three constructs. Despite the variations revealed by sanger sequencing, all plasmids have
successfully expressed protein in the initial experiments.
Transformation of BL21(DE3) and protein induction test were performed according to
section 3.5 and 3.7, respectively. Aliquots were retrieved at time 0 of induction and after three
hours (T3) of induction and loaded into SDS/PAGE gel prepared as is described in section 3.8.
25 kDa
Figure 4.17: SDS/PAGE gel of protein 671 induction. 1- Time 0 pET21a-671 II A. 2- Time 0 pET21a-671
II B. 3- Time 0 pET21a-671 I. 4- Time 0 pET21a. 5- Time 3 hours pET21a-671 II A non-induced. 6- Time
3 hours pET21a-671 II A induced. 7- Time 3 hours pET21a-671 II B non-induced. 8- Time 3 hours pET21a-
671 II B induced. 9- Time 3 hours pET21a-671 I non-induced. 10- Time 3 hours pET21a-671 I induced. 11-
Time 3 hours pET21a non-induced. 12- Time 3 hours pET21a induced.
1 2 3 4 5 6 7 8 9 10 11 12

40
Samples were run at 80 mV for approximately 2 hours (figure 4.17). Expected protein is of 26,6
kDa, according to SeqBuilder software from Lasergene’s DNAStar.
As it is depicted in figure 4.17, induced samples of pET21a-671 II B and pET21a-671 I
display an accentuated band superior to the 25 kDa ladder mark which can be correlated to protein
671. The band displayed in pET21a-671 I, however, is significantly less noticeable which can be
explained by the loss of the RBS.
On contrary to previous results, sample pET21a-671 II A demonstrates no induction
whatsoever.
Transformed colonies of BL21(DE3) were stricken and screened via Colony Screening
PCR in order to verify successful transformation with pET21a-671 II A. Colony Screening PCR
performed according to section 3.6
Figure 4.18: Colony Screening PCR of pET21a-671 II A. 1 to 8- Amplification from transformed
BL21(DE3) with pET21a-671 II A. 9- Amplification from pET21a-671 II 10μL (positive control). 10-
Control
As it is demonstrated in figure 4.18, all stricken BL21(DE3) colonies successfully
amplified an 850bp DNA fragment that corresponds to gene 671 insert. Three colonies were
selected and inoculated into fresh medium to perform an induction test.
Induction test for the three colonies followed conditions stated in section 3.6, with 1mM
IPTG and temperature 37ºC. Aliquots retrieved at time 0 (T0) and at hour 3 (T3) of induction for
all samples and loaded in SDS/PAGE gel (section 3.8, depicted in 4.19).
1 2 3 4 5 6 7 8 9 10
850 bp

41
Similarly to the previous induction assay (figure 4.17), none of the three colonies selected
of pET21a-671 II A successfully induced protein 671 (as is demonstrated in figure 4.19), despite
PCR screening confirming a positive transformation.
Figure 4.19: SDS/PAGE gel of pET21a-671 II A induction. 1- Time 0 hour Colony 1. 2- Time 3 hours
induced Colony 1. 3- Time 3 hours non-induced Colony 1. 4- Time 0 hour Colony 2. 5- Time 3 hours
induced Colony 2. 6- Time 3 hours non-induced Colony 2. 7- Time 0 hours Colony 3. 8- Time 3 hours
induced Colony 3. 9- Time 3 hours non-induced Colony 3.
A series of factors could explain the unsuccessful induction of pET21a-671 II A. The
concentration of IPTG added to the samples could be less than sufficient to induce expression of
the protein. However, in all elaborated assays was used the same concentration of IPTG, in
particular in the first assay (figure 4.13), where a successful expression of the protein was
achieved in all induced samples. Similarly, toxic concentrations of IPTG could also explain the
absence of expression, however, plasmids pET21a-671 II B and pET21a-671 I exhibited protein
expression in all assays (figure 4.15 and 4.17). In all assays, the IPTG used was retrieved from
the same stock and administered in equal concentrations to all cultures, which deems IPTG as the
unlikely cause of this occurrence.
The use of abnormal BL21(DE3) competent cells could justify the inability to properly
express the 671 protein. However, all culture samples of BL21(DE3) used in all induction assays
were originally provenient from the same batch, prepared per point 3.1. Successful induction
observed in samples pET21a-671 II B and pET21a-671 I (4.15 and 4.17) confirms proper activity
of competent cells.
Another possible cause could be the contamination of the stock of pET21a-671 II A due
to improper handling. All pET21a-671 II A transformations of BL21(DE3) were performed with
extracted plasmid from the aforementioned stock. In figure 4.18 is displayed a Colony Screening
of transformed pET21a-671 II A colonies with amplified 671 gene. Furthermore, re-sequence of
1 2 3 4 5 6 7 8 9

42
the multiple cloning site of the same plasmid confirmed no alterations occurred to the target
sequence.
The occurrence of alterations on the remaining plasmid that could undermine the
induction process is, however, plausible. To assess this hypothesis, it should be performed a PCR
screening with different sets of primers that will amplify different areas of the plasmid.
4.10 Acquiring positives of pMAD del 671
Plasmid pMAD del 671 was constructed as it is described in sections 3.11 and 3.12.
Transformation to E.coli strain DC10b was performed according to section 3.5 and selected
colonies were screened via Colony Screening PCR with the primers pMAD1 and pMAD2. PCR
conditions were as stated in section 3.6.
Figure 4.20: Colony Screening PCR of pMAD del 671. 1 to 13- Amplification from transformed DC10b
with pMAD del 671. 14 DNA Ladder 15- Amplification from pMAD del 671 (positive control). 16-
Amplification from auto-ligated pMAD. 17- Amplification from pMAD digested with BamHI. 18-
Amplification from pMAD digested with EcoRI. 19- Amplification from pMAD del Sle1. 20-
Amplification from pMAD. 21- Control.
A positive colony of pMAD del 671 will amplify a DNA fragment of 2000bp (which
corresponds to the combined 1000bp Up region and 1000bp Down region). In figure 4.20, it is
possible to discern five DC10b colonies that display a 2000bp band amplification similarly to the
positive control pMAD del 671 (lane 1). Lanes 2, 3, 4 and 6 display a band of approximately
400bp which coincides to the amplification of the auto-ligated pMAD. The existence of
1 2 3 4 5 6 7 8 9 10 11 12 13 14 15 16 17 18 19 20 21
400 bp
2 000 bp

43
amplification product in digested pMAD plasmid implies that digestion with either BamHI or
EcoRI was incomplete.
Colonies positive for pMAD del 671 were stricken into fresh plates and plasmid DNA
was extracted using a Miniprep kit. It followed a digestion with restriction enzyme AvaI in order
to assess and Digestive Profile. Digestion with AvaI enzyme will result in two DNA fragments
with the following sizes.
Table 4.3: Size comparison (in bp) of DNA fragments produced by AvaI digestion
pMAD pMAD del 671
9202 9202
482 2488
Figure 4.21: Digestive Profile of pMAD del 671 by AvaI. 1- pMAD non-digested. 2- Digested pMAD. 3-
pMAD del 671 non-digested. 4- Digested pMAD del 671. 5- pMAD del 671 B non-digested. 6- Digested
pMAD del 671 B.
Figure 4.21 depicts the digestion of three plasmids by enzyme AvaI. All plasmids display
a band correspondent to the 9202bp DNA fragment. As expected, digested pMAD displays a
second band of approximately 500bp albeit barely visible. The remaining digested samples of
pMAD del 671 exhibit a second band above the 2000bp ladder size, which confirms the selected
positives.
1 2 3 4 5 6
500 bp
2 000 bp
9 000 bp

44
4.11 Sequencing of pMAD del 671
Sanger sequencing of plasmid pMAD del 671 was also performed in order to verify
coherence with the in-silico sequence. Primers NCTC671UpFwEcoRI (P1) and
NCTC671DwRevBamHI (P4) were used as forward and reverse primers, respectively. Provided
traces were assembled in Lasergene’s DNAStar software, SeqMan.
Assembly of pMAD del 671 traces with in-silico sequence showed 99% match with both
primers and coherence was verified.
4.12 Integration of pMAD del 671 in NCTC 8325-4 genome
After verified and sequenced positives of pMAD del 671, it followed the electroporation
of S.aureus strain RN4220, as demonstrated in section 3.13. Several colonies were selected for
phage transduction (section 3.14), at the end of which was obtaining the positives NCTC 8325-4
+ pMAD del 671.
It followed the gene Knock-out protocol as it is demonstrated in section 3.15. Verification
of integrated pMAD del 671 was verified via PCR screening from the extracted genomic DNA
(sections 3.17 and 3.16)
Samples were screened with two different sets of primers that will allow to determine in
which region, Up or Down, integration occurred. In table 4.4 it is demonstrated the obtained
amplification fragments per each pair of primers. For a given sample, the amplification of a
fragment of 3000bp with the set P1-pMAD2 and the amplification of a fragment of 2000bp with
the remaining set, will indicate the integration of plasmid pMAD del 671 occurred on the Down
region.
Table 4.4: pMAD del 671 integration according to each set of primer.
P1 – pMAD2 pMAD1 – P4
Integration Down 3000bp 2000bp
Integration Up 2000bp 3000bp
No integration 2000bp 2000bp
In figure 4.22 is depicted the agarose gel of the integration PCR screening. Samples were
loaded in gel following the sequence P1-pMAD2 sample / pMAD1-P4 sample, in order to
facilitate comparison of the resulting amplifications.
Sample pair 1 displays two amplification bands of approximately 2000bp which is expected
when no integration occurs. In sample pair 2 we see a band of approximately 3000bp amplified

45
by primer set pMAD1-P4 which corresponds to Up-region integration. Sample pair 3 shows a
band of 3000bp, which would suggest integration, but also a second band of 2000bp. This result
proposes the extracted DNA was retrieved from mixed colonies.
Figure 4.22: Integration Screening of pMAD del 671. 1- amplification pair negative integration. 2-
amplification pair positive for Up-region integration. 3- amplification pair with mixed colonies. 4-
amplification pair positive for Down-region integration.
Sample pair 4 displays a band of 3000bp amplified by primer set P1-pMAD2, which
corresponds to Down-region integration.
Four colonies NCTC 8325-4 that displayed positive integration (one displayed integration
by Up-region, and the remaining 3, Down-region integration) were selected and stricken to fresh
plates.
4.13 Excision of pMAD del 671
After confirmation of positive integration, it followed the excision procedure. Similarly to
the integration step, positive excised colonies were confirmed via PCR screening described in
section 3.17.
Samples were screened with primers forward NCTC671UpFwEcoRI (P1) and reverse
NCTC671DwRevBamHI (P4). These primers will amplify the DNA fragment that consists of
1000bp Upstream region and 1000bp Downstream region of gene 671.
In NCTC 8325-4 wildtype, these primers will also amplify gene 671, so the expected size
of the amplified fragment will be of 2000bp from regions Up and Down plus gene 671, which
amounts to approximately 3000bp fragment. In a successful excision of gene 671, the amplified
product will consist of a DNA fragment of 2000bp.
2 000 bp
1 2 1 3 4

46
Figure 4.23: PCR screening of NCTC Δ671. 1- amplification from screened sample A. 2- amplification
from screened sample B. 3- amplification from screened sample C. 4- amplification from pMAD del 671.
5- amplification from NCTC 8325-4 wildtype. 6- amplification from pMAD. 7- control.
In figure 4.23 is demonstrated the agarose gel of the PCR screening of samples A, B and
C. Sample A displays a band of approximately 3000bp which corresponds to the amplified
fragment Up-671-Down and is, therefore, a negative excised sample.
Samples B and C display a band of 2000bp which is the expected size amplified from a
positive sample, which consists of fragments Up-Down.
In total, ten confirmed NCTC 8325-4 Δ671 mutants were acquired.
2 000 bp
3 000 bp
1 2 3 4 5 6 7

47
5 Conclusion
Both plasmids of pET21a-671 and pMAD del 671 were successfully constructed. PCR
screening with the primers T7 promoter and T7 terminator confirmed positive insertion of gene
671 in the MCS of vector pET21a. Similarly, screening with the primers pMAD1 and pMAD2
confirmed proper insertion of fragment Up-Down in the vector pMAD.
The first vector for protein expression was pET21a-671 I, acquired by plasmid digestion with
enzymes XbaI and EagI. Sequencing, however, revealed an interruption of approximately 40bp
when assembled with the in-silico sequence. The cause disruption, that resulted in the loss of the
RBS and the start codon in the plasmid, was determined to be the erroneous digestion with enzyme
XbaI, in place of NheI. Despite the loss of the RBS and start codon, this plasmid managed a
successful protein expression.
The second vector, pET21a-671 II, was acquired by plasmid digestion with the proper
digestion with enzymes NheI and EagI. Of the obtained positives, two were selected and tested
for protein induction, pET21a-671 II A and pET21a-671 II B. Sequencing revealed the loss of
ORF in plasmid B that would result in the expression of a longer protein. No mismatched were
found in plasmid A. Both plasmids were able to successfully express protein in the first induction
assay, however, repetitions of the assay with plasmid A were unsuccessful. Due to these
inconsistencies in the expression of plasmid pET21a-671 II A, purification of the protein 671 was
not accomplished. The reasons behind the loss of expression ability of plasmid are yet to fully
assessed.
Future work will consist in the purification of protein 671 from a third pET21a-671 II
positive, plasmid C, followed by the assessment of the protein enzymatic profile by zymography.
Mutants NCTC 8325-4 Δ671 were obtained and confirmed via PCR screening. It follows the
characterization of the mutant by assessing cell growth rate comparatively to wildtype, and cell
morphology.

48
6 References
1. Murray P., Baron E., Jorgensen, H., Landry, L., Pfaller, A., Yolken, H. (Eds.). (2007).
Manual of Clinical Microbiology (9th ed.). Herdon, VA, United States of America:
American Society for Microbiology.
2. Del Rio, A., Cervera, C., Moreno, A., Moreillon, P., Miró, J.M. Patients at Risk of
Complications of Staphylococcus aureus Bloodstream Infection. Clinical Infectious
Diseases, 2009; 48: 246-53. DOI: 10:1086/598187
3. Guerrero, M., López, J., Goyenechea, A., Fraile, J., de Górgolas, M. Endocarditis caused
by Staphylococcus aureus: A reappraisal of the epidemiologic, clinical, and pathologic
manifestations with analysis of factors determining outcome. Medicine (Baltimore).
2009; 88(1):1-22. DOI: 10.1097/MD.0b013e318194da65.
4. Klein, E., Smith, D., Laxminarayan, R., Hospitalizations and Deaths Caused by
Methicillin-Resistant Staphylococcus aureus, United States, 1999–2005. Emerging
Infectious Diseases. 2007;13(12):1840-1846. DOI:10.3201/eid1312.070629.
5. EARSS management team. European Antimicrobial Resistance Surveillance System
database. Bilthoven, The Netherlands: National Institute for Public Health and the
Environment, 2008.
6. Lowy, F. Antimicrobial resistance: the example of Staphylococcus aureus. J Clin Invest.
2003; 111(9): 1265–73. DOI: 10.1172/JCI18535
7. Chambers, H. The changing epidemiology of Staphylococcus aureus. Emerg Infect Dis.
2001; 7(2): 178–82. DOI: 10.3201/eid0702.700178
8. Naber, C. Staphylococcus aureus Bacteremia: Epidemology, Pathophysiology, and
Management Strategies, 2007. Clinical Infectious Diseases: 2009; 48:231-7. DOI:
10.1086/598189
9. Deurenberg, R., Stobberingh, E. The evolution of Staphylococcus aureus. Infection,
Genetics and Evolution, 2008. 8: 747-763. DOI: 10.1016/j.meegid.2008.07.007.
10. Berger-Bächi, B., Rohrer, S. Factors influencing methicillin resistance in staphylococci.
Arch Microbiol. 2002. 178: 165-171. DOI: 10.1007/s00203-002-0436-0
11. Szewda, P., Schielmann, M., Kotlowski, R., Gorczyca, G., Zalewska, M., Milewski, S.
Peptidoglycan hydrolases-potential weapons against Staphylococcus aureus. Appl
Microbiol Biotechnol. 2012. 96: 1157-1174. DOI 10.1007/s00253-012-4484-3
12. Scheffers, D., Pinho, M. Bacterial Cell Wall Synthesis: New Insights from Localization
Studies. Microbiology and Molecular Biology Reviews. 2005, 69: 585-607. DOI:
10.1128/MMBR.69.4.585-607.2005
13. Weidenmaier, C., Peschel, A. Teichoic acids and related cell-wall glycopolymers in
Gram-positive physiology and host interactions. Nat Rev Microbiol. 2008. 6: 276–287.
DOI: 10.1038/nrmicro1861
14. Boneca, I. The role of peptidoglycan in pathogenesis. Current Opinion in Microbiology.
2005. 8: 46-53. DOI: 10.1016/j.mib.2004.12.008.
15. Chaput, C., Boneca, I. Peptidoglycan detection by mammals and flies. Microbes and
Infection. 2007. 9: 637-647. DOI: 10.1016/j.micinf.2007.01.022
16. Dziarski, R., Gupta, D. Mammalian PGRPs: novel antibacterial proteins. Cell
Microbiology. 2008. 8:1059–1069. DOI: 10.1111/j.1462-5822.2006.00726.x.
17. Kashyap, D., Wang, M., Liu, L., Boons, G., Gupta, D., Dziarski, R. Peptidoglycan
recognition proteins kill bacteria by activating protein-sensing two-component systems.
Natural Medicines. 2011. 17:676–683. DOI: 10.1038/nm.2357.
18. Atilano, M., Yates, J., Glittenberg, M., Filipe, S., Ligoxygakis, P. Wall Teichoic Acids
of Staphylococcus aureus Limit Recognition by the Drosophila Peptidoglycan
Recognition Protein-SA to Promote Pathogenicity. PLoS Pathog 2011. 7(12): e1002421.
DOI: 10.1371/journal.ppat.1002421.
19. Goodell, E., Schwarz, U. Release of cell wall peptides into culture medium by
exponentially growing Escherichia coli. J Bacteriol. 1985. 162: 391–397.

49
20. Vollmer, W., Joris, B., Charlier, P., Foster, S. Bacterial peptidoglycan (murein)
hydrolases. FEMS Microbiol Rev. 2008. 32: 259-286. Doi: 1 0.1111/j.1574-
6976.2007.00099
21. Bose, J., Lehman, M., Fey, P., Bayles, K. Contribution of the Staphylococcus aureus Atl
AM and GL Murein Hydrolase Activities in Cell Division, Autolysis, and Biofilm
Formation. PLoS ONE. 2012 7(7): e42244. DOI:10.1371/journal.pone.0042244
22. Atilano, M., Pereira, P., Vaz, F., Catalão, M., Reed, P., Grilo, I., Sobral, R., Ligoxygakys,
P., Pinho, M., Filipe, S. Bacterial autolysins trim cell surface peptidoglycan to prevent
detection by the Drosophyla innate imune system. eLife 2014, 3:e02277. DOI:
10.7554/eLife.02277.
23. Kajimura, J., Fujiwara, T., Yamada, S., Suzawa, Y., Nishida, T., Oyamada, Y., Hayashi,
I., Yamagishi, J., Komatsuzawa, H. and Sugai, M. Identification and molecular
characterization of an N-acetylmuramyl-L-alanine amidase Sle1 involved in cell
separation of Staphylococcus aureus. Molecular Microbiology, 2005. 58: 1087–1101.
DOI:10.1111/j.1365-2958.2005.04881.x
24. Heilmann, C., Hartleib, J., Hussain, M., Peters, G. Multifunctional Staphylococcus
aureusAutolysin Aaa Mediates Adherence to Immobilized Fibrinogen and Fibronectin.
Infection and Immunity. 2005. 73(8): 4793-4802. DOI: 10.1128/IAI.73.8.4793-
4802.2005.
25. Frankel, M., Schneewind, O. Determinants of Murein Hydrolase Targeting to Cross-wall
of Staphylococcus aureus Peptidoglycan. J Biol Chem. 2012; 287(13): 10460-10471.
DOI: 10.1074/jbc.M111.336404
26. Liu et al., Lysin Motif–Containing Proteins LYP4 and LYP6 Play Dual Roles in
Peptidoglycan and Chitin Perception in Rice Innate Immunity. The Plant Cell Online.
2012. 24(8): 3406-3419 DOI: 10.1105/tpc.112.102475
27. Scott, J., Barnett, T. Surface Protein of Gram-Positive Bacteria and How They Get There.
Annu. Rev. Microbiol. 2006. 60: 397-423. DOI:
10.1146/annurev.micro.60.080805.142256.

50
Anexes
A. 1 Kb Plus DNA Ladder (Thermo Scientific)
B. GeneRuler 1kb DNA Ladder (Thermo Scientific, catalog number: SM0312)

51
C. Precision Plus Protein Dual Color Standarts (PPPS) (Bio-Rad Laboratories, catalog
number: 161037)
D. Miniprep Kit: Wizard Plus SV Minipreps DNA Purification Systems (Promega
Corporation, catalog number: A1465)
Centrifugation Protocol
Production of Cleared Lysate
1. Pellet 1–10ml of overnight culture for 5 minutes.
2. Thoroughly resuspend pellet with 250μl of Cell Resuspension Solution.
3. Add 250μl of Cell Lysis Solution to each sample; invert 4 times to mix.
4. Add 10μl of Alkaline Protease Solution; invert 4 times to mix. Incubate 5 minutes at room
temperature.
5. Add 350μl of Neutralization Solution; invert 4 times to mix.
6. Centrifuge at top speed for 10 minutes at room temperature.
Binding of Plasmid DNA
7. Insert Spin Column into Collection Tube.
8. Decant cleared lysate into Spin Column.
9. Centrifuge at top speed for 1 minute at room temperature. Discard flowthrough, and reinsert
Column into Collection Tube.
Washing
10. Add 750μl of Wash Solution (ethanol added). Centrifuge at top speed for 1 minute. Discard
flow through and reinsert column into Collection Tube.
11. Repeat Step 10 with 250μl of Wash Solution.

52
12. Centrifuge at top speed for 2 minutes at room temperature.
Elution
13. Transfer Spin Column to a sterile 1.5ml microcentrifuge tube, being careful not to transfer
any of the Column Wash Solution with the Spin Column. If the Spin Column has Column Wash
Solution associated with it, centrifuge again for 1 minute at top speed, then transfer the Spin
Column to a new, sterile 1.5ml microcentrifuge tube.
14. Add 100μl of Nuclease-Free Water to the Spin Column. Centrifuge at top speed for 1 minute
at room temperature.
15. Discard column, and store DNA at –20°C or below
E. Clean Up Kit: Wizard SV Gel and PCR Clean-Up System (Promega Corporation,
catalog number: A9285)
Gel Slice and PCR Product Preparation
A. Dissolving the Gel Slice
1. Following electrophoresis, excise DNA band from gel and place gel slice in a 1.5ml
microcentrifuge tube.
2. Add 10μl Membrane Binding Solution per 10mg of gel slice. Vortex and
incubate at 50–65°C until gel slice is completely dissolved.
B. Processing PCR Amplifications
1. Add an equal volume of Membrane Binding Solution to the PCR amplification.
Binding of DNA
1. Insert SV Minicolumn into Collection Tube.
2. Transfer dissolved gel mixture or prepared PCR product to the Minicolumn assembly. Incubate
at room temperature for 1 minute.
3. Centrifuge at 16,000 × g for 1 minute. Discard flowthrough and reinsert Minicolumn into
Collection Tube.
Washing
4. Add 700μl Membrane Wash Solution (ethanol added). Centrifuge at 16,000 × g for 1 minute.
Discard flowthrough and reinsert Minicolumn into Collection Tube.
5. Repeat Step 4 with 500μl Membrane Wash Solution. Centrifuge at 16,000 × g for 5 minutes.
6. Empty the Collection Tube and recentrifuge the column assembly for 1 minute with the
microcentrifuge lid open (or off) to allow evaporation of any residual ethanol.
Elution
7. Carefully transfer Minicolumn to a clean 1.5ml microcentrifuge tube.
8. Add 50μl of Nuclease-Free Water to the Minicolumn. Incubate at room temperature for 1
minute. Centrifuge at 16,000 × g for 1 minute.
9. Discard Minicolumn and store DNA at 4°C or –20°C.