
The Role of Mineral Fertilizers in Transforming Philippine …€¦ · · 2014-02-205th Floor,...
25
For comments, suggestions or further inquiries please contact: Philippine Institute for Development Studies Surian sa mga Pag-aaral Pangkaunlaran ng Pilipinas The PIDS Discussion Paper Series constitutes studies that are preliminary and subject to further revisions. They are be- ing circulated in a limited number of cop- ies only for purposes of soliciting com- ments and suggestions for further refine- ments. The studies under the Series are unedited and unreviewed. The views and opinions expressed are those of the author(s) and do not neces- sarily reflect those of the Institute. Not for quotation without permission from the author(s) and the Institute. The Research Information Staff, Philippine Institute for Development Studies 5th Floor, NEDA sa Makati Building, 106 Amorsolo Street, Legaspi Village, Makati City, Philippines Tel Nos: (63-2) 8942584 and 8935705; Fax No: (63-2) 8939589; E-mail: [email protected] Or visit our website at http://www.pids.gov.ph February 2014 DISCUSSION PAPER SERIES NO. 2014-14 The Role of Mineral Fertilizers in Transforming Philippine Agriculture Roehlano M. Briones
-
Upload
hoangtuyen -
Category
Documents
-
view
217 -
download
3
Transcript of The Role of Mineral Fertilizers in Transforming Philippine …€¦ · · 2014-02-205th Floor,...

For comments, suggestions or further inquiries please contact:
Philippine Institute for Development StudiesSurian sa mga Pag-aaral Pangkaunlaran ng Pilipinas
The PIDS Discussion Paper Seriesconstitutes studies that are preliminary andsubject to further revisions. They are be-ing circulated in a limited number of cop-ies only for purposes of soliciting com-ments and suggestions for further refine-ments. The studies under the Series areunedited and unreviewed.
The views and opinions expressedare those of the author(s) and do not neces-sarily reflect those of the Institute.
Not for quotation without permissionfrom the author(s) and the Institute.
The Research Information Staff, Philippine Institute for Development Studies5th Floor, NEDA sa Makati Building, 106 Amorsolo Street, Legaspi Village, Makati City, PhilippinesTel Nos: (63-2) 8942584 and 8935705; Fax No: (63-2) 8939589; E-mail: [email protected]
Or visit our website at http://www.pids.gov.ph
February 2014
DISCUSSION PAPER SERIES NO. 2014-14
The Role of Mineral Fertilizersin Transforming Philippine Agriculture
Roehlano M. Briones

THE ROLE OF MINERAL FERTILIZERS IN TRANSFORMING PHILIPPINE AGRICULTURE
Roehlano M. Briones1
ABSTRACT. Fertilizer policy in the country has evolved from pervasive interventionism in the 1970s to today's market-oriented regime. Government has abandoned price policies and subsidies, focusing rather on standard-setting, quality regulation, and training. Over the same period domestic demand for fertilizer has continually been increasing, though recently resurgent fertilizer prices has reduced total utilization. Evidence suggests that farmers are under-applying fertilizer, thereby forfeiting efficiency gains at the margin. On the supply side, imports have in the past few decades emerged as the main source of fertilizer, as domestic production has dwindled. With deregulation, numerous private sector players have taken over the distribution of fertilizers; analysis of the supply chain points to low marketing margins. Integration analysis fails to find systematic arbitrage opportunities between the domestic and world markets. Within the domestic market however, there remain large disparities in prices across regions. Priorities for research and policy are therefore understanding the behavior of farmers in terms of fertilizer application, and addressing internal price disparities, perhaps by improved transport infrastructure and logistics.
Keywords: fertilizer policy, fertilizer demand, competition, market integration
1 Senior Research Fellow, Philippine Institute for Development Studies. This study was conducted as part of the "Initiative on the Role of Fertilizer and Seeds in Transforming of Agriculture in Asia, implemented as part of the Regional Strategic Analysis and Knowledge Support Systems in Asia Program (ReSAKSS-Asia)." Comments from Balu Bumb are gratefully acknowledged. The usual disclaimer applies.

1
1. OVERVIEW
Despite past gains, performance of Philippine agriculture today leave much to be desired. Poverty remains widespread, especially in rural areas; in 2009 poverty among agricultural households is estimated at 56.8%, whereas poverty among non-agricultural households is only 17.1% (Reyes et al, 2012). A lasting solution to mass poverty will still require sustained growth in agriculture.
In the past, fertilizer has made a tremendous contribution to agricultural transformation. What is its future role in the continuing development of Philippine agriculture? In particular, what is its role in improving competitiveness – a key dimension of development in view of the tension between self-sufficiency targeting (again in vogue since 2008) and global integration. Several major crops, which include the biggest users of fertilizer, namely rice, corn, and sugarcane, are import-competing. This raises the following questions:
Are farmers applying the right amount of fertilizer? Economic theory shows that fertilizer use is optimized when its marginal contribution (in value terms) equals its price. Too much or too little application of fertilizer may raise cost per unit output, and erode its competitiveness vis-a-vis foreign suppliers.
Is price of fertilizer too high? The Philippine Development Plan highlights “high cost of production inputs” as a key constraint in Philippine agriculture. Is fertilizer contributing to this high cost of inputs? In a competitive market, the price of fertilizer (relative to outpput) will be brought down to its marginal product; in the presence of market power, price may not be competed down to this benchmark. Is market structure a factor in keeping fertilizer prices high? Perhaps there are still policies that introduce barriers to entry and related distortions in the fertilizer market. Lastly, linking the answers to these questions to action: what types of policies should be implemented to facilitate the role of fertilizer in agricultural transformation?
The study will rely on review of the literature as well as analysis of secondary data from various sources, namely: Bureau of Agricultural Statistics (BAS); Fertilizer and Pesticide Authority (FPA); and Food and Agriculture Organisation (FAO). Information that is not available from desk review, e.g. price-cost margins along the supply chain, market structure by node of the chain, etc., may be elicited based on interviews of key informants.
2. EVOLUTION OF FERTILIZER POLICY
2.1. Evolution of the sector and policy regime
During the postwar period, growing fertilizer demand was mostly met by increasing domestic production, supported by incentives and price policies.
David and Balisacan (1981) summarize the post-war history of the fertilizer industry up to the 1970s. During the 1950s, the fertilizer industry was regarded as a "new and necessary" industry exempted from taxes and customs duties. Furthermore, market policies in the form of controls and tariffs on fertilizer imports raised the domestic price of fertilizer. Government also extended subsidies, e.g. distribution of discounted fertilizers to sugar planters cooperatives.
In 1972, the petroleum price shock led to a four-fold jump in the world price of fertilizer; simultaneously there was a global supply shock, which affected the country, leading to a

2
20% reduction in rice output. In 1973, government directly intervened in the fertilizer industry, first establishing a Fertilizer Industry Authority to regulate prices, imports, production, and marketing. Over the next two years, the Authority imposed two-tier pricing: with food producers able to access fertilizer at an administered price which was lower than the market price. A supervised credit program was simultaneously launched, which incorporated a fertilizer subsidy.
After the lapse of the two-tier policy, the Authority continued its price – targeting policy by controlling the level of imports. The quantitative restriction (QR) was allocated to domestic producers and authorized importers. Meanwhile domestic producers were exempted from controls and duties on imports of raw materials. Government also compensated domestic fertilizer producers for losses incurred from administered pricing.
In 1977, the FIA was reorganized into the Fertilizer and Pesticide Authority (FPA) by virtue of PD 1144. The PD assigned FPA a regulatory function over both fertilisers and pesticides to ensure the safety and efficacy of products sold in the market. However it continued to assign broad powers to the Authority to "determine and set the volume of prices both wholesale and retail, of fertilizer and fertilizer inputs".
Since 1986, government has implemented a series of reforms which allowed a much greater scope for market allocation and pricing.
The resumption of democracy in 1986 initiated a reversal in government policy in agriculture. For fertilizer this was seen in the liberalization of the industry, where FPA ceded administrative controls and focused on developmental support (Alcala, 2012). The QR on imports were abandoned (Office of the President, 1992), and with it the price-setting function of the Authority. Import duties were also reduced, over a series of tariff reduction programs. Currently applied rates are in the range of 1 to 3% (Table 1). The Agriculture and Fisheries Modernization Act (AFMA) of 1997 furthermore allows duty-free importation by enterprises engaged in agriculture, conditional on direct use by these enterprises, i.e. plantations, aquaculture operators, farmer cooperatives, etc.
Table 1: Tariff rates for fertilizer products, Philippines (as of 2013)
AHTN No Item MFN rate FTA partner ratea
3102.10.00 Urea 1 0
3102.21.00 Ammonium Sulphate 3 0
3103.10.10 Superphosphate 1b 0
31.04 Potassic fertilisers 1 0
3105.20.00 Blended fertilisers 3 0 a ASEAN countries, plus Australia, China, Japan, Korea, and New Zealand. India is a free trade partner by virtue of the ASEAN India Free Trade Agreement; however fertilizer imports from that country are levied MFN rates. bFor feed grade superphosphate, the tariff rate is 7%.
Source: Tariff Commission.
Together with opening the domestic market to foreign competition (thus making fertilizers cheaper), government has retreated from extending fertilizer subsidies. The remaining incentive for the sector is indirect: sale and importation of fertilizers are exempted from the national value added tax of 12%. (Other agri-chemicals, e.g. pesticides, are subject to VAT.)

3
2.2. Current regulatory regime
FPA regulations on importation and manufacture are directed towards maintaining product quality and standards.2
The FPA no longer requires an import permit; what is requires is licensing of fertilizer importer-distributors, and mandatory product registration. Obtaining an import license should take not more than three days, subject to the following requirements:
• Duly accomplished and notarized application form (original copy) with Documentary stamps required
• Business Name registration Certificate (SEC/DTI/Cooperative)
• Copy of latest Income Tax Returns (ITR) and Financial Statements (FS)
• Copy of Distributorship Agreement/ Certification with mother Company
• List of distributors and dealers per province by region (for Importer-Distributors)
• Product Registration approval of all fertilizer grades to be sold
• Inspection and recommendation by the FPA Regional / Provincial Officer on their area coverage
• Registration of Fertilizer Warehouse
• Filing and License Fee
A similar checklist of requirements applies for fertilizer distributors. To obtain fertilizer product registration, the importer must specify the following:
• Schematic diagram/production process
• Sample of the product for confirmatory analysis at any FPA accredited laboratory
• Proposed label or bag
• Certificate of analysis from the source/country of origin
• Brochure/pamphlets of exporting/manufacturing firm or company profile
• Test for pathogens
• Bioefficacy data: test crop
• Experimental Use Permit (if applicable)
• Completeness of data
• Filing and registration fee
The license is valid for one year and renewable,
Meanwhile product registration is valid for three years. For renewal, the applicant must update FPA of any changes in the foregoing, and submit a recent chemical analysis. A similar checklist of requirements is applied for registration of locally manufactured products. The entire process should take not more than 65 days for renewal and 265 days for new products. 2 This sub-section is based on the Citizen's Charter of the FPA (FPA, 2013).

4
The FPA has a fixed schedule of fees, ranging form approximately $15 - $200, for various permits and licenses. As can be seen the above requirements appear straightforward. Despite these apparently strict licensing and registration requirements, the problem of adulterated or substandard fertilizers is still being raised by some stakeholders in the fertilizer industry, which the FPA is trying hard to address in cooperation with legitimate fertilizer handlers (Alcala, 2012).
3. DEMAND-SIDE ISSUES
3.1. Utilization of fertilizer
Fertilizer consumption has been increasing over the past decades, punctuated by some sharp declines due to external shocks.
From 1950 to 1980, fertilizer consumption grew by nearly 8% per year for all crops. Demand was met initially by imports; domestic production began in the 1950s, as three fertilizer plants were established, and a fourth was added in 1966. The share of imports in consumption fell from 100% in 1950 to only 41% by the end of the 1960s. Up to that period, most of the fertilizer was absorbed by the export crop sector, with sugarcane farming being the largest buyer. From the 1970s imports began to account for most of the growth in fertilizer supply, rising to 75% in the early 1980s; moreover the composition shifted to urea reflecting increasing utilization of fertilizer for rice production (David and Balisacan, 1981).
Figure 2 presents estimates of fertilizer consumption using supply and utilization accounts from BAS. Consumption is proxied by net supply, i.e. production plus net imports. Obviously this indicator is flawed due to failure to account for changes in inventory the alternative, which is fertilizer sales, is perhaps less reliable owing to under-reporting by companies, and should be used only when better indicators are unavailable.3
Figure 1: Annual consumption of fertilizer in '000 tons, 1990 - 2012
Source: BAS.
3 Interview with Lora Japon, FPA Planning Division.
0
500
1,000
1,500
2,000
2,500
3,000
1990 1992 1994 1996 1998 2000 2002 2004 2006 2008 2010 2012P
Production Net imports

5
Consumption has been on an upward trend since 1990, suffering a major decline in 1998 due to the nationwide drought brought about by El Nino. Consumption subsequently recovered to a peak of 2.6 million tons in 2004. Since then consumption has declined, with another abrupt drop in 2008 when fertilizer prices soared in the world market. There was some recovery in subsequent years (note that 2012 figures are still preliminary.)
Also noticeable in Figure 1 is the diminishing importance of domestic production in meeting demand. Domestic production peaked in 1996; during 1994 – 1996, domestic production , accounted for at least 70% of consumption. In contrast, in 2008 – 2010 the share of domestic production in consumption dropped to an average of 12%. Further discussion of sources of supply is provided in Section 4 (on supply-side issues).
The main type of fertilizer consumed has usually been nitrogen-based; until recently, next in importance are phosphate-based fertilizers.
Data from FPA provide a breakdown in fertilizer consumption by type (Figure 2). This data set only considers the major types, namely: 0-0-60 (potassium sulfate), 14-14-14 (complete NPK), 16-20-0 (ammonium phosphate), 18-46-0 (diammonium phosphate), 21-0-0 (ammonium sulfate), and 46-0-0 (urea). Unfortunately at this level of disaggregation, the sum of production and net exports is problematic (i.e. negative for some years), hence consumption is proxied by fertilizer sales. While this proxy underestimates actual levels, it may not be inaccurate as an indicator of changes over time as well as composition. Consistent with the earlier data on consumption, fertilizer sales undergoes a trend increase from the 1980s to the 1990s, peaking in 1997 (2 million tons), then drop in 1998 was due to a severe drought. Quantity sold remained within the neighborhood of the peak (1.5 – 1.9 million tons) until 2005, during sales dropped, up to 2010.
Figure 2: Utilization of fertilizer by major type, 1980 - 2012
Source: BAS.
Meanwhile the largest shares in consumption are urea and ammonium sulfate ; these two account for about 50% of quantity sold in recent years. The next in rank is complete NPK fertilizer, accounting for one-fifth to a quarter of fertilizers sold by volume.
The importance of nitrogen-based fertilizers is confirmed by FAO data (Figure 3), which looks at net supply (adjusted further for non-fertilizer use). Units are nutrient weight (nitrogen, phosphate, and potash equivalents). Nitrogen fertilizer accounts for the bulk of
0.0
500.0
1,000.0
1,500.0
2,000.0
2,500.0
1980 1985 1990 1995 2000 2005 2010
0-0-60 14-14-14 16-20-0 18-46-0 21-0-0 46-0-0

6
consumption. From 2002 the next most important nutrient was phosphate; the sharp drop in overall consumption in 2008 was accompanied by substitution away from phosphate to potash fertilizers, which now accounts for the second largest share in nutrients consumed.
Figure 3: Fertilizer consumption in the Philippines, by type of nutrient, '000 nutrient-tons
Source: FAOStat
By crop, the major users of fertilizer are cereals, for which fertilization rate per ha has been fairly stable except for a sharp drop in 2008.
According to Mojica (2006), about 60% of fertilizer consumption goes to food crops, mainly rice and corn; this is consistent with Olegario (2012), which estimates that rice accounts for 38% of fertilizer use, followed by maize (21%). The next major users are fruits and vegetables, at 19%; sugar accounts for 7%, while other crops, 15%. Official time series data is available for fertilizer utilization of the main cereals (Figure 4 and Figure 5).
Figure 4: Fertilization rate in bags/ha for paddy rice, 2003 - 2012
Note: 1 bag = 50 kg.
Source: CountrySTAT.
0
200
400
600
800
1000
2002 2003 2004 2005 2006 2007 2008 2009 2010 2011
Nitrogen Fertilizers (N total nutrients)
Phosphate Fertilizers (P205 total nutrients)
Potash Fertilizers (K20 total nutrients)
00.5
11.5
22.5
33.5
44.5
5
2003 2004 2005 2006 2007 2008 2009 2010 2011 2012
Urea Ammosul (21-0-0) Ammophos (16-20-0)
Complete (14-14-14) Others

7
Figure 5: Fertilization rate in bags/ha for maize, 2003 - 2012
Source: CountrySTAT.
For both paddy rice and maize, fertilizer application has ranged between 4 to 5 bags (200 – 250 kg) per ha, with paddy rice being slightly higher. In both, the biggest item is for urea, about 100 kg/ha in either crop. The next biggest category is complete NPK fertilizer, between 70 – 80 kg/ha for paddy rice, and 55 – 65 kg/ha for maize.
Fertilizer consumption (per ha and as a share in total cost) is also significant for other major crops, most notably sugarcane, some fruits, commercial crops, and temperate vegetables.
Table 2 reports fertilization rates by major crop from an FAO dataset. These rates are not directly comparable with those in Figure 4 and 5 as these are measured by actual nutrient applied (rather fertilizer quantity). By proportion of area harvested, extent of fertilizer application is widest in rice, followed by sugarcane, maize, palm oil, potato, and tobacco.
Table 2: Extent and rate of fertilizer application, by type of nutrient, 2001
Application, extent of area harvested
(% total)
Fertilization rate (kg/ha) Nitrogen Phosphorus Potassium
Rice 85 51 15 11 Sugarcane 80 85 55 30 Maize 80 58 16 10 Palm oil 80 75 25 70 Potato 80 85 55 45 Tobacco 80 75 20 55 Cocoa 50 85 45 45 Fruits 50 75 35 40 Vegetables 50 0.1 0 0 Coffee 40 0 0 0 Rubber 40 25 15 80 Coconut 30 20 15 10 Other crops 30 25 15 10 Groundnut 20 40 30 20 Soya 20 20 30 10
Source: FAO FertiSTAT.
0.0
0.5
1.0
1.5
2.0
2.5
3.0
3.5
4.0
4.5
5.0
2003 2004 2005 2006 2007 2008 2009 2010 2011 2012
Urea Ammosul Ammophos Complete Others

8
Highest nitrogen fertilizer rate is found for sugarcane, potato, and cocoa. Sugarcane also exhibits highest fertilization rate for Phosphorus at 55 kg/ha (together with potato); highest fertilization rate for Potassium is Rubber, followed by Palm oil.
Fertilizers account for a substantial but not dominant share in production cost; the highest shares are observed for fruits and vegetables, and lowest for root crops, with cereals in between (about 10 – 15% share).
While a time series for utilization by crop is not available, a time series on cost and returns by crop provides information on fertilizer cost, from which share in total cost can be readily calculated (Table 3).
Table 3: Fertilizer cost as a share in total cost, 2002 – 2011 (%)
2002 2004 2006 2008 2010 2011
Area harvested (ha)
Cereals
Maize 13.8 19.1 20.6 29.8 14.8 15.7 4,690,000
Palay 8.3 12.7 13.9 16.1 10.0 11.1 2,593,000
Fruits
Watermelon 14.4 20.3 22.4 30.6 21.5 25.4 6,102
Mango 9.8 14.1 15.8 15.8 20.1 23.6 187,073
Pineapple 16.9 24.1 27.6 27.6 21.8 21.3 58,456
Papaya 20.6 27.8 29.5 34.4 24.0 19.1 8,647
Duriaan 9.3 14.9 17.1 23.5 15.8 18.0 19,001
Calamansi 8.1 12.1 13.0 15.4 9.5 9.9 21,141
Root crops
Cassava 6.0 8.7 9.5 16.2 10.7 11.2 221,235
Sweet Potato 5.5 8.1 8.8 14.1 8.6 8.6 439,698
Vegetables and others
Tomato 17.1 22.9 25.8 34.2 24.8 27.2 17,548
French beans 9.3 13.3 14.6 18.8 22.2 25.8 3,621
Cabbage 16.0 20.5 21.3 33.0 24.4 24.4 8,550
Carrots 13.2 18.1 19.9 29.6 21.3 23.4 4,947
Potato 12.0 15.8 17.8 26.1 22.3 22.1 58,456
Eggplant 26.2 18.3 20.1 28.2 21.0 21.3 21,377
Cauliflower 13.5 20.5 22.2 29.8 21.7 20.0 1,067
Ampalaya 9.5 13.9 15.2 21.4 14.6 18.2 10,877
Onion Bulb n.a. n.a. 16.0 20.4 16.7 14.9 14,641
Onion Native n.a. n.a. 10.4 13.1 9.5 10.9 14,641
Garlic n.a. n.a. 9.7 15.5 9.5 10.1 2,830
Stringbeans 5.1 7.7 8.6 13.5 8.5 9.9 14,298
Peanut 1.2 1.8 2.0 3.2 1.9 2.3 26,902
Mungbean 0.4 0.6 0.6 0.9 0.5 0.6 45,283
Coffee 13.7 18.9 20.9 26.1 17.2 20.4 119,637
Note: n.a. – not applicable. Source of basic data: CountrySTAT.

9
Note that cost and returns is anchored on survey data on intermittent years; costs are interpolated on in-between years by revaluing the fixed input quantity. Hence the rising cost share of fertilizer over the 2000s up to 2008 is due to rising price of fertilizers; since then fertilizer's cost share has fallen together with a decline in fertilizer price.
The crops with the largest area harvested by far are the cereals, but fertilizer takes up only 11 – 16% of total cost of these crops (its share in cost of Maize peaked at nearly 30% in 2008). The next largest area harvested figures are posted by the root crops, but fertilizer accounts for only 9 – 11% of cost; this is already much higher than the cost shares of fertilizer in 2002 (about 5 – 6%.)
As for fruits, the top two in the data set (mango and pineapple) in terms of area also have high shares of fertilizer in total cost (above 20%). Meanwhile among the vegetables, crops with fertilizer cost shares above 20% account for nearly 116,000 of area harvested; vegetable crops also include some of the lowest fertilizer users (namely mungbean and peanut). Only one commercial crop, namely coffee, is found in the data set; fertilizer accounts for 20% of production cost of this crop.
3.2. Fertilizer application: impact and efficiency
Fertilizers combined with adoption of modern varieties was and remains a major contributor to agricultural productivity.
The introduction of high yielding varieties during the Green Revolution (beginning in the the late-1960s) was the impetus for adopting modern production practices, including fertilizer application. A study of Philippine rice farmers found that, prior to dissemination of IR-8 – the prototypical "miracle rice" variety – only 14% of sampled farmers applied fertilizer before transplanting, while 41% applied fertilizer after transplanting (Castillo, 1975; citing Sumayao, 1969). For the same group of farmers, in their fourth season of planting IR-8, 37% applied fertilizer before transplanting, and 54% applied after transplanting .
Studies compiled by Barker, Herdt, and Rose (1985) show that (with a few exceptions), modern varieties did not systematically have lower yields in the absence of fertilizer. Moreover modern varieties consistently have higher yields, larger yield increases, higher maximum yield fertilizer levels, and higher average productivity of fertilizer. The average maximum yield increase due to fertilizer during the dry season is 3.1 tons/ha in the case of modern varieties, but only 0.7 tons/ha for traditional varieties. The increment is smaller during the wet season but still substantial (1.2 tons/ha for modern varieties, compared to 0.3 tons/ha for traditional varieties).
In terms of average productivity, the ratio of kg of rice per kg fertilizer was higher for modern varieties by 8.9 kg rice/kg fertilizer during the dry season; for the wet season the difference was 6.2 kg rice/kg fertilizer. The coefficient of variation of yield imply that modern variety yields are less variable than traditional variety yields; that is, at any given level of applied fertilizer, there is a higher probability of receiving the expected yield with the modern varieties than with the traditional varieties.
In short, the primary innovation of the Green Revolution was the introduction of a set of rice varieties characterized by higher yield as well as superior yield-response to fertilizers. In the late 1960s rice was (as now) a key crop, accounting for 29% of agriculture GVA. From 1965 to 1980, the country's rice output grew by 3.27 million t over the period 1965 – 1980. Of this increment, 1.01 million t or 30% could be attributed to increased fertilizer use (Herdt and

10
Capule, 1983).
These findings continue to hold in the post-Green revolution period, i.e. fertilizer continues to contribute significantly to output. A panel data set covering the period 1995 – 2002 generated an estimate of output elasticity of fertilizer application of 0.03 (Yao and Shively, 2007). Using another panel data set spanning the period 1996 – 2007, Mariano et al (2010) estimate the output elasticity of fertilizer for irrigated systems at 0.08.
In the case of rice, where small farmers are most experienced in adoption of modern technologies, fertilizers are apparently being applied at below optimum levels.
A number of studies indicate that Filipino rice farmers are applying insufficient quantities of fertilizer. In one IRRI study (conducted in the latter half of the 1990s), farmer's practice is contrasted with site-specific nutrient management (SSNM), defined as the dynamic field-specific management in a particular cropping season to optimize supply and demand according to their variation in time and space. SSNM led to a significantly larger fertilizer cost; in their sample, rates of N were similar in SSNM and farmer practice (about 110 kg/ha), but more P and K were applied in the first year, Average fertilizer cost in SSNM was 45% higher than under farmer practice. In general farmer practices tended to remain unbalanced, applying an average of 30% less P and 130% less K than SSNM.
The analysis of Pingali et al (1998) compares marginal productivity of fertilizer with the ratio of fertilizer to rice prices. In 1985 and 1986, based on farm-level data, the marginal product of fertilizer was estimated at 15.3 during the wet season, and 8.3 during the dry season, evaluated at the sample means (84.2 kg/ha and 133.6 kg/ha during dry and wet seasons, respectively). The marginal product is far above the ratio of fertilizer to paddy rice price of 4.1. Fertilizers are still contributing positively to profitability of rice farming; on the other hand, this implies that fertilizer is being underutilized in Philippine farms. In contrast, for Indonesian farms, the marginal product is close to the input/output price ratio. Average fertilizer application in the Indonesia sample is 176 kg/ha in irrigated areas, whereas in the Philippines the average harvest (wet and dry seasons) is 109 kg/ha.4
Another IRRI study suggests that even N management may be wanting among Filipino rice farmers (Dawe et al, 2007). Data from a rice farmer survey spanning 1988 – 2002 is contrasted with computed optimal N based on experimental trials. The comparison suggesting that farmers tend to overapply N during the wet season and under-apply N during the dry season (31 to 55 kg gap from optimal). For irrigated areas, bridging the gap may result up to one-ton yield increment - a substantial increase (compared with the yield of irrigated systems in 2012 of 4.2 tons/ha).
What accounts for this systematic under-application of fertilizer is not clear. Mataia and Dawe (2007) rule out one possible reason, which is access to credit. Another potential explanation, namely risk aversion, has been ruled out in Abedullah and Pandey (2004) at least for the case of favorable rainfed environment in the Philippines. Their work however is based on a standard expected utility maximization framework (in mean-variance form), which may not be able to capture the full range of behavior of farmers (Bocqueho, Jacquet, and Reynaud, 2013). Deeper analysis is needed to resolve this puzzle.
4 Likewise, FAO FertiSTAT data for 2001 indicates fertilizer application in paddy rice areas to be only 51 kg/ha; in contrast, in Indonesia application was more than double that for the same year, at 105 kg/ha.

11
4. SUPPLY-SIDE ISSUES
4.1. Sources of fertilizer supply
As discussed previously, domestic production used to account for over 70% of net supply; now the share is down to 30% or lower. Currently domestic production is sourced from five firms (Table 4). The largest is PHILPHOS, originally a Philippine government corporation established in 1980, later in joint venture with the Republic of Nauru (a major source of phosphate rock). PHILPHOS produces for both the export and domestic market; located in the Visayas island group in Central Philippines, it is able to distribute its products all over the country. It was later privatized in 2000. Among the newer players, the next largest capacity belongs to Soiltech, the market leader in domestically produced fertilizer in the Northern island of Luzon. Other companies (also based in Luzon) producer smaller quantities of various common and specialty fertilizers. Clearly there are large scale economies at work, limiting the number of domestic manufacturers; however the market as a whole need not be an oligopoly if there is strong competition from imports.
Table 4: Capacity and products of fertilizer manufacturers in the Philippines (2012)
Company Capacity (tons/year)
Products
AFC 45,000
30,000
80,000
75,000
Single superphosphate
Ammonium sulfate
Complete NPK
Ammonium phosphate
Farmfix Fertilizer 50,000 Fertilizer blends
Inchem 22,000 Potassium sulfate
PHILPHOS 1.17 million NP fertilizers, NPK fertilizers, Ammonium sulfate
Soiltech Agricultural Products 1 million NPK fertilizers: 14-14-14, 16-20-0, 6-9-15
Sources: FPA; company websites
Fertilizer imports by value have been rising, reaching a peak in 2008, declining in 2009 as the domestic market adjusts to the high fertilizer prices; since then imports have recovered (Figure 9). Exports are far lower with a much more erratic trend (but an upward rise remains discernible). Imports are mostly sourced from ASEAN, and other free trade partners, i.e. China, Japan, Korea, and Australia, for which the import duty is zero. China is by far the largest source of imports of the Philippines. Free trade partners account for 89% of fertilizer imports of the country by value. Hence, together with the tariff exemption of agricultural enterprises, imports of fertilizers into the Philippines are effectively duty-free.
The main type of fertilizer imported (by value) is nitrogenous fertilizer, consistent with fertilizer usage patterns shown in Section 3. The Philippines has no domestic source of ammonium, as any natural gas deposits are prioritized for use by the power and fuel industry. Domestic production depends mainly on imported raw materials such as rock

12
phosphate, anhydrous ammonia, sulfuric acid and other finished fertilizer grades which are needed in the blending process of fertilizer production (Alcala, 2012).
Figure 6: Imports and exports of fertilizer, 2001 – 2012 (in $US)
Source: Trademap.
Figure 7: Fertilizer imports by product type, 2001 – 2012 (in $US)
Source: Trademap.
4.2. The fertilizer supply chain and market structure
Fertilizer marketing passes through three levels, namely: importers/manufacturers; distributors/wholesalers; and dealers/retailers (Figure 8). Distributors typically operate in one province and to sell to dealers, and dealers sell to end users, i.e. farmers. Distributors can also sell directly to farmers or large plantations, and may also have a dealer's license. In some areas there may be area distributors whose operations span multiple provinces and who supply distributors. As discussed earlier, imports can also be done by large plantations and farmer cooperatives.
As of 2012 there were 483 licensed handlers in the fertilizer industry, spanning importation, distribution, repacking, export, and manufacturing. Of these, 150 were listed as importers; 8
0
100,000
200,000
300,000
400,000
500,000
600,000
700,000
2001 2002 2003 2004 2005 2006 2007 2008 2009 2010 2011 2012
Imports from ASEAN Imports from other FTA partners
Other imports Exports
0
100,000
200,000
300,000
400,000
500,000
600,000
700,000
2001 2002 2003 2004 2005 2006 2007 2008 2009 2010 2011 2012
Nitrogenous fertilizers NPK fertilizers
Pottasic fertilizers Phosphatic fertilizers

13
handlers were also listed as end-users (e.g. large plantations). Many more handlers are farmer cooperatives or associations (e.g. sugar planter organizations) who distribute fertilizer to their members. Hence, even if there are entry barriers to fertilizer marketing, these are not so high as to limit the number of players.
Data on fertilizer revenues (by which to infer market concentration ratios) is confidential. Available information on the market profile is too sparse to support any firm findings on market structure; the assessment rather examines pricing behavior to infer the state of competition in the domestic market.
Figure 8: Schematic of key players in the fertilizer market
Source: Olegario (2012).
4.3. Pricing along the supply chain
Official data on fertilizer price pertains to retail or dealer's prices. Prices were on a relatively gradual upward trend until 2007, after which prices spiked dramatically, before pulling back in 2009 (Figure 9). Thenceforth prices resumed their more gradual upward trend. By 2011 fertilizer prices were much higher than in 2007. This to a great extent accounts for lower fertilizer application after 2007.
Unfortunately there is no official data on prices at the level of the wholesaler and importer. Some information is available from key informant interviews, compiled in Table 5. The Table is a semi-stylized disaggregation applicable to the Northern island of Luzon where rice farming is widespread, and distance between dealers and distributors, as well as distributors and nearest shipping port, are within two hours land transport or lower.
What is striking is the minuteness of the mark-up along the supply chain. At the end of the chain are the dealers, who state that their mark-up is ordinarily P30/kg; and may occasionally fall even lower for long-time customers, or when they need to dispose of stocks, especially towards the beginning of the rice harvest season (the lean season for fertilizer
Area distributors Farmer cooperatives Plantation accounts
Farmers
Dealers
Cooperative growers
Growers associations
Distributors/Dealers
Importers/Manufacturers/Distributors

14
sales).
Figure 9: Dealer's prices of fertilizer in pesos per bag, , national average, 2001 - 2012
Source: BAS.
Table 5: Breakdown of mark-up and cost along the supply chain for imported urea, late-2013
Selling pricea Gross mark-up
Net margin Net margin (%)b
Dealer 1,090 30 ~30c 2.8
Distributor 1,060 60 ~ 50d 4.7
Importer 1,000 86 ~30e 3.0
Exporter's price (CIF, bagged) 914 239f - -
Export price (FOB, bulk) 675 - - -
a Importer's price actual; distributor and dealer estimated from mark-ups. b As a proportion of selling price. c For both informants, associated costs are trivial, as fertilizer forms only a small portion of deliveries of the agri-trading retail shop. d According to informant, only non-trivial cost is delivery. Estimated from delivery charge of P3,500 for 25 ton transport. e The implicit cost of 56 pesos is consistent with port and customs clearance charges of about P20/bag (P10,000 per container), estimated from Manila International Container Port tariff schedule, and transport cost of P36/bag (P18,000 per container), estimated by two trucking companies. According to the fertilizer importer, other cost items on a per bag basis are minimal. fImplicit mark-up only. F.O.B. price from World Bank Pink Sheet. Blank denotes information not available.
Sources: Informant interviews and references cited.
The margin has been fixed for several years now, even during the period of soaring fertilizer prices in 2008; the dealers claim that as a proportion of their working capital the mark-up had fallen dramatically. However any attempt to adjust the mark-up would be counter-
0
200
400
600
800
1000
1200
1400
1600
1800
1990 1995 2000 2005 2010
Ammosul (21-0-0) Urea (45-0-0)
Ammophos (16-20-0) Complete (14-14-14)
15
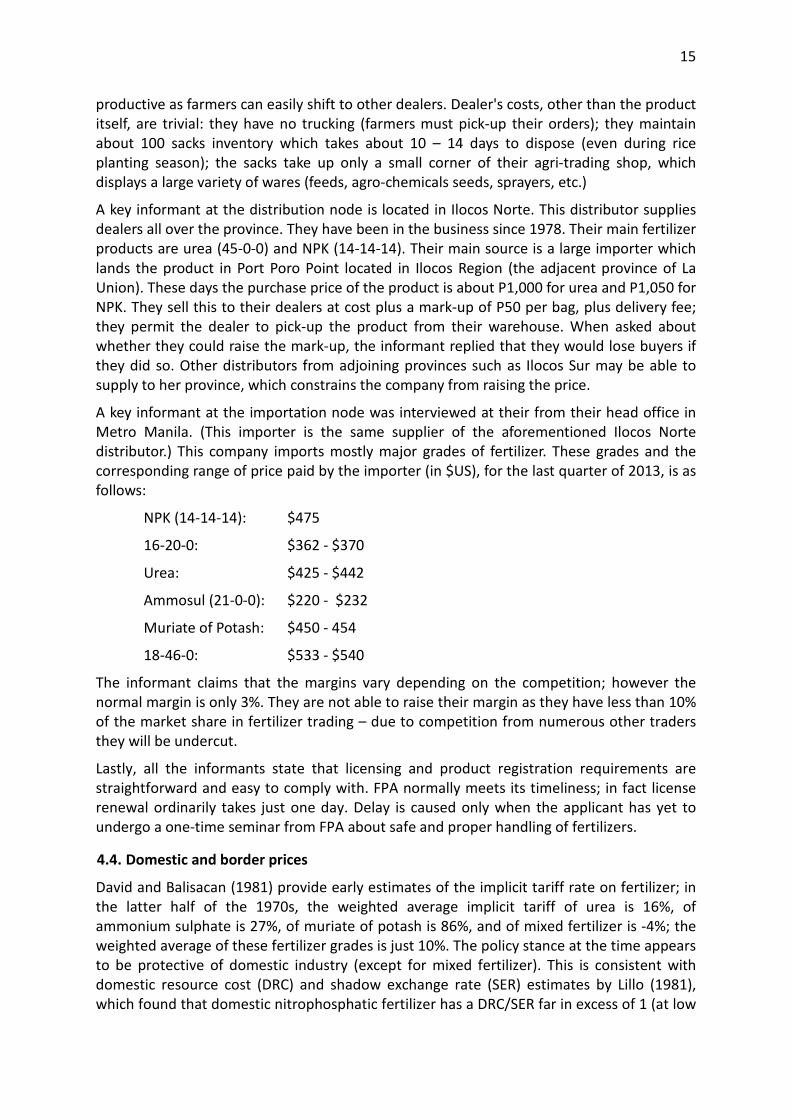
productive as farmers can easily shift to other dealers. Dealer's costs, other than the product itself, are trivial: they have no trucking (farmers must pick-up their orders); they maintain about 100 sacks inventory which takes about 10 – 14 days to dispose (even during rice planting season); the sacks take up only a small corner of their agri-trading shop, which displays a large variety of wares (feeds, agro-chemicals seeds, sprayers, etc.)
A key informant at the distribution node is located in Ilocos Norte. This distributor supplies dealers all over the province. They have been in the business since 1978. Their main fertilizer products are urea (45-0-0) and NPK (14-14-14). Their main source is a large importer which lands the product in Port Poro Point located in Ilocos Region (the adjacent province of La Union). These days the purchase price of the product is about P1,000 for urea and P1,050 for NPK. They sell this to their dealers at cost plus a mark-up of P50 per bag, plus delivery fee; they permit the dealer to pick-up the product from their warehouse. When asked about whether they could raise the mark-up, the informant replied that they would lose buyers if they did so. Other distributors from adjoining provinces such as Ilocos Sur may be able to supply to her province, which constrains the company from raising the price.
A key informant at the importation node was interviewed at their from their head office in Metro Manila. (This importer is the same supplier of the aforementioned Ilocos Norte distributor.) This company imports mostly major grades of fertilizer. These grades and the corresponding range of price paid by the importer (in $US), for the last quarter of 2013, is as follows:
NPK (14-14-14): $475
16-20-0: $362 - $370
Urea: $425 - $442
Ammosul (21-0-0): $220 - $232
Muriate of Potash: $450 - 454
18-46-0: $533 - $540
The informant claims that the margins vary depending on the competition; however the normal margin is only 3%. They are not able to raise their margin as they have less than 10% of the market share in fertilizer trading – due to competition from numerous other traders they will be undercut.
Lastly, all the informants state that licensing and product registration requirements are straightforward and easy to comply with. FPA normally meets its timeliness; in fact license renewal ordinarily takes just one day. Delay is caused only when the applicant has yet to undergo a one-time seminar from FPA about safe and proper handling of fertilizers.
4.4. Domestic and border prices
David and Balisacan (1981) provide early estimates of the implicit tariff rate on fertilizer; in the latter half of the 1970s, the weighted average implicit tariff of urea is 16%, of ammonium sulphate is 27%, of muriate of potash is 86%, and of mixed fertilizer is -4%; the weighted average of these fertilizer grades is just 10%. The policy stance at the time appears to be protective of domestic industry (except for mixed fertilizer). This is consistent with domestic resource cost (DRC) and shadow exchange rate (SER) estimates by Lillo (1981), which found that domestic nitrophosphatic fertilizer has a DRC/SER far in excess of 1 (at low

16
historical world prices). At the time, domestic plants were operating vintage equipment and at excess capacity, hence could not keep up with technological change (David and Balisacan, 1981).
It would be interesting to continue the implicit tariff rate calculation to the reform period Unfortunately there is however no comparable data during the reform period by which to compute the implicit tariff; the problem is that official data is available only for retail prices (i.e. paid by farmers); what is needed is wholesale prices, to compare with CIF prices of major fertilizer grades.
Keeping this discrepancy in mind, it is nonetheless interesting to make a graphical comparison (Figure 10). Only urea is considered given availability of domestic and world price data. "Spread" is defined as the ratio of the average national monthly retail price to the world price (in FOB); world prices are converted to pesos using the market exchange rate.
Figure 10: Monthly price of urea (Black Sea FOB), in $ per ton, and domestic price spread
Source of basic data: World Bank (2013).
Both world and domestic prices are highly variable (standard deviations are P6,000 and P7,700, respectively). The spread is anywhere from 1.1 (in 2008) to 3.0 (in 1999). World and domestic price are highly correlated (correlation coefficient of 0.95). Note however that the spread tends to be larger when the world price falls, and shrinks when world price rises. This seems consistent with fixed mark-ups, at least at the dealer level, as suggested by the key informant interviews. The association of course is strongly influenced by the market exchange rate; for instance during the Asian financial crisis, the world price of urea fell by 34%, implying a spread of 3.2 had the exchange rate remained constant; instead the peso price of the dollar soared, limiting the spread to its actual value of just 1.9.
High correlation of domestic and foreign price suggests a domestic market that is well-integrated with the world market. Here "integrated" implies reasonably rapid dissipation of arbitrage opportunities between domestic and foreign prices – an important indicator of competitiveness in the domestic market (but by no means a comprehensive one).
0.0
0.5
1.0
1.5
2.0
2.5
3.0
3.5
0
5,000
10,000
15,000
20,000
25,000
30,000
35,000
40,000
Jan-
90
Apr
-91
Jul-9
2
Oct
-93
Jan-
95
Apr
-96
Jul-9
7
Oct
-98
Jan-
00
Apr
-01
Jul-0
2
Oct
-03
Jan-
05
Apr
-06
Jul-0
7
Oct
-08
Jan-
10
Apr
-11
Jul-1
2
Spread FOB, pesos/ton

17
4.5. Market integration
A more formal test of integration between domestic and world markets is needed, which is performed in the following sub-section. Denote monthly domestic and world prices in as, respectively, ,t tDP WP , with 0 1 2, ,β β β as parameters, and tε an error term. The domestic
price is expressed in local currency and the world price in $US; denote the monthly exchange rate by tER . The following is posited as a long run relationship between domestic
and world price:
1 20 exp( )t t t tDP WP ERβ ββ ε= .
Taking natural logarithms (prices in logs in lower-case):
0 1 2t t t tdp wp erβ β β ε= + + + (1)
The relationship can be estimated by OLS if 2~ (0, )t Nε σ . However finite variance may be
violated if both time series are random walks. Prior to estimating (1), there is a need to check if the time series are I(0) stationary. If the series are not stationary and but are stationary in first differences, i.e. I(1), then equation (1) can still be estimated if there is a set of parameters for which the following holds:
0 1 2 ~ (0)t t t tdp b b wp b er Iε = + + + (1')
The parameters in (1') result in a cointegrating equation. With multiple time series, if vector autoregression (VAR) of , ,t t tdp wp er on lagged values is I(1), the presence of a cointegrating
relation (1') can be determined. The VAR corresponds to a vector error correction model (VEC) of the form:
1
11
p
t t i t i ti
ε−
− −=
∆ = + ∆ +∑y Πy Γ y (2)
Here the ty vector is a 1x3 element vector consisting of time series variables of interest,
while p is the maximum number of lags in the VAR model. The VEC form is useful as it provides information about the speed of adjustment to the long-run equilibrium relationship expressed by the cointegrating equation corresponding to (1). The foregoing is implemented in STATA with the following steps:
1. Check I(0) and I(1) stationarity of the time series variables using the augmented Dickey-Fuller test.
2. Supposing the time series variables are I(1), identify the number of lags in the VEC model using the varsoc command.
3. Check the existence of cointegrating relations with the vecrank command, which runs the Johansen test for integration.
4. Run the VEC model using the vec command, which applies the maximum likelihood method of Johansen.
Note that in the program, the time series variables for domestic price, world price, and exchange rate are denoted logdom,logfob,and logpusd; the lag operator is denoted L, such that L.2 denotes a two-period lag; and the difference operator is denoted D.
Table 6 provides the results of the augmented Dickey-Fuller tests; for all three time series

18
the test rejects I(0) stationarity but fails to reject I(1) stationarity.
Table 6: Results of Dickey-Fuller tests in STATA
Variable MacKinnon approximate p-value for Z(t) Decision
logdom 0.7297 Reject D.logdom 0.0000 Fail to reject logfob 0.6089 Reject D.logfob 0.0000 Fail to reject logpusd 0.2951 Reject D.logpusd 0.0000 Fail to reject
Source: Author's calculation.
Table 7 presents results for the number of lags. The preferred tests are the Hannan-Quinn information criterion, and the Schwarz Bayesian information criterion, both of which point to a lags of up to two periods.
Table 7: STATA results for number of lags in the VEC model
. varsoc logdom logfob logpusd Selection-order criteria Sample: 5 - 282 Number of obs = 278 +---------------------------------------------------------------------------+ |lag | LL LR df p FPE AIC HQIC SBIC | |----+----------------------------------------------------------------------| | 0 | -125.913 .000507 .927432 .943137 .966579 | | 1 | 1566.41 3384.6 9 0.000 2.8e-09 -11.1828 -11.12 -11.0262 | | 2 | 1691.05 249.29 9 0.000 1.2e-09 -12.0148 -11.9048* -11.7408* | | 3 | 1703.5 24.893* 9 0.003 1.2e-09* -12.0396* -11.8825 -11.6481 | | 4 | 1711.31 15.619 9 0.075 1.2e-09 -12.031 -11.8268 -11.5221 | +---------------------------------------------------------------------------+ Endogenous: logdom logfob logpusd Exogenous: _cons
Source: Author's calculation.
Table 8 presents the results of Step 3, based on 5% level of significance. Comparison with the trace statistic rejects the null hypothesis of no cointegrating relation (line 0.) The Johansen test statistic identifies the first null hypothesis that is not rejected, which is at most one cointegrating relation (line 1), i.e. the trace statistic is below the critical value.5
The existence of a unique cointegrating vector becomes the working hypothesis in the VEC model. The VEC analysis is presented in Table 9. At the bottom of the Table are the estimates of the cointegrating equation; with logdom restricted to a coefficient of unity, the signs of logfob and logpusd coefficients are negative as expected. The coefficients are all statistically significant at 1% level (or even lower). The values imply a transmission elasticity of about 0.82 from world to domestic prices (holding exchange rate constant); a similar transmission elasticity holds for changes in the peso-dollar exchange rate (holding world dollar prices constant).
5 The cointegrating equation is unique up to a multiple of transformation.

19
Table 8: STATA results for existence of cointegrating vector
. vecrank logdom logfob logpusd, lag(2) Johansen tests for cointegration Trend: constant Number of obs = 280 Sample: 3 - 282 Lags = 2 ------------------------------------------------------------------------------- 5% maximum trace critical rank parms LL eigenvalue statistic value 0 12 1679.2336 . 51.2053 29.68 1 17 1701.2121 0.14529 7.2483* 15.41 2 20 1703.1457 0.01372 3.3811 3.76 3 21 1704.8363 0.01200 -------------------------------------------------------------------------------
Source: Author's calculation.
The cointegrating equation expresses the long run relationship. The short-term adjustment relation is shown in the top part of the table. When the value of cointegrating equation is positive, i.e. the domestic price is "too high", then an increase in its value causes 0.06% decline in the domestic price of the next period. The difference is small on a monthly basis but adds up to a sizable proportion on an annual time scale. Note lastly that in the short-run adjustment equations, the coefficients of logdom in the D.logfob and D.logpusd equations are statistically non-significant, consistent with notion of a small open economy (Philippines does not affect the world price of urea) and small sector (fertilizer alone does not affect the market exchange rate).
4.6. Domestic fertilizer price dispersion
The abovementioned results analyze integration between average domestic price and a benchmark world price. It does not address sub-national issues, i.e. whether domestic prices within the country are themselves integrated. Across the country, there is a wide dispersion in retail prices of fertilizer based on the Dealer's price index (Table 10). Relative to the national average, the cheapest fertilizers are found in Ilocos, Cagayan Valley (in the North); Western Visayas (Central); and Davao Region (South). The most expensive fertilizers meanwhile are in ARMM and Eastern Visayas – which also happen to be among the poorest regions of the country. Variations in fertilizer prices (as gauged by the standard deviation) are similar across fertilizer grades, i.e. in the somewhere between 6 – 7%. The widest range in the index is for urea, followed by ammonium sulfate.
Accounting for these disparities warrants future research. Further study should check for the presence of spatial market integration, i.e. whether spatial arbitrage opportunities exist within the country. If none, disparities may still be attributed to transaction cost differences, perhaps due to area-specific gaps in infrastructure and logistics.

20
Table 9: STATA results for the VEC model estimation
. vec logdom logfob logpusd, lag(2) Vector error-correction model Sample: 3 - 282 No. of obs = 280 AIC = -12.03009 Log likelihood = 1701.212 HQIC = -11.94157 Det(Sigma_ml) = 1.06e-09 SBIC = -11.8094 Equation Parms RMSE R-sq chi2 P>chi2 ---------------------------------------------------------------- D_logdom 5 .020802 0.6869 603.3296 0.0000 D_logfob 5 .084633 0.1804 60.51297 0.0000 D_logpusd 5 .019316 0.1842 62.07544 0.0000 ---------------------------------------------------------------- ------------------------------------------------------------------------------ | Coef. Std. Err. z P>|z| [95% Conf. Interval] -------------+---------------------------------------------------------------- D_logdom | _ce1 | L1. | -.0569134 .0111676 -5.10 0.000 -.0788015 -.0350253 | logdom | LD. | .5209091 .0405173 12.86 0.000 .4414967 .6003216 | logfob | LD. | .1082947 .0155398 6.97 0.000 .0778372 .1387522 | logpusd | LD. | .2029804 .0600431 3.38 0.001 .0852981 .3206628 | _cons | .0021857 .0012814 1.71 0.088 -.0003258 .0046973 -------------+---------------------------------------------------------------- D_logfob | _ce1 | L1. | .1410678 .0454361 3.10 0.002 .0520147 .230121 | logdom | LD. | .2111027 .1648475 1.28 0.200 -.1119925 .534198 | logfob | LD. | .4585162 .0632249 7.25 0.000 .3345977 .5824347 | logpusd | LD. | -.4824705 .2442898 -1.97 0.048 -.9612697 -.0036713 | _cons | .0007622 .0052135 0.15 0.884 -.0094561 .0109805 -------------+---------------------------------------------------------------- D_logpusd | _ce1 | L1. | .0173224 .01037 1.67 0.095 -.0030024 .0376472 | logdom | LD. | .0505793 .0376235 1.34 0.179 -.0231614 .1243201 | logfob | LD. | .0135813 .01443 0.94 0.347 -.0147009 .0418635 | logpusd | LD. | .4035137 .0557548 7.24 0.000 .2942363 .5127911 | _cons | .000974 .0011899 0.82 0.413 -.0013582 .0033061 ------------------------------------------------------------------------------

21
Cointegrating equations Equation Parms chi2 P>chi2 ------------------------------------------- _ce1 2 1235.873 0.0000 ------------------------------------------- Identification: beta is exactly identified Johansen normalization restriction imposed ------------------------------------------------------------------------------ beta | Coef. Std. Err. z P>|z| [95% Conf. Interval] -------------+---------------------------------------------------------------- _ce1 | logdom | 1 . . . . . logfob | -.8221742 .0302817 -27.15 0.000 -.8815252 -.7628232 logpusd | -.8396897 .0581069 -14.45 0.000 -.9535771 -.7258024 _cons | -2.033394 . . . . . ------------------------------------------------------------------------------
Table 10: Dealer's price index by region, average of 2009 – 2011 (Philippines = 1.00)
Ammonium phosphate
Ammonium sulfate
Complete NPK
Urea Average
Philippines 1.00 1.00 1.00 1.00 1.00 Luzon
CAR 0.97 0.99 0.97 0.98 0.98
Ilocos 0.93 0.93 0.94 0.94 0.94
Cagayan Valley 0.94 0.91 0.92 0.93 0.93
Central Luzon 0.95 1.00 0.95 0.97 0.97
CALABARZON 1.07 1.07 1.03 1.04 1.04
MIMAROPA 1.08 1.12 1.04 1.07 1.07
Visayas
Bicol 0.98 1.06 1.01 1.01 1.01
Western Visayas 0.95 0.92 0.96 0.94 0.94
Central Visayas 1.02 1.02 1.02 1.02 1.02
Eastern Visayas 1.11 1.17 1.09 1.11 1.11
Mindanao
Zamboanga Peninsula 1.03 1.03 1.01 1.02 1.02
Northern Mindanao 1.10 1.04 1.02 1.04 1.04
Davao Region 0.96 0.92 0.97 0.95 0.95
SOCCSKSARGEN 0.98 0.94 0.97 0.96 0.96
CARAGA 1.00 0.97 0.98 0.98 0.98
ARMM 1.02 1.01 1.13 1.10 1.10
Average 0.06 0.07 0.05 1.00 1.00 Source of basic data: BAS.
5. CONCLUSION
5.1. Summary and key challenges
The fertilizer sector has grown dramatically since the 1950s, owing to adoption of modern technology in Philippine agriculture. From its initial concentration in export crops (mostly

22
sugar), demand from cereals and other crops exploded after the Green Revolution in rice. Application of fertilizers realized the high yield potential from modern technologies and varieties, which exhibited better fertilizer response compared to traditional varieties.
The policy regime also evolved; initially policies aimed at first at establishing a strong domestic industry to substitute for imports by pursuing protectionist policies. This was followed by even more strongly interventionist approach which aimed at both protection of domestic investors and making cheap inputs (fertilizers, chemicals, credit) accessible to small farmers.
The current regime (beginning 1986) is market-oriented. The distortions in place over the previous three decades were largely dismantled; tariffs are now low; regulations are focused on maintaining product quality and safety; subsidies were eliminated, though strong incentives are in place through various exemptions such as from the value added tax, and tariff exemption for producer-importers.
However significant challenges remain, at two levels. First, at the market level: despite efforts of regulator and the private sector, the sale of substandard fertilizers is still being reported; it is unclear however how widespread the practice is (beyond a some anecdotes). A more serious challenge is the persistent of apparent inefficiencies in fertilizer marketing, as seen in the large discrepancies in pricing across adjacent regions for the same product. The fact that markets are competitive does not preclude inefficiencies in the fertilizer supply chain at least in some areas, owing to poor transport infrastructure, weak logistics systems, and low investments.
The second level is at the farm: cultivators continue to apply sub-optimal amounts of fertilizer, whether for the main nutrients (nitrogen, phosphorus, and potassium) as well as for micronutrients (Mamaril et al, 2009). While knowledge does play a key role in remedying this, perhaps other factors are equally or even more important – what these factors are however elude researchers to date. Credit and risk aversion are not strong candidates for these factors, though some manner of aversion to potential loss, not captured by traditional expected utility formulations, may hold the answer to this puzzle.
5.2. Way forward
The foregoing suggests a few implications for policy and research. First of course is to stay the course on the market-oriented regime in fertilizer policy. There remains of course a persistent (though no longer vocal) constituency for resumption of interventionism, emphasizing subsidies and protection. Inappropriate solutions to very real problems in the sector must always be resisted.
Identifying appropriate solutions is however far from easy. The task begins first with evidenced-based analysis at both levels of the problem, i.e. the market and the farmer. The former warrants careful documentation of structure, conduct, and performance of fertilizer trading, along with assessment of binding constraints and chokepoints. Whereas, the latter will entail a more flexible model-building, together with primary data collection and hypothesis testing, to arrive at a comprehensive understanding of the farmer's goals, opportunities, and constraints. This will help improve the package of technologies, incentives, and infrastructure towards boosting competitiveness of smallholder systems in the Philippines.

23
REFERENCES
Abedullah, and S. Pandey, 2004. Risk and fertilizer use in the rainfed rice ecosystem of Tarlac, Philippines. Journal of Agricultural and Applied Economics 36(1): 241 – 250.
Barker, R., R. Herdt, and B. Rose, 1985. The rice economy of Asia. Resources for the Future: Washington, D.C.
Castillo, G., 1975. All in a grain of rice: a review of Philippine studies on the social and eocnomic implications of the new rice technology. Southeast Asian Regional Centre for Graduate Studies and Research in Agriculture, College, Laguna, Philippines.
David, C., and A. Balisacan, 1981. An analysis of fertilizer policies in the Philippines. Journal of Philippine Development 8(1&2): 27 – 37.
Dawe, D., P. Moya, F. Gascon, M.S. Valencia, 2007. Can nitrogen management in Philippine rice production be improved? In: D. Dawe, P. Moya, and C. Casiwan, eds. Why does the Philippines Import Rice? Meeting the challenge of trade liberalization. IRRI, Los Banos, Laguna, Philippines. Herdt, R, and C. Capule, 1983. Adoption , spread, and production impact of modern rice varieties in Asia. IRRI, Los Banos, Laguna, Philippines.
Mamaril, C., M. Castillo, L. Sebastian, 2009. Facts and Myths about Organic Fertilizers. Philippine Rice Research Institute, Munoz, Nueva Ecija, Philippines.
Mariano, M., R. Villano, E. Fleming, 2010. Are irrigated farming ecosystems more productive than rainfed farming systems in rice production in the Philippines? Agriculture, Ecosystems, and Environment 139(4): 603 – 610.
Mataia, A., and D. Dawe, 2007. Lack of credit is not a major constraint to improving the productivity of rice farmers. In: D. Dawe, P. Moya, and C. Casiwan, eds. Why does the Philippines Import Rice? Meeting the challenge of trade liberalization. IRRI, Los Banos, Laguna, Philippines.
Mojica-Sevilla, F., 2006. The Philippine Fertilizer Industry. Food and Agri Business Monitor. Center for Food and Agri Business, University of Asia and the Pacific, Pasig City, Philippines, May.
Pingali, P., M. Hossain, S. Pandey, L. Price, 1998. Economics of nutrient management in Asian rice systems: Towards increasing knowledge intensity. Field crops research 56(1):157 – 176.
Sumayao, B., 1969. The Bicolano farmers' response to an improved rice variety IR-8-288-3. UP College of Agriculture, College, Laguna, Philippines.
Yao, R., and G. Shively, 2007. Technical change and production efficiency: irrigated rice in the Philippines. Asian Economic Journal 21(2): 155-168.
Office of the President, 1992. The Aquino Management of the Presidency. The President's Report 1986 – 1992. Office of the President, Government of the Philippines, Manila.


![[Smarter Makati Presentation : Makati City, Philipines]](https://static.fdocuments.us/doc/165x107/558624e6d8b42a56578b4595/smarter-makati-presentation-makati-city-philipines.jpg)
