The role of international institutions in fostering sub ...
14
1255 Amsterdam Ave, New York, NY 10027 | http://energypolicy.columbia.edu | @ColumbiaUEnergy The role of international institutions in fostering sub-Saharan Africa’s electrification By Simone Tagliapietra and Morgan Bazilian September 21, 2017 International institutions, such as multilateral development banks and national development agencies, are crucial in funding the provision of electricity services in sub-Saharan Africa. In the following Commentary, the authors discuss the role of these institutions in bringing electricity to the region. The Commentary shows that the scale and focus of global initiatives is wide and eclectic, and coordination between large and smaller funders remains critical. It highlights how over the past decade, 92 percent of international financial support to SSA’s electrification came from World Bank Group (WBG), the African Development Bank (AfDB) and the European Union (EU). The EU’s actions in the field appear to be particularly fragmented. The WBG, the AfDB and the US have streamlined their actions largely by focusing resources on a few initiatives. The Commentary concludes with recommendations to help get more large-scale projects funded, and increase technical assistance and capacity building. Better coordination and information-sharing mechanisms to track the rapidly- changing landscape will be critical to achieve the energy access goals in sub-Saharan Africa. Sub-Saharan Africa’s historical electrification challenge The adoption of the UN’s Sustainable Development Goals (SDG) has brought the importance of energy access to the fore. 1 SDG 7 has a set of indicators related to the achievement of universal access to energy services, and tracks progress using metrics of the proportion of the population with access. Partially as a result of SDG 7, there has been a burst of new initiatives aimed to support its achievement. Still, to our knowledge, there was no compilation of them. This commentary provides an initial, non-comprehensive inventory of initiatives focused on access to electricity services. It does not provide considerable analysis on the scale or efficacy of these initiatives, but rather provides the compilation as fodder for future, more detailed work. This short paper begins with some scale and context, then briefly describes some of the institutions and stakeholders active in the area. It then provides the current inventory of activity, and concludes with some observations and recommendations by the authors. Electrification remains one of sub-Saharan Africa’s (SSA) most dramatic socio-economic challenges, and one of the most difficult to achieve of the United Nation’s Sustainable Development Goals. 2 Given the size of the investment needed, international institutions, such as international organizations, multilateral development banks and national development agencies, have a critical role in fostering SSA’s electrification. Consider the scope of the problem: Less than a third of the regional population has access to electricity. 3 Around 600,000 premature deaths are registered each year as a consequence of household air pollution resulting from the utilization of polluting fuels for cooking and lighting. 4 Electrification rates average in SSA countries at 35 percent, against 86 percent in South Africa and 99 percent in North African countries. This situation is even more dramatic in rural areas, where SSA’s average electrification rate stands at 16 percent, against 71 percent in South Africa and 99 percent in North African countries. 5 Access is not the only challenge sub-Saharan Africa faces. While two-thirds of SSA’s population does not have access to electricity, the remaining one-third cannot consume as it would like, due to regular blackouts and brownouts resulting from a structural constraint of available electricity supply across SSA. This can be seen in the wide disparities in electricity consumption levels between populations with access to electricity in SSA and other parts of the world. 6 In SSA, average electricity consumption per capita stands at 201 kilowatt- 1 See e.g., https://sustainabledevelopment.un.org/sdgs 2 The authors are grateful to Alexander Roth for his excellent research assistance. 3 International Energy Agency (2016a). 4 World Health Organisation (2014). 5 World Bank, World Development Indicator database, accessed in May 2017. 6 World Bank (2016) and World Bank (2017b).
Transcript of The role of international institutions in fostering sub ...

1255 Amsterdam Ave, New York, NY 10027 | http://energypolicy.columbia.edu | @ColumbiaUEnergy
The role of international institutions in fostering sub-Saharan Africa’s electrification
By Simone Tagliapietra and Morgan Bazilian
September 21, 2017
International institutions, such as multilateral development banks and national development agencies, are crucial in funding the provision of electricity services in sub-Saharan Africa. In the following Commentary, the authors discuss the role of these institutions in bringing
electricity to the region. The Commentary shows that the scale and focus of global initiatives is wide and eclectic, and coordination between large and smaller funders remains critical. It highlights how over the past decade, 92 percent of international financial support to SSA’s electrification came from World Bank Group (WBG), the African Development Bank (AfDB) and the European Union (EU). The EU’s actions in the field appear to be particularly fragmented. The WBG, the AfDB and the US have streamlined their actions largely by focusing resources on a few initiatives. The Commentary concludes with recommendations to help get more large-scale projects funded, and increase technical assistance and capacity building. Better coordination and information-sharing mechanisms to track the rapidly-
changing landscape will be critical to achieve the energy access goals in sub-Saharan Africa.
Sub-Saharan Africa’s historical electrification challenge
The adoption of the UN’s Sustainable Development Goals (SDG) has brought the importance of energy access to the fore.1 SDG 7 has a set of indicators related to the achievement of universal access to energy services, and tracks progress using metrics of the proportion of the population with access. Partially as a result of SDG 7, there has been a burst of new initiatives aimed to support its achievement. Still, to our knowledge, there was no compilation of them. This commentary provides an initial, non-comprehensive inventory of initiatives focused on access to electricity services. It does not provide considerable analysis on the scale or efficacy of these initiatives, but rather provides the compilation as fodder for future, more detailed work. This short paper begins with some scale and context, then briefly describes some of the institutions and stakeholders active in the area. It then provides the current inventory of activity, and concludes with some observations and recommendations by the authors.
Electrification remains one of sub-Saharan Africa’s (SSA) most dramatic socio-economic challenges, and one of the most difficult to achieve of the United Nation’s Sustainable Development Goals.2 Given the size of the investment needed, international institutions, such as international organizations, multilateral development banks and national development agencies, have a critical role in fostering SSA’s electrification.
Consider the scope of the problem: Less than a third of the regional population has access to electricity.3 Around 600,000 premature deaths are registered each year as a consequence of household air pollution resulting from the utilization of polluting fuels for cooking and lighting.4 Electrification rates average in SSA countries at 35 percent, against 86 percent in South Africa and 99 percent in North African countries. This situation is even more dramatic in rural areas, where SSA’s average electrification rate stands at 16 percent, against 71 percent in South Africa and 99 percent in North African countries.5
Access is not the only challenge sub-Saharan Africa faces. While two-thirds of SSA’s population does not have access to electricity, the remaining one-third cannot consume as it would like, due to regular blackouts and brownouts resulting from a structural constraint of available electricity supply across SSA. This can be seen in the wide disparities in electricity consumption levels between populations with access to electricity in SSA and other parts of the world.6 In SSA, average electricity consumption per capita stands at 201 kilowatt-
1 See e.g., https://sustainabledevelopment.un.org/sdgs 2 The authors are grateful to Alexander Roth for his excellent research assistance. 3 International Energy Agency (2016a). 4 World Health Organisation (2014). 5 World Bank, World Development Indicator database, accessed in May 2017. 6 World Bank (2016) and World Bank (2017b).
1255 Amsterdam Ave, New York, NY 10027 | http://energypolicy.columbia.edu | @ColumbiaUEnergy
hour (kWh) per year, against 4,200 kWh in South Africa and 1,500 kWh in North African countries.7 This situation is even worse in SSA’s rural areas with access to electricity, as here electricity consumption per capita remains even below 100 kWh per year.8
To meet the UN MDG, funding must increase substantially. Annual investments into SSA’s electricity sector currently amount to $US8 billion,9 well short of the estimated $US100 billion per year needed to ensure universal access to electricity by 2030.10 That is, SSA is clearly not on track to meet the 2030 target.11
Filling this gap will require a substantial commitment of international private investments into SSA’s electricity sector, which in turn requires that SSA countries reform their (energy) governance. Risks arising from macroeconomic or political instability should be reduced, as well as the risks arising from weak protection of contract and property rights. Furthermore, clear and stable energy regulatory frameworks should be developed, and market-distorting energy subsidies should be reformed.12 Without good (energy) governance, international private investments will likely continue at their current modest pace across SSA.13
The role of international institutions in fostering sub-Saharan Africa’s electrification
International institutions, including international organizations, multilateral development banks and national development agencies, could channel international private investments into SSA’s electricity sector by putting in place dedicated blended finance tools and/or risk-sharing mechanisms.
International financial assistance (i.e., official development assistance -ODA plus other official flows) to SSA’s electricity sector has almost quadrupled over the last decade, increasing from 1.3 billion U.S.$ to 4.9 billion U.S.$ in 2015.14 A recent review of financing flows by the Sustainable Energy for All Initiative shows the contours of the finance gap clearly (Figure 1).15 The focus of this short paper is on the supply-side of the Sankey diagram (i.e., providers)
7 Ibidem. 8 International Energy Agency (2014). 9 Ibidem. 10 Mentis, D. et al. (2017) and Enerdata (2017). 11 World Bank (2017a). 12 International Monetary Fund (2013) and International Monetary Fund (2015). 13 Trimble, C. et al. (2016). 14 Organisation for the Economic Cooperation and Development, Development Finance Database, accessed in June 2017. 15 http://www.seforall.org/sites/default/files/2017_SEforALL_FR4_PolicyPaper.pdf

1255 Amsterdam Ave, New York, NY 10027 | http://energypolicy.columbia.edu | @ColumbiaUEnergy
Figure 1: Finance flows for energy access (SE4All, 2017)
Over the last decade, most of the financial assistance came from three players: the World Bank Group (WBG) (40 percent), the African Development Bank (AfDB) (27 percent) and the European Union (EU) (25 percent). Other players (8 percent in total) including, for instance: the Arab Fund for Economic and Social Development, the government of the United States, the OPEC Fund for International Development, the Kuwait Fund for Arab Economic Development, the government of the United Arab Emirates, the Climate Investment Funds, and the Arab Bank for Economic Development in Africa.16 As an example of highlighting the multi-agency cooperation inherent in many projects, the U.S. Power Africa initiative produces an excellent Annual Report with useful partnership maps (Figure 2).17
16 Ibidem. 17 https://www.usaid.gov/sites/default/files/documents/1860/PA_FINAL_508c.PDF

1255 Amsterdam Ave, New York, NY 10027 | http://energypolicy.columbia.edu | @ColumbiaUEnergy
Figure 2: Power Africa capacity building partnership map (Power Africa, 2017)
Notwithstanding their growing importance, these global financing initiatives for SSA’s electrification have never been tracked in a coherent manner. 18 It may be useful to employ techniques like those from International Relations employed by Keohane and Victor (2011) to better map the regime complex for energy access.
Our effort to address this gap, which is summarized in Table 1 at the end of this document, offers a non-comprehensive review of global financing initiatives for SSA’s electrification.
Our takeaways follow, but it is important to note that China has taken a different approach. Over the last decade more studies have been done on the engagement of China into Africa’s energy sector.19 However, this engagement is not captured by this review, since China moves via state owned enterprises (SOEs), rather than via financial assistance institutions. With a seminal report published in 2016, the International Energy Agency estimated that China’s SOEs to be responsible for 30 percent of new power capacity additions in SSA between 2010 and 2015, with a total investment of around US$ 13 billion over the last five years.20
We derive three principal takeaways from this review:
i) The scale and focus of initiatives is wide and eclectic. Taken in isolation this might be considered as good news, as it signals a widespread movement of support across the globe to SSA’s electrification. However, when considering that 92 percent of the last decade’s international financial support to SSA’s electrification came from only three players (i.e., WBG, AfDB, EU), there likely remains a coordination issue between these large well-established funders and the multitude of new initiatives.
ii) The EU’s actions appear particularly fragmented. The EU has 19 initiatives ongoing in the field (Table 1, A1-B12), originating from either EU Member States and EU Institutions. The variety of EU
18 To our knowledge, only partial reviews exists. See, for instance: European Union Energy Initiative Partnership Dialogue Facility (2016) and Quitzow, R. et Al. (2016). 19 See e.g., https://www.iaee.org/en/publications/newsletterdl.aspx?id=232; and http://www.bu.edu/cgef/#/intro 20 International Energy Agency (2016b).
1255 Amsterdam Ave, New York, NY 10027 | http://energypolicy.columbia.edu | @ColumbiaUEnergy
Member States’ initiatives (Table 1, B1-B12) is understandable, as each country has its own political and commercial interests to promote across SSA. What is less understandable is the fragmentation of EU Institutions (Table 1, A1-A7). The EU’s current fragmented system seems to favor overlaps, inefficiencies and overall higher transaction costs. It is reasonable to consider that European taxpayers’ money would be far better spent if channeled through a unique facility, allowing policy consistency, elimination of overlaps, abatement of transaction costs and, therefore, overall higher efficiency and impact.21
iii) The WBG, the AfDB and the U.S. have streamlined their actions in the field, focusing resources on a few initiatives. It appears that the WBG, the AfDB and the U.S. do not contribute to fragmentation, as they have a rather streamlined set of action in the field. The WBG operates through its established mechanisms (i.e., The International Bank for Reconstruction and Development, The International Development Association, The International Finance Corporation, The Multilateral Investment Guarantee Agency – Table 1, C1-C4). The AfDB, in addition to its traditional financing tools, has established two initiatives to invest in SSA’s (electricity) infrastructure: the ‘New Deal on Energy for Africa’ and the ‘Africa50’ (Table 1, D1-D3). The former is a public-private partnership between the AfDB, African governments and global private sector aimed at putting in place innovative financing to achieve universal access to energy by 2025, while the latter is an infrastructure fund owned by the AfDB, African governments and global institutional investors created to specifically mobilize long term savings to promote (electricity) infrastructure development in Africa. The U.S. mainly acts through ‘Power Africa’ (Table 1, E1), a public-private partnership platform launched in 2013 and involving 12 U.S. government agencies, African governments, more than 100 private sector partners (e.g., energy companies, investment banks, equity funds, institutional investors), and other multilateral partners.
Conclusion: Making the best of these global financing initiatives
Given the wide and growing landscape, it might be useful to focus on what can be done to enhance and scale-up the current global financing initiatives for SSA’s electrification. One key is to reduce fragmentation. As outlined by the Africa Progress Panel (2015), SSA’s energy needs are poorly served by a fragmented system of financial assistance. This is because available funding often gets transferred through overly bureaucratic delivery structures that combine high transaction costs with low impact, thus resulting in most finance to be earmarked for small-scale projects rather than sizeable programs.
International financial or development institutions need to offer more than financial support to SSA’s electrification. Increased technical assistance and help with building capacity building and risk instruments are critical. International institutions with a long record of infrastructure financing could enhance SSA’s ‘soft’ infrastructure of national governments and institutions. They can do this by supporting the development of sound energy policies, regulations, incentive systems, sector reforms, corporate governance, and transparency and accountability best practices. Several programs (e.g., AfDB’s ‘New Deal on Energy for Africa’ or the US ‘Power Africa’ program) already work with an explicit focus on creating these enabling environments.
Calls for better coordination and cohesion in the development arena are ubiquitous, and there are relatively few success stories. Still, the way to make the most of the global financing initiatives for SSA’s electrification could be to establish a coordination, or perhaps compilation and information-sharing mechanism, to better track the rapidly-moving landscape and help inform the actions of leading players and others. Although it is recognized that such centralized mechanisms are difficult to establish and maintain, the World Bank’s State of Energy Access Report (SEAR),22 or its Global Tracking Framework (GTF)23 may offer venues for housing such a function in their future iterations.
21 With this regard, see also: Tagliapietra, S. (2017). 22 https://www.esmap.org/node/55528 23 http://gtf.esmap.org/

1255 Amsterdam Ave, New York, NY 10027 | http://energypolicy.columbia.edu | @ColumbiaUEnergy
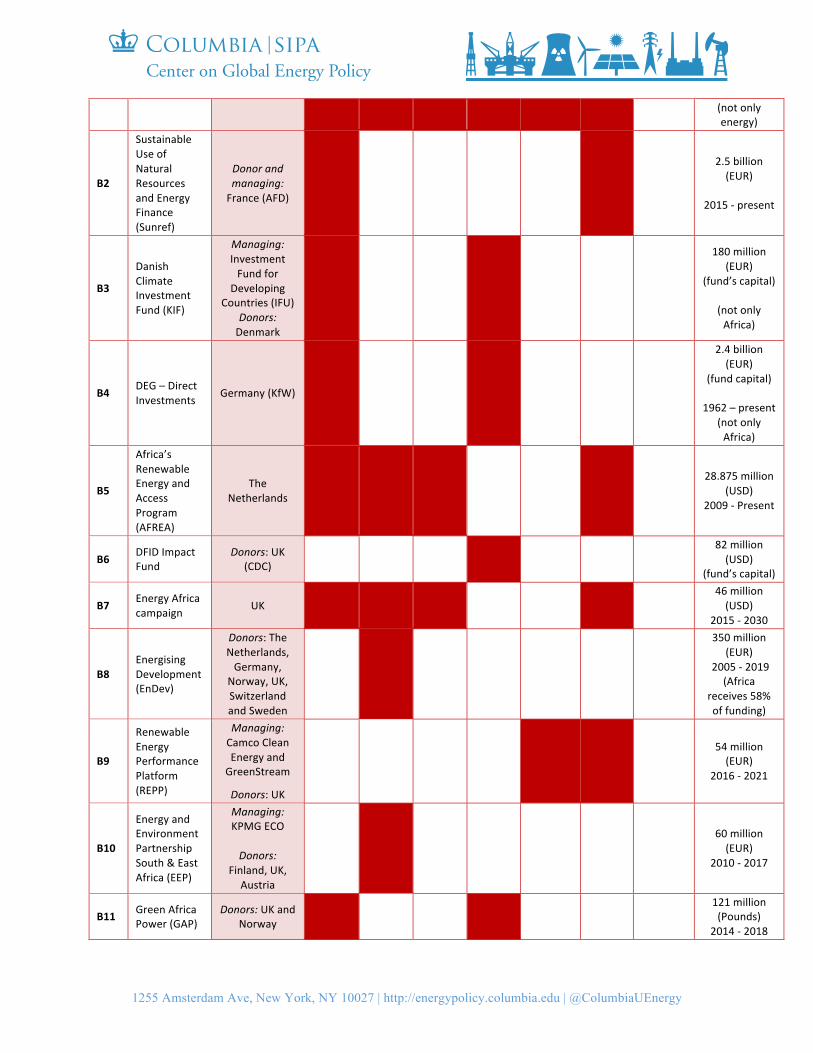
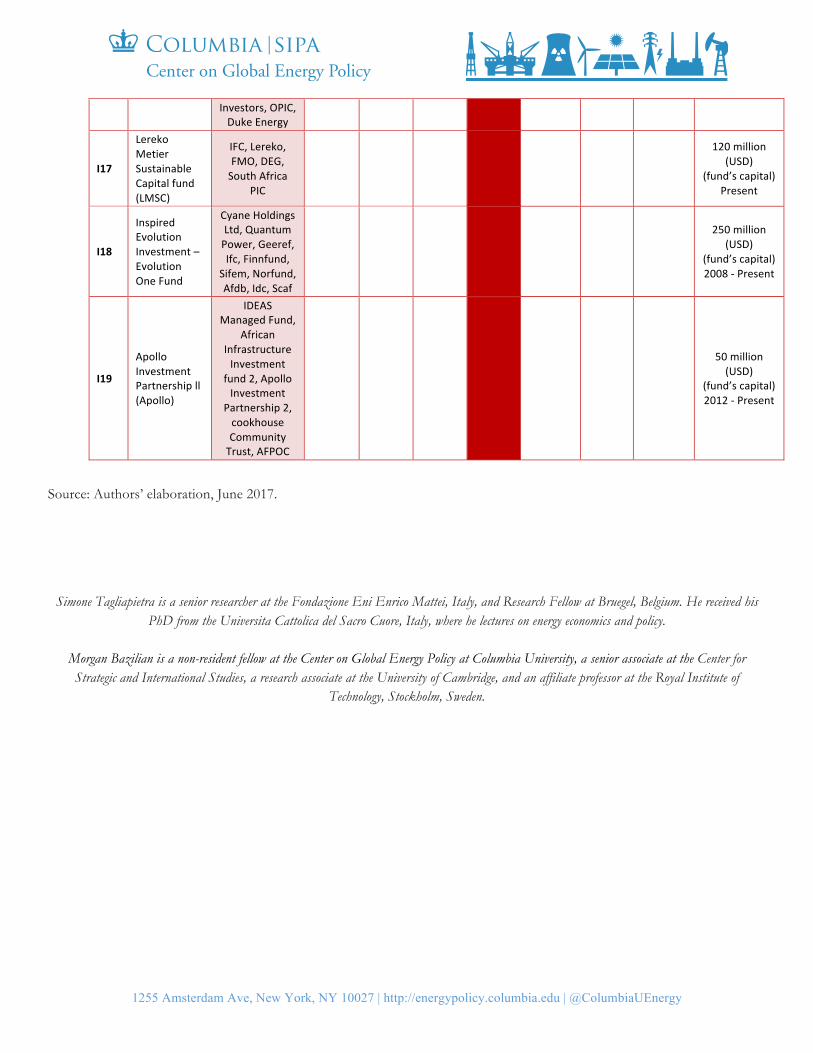
TABLE 1: A review of global financing initiatives for Sub-Saharan Africa’s electrification
Nameoftheinitiative
Responsibleinstitution Loans Grants Guaran
-tees Equity RiskSharing
Technical
Assistance
Interestrate
subsidiesBudget
AEUROPEANINSTITUTIONS
A1TheEuropeanDevelopmentFund(EDF)
Managing:ECandEIB
Donors:EUMemberStates
30.5billion(EUR)
2014–2020(worldwideandnotonly
energy)
A2TheACPInvestmentFacility(IF)
Managing:EIBDonors:EU
MemberStates(viaEDF)
3.6billion(EUR)
2000-present(notonlyAfricaandenergy)
A3ACP-EUEnergyFacility(EF)
Managing:ECDonors:EUandMemberStates
(viaEDF)
445million(EUR)
2006-2013200million
(EUR)2014-2020
A4
TheEU-AfricaInfrastructureTrustFund(EU-AITF)
Managing:EIBDonors:ECand12EUMember
States
811.9million(EUR)
2007–present(notonlyenergy)
A5AfricaInvestmentFacility(AfIF)
NA
A6AfricaEnergyGuaranteeFund(AEGF)
Managing:EIBandEC
Donors:EIB(EU-Africa
InfrastructureTrustFund)
601million
(EUR)2007-2030
A7EUExternalInvestmentPlan(EIP)
Donors:EUBudgetand
EDF
3.35billion(EUR)(EFSD)Until2020(worldwide)
B EUROPEANCOUNTRIES Loans Grants Guaran
tees Equity RiskSharing
Technical
Assistance
Interestrate
subsidies
B1 ProparcoDonorandmanaging:France(AFD)
3.7billion(EUR)
2014-2019
1255 Amsterdam Ave, New York, NY 10027 | http://energypolicy.columbia.edu | @ColumbiaUEnergy
(notonlyenergy)
B2
SustainableUseofNaturalResourcesandEnergyFinance(Sunref)
Donorandmanaging:France(AFD)
2.5billion(EUR)
2015-present
B3
DanishClimateInvestmentFund(KIF)
Managing:InvestmentFundfor
DevelopingCountries(IFU)
Donors:Denmark
180million(EUR)
(fund’scapital)
(notonlyAfrica)
B4 DEG–DirectInvestments Germany(KfW)
2.4billion(EUR)
(fundcapital)
1962–present(notonlyAfrica)
B5
Africa’sRenewableEnergyandAccessProgram(AFREA)
TheNetherlands
28.875million(USD)
2009-Present
B6 DFIDImpactFund
Donors:UK(CDC)
82million(USD)
(fund’scapital)
B7 EnergyAfricacampaign UK
46million(USD)
2015-2030
B8EnergisingDevelopment(EnDev)
Donors:TheNetherlands,Germany,
Norway,UK,SwitzerlandandSweden
350million(EUR)
2005-2019(Africa
receives58%offunding)
B9
RenewableEnergyPerformancePlatform(REPP)
Managing:CamcoCleanEnergyandGreenStream
Donors:UK
54million(EUR)
2016-2021
B10
EnergyandEnvironmentPartnershipSouth&EastAfrica(EEP)
Managing:KPMGECO
Donors:
Finland,UK,Austria
60million(EUR)
2010-2017
B11 GreenAfricaPower(GAP)
Donors:UKandNorway
121million(Pounds)
2014-2018

1255 Amsterdam Ave, New York, NY 10027 | http://energypolicy.columbia.edu | @ColumbiaUEnergy
B12NordicClimateFacility(NCF)
Donors:Denmark,Finland,Iceland,
Norway,andSweden
1billion(EUR)1989–present(46%thusfarallocatedfor
Africa)
WORLDWIDE Loans Grants Guarantees Equity Risk
Sharing
Technical
Assistance
Interestrate
subsidies
C WORLDBANK
C1
InternationalDevelopmentAssociation(IDA)
WorldBankGroup
14.4billion(USD)
(investmentsinelectricityinsub-Saharan
Africabetween2005and2015)
C2
InternationalBankforReconstructionandDevelopment(IBRD)
WorldBankGroup
C3
InternationalFinanceCorporation(IFC)
WorldBankGroup
C4
MultilateralInvestmentGuaranteeAgency(MIGA)
WorldBankGroup
DAfricanDevelopmentBank(AfDB)
D1
LightUpandPowerAfrica–ANewDealonEnergyforAfrica
AfDB
12billion(USD)
60-90billionstillrequiredfromexternal
sources2015-2025
D2 EnergySectorLoans AfDB 840million
(USD)
D3Africa50InfrastructureFund
23Africangovernments,twocentral
banksandtheAfrican
DevelopmentBank
700million(USD)
(fund’scapital)2015-Present
E USA
E1 PowerAfrica USA 7billion(USD)2013-Present
F ARABCOUNTRIES

1255 Amsterdam Ave, New York, NY 10027 | http://energypolicy.columbia.edu | @ColumbiaUEnergy
F1
ArabBankforEconomicDevelopmentinAfrica(BADEA)
Member-statesoftheArabLeague
1.6billion(USD)
2015-2019(notonlyenergy)
F2 ArabFund(AFESD)
Member-statesoftheArabLeague
10billion(USD)
1974-Present(notonlyenergy)
F3
KuwaitFundforArabEconomicDevelopment(KFAED)
Kuwait
1.3billion(USD)
(notonlyenergy)
1961-Present
F4IRENA/ADFDProjectFacility
AbuDhabiFundfor
Development
350million(USD)Present(notonlyAfrica)
F5
OPECFundforInternationalDevelopment(OFID)–EnergyPovertyProgram
OPECMembers
5.28billion(USD)
2007-2030(fund)
G CHINA
G1China-AfricaDevelopmentFund(CAD)
ChinaDevelopmentBankandEximBankofChina
3billion(USD);estimatedtogrowto5billion
2007-Present
G2Akon’sLightingAfrica
ChinaJiangsuInternationalEconomicAndTechnical
CooperationGroup
1billion(USD)creditline2014-2030
H MULTILATERAL Loans Grants Guaran
tees Equity RiskSharing
Technical
Assistance
Interestrate
subsidies
H1GreenClimateFund(GCF)
42countries 10.3Billion
(USD)2010-Present
H2
GlobalEnvironmentalFacility(GEF)
39countries 3.2billion(USD)
1991-Present
H3
SustainableEnergyforAll(SE4ALL)SustainableEnergyFund
AfDB,UN,WorldBank
Donors:
Denmark,Italy,UK,US
95million(USD)
(fund’scapital)Present

1255 Amsterdam Ave, New York, NY 10027 | http://energypolicy.columbia.edu | @ColumbiaUEnergy
forAfrica(SEFA)
H4
TheElectrificationFinancingInitiative(ElectriFI)
Donors:ECandUSA(Power
Africa)
115million(EUR)
2016-present
H5
TheAfricaRenewableEnergyInitiative(AREI)
Partners:AfricanUnion,NEPAD,AfDB,UNEP,IRENA
Donors:Germany,France,
Canada,Italy,Japan,UnitedKingdom,USA,EU,Sweden,Canada,Japan
(alsoviaexisting
instruments)
>10billion
(USD)2015-Present
H6
ClimateInvestmentFunds(CIF)CleanTechnologyFund(CTF)
Australia,Canada,Denmark,France,Germany,
Japan,Korea,Netherlands,Norway,Spain,
Sweden,Switzerland,UK,US
5.8billion(USD)
(globalandnotonlyenergy)
3.8billion(USD)
(onlyenergy)
Present
H7
StrategicClimateFund(SCF)ScalingUpRenewableEnergyinLowIncomeCountriesProgram(SREP)
Australia,Canada,Denmark,France,Germany,
Japan,Korea,Netherlands,Norway,Spain,
Sweden,Switzerland,UK,US
839million
(USD)2008-Present
I PPP/PRIVATE Loans Grants Guaran
tees Equity RiskSharing
Technical
Assistance
Interestrate
subsidies
I1
TheGlobalEnergyEfficiencyandRenewableEnergyFund(GEEREF)
Advisor:EIBDonors:EC,Germany,Norway,24privateinvestors
334million(EUR)
(fund’scapital)2008-Present
I2
AfricanRenewableEnergyFund(AREF)
AfricanDevelopmentBank,GEEREF,
EIB,GEF,
200million(USD)
(fund’scapital)2014-Present

1255 Amsterdam Ave, New York, NY 10027 | http://energypolicy.columbia.edu | @ColumbiaUEnergy
SustainableEnergyFundforAfrica
(SEFA),WestAfrican
DevelopmentBank(BOAD),EcowasBankforInvestment
andDevelopment(EBID),FMO,
CalvertInvestments,UK(CDC),BIO,Austria(OeEB)
I3EnergyAccessVenturesFund(EAV)
EIB,UK(CDC),OPEC(OFID),France(FFEMandProparco),SchneiderElectric
55million(EUR)
(fund’scapital)2015-Present
I4
GlobalClimatePartnershipFund(GCPF)
Denmark,WorldBank
(IFC),DeutscheBank,FMO,Germany(KfW),UK
Austria(OeEB),responsAbility,ÄrzteversorgungWestfalen-Lippe,ASN
Bank
331million(USD)
(fund’scapital)2010-Present
I5
ImpactAssetsEmergingMarketsClimateFund
CalvertFoundationand
PrivateInvestors
2.24million(USD)
(fund’scapital)2015-Present
I6
Rassembleursd’EnergiesSolidarityInvestmentFund
ENGIEGroup
15million(EUR)
(fund’scapital)2010-Present
I7 VantageGreenXFund
SouthAfricanPensionFunds
220million(USD)
(fund’scapital)2013-Present
I8
InfraCoAfrica–SubSaharaInfrastructureFund
PrivateInfrastructureDevelopmentGroup(PIDG)
126million(USD)
(fund’scapital)Present
I9responsAbility–EnergyAccessFund
IFC,Shellfoundation,EIB
30million(USD)
(fund’scapital)2003-Present
I10 VitalCapitalII PrivateInvestors
500million(USD)
(fund’scapital)

1255 Amsterdam Ave, New York, NY 10027 | http://energypolicy.columbia.edu | @ColumbiaUEnergy
Present
I11 GroFinSGBFund
ShellFoundation,Germany(KfW),TheNorwegianInvestmentFundfor
DevelopingCountries,
Norfund,theDutchGoodGrowthFund(DGGF),GroFinRiskCapitalFacility,andGroFinMENA.
150million(USD)
(fund’scapital)2014-Present
I12 AcumenFund
Donorsandinternationaldevelopmentagencies
64million(USD)
(fund’scapital)2001-Present
I13 GuarantCo
PrivateInfrastructureDevelopmentGroup(PIDG)(Australia,UK,
TheNetherlands,Switzerland,Sweden)
300million(USD)
(fund’scapital)2016-Present
I14 DIFrontierInvestment
CDC,PensionDenmark,PFAPension,TrygInsurance,
GEEREF,DanishInvestmentFundfor
DevelopingCountries,Seed
CapitalAssistance
Facility(SCAF)fundedbyAfDB
andUNEP
200million(USD)
(fund’scapital)2011-Present
I15
EmergingAfricaInfrastructureFund(EAIF)
PrivateInfrastructureDevelopmentGroup(PIDG)(UK,The
Netherlands,Sweden,
Switzerland),Germany(KfW),TheNetherlands(FMO),SBSA,StandardCharter
587million(USD)
(fund’scapital)2002-Present
1255 Amsterdam Ave, New York, NY 10027 | http://energypolicy.columbia.edu | @ColumbiaUEnergy
Investors,OPIC,DukeEnergy
I17
LerekoMetierSustainableCapitalfund(LMSC)
IFC,Lereko,FMO,DEG,SouthAfrica
PIC
120million(USD)
(fund’scapital)Present
I18
InspiredEvolutionInvestment–EvolutionOneFund
CyaneHoldingsLtd,QuantumPower,Geeref,Ifc,Finnfund,
Sifem,Norfund,Afdb,Idc,Scaf
250million(USD)
(fund’scapital)2008-Present
I19
ApolloInvestmentPartnershipll(Apollo)
IDEASManagedFund,
AfricanInfrastructureInvestment
fund2,ApolloInvestment
Partnership2,cookhouseCommunityTrust,AFPOC
50million(USD)
(fund’scapital)2012-Present
Source: Authors’ elaboration, June 2017.
Simone Tagliapietra is a senior researcher at the Fondazione Eni Enrico Mattei, Italy, and Research Fellow at Bruegel, Belgium. He received his PhD from the Universita Cattolica del Sacro Cuore, Italy, where he lectures on energy economics and policy.
Morgan Bazilian is a non-resident fellow at the Center on Global Energy Policy at Columbia University, a senior associate at the Center for Strategic and International Studies, a research associate at the University of Cambridge, and an affiliate professor at the Royal Institute of
Technology, Stockholm, Sweden.

1255 Amsterdam Ave, New York, NY 10027 | http://energypolicy.columbia.edu | @ColumbiaUEnergy
References Enerdata (2017), Review of the African Solar Market, Public Webinar, February 7.
European Union Energy Initiative Partnership Dialogue Facility (2016), Mapping of Energy Initiatives and Programs in Africa, Eschborn.
International Energy Agency (2014), Africa Energy Outlook, World Energy Outlook Special Report, IEA/OECD, Paris.
International Energy Agency (2016a), Boosting the Power Sector in Sub-Saharan Africa. China’s Involvement, IEA/OECD, Paris.
International Energy Agency (2016b), World Energy Outlook 2016, IEA/OECD, Paris.
International Monetary Fund (2013), Energy Subsidy Reform in Sub-Saharan Africa. Experiences and Lessons, African Department Working Paper, Washington, D.C.
International Monetary Fund (2015), How Large Are Global Energy Subsidies?, IMF Working Paper, Washington, D.C.
Keohane, Robert O., and David G. Victor. "The regime complex for climate change." Perspectives on politics 9.1 (2011): 7-23.
Mentis, D. et al. (2017), Lighting the World. The first global application of an open source, spatial electrification tool (ONSSET), with a focus on Sub-Saharan Africa, Division of Energy Systems Analysis Working Paper Series, DESA/17/2, Royal Institute of Technology, Stockholm.
Organisation for the Economic Cooperation and Development, Development Finance Database, available at: http://www.oecd.org/dac/financing-sustainable-development/development-finance-data/
Quitzow, R. et Al. (2016), The Future of Africa’s Energy Supply, Institute for Advanced Sustainability Studies, Potsdam.
Tagliapietra, S. (2017), Electrifying Africa: How to Make Europe’s Contribution Count, Policy Contribution, Issue 2017/17, Bruegel, Brussels
Trimble, C. et al. (2016), Financial Viability of Electricity Sectors in Sub-Saharan Africa: Quasi-Fiscal Deficits and Hidden Costs, Policy Research Working Paper 7788, World Bank, Washington, D.C.
United Nations (2015), Transforming our world: the 2030 Agenda for Sustainable Development, Resolution adopted by the General Assembly on 25 September 2015, New York.
Word Bank (2016), Regulatory Indicators for Sustainable Energy. A Global Scorecard for Policy Makers, Washington, D.C.
World Bank (2017a), Global Tracking Framework 2017, Washington, D.C.
World Bank (2017b), State of Electricity Access Report 2017, Washington, D.C.
World Bank, World Development Indicator Database, available at: http://www.worldbank.org/?cid=ECR_GA_HPlaunch_searchad_EN_EXTP&gclid=CKyDw7Pb29QCFWMz0wodcUcNCQ
World Health Organisation (2014), Burden of disease from Household Air Pollution for 2012, Geneva.