THE ROLE OF INFLAMMTION IN TYPE II DIABETES
28
1 MQP-BC-DSA-9805 THE ROLE OF INFLAMMTION IN TYPE II DIABETES A Major Qualifying Project Report Submitted to the Faculty of the WORCESTER POLYTECHNIC INSTITUTE in partial fulfillment of the requirements for the Degree of Bachelor of Science in Biochemistry by _________________________ Nicholas Tsitsilianos April 28, 2011 APPROVED: _________________________ _________________________ Jason Kim, Ph.D. David Adams, Ph.D. Program in Molecular Medicine Biology and Biotechnology UMASS Medical Center WPI Project Advisor Major Advisor
Transcript of THE ROLE OF INFLAMMTION IN TYPE II DIABETES

1
MQP-BC-DSA-9805
THE ROLE OF INFLAMMTION IN TYPE II DIABETES
A Major Qualifying Project Report
Submitted to the Faculty of the
WORCESTER POLYTECHNIC INSTITUTE
in partial fulfillment of the requirements for the
Degree of Bachelor of Science
in
Biochemistry
by
_________________________
Nicholas Tsitsilianos
April 28, 2011
APPROVED:
_________________________ _________________________
Jason Kim, Ph.D. David Adams, Ph.D.
Program in Molecular Medicine Biology and Biotechnology
UMASS Medical Center WPI Project Advisor
Major Advisor

2
ABSTRACT
Insulin resistance is one of the main causes of Type II diabetes. Recent studies have
shown that inflammation plays a key role in the onset of insulin resistance. A high fat diet and
elevated levels of inflammatory cytokines have been found to interfere with insulin signaling. In
this study, we explored the effect of a high fat diet on insulin resistance in immunodeficient
mice. Following a high fat diet, these NOD-scidILrnull mice remained leaner and significantly
more insulin-sensitive compared to their wild type counterparts. These data will aid our
understanding of how inflammation promotes insulin resistance.

3
TABLE OF CONTENTS
Signature Page ..................................................................................................................... 1
Abstract ................................................................................................................................ 2
Table of Contents ................................................................................................................. 3
Acknowledgements .............................................................................................................. 4
Background .......................................................................................................................... 5
Project Purpose ................................................................................................................... 15
Methods............................................................................................................................... 16
Results ................................................................................................................................. 19
Discussion ........................................................................................................................... 24
Bibliography ....................................................................................................................... 27

4
ACKNOWLEDGEMENTS
First, I would like to thank Dr. Jason Kim for allowing me to work in his lab at UMass
Medical School, for offering his guidance in establishing my project purpose, and for his input in
my final report. I would also like to thank Dr. Hwi-Jin Ko for teaching me the many techniques
that were involved in the MQP. Finally, yet importantly, a special thanks to Professor David
Adams for guiding me through the MQP process, advising me along the way, and for helping in
the editing of the final report.

5
BACKGROUND
Diabetes is a metabolic disorder affecting millions of individuals worldwide. Diabetes is
a disease in which the body becomes unable to use glucose as a source of energy, and this failure
to utilize the body’s main source of energy has many severe ramifications. Because the patient is
unable to produce or respond to insulin (depending on the type of diabetes), this disease prevents
glucose from being delivered inside cells in the body either for immediate use, or storage for
later. According to the American Diabetes Association (2010), 25.8 million people currently
suffer from this disorder in the United States. There does not seem to be any gender
discrimination with diabetes, affecting about 11.8% of men under the age of 20, and 10.8% of
women in the same age group (American Diabetes Association, 2010).
Diabetes: Types I and II
The two main types of diabetes are type I and type II. Type I diabetes is an autoimmune
disease that destroys the pancreatic islet beta cells and keeps them from creating and secreting
insulin. In this type, the body’s own T-lymphocytes target the pancreatic beta cells leading to
their destruction. The lack of insulin prevents the body from maintaining homeostatic levels of
carbohydrates and fats circulating throughout the body. Type I diabetes commonly affects
children (and is sometimes termed juvenile onset diabetes), but it also occasionally presents in
the adult population. Recent statistics show that nearly 1 in every 400 children and adolescents
has type-1 diabetes (American Diabetes Association, 2010). The more common type II diabetes,
which mostly affects adult patients, is frequently associated with poor diet and obesity, and
causes the body to become unresponsive to the insulin that is produced.

6
Diabetes Physiology: Mechanism and Role of Insulin Receptors
Delivering the necessary energy to and from cells is performed by the body’s
metabolism. Two hormones essential for this process are insulin and glucagon. The homeostasis
of the blood levels of glucose, fatty acids, triglycerols, and amino acids is maintained by these
two hormones working in unison to take up and delivery energy to the body (Herrera, 2000).
These two hormones are secreted by pancreatic cells known as the islets of Langerhans. The
islets are composed of alpha, beta, and gamma cells. The alpha and beta cells are responsible for
secreting glucagon and insulin, respectively, and the gamma cells secrete somatostatin, which
helps regulates the secretion of growth hormone. The body is extremely sensitive to the amounts
of glucose in the circulatory system. The body responds when glucose levels fluctuate from the
normal range, between 5 to 8 mmol/l. When glucose levels dip below 5 mmol/l, the body
increases the amount of glucose in the blood by secreting glucagon, which signals the body to
break down glycogen reserves into glucose for use, in a process known as gluconeogenesis. The
body frequently experiences low glucose levels in the morning hours after fasting overnight.
Alternatively, when blood glucose levels rise above 8 mmol/l, such as after the ingestion of a
meal, beta cells release insulin to signal the uptake of glucose into cells. The glucose taken up
by the cell is then used as an immediate energy source, or is converted to glycogen through a
process known as glycogenesis. This glucose homeostasis balancing act is shown in Figure 1.

7
Figure 1: Glucagon and Insulin Secretion. The figure shows the two
scenarios that occur during an imbalance in plasma glucose levels. When the
body is no longer in homeostatic levels of glucose in the blood, the secretion of
insulin (the bottom half of figure 1) or glucagon (the top half of figure 1) is
performed to re-establish homeostasis. (Freudenrich, 2010)
The pancreatic hormones are produced through a series of pathways in the endocrine
system. When plasma glucose levels are above or below the normal levels, signals are sent to
the brain. In normal insulin-sensitive individuals, the body will sense the increase in blood
glucose levels and signal to the pancreas to secrete more insulin. This newly secreted insulin
travels through the blood stream and binds insulin receptor sites located on tissues such as liver
and muscle. The binding of insulin to its receptor triggers a cascade of intracellular signaling
that allows the cells to take up more glucose via glucose transporters (Figure-2). When insulin
binds its receptor, the receptor is auto-phosphorylated which leads to a series of signaling events
that culminate with the up-regulation of glucose transporters on the cell surface that bind glucose
and transport it inside the cell (White, 1997).

8
Figure 2: Diagram of Insulin Signaling Pathway. Figure illustrates the
cascade of signaling events that occur when insulin molecules bind the insulin
receptor (diagram upper center) resulting in auto-phosphorylation. The end
result is the migration of the glucose transporter GLUT storage vesicle to the
cell surface to bind glucose and transport it into the cell. (SABiosciences, 2010)
Type II Diabetes: Insulin Resistance and its Various Mechanisms
Although Type II diabetes is the more common type, less is known about its various
causes. All type II patients show one consistent phenotype, insulin resistance, a lack of response
to secreted insulin. This resistance is a notable characteristic of diseases such as high blood
pressure and heart disease, and is primarily associated with type II diabetes. Insulin resistance
can be observed 10 to 20 years before the onset of Type II diabetes (Shulman, 2000). In
response to decreased insulin sensitivity, the pancreas secretes more insulin to compensate.
Diabetes results when the increased levels of insulin are insufficient to compensate for the
insulin resistance. Insulin resistance can manifest in three types: 1) increased amounts of insulin

9
are required to elicit normal physiological responses; 2) the increased levels of insulin are
insufficient to maintain glucose homeostasis; 3) a combination of the first two (Proietto et al.,
1982).
Fatty Acid-Induced Insulin Resistance
One mechanism that can induce insulin resistance is an increased level of plasma free
fatty acids. Since free fatty acids compete with glucose for substrate oxidation, one model
proposes that increased fat oxidation associated with obesity causes insulin resistance (Shulman,
2000). The increased fatty acid levels directly affect insulin signaling and diminish glucose
uptake (Figure-3). Other factors such as adipokines secreted by adipose tissue may also lead to
diminished glucose uptake (Mlinar et al., 2006).
Figure 3: Two Proposed Mechanisms for Fatty Acid Induced Insulin
Resistance. The top diagram shows fatty acid-induced insulin resistance
occurring in skeletal muscle, and focuses on the role of mitochondria and an
inhibition of phosphofructokinase which would increase intra-cellular levels of

10
glucose-6-phosphate and inhibit the activity of hexokinase II, increasing
intracellular glucose and decreasing the amount of glucose taken up by the
muscle. The bottom diagram is an alternative mechanism in which increased
levels of fatty acid in the muscle leads to the activation of a serine/threonine
kinase cascade, which initiates phosphorylation of serine/threonine sites on the
insulin receptor substrates, causing insulin resistance. (Shulman, 2000)
ER Stress in Type II Diabetes
The endoplasmic reticulum (ER) is a highly specialized organelle that functions with
intracellular trafficking, and lipid and protein synthesis. The ER synthesizes transmembrane
proteins and lipids for most cells, and is responsible for the synthesis of almost all secreted
proteins. The ER also has an important role in Ca
2+ storage and signaling. Thus, the ER is a
multi-functional organelle that functions in organogenesis, transcriptional activity, stress
responses, and apoptosis (Berridge, 2002). With respect to diabetes, ER
stress plays a role in
β-cell loss and insulin resistance. In the presence of high glucose levels, insulin production in
the ER as a secreted protein can exceed 10-fold normal levels which can stress the ER,
increasing the chances of incorrect protein folding. When the ER is stressed, it utilizes an
unfolded protein response (UPR) (Berridge, 2002), which aims to halt protein translation to
restore normal folding. The response normally includes the production of molecular chaperones,
which aid in the protein folding process. However, prolonged exposure to ER stress can be
detrimental to β-cell function (Eizirik et al., 2008). Therefore, chronic levels of glucose and fatty
acids which exceed the normal range inflict a great deal of stress on the ER, affect insulin folding
and production, and ultimately lead Type II diabetes.

11
Mitochondrial Oxidative Stress in Type II Diabetes
Another organelle whose impairment is related to diabetes is the mitochondrion. Studies
have shown that subjects with a history of diabetes in their family experience reduced rates of
mitochondrial ATP synthesis in the mitochondria, before experiencing any diminished tolerance
for glucose, providing evidence that mitochondrial dysfunction plays a significant role in the
onset of diabetes (Petersen et al., 2004). Within β-cells, an ATP/ADP ratio determines the
opening and closing of the KATP channel that allows the secretion of insulin, thus mitochondrial
dysfunction affects glucose-induced insulin secretion (Lowell and Shulman, 2005). As glucose is
normally processed into pyruvate in the cytoplasm, the pyruvate enters the mitochondria, and the
ratio of ATP/ADP increases. The increase in the ATP/ADP ratio eventually triggers the
exocytosis of insulin secretory vesicles by the β-cells via a cascade of events including the
closing of ATP-sensitive K+ channels, and the depolarization of voltage-sensitive Ca2+ channels
(Rolo and Palmeira, 2006). However, when this ATP/ADP ratio increases too high, hyper-
polarization of the mitochondrial membrane occurs. The proton gradient’s high electrochemical
potential difference, which is indicative of a high glucose state, eventually causes partial
inhibition of the electron transport in complex III (Rolo and Palmeira, 2006). Electron transport
complex III is one of the four complexes responsible for transporting electrons along the inner
mitochondrial membrane, and helps transfer H+ ions across the membrane to establish the proton
gradient. As a result of complex III’s inhibition, electrons accumulate at a molecule known as
coenzyme Q, another member of the electron transport chain. Free radical anions are then
formed from the partial reduction of O2. This accelerated reduction of coenzyme Q appears to be
the fundamental cause of mitochondrial dysfunction leading to diabetes-related metabolic
disorders (Rolo and Palmeira, 2006).

12
Type II Diabetes Mouse Models
To better understand diabetes, scientists have developed several types of mouse models
that mimic the disease. The Akita mouse contains a C96Y mutation in the insulin-2 gene, which
prevents disulfide bonds from connecting insulin A and B chains together. This results in the
accumulation of misfolded pro-insulin molecules in the ER, and eventually causes diabetes from
β-cell loss induced by ER stress (Eizirik et al., 2008).
Another model, known as the Munich mouse, has a C95S mutation in the insulin gene,
resulting in a loss of the disulfide bond of the intra-A chain. The loss of this bond leads to
insulinopenic glucose tolerance in mice that are heterozygous, and causes severe diabetes in mice
that are homozygous (Eizirik et al., 2008).
Tfam-mutant mice develop diabetes from having a knockout of the nuclear gene Tfam
in pancreatic β-cells, which causes impaired insulin secretion and β-cell loss. Tfam, a
transcriptional activator imported into mitochondria, is essential for mtDNA expression and
maintenance. These mice can be used to investigate how mitochondrial dysfunction affects
diabetes since they also show severe mtDNA depletion, deficient oxidative phosphorylation, and
abnormal-appearing mitochondria (Rolo and Palmeira, 2006).
The non-obese diabetic-severe combined immunodeficient (NOD-SCID) mouse was
reported in 1995 (Shultz et al., 1995) and was generated by crossing a NOD mouse with a SCID
mouse. In contrast to the NOD mouse, which is our best model to date for Type I diabetes, the
NOD-SCID mouse lacks an immune system so lacks the autoreactive T cells which destroy the
islet tissue in Type I diabetes. This mouse does not have the phenotype of type 1 diabetes which
is a major characteristic of NOD mouse. Type-1 diabetes is an autoimmune disease in which
insulin-producing -cells are destroyed by T cells (the T and B lymphocytes in this mouse fail to

13
properly rearrange their antigen-specific receptors and fail to generate functional T or B cells).
The NOD-scidILrnull mouse has the targeted mutation in the IL2 receptor common chain
gene (IL2r). The IL2r chain is required for high-affinity signaling through the IL2, 4, 7, 9, 15
and 21 receptors. The receptor also directs the growth and maturation of lymphocyte subtypes: T
cells, B cells, and natural killer cells so mutation of this gene in mice exhibits severe impairment
in innate and adaptive immunity. Recent studies have shown that insulin resistance is related to
inflammation and our previous study found the increase of various inflammatory markers in
skeletal muscle characterized by insulin resistance. Based on these results, we selected this
NOD-scidILrnull mouse model in order to identify the role of inflammation in type-2 diabetes.
Kim Lab Interests in Immune System Involvement in Type II Diabetes
Dr. Jason Kim, a Professor of Molecular Medicine at the University of Massachusetts
Medical School, is involved in a variety of research projects involving Type II diabetes and
metabolism in general. One project is currently investigating the relationship between Type II
diabetes and the immune system. Although Type II is not considered an autoimmune disease like
Type I, there is evidence of a relationship between type II and the immune system. One line of
evidence is the link between inflammation and insulin resistance. Although their role is
complex, it is clear that immune molecules such as macrophages, lymphocytes, etc. are involved
in atherosclerosis and obesity, which are associated with insulin resistance syndrome (Tracy and
Lewis, 2002). In 1993, the discovery of the overexpression of TNF-α in adipose tissue of obese
individuals allowed Hotamisligil et al. to conclude there is a relationship between inflammatory
cytokines and insulin activity in type II diabetes (Hotamisligil and Spiegelman, 1993).
Cytokines are hormones involved with cellular signaling that are produced by the immune

14
system and nervous system. When an individual becomes obese, macrophages penetrate adipose
tissue and cause the adipose cells to secrete inflammatory cytokines such as TNF-α (Kim, 2010).
TNFα is released from macrophages and lymphocytes after inflammatory stimulation, trauma, or
as previously mentioned by obesity. Among its multiple types of signal transductions, TNFα
signals the activation of c-Jun NH2-terminal kinase-1 (JNK-1) which helps regulate energy
balance, and glucose and lipid homeostasis in a variety of tissues (Aguirre et al., 2000) (Figure-
4). When bound to insulin receptor substrate-1 (IRS-1), JNK-1 is phosphorylated at a key serine
residue (not tyrosine) which prevents insulin signaling, leading to insulin resistance (Aguirre et
al., 2000).
Figure 4: The Role of JNK in Insulin Resistance. Each labeled number
indicates observations made with mice deficient in JNK1 in adipose tissue, liver,
skeletal muscle, or nervous system: 1) In adipose tissue, JNK1 promotes the
secretion of interleukin-6 (IL-6) which causes hepatic insulin resistance in
obesity, 2) In liver, JNK1 reduces lipid metabolism and insulin clearance,
thereby preventing hepatic steatosis and decreasing insulin resistance, 3) In
skeletal muscle, JNK1 mediates insulin resistance, adipose tissue inflammation,
and suppresses muscle lipoprotein lipase thereby altering circulating triglyceride
levels, and 4) In the nervous system, JNK1 mediates the negative feedback
regulation of hypothalamic pituitary-thyroid axis and promotes negative energy
balance by increasing food intake and reducing energy expenditure. (Kim,
2010)

15
PROJECT PURPOSE
Various factors induce insulin resistance in type-2 diabetes. Recently, many investigators
found that insulin resistance is related to inflammation. In our lab’s previous data we established
that inflammation was induced in skeletal muscle with insulin resistance after a short-term high-
fat diet. To further investigate this relationship between insulin resistance and inflammation, we
assessed glucose metabolism and insulin resistance in diabetic immune-deficient mice.

16
METHODS
Body Composition
The 1H-MRS instrument was used to measure the changes in the mouse’s total body
weight, fat mass, and lean mass. Body composition of the mice was measured weekly. The 1H-
MRS machine allowed the measurements to be taken while the mice were fully awake.
Metabolic Cage
Metabolic cages were used in conscious mice to measure energy expenditure, physical
activity, and food/water intake. Energy expenditure was calculated by measuring O2
consumption and CO2 production in individual mice. Physical activity was calculated by
quantitative measurement of horizontal and vertical movement (XYZ-axis) for 3 days. Twelve
mice were measured at a time (6 NOD-scidILrnull and 6 wild-type). The metabolic cages were
performed on both normal chow and 4 weeks of high-fat diet (55% fat).
Hyperinsulinemic-Euglycemic Clamp
A hyperinsulinemic-euglycemic clamp (Figure-5) was used to measure glucose
metabolism in conscious mice. The clamp was performed on normal chow and 4 weeks of high-
fat diet with the NOD-scidILrnull mice and wild type mice. Following the basal period, a 2-hr
hyperinsulinemic-euglycemic clamp was conducted with a primed (150 mU/kg body weight) and
continuous infusion of human insulin at a rate of 15 pmol/kg/min to raise plasma insulin within a
physiological range. Blood samples were collected at 10~20 min intervals for the immediate
measurement of plasma glucose, and 20% glucose was infused at variable rates to maintain basal
glucose levels. Insulin-stimulated whole body glucose metabolism was estimated with a

17
continuous infusion of [3H]glucose throughout the clamps (0.1 µCi/min). To estimate insulin-
stimulated glucose uptake in individual organs, 2-[1-14
C]deoxy-D-glucose (2-[14
C]DG), which is
a non-metabolizable glucose analogue, was administered as a bolus (10 µCi) at 75 min after the
start of clamp. Blood samples were taken at 80, 85, 90, 100, 110, and 120 min of clamp for the
measurement of plasma [3H]glucose,
3H2O, and 2-[
14C]DG concentrations. An additional blood
sample was taken at 120 min to measure plasma insulin concentrations (clamp parameters). At
the end of clamp, mice were anesthetized, and tissue samples were taken for biochemical and
molecular analyses. Both the 3H-glucose and 2-[1-14
C]deoxy-D-glucose were purchased from
PerkinElmer.
Figure 5: The Hyperinsulinemic-Euglycemic Clamp. This
figure shows conscious mice inside oversized restrainers. The
mouse’s tail is exposed from the back of the restrainer in order
to take blood samples.
Whole Body Assay
The Whole body assay was performed following each clamp to measure the radioactivity
in each of the plasma samples taken during the clamp. Barium hydroxide monohydrate (0.3 N)
as well as Zinc sulfate heptahydrate (0.3 N), which were purchased from Sigma-Aldrich, were
used to deproteinize plasma samples to measure whole body glucose metabolism. A scintillation

18
cocktail and liquid scintillation counter, with dual channels for the separation of 3H and
14C,
were used to measure radioactivity in plasma samples. Basal whole body glucose turnover was
determined as the ratio of the [3H]glucose infusion rate to the specific activity of plasma glucose
at the end of basal period. Insulin-stimulated whole body glucose uptake was determined as the
ratio of the [3H]glucose infusion rate to the specific activity of plasma glucose during the final 30
min of clamps. Hepatic glucose production during insulin-stimulated state (clamp) was
determined by subtracting the glucose infusion rate from the whole body glucose uptake. Whole
body glycolysis was calculated from the rate of increase in plasma 3H2O concentration from
90~120 min of clamps. Whole body glycogen plus lipid synthesis was estimated by subtracting
whole body glycolysis from whole body glucose uptake.

19
RESULTS
Four groups of mice were studied during the project: 1) C57BL/6J wild-type mice on a
normal diet, 2) NOD-scidILrnull mice on a normal diet, 3) C57BL/6J mice on a high-fat diet for
4 weeks, and 4) NOD-scidILrnull mice on a high-fat diet for 4 weeks. Body composition was
measured weekly to observe the changes in fat mass and lean mass of both mice on both diet
conditions (Figure-6). The fat mass of wild-type mice increased threefold on the high-fat diet
compared to standard chow, but there was no significant change in fat masses of NOD-
scidILrnull mice between chow and the high-fat diet condition. The body weight of wild-type
mice increased significantly after high-fat diet compared to chow diet in contrast to that of NOD-
scidILrnull mice.

20
Figure 6: Body composition data of wild-type and NOD-scidILrnull
mice (SCID) on normal chow diet and a high-fat diet.
After 4 weeks of chow and high-fat diet, wild-type mice and NOD-scidILrnull mice
were put in the metabolic cages and their food intake, physical activity, and energy expenditures
were measured for 3 days (Figure-7). Food intake and physical activity were significantly
reduced in wild-type mice after high-fat diet, but there was no significant change in food intake
and physical activity in NOD-scidILrnull mice. Interestingly, food intake was higher in NOD-
scidILrnull mice than wild-type mice on both chow and high-fat diet conditions. VO2
consumption, VCO2 production, and energy expenditure significantly decreased in wild type
mice after high-fat diet compared to NOD-scidILrnull mice.

21
Figure 7: Metabolic Cage Data. The graphs display comparisons of
food intake, water intake, physical activity, VO2 consumption, VCO2
production, respiratory exchange ratio, and energy expenditure in mice
on a high fat diet versus mice on a normal diet. The blue columns
represent the normal chow diet and the red columns represent the high
fat diet. NOD-scidILrnull (SCID) and wild-type (WT) columns are
labeled. The asterisk indicates a significant difference in the compared
groups.

22
Following a 4 weeks of normal chow and a high-fat diet, a hyperinsulinemic-euglycemic
clamp was performed on each group of mice to assess glucose metabolism (Figure-8). NOD-
scidILrnull mice fed a chow diet were more insulin-sensitive than wild-type mice, as indicated
by significant increases in steady-state glucose infusion rates and whole-body glucose turnover
during clamp. Following high-fat diet, NOD-scidILrnull mice remained more insulin-sensitive
and showed a ~ 40% increase in insulin-stimulated whole-body glucose turnover, and more than
a twofold increase in while-body glycogen plus lipid synthesis compared with the high-fat diet
wild-type mice. Hepatic insulin action in the NOD-scidILrnull mice was much higher than that
in wild-type mice on both chow and high-fat diet conditions.

23
Figure 8: Hyperinsulinemic-Euglycemic Clamp Data. The graphs
show the changes in glucose infusion rate, hepatic insulin action, whole
body glycolysis, whole body glycogen synthesis and whole body
glucose turnover in mice on a high fat diet versus on a normal diet.
The black columns represent the normal wild-type (WT) mice and the
red columns represent the NOD-scidILrnull mice. The asterisk
indicates a significant difference in the compared groups.
24
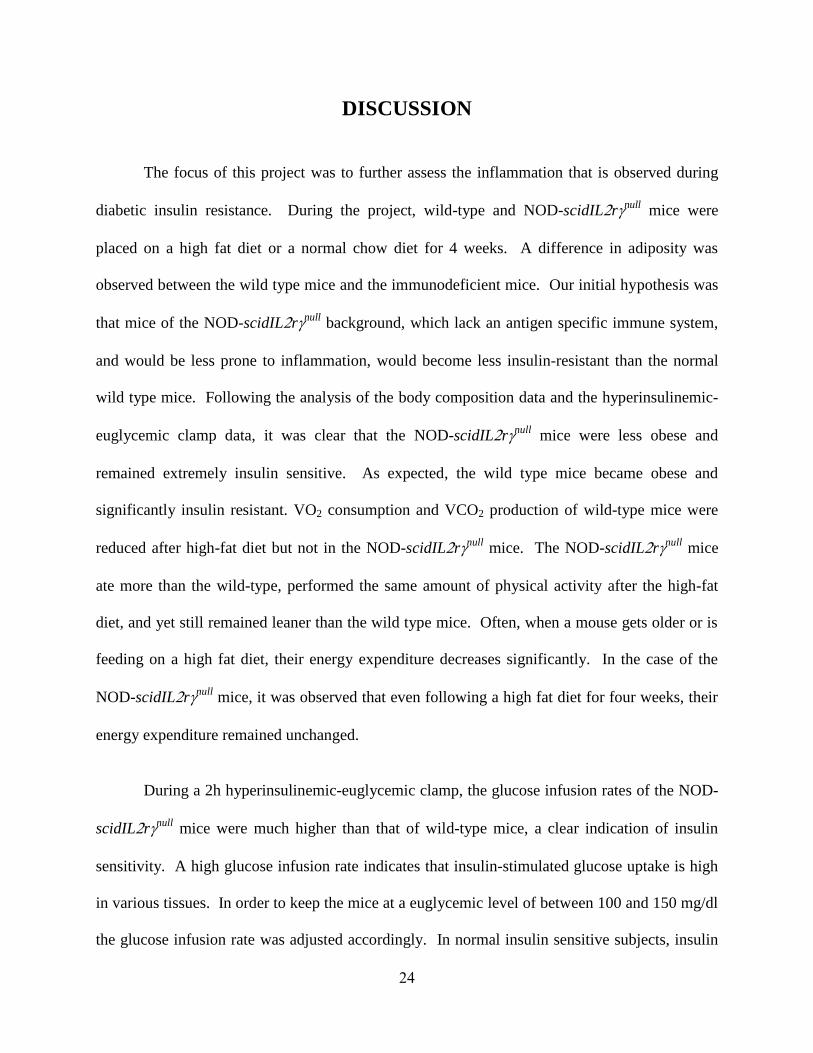
DISCUSSION
The focus of this project was to further assess the inflammation that is observed during
diabetic insulin resistance. During the project, wild-type and NOD-scidILrnull mice were
placed on a high fat diet or a normal chow diet for 4 weeks. A difference in adiposity was
observed between the wild type mice and the immunodeficient mice. Our initial hypothesis was
that mice of the NOD-scidILrnull background, which lack an antigen specific immune system,
and would be less prone to inflammation, would become less insulin-resistant than the normal
wild type mice. Following the analysis of the body composition data and the hyperinsulinemic-
euglycemic clamp data, it was clear that the NOD-scidILrnull mice were less obese and
remained extremely insulin sensitive. As expected, the wild type mice became obese and
significantly insulin resistant. VO2 consumption and VCO2 production of wild-type mice were
reduced after high-fat diet but not in the NOD-scidILrnull mice. The NOD-scidILrnull
mice
ate more than the wild-type, performed the same amount of physical activity after the high-fat
diet, and yet still remained leaner than the wild type mice. Often, when a mouse gets older or is
feeding on a high fat diet, their energy expenditure decreases significantly. In the case of the
NOD-scidILrnull mice, it was observed that even following a high fat diet for four weeks, their
energy expenditure remained unchanged.
During a 2h hyperinsulinemic-euglycemic clamp, the glucose infusion rates of the NOD-
scidILrnull mice were much higher than that of wild-type mice, a clear indication of insulin
sensitivity. A high glucose infusion rate indicates that insulin-stimulated glucose uptake is high
in various tissues. In order to keep the mice at a euglycemic level of between 100 and 150 mg/dl
the glucose infusion rate was adjusted accordingly. In normal insulin sensitive subjects, insulin

25
causes the inhibition of glucose production from the liver. Hepatic insulin action in NOD-
scidILrnull mice was shown to be much higher than that in wild-type mice on both chow and
high-fat diet conditions. This result indicates that hepatic glucose production was more reduced
in NOD-scidILrnull mice compared to wild-type mice during the clamp, which illustrates that
the liver is insulin resistant in wild-type mice. As indicated by whole-body glucose turnover,
glycolysis and glycogen synthesis, NOD-scidILrnull mice used and stored more glucose even
though they were fed high-fat diet. These results indicate that NOD-scidILrnull mice remain
more insulin sensitive following high-fat diet, which may have come from the lack of
inflammatory responses.
There is a proven relationship between the immune system, inflammation and insulin
resistance. A previous study performed by Kim et al. (2010) which collaborated with Dr. Roger
Davis, demonstrated the relationship between inflammation and insulin resistance by observing
the activity of JNK-1 in mice following high-fat diet. Following the high fat diet in WT mice,
JNK-1’s activation by the cytokine TNF- caused phosphorylation of serine residues as opposed
to the normal tyrosine residues, thus inhibiting the normal phosphorylation cascade performed
during normal insulin signaling. Mice, which contained a selective deletion of JNK-1 in white
and brown adipose tissue, remained insulin sensitive, whereas normal mice became insulin
resistant following high-fat diet. The removal of JNK-1 prevented the inflammatory cytokine
from causing an abnormal signaling pathway and rescued the mice from insulin resistance.
Similarly in this project, the removal of an even larger component of the immune system in the
NOD-SCID mice caused the same event. Taken together, based on results of the previous JNK-1
study and our data, inflammation is one of the major causes to induce insulin resistance.

26
Further studies will measure the inflammation-related mediators and targets (for example
macrophages, TLR4, SOCS3, MCP-1, etc.), and will use immunoblots to measure the levels of
insulin signaling proteins from muscle, white adipose tissue, brown adipose tissue, and liver.
Future studies will also address whether the tissue-specific delivery of inflammation related
proteins using an AAV expression system can re-induce insulin-resistance in NOD-scidILrnull
mice following a high-fat diet. This study will further characterize the role of inflammation on
insulin resistance in type 2 diabetes.

27
BIBLIOGRAPHY
Aguirre, Vincent [et al.] (2000) The c-Jun NH2-terminal Kinase Promotes Insulin Resistance
During Association with Insulin Receptor Substrate-1 and Phosphorylation of Ser(307). Journal
of Biological Chemistry Vol. 275, pp. 9047-9054.
American Diabetes Association (2010) Diabetes Statistics [Online]. - January 26, 2010. -
http://www.diabetes.org/diabetes-basics/diabetes-statistics/.
Berridge, Michael J. (2002) The Endoplasmic Reticulum: A Multifunctional Signaling
Organelle. Cell Calcium. Vol. 32, pp. 235-249.
Eizirik, Décio L., Cardozo AK and Cnop M (2008) The Role for Endoplasmic Reticulum
Stress in Diabetes Mellitus. Endocrine Reviews. Vol. 29 pp. 42-61.
Freudenrich, Craig Ph.D. Blood Glucose and Insulin. How Diabetes works. Discovery Health,
2010. http://health.howstuffworks.com/diseases-conditions/diabetes/diabetes1.htm.
Herrera, Pedro Luis (2000) Adult Insulin- and Glucagon-Producing Cells Differentiate from
Two. Development. Vol. 127, pp. 2317-2322.
Hotamisligil Gökhan S. and Spiegelman Bruce M. (1993) Through thick and thin: Wasting,
obesity, and TNFα. Cell Press. Vol. 73, pp. 625-627.
Kim, Jason K. (2010) Inflammation and Insulin Resistance: An Old Story with New Ideas.
Korean Diabetes Journal. Vol. 34, pp. 137-145.
Lowell, Bradford B. and Shulman, Gerald I (2005) Mitochondrial Dysfunction and Type 2
Diabetes. Science Vol. 307, pp. 384-387.
Mlinar, Barbara [et al.] (2006) Molecular Mechanisms of Insulin Resistance and Associated
Diseases. Clinica Chimica Acta. Vol. 375, pp. 20-35.
Petersen, Kitt Falk [et al.] (2004) Impaired Mitochondrial Activity in the Insulin-Resistant
Offspring of Patients with Type 2 Diabetes. The New England Journal of Medicine. Vol. 350,
pp. 664-671.
Proietto J. [et al.] (1982) Validation of a Practical In Vivo Insulin Dose Response Curve in Man.
Metabolism. Vol. 31, pp 354-361.
Rolo, Anabela P. and Palmeira, Carlos M. (2006) Diabetes and Mitochondrial Function: Role
of Hyperglycemia and Oxidative Stress. Toxicology and Applied Pharmacology Vol. 212, pp.
167-178.

28
SABiosciences Insulin Receptor Pathway. SABiosciences. QIAGEN Company, 2010.
http://www.sabiosciences.com/pathway.php?sn=Insulin_Receptor_Pathway.
Shulman, Gerald I. (2000) Cellular Mechanisms of Insulin Resistance. Journal of Clinical
Investigation. Vol. 106, pp. 171-176.
Steinberg [et al.] (2006) Tumor Necrosis Factor α-Induced Skeletal Muscle Insulin Resistance
Involves Suppression of AMP-Kinase Signaling. Cell Metabolism. Vol. 4, pp. 465-474.
Tracy, Michael R. and Lewis, Russell P. (2002) The Role of the Immune System in the Insulin
Resistance Syndrome. Current Diabetes Reports. Vol. 2, pp. 96-99.
White MF (1997) The Insulin Signalling System and the IRS Proteins. Diabetologia. Vol. 40,
pp. S2-S17.
Shultz [et al.] (1995). Multiple defects in innate and adaptive immunologic function in
NOD/LtSz-scid mice. Journal of Immunology , Vol. 154, pp. 180-91.