The Role of Fluid Dynamics, Microstructure and Mucociliary ... · The Role of Fluid Dynamics,...
99
The Role of Fluid Dynamics, Microstructure and Mucociliary Clearance in the Micro- and Macroscopic Barrier Properties of Pulmonary Mucus Dissertation zur Erlangung des Grades des Doktors der Naturwissenschaften der Naturwissenschaftlich-Technischen Fakultät III Chemie, Pharmazie, Bio- und Werkstoffwissenschaften der Universität des Saarlandes von Julian Kirch Saarbrücken 2012
Transcript of The Role of Fluid Dynamics, Microstructure and Mucociliary ... · The Role of Fluid Dynamics,...

The Role of Fluid Dynamics, Microstructure and Mucociliary Clearance in the Micro- and Macroscopic
Barrier Properties of Pulmonary Mucus
Dissertation
zur Erlangung des Grades
des Doktors der Naturwissenschaften
der Naturwissenschaftlich-Technischen Fakultät III
Chemie, Pharmazie, Bio- und Werkstoffwissenschaften
der Universität des Saarlandes
von
Julian Kirch
Saarbrücken
2012

Tag des Kolloquiums: 31. Oktober 2012
Dekan: Prof. Dr. Wilhelm F. Maier
Vorsitzender: Prof. Dr. R.W. Hartmann
Berichterstatter: Prof. Dr. C.-M. Lehr
Prof. Dr. I. Bernhardt
Prof. Dr. B. Rothen-Rutishauser
Wissenschaftlicher Mitarbeiter: Dr. G.-W. Kohring
Für meine Frau Sabrina
“Reality is frequently inaccurate.”
The Hitchhikers Guide to the Galaxy, Douglas Adams

TABLE OF CONTENTS
i
Table of Contents
1. Summary .................................................................................................................. - 1 -
2. Zusammenfassung ................................................................................................... - 2 -
3. Introduction ............................................................................................................. - 3 -
3.1 Pulmonary Drug Delivery and Nanocarriers ..................................................... - 4 -
3.2 Mucus and Mucociliary Clearance .................................................................... - 7 -
3.3 Particle Mobility in Mucus and Hydrogels ...................................................... - 11 -
3.4 Aim of This Work ............................................................................................ - 15 -
4. Mucociliary Clearance of Nanoparticles ............................................................. - 17 -
4.1 Abstract ............................................................................................................ - 18 -
4.2 Introduction ...................................................................................................... - 18 -
4.3 Experimental .................................................................................................... - 20 -
4.3.1 Materials ................................................................................................... - 20 -
4.3.2 Particle Tracking Experiments ................................................................. - 21 -
4.3.3 Particle Characterization ......................................................................... - 23 -
4.4 Results .............................................................................................................. - 24 -
4.4.1 Particle Characterization ......................................................................... - 24 -
4.4.2 Particle Tracking Experiments ................................................................. - 26 -
4.5 Discussion ........................................................................................................ - 28 -
4.6 Conclusion ....................................................................................................... - 31 -
5. Fluid Dynamics of Particle-Mucus Interactions ................................................. - 32 -
5.1 Abstract ............................................................................................................ - 33 -
5.2 Introduction ...................................................................................................... - 33 -
5.3 Experimental .................................................................................................... - 35 -
5.3.1 CFD and Analytical Solution of Particle Trajectories ............................. - 35 -
5.3.2 Simulation of Mucus Plasticity ................................................................. - 38 -
5.4 Results .............................................................................................................. - 39 -
5.4.1 Particle Trajectories ................................................................................. - 39 -
5.4.2 Simulation of Mucus Plasticity ................................................................. - 44 -
5.5 Discussion ........................................................................................................ - 45 -
5.5.1 Particle Trajectories ................................................................................. - 45 -

TABLE OF CONTENTS
ii
5.5.2 Mucus Plasticity ....................................................................................... - 46 -
5.6 Conclusion ....................................................................................................... - 47 -
6. The Role of Micro- and Macrostructure of Mucus in Particle Mobility ......... - 48 -
6.1 Abstract ............................................................................................................ - 49 -
6.2 Introduction ...................................................................................................... - 49 -
6.3 Experimental .................................................................................................... - 51 -
6.3.1 Materials ................................................................................................... - 51 -
6.3.2 Atomic Force Microscopy ........................................................................ - 52 -
6.3.3 Capillary Penetration Experiments .......................................................... - 54 -
6.3.4 Cryo-SEM ................................................................................................. - 55 -
6.3.5 Optical Tweezers ...................................................................................... - 55 -
6.4 Results .............................................................................................................. - 59 -
6.4.1 Force Spectroscopy .................................................................................. - 59 -
6.4.2 Capillary Experiments .............................................................................. - 59 -
6.4.3 Cryo-SEM ................................................................................................. - 62 -
6.4.4 Optical Tweezers ...................................................................................... - 64 -
6.5 Discussion ........................................................................................................ - 69 -
6.5.1 Force Spectroscopy .................................................................................. - 69 -
6.5.2 Capillary Experiments .............................................................................. - 69 -
6.5.3 Cryo-SEM ................................................................................................. - 70 -
6.5.4 Optical Tweezers ...................................................................................... - 71 -
6.6 Conclusion ....................................................................................................... - 73 -
7. Overall Conclusion and Outlook ......................................................................... - 74 -
8. List of Figures ........................................................................................................ - 77 -
9. List of Abbreviations ............................................................................................. - 78 -
References ..................................................................................................................... - 79 -
Curriculum Vitae .......................................................................................................... - 89 -
List of Publications ....................................................................................................... - 91 -
Scientific Publications ................................................................................................ - 91 -
Poster & Talks ............................................................................................................ - 92 -
Acknowledgements ....................................................................................................... - 94 -

SUMMARY
- 1 -
1. Summary
Major issues in both toxicological as well as pharmaceutical research are biological
barriers, impeding the invasion of pathogens but also the delivery of beneficial substances
into the body. The upper lungs as site of application of such substances exhibit a
particularly efficient biological barrier: the mucus blanket and its mucociliary clearance.
The fate of particles upon deposition onto the moving mucus barrier is yet unsolved and
was central theme of this work. In this context, mucociliary clearance of nanoparticles and
its fluid dynamics were investigated. These results were correlated with the analysis of
microscopic and macroscopic particle penetration behavior in mucus and mucus structure.
Here, the application of complex methods such as cryoscopic scanning electron
microscopy (cryo-SEM), atomic force microscopy (AFM) and optical tweezers revealed
the mechanisms of particle mobility in mucus. It could be shown that mucociliary
clearance is independent on particle properties such as size, shape, charge or surface
chemistry. It was demonstrated that this is due to the only poor particle mobility in mucus:
The polymer scaffold of mucus is highly rigid which, in combination with the extensive
heterogeneity in pore size, impedes particle translocation. In contrast to model gels and due
to this rigidity, particles in mucus which are exposed to external force fields cannot deform
or rupture the polymer scaffold of mucus.

ZUSAMMENFASSUNG
- 2 -
2. Zusammenfassung
Ein zentrales Thema sowohl in der toxikologischen als auch der pharmazeutischen
Forschung sind biologische Barrieren, welche die Aufnahme von Krankheitserregern aber
auch Pharmazeutika in den Körper erschweren. Die obere Lunge als Applikationsort
solcher Substanzen weist eine besonders effiziente biologische Barriere auf: die Mukus-
Schicht mit ihrer mukoziliären Clearance. Das Schicksal von Partikeln nach deren
Deposition auf der bewegten Mukus-Schicht ist noch ungeklärt und war zentrales Thema
dieser Arbeit. In diesem Kontext wurde die mukoziliäre Clearance von Nanopartikeln und
deren Fluid Dynamik untersucht. Die Ergebnisse wurden mit der Analyse des mikro- und
makroskopischen Penetrationsverhaltens von Partikeln in Mukus und dessen Struktur
korreliert. Dabei deckte die Anwendung von Kryo-Elektronenmikroskopie,
Rasterkraftmikroskopie und der optischen Pinzette die Mechanismen der Partikelmobilität
in Mukus auf. Zusammenfassend konnte gezeigt werden, dass die mukoziliäre Clearance
unabhängig von Partikelgröße, -form, -ladung, oder -oberflächenchemie ist. Es wurde
nachgewiesen, dass dies auf die vernachlässigbare Partikelmobilität in Mukus
zurückzuführen ist: Das Polymergerüst von Mukus ist hoch rigide, was aufgrund der
großen Heterogenität der Porengröße die Partikeltranslokation behindert. Im Gegensatz zu
den verwendeten Modell-Gelen und aufgrund dieser Rigidität können Partikel, die einem
externen Kraftfeld ausgesetzt sind, das Polymergerüst von Mukus nicht zerstören.

INTRODUCTION
- 3 -
3. Introduction

INTRODUCTION
- 4 -
3.1 Pulmonary Drug Delivery and Nanocarriers
The pulmonary route to deliver drugs is one of the earliest forms of drug administration to
treat diseases (Bailey and Berkland, 2009). Not considering the use of “vapors” by
Egyptians in 1500 B.C., such applications even date as early as the late 17th century when
Bennet used inhalation treatments to cure tuberculosis (Patton and Byron, 2007). With
growing technological knowledge, inhalation made its way into the 20th century and
became a convenient and effective treatment in various therapies. By now, inhalation of
drugs as droplet aerosol or dry powder is used not only in local but also systemic
applications. While the former has played a more important role in the beginning of
inhalation therapy (asthma, tuberculosis and obstructive disorders), the latter is already
being exploited in various diseases (e.g. insulin delivery) with more applications still to
come. The advantages of pulmonary delivery, grasped only empirically in the beginning,
are now being widely appreciated in particular with respect to the delivery of modern
formulations: Crucial for any type of drug delivery application is the performance in
uptake/absorption, stability and retention, i.e. the (time dependent) concentration in the
blood of the delivered active pharmaceutical ingredient (API) in comparison to intravenous
application which can be summarized by the term “bioavailability”. Not only in this
respect, the pulmonary route holds great potential: The large surface area, high epithelial
permeability and low catabolic enzymatic activity allow for rapid and effective uptake of
drugs. In addition, it has the specific advantage of avoiding first-pass effects and potential
side-effects of high systemic concentrations typical of conventional delivery methods
(Bailey and Berkland, 2009). Furthermore, the convenience and adherence of such a form
of delivery versus oral dosage forms or even injections are highly relevant in clinical
practice or pediatrics. Especially with respect to therapies or vaccination in third world
countries, where injections pose a major risk to infections, this aspect is particularly
important.
In the past, the focus of research in aerosol medicine has been laid on the optimization of
drug carrier deposition in the lungs. Here, implications of physical and aerodynamic
properties of such carriers and of the design of inhalation devices on the deposited particle
or droplet fraction had to be thoroughly understood to control deposition in the desired
way. Especially particle size distribution and the respective size-associated deposition
mechanisms (impaction, sedimentation and diffusion) were extensively investigated: In

INTRODUCTION
- 5 -
particular in terms of systemic delivery, it is often desired to deposit particles in the deeper
lungs where the large surface area and thin epithelium enhance drug uptake. To advance
this deep into the lungs, the aerosol needs a certain particle/droplet size distribution to
avoid deposition or impaction in the upper parts of the lungs. Particles with aerodynamic
diameters of approximately 1-5 µm are considered ideal for alveolar deposition (Scheuch,
Kohlhaeufl et al., 2006). Above and below this size, particles or droplets are preferably
deposited in the trachea or bronchia (figure 1). However, new technologies such as larger
carriers doped with nanoparticles which can be released after deposition are applied to
overcome these aerodynamic restriction. Thus, it is possible to combine existing
knowledge of optimal aerosolization and thus deposition patterns with the advantages of
the more recent concept of nanocarriers. In current opinion, these nanoparticles are objects
with at least one dimension < 100 nm (Oberdorster, Oberdorster et al., 2005) while in the
pharmaceutical context, this is often extended to particulate matter of several hundred
nanometers in size (Kreuter, 1991).
Figure 1: Particle deposition in dependency of particle size (aerodynamic diameter). Particles of an
aerodynamic diameter between 1 and 5 µm are considered ideal for alveolar deposition whereas smaller and
larger particles are preferably deposited in the airways or the mouth and throat, respectively. By courtesy of
Christian Ruge, adopted from (Patton and Byron, 2007).
One key feature of these benefits of the application of nanoparticles is linked with the
mentioned term of bioavailability: In current research, the development of new
applications for systemic delivery, mostly involving fragile and costly (macro)molecules or
proteins, demands more than an optimal particle or droplet deposition as stability and
INTRODUCTION
- 6 -
delivered amount are much more restricted than in conventional drugs. Therefore, in this
case, an optimization of dissolution properties, stability and targeting is enormously more
important. These factors can be positively influenced by the use of nanocarriers. The small
size and thus the surface area of these particles greatly improves dissolution behavior even
without the use of enhancers with often unknown long-term safety (Bailey and Berkland,
2009). Furthermore, it is widely accepted that smaller particles (< 0.5 µm) may be taken up
in a more effective way by cells than larger particles (Koch, Reynolds et al., 2005; Bailey
and Berkland, 2009). This may be the reason that nanoparticles exhibit prolonged retention
compared to micoparticles (Geiser and Kreyling, 2010). These uptake properties also
provide the potential to improve the targeting to specific cell types or intracellular
compartments.
One big issue in the characterization of the potential of nanocarriers in terms of
bioavailability refers to the aspects of retention and penetration. Retention describes the
performance of a formulation in resisting the respective forms of clearance characteristic
for the site of delivery. For intravenous delivery the prominent forms are typically the renal
and hepatic clearance. In pulmonary delivery, however, this refers mainly to the
mucociliary- and the macrophage clearance. Mucociliary clearance is the dominant form of
clearance in the central and upper lungs whereas macrophage clearance is more dominant
in the alveoli. Penetration is important, as the thick mucus layer in the upper lungs
(figure 2) is not only excreting deposited particles by mucociliary clearance but forms a
compact non-epithelial barrier which nanocarriers have to cross before reaching the
epithelium or even the blood stream. The work presented here, focuses on the local
pulmonary delivery in the upper lungs as it is relevant for diseases such as chronic
obstructive pulmonary disease (COPD) or pulmonary hypertension where frequent and
long-lasting local treatment is necessary. Here, the need for modern formulations with
sustained, local release, and thus a minimized drug or carrier clearance, is paramount.
Therefore, mucociliary clearance and mucus penetration which have been under
investigation for quite some time but are not sufficiently understood so far, are very
important in this field, particularly for nanoparticle delivery. Here several mechanisms are
exclusive for such small carriers (e.g. wetting phenomena and fluid dynamics) and have to
be thoroughly considered to evaluate the pharmaceutical potential of the carrier.

INTRODUCTION
- 7 -
3.2 Mucus and Mucociliary Clearance
Mucociliary clearance is an innate airway defense mechanism enabling the body to excrete
foreign material in a very efficient way. The underlying principle is the constant secretion
of mucus and its fast cranial propulsion (3-25 mm/min in humans (Hofmann and
Asgharian, 2003; Antunes and Cohen, 2007)) by the concerted action of beating cilia
attached to the tips of the epithelial cells (figure 2). Thus, airborne pathogens, dust or other
foreign material can be trapped inside the mucus layer and removed from the airways.
Mucus is a complex fluid consisting of proteins, electrolytes and water. As biological
hydrogel, the water content is very high (95 % by weight). The macromolecular hydrogel
structure is given by mucins (< 5 % by weight). The remaining components are inorganic
salts, carbohydrates and lipids (Peppas and Huang, 2004). Mucins are large proteins
containing highly hydrophilic glycosylated regions as well as “naked” and thus more
hydrophobic domains. The sugar content usually represents up to 50 % of the protein
weight where the sugar chains are attached via O-glycosidic bounds between N-
acetylgalactosamine and serine or threonine residues (Sanders, Rudolph et al., 2009);
further sugar residues are galactose, fucose and sialic acids. The dominating amino acids in
the protein backbone are serine, threonine and proline (Peppas and Huang, 2004). The
typical monomer length is 500 nm with a weight of 2-16 MDa (Sanders, Rudolph et al.,
2009). Each mucosal surface has its own characteristic mucin composition: in pulmonary
mucus, MUC5AC and MUC5B are the most abundant mucins (Thornton and Sheehan,
2004).
The hydrogel structure of mucus is given by polymerization of these mucin monomers to
form block copolymers. Here, mucin monomers are linked by disulfide bridges, physical
entanglement or hydrophobic interactions between non-glycosylated domains (Thornton
and Sheehan, 2004; Cone, 2009). The underlying principles of mucin polymerization,
especially with regard to the formation of the complex structure of the different layers of
the pulmonary mucosa remain yet unsolved. One of the more established models for the
formation of the mucin hydrogel is the so called “jack-in-the-box” model, describing the
formation of the gel by quick hydration of the mucins upon secretion in a condensed and
non- or only less hydrated form (Verdugo, Deyrup-Olsen et al., 1987; Verdugo, 1991).

INTRODUCTION
- 8 -
Figure 2: The lungs are lined with different non-epithelial barriers. In the peripheral lungs, the epithelium is
lined with a very thin layer of surfactant. In the upper lungs, the epithelium is additionally covered with a
thick barrier composed of the pericilary layer (PCL) of low viscosity and the highly viscoelastic “tenacious”
(Florey, 1962) mucus layer.
This mechanism is also believed to contribute to the formation of the distinct two layer
structure of the pulmonary mucosa: The epithelium of the upper lungs is lined with cells
bearing 50-200 cilia per cell (Antunes and Cohen, 2007) which beat in a coordinated way
to transport the mucus layer resting on the tips of these cilia. The cilia itself are moving in
a layer of different properties, the periciliary layer (PCL). The PCL is located beneath the
mucus blanket and is thought to be established by a gradient in mucin concentration
proportional to the distance from the epithelium. Recent findings support the hypothesis of
the PCL being interfused with tethered mucins, giving it some internal structure (Randell
and Boucher, 2006). These more or less distinct layers differ mainly in rheological
properties. Whereas the several micron thick mucus layer (0.2-30 µm (Sims and Horne,
1997; Widdicombe, 2002; Sanders, Rudolph et al., 2009)) is a gel of quite high viscosity,
the underlying PCL is of lesser viscosity, believed to thus enable efficient ciliary beating.
This difference in rheology is considered to be due to complex interactions between
hydration status regulated by ion transporters, a gradient in mucin concentration and
adaptation to environmental factors and mechanical stress (Tarran, Trout et al., 2006;
Button and Boucher, 2008). The height of the PCL of approximately 7 µm (Button and
Boucher, 2008) is given by the length of the cilia and is a key factor in the investigation of
diseases such as cystic fibrosis (CF) which is associated with a defect in ion transport
pathways affecting the volume of the PCL, the efficient ciliary beating and thus an
impaired mucociliary clearance, leading to increased bacterial invasion. The thin layer (on
average 200 nm (Bastacky, Lee et al., 1995)) of pulmonary surfactant (mainly composed of

INTRODUCTION
- 9 -
phospholipids and proteins) on top of the mucus blanket has its major function in the
deeper lungs, where it is the only non-epithelial barrier and contributes to the structural
stability of the alveoli and immunological homeostasis.
Figure 3: Metachronal fields describe areas of homogeneous mucus transport direction (blue arrows). The
size of the field can differ over a large size range and is also different in healthy or diseased state (Iravani and
Melville, 1976).
The beating pattern of the cilia is organized in so-called “metachronal fields” (Iravani and
Melville, 1976) referring to the slight variance in space and time in the beating pattern of
the cilia: The direction and the phase of the beating cycle (9-15 Hz in humans (Antunes
and Cohen, 2007)) can be divergent in neighboring areas of the mucus blanket (figure 3).
The areas of homogeneous transport direction and velocity are called metachronal fields.
While mucus clearance direction is heterogeneously organized in the horizontal (x-y)
plane, other features of mucociliary clearance depend on the vertical position and thus the
height above the epithelium. So far, the beating cycle of the cilia and the physical
implications on mucus flow (fluid dynamics) are not completely solved. In the past years
large efforts were focused on the mathematical modeling of the ciliary beating cycle
(Barton and Raynor, 1967; Fulford and Blake, 1986; Smith, Gaffney et al., 2007), the
complexity of the models and the results of this modeling approach clearly depending on
the computing resources of the respective period. However, with only marginal
experimental counterweight, these results show high variation, in particular for mucus flow

INTRODUCTION
- 10 -
profiles, describing the velocity of the mucociliary transport in dependency of the height
above the epithelium (Smith, Gaffney et al., 2008).
Similar to the (mathematical) description of the ciliary beating cycle, the interaction of
particles with the mucus blanket and their mucociliary clearance has attracted much
attention in the last years. Here, the focus was clearly laid on epidemiological or
toxicological considerations, in particular with respect to pollution and exhaust, asbestos or
the potential risk of exposure to newer materials such as carbon nanotubes. Therefore most
of the data is acquired via szintigraphic or similar ensemble averaged methods, giving
insight into the overall distribution or the cleared fraction of an inhaled particle species
(Moller, Felten et al., 2008; Geiser and Kreyling, 2010). Parameters under investigation
were particle size, shape and material, exposure and clearance time. Although it seems that
there is consensus on the point that particle translocation through mucus and uptake into
the blood stream is a minor clearance pathway compared to macrophage uptake and
mucociliary clearance (Geiser and Kreyling, 2010), those studies do not give insight into
the underlying mechanism of particle deposition onto and translocation within the mucus
blanket on the single particle level. The investigation of the last point was previously
assessed by microscopic methods to describe particle translocation phenomena in vivo.
Here, large particles (> 10 µm) were observed to translocate into the pulmonary
epithelium, which was concluded to be mainly due to wetting forces of the pulmonary
surfactant (Schürch, Gehr et al., 1990; Gehr, Green et al., 1996). However, these results
cannot be used to judge nanoparticle fate upon deposition onto the mucus blanket
(figure 4).
Figure 4: Particle translocation upon deposition onto the mucus blanket depends on size. Wetting forces can
maximally submerse small particles completely but not cause further translocation through mucus (A).
Particles with a diameter approaching the thickness of PCL and mucus, however, can be pushed inside the
epithelium due to wetting forces (B).

INTRODUCTION
- 11 -
In this case, wetting forces may cause a immersion of nanoparticles below the surface of
the mucus blanket, but do not influence particle mobility inside mucus and thus do not
cause a translocation through mucus towards the epithelium. This is particularly true if the
fluid layer on top of the epithelium is several microns thick as it is in the upper lungs.
Therefore, the fate of nanoparticle upon deposition onto mucus is not sufficiently solved
yet and satisfying studies are still missing.
3.3 Particle Mobility in Mucus and Hydrogels
The non-epithelial barrier of the pulmonary mucus blanket in the upper lungs derives its
barrier properties not only from the ciliary clearance and thus the fast excretion of inhaled
material. As mentioned before, the highly viscous and compact mucus layer impedes
translocation of pathogens or particulate matter to the epithelium. Similar to other
hydrogels, hydrated mucins in mucus form a tight mesh of entangled fibers, trapping any
material entering the mucus. In physical terms, this system can be described as complex
fluid, exhibiting properties of a viscous liquid as well as of an elastic solid. Such
rheological properties are usually quantified by the two parameters viscosity and elasticity.
While the former refers to the resistance of the fluid to flow, the latter describes the more
solid like property of the material stiffness. Both parameters are complex quantities that
depend on further parameters like temperature, shear rate, shear frequency, time and length
scale etc. and can therefore only hardly be applied to grasp the complete behavior of such
systems if evaluated without experimental details and boundary conditions. Nevertheless,
viscosity and elasticity or derived parameters represent an established measure to describe
rheological properties of mucus and are given by
. (1)
Here, µ* is the complex viscosity with its real and imaginary part µ’ and µ’’ corresponding
to the viscosity and the elasticity, τ* = shear stress, γ = shear strain and G’ and G’’
represent storage and loss modulus respectively; µ is often denoted with the symbol η as

INTRODUCTION
- 12 -
well. The viscosity of mucus ranges between 102 and 10-2 Pas (Lai, Wang et al., 2009),
referring to ten to 100000 times that of water depending on the parameters mentioned
above as well as disease state and species.
Not only within one species or even within one individual, the variation in the magnitude
of the above mentioned parameters is significant, which demonstrates the highly
heterogeneous nature of this fluid. This heterogeneity impedes general conclusions
regarding the modeling and prediction of rheological behavior of mucus. It is however
quite established that any disturbance in the homeostasis of mucus secretion (e.g. in CF)
affects mucus rheology and thus mucociliary clearance of particles trapped inside the
mucus blanket.
Before particles are cleared they make contact with the mucus blanket. Once submersed
inside this hydrogel, particle mobility within this matrix and the mechanisms influencing
the extent of this mobility are yet unsolved. Driving forces for a particle translocation into
or even through this barrier are impaction, gravity, diffusion and external forces such as
magnetic or electrostatic force fields. The first three of these mechanisms depend mainly
on particle properties such as impaction trajectory and velocity, particle density, shape and
size and rheological properties of the fluid. Diffusion behavior in dependency of particle
properties is of great importance in the investigation of particle mobility in mucus.
Diffusion in viscous fluids is a complex topic which demands sophisticated mathematical
models. The most established model for diffusion is given by the Stokes-Einstein equation,
relating particle size and diffusion constant
(2)
with D = diffusion constant, kB = Bolzmann constant, T = temperature and r = particle
radius. The diffusion constant describes how fast a particle diffuses. This can be seen by
the relation between D and the mean squared displacement (MSD, ∆ ) for three-
dimensional diffusion:
(3)

INTRODUCTION
- 13 -
Here, t represents the correlation time of the experiment while α has the value of 1 in a
purely viscous fluid but can be different for complex fluids such as mucus or other
hydrogels. In this case r denotes the distance from the location at the previous time step.
The MSD is proportional to the width of the probability distribution of particle location
(figure 5) i.e. it quantifies the probability to diffuse a certain distance within the given
correlation time t.
However, as seen in equation 3, in particular for complex fluids, this determination of
diffusion behavior is strongly dependent on the correlation time t, i.e. the time span for
which the MSD is measured. Therefore, it is not easy to distinguish between different types
of diffusion, such as hindered or free diffusion (figure 6) by only considering short
correlation time spans.
Although being particularly important concerning the mobility of particles in mucus, this
strict discrimination is therefore not often addressed in current research. Much more, the
focus of studies investigating particle-mucus interactions has been laid on the mechanisms
involved in the restriction of particle mobility. Here, the goal is in the determination of
particle properties influencing the mobility such as adhesion to mucus or particle size.
These parameters are important to describe the filtering ability of mucus as being primarily
a size sieving (Sanders, Rudolph et al., 2009) or interaction filtering (Lieleg and Ribbeck,
2011) process. While the former model pronounces the sizes of the pores inside mucus or
other biological hydrogels as limiting factor, the latter favors adhesive interactions between
particles and gel components. Whatever mechanism will be dominant in the respective
case, the reason will surely lay within the structure of mucus on the microscale which is -in
detail- still not clear (Peppas and Huang, 2004). Unfortunately, recent studies relied only
on microscopic analysis with rather harsh conditions or very indirect methods to clarify
mucus structure. Therefore, the investigation of the structure of native pulmonary mucus in
its physiological state is very important to understand particle mobility in mucus and their
interactions with mucus components such as mucins.

INTRODUCTION
- 14 -
Figure 5: The meaning of the MSD can be visualized by plotting the probability of a particle to be located at
a certain distance from the origin. With increasing time (t1 < t2 < t3) this distribution broadens and the MSD,
being proportional to the width (full width at half maximum, FWHM) of the distribution, increases. This
means, the probability to find the particle away from the origin increases (as quantified by the MSD),
whereas the origin is still the most probable location of the particle. Image by courtesy of Dominik Selzer.
Figure 6: Free (B) and hindered diffusion (A) cannot easily be distinguished by MSD measurement. For
short correlation times t (highlighted by the box) plateau values for the MSD are not reached, thus showing
similar behavior for both types of diffusion behavior.

INTRODUCTION
- 15 -
3.4 Aim of This Work
As presented in the previous sections, the thick mucus blanket and its clearance by ciliary
action acts as significant barrier to the translocation of deposited particles down to the
epithelium and thus the blood stream. The mobility of particles in mucus and the
dependence of yet unknown parameters or the controllability of the mucociliary clearance
are largely unexplored. Especially for pharmaceutical purposes intending to maximize such
translocation, this is of great importance. However, it is not desired to decrease or even
abort mucociliary clearance, as it is the primary innate defense mechanism in the lungs and
thus crucial for pulmonary health. Due to the same reason, it is not desired to diminish the
overall barrier properties of the pulmonary mucus. A much more elegant way to reach
increased bioavailability of formulations administered via the lungs would be to
circumvent mucociliary clearance on the individual particle level and to manufacture
particles capable of a fast penetration through an unaltered mucus layer.
Not only for the reasons mentioned above but also for toxicological considerations it is
absolutely crucial to first understand the interactions of particles with such non-cellular
barriers of the lungs. Here, several still open questions remain and are tackled in the
presented work:
• The study presented here aimed to give insight into the yet unknown dependence of
the mucociliary clearance of particulate material on various particle properties such
as size, shape, charge or surface properties to understand the mucociliary clearance
on the microscopic level.
• Furthermore, the investigation of the process of particle sedimentation and
impaction upon deposition onto the mucus blanket was expected to explain what
happens between the events of particle deposition and mucociliary clearance of the
particle.
• However, once deposited and while being transported via mucociliary clearance, it
is still not clear if and by which mechanism (nano)particles may translocate through
the mucus blanket, how this affects biodistribution of inhaled material and how this
can be controlled by smart particle design. This is particularly important in terms of
the connection between mucus’ microstructure, diffusion and overall particle
INTRODUCTION
- 16 -
retention in the lungs. Therefore, the mobility of particles once trapped inside the
mucus blanket and their interactions with the mucus mesh were assessed. Here, not
only (adhesive) interactions between particles and mucus components and
diffusion, but also the response of nanoparticles suspended in mucus and model
gels to external force fields and the implications on mucus structure on the
microscopic level were investigated as they were hypothesized to play a crucial role
for particle mobility.

MUCOCILIARY CLEARANCE OF NANOPARTICLES
- 17 -
4. Mucociliary Clearance of Nanoparticles
Parts of this chapter were published in:
Kirch, J., Guenther, M., et al. (2012). Mucociliary clearance of micro- and nanoparticles
is independent of size, shape and charge-an ex vivo and in silico approach. J Control
Release 159(1): 128-134
The first author contributed the following points to the publication:
• design, performance and interpretation of experiments • writing of the manuscript

MUCOCILIARY CLEARANCE OF NANOPARTICLES
- 18 -
4.1 Abstract
The fate of inhaled particles after deposition onto the pulmonary mucosa is far from being
solved, in particular with respect to mucociliary clearance and mucus penetration. Due to
the fact that these phenomena govern pulmonary residence time and thus bioavailability,
they are highly relevant for any kind of controlled release formulation delivered via that
route. The work presented in the following section applied ex vivo approaches to
investigate the dependency of muciliary clearance of micro-, submicron and nanoparticles
on size, shape, charge and surface chemistry of such particles. In addition, measurement of
mucociliary clearance of different particles also provided information about their
penetration into mucus. Surprisingly, no significant differences in mucociliary clearance
could be found for any type of particle under investigation. We hypothesized that particle
penetration into the mucus gel layer is negligible at least within the time frame allowed by
horizontal mucus transport. The presented data suggests that the observed lack of
difference in mucociliary clearance is caused by the lack of immediate penetration of
deposited aerosol particles into the mucus blanket.
4.2 Introduction
Before reaching the epithelial barrier, particulate drug carriers deposited onto mucosal
tissues have to cross the mucus gel layer (Khanvilkar, Donovan et al., 2001; Cone, 2009;
Sanders, Rudolph et al., 2009). In the context of local pulmonary drug delivery in the
upper lungs, rapid mucociliary clearance of trapped drug carriers will put a serious
limitation to any attempt of designing inhalable controlled release systems. Strategies to
control the mucociliary clearance of pulmonary drug carriers without jeopardizing the
important barrier function of pulmonary mucus e.g. by innovative particle design, therefore
need to be addressed first, both scientifically and technologically.
Mucociliary clearance dramatically influences the fate of deposited drug carriers: Inhaled
particulate material is trapped and moved along with the moving mucus to be excreted by
transport to the larynx (Iravani and Melville, 1976; Fulford and Blake, 1986; Antunes and

MUCOCILIARY CLEARANCE OF NANOPARTICLES
- 19 -
Cohen, 2007). Those processes have long been under investigation (Geiser, Cruz-Orive et
al., 1990; Geiser, Serra et al., 1995; Geiser, Im Hof et al., 1997; Geiser, Gerber et al.,
2000), but are still not fully understood. In previous studies, the focus has mainly been laid
on the macroscopic investigation of processes and parameters which influence the
regulation of mucus secretion (Boucher, 2007) and clearance (King, 2006). Here,
characterization of mucociliary clearance in healthy and diseased state (Donaldson,
Corcoran et al., 2007; Livraghi and Randell, 2007) and under pharmacologically relevant
conditions (Bennett, 2002) plays a large role in current research.
Translocation of particles through pulmonary mucus has not been satisfactorily clarified so
far, especially considering the fact that the pulmonary mucus blanket is continuously
moving due to mucociliary clearance. This is particularly true for nanosized particles
which are much smaller in diameter than the thickness of the mucus blanket.
Considering the interaction of particles with a moving gel layer, it is not clarified yet, how
such a translocation can be correlated with dynamic processes of the ciliary propulsion of
this moving layer (e.g. fluid dynamics) as well as particle properties such as size, shape,
charge and surface chemistry. Therefore, the aim of this study was to investigate and
possibly identify critical particle properties which may influence their mucociliary
clearance and translocation within the mucus blanket. Measuring the mucociliary clearance
velocity of particles may also give insight into their penetration behavior into mucus:
Whereas non-penetrating particles will be cleared with the moving mucus (figure 7A),
particles that cross the mucus layer or even make contact with the epithelium (figure 7B)
will on average be slowed down as they reach layers of smaller flow velocity (PCL and
vicinity of the epithelium). Thus, they will show no, or at least a decreased average
clearance velocity, which can be measured by particle tracking.
The influence of particle properties, such as surface chemistry, size, charge and shape on
mucociliary clearance (and indirectly on penetration potential) can be determined
experimentally by the recently described ex vivo Embryonic Chicken Trachea (ECT)
model (Henning, Schneider et al., 2008; Henning, Schneider et al., 2010) where horizontal
particle trajectories can be imaged and analyzed. To improve comparison of clearance
velocities of different particles and to reduce the statistical individual variance, we
successfully applied a method to track particles of different type simultaneously.

MUCOCILIARY CLEARANCE OF NANOPARTICLES
- 20 -
Figure 7: Non-penetrating particles (A) will be cleared with the moving mucus blanket. Penetrating particles
(B) will, on average, be transported slower or even not at all by translocating to areas with negligible
horizontal mucus velocity such as the vicinity of the epithelium.
4.3 Experimental
4.3.1 Materials
Experiments were conducted with three main groups of particles: Size dependency was
investigated with differently sized polystyrene (PS) particles, shape and charge
dependency was analyzed with differently charged (COOH surface or polyethylenimin
(PEI) coating, respectively) rod-shaped (aspect ratio ≈ 4) and spherical PS particles.
Dependency on surface chemistry was investigated with maghemite particles of different
surface chemistry.
Spherical PS-COOH particles (nominal density ρp = 1050 kg/m³) were purchased from
BangsLabs (Fishers, USA), rod-shaped particles were made by stretching spherical PS-
COOH particles purchased from Polysciences (Warrington, USA) according to the film
stretching procedure previously described (Champion, Katare et al., 2007). PEI was coated
on particle surface through passive adsorption: Particle suspension (108 particles/ml) was
incubated 1:1 in 2 mg/ml PEI solution overnight with end-to-end mixing. Particles were
washed two times in phosphate buffered saline (PBS, 5 mM) and stored at 4 °C. Washing
was performed by 15 min centrifugation at 7000 rpm and subsequent resuspension.
Maghemite particles were obtained from Chemicell (Berlin, Germany), had a mean density
of ρp = 1250 kg/m³ and were assembled from 20 nm subunits. All particles, except for rod-

MUCOCILIARY CLEARANCE OF NANOPARTICLES
- 21 -
shaped and PEI coated particles were purchased from commercial sources. Fluorescent
label was fluorescein isothiocyanate (FITC) or 4',6-diamidino-2-phenylindole (DAPI) for
reference particles, respectively, incorporated in the polymer matrix of the PS particles by
the manufacturer.
Maghemite particles, were coated with a lipophilic dye by the manufacturer. Subsequently,
a second layer enveloping the particle with a hydrophilic polymer was attached by the
manufacturer to protect the particles against aggregation by foreign ions (Tseng, Di Carlo
et al., 2009; Cinti, Taranta et al., 2011). All chemical modifications were linked covalently
to the surface of maghemite particles by the manufacturer (chitosan, starch,
phosphatidylcholine (PC), polyacrylamide (PAA)). PS-COOH particles of 555 nm
hydrodynamic diameter were applied as reference particles in all experiments. All
chemicals used were of analytical grade and purchased from standard commercial sources.
Fertilized eggs, specified as pathogen free, were obtained from Lohmann (Cuxhafen,
Germany).
4.3.2 Particle Tracking Experiments
In the ECT model, particles were deposited onto excised trachea from chicken embryos.
Particle movement was monitored by optical means. In this study, fertilized eggs were
incubated for 18-19 days at 37 °C and 60 % humidity in a breeding chamber. Trachea were
excised and particles deposited as described earlier (Henning, Schneider et al., 2008).
Briefly, after isolation, trachea were cut into half pipes and aqueous particle suspension
was deposited on their inner (mucosal) side by using a MicrosprayerTM (PennCentury Inc.,
Wyndmoor, USA) as displayed in figure 8. Particles were applied as a mixture of two
different types of particles suspended in millipore water; in each case PS-COOH particles
of 555 nm hydrodynamic diameter were used as a reference particle. The applied amount
of particle suspension was approximately 0.1 µl (0.04-0.06 % solid fraction) per trachea.

MUCOCILIARY CLEARANCE OF NANOPARTICLES
- 22 -
Figure 8: Trachea were cut in half pipes and particles are deposited on top. Trapped particles (green) are
transported horizontally by mucociliary clearance and can be tracked by fluorescent labeling.
With an assumed joint thickness of 20 µm for PCL and mucus layer, the amount of liquid
on top of the tracheal epithelium is 1.6 µl (taking into account average length and diameter
of embryonic chicken trachea). The application of the particle suspension therefore
represents the addition of 6.25 % fluid. According to previous studies (Powell, Aharonson
et al., 1974) this was assumed not to influence the rheological properties of mucus
significantly. Throughout the experiment, the half pipes were placed onto Locke-Ringer
solution soaked tissue. After particle deposition, the half pipes were transferred into a
humidity (99 %) and temperature (33 °C) controllable chamber. Particle transport velocity
due to mucociliary clearance was measured by fluorescence microscopy (Axioimager,
Zeiss, Jena, Germany). Clearance rates measured by this method are comparable to human
clearance rates (Henning, Schneider et al., 2008) which range between 3-25 mm/min
(Hofmann and Asgharian, 2003; Antunes and Cohen, 2007) All particles were fluorescent-
labeled to allow tracking of their transport in the x-y plane. Reference particles and
particles under investigation were labeled with a different fluorophore and could therefore
be distinguished. Particle trajectories were recorded as image sequences of 10 s length.
Due to the fact that most particles left the frame after this time, longer sequences could not
be imaged. Several sequences were recorded on different spots on each trachea and particle
trajectories were analyzed. On average, 10-20 particle trajectories per sequence were
analyzed. To investigate the dependency of transport velocity on particle shape, spherical
and rod shaped PS particles were applied and tracked simultaneously. To investigate
charge dependency of transport velocity, reference particles were applied and tracked

MUCOCILIARY CLEARANCE OF NANOPARTICLES
- 23 -
simultaneously with positively or negatively charged rod shaped and spherical particles,
respectively. To complete these studies, the dependency of transport velocity on particle
surface chemistry was investigated with maghemite particles coated with chitosan, PC,
PAA and starch. In each case, the particle type under investigation was applied and tracked
simultaneously with reference particles or compared directly (e.g. in the case of shape
dependency). The mean transport velocity of each type of particle was calculated by
MtrackJ software. The mean transport velocity of the reference particles in each sequence
was set to 100 %. For each sequence, the mean transport velocity of reference particles was
compared to the mean velocity of the particle type under investigation.
4.3.3 Particle Characterization
Particles were characterized by dynamic light scattering (DLS), scanning electron
microscopy (SEM) and atomic force microscopy (AFM). DLS measurements were
conducted with particle suspensions in millipore water with a Zetasizer Nano-ZS (Malvern
Instruments, Herrenberg, Germany): Here, particle solutions provided by the manufacturer
were diluted with millipore water to yield concentrations of approximately 108 particles per
ml. SEM measurements were conducted with a JSM 7001F Field Emission SEM (Jeol,
Tokyo, Japan) under high vacuum conditions and room temperature. Prior to scanning by
SEM, particles were sputter-coated with gold (layer thickness approximately 10 nm).
Accelerating voltage was 20 kV with a focal distance of 10 mm. Samples for microscopic
imaging were prepared by coating freshly cleaved mica with aqueous particle suspensions
(1:100 dilution of stock solution provided by the manufacturer) followed by gentle drying
with compressed air. AFM scans were done using a Multimode V (Veeco, Plainview,
USA). Particles were scanned using non-contact mode and scan rates of 0.7 Hz. Standard
non-contact mode cantilevers were used to image dried particles on mica (OMCL-
AC160TS, Olympus, Essex, Great Britain).
MUCOCILIARY CLEARANCE OF NANOPARTICLES
- 24 -
4.4 Results
4.4.1 Particle Characterization
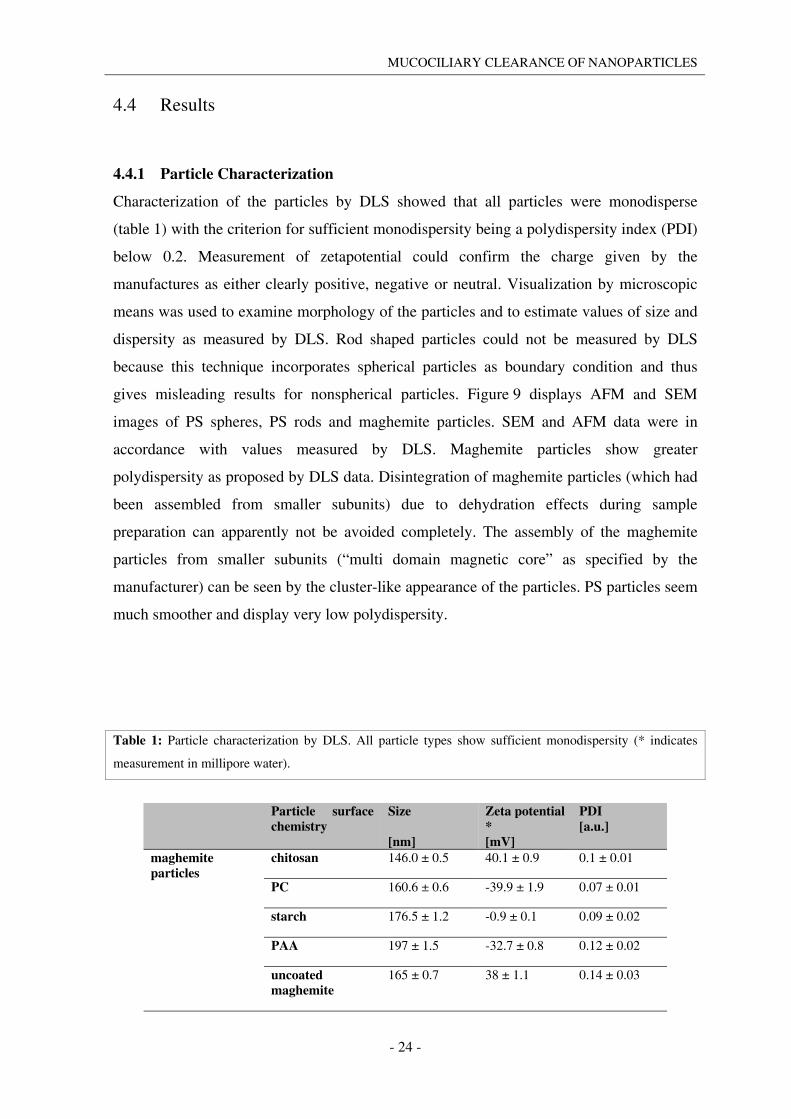
Characterization of the particles by DLS showed that all particles were monodisperse
(table 1) with the criterion for sufficient monodispersity being a polydispersity index (PDI)
below 0.2. Measurement of zetapotential could confirm the charge given by the
manufactures as either clearly positive, negative or neutral. Visualization by microscopic
means was used to examine morphology of the particles and to estimate values of size and
dispersity as measured by DLS. Rod shaped particles could not be measured by DLS
because this technique incorporates spherical particles as boundary condition and thus
gives misleading results for nonspherical particles. Figure 9 displays AFM and SEM
images of PS spheres, PS rods and maghemite particles. SEM and AFM data were in
accordance with values measured by DLS. Maghemite particles show greater
polydispersity as proposed by DLS data. Disintegration of maghemite particles (which had
been assembled from smaller subunits) due to dehydration effects during sample
preparation can apparently not be avoided completely. The assembly of the maghemite
particles from smaller subunits (“multi domain magnetic core” as specified by the
manufacturer) can be seen by the cluster-like appearance of the particles. PS particles seem
much smoother and display very low polydispersity.
Table 1: Particle characterization by DLS. All particle types show sufficient monodispersity (* indicates
measurement in millipore water).
Particle surface chemistry
Size [nm]
Zeta potential * [mV]
PDI [a.u.]
maghemite particles
chitosan 146.0 ± 0.5 40.1 ± 0.9 0.1 ± 0.01
PC 160.6 ± 0.6 -39.9 ± 1.9 0.07 ± 0.01
starch 176.5 ± 1.2 -0.9 ± 0.1 0.09 ± 0.02
PAA 197 ± 1.5 -32.7 ± 0.8 0.12 ± 0.02
uncoated maghemite
165 ± 0.7 38 ± 1.1 0.14 ± 0.03

MUCOCILIARY CLEARANCE OF NANOPARTICLES
- 25 -
PS
(reference particle)
555 ± 6.3 -49.5 ± 0.4 0.04 ± 0.07
PS (“200 nm”) 248.3 ± 1.4 -44.9 ± 0.4 0.004 ± 0.002
PS (“1000 nm”) 926 ± 115 -32.4 ± 0.8 0.17 ± 0.09
PS (“6000 nm”) 6242 ± 469 -32.7 ± 0.7 0.09 ± 0.07
PEI-terminated PS (positively charged spheres)
600.5 ± 7.0 41 ± 2.0 0.14 ± 0.08
COOH-terminated PS (negatively charged spheres)
555 ± 7.0 -42 ± 2.1 0.06 ± 0.03
Figure 9: SEM (A-C) images as well as AFM images (D-F) of spherical and rod shaped PS particles (A, B,
D, E) and maghemite particles (C, F). Maghemite particles show rougher surface and more heterogeneous
shape than PS particles. Scale bar represents 1 μm for PS particles or 100 nm for maghemite particles.

MUCOCILIARY CLEARANCE OF NANOPARTICLES
- 26 -
4.4.2 Particle Tracking Experiments
The ECT model was employed to visualize and analyze the transport of deposited particles
by mucociliary clearance. Particle trajectories showed the effective and well directed
clearance of trapped particles (figure 10). Particles were transported mainly
homogeneously throughout the imaged sequences. Slight divergences in direction or
velocity of transport by mucociliary clearance were probably caused by the convergence of
different metachronal fields. Trachea with impaired ciliary activity could be distinguished
by strongly heterogeneous, circular or even reverse particle transport.
Figure 10: Trajectories of particles transported by mucociliary clearace. Slight differences in transport
direction may be caused by the convergence of metachronal fields. Single trajectories (numbered) are shown
in different color. Image size is 120 µm in width.
The aim of this study was to investigate the influence of different parameters such as
shape, size, charge and surface properties on the clearance behavior of micro- and
nanoparticles after deposition. In this context, clearance transport velocity of different
types of particles was analyzed. No significant difference in transport velocity between
reference particles and particle type under investigation could be found for any data set, be
it dependency on size, charge, shape or surface chemistry (One Way ANOVA-Sigma Plot,
systat, Chicago, USA). To exclude a retarding influence of PS reference particles on mucus
MUCOCILIARY CLEARANCE OF NANOPARTICLES
- 27 -
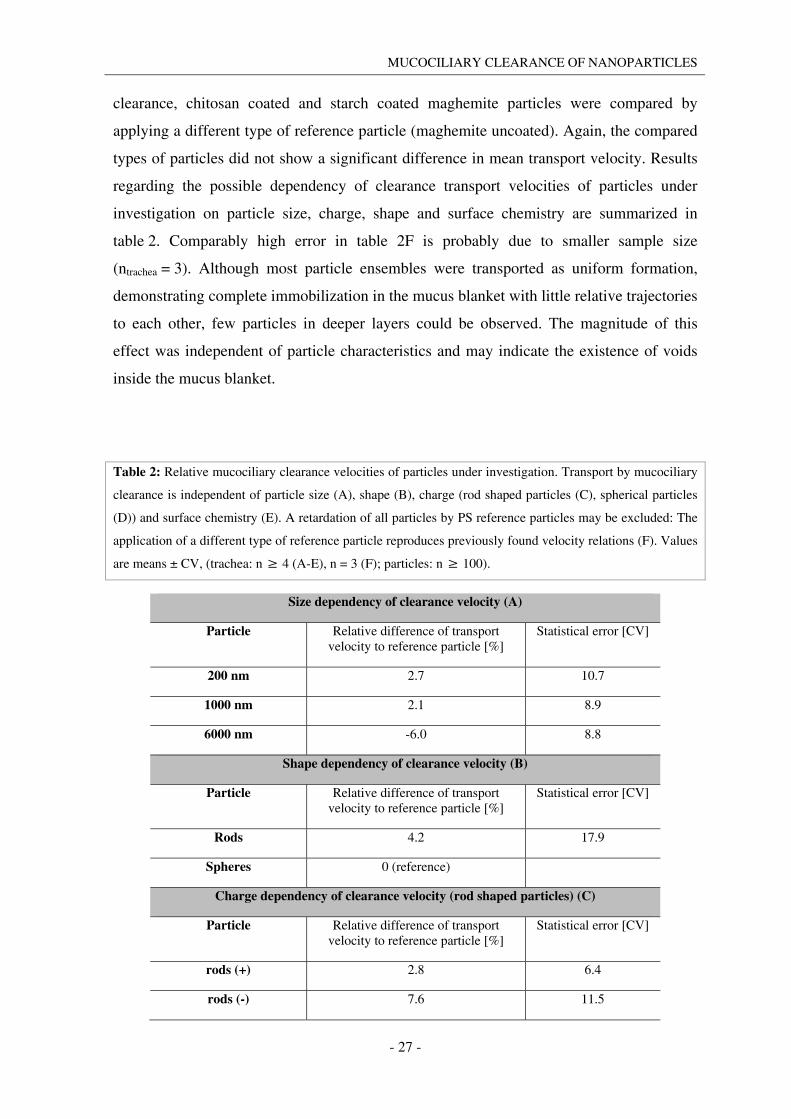
clearance, chitosan coated and starch coated maghemite particles were compared by
applying a different type of reference particle (maghemite uncoated). Again, the compared
types of particles did not show a significant difference in mean transport velocity. Results
regarding the possible dependency of clearance transport velocities of particles under
investigation on particle size, charge, shape and surface chemistry are summarized in
table 2. Comparably high error in table 2F is probably due to smaller sample size
(ntrachea = 3). Although most particle ensembles were transported as uniform formation,
demonstrating complete immobilization in the mucus blanket with little relative trajectories
to each other, few particles in deeper layers could be observed. The magnitude of this
effect was independent of particle characteristics and may indicate the existence of voids
inside the mucus blanket.
Table 2: Relative mucociliary clearance velocities of particles under investigation. Transport by mucociliary
clearance is independent of particle size (A), shape (B), charge (rod shaped particles (C), spherical particles
(D)) and surface chemistry (E). A retardation of all particles by PS reference particles may be excluded: The
application of a different type of reference particle reproduces previously found velocity relations (F). Values
are means ± CV, (trachea: n ≥ 4 (A-E), n = 3 (F); particles: n ≥ 100).
Size dependency of clearance velocity (A)
Particle Relative difference of transport velocity to reference particle [%]
Statistical error [CV]
200 nm 2.7 10.7
1000 nm 2.1 8.9
6000 nm -6.0 8.8
Shape dependency of clearance velocity (B)
Particle Relative difference of transport velocity to reference particle [%]
Statistical error [CV]
Rods 4.2 17.9
Spheres 0 (reference)
Charge dependency of clearance velocity (rod shaped particles) (C)
Particle Relative difference of transport velocity to reference particle [%]
Statistical error [CV]
rods (+) 2.8 6.4
rods (-) 7.6 11.5

MUCOCILIARY CLEARANCE OF NANOPARTICLES
- 28 -
Charge dependency of clearance velocity (spherical particles) (D)
Particle Relative difference of transport velocity to reference particle [%]
Statistical error [CV]
spheres (+) 2.2 9.1
spheres (-) 0.5 8.1
Dependency of clearance velocity on surface chemistry (E)
Particle Relative difference of transport velocity to reference particle [%]
Statistical error [CV]
PC -1.0 6.8
chitosan 0.5 8.1
starch 1.7 6.0
PAA 10 14.0
Dependency of clearance velocity on surface chemistry (influence of reference) (F)
Particle Relative difference of transport velocity to reference particle [%]
Statistical error [CV]
chitosan 11.6 42.6
starch 8.2 23.9
4.5 Discussion
The presented study describes the investigation of trajectories of individual particles upon
impaction onto the mucus layer. This process is rather fast and horizontal transport by
mucociliary clearance governs the order of magnitude of the relevant velocities. ECT
experiments showed that relative clearance velocity of the particles under investigation did
not differ from that of simultaneously measured reference particles. This simultaneous
measurement allowed for a direct comparison of reference particles and particles under
investigation. A dependency of shape, size, charge or particle coating on the relative
transport velocity was not observed. Therefore, the clearance behavior and the transport
velocity of particles deposited onto the mucus blanket seems to be mainly determined by
the characteristics of the underlying mucus and its flow properties.

MUCOCILIARY CLEARANCE OF NANOPARTICLES
- 29 -
Experimental and theoretical studies (Matsui, Randell et al., 1998; Smith, Gaffney et al.,
2007; Smith, Gaffney et al., 2008) predicted heterogeneous flow velocities along the height
of the mucus layer with smaller average velocities in the region of the PCL, the vicinity of
the epithelium and finally vanishing flow at the epithelium. Therefore, penetrating particles
will on average experience a decreased flow velocity and thus slower transport while
advancing deeper towards the epithelium (figure 7). This is the reason for mucociliary
clearance velocity of deposited particles being able to provide information about the
penetration potential of such particles. Taking into account the presented results, the
mentioned particle properties might thus not influence particle penetration.
However, we have so far not considered the role of wetting and diffusion: It is well known
from previous studies that wetting is a strong driving force to submerge particles in
biological fluids (Gehr, Green et al., 1996; Gehr, Im Hof et al., 2000; Fiegel, Jin et al.,
2005). Although this behavior might not be influenced by shape, surface topography or
surface free energy (Geiser and Kreyling, 2010) its influence on particle penetration can be
important. It could previously be demonstrated that the existence of a surfactant lining
strongly influences the immersion of particles into airway fluids (Schurch, Gehr et al.,
1990; Gehr, Green et al., 1996; Fiegel, Jin et al., 2005). The force caused by the interplay
of particle wetting and surface tension of the surfactant layer can be strong enough to result
in the displacement of the particle into the epithelium. From the physical point of view, it
is important to stress that this particular effect only comes to pass (and has so far only been
reported (Geiser and Kreyling, 2010)) if the particle size approaches the thickness of the
fluid layer. In the scenario described here, smaller particles (especially submicron or
nanosized particles) are deposited onto airway fluids. For those small particles, the
described forces can maximally immerse the particle completely but cannot contribute to
any further displacement within the mucus layer.
Overall the presented results lead to the conclusion that the particle properties under
investigation (size, shape, charge, surface chemistry) play only a minor role in their
clearance behavior, i.e particles that are trapped in the mucus will be cleared at a velocity
that is equal to the clearance velocity of the mucus, independent of particle properties.
However, the mucus blanket does not appear totally uniform, either in surface coverage as
well as in thickness (van As and Webster, 1972; Iravani and Melville, 1976; Sims and
Horne, 1997). Therefore, besides fast penetration through the mucus blanket, the
deposition on poorly covered patches of the epithelium (van As and Webster, 1972;
MUCOCILIARY CLEARANCE OF NANOPARTICLES
- 30 -
Moller, Felten et al., 2008; Geiser and Kreyling, 2010) followed by epithelial adhesion
represents a further possibility to escape the mucociliary clearance. The latter
phenomenon, although there has been extensive proof for such heterogeneity of the mucus
blanket in thickness and coverage of the epithelium (Iravani and Melville, 1976; Im Hof,
Gehr et al., 1997; Sims and Horne, 1997), is not easily accessed and has so far rarely been
exploited for pharmaceutical purposes. Nanoparticles deposited on such patches of the
epithelium which are only poorly covered with mucus, can slip through these voids inside
the mucus blanket and reach the PCL or even the epithelium. The existence of a fraction of
particles which may undergo this process was observed in this study and this may also be
the reason for the discrepancy between fast horizontal transport of individual particles and
previously reported long term (> 24 h) retention of fractions of inhaled nanomaterial
(Moller, Felten et al., 2008) (with a clearance velocity of 2 mm/min particles deposited in
the airways should be cleared from the lungs within maximally 2 h). Hence, for
pharmaceutical applications, the more passive approach of enhancing the adhesion of
particles to the epithelial cell surface as shown by Fischer et al. (Fischer, Aleman et al.,
2009) deserves high attention. The experimental results described here clearly suggest that
in quantitative terms of particle retention in the airways, this mechanism of translocation
may be at least equally important than direct particle penetration through mucus; an
approach which combines these mechanisms is considered ideal.
In further studies, the role of mucus fluid dynamics and microstructure in the directed,
vertical translocation of particles should be investigated: Here, not the local particle
mobility and diffusion (Sanders, De Smedt et al., 2003; Lai, O'Hanlon et al., 2007; Lai,
Wang et al., 2009; Sanders, Rudolph et al., 2009) as usually described by quantifying the
mean-squared displacement of particles (Valentine, Perlman et al., 2004; Lai, O'Hanlon et
al., 2007; Crater and Carrier, 2010) should be measured; rather should it be cleared if voids
inside the mucus blanket in its in vivo state are possibly interconnected and if and under
which preconditions they allow particle translocation. Furthermore it should be clarified,
how particle impaction and their trajectories influence sedimentation of deposited particles
in mucus. Here, the underlying physical principles have been seldom considered in
previous studies but need to be characterized first, before being able to describe particle-
mucus interactions satisfactorily. These points are further assessed in the following
sections.

MUCOCILIARY CLEARANCE OF NANOPARTICLES
- 31 -
4.6 Conclusion
In summary, clearance velocity of micro-, and nanoparticles, trapped in the pulmonary
mucus blanket and transported by mucociliary clearance, was shown to be independent of
size, shape, charge and surface properties of the particles under investigation. Direct
comparison of transport velocities of simultaneously measured particle types allowed for
an estimation of particle penetration through the mucus blanket, revealing that vertical
penetration of particles into the mucus blanket may be negligible compared to their
horizontal transport due to mucociliary clearance. Possible strategies to design particles
capable to escape the otherwise very effective mucociliary clearance remain either a
substantial increase in their diffusivity in mucus (mucopenetration), or minimizing
mucoadhesion, targeting possible voids in the mucus blanket and seeking direct
bioadhesion to the epithelial surface. Such a substantial increase in diffusivity or mobility
of particles in mucus may be reached by the application of external forces to pull the
particles through mucus. Before such approaches can be realized, however, the process of
sedimentation in and impaction onto the mucus blanket of nanoparticles have to be
clarified. Furthermore, mobility of particles inside the mucus mesh and the implications of
mucus’ microstructure on such mobility have to be investigated.

FLUID DYNAMICS OF PARTICLE-MUCUS INTERACTIONS
- 32 -
5. Fluid Dynamics of Particle-Mucus Interactions
Parts of this chapter were published in:
Kirch, J., Guenther, M., et al. (2012). Computational fluid dynamics of nanoparticle
disposition in the airways: mucus interactions and mucociliary clearance. Comput Visual
Sci: accepted
The first author contributed the following points to the publication:
• design and interpretation of simulations and analytical solutions • writing of the manuscript
The second author of the publication performed simulations and calculations.

FLUID DYNAMICS OF PARTICLE-MUCUS INTERACTIONS
- 33 -
5.1 Abstract
Interactions of nanoparticles with respiratory fluids such as pulmonary mucus are currently
under investigation and are involved in a variety of applications. The clearance processes
especially for nanoparticles are still not fully understood. The study presented in the
following section represents an approach to describe deposition, sedimentation and
clearance of nanoparticles within mucus with numerical and analytical models. Here, the
physical background of nanoparticle behavior in fluid flow was taken into account for the
first time within this context. Particle impaction as well as sedimentation and mucociliary
clearance were simulated with computational fluid dynamics (CFD) and described
analytically. Furthermore mucus plasticity as pathway for complex particle translocation
was simulated using advanced CFD methods. We could demonstrate that fluid dynamics
strongly influence the fate of deposited nanoparticles in mucus: Sedimentation and
impaction were shown to be unlikely to contribute to particle translocation. However,
intrinsic plasticity of mucus slabs and collision of such slabs may enhance particle
translocation towards the pulmonary epithelium.
5.2 Introduction
This study aims to describe interactions of nanoparticles with mucus as the major non-
cellular element of the mucosal barrier. Mucus is a complex fluid containing hydrogel-
forming glycoproteins (mucins) and forms a compact barrier in the upper lungs. It has a
very active role in the protection from inhaled material: Material deposited in the lungs
usually adheres to mucus and can therefore be transported cranially and finally be excreted.
This process is called mucociliary clearance.
Elimination of particulate matter by this mucociliary escalator reduces residence time and
thus the amount of the drug at the site of action. Therefore, current approaches to increase
bioavailability aim to enhance penetration of mucus by particles. On the other hand, one
aims to increase the probability that particles remain at the deposition site (which seems
only feasible if deposited on patches not covered with mucus). Which approach may be

FLUID DYNAMICS OF PARTICLE-MUCUS INTERACTIONS
- 34 -
favorable is not clear yet. Recent publications have described nanoparticle mobility in
mucus depending on particle surface chemistry (Lai, Wang et al., 2009). However, those
approaches solely rely on investigations concerning the MSD of particles already
submersed in mucus but do not take into account any clearance processes or deposition
effects. Although these processes have been under experimental investigation for quite
long time (Geiser, Cruz-Orive et al., 1990; Geiser, Im Hof et al., 1997; Geiser, Gerber et
al., 2000) they are still largely unexplored. The aim of this study was the description of
particle deposition onto mucus with computational methods to clear if particles deposited
onto the mucus blanket are able to cross the mucus layer and reach the underlying
epithelium by impaction or sedimentation. In addition, the applicability of an analytical
solution to the problem was investigated. The aim of such numerical and analytical
approaches is the development of a model which allows for a quick estimation of particle-
mucus interactions in terms of particle trajectory inside the mucus blanket upon the
deposition. This is necessary because it is seldom known how all physical interactions that
are involved in particle displacement balance and thus determine the behavior of deposited
particles of different properties. Furthermore, mucus plasticity was analyzed by CFD to
assess additional possibilities of particle attachment or translocation to the epithelium
(figure 11): It is known that the mucus blanket is heterogeneous not only in thickness but
also in surface coverage, transport velocity and direction (Iravani and Melville, 1976).
Therefore, mucus droplets of potentially even varying size may collide if being transported
within different metachronal fields. Upon such collisions, particles deposited on the mucus
blanket may be submerged and pushed deeper inside the mucus layer and may thus
encounter the epithelium in the end. Another possibility of particles reaching the
epithelium besides diffusion and impaction is the translocation due to mucus spreading:
Mucus droplets, either directly upon secretion or after separation from larger entities, may
spread if no confining barriers are located on the sides. This spreading was modeled to
determine the magnitude of the time spans of such spreading phenomena and to find out if
this behavior can indeed contribute to particle translocation to the epithelium.

FLUID DYNAMICS OF PARTICLE-MUCUS INTERACTIONS
- 35 -
Figure 11: Mucus plasticity due to spreading (top) and deformation upon collision of mucus slabs (bottom)
may be the reason for particle translocation to the epithelium: Particles deposited on top of the mucus blanket
will get into close contact of the epithelium during the spread of the mucus droplet. Collision may cause
immersion of particle into the depth of the mucus layer.
5.3 Experimental
5.3.1 CFD and Analytical Solution of Particle Trajectories
5.3.1.1 Computational Model To simulate particle deposition on top and sedimentation within the mucus layer a 2D
model was applied. The plane chosen was orthogonal to the mucus and parallel to the
mucus flow. The computation domain (figure 12) used was quadratic and had a side length
of 100 µm. Numerical computation of the fluid flow and the particle dynamics was done by
the commercial CFD tool Ansys Fluent 12.1 with an underlying regular rectangular
numerical grid. For the upper and lower boundary, a no-flux boundary was set. On the
upper boundary that represents non-moving air, the velocity is set to be zero. The lower
boundary simulates propulsion of mucus by cilia by a moving wall approach. Here, a
constant velocity was assumed as first approximation. All other boundaries were periodic.
The hereby simulated flow was a multiphase flow, where air, mucus and particles are
different phases. The interface between the air and the mucus phase is a so-called free

FLUID DYNAMICS OF PARTICLE-MUCUS INTERACTIONS
- 36 -
boundary, i.e. no shape can be prescribed. The shape of the interface is the result of several
balanced forces. We could expect that the interface is a straight line since there is no force
which might destroy this line shape. Hence, the surface tension could be neglected in this
section. The simulations were done using the volume-of-fluid (VOF) model (Hirt and
Nichols, 1981) to take into account the free boundary. The simulation of the particles’
paths was done by a Lagrangian method using Fluent’s discrete phase model (DPM). For
the numerical as well as the analytical model viscosity of the mucus layer increased
according to physiological values from 1 mPas at the bottom to 6 Pas (Lai, Wang et al.,
2009) at the mucus/air interface to represent gradual transition of the watery PCL to highly
viscous mucus layer (Randell and Boucher, 2006). Determination of mucus flow velocity
u(z) was achieved by simulating mucus flow as steady-state process. Particle motion inside
mucus after impaction onto this fluid layer, however, is a non-steady-state process with
adapted time step control. Maximum resolution in time was 2.2 x 10⁻⁹ s. Convergence was
surveyed by monitoring the decrease of residuals. Here, a decrease of residuals to a plateau
value of 10-6 was accepted as convergence criterion for all simulation results.
Figure 12: Computation domain of particle mucus interactions displaying both phases (mucus and air).
Boundaries are periodic and the grid consisted of 100 vertical and 320 horizontal cells.
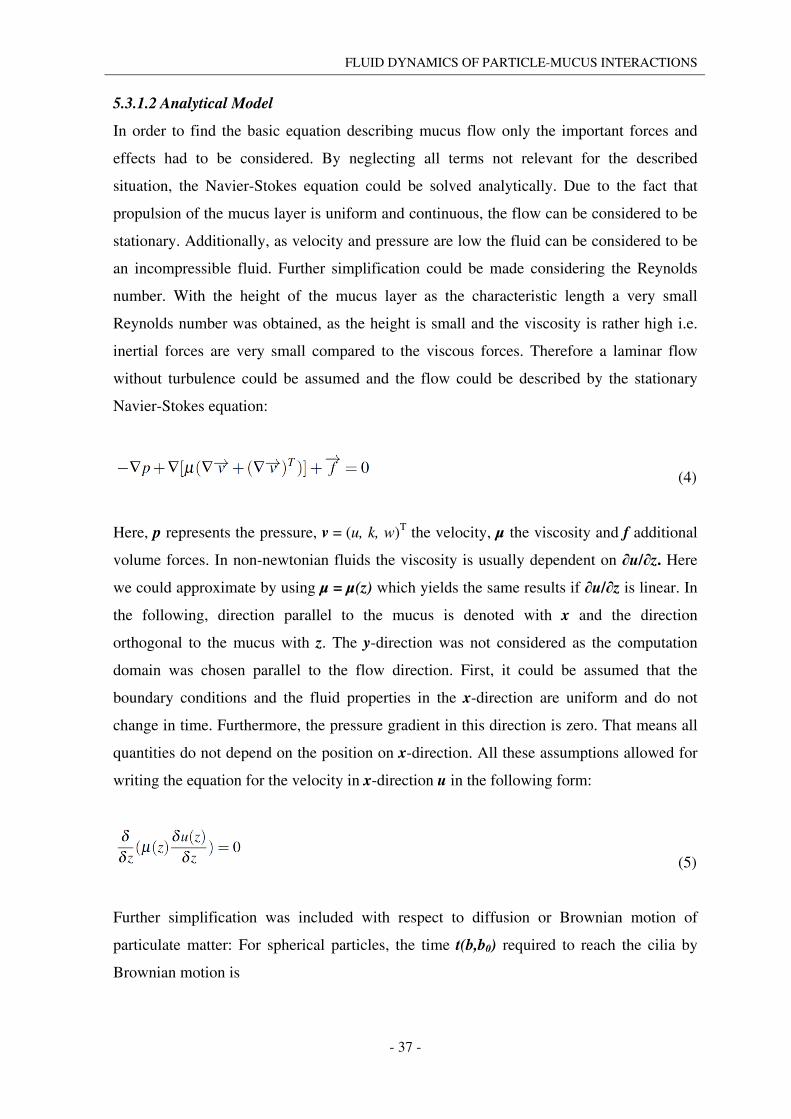
FLUID DYNAMICS OF PARTICLE-MUCUS INTERACTIONS
- 37 -
5.3.1.2 Analytical Model
In order to find the basic equation describing mucus flow only the important forces and
effects had to be considered. By neglecting all terms not relevant for the described
situation, the Navier-Stokes equation could be solved analytically. Due to the fact that
propulsion of the mucus layer is uniform and continuous, the flow can be considered to be
stationary. Additionally, as velocity and pressure are low the fluid can be considered to be
an incompressible fluid. Further simplification could be made considering the Reynolds
number. With the height of the mucus layer as the characteristic length a very small
Reynolds number was obtained, as the height is small and the viscosity is rather high i.e.
inertial forces are very small compared to the viscous forces. Therefore a laminar flow
without turbulence could be assumed and the flow could be described by the stationary
Navier-Stokes equation:
(4)
Here, p represents the pressure, v = (u, k, w)T the velocity, µ the viscosity and f additional
volume forces. In non-newtonian fluids the viscosity is usually dependent on ∂u/∂z. Here
we could approximate by using µ = µ(z) which yields the same results if ∂u/∂z is linear. In
the following, direction parallel to the mucus is denoted with x and the direction
orthogonal to the mucus with z. The y-direction was not considered as the computation
domain was chosen parallel to the flow direction. First, it could be assumed that the
boundary conditions and the fluid properties in the x-direction are uniform and do not
change in time. Furthermore, the pressure gradient in this direction is zero. That means all
quantities do not depend on the position on x-direction. All these assumptions allowed for
writing the equation for the velocity in x-direction u in the following form:
(5)
Further simplification was included with respect to diffusion or Brownian motion of
particulate matter: For spherical particles, the time t(b,b0) required to reach the cilia by
Brownian motion is

FLUID DYNAMICS OF PARTICLE-MUCUS INTERACTIONS
- 38 -
(6)
with b = thickness of mucus, b0 = starting height of the particle trajectory. D is given by
equation (2). Mucus viscosities range between 102 and 10-2 Pas (Lai, Wang et al., 2009).
Therefore we could determine a diffusion coefficient for a viscosity of 50 Pas which lead
(with an assumed thickness of 10 µm for the mucus blanket) to a value of
t(10 µm) = 1.1 x 10⁶ s (= 12.9 days). Even for highly diffusive particles (Lai, O'Hanlon et
al., 2007) with t(10 mm) = 500 s, mucociliary transport velocity (typical value in ex vivo
experiments: 2 mm/min) exceeds diffusional transport by far. Therefore it is plausible to
neglect diffusional transport through the mucus blanket in a simple analytical model.
Applied variables and parameters are summarized in table 3.
Table 3: Applied variables and their denotations
Variable Denotation
p pressure
µ viscosity
v flow velocity
u, k, w flow velocity in x, y, z direction
V particle velocity
U, K, W particle velocity in x, y, z direction
uM, uA flow velocity in mucus or air respectively
u0 drive velocity of the mucus layer
r particle radius
5.3.2 Simulation of Mucus Plasticity
Numerical simulations of mucus plasticity and mucus slab deformation were done using
the software tool Finite-Pointset Method (FPM) recently developed at the Fraunhofer-
Institute for Industrial Mathematics in Kaiserslautern, Germany (Tiwari and Kuhnert,
2002; Tiwari, Hietel et al., 2006). FPM solves fluid dynamic problems and its numerics are
based on a grid-free method, i.e. unlike other CFD tools like Fluent, FPM needs no mesh to
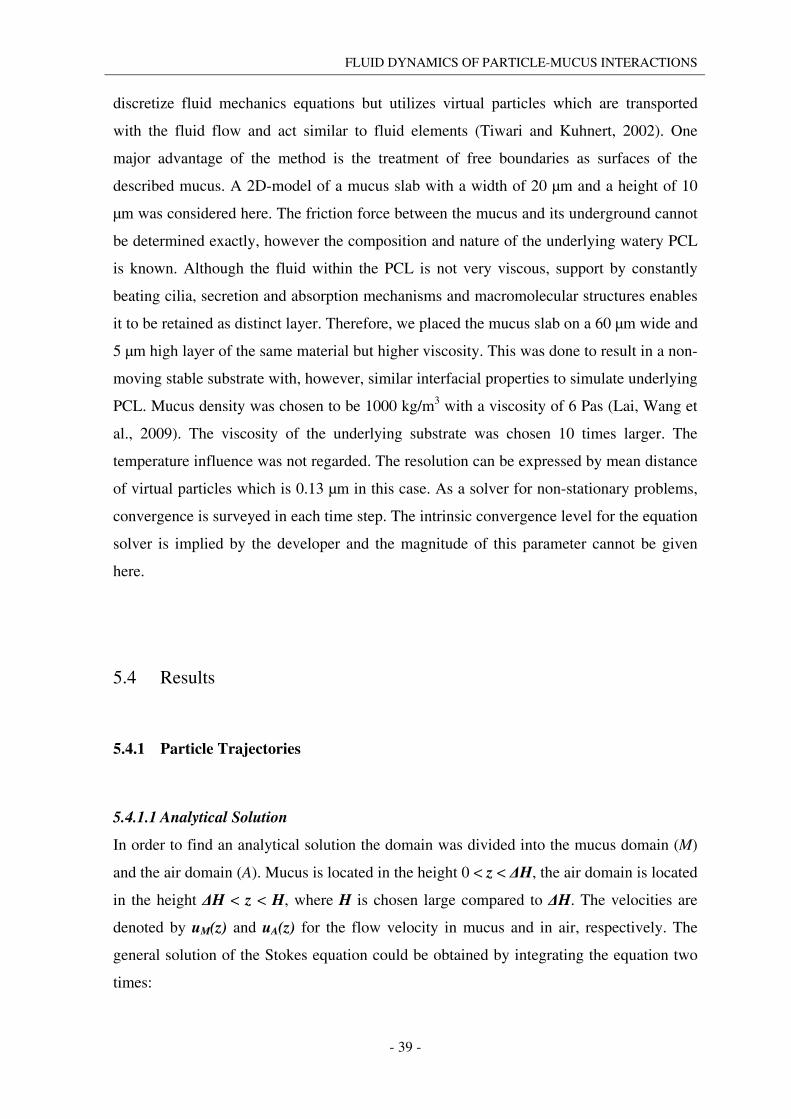
FLUID DYNAMICS OF PARTICLE-MUCUS INTERACTIONS
- 39 -
discretize fluid mechanics equations but utilizes virtual particles which are transported
with the fluid flow and act similar to fluid elements (Tiwari and Kuhnert, 2002). One
major advantage of the method is the treatment of free boundaries as surfaces of the
described mucus. A 2D-model of a mucus slab with a width of 20 µm and a height of 10
µm was considered here. The friction force between the mucus and its underground cannot
be determined exactly, however the composition and nature of the underlying watery PCL
is known. Although the fluid within the PCL is not very viscous, support by constantly
beating cilia, secretion and absorption mechanisms and macromolecular structures enables
it to be retained as distinct layer. Therefore, we placed the mucus slab on a 60 µm wide and
5 µm high layer of the same material but higher viscosity. This was done to result in a non-
moving stable substrate with, however, similar interfacial properties to simulate underlying
PCL. Mucus density was chosen to be 1000 kg/m3 with a viscosity of 6 Pas (Lai, Wang et
al., 2009). The viscosity of the underlying substrate was chosen 10 times larger. The
temperature influence was not regarded. The resolution can be expressed by mean distance
of virtual particles which is 0.13 µm in this case. As a solver for non-stationary problems,
convergence is surveyed in each time step. The intrinsic convergence level for the equation
solver is implied by the developer and the magnitude of this parameter cannot be given
here.
5.4 Results
5.4.1 Particle Trajectories
5.4.1.1 Analytical Solution
In order to find an analytical solution the domain was divided into the mucus domain (M)
and the air domain (A). Mucus is located in the height 0 < z < ΔH, the air domain is located
in the height ΔH < z < H, where H is chosen large compared to ΔH. The velocities are
denoted by uM(z) and uA(z) for the flow velocity in mucus and in air, respectively. The
general solution of the Stokes equation could be obtained by integrating the equation two
times:

FLUID DYNAMICS OF PARTICLE-MUCUS INTERACTIONS
- 40 -
(7a)
. (7b)
For the velocities in mucus and air following equations could be obtained:
. (8)
It can be assumed that the viscosity of air is almost constant so that the equations could be
simplified to
. (9)
It remained to determine the unknown constants C1, C2, C3, C4. The complete solution
could be obtained by choosing boundary and interface conditions. Therefore, the drive
velocity of cilia was chosen as u0. Finally, the following velocities could be obtained:
(10a)
. (10b)
These two equations describe flow velocity u(z) of the mucus layer and the air above. The
analytical solution of the flow velocity of the mucus layer uM(z) is compared to its
numerical solution in figure 13. These results qualitatively match experimental (Matsui,
Randell et al., 1998) as well as numerical results of previous studies which apply much
more complex models for the ciliary drive of the mucus layer (Smith, Gaffney et al., 2007;
Smith, Gaffney et al., 2008). Similar to those studies, mucus flow velocity was found to be
almost constant along the mucus’ height. The knowledge about flow velocities of mucus
depending on z was used to describe particle trajectories after deposition.

FLUID DYNAMICS OF PARTICLE-MUCUS INTERACTIONS
- 41 -
Figure 13: Comparison between numerical and analytical solution of mucus flow velocity depending on the
height above the surface (interface between PCL and mucus).
5.4.1.2 Particle Velocity and Path Inside Mucus
In the following section, the velocity and the path of a particle inside the mucus flow after
deposition is described. Under the assumption of a laminar flow, the drag force for a
spherical particle can be written according to the Stokes law:
(11)
with µM = viscosity of the mucus, r = particle radius and Vrel = relative velocity between
particle and fluid flow. To consider the vertical movement of particles (in z-direction,
orthogonal to mucus flow), we released a particle into the mucus with some initial velocity
W0 in z-direction. The particle motion is essentially determined by the balance of inertia
force and drag force. As there is no flow in z-direction now, the equation of motion was
given by
(12)
where mP is the particle mass. Here, f represents constant forces like gravitation and
buoyant forces. The solution of this (ordinary differential) equation was

FLUID DYNAMICS OF PARTICLE-MUCUS INTERACTIONS
- 42 -
(13)
where ρP is the density of the particle. To estimate the behavior of the velocity V(t),
relevant values, for instance, ρP = 1125 kg/m3, r = 100 x 10-9m were considered. Mucus
viscosity µM(z) was modeled as linearly increasing from 1 mPas at the bottom to 6 Pas at
the mucus/air interface. As particles do not move much in z-direction, this can be
approximated by using the constant value of 6 Pas at the air interface. Buoyant forces and
gravitation forces result in values in the order of the size 10-17 N, whereas friction force is
about 10-11 N for a typical mucus velocity of 2 mm/min. Thus, buoyant forces and
gravitation force could be neglected compared to the friction force. Looking on the particle
velocity, after t = 1.9 x 10⁻¹² s the initial velocity has decreased to approximately 1 % of its
original value. In addition, horizontal velocity (x-direction, parallel mucus flow) could be
considered. The equation of motion was given by
(14)
where uf is the flow velocity of the mucus (depends on z). Approximating that the particle
does not move much in vertical direction it could be assumed that the particle is located in
a constant height, hence, the fluid flow velocity at particle position is constant (uf = u0 =
mucus drive velocity) which is feasible by looking at the only slightly decreasing flow
velocity (figure 13, section 5.4.1.1). Using the equivalent equation of motion for the
horizontal direction, the following solution could be obtained:
. (15)
That means, the size of acceleration of a particle is the same as the deceleration in vertical
direction. Hence, the particle immediately accelerates to flow velocity. Now, the particle
path could be computed. In our case (with f = 0) the following equations could be
obtained:
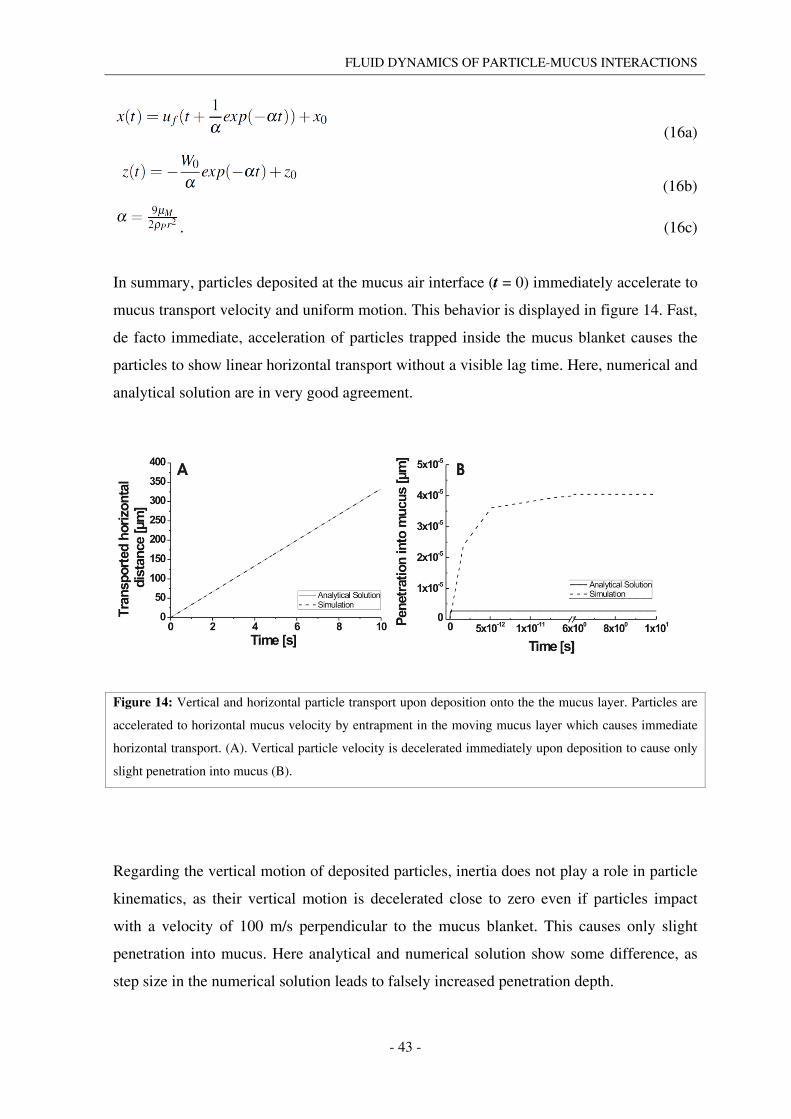
FLUID DYNAMICS OF PARTICLE-MUCUS INTERACTIONS
- 43 -
(16a)
(16b)
. (16c)
In summary, particles deposited at the mucus air interface (t = 0) immediately accelerate to
mucus transport velocity and uniform motion. This behavior is displayed in figure 14. Fast,
de facto immediate, acceleration of particles trapped inside the mucus blanket causes the
particles to show linear horizontal transport without a visible lag time. Here, numerical and
analytical solution are in very good agreement.
Figure 14: Vertical and horizontal particle transport upon deposition onto the the mucus layer. Particles are
accelerated to horizontal mucus velocity by entrapment in the moving mucus layer which causes immediate
horizontal transport. (A). Vertical particle velocity is decelerated immediately upon deposition to cause only
slight penetration into mucus (B).
Regarding the vertical motion of deposited particles, inertia does not play a role in particle
kinematics, as their vertical motion is decelerated close to zero even if particles impact
with a velocity of 100 m/s perpendicular to the mucus blanket. This causes only slight
penetration into mucus. Here analytical and numerical solution show some difference, as
step size in the numerical solution leads to falsely increased penetration depth.

FLUID DYNAMICS OF PARTICLE-MUCUS INTERACTIONS
- 44 -
5.4.2 Simulation of Mucus Plasticity
Considering the presented results of particle mobility upon deposition, it could be shown
that sedimentation of such particles within the mucus layer might not be a very probable
mechanism for particle translocation across this layer. The question of possible further
ways to access the underlying epithelium remains. One of those possibilities might be the
displacement of particles by plastic deformation of the mucus slab itself or deposition on
poorly covered patches of the epithelium. Here, on the one hand, the aim was to investigate
if such mucus slabs are likely to retain their shape (i.e. retention of existing gaps within the
mucus layer would also be possible) within physiologically relevant time spans (minutes to
hours, the time needed to clear particles from the lungs). On the other hand plasticity of
mucus slabs was analyzed to investigate whether particles deposited on top could access
the epithelium by deformation of mucus slabs involving mass transport from top to bottom.
Therefore, numerical grid-free methods (FPM) were applied which could simulate the
plasticity of 2D mucus slabs of a given cuboid shape upon removal of restraining
boundaries at the sides of the slab. These simulations gave insight into the time frame of
deformation of mucus slabs and the velocity and direction of deformation by gravitational
forces and diffusion. It was shown that mucus slabs can be considered rather stable in
terms of deformation within physiologically relevant time spans: Figure 15 shows mucus
slab deformation within a time span of 800 s. Here, figure 15A and 15B display the initial
situation (t = 0), figure 15C and 15D represent mucus deformation after 400 s. Figure 15E
and 15F display mucus deformation after 800 s.
Within this time, the cuboid mucus slab decreases in height by approximately 40 %.
Similarly, the slab flattens out and increases in surface. It can be shown that the magnitude
of deformation velocity of mucus is greatest in the area of the upper edges whereas mucus
in the area of the center of the slab shows smallest flow velocities. Concerning the
magnitude of the horizontal mucus deformation velocity (ux, figure 15B, 15D, 15F), it
could be shown that, again, areas of greatest velocity are located on the upper edges of the
cuboid mucus slab. In summary, it can be concluded that the shape of such mucus slabs
will be maintained within time spans of physiological relevance, where areas of greatest
deformation and flow velocity are located on the upper edges of the mucus slab.

FLUID DYNAMICS OF PARTICLE-MUCUS INTERACTIONS
- 45 -
Figure 15: Deformation of cuboid mucus slab by gravitational forces and diffusion after 0 s (A+B), 400 s
(C+ D) and 800 s (E+F). Images on the left (A, C, E) show magnitude of horizontal deformation velocity
whereas images on the right (B, D, F) represent magnitude of total deformation velocity. Dimension of all
data is m/s.
5.5 Discussion
5.5.1 Particle Trajectories
The aim of this study was to describe the mobility of nanoparticles in a complex biological
fluid such as respiratory mucus and the interactions of such particles with this fluid.
Particle trajectories and mobility of inhaled particles during impaction and sedimentation
within mucus and mucociliary clearance were solved numerically and analytically. In
addition, mucus plasticity was numerically solved to investigate further possibilities for
particle translocation across the mucus layer. Analytical and numerical considerations of

FLUID DYNAMICS OF PARTICLE-MUCUS INTERACTIONS
- 46 -
particles trajectories deposited onto mucus showed that inertia does not play a significant
role in the movement of particles within mucus. It could be shown analytically as well as
by simulation that particles which are deposited at the air-mucus interface immediately
accelerate to the velocity of the moving mucus layer. Vertical motion of particles during
deposition could also be solved numerically and analytically: Immediately upon
deposition, vertical particle velocity is decelerated quickly close to zero i.e. particles do not
penetrate significantly inside the mucus layer. Here, impaction velocity only plays a
marginal role in the quantitative behavior of particle sedimentation. Although simulations
were in good accordance with the analytical solution, slight differences were visible. These
were most probably due to step size during simulation. However, all these findings are in
accordance with previous experimental studies and simulations concerning mucus flow,
even for models involving much more complex mathematical description of mucus
propulsion by ciliated cells (Barton and Raynor, 1967; Fulford and Blake, 1986; Smith,
Gaffney et al., 2007; Smith, Gaffney et al., 2008).
5.5.2 Mucus Plasticity
To assess further possibilities for nanoparticles to reach the underlying epithelium,
plasticity of mucus structures was studied: It could be shown that deformation of mucus
slabs might be slow enough to allow retention of mucus structures within physiologically
relevant time spans, i.e. before the structures are cleared by ciliary propulsion (minutes to
hours). This finding is supported by previous experimental work which showed that the
mucus layer is heterogeneous in height, appearance and surface coverage over the whole
airways and does not form one continuous layer (Iravani and Melville, 1976; Im Hof, Gehr
et al., 1997; Sims and Horne, 1997; Gehr, Im Hof et al., 2000). From this, one could
conclude that possible gaps within the mucus layer might be retained in shape such that
particles deposited there would have direct access to the underlying epithelium.
Furthermore, it could be shown that during deformation the upper edges of the mucus slabs
are deformed with greatest velocity. Particles deposited there might be transported towards
the epithelium within the mucus. Clearly the presented approach represents only a rough
approximation to the real situation, as interfacial physico-chemistry was not included in the
model. Surface tension and other related effects cannot easily be modeled and need to be
thoroughly assessed to completely mimic mucus spreading. In addition to that, further

FLUID DYNAMICS OF PARTICLE-MUCUS INTERACTIONS
- 47 -
studies concerning exact particle position in this situation and collision of two or more
mucus slabs and its influence on deposited particles should follow. In summary, the
question of particle translocation across the mucus layer can be addressed in the following
way: The presented findings show that particles deposited on top of the mucus layer are
very unlikely to cross this layer by sedimentation, diffusion or impaction, at least within
time spans of physiological relevance, i.e. before particles entrapped by mucus are
excreted by mucociliary clearance. However, deposition of particles in gaps within the
mucus layer which were shown in our studies to retain their shape at least for short- and
mid-term considerations, may be a possibility for particles to directly access the
epithelium. Furthermore, deformation or collision mucus slabs may also lead to
translocation of entrapped particles to the epithelium due to mass transport on the edges of
the mucus slabs.
5.6 Conclusion
In this section the role of mucus fluid dynamics in the process of mucociliary clearance for
the fate of deposited particles was investigated. Both numerical and analytical solutions to
the problem were applied. Although using several approximations, it could be shown that
the presented results were in accordance to previous studies with much more complex
models. Both solutions were also in sufficient accordance to each other. In principle, the
presented study displayed the kinematic behavior of deposited particles. One main
conclusion from the presented results is the fact that particles cannot penetrate the mucus
blanket by impaction or sedimentation alone and seem to be rather immobile once
deposited onto the mucus blanket. This is a fact which is in accordance to the results
described in the previous section: Here no difference in mucociliary clearance of several
parameters was found. This is particularly feasible as there is no relative velocity between
the particles and the moving mucus layer as suggested by the results presented here.
However, particle mobility and diffusion on the microscale have to be considered to
complete the understanding of particle fate within the mucus layer of the lungs. This is
approached in the section to come.

THE ROLE OF MICRO- AND MACROSTRUCUTRE OF MUCUS IN PARTICLE MOBILITY
- 48 -
6. The Role of Micro- and Macrostructure of Mucus in
Particle Mobility
Parts of this chapter were published in:
Kirch, J., Schneider, A., et al. (2012). Optical tweezers reveal relationship between
microrheology and particle penetration of pulmonary mucus. submitted for publication
The first author contributed the following points to the publication:
• design, performance and interpretation of experiments • writing of the manuscript
The second author of the publication performed experiments involving optical tweezers.

THE ROLE OF MICRO- AND MACROSTRUCUTRE OF MUCUS IN PARTICLE MOBILITY
- 49 -
6.1 Abstract
In this study the mobility of nanoparticles in mucus and similar hydrogels as model
systems was assessed to elucidate the so far missing linkage between microscopic diffusion
behavior and macroscopic penetration of such gels. Differences in particle adhesion to
mucus components were strongly dependent on particle coating. Particles coated with
2 kDa PEG exhibited a decreased adhesion to mucus components whereas chitosan
strongly increased the adhesion. In spite of such mucoinert properties of PEG, magnetic
nanoparticles of both coatings did not penetrate through native respiratory mucus, resisting
high magnetic forces even for several hours. However, model hydrogels were, indeed,
penetrated by both particles in dependency of particle coating, obeying the theory of
particle mobility in an external force field. Comparison of penetration data with cryo
scanning electron microscopy (cryo-SEM) images of mucus and the applied model systems
suggested particularly high rigidity of the mucin scaffold and a broad pore size distribution
in mucus as reason for the observed particle immobilization. Active probing of the rigidity
of mucus and model gels with optical tweezers was used for the first time within this
context to confirm such properties of mucus on the microscale, thus presenting the missing
linkage between micro- and macroscopical observations: Due to high heterogeneity in the
size of the voids and pores of mucus, on small scales, particle mobility will depend on
adhesive or inert properties. However, particle translocation over distances larger than a
few microns is restricted by highly rigid structures within the mucus mesh.
6.2 Introduction
Mucus is a complex fluid of spatially varying properties containing hydrogel-forming
glycoproteins (mucins) that enable the exchange of nutrients, provide lubrication, and
protect the body from environmental influences. A compact layer of this hydrogel covers
the complete gastrointestinal tract, the urogenital tract and the epithelium of the upper and
central lung. Especially in pharmaceutical research, the barrier function of mucus is of
special importance. Translocation of particulate matter such as dust, pathogens like viruses,
or pharmaceutical (nano)carriers through this barrier is currently under investigation but

THE ROLE OF MICRO- AND MACROSTRUCUTRE OF MUCUS IN PARTICLE MOBILITY
- 50 -
still not completely understood. In contrast to pathogens or toxic agents, penetration of this
mucus barrier is strongly desired for any kind of drug delivery device, such as
(nano)particulate application systems. Here, especially modification of particles with
polyethylenglycol (PEG) was reported to enhance particle diffusivity within the probed
timeframe. On the contrary, chitosan is established as mucoadhesive, intending to increase
bioavailability, but may thus decrease particle diffusivity.
In the last years, the investigation of the microrheology of mucus in this context has been
gaining momentum (Lai, Wang et al., 2009). In particular the discrimination between
different filtering effects, their correlation with gel structure and further details on how
such filtering is controlled are being investigated (Lieleg and Ribbeck, 2011). Furthermore,
the influence of electrolytes such as bile salts on particle mobility in mucus is tackled
(Macierzanka, Rigby et al., 2011). The most established parameters to describe filtering
effects are pore size (Sanders, De Smedt et al., 2000) and particle-mucus interactions
(Mura, Hillaireau et al., 2011). The pore size is derived either from imaging data or particle
tracking experiments. Particle tracking also provides information on mucociliary clearance
and particle interactions with components of the mucus' polymer mesh (adhesion to
mucins). Current studies in this field either focus on pore size as limiting factor (Olmsted,
Padgett et al., 2001; Dawson, Wirtz et al., 2003) or suggest the more complex interaction
filtering of mucus rather than size-exclusion effects (Lieleg and Ribbeck, 2011).
Concerning non-cryo microscopic imaging, a disadvantage of such methods is their
susceptibility to artifacts due to their harsh conditions, staining, or sputtering. Particle
tracking experiments on the other hand suffer from limitations either in short correlation
time, small observed area, or both. An alternative to such small-scale mobility of particles
in mucus are classical diffusion chamber studies which quantify translocated particle
fractions (Sanders, De Smedt et al., 2000). Those studies, however, do not provide
information about microscopic particle behavior and mucus structure.
Therefore, although each being extensively investigated, the major problem in this field is
the still missing linkage between penetration behavior on scales larger than a few
micrometers and microrheology and -structure of mucus. The presented study bridges this
gap through combination of advanced methods which, to our knowledge, have not been
applied so far in this context. Initially, particle-mucus interactions were investigated by
force spectroscopy to quantify adhesion of differently coated nanoparticles to mucus
components to confirm mucoinert or mucoadhesive properties of the applied particles.

THE ROLE OF MICRO- AND MACROSTRUCUTRE OF MUCUS IN PARTICLE MOBILITY
- 51 -
Penetration of such differently adhesive particles through mucus and model gels was
investigated by quantifying penetration velocity of magnetic particles through capillaries
filled with mucus or model gels. Penetration behavior was assessed considering the theory
of particle mobility in a distinct force field. This macroscopic particle mobility was
correlated to microscopic mucus rheology and structure. Here, cryo scanning electron
microscopy (cryo-SEM) was applied which allowed for an unbiased determination of the
native mucus structure. Furthermore, optical tweezers were used to passively and actively
probe native respiratory mucus. This approach is unique in this context and demonstrated
that one crucial point in particle mobility is not only the pore size distribution but also
mucin scaffold rigidity which is not captured in regular methods to measure mucus
microrheology. This combination of pore size and rigidity in mucus could be used to
explain the mentioned discrepancy between micro- and macrorheology of mucus as well as
between low long distance mucus penetration and previously observed microscopic
particle mobility.
6.3 Experimental
6.3.1 Materials
All particles were obtained from commercial sources: For force measurements, PS
particles with covalently linked coating (chitosan and polyethylenglycol (PEG, 2 kDa),
500 nm diameter, Kisker Biotech, Steinfurt, Germany) were used. Capillary penetration
experiments were conducted with dextran iron oxide composite particles with covalently
linked coating (chitosan and PEG, 2 kDa) with a diameter of 170-200 nm (Micromod,
Rostock, Germany). For the experiments with the optical tweezers, either
polymethylmethacrylate (PMMA) beads (Fluka Productions GmbH, Buchs, Switzerland)
with a size of 4 µm or melamine resin beads (Fluka Productions GmbH, Buchs,
Switzerland) with a size of 5 µm were used. For optical tweezer experiments, the
observation of the samples was done with a Gene Frame (ABgene, Epsom, United
Kingdom), a special sample cell with a low volume of 25 µl. All chemicals used were of
analytical grade and purchased from standard commercial sources. Nanoparticles were
characterized regarding their size distribution by nanoparticle tracking analysis (NTA).

THE ROLE OF MICRO- AND MACROSTRUCUTRE OF MUCUS IN PARTICLE MOBILITY
- 52 -
Measurements were performed with a LM10-HS (NanoSight, Amesbury, United
Kingdom). This technique was previously demonstrated to be more precise in determining
particle size distributions than standard dynamic light scattering (DLS) especially for
polydisperse samples (Filipe, Hawe et al., 2010). Particle size distribution is displayed
below (figure 16).
Figure 16: Particle size distribution (hydrodynamic diameter) of PS particles (A+C) and magnetic dextran
particles (B+D) with PEG 2 kDa coating (right) or chitosan coating (left). Size distribution is averaged over
n = 3 independent experiments.
6.3.2 Atomic Force Microscopy
AFM cantilevers were cleaned and modified according to a previously described procedure
(Gfeller, Nugaeva et al., 2005). In short, cantilevers were cleaned twice in piranha etch
(97 % H2SO4 in 30% H2O2; 1:1), rinsed in millipore water and dried under nitrogen flow.
Cantilevers were suspended in silane solution (1 % 3-glycidyloxypropyl-trimethoxysilane,

THE ROLE OF MICRO- AND MACROSTRUCUTRE OF MUCUS IN PARTICLE MOBILITY
- 53 -
0.5 % N-ethyldiisopropylamine in water-free toluene) for 4 h at room temperature to form
a self-assembled monolayer (SAM), providing a hydroxyl-reactive surface towards
primary hydroxyl groups of mucins. After silanization, cantilevers were rinsed twice for
20 min with dry toluene and dried under nitrogen flow. Subsequently, cantilevers were
suspended overnight in 1 % mucin solution followed by a rinsing with millipore water. The
sample substrate was silica, cleaned equally as the used cantilevers. A drop of particle
suspension (chitosan or 2 kDa PEG coated polystyrene particles respectively in millipore
water) was placed onto the substrate and dried in air. These samples were used in
subsequent force imaging. Samples were inserted into the fluid cell of the AFM
(Multimode V, Bruker, Santa Barbara, USA). Measurements of force plots (force
spectroscopy) were done via so-called force volume imaging in fluid conditions where a
surface is scanned while recording force-distance plots for each pixel of the image
(figure 17). Force volume images (4096 force plots per image) were taken of the samples
with 10 nN trigger force and a surface dwell time of 1 s. Force plots attributed to the
particles were extracted, analyzed and compared to the force plots attributed to the
substrate with nanoscope 7.13 software (Bruker, Santa Barbara, USA). Adhesion force was
averaged over all force plots attributed to one particle. Several particles (n > 6) were
analyzed and the statistical variation in average adhesion force among the particles
considered as statistical error.
Figure 17: Force volume imaging allowed for the discrimination between mucoadhesive (red) and mucoinert
particles (blue) by the magnitude of adhesion to the mucin functionalized cantilever tip (left). SEM images of
the modified tip (right) display the dense layer of mucin on the tip.

THE ROLE OF MICRO- AND MACROSTRUCUTRE OF MUCUS IN PARTICLE MOBILITY
- 54 -
6.3.3 Capillary Penetration Experiments
Capillary penetration experiments were conducted according to a method recently
introduced by Kuhn et al. (Kuhn, Hallahan et al., 2006). Briefly, capillaries were filled
with a model gel or respiratory mucus, respectively and sealed with vacuum grease on one
end. 10 µl of particle suspensions (chitosan or 2 kDa PEG coated magnetic dextran iron
oxide composite particles, Micromod, Rostock, Germany) were pipetted on top of the gel
column. Filled capillaries were placed upright with their sealed end in a reproducible
position in 2 mm distance to the pole of a neodymium magnet (figure 18). Capillaries were
fixed in a reproducible position next to the pole of the magnet (neodymium permanent
magnet).
Figure 18: Gel filled columns were placed upright next to the magnet. Nanoparticle suspensions were filled
on top of the gel columns. Magnetic particles were pulled through the hydrogel mesh upon exposure to the
magnetic field.
A fit with the model of Chrambach and Rodbard was done according to a procedure
described previously (Sarbolouki, Mahnam et al., 2004). Here particle mobility in an
external force field as described as function of gel concentration is given by
(17)
THE ROLE OF MICRO- AND MACROSTRUCUTRE OF MUCUS IN PARTICLE MOBILITY
- 55 -
where m is the particle mobility, m0 the mobility in water, c the polymer concentration, and
k the system specific constant. Velocity of the magnetic particles while being pulled
through model gels or mucus was obtained by measuring the travelling time of the particle
at a fixed position in 2-4 mm distance to the pole of the magnet.
Native respiratory mucus was obtained during bronchoscopy of a healthy horse and stored
at -80 °C. According to previous studies, storage should not influence mucus rheological
properties (Gastaldi, Jardim et al., 2000). There was no access to mucus of further healthy
individuals. Model gel was hydroxyl-ethyl-cellulose (HEC, SE Tylose GmbH & Co. KG,
Wiesbaden, Germany) of various concentrations. To prepare model gels, the respective
amount of HEC was dissolved under overnight stirring in millipore water.
6.3.4 Cryo-SEM
HEC hydrogels and native respiratory mucus were imaged by cryo-SEM. HEC gels were
prepared by dissolving the respective amount of HEC in millipore water. Before SEM
imaging, HEC gels and mucus were collected in a thin dialysis capillary. Gel-filled
capillaries were immediately frozen in liquid propane, to only allow formation of
amorphous- and circumvent formation of crystalline water. Capillaries were cut into
smaller pieces to subsequently image the brim of the cut. Sublimation of frozen,
amorphous water inside the porous HEC gel and mucus was carried out for 1 h at -100 °C
(Baltec SCD 500 Sputter coater, Baltec/Leica, Germany). Subsequently, the surface of the
dry polymer scaffold was sputter coated with platinum (layer thickness approximately
12 nm. After sputtering, samples were transferred into the SEM (DSM 982 Gemini, Zeiss,
Jena, Germany) and imaged at -120 °C and 5 keV with 5-6 mm working distance.
6.3.5 Optical Tweezers
To probe the microstructure of the respective medium, the choice of the bead had to be
adapted to the optical properties of the fluid. In 1 % HEC gel (refractive index ≈ 1.33)
PMMA beads (refractive index ≈ 1.48) were used while in mucus melamin resin beads
THE ROLE OF MICRO- AND MACROSTRUCUTRE OF MUCUS IN PARTICLE MOBILITY
- 56 -
(refractive index ≈ 1.68) proved to be the optimal choice. Here, the difference in
refractive index should be maximized. For the preparation of the samples, a small volume
of beads (2-4 µl) with a solid content 10 % was mixed with about 100 µl of the respective
fluid. The concentration of beads was chosen in a range of 200-2000 ppm, so that
hydrodynamic interactions between multiple beads could be neglected. Following the
mixing process, all samples were vortexed for about five minutes to make sure that the
beads were distributed homogeneously within the fluid. 25 µl of this mixture were filled
into the sample holder and sealed airtight with cover glasses and vacuum grease.
The setup of the optical tweezers was identical with the one used by Ziehl et al. (Ziehl,
Bammert et al., 2009). The beam of a solid state laser (Ciel, Laser Quantum, Cheshire,
United Kingdom) was guided towards the oil immersion objective (numerical
aperture = 1.4, 60 x magnification) to create a harmonical trapping potential within its
focal region inside an inverted microscope (Eclipse TE2000-S, Nikon GmbH, Duesseldorf,
Germany). The visualization of trapped beads was achieved by illuminating the sample
with an LED illumination source (ZLED CLS 9000, Zett Optics, Braunschweig, Germany)
from above in the inverse direction of the laser beam through the sample cell onto the chip
of a high speed camera (HiSpec 2G, Fastec Imaging, San Diego, CA, USA). The beads
were recorded for a duration of 16 s with a sample rate of 16 kHz and tracked afterwards
by the means of a cross correlation algorithm realized in LabView 2011 (National
Instruments Germany GmbH, Munich, Germany) which allowed for the determination of
the particle displacements with a spatial resolution of approximately 2 nm (Cheezum,
Walker et al., 2001).
Two types of measurements were conducted: In passive tracking experiments, a bead was
held in place by the trap and the Brownian motion was recorded as reported above. Active
experiments were performed by moving the piezoelectric stage of the setup in a triangular
oscillation pattern induced by the signal of a waveform generator. The amplitude and
frequency of the oscillation were chosen according to the mobility of the bead at its current
position (usually between 1 µm and 4 µm and respectively 0.1 Hz and 0.2 Hz). The
observation time was chosen in a way that at least two full oscillation periods could be
recorded. Synchronous to image acquisition the voltage signal driving the stage was
recorded by a data acquisition card (National Instruments Germany GmbH, Munich,
Germany). All optical tweezers measurements were performed at a temperature of 20 °C.

THE ROLE OF MICRO- AND MACROSTRUCUTRE OF MUCUS IN PARTICLE MOBILITY
- 57 -
6.3.5.1 Determination of the Shear Moduli
The shear moduli were determined from the displacement data of beads that were confined
in the focal region of the optical trap. This was achieved for mucus as well as for the HEC
model gel by a method proposed in 1997 by Schnurr et al. (Schnurr, Gittes et al., 1997)
according to which the Fourier-transformed displacements ( ) are linked to the force
spectrum of Brownian motion ( ) by a response function , the compliance, which is a
complex function of the frequency ω for non-Newtonian fluids.
. (18)
Here, Fourier-transformed quantities are denoted by a tilde and the compliance is given by
(19)
while the power spectral density (PSD, | | ) of the particle displacements can be
related directly to the imaginary part of the response function α'' by applying the
fluctuation-dissipation-theorem (Landau and Lifshitz, 1966). The parameter α' can be
obtained by applying the Kramers-Kronig-relations as previously demonstrated (Addas,
Schmidt et al., 2004):
(20a)
. (20b)
The connection between the compliance of the material and its shear modulus is finally
given by
(21)

THE ROLE OF MICRO- AND MACROSTRUCUTRE OF MUCUS IN PARTICLE MOBILITY
- 58 -
where the shear modulus is given as
. (22)
At this point knowledge of the strength k of the optical trap is required because it
influences the elastic properties of the fluid over the whole frequency regime in form of an
additive constant:
. (23)
In the case of the HEC model gel these were determined directly out of the passive
measurements by using the equipartition of energy relating the thermal energy with the
harmonic trapping potential (Simmons, Finer et al., 1996). Due to the strong confinement
of the polymer network however this was not possible in mucus. Instead the calibration of
the trap strength was performed within a second sample cell containing water. The typical
strength of the optical trap used in the experiment ranged between 3 pN/µm and 8 pN/µm.
The frequency at which the corresponding apparent elastic modulus was reached also
defined the lower data cut-off, typically around 1 Hz. The shear modulus at even lower
frequencies would only represent the characteristics of the trap instead of those of the
fluids. As upper cut-off, a frequency of 3.5 kHz was chosen which lies well below the
Nyquist frequency (Shannon, 1949) of in our case 8.192 kHz. This choice was motivated
by the minimization of aliasing errors.

THE ROLE OF MICRO- AND MACROSTRUCUTRE OF MUCUS IN PARTICLE MOBILITY
- 59 -
6.4 Results
6.4.1 Force Spectroscopy
Determination of adhesive interactions between mucin fibers and nanoparticles of different
surface chemistry could be realized by force spectroscopy. Direct comparison of adhesion
forces between nanoparticles and silica substrate allowed for an unbiased comparison
between chitosan and PEG (2 kDa) coated PS-nanoparticles. Relative adhesion compared
to the substrate as shown in figure 19 demonstrated that chitosan coated particles adhered
much stronger to mucin fibers attached to the tip of the cantilever than PEG coated
particles. Whereas adhesion force between mucin functionalized tip and chitosan coated
particles was over 250 % stronger than to the substrate, PEG coating of nanoparticles even
resulted in a reduced adhesion compared to the bare silica substrate.
Figure 19: Adhesion of differently coated nanoparticles to mucin fibers compared to underlying silica substrate. Data shown as mean ± SD.
6.4.2 Capillary Experiments
Penetration of magnetic particles over macroscopic distances in mucus and model gels was
investigated by the method of Kuhn et al. (Kuhn, Hallahan et al., 2006). This method
allowed for the analysis of direct translocation and penetration behavior of differently
coated magnetic nanoparticles over defined distances in mucus and model systems.
Investigation of penetration behavior over such distances may predict the potential of
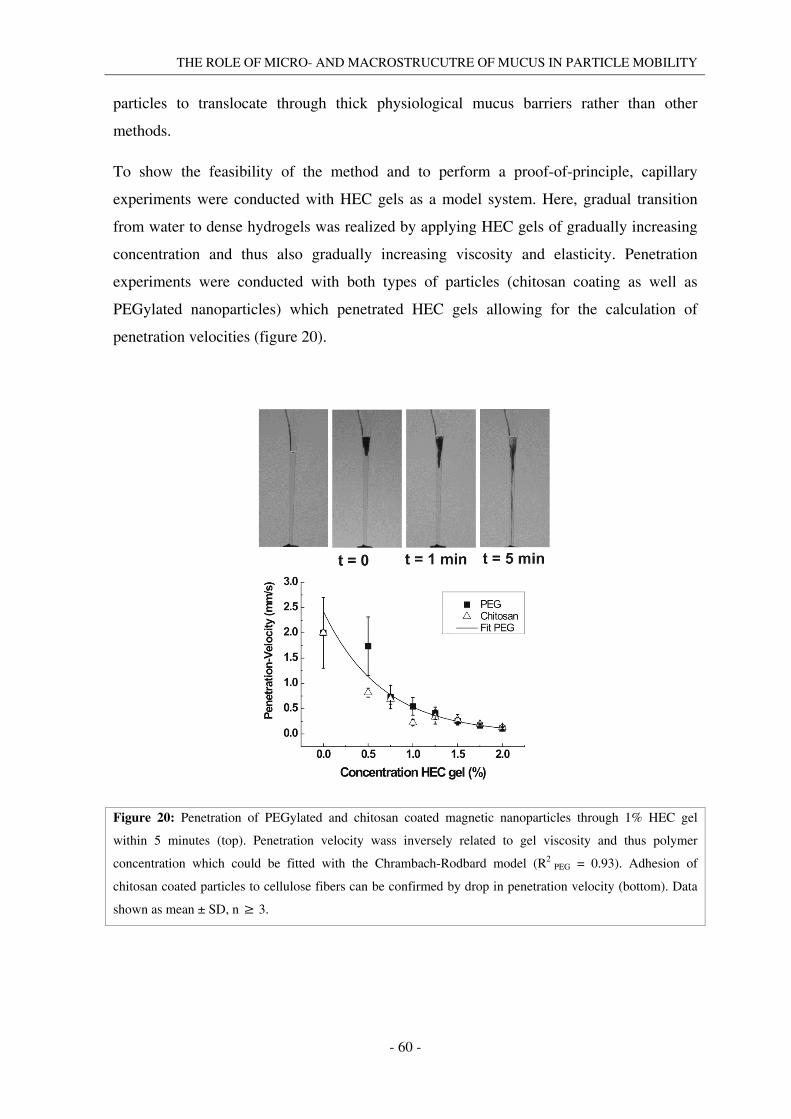
THE ROLE OF MICRO- AND MACROSTRUCUTRE OF MUCUS IN PARTICLE MOBILITY
- 60 -
particles to translocate through thick physiological mucus barriers rather than other
methods.
To show the feasibility of the method and to perform a proof-of-principle, capillary
experiments were conducted with HEC gels as a model system. Here, gradual transition
from water to dense hydrogels was realized by applying HEC gels of gradually increasing
concentration and thus also gradually increasing viscosity and elasticity. Penetration
experiments were conducted with both types of particles (chitosan coating as well as
PEGylated nanoparticles) which penetrated HEC gels allowing for the calculation of
penetration velocities (figure 20).
Figure 20: Penetration of PEGylated and chitosan coated magnetic nanoparticles through 1% HEC gel
within 5 minutes (top). Penetration velocity wass inversely related to gel viscosity and thus polymer
concentration which could be fitted with the Chrambach-Rodbard model (R2 PEG = 0.93). Adhesion of
chitosan coated particles to cellulose fibers can be confirmed by drop in penetration velocity (bottom). Data
shown as mean ± SD, n ≥ 3.

THE ROLE OF MICRO- AND MACROSTRUCUTRE OF MUCUS IN PARTICLE MOBILITY
- 61 -
It was shown that penetration velocity was indeed strongly dependent on rheological
properties and polymer concentration of the model gel (figure 20, bottom): Penetration
velocities of the particles in the HEC gel of the highest concentration decreased to
approximately a tenth of their initial value as measured in millipore water. Correlation of
particle velocity with polymer concentration of the respective hydrogel can be used to
assess the accordance of penetration behavior with theoretical models describing particle
mobility in a force field. Fitting of penetration velocities with the model of Chrambach and
Rodbard (Chrambach and Rodbard, 1971; Sarbolouki, Mahnam et al., 2004) shows that in
general, sufficient congruence can be reached for the penetration behavior of PEG particles
(R2 PEG = 0.93) which exhibits greater conformity with the mentioned model than
penetration behavior of chitosan coated nanoparticles: Here a fit with sufficient goodness
could not be achieved. Performing the same experiments with native respiratory mucus, it
could be shown that mucus is indeed a “tenacious fluid” (Florey, 1962): No penetration
into, let alone through the mucus column could be observed (figure 21). This was true even
for very long exposure (> 3 h) to the magnetic field. A difference between chitosan coated
or PEGylated nanoparticles in this behavior could at no point be observed.
Figure 21: Magnetic PEG coated nanoparticles did not penetrate into a mucus filled column even within
incubation times longer than 3 h.

THE ROLE OF MICRO- AND MACROSTRUCUTRE OF MUCUS IN PARTICLE MOBILITY
- 62 -
6.4.3 Cryo-SEM
Structural analysis of mucus and HEC gels was performed with cryo-SEM. The structure
of the polymer matrix of mucus and the differently concentrated HEC gels could be
imaged in their native state. The porous polymer scaffold of the gels could be visualized
with high resolution (figure 22-25) Pore size could be determined to range between
approximately 100 nm to 500 nm in HEC of 0.5 % concentration (figure 22). With
increasing polymer concentration, HEC hydrogels exhibit decreasing pore sizes as the
polymer mesh becomes more condensed (figure 23). The average thickness of the fibers of
the polymer scaffold can be determined to approximately 20 nm. Cryo-SEM imaging of
mucus gel revealed a very different structure of the mucin polymer mesh: In mucus, large
pores are heterogeneously combined with very small pores. Pore sizes of mucus ranged
between approximately 100 nm and voids of several micrometers in diameter (figure 24).
Furthermore, the thickness of the fibers of the polymer scaffold could be determined to be
much higher than in HEC gels (figure 25).
Figure 22: HEC gels of low concentration exhibit a very airy mesh structure with thin polymer fibers and
large, quite homogeneous pore sizes.

THE ROLE OF MICRO- AND MACROSTRUCUTRE OF MUCUS IN PARTICLE MOBILITY
- 63 -
Figure 23: With increasing polymer concentration, the mesh of HEC hydrogel becomes more condensed and
the sizes of the pores become smaller.
Figure 24: Mucus exhibits a very heterogeneous structure with a very broad pore size distribution from voids
of several micrometers to small pores below 100 nm. The area marked with a white square is displayed in
figure 25.

THE ROLE OF MICRO- AND MACROSTRUCUTRE OF MUCUS IN PARTICLE MOBILITY
- 64 -
Figure 25: Polymer fibers in mucus are much thicker than in HEC hydogels and form very thick pore walls,
suggesting a high rigidity of the polymer mesh. Pores can be very small and do not seem to be very well
connected.
6.4.4 Optical Tweezers
Optical tweezers as a non-invasive tool were applied to probe the microrheology and
particularly the rigidity of the polymer scaffold on the micrometer scale. Here, native
respiratory mucus as well as HEC model gels were analyzed in this regard with stationary
and oscillating optical traps. In the case of the stationary, passive tracking experiment, a
single bead was confined to a small spacial volume and the displacement from the center
of the trap was recorded. Afterwards the MSD was calculated (figure 26 & 27). It is linked
to the diffusion coefficient D of a fluid by the generalized Stokes-Einstein-equation
(equation 3). In the case of a simple Newtonian fluid which does not show any elastic
behavior, the coefficient α is equal to 1 and the MSD increases linearly with time. In
contrast, for complex fluids like hydrogels the history of former deformations plays an
important role on its flow properties and α may become bigger (superdiffusive behavior) or
smaller than 1 (subdiffusive behavior). The one-dimensional MSD of the beads out of the
center of the optical trap in dependency of the correlation time t of mucus (figure 26) and
the HEC model gel (figure 27) is displayed below.

THE ROLE OF MICRO- AND MACROSTRUCUTRE OF MUCUS IN PARTICLE MOBILITY
- 65 -
Figure 26: MSD values of the applied microparticles measured in native pulmonary mucus. Large range in
the slope of the MSD values determines strongly heterogeneous, locally varying rheological properties.
Symbols refer to different samples and different sites within the sample (nsamples ≥ 3).
Figure 27: MSD values of the applied microparticles measured in HEC hydogel (1 %). MSD values do not
depend on site as observable by the highly homogeneous slopes. Symbols refer to different samples and
different sites within the sample (nsamples ≥ 3).

THE ROLE OF MICRO- AND MACROSTRUCUTRE OF MUCUS IN PARTICLE MOBILITY
- 66 -
The data cut-off for long times was chosen at the point where the MSD reached a plateau
defined by the constrictions either due to the optical trap or the polymer scaffold.
Extensive heterogeneity of mucus morphology as suggested by cryo-SEM studies could be
confirmed: Highly diverse slopes of the MSD of particles in mucus in dependence of
correlation time indicate strongly varying local properties. Consequently, the observed
range in absolute values suggests a large variety in particle mobilities that spans more than
an order of magnitude at all observable correlation times. On the contrary, for HEC (1 %)
the measured MSD values lay within a much smaller range, thus demonstrating a high
rheological homogeneity of the bulk hydrogel.
Calculating storage and loss moduli, it was found that the microrheology of mucus presents
itself much more diverse than that of HEC. While the mean range of the storage modulus
in mucus (figure 28A) covered a whole order of magnitude at each frequency over the
whole frequency regime, the fluctuations in HEC (figure 28C) were a lot narrower and
typically did not move further apart than a factor of 2. The only exception were the moduli
at lower frequencies than 20 Hz which showed a significant scatter which may be due to
thermal drift of the piezo stage. Similar information could be deducted from the loss
moduli (figure 28B and 28D), where, again, the range in mucus is even more significant.
In general the presented results imply a similar elastic as well as viscous behavior of
mucus and HEC at frequencies between 10 Hz and 1000 Hz, differing mainly in terms of
high material heterogeneity in mucus and high homogeneity in HEC gels respectively.
In the HEC model gel, material homogeneity could be recovered not only from the
uniformity of the MSDs at different locations within the gel but also when considering
displacements at a certain spot in different directions i.e. along the x- and y-axis of the
pictures taken by the high-speed camera (figure 29). As displayed in figure 29B both
curves overlap almost completely. On the contrary, in mucus strong deviations in the
behavior of the MSD could be seen when comparing the x- and the y-direction of the
trajectories (figure 29A). When comparing the values of the MSD along the y-axis at
0.35 ms and 1 s, there is only an increase by a factor of 3.25 while along the x-axis the
values increase much steeper by a factor of 10.

THE ROLE OF MICRO- AND MACROSTRUCUTRE OF MUCUS IN PARTICLE MOBILITY
- 67 -
Figure 28: Storage- and loss moduli of mucus and HEC gel. Similar to MSD data, mucus (A+B) exhibits
broad ranges of loss- and storage moduli. Contrary, HEC hydrogel shows homogeneous distribution of both
moduli (C+D). Symbols refer to different samples and different sites within the sample (nsamples ≥ 3).
Figure 29: Material homogeneity is additionally displayed by comparing MSD data for x- and y-direction for
mucus (A) and HEC gel (B). In mucus, both curves differ significantly demonstrating high material
anisotropy whereas for HEC gels, both curves align well, demonstrating isotropic behavior.

THE ROLE OF MICRO- AND MACROSTRUCUTRE OF MUCUS IN PARTICLE MOBILITY
- 68 -
Importantly, although suggesting quite similar microrheology for both systems (either the
MSDs or the shear moduli), the clear difference in material homogeneity between mucus
and HEC gel is in accordance with the completely different macroscopic penetration
behavior of particles in mucus and HEC. Yet, according to the fluctuation data, both
materials should react similarly at least on a microscopic scale. To grasp these seemingly
contradictory properties, additional, active experiments had to be performed: Here, a bead
was caught in the trap and the piezoelectric stage the probe cell rested on was moved in a
triangular wave pattern. The motion of the stage and the displacements of the bead
relatively to the center of the trap were recorded. It could be shown that trapped particles
can easily be moved through the HEC gel (1 %) as the particle followed the moving trap
(figure 30B), i.e. the force exerted on it by the laser was sufficient to distort, stretch, or
even rupture the polymer scaffold of the dense HEC gel. On the contrary, active
measurements within mucus (figure 30A) showed that most beads could not be moved
significantly, demonstrating the high rigidity of the polymer scaffold.
Figure 30: Active measurements by oscillating trapped beads reveals rigidity of the mucus mesh as trapped
beads cannot be moved within the mesh while the trap is displaced by 1 µm in each direction (A). In HEC gel
(B) the trapped bead follows the trap during the complete oscillation cycle.

THE ROLE OF MICRO- AND MACROSTRUCUTRE OF MUCUS IN PARTICLE MOBILITY
- 69 -
6.5 Discussion
6.5.1 Force Spectroscopy
So far adhesive interactions between mucin fibers and differently coated nanoparticles
were usually investigated via quantification of mucin adsorption to these particles. In such
studies (Yoncheva, Lizarraga et al., 2005), PEGylation was shown to reduce mucin
adsorption and thus adhesion. The presented results are in good agreement with those
studies as increased adhesion with chitosan coating and decreased adhesion by PEGylation
could be confirmed. However, the approach presented here has the advantage of comparing
both types of particles directly with the underlying substrate as intrinsic control. Thus, the
results presented here are independent on the used cantilever and its tip geometry which
greatly influences adhesion data and has so far been an unsolved problem in the
methodology of force spectroscopy. While PEGylation of particles to decrease adhesive
interactions with mucus or mucins is a quite recent approach, application of chitosan
coating to increase such interactions has been widely accepted (Smart, 2005). Thus, the
influence of such different coatings on particle mobility in mucus of various sources has
been accessed by different methods. However, as mentioned before, those methods suffer
from several limitations. Therefore we applied a just recently developed method to probe
long-distance/long-term particle mobility to increase to proximity to the in vivo situation.
Here, particle mobility in mucus is investigated for time scales and spatial distances of
higher physiological relevance as presented in section 6.4.2.
6.5.2 Capillary Experiments
The observed behavior was in accordance with theoretical description of the particle
penetration through gels: The applied model describes penetration of spherical particles
through hydrogels by application of an external force field (e.g. electrostatic or magnetic
forces). The fact that this model incorporates inert i.e. non-adhesive particles as boundary
condition may be the reason for the greater goodness of the fit for PEGylated particles:
Similar to their interaction with mucins, chitosan coated particles may interact adhesively
with HEC fibers. As HEC fibers are polysaccharides, chemical similarities to
polysaccharide side chains of mucins over large areas cannot be doubted. Thus, HEC gels

THE ROLE OF MICRO- AND MACROSTRUCUTRE OF MUCUS IN PARTICLE MOBILITY
- 70 -
might mimic mucus gel and its adhesion to chitosan or chitosan coated particles. This
adhesive interaction is supposed to be largely due to electrostatic interactions (Andrews,
Laverty et al., 2009).
Furthermore, the model of Chrambach and Rodbard allowed for an estimation of the
average pore size of the gel: According to this model, the pore size equals the size of the
probe particles when penetration velocity drops to 50 % of its initial value. Considering the
fit of penetration velocity of PEGylated particles, this means that the average pore size of
HEC gels should be approximately 200 nm for concentrations around 0.5 % which could
later be confirmed by cryo-SEM images of HEC hydrogels (section 6.4.3).
The fact that both types of particle did show penetration through HEC gels but not through
mucus indicated the need to further characterize both systems. Therefore, the structure of
mucus and HEC gels was analyzed by cryo-SEM imaging of native respiratory mucus.
6.5.3 Cryo-SEM
The results presented here could confirm the findings obtained by the described capillary
experiments: Indeed, a pore size approaching the diameter of the penetrating particles of
approximately 200 nm can be expected to lie between HEC gel concentrations of 0.5 % to
1 %, as predicted by the Chrambach and Rodbard model. Furthermore, cryo-SEM images
pointed out, that in general, particles do penetrate hydrogels upon the application of
external forces, even if the pores are much smaller than the particles.
This fact revealed two considerable features of the mucus hydrogel which may have an
impact on particle mobility and penetration in this polymer mesh: pore size distribution in
conjunction with the thickness of the polymer scaffold. As mentioned above, comparison
of cryo-SEM images of HEC gels with the results presented in section 6.4.2 showed that
pore size is not always the limiting factor for penetration. Therefore, considering that
particles did not penetrate mucus, one would postulate either a high rigidity of the mucin
scaffold which resists any rupture or deformation upon application of external forces so
that particles are indeed captured in the smaller pores (if existing) or strong adhesive
interactions between particles and mucus. The observation of the thick polymer scaffold, a
very heterogeneous pore size distribution in mucus (which is in accordance with recent

THE ROLE OF MICRO- AND MACROSTRUCUTRE OF MUCUS IN PARTICLE MOBILITY
- 71 -
findings for cervical mucus (Lai, Wang et al., 2010)) and the fact that mucoinert
PEGylated particles did not show better penetration into mucus, suggests the former to be
the dominant mechanism here. The very thick polymer scaffold in mucus (figure 25) may
be composed of thick mucin bundles as suggested by an earlier study (Lai, Wang et al.,
2010). The consequences of such rigid and thick polymer structure were further assessed in
section 6.4.4. In summary, to describe mobility of particles in mucus, both size sieving
effects as well as interaction filtering have to be considered - however only in addition to
the evaluation of mechanical properties of the polymer scaffold: The results described
above demonstrate that the key feature of mucus is its highly rigid structure in conjunction
with the observed heterogeneous pore size distribution of very small but also large pores.
Assessment of the first point was performed with optical tweezers as advanced tool to
study active microrheology in a non-invasive way.
6.5.4 Optical Tweezers
The broad distribution of pore size in mucus (section 6.4.3) may be the reason for a broad
statistical spread of its rheological behavior (figures 26, 28, 29). Particles located in
smaller pores seem less mobile than particles located in large pores. In any case, however,
particles in mucus could not be translocated by trapping and the deflection of optical traps.
Contrary, no comparably large pores exist within HEC gels. This resulted in a much more
homogeneous material response. Together with relatively small pore sizes, the elastic as
well as the viscous modulus measured by passive tracking experiments in the setup of
optical tweezers showed comparable or even bigger values for HEC gels depending on the
excitation frequency. Active deflection of the beads was, however, possible for HEC gels.
Thus, while in mucus the MSD may pretend a large spread in particle mobility (with few
quite mobile particles), macroscopic capillary penetration experiments (see corresponding
section) and active particle deflection by optical traps challenged this result: In HEC gels,
particles could be driven actively through the fluid despite the MSD indicating a more
homogeneous but yet a similar confinement as in mucus. As sketched in figure 31,
particles in HEC gels are probably dispersed in dense gels of small pore sizes.

THE ROLE OF MICRO- AND MACROSTRUCUTRE OF MUCUS IN PARTICLE MOBILITY
- 72 -
Figure 31: Particles in HEC hydrogels can be displaced easily by external force fields due to a polymer mesh
which can be deformed or even ruptured (left). In mucus, particle mobility is determined mainly by the size
of the respective pore the particle is located in. The rigidity of the mucin scaffold, however, impedes
displacement of the particle out of such voids (right).
The key feature here is that contrary to mucus, upon actively displacing a bead, the
polymer scaffold of HEC gels may be deformed or even ruptured. In mucus, the mobility
of particles depends on the local pore size as the encounter of the bead with the wall of the
respective pore limits its mobility: Due to the polymer scaffold rigidity the beads cannot be
moved over larger distances. Therefore, the investigation of the microrheology by passive
particle tracking (measurement of MSD and further processing to calculate rheological
parameters) must not remain the sole method to extrapolate to particle translocations over
larger distances. This is particularly true for tracking experiments with very short
correlation times. It was shown in this study that a setup of optical tweezers is a reliable
tool not only to determine the microrheology of a material but also auxiliary parameters
such as pore rigidity and size on the micron scale.

THE ROLE OF MICRO- AND MACROSTRUCUTRE OF MUCUS IN PARTICLE MOBILITY
- 73 -
6.6 Conclusion
A combination of novel tools such as cryo-SEM, capillary penetration or optical tweezers
was applied to assess particle mobility in and penetration through mucus and model
hydrogels on various length scales. It could be shown that the thorough assessment of
particle penetration through mucus cannot be described solely by methods focusing on
only one scale, be it micro-, meso-, or macroscopic behavior. It was demonstrated that
neither adhesive or non-adhesive particle-mucus interactions, nor the pore size of the
hydrogel alone are sufficient parameters to describe particle mobility in mucus: HEC
hydrogels with much smaller pore sizes and comparable elastic and viscous modulus were
even shown to be penetrated more easily by magnetic particles than mucus. It was
discovered, that this discrepancy may be caused by differences in rigidity of the polymer
scaffold which was assessed by optical tweezers and a broad pore size distribution in
mucus. The observed differences in particle mobility due to surface chemistry as described
in the literature may thus be due to differences in particle adhesion to mucins within larger
voids of mucus. Therefore, this study presents the so far missing linkage between
microrheology and macroscopical observations regarding particle mobility in mucus.

OVERALL CONCLUSION AND OUTLOOK
- 74 -
7. Overall Conclusion and Outlook

OVERALL CONCLUSION AND OUTLOOK
- 75 -
The presented work illuminates the fate of inhaled material after encountering the mucus
layer as primary and most important non-cellular component of the air-blood barrier of the
upper lungs. Here, all main aspects of particle-mucus interactions such as fluid dynamics
and physical interactions were taken into account, in particular with respect to mucociliary
clearance and particle mobility in mucus.
• The identification of possible, yet unknown parameters affecting mucociliary
clearance was one of the major goals of the presented work. As it is displayed in the
first section of this study, we could show for the first time to our knowledge that
particle fate upon deposition as influenced by mucociliary clearance does not
depend on particle properties such as size, shape, charge and surface chemistry of
the particles under investigation. This was demonstrated in an ex vivo setup with
high relevance to the in vivo situation. A lack of relative velocity between
transported particles and their surrounding medium, the moving mucus blanket,
was concluded to be the reason for the observed independency on individual
particle properties. With mucociliary clearance velocity giving indirect evidence for
particle penetration through mucus, it was hypothesized that particles do not
sediment upon deposition on an intact and compact mucus layer. Therefore, a
possible small fraction of particles translocating to the epithelium was considered to
take advantage of turbulent mucus flow or of heterogeneities in the mucus mesh
such as larger voids or poorly covered patches of the epithelium. This hypothesis
was the foundation of the work presented in the second section.
• Here, mucus fluid dynamics was assessed by analytical and numerical methods. It
could be confirmed that, indeed, nanoparticles being deposited onto the mucus
blanket do not sediment or translocate into mucus due to impaction or gravitation.
This behavior leads to an only negligible time span where a relative velocity
between mucus and the particles still exists which is however a precondition to
observe differences in mucociliary clearance. Again, this approach is unique in
current research and contributed to clarify the fate of particles deposited on the
mucus blanket. The remaining mechanism potentially susceptible to particle
properties and thus being able to cause differences in translocation trough the
mucus blanket is translocation due to turbulent mucus flow, heterogeneous surface
coverage or collision and spreading of mucus flakes. This was proven feasible in a
computational approach. Particle diffusion as further mechanism for particle
OVERALL CONCLUSION AND OUTLOOK
- 76 -
translocation however, so far only considered in a simplified approach in the
described experiments and calculations, is highly dependent on mucus structure,
rheology and particle-mucus interactions. Therefore, these parameters needed to be
additionally investigated as it is shown in the third experimental section.
• As specified in the aim of the thesis, the parameters mentioned above were
hypothesized to be crucial factors for particle mobility in mucus. Here, the
presented unique approach combining macro- and microscopic investigation of
particle mobility, mucopenetration, mucus structure and rheology revealed several
key features of mucus inhibiting particle mobility on mesoscopic scales: Contrary
to chitosan coated particles, PEGylated particles were shown not to adhere to mucin
fibers. Despite of these, indeed, large differences in adhesive particle-mucus
interactions, particle penetration through mucus filled capillaries could surprisingly
not be observed for any particle type, resisting the applied external magnetic field.
Cryo-SEM analysis of the structure of mucus and HEC gels lead to the following
conclusion: Mucus heterogeneity in pore size and the thick, possibly rigid, polymer
scaffold may be the reason for large differences in particle mobility on the
microscopic scale but impede translocation over larger distances. These postulated
points were confirmed by experiments involving optical tweezers where active
deflection of trapped beads revealed that, indeed, even high forces cannot overcome
the restricting rigid walls of the pores inside mucus.
In the future, possibilities to overcome this rigid mucus barrier on the individual particle
level need to be assessed. Here, previous works as presented by Kuhn et al. (Kuhn,
Hallahan et al., 2006) proposed effective mechanisms such as the degradation of the
surrounding polymer mesh by enzymes bound to the particles’ surface as highly potential
delivery system for mucosal surfaces. Furthermore the indirect approach of using particles
adhesive to the epithelial cells and thus taking advantage of patches of the epithelium
which are poorly covered with mucus, seems to be suitable to increase the particle
concentration in the vicinity of the epithelium.

LIST OF FIGURES
- 77 -
8. List of Figures
Figure 1. ............................................................................................................................ - 5 -
Figure 2 ............................................................................................................................. - 8 -
Figure 3 ............................................................................................................................. - 9 -
Figure 4 ........................................................................................................................... - 10 -
Figure 5 ........................................................................................................................... - 14 -
Figure 6 ........................................................................................................................... - 14 -
Figure 7. .......................................................................................................................... - 20 -
Figure 8. .......................................................................................................................... - 22 -
Figure 9. .......................................................................................................................... - 25 -
Figure 10 ......................................................................................................................... - 26 -
Figure 11 ......................................................................................................................... - 35 -
Figure 12. ........................................................................................................................ - 36 -
Figure 13 ......................................................................................................................... - 41 -
Figure 14. ........................................................................................................................ - 43 -
Figure 15 ......................................................................................................................... - 45 -
Figure 16 ......................................................................................................................... - 52 -
Figure 17 ......................................................................................................................... - 53 -
Figure 18 ......................................................................................................................... - 54 -
Figure 19. ........................................................................................................................ - 59 -
Figure 20 ......................................................................................................................... - 60 -
Figure 21. ........................................................................................................................ - 61 -
Figure 22 ......................................................................................................................... - 62 -
Figure 23 ......................................................................................................................... - 63 -
Figure 24 ......................................................................................................................... - 63 -
Figure 25 ......................................................................................................................... - 64 -
Figure 26. ........................................................................................................................ - 65 -
Figure 27 ......................................................................................................................... - 65 -
Figure 28 ......................................................................................................................... - 67 -
Figure 29 ......................................................................................................................... - 67 -
Figure 30 ......................................................................................................................... - 68 -
Figure 31 ......................................................................................................................... - 72 -

LIST OF ABBREVIATIONS
- 78 -
9. List of Abbreviations
API Active Pharmaceutical Ingredient
AFM Atomic Force Microscopy
CF Cystic Fibrosis
CFD Computational Fluid Dynamics
COPD Chronic Obstructive Pulmonary Disease
CV Coefficient of Variation
Cryo-SEM Cryo Scanning Electron Microscopy
DAPI 4',6-diamidino-2-phenylindole
DLS Dynamic Light Scattering
DPM Discrete Phase Model
e.g. exempli gratia
ECT Embryonic Chicken Trachea
FITC fluorescein isothiocyanate
FPM Finite-Pointset Method
FWHM Full Width at Half Maximum
HEC Hydroxyethylcellulose
i.e. id est
MSD Mean Squared Displacement
NTA Nanoparticle Tracking Analysis
PAA Polyacrylic Acid
PC Phosphatidylcholine
PCL Periciliary Layer
PEG Polyethylenglycol
PEI Polyethylenimin
PMMA Polymethacrylate
PS Polystyrene
PSD Power Spectral Density
SAM Self-Assembled Monolayer
SD Standard Deviation
VOF Volume-Of-Fluid

REFERENCES
- 79 -
References
Addas, K. M., Schmidt, C. F., et al. (2004). Microrheology of solutions of semiflexible
biopolymer filaments using laser tweezers interferometry. Phys Rev E Stat Nonlin Soft
Matter Phys 70(2 Pt 1): 021503.
Andrews, G. P., Laverty, T. P., et al. (2009). Mucoadhesive polymeric platforms for
controlled drug delivery. Eur J Pharm Biopharm 71(3): 505-518.
Antunes, M. B. and Cohen, N. A. (2007). Mucociliary clearance--a critical upper airway
host defense mechanism and methods of assessment. Curr Opin Allergy Clin Immunol
7(1): 5-10.
Bailey, M. M. and Berkland, C. J. (2009). Nanoparticle formulations in pulmonary drug
delivery. Med. Res. Rev. 29(1): 196-212.
Barton, C. and Raynor, S. (1967). Analytical investigation of cilia induced mucous flow.
Bull Math Biophys 29(3): 419-428.
Bastacky, J., Lee, C. Y., et al. (1995). Alveolar lining layer is thin and continuous: low-
temperature scanning electron microscopy of rat lung. J Appl Physiol 79(5): 1615-1628.
Bennett, W. D. (2002). Effect of beta-adrenergic agonists on mucociliary clearance. J
Allergy Clin Immunol 110(6 Suppl): S291-297.
Boucher, R. C. (2007). Airway surface dehydration in cystic fibrosis: pathogenesis and
therapy. Annu Rev Med 58: 157-170.

REFERENCES
- 80 -
Button, B. and Boucher, R. C. (2008). Role of mechanical stress in regulating airway
surface hydration and mucus clearance rates. Respir Physiol Neurobiol 163(1-3): 189-201.
Champion, J. A., Katare, Y. K., et al. (2007). Making polymeric micro- and
nanoparticles of complex shapes. Proc Natl Acad Sci U S A 104(29): 11901-11904.
Cheezum, M. K., Walker, W. F., et al. (2001). Quantitative comparison of algorithms for
tracking single fluorescent particles. Biophys J 81(4): 2378-2388.
Chrambach, A. and Rodbard, D. (1971). Polyacrylamide gel electrophoresis. Science
172(3982): 440-451.
Cinti, C., Taranta, M., et al. (2011). Newly engineered magnetic erythrocytes for
sustained and targeted delivery of anti-cancer therapeutic compounds. PLoS One 6(2):
e17132.
Cone, R. A. (2009). Barrier properties of mucus. Adv Drug Deliv Rev 61(2): 75-85.
Crater, J. S. and Carrier, R. L. (2010). Barrier properties of gastrointestinal mucus to
nanoparticle transport. Macromol Biosci 10(12): 1473-1483.
Dawson, M., Wirtz, D., et al. (2003). Enhanced viscoelasticity of human cystic fibrotic
sputum correlates with increasing microheterogeneity in particle transport. J Biol Chem
278(50): 50393-50401.
Donaldson, S. H., Corcoran, T. E., et al. (2007). Mucociliary clearance as an outcome
measure for cystic fibrosis clinical research. Proc Am Thorac Soc 4(4): 399-405.

REFERENCES
- 81 -
Fiegel, J., Jin, F., et al. (2005). Wetting of a particle in a thin film. J Colloid Interface Sci
291(2): 507-514.
Filipe, V., Hawe, A., et al. (2010). Critical evaluation of Nanoparticle Tracking Analysis
(NTA) by NanoSight for the measurement of nanoparticles and protein aggregates. Pharm
Res 27(5): 796-810.
Fischer, K. E., Aleman, B. J., et al. (2009). Biomimetic nanowire coatings for next
generation adhesive drug delivery systems. Nano Lett 9(2): 716-720.
Florey, H. W. (1962). The secretion and function of intestinal mucus. Gastroenterology
43: 326-329.
Fulford, G. R. and Blake, J. R. (1986). Muco-ciliary transport in the lung. J Theor Biol
121(4): 381-402.
Gastaldi, A. C., Jardim, J. R., et al. (2000). The influence of temperature and length of
time of storage of frog mucus samples. Biorheology 37(3): 203-211.
Gehr, P., Green, F. H., et al. (1996). Airway surfactant, a primary defense barrier:
mechanical and immunological aspects. J Aerosol Med 9(2): 163-181.
Gehr, P., Im Hof, V., et al. (2000). The mucociliary system of the lung--role of
surfactants. Schweiz Med Wochenschr 130(19): 691-698.
Geiser, M., Cruz-Orive, L. M., et al. (1990). Assessment of particle retention and
clearance in the intrapulmonary conducting airways of hamster lungs with the
fractionator. J Microsc 160(Pt 1): 75-88.

REFERENCES
- 82 -
Geiser, M., Gerber, P., et al. (2000). Retention of Teflon particles in hamster lungs: a
stereological study. J Aerosol Med 13(1): 43-55.
Geiser, M., Im Hof, V., et al. (1997). Ultrastructure of the aqueous lining layer in
hamster airways: is there a two-phase system? Microsc Res Tech 36(5): 428-437.
Geiser, M. and Kreyling, W. G. (2010). Deposition and biokinetics of inhaled
nanoparticles. Part Fibre Toxicol 7: 2.
Geiser, M., Serra, A. L., et al. (1995). Efficiency of airway macrophage recovery by
bronchoalveolar lavage in hamsters: a stereological approach. Eur Respir J 8(10): 1712-
1718.
Gfeller, K. Y., Nugaeva, N., et al. (2005). Rapid biosensor for detection of antibiotic-
selective growth of Escherichia coli. Appl Environ Microbiol 71(5): 2626-2631.
Henning, A., Schneider, M., et al. (2008). Embryonic chicken trachea as a new in vitro
model for the investigation of mucociliary particle clearance in the airways. AAPS
PharmSciTech 9(2): 521-527.
Henning, A., Schneider, M., et al. (2010). Influence of particle size and material
properties on mucociliary clearance from the airways. Journal of Aerosol Medicine and
Pulmonary Drug Delivery 23(4): 233-241.
Hirt, C. W. and Nichols, B. D. (1981). Volume of fluid (VOF) method for the dynamics of
free boundaries. J Comput Phys 39(1): 201-225.
Hofmann, W. and Asgharian, B. (2003). The effect of lung structure on mucociliary
clearance and particle retention in human and rat lungs. Toxicol Sci 73(2): 448-456.

REFERENCES
- 83 -
Im Hof, V., Gehr, P., et al. (1997). In vivo determination of surface tension in the horse
trachea and in vitro model studies. Respir Physiol 109(1): 81-93.
Iravani, J. and Melville, G. N. (1976). Mucociliary function in the respiratory tract as
influenced by physicochemical factors. Pharmacol Ther B 2(3): 471-492.
Khanvilkar, K., Donovan, M. D., et al. (2001). Drug transfer through mucus. Adv Drug
Deliv Rev 48(2-3): 173-193.
King, M. (2006). Physiology of mucus clearance. Paediatr Respir Rev 7 Suppl 1: S212-
214.
Koch, A. M., Reynolds, F., et al. (2005). Transport of surface-modified nanoparticles
through cell monolayers. Chembiochem 6(2): 337-345.
Kreuter, J. (1991). Nanoparticle-based dmg delivery systems. J Control Release 16(1-2):
169–176.
Kuhn, S. J., Hallahan, D. E., et al. (2006). Characterization of superparamagnetic
nanoparticle interactions with extracellular matrix in an in vitro system. Ann Biomed Eng
34(1): 51-58.
Lai, S. K., O'Hanlon, D. E., et al. (2007). Rapid transport of large polymeric
nanoparticles in fresh undiluted human mucus. Proc Natl Acad Sci U S A 104(5): 1482-
1487.
Lai, S. K., Wang, Y. Y., et al. (2009). Mucus-penetrating nanoparticles for drug and gene
delivery to mucosal tissues. Adv Drug Deliv Rev 61(2): 158-171.

REFERENCES
- 84 -
Lai, S. K., Wang, Y. Y., et al. (2010). Nanoparticles reveal that human cervicovaginal
mucus is riddled with pores larger than viruses. Proc Natl Acad Sci U S A 107(2): 598-
603.
Lai, S. K., Wang, Y. Y., et al. (2009). Micro- and macrorheology of mucus. Adv Drug
Deliv Rev 61(2): 86-100.
Landau, L. D. and Lifshitz, E. M. (1966). In course of theoretical physics: statistical
physics part 1. 5: 371-389.
Lieleg, O. and Ribbeck, K. (2011). Biological hydrogels as selective diffusion barriers.
Trends Cell Biol 21(9): 543-551.
Livraghi, A. and Randell, S. H. (2007). Cystic fibrosis and other respiratory diseases of
impaired mucus clearance. Toxicol Pathol 35(1): 116-129.
Macierzanka, A., Rigby, N. M., et al. (2011). Adsorption of bile salts to particles allows
penetration of intestinal mucus. Soft Matter 7: 8077.
Matsui, H., Randell, S. H., et al. (1998). Coordinated clearance of periciliary liquid and
mucus from airway surfaces. J Clin Invest 102(6): 1125-1131.
Moller, W., Felten, K., et al. (2008). Deposition, retention, and translocation of ultrafine
particles from the central airways and lung periphery. Am J Respir Crit Care Med 177(4):
426-432.
Mura, S., Hillaireau, H., et al. (2011). Biodegradable nanoparticles meet the bronchial
airway barrier: how surface properties affect their interaction with mucus and epithelial
cells. Biomacromolecules 12(11): 4136-4143.
REFERENCES
- 85 -
Oberdorster, G., Oberdorster, E., et al. (2005). Nanotoxicology: an emerging discipline
evolving from studies of ultrafine particles. Environ Health Perspect 113(7): 823-839.
Olmsted, S. S., Padgett, J. L., et al. (2001). Diffusion of macromolecules and virus-like
particles in human cervical mucus. Biophys J 81(4): 1930-1937.
Patton, J. S. and Byron, P. R. (2007). Inhaling medicines: delivering drugs to the body
through the lungs. Nat Rev Drug Discov 6(1): 67-74.
Peppas, N. A. and Huang, Y. (2004). Nanoscale technology of mucoadhesive
interactions. Adv Drug Deliv Rev 56(11): 1675-1687.
Powell, R. L., Aharonson, E. F., et al. (1974). Rheological behavior of normal
tracheobronchial mucus of canines. J Appl Physiol 37(3): 447-451.
Randell, S. H. and Boucher, R. C. (2006). Effective mucus clearance is essential for
respiratory health. Am J Respir Cell Mol Biol 35(1): 20-28.
Sanders, N., Rudolph, C., et al. (2009). Extracellular barriers in respiratory gene
therapy. Adv Drug Deliv Rev 61(2): 115-127.
Sanders, N. N., De Smedt, S. C., et al. (2003). Mobility and stability of gene complexes in
biogels. J Control Release 87(1-3): 117-129.
Sanders, N. N., De Smedt, S. C., et al. (2000). Cystic fibrosis sputum: a barrier to the
transport of nanospheres. Am J Respir Crit Care Med 162(5): 1905-1911.
Sarbolouki, M. N., Mahnam, K., et al. (2004). Determination of pore/protein size via
electrophoresis and slit sieve model. Electrophoresis 25(17): 2907-2911.

REFERENCES
- 86 -
Scheuch, G., Kohlhaeufl, M. J., et al. (2006). Clinical perspectives on pulmonary
systemic and macromolecular delivery. Adv Drug Deliv Rev 58(9-10): 996-1008.
Schnurr, B., Gittes, F., et al. (1997). Determining microscopic viscoelasticity in flexible
and semiflexible polymer networks from thermal fluctuations Macromolecules 30: 7781-
7792.
Schurch, S., Gehr, P., et al. (1990). Surfactant displaces particles toward the epithelium
in airways and alveoli. Respir Physiol 80(1): 17-32.
Schürch, S., Gehr, P., et al. (1990). Surfactant displaces particles toward the epithelium
in airways and alveoli. Respir Physiol 80(1): 17-32.
Shannon, C. E. (1949). Communication in the presence of noise. Proceedings of the IRE
37: 10-21.
Simmons, R. M., Finer, J. T., et al. (1996). Quantitative measurements of force and
displacement using an optical trap. Biophys J 70(4): 1813-1822.
Sims, D. E. and Horne, M. M. (1997). Heterogeneity of the composition and thickness of
tracheal mucus in rats. Am J Physiol 273(5 Pt 1): L1036-1041.
Smart, J. D. (2005). The basics and underlying mechanisms of mucoadhesion. Adv Drug
Deliv Rev 57(11): 1556-1568.
Smith, D. J., Gaffney, E. A., et al. (2007). A viscoelastic traction layer model of muco-
ciliary transport. Bull Math Biol 69(1): 289-327.

REFERENCES
- 87 -
Smith, D. J., Gaffney, E. A., et al. (2008). Modelling mucociliary clearance. Respir
Physiol Neurobiol 163(1-3): 178-188.
Tarran, R., Trout, L., et al. (2006). Soluble mediators, not cilia, determine airway
surface liquid volume in normal and cystic fibrosis superficial airway epithelia. J Gen
Physiol 127(5): 591-604.
Thornton, D. J. and Sheehan, J. K. (2004). From mucins to mucus: toward a more
coherent understanding of this essential barrier. Proc Am Thorac Soc 1(1): 54-61.
Tiwari, S. and Kuhnert, J. (2002). Finite pointset method based on the projection method
for simulations of the incompressible Navier-Stokes equations. Springer LNCSE: Meshfree
methods for Partial Differential Equations 26.
Tiwari, S. A., Hietel, D., et al. (2006). Meshfree method for simulations of interactions
between fluids and flexible structures, lecture notes in computational science and
engineering. Meshfree Methods for Partial Differential Equations III: 249 - 264.
Tseng, P., Di Carlo, D., et al. (2009). Rapid and dynamic intracellular patterning of cell-
internalized magnetic fluorescent nanoparticles. Nano Lett 9(8): 3053-3059.
Valentine, M. T., Perlman, Z. E., et al. (2004). Colloid surface chemistry critically
affects multiple particle tracking measurements of biomaterials. Biophys J 86(6): 4004-
4014.
van As, A. and Webster, I. (1972). The organization of ciliary activity and mucus
transport in pulmonary airways. S Afr Med J 46(13): 347-350.
Verdugo, P. (1991). Mucin exocytosis. Am Rev Respir Dis 144(3 Pt 2): S33-37.

REFERENCES
- 88 -
Verdugo, P., Deyrup-Olsen, I., et al. (1987). Molecular mechanism of mucin secretion: I.
The role of intragranular charge shielding. J Dent Res 66(2): 506-508.
Widdicombe, J. H. (2002). Regulation of the depth and composition of airway surface
liquid. J Anat 201(4): 313-318.
Yoncheva, K., Lizarraga, E., et al. (2005). Pegylated nanoparticles based on poly(methyl
vinyl ether-co-maleic anhydride): preparation and evaluation of their bioadhesive
properties. Eur J Pharm Sci 24(5): 411-419.
Ziehl, A., Bammert, J., et al. (2009). Direct measurement of shear-induced cross-
correlations of Brownian motion. Phys Rev Lett 103(23): 230602.

CURRICULUM VITAE
- 89 -
Curriculum Vitae
PERSONAL Date of birth:
January 19th, 1984 in Saarbruecken
Marital Status: married
EDUCATION 09/2009 – 05/2012
Doctoral thesis at Saarland University, AG Lehr with the title: “The
Role of Fluid Dynamics, Microstructure and Mucociliary Clearance
in the Micro- and Macroscopic Barrier Properties of Pulmonary
Mucus”
10/2008 – 08/2009
Diploma thesis at the Technical University Kaiserslautern, AG
Ziegler with the title: “Rasterkraftmikroskopische Charakterisierung
von Biofilmen auf Dentalmaterialien“, granting of the diploma in
biophysics
10/2004 – 10/2008
Undergraduate studies of biophysics at the Technical University
Kaiserslautern
03/2003
Graduation at the „Staatl. Gymnasium Hermeskeil“
1994 – 2003
Staatl. Gymnasium Hermeskeil
AWARDS 03/2011
INTERNATIONAL SOCIETY FOR AEROSOLS IN MEDICINE
Student Research Award 2011, third prize

CURRICULUM VITAE
- 90 -
INTERNSHIPS 08/2008
Internship at the Fraunhofer Institut for Biomedical Engineering
(IBMT), St. Ingbert
05/2003
Internship at the Landesamt für Gesundheit und Verbraucherschutz,
Saarbruecken
INTERNATIONAL EXPERIENCE 06/2004 – 08/2004
Volunteering at the farm Sidri-Vellir, Iceland
08/2000 – 07/2001
Study at the Worcester Academy, Worcester, USA
ZIVILDIENST 05/2003 – 05/2004
Zivilidienst at the Schule und Internat für Blinde und Gehörlose,
Lebach

LIST OF PUBLICATIONS
- 91 -
List of Publications
Scientific Publications
Kirch, J., Guenther, M., et al. (2012). Mucociliary clearance of micro- and nanoparticles
is independent of size, shape and charge—an ex vivo and in silico approach. J Control
Release 159(1): 128-134
Kirch, J., Guenther, M., et al. (2012). Computational fluid dynamics of nanoparticle
disposition in the airways: mucus interactions and mucociliary Clearance. Comput Visual
Sci: accepted
Kirch, J., Schneider, A., et al. (2012). Optical tweezers reveal relationship between
microrheology and particle penetration of pulmonary mucus. submitted for publication
Ruge, C. A., Kirch, J., et al. (2011). Uptake of nanoparticles by alveolar macrophages is
triggered by surfactant protein A. Nanomedicine: NBM 7: 690-693
Kirch, J., Ruge, C. A., et al. (2012). Nanostructures overcoming the pulmonary barrier:
Physiological considerations and mechanistic issues. RSC drug discovery series:
Nanostructured biomaterials for overcoming biological barriers: Book Chapter
Pfeifer, C., Hasenpusch, G., et al. (2011). Dry powder aerosols of polyethylenimine
(PEI)-based gene vectors mediate efficient gene delivery to the lung. J Control Release 154
(1): 69-76

LIST OF PUBLICATIONS
- 92 -
Poster & Talks
Kirch, J. Schneider, M., et al. (2011). computational fluid dynamics of nanoparticle
deposition in mucus and mucociliary clearance. ISAM Congress, Rotterdam (NED):
Poster
Kirch, J., Guenther, M., et al. (2011). Computational fluid dynamics of nanoparticle
deposition in the lung and mucociliary clearance. Modeling Biological Membranes,
Frankfurt (D): Talk
Kirch, J. Schneider, A., et al. (2010). New methods and models to investigate interactions
between nanoparticles and mucus. Biological Barriers, Saarbruecken (D): Poster
Kirch, J. Schneider, M., et al. (2010). Mucociliary clearance of nanoparticles -
computer-assisted image analysis. Aerosol Seminar, Marburg (D): Poster
Kirch, J. Schneider, M., et al. (2010). Improved particle tracking in mucociliary
clearance experiments by simultaneous application of differently labelled particles. PSWC
World Congress, New Orleans (USA): Poster
Mueller, C., Wald, J., et al. (2010). Bioadhesion on surfaces in the oral cavity – a
combined surface analytical approach. ESB, 23rd European Conference on Biomaterials,
Tampere (Finnland): Poster
Huber, C., Kirch, J., et al. (2010). Untersuchungen der Protein-Protein-Wechselwirkung
in dentalen Biofilmen. 16. Arbeitstagung Angewandte Oberflächenanalytik (AOFA),
Kaiserslautern (D): Poster
LIST OF PUBLICATIONS
- 93 -
Mueller, C., Lueders, A., et al. (2009). Initial bioadhesion on surfaces in the oral cavity
investigated by different surface science methods. Euro AFM Forum, Garching (D): Poster
Kirch, J., Mueller, C., et al. (2009). Protein-protein interaction on dental surfaces. Euro
AFM Forum, Garching (D): Talk
Kirch, J., Mueller, C., et al. (2009). Protein-protein interactions on dental surfaces
studied by scanning force spectroscopy (SFS). SPM and Organic Materials XVII, Bremen
(D): Poster
Kirch, J., Mueller, C., et al. (2009). Protein-protein interactions on dental surfaces
studied by scanning force spectroscopy (SFS). Euro AFM Forum, Garching (D): Poster

ACKNOWLEDGEMENTS
- 94 -
Acknowledgements
First of all I would like to thank Prof. Dr. Claus-Michael Lehr who gave me the
opportunity to develop not only my scientific skills but also my personality to a great
extend. In addition I would like to thank him for his creative advice during the last years
and the trust he has put into myself and the way we approached the goal of our research. It
has been great to enjoy his passion and determination.
Additionally, I feel deeply grateful towards Prof. Dr. Ulrich Schaefer as my main advisor
who contributed to so much of our scientific work and has been delightful to work with
throughout my time at Saarland University.
Furthermore, I would especially like to thank Andreas Schneider and Prof. Dr. Marco
Guenther which contributed some much to the work presented here and were always open
for discussion and new approaches.
To Christian Ruge and Prof. Dr. Marc Schneider for their social and technical support:
Thank you very much! Without the both of you the last years would have been much less
enjoyable.
In addition, I greatly appreciate the constant advice of Prof. Dr. Ingolf Bernhardt who
helped me a lot to improve the results presented here.
I also thank all my colleagues for the brilliant spirit among the Ph.D. students and the
amicable atmosphere in the lab! It was great to get to know all of you! Furthermore, a big
thank you goes to all our technicians who make our work possible in the first place.
Furthermore, I would like thank the German Research Association for the generous
funding of the project.