The Role of Firms’ Life Cycle Stages on Voluntary ...
20
this article is distributed under the terms of the creative commons attribution 4.0 international license 1 Universidade Federal do Espírito Santo, Vitória, ES, Brasil Received: 05/30/2019. Revised: 10/30/2019. Accepted: 04/06/2020. Published Online: 10/05/2020. DOI: http://dx.doi.org/10.15728/bbr.2020.17.6.1 e Role of Firms’ Life Cycle Stages on Voluntary Disclosure and Cost of Equity Capital in Brazilian Public Companies Paulo Victor Novaes 1 [email protected] | 0000-0002-6466-9489 Jose Elias Almeida 1 [email protected] | 0000-0001-5220-0598 ABSTRACT We examine the effects of firms’ life cycle stages on voluntary disclosure and the cost of equity capital. We also examine the relationship between the interaction of life cycle stages and voluntary disclosures measures on cost of equity capital. Our sample consists of non-financial Brazilian public companies, covered by analysts between 2008 and 2014, collected from I/B/E/S and Comdinheiro databases. We find that voluntary disclosure level is higher for firms in maturity and growth stages. We also find that firms in introduction and decline life cycle stages show higher implied cost of capital, however declining firms that increase voluntary disclosure reduce their cost of capital. Moreover, mature firms significantly reduce such inherent risk by reporting social and environmental voluntary information. Our results are useful for investors, practitioners, and regulators to the understanding of the incentives of voluntary disclosure practices. KEYWORDS Voluntary Disclosure, Cost of Equity Capital, Implied Cost of Capital, Life Cycle Stages, Emerging Market
Transcript of The Role of Firms’ Life Cycle Stages on Voluntary ...
this article is distributed under the terms of the creative commons attribution 4.0 international license
1Universidade Federal do Espírito Santo, Vitória, ES, Brasil
Received: 05/30/2019.Revised: 10/30/2019.Accepted: 04/06/2020.Published Online: 10/05/2020.DOI: http://dx.doi.org/10.15728/bbr.2020.17.6.1
The Role of Firms’ Life Cycle Stages on Voluntary Disclosure and Cost of Equity Capital in Brazilian Public Companies
Paulo Victor Novaes1
[email protected] | 0000-0002-6466-9489
Jose Elias Almeida1 [email protected] | 0000-0001-5220-0598
ABSTRACTWe examine the effects of firms’ life cycle stages on voluntary disclosure and the cost of equity capital. We also examine the relationship between the interaction of life cycle stages and voluntary disclosures measures on cost of equity capital. Our sample consists of non-financial Brazilian public companies, covered by analysts between 2008 and 2014, collected from I/B/E/S and Comdinheiro databases. We find that voluntary disclosure level is higher for firms in maturity and growth stages. We also find that firms in introduction and decline life cycle stages show higher implied cost of capital, however declining firms that increase voluntary disclosure reduce their cost of capital. Moreover, mature firms significantly reduce such inherent risk by reporting social and environmental voluntary information. Our results are useful for investors, practitioners, and regulators to the understanding of the incentives of voluntary disclosure practices.
KEYWORDSVoluntary Disclosure, Cost of Equity Capital, Implied Cost of Capital, Life Cycle Stages, Emerging Market
17
602
1. INTRODUCTIONVoluntary disclosure is a firm’s communication channel to reducing information asymmetry
in addition to mandatory financial reporting. Empirical and analytical studies on voluntary disclosure show a negative relationship between voluntary disclosure and the cost of equity capital (Botosan, 1997; Dhaliwal, Li, Tsang, & Yang, 2011; Diamond & Verrecchia, 1991; Francis, Nanda, &Olsson, 2008). Botosan (1997) argues that great disclosure reduces the cost of capital, however she argues that it is still a controversial issue in both practical and academic areas.
The literature has documented that the risk assumed by capital suppliers is a function of different structures and strategies observed within the firm (Al-Hadi, Hasan, & Habib, 2016; Anthony & Ramesh, 1992; Hasan & Habib, 2017) and recent life cycle literature helps to explain the association between firms’ life cycles and the cost of capital. For instance, the cost of capital is higher for introduction and decline firms and lower for growth and mature firms (Hasan et al., 2015). In such case, life cycle stages capture the perceived risk of firms that is reflected in the estimated cost of capital.
We examine the economic function on the relationship between voluntary disclosure and cost of equity capital over firms’ life cycle stages in Brazilian public companies covered by analysts. We also examine three measures of voluntary disclosure to capture different properties of disclosure on cost of capital.
We hypothesize that on equilibrium the cost of capital is lower because investors are better informed and consequently, liquidity is higher and the cost to obtain private information is lower. Then, in this scenario, there is no need for additional information (voluntary disclosure). On the other hand, managers have incentives to withhold and/or delay the disclose of bad news (Kothari, Li, & Short, 2009; Skinner, 1994), by increasing information asymmetry in the market, consequently increasing the cost to obtain private information.
The information environment plays an important role on asset pricing and its quality shapes the cost and benefits of disclosure as well as market participants decisions (Beyer, Cohen, Lys, & Walther, 2010; Kothari & Verdi, 2016). We argue that life cycle stages change firms´ information environments since there are different incentives to disclose voluntary information and, at the same time, each life cycle stage affects cost of equity capital (Dickinson, 2011; Hasan, Hossain, Cheung, & Habib, 2015; Jovanovic, 1982; Jovanovic & MacDonald, 1994).
Our research design addresses firms’ life cycle stages as a factor that drives the relation between voluntary disclosure and the cost of equity capital for each firm differently. We posit that firms’ voluntary disclosure shifts the cost of capital over life cycle stages, comparing to mature firms, whose cash flow generation is expected to be more predictable and, consequently, there is a stable information environment with high level of scrutiny from investors and analysts (Kothari and Verdi, 2016).
We use three measures of voluntary disclosure to capture different properties of disclosure ((i) full disclosure that considers the (ii) economic and financial disclosure and (iii) social and environmental disclosure) following Botosan (1997), Dhaliwal et al. (2011), Eng and Mak (2003) Francis et al. (2008) and Almeida and Rodrigues (2016). The underlying idea to explore different properties of voluntary disclosure is related to life cycle stages incentives to disclose private information aiming to reduce cost of equity capital. For instance, firms in the mature stage have lower uncertainty about cash flow generation (Hamman & Steyn Bruwer, 2005; Singh & Faircloth, 2005). Then, market participants could be more interested in social and environmental issues than in economic and financial voluntary information. At the same time, introduction

17
603
or decline firms could address more effort to disclose economic and financial information than social and environmental as a way to reduce cost of equity capital.
We examine the Brazilian setting due to its relevance in the group of BRICS countries, strong government intervention, poor institutional environment, and low level of transparency (Almeida & Dalmácio, 2015; Beiruth, Fávero, Murcia, Almeida, & Brugni, 2017; Lopes & Alencar, 2010). Zhao & Xiao (2018) believe that this scenario of different agency problems presented in developing countries contributes even more to raising the financial constraint, but the way the information is shared shapes the relationship among market participants. Aerts, Cormier & Magnan (2007) and Chauhan & Kumar (2018) show that both market analysts and investors of emerging markets consider nonfinancial information on valuation functions.
We examine the Brazilian setting using only public companies with analysts coverage for two main reasons: firstly, to control the information environment and to make the analysis comparable between firms with high and low analysts coverage and, secondly, to estimate the implied cost of capital using analysts forecasts (Gebhardt, Lee, & Swaminathan, 2001; Hail & Leuz, 2006; Verdi, 2005).
This paper contributes to the literature by showing that introduction and decline firms have higher cost of capital, however, while the full voluntary disclosure index and economic and financial voluntary disclosure reduces the cost of capital of decline firms, mature firms reduce the cost of capital by increasing the voluntary disclosure of social and environmental actions. In other words, decline firms reduce information asymmetry by increasing voluntary disclosure about their fundamentals, and mature firms increase social and environmental voluntary disclosures in addition, since analysts are more capable to assess their fundamentals. We also expand on a previous study by Hasan et al. (2015) by adding the moderate effect of voluntary disclosure on the relationship between life cycle and cost of capital.
The remainder of this paper is organized as follows: Section 2 presents the hypotheses development; Section 3 discusses the research design; Section 4 presents our empirical results; and Section 5 concludes.
2. HYPOTHESES DEVELOPMENTThe literature documents that companies must have positive reasons to voluntarily disclose
their private information. Such disclosure practices must outweigh its costs (Gray, Radebaugh, & Roberts, 1990; Grossman & Hart, 1980; Skinner, 1994). Prior evidence support the underlying premise that voluntary disclosure reduces cost of equity capital and increases both liquidity and firm value in different perspectives (Balakrishnan, Billings, Kelly, & Ljungqvist, 2014; Botosan, 1997; Dhaliwal et al., 2011).
In emerging countries, some evidence support the idea that in a low-level disclosure environment, an increase in the disclosure level reduces the inherent risk (Lima, 2009; Lopes and Alencar, 2010). However, previous studies (Clarkson, Fang, Li, & Richardson, 2010; Jiang, Jiang, & Kim, 2017; Lee & Chou, 2017; Mendes-Da-Silva, Onusic, & Bergmann, 2014; Shattarat, K, Haddad, & Al-Hares, 2013) show that this relation between voluntary disclosure and cost of capital is still an open question to identify new factors to affect this linkage.
There is growing literature in accounting and finance analyzing the impact of the firm life cycle on firms’ fundamentals. Dickinson (2011) argues that the life of a firm is influenced by internal (as strategy choices and financial resources) and external environments (as macroeconomic factors) not only by firms’ age.

17
604
Moreover, Dickinson (2011) shows that firms fundamentals measured by earnings per share, return on assets, growth in sales, size, market-to-book and other ratios are different across life cycle stages. This could be associated with the analysts’ decisions to cover a firm (Beyer et al., 2010; Kothari & Verdi, 2016), conveying more scrutiny on corporate information environment.
Huang and Li (2014) based on proprietary cost literature, show that firms in growth industries tend to disclose more voluntary information (proxied by management earnings forecast) to the market. Al-Hadi, Hasan, and Habib (2016) find that, on average, firms in the growth stage, with separate risk committee, tend to present greater market risk disclosures, suggesting a path to reducing informational asymmetry by a specific voluntary disclosure.
Firms in the introduction and growth stages are characterized by the need of capital expenditure and then, these firms focus on sales growth (Dickinson, 2011; Jenkins & Kane, 2004). During the first stages of intensive growth, in the extent of the initial uncertainty are mitigated, the cost of equity capital decreases significantly, attracting new investors, among other resources, via voluntary disclosure (Armstrong, Core, Taylor, & Verrecchia, 2011; Hasan et al., 2015; Mueller, 1972).
Mature firms, in turn, generate positive cash flows from their sales and focus, instead, on profitability (Jenkins & Kane, 2004), with high levels of voluntary information (Al-Hadi, Hasan, & Habib, 2015) which leads to greater analyst coverage (Derrien & Kecskés, 2013; Eng & Mak, 2003) to pursuit lower cost of capital (Al-Hadi et al., 2015; Bowen, Chen, & Cheng, 2008) In such case, there is lower uncertainty on mature firms than firms in other stages (Chay & Suh, 2009).
Introduction and decline firms are similar on limited resources, which leads to lower level of voluntary disclosure compared to growth and mature firms. The expected pattern of business’ fundamentals over life cycle stages reflect the uncertainty captured by higher levels cost of capital in these stages (Dickinson, 2011; Hasan et al., 2015). Shake-out stage appears to be unclear about firms’ fundamentals (Dickinson, 2011). Then, we present our first hypothesis:
• H1: The voluntary disclosure (cost of capital) is expected to be higher (lower) in mature stage than in other stages, compared to shake-out.
To expand related literature, we analyze the relationship between voluntary disclosure and cost of capital taking into account an existing behavior pattern of voluntary disclosure across the firm´s life cycle stages. Thus, the interactions between life cycle stages and voluntary disclosure are expected to differently affect the cost of equity capital of firms.
For instance, firms in the early stage (introduction) or in declining stage have lower growth rates and these firms could fail in the market. Then, to differentiate themselves from other firms, they increase voluntary disclosure in an attempt to reduce the cost of capital, whilst mature and growth firms are not as much affected, once the generation of positive cash flow is expected to mitigate the market uncertainty. Then, firms in the introduction and declining stages could use voluntary disclosure as an instrument to surpass financial constraints (Hyytinen & Pajarinen, 2005), which is a the consequences of life cycle (Chay & Suh, 2009).
General uncertainties derived from the lack of general information might be mitigated via an increasing of voluntary general disclosure, such as information about the sales forecast, executive compensation, or the composition of the board of directors. On the other hand, there are uncertainties derived from the life cycle stage the firm is expected (or classified) to be in,

17
605
and these uncertainties are mitigated via an increasing of specific voluntary information, such as environmental policies, employee relations, training, and corporate social responsibility disclosure (Al-Hadi et al., 2016; El Ghoul, Guedhami, Kwok, & Mishra, 2011; Hasan et al., 2015; Jenkins & Kane, 2004; Villiers & van Staden, 2011; Zhao & Xiao, 2018).
However, since it is expected that mature firms disclose more voluntary information, then the uncertainty is reduced, and only firms in stages with high uncertainty disclose more voluntary information that could reduce cost of equity capital. Therefore, our second hypothesis is:
• H2: The higher the level of voluntary disclosure of firms in life cycle stages with high uncertainty, the lower the cost of equity capital.
3. RESEARCH DESIGN
3.1. Sample Selection and data
The sample of Brazilian public firms with analyst coverage is extracted from the population of public companies listed on the Brazilian Stock Exchange – [B]³, between 2008 and 2014. We use the Comdinheiro® database for financial data of Brazilian non-financial public companies that collects these information directly from Brazilian SEC and Bovespa systems and I/B/E/S database for analysts’ information. Table 1 shows the sample selection as follow:
Table 1 Sample Selection
STEPS OF DATA SELECTION Firm-year ObservationsCompanies with shares traded in Sao Paulo Stock Exchange (Bovespa) 2,751(-) Exclusion of observations without information from Cash Flow Statement (150)(-) Exclusion of observations of non-covered firms (2,004)Final sample for Disclosure analysis (First hypothesis) 597
(-) Observations excluded due to missing values for Implied Cost of Capital Model (61)Final sample for Cost of Capital analysis (First and Second hypotheses) 536
(=) Final sample merging disclosure measures and implied cost of capital samples 515
Our analysis begins since 2008 due to the mandatory disclosure of Cash Flow Statements for public companies required by IFRS (International Financial Reporting Standards) adoption in Brazil (Almeida & Rodrigues, 2016; Beiruth et al., 2017). This enables us to use the Cash Flows patterns (signals of operating, investing and financing cash flows) as a proxy for the life cycle stages, according to Dickinson (2011).
We developed two samples: one for voluntary disclosure, totaling 597 firm-year observation, and another one for the Implied Cost of Capital (ICC), totaling 536 firm-year observation, due to missing values of market information needed such as current stock price, payout ratio, book value of share and other information to implement the estimation of Gebhardt (2001)’s model of ICC. Our final sample after merge the two samples has 515 observations, among 10 industries, which is shown in Table 2.

17
606
Table 2 Industries across time
IndustryYear
2008 2009 2010 2011 2012 2013 2014 TotalIndustrial goods 12 13 13 13 13 13 9 86Cyclical consumer 18 19 20 20 20 19 11 127Non-cyclical consumer 10 10 10 10 10 10 5 65Finance¹ 3 3 2 2 2 2 1 15Basic materials 9 11 11 11 11 11 7 71Oil, gas and biofuel 1 1 1 1 1 1 0 6Health 3 3 3 3 3 3 2 20Information technology 2 2 2 2 2 2 2 14Telecommunication 2 2 2 3 3 3 1 16Utilities 14 14 13 14 14 14 12 95Total 74 78 77 79 79 78 50 515
¹ Firms that explore real estate activities
As additional analysis, we develop a matched sample to reduce possible bias in our results. For each life cycle stage, we consider firms with stock liquidity (ratio between firm average trade volume and firm market value at the year t) higher or equal to 0.001 and total assets between minimum and maximum values shown in descriptive statistics of the sample. Moreover, we also use alternatively Beta instead of CAPM as a substitute of ICC, because the firms comprised the matched sample are not covered by analysts. Preliminary results have evidenced a negative market-risk premium at the period of analysis, which is considered a specific characteristics of the Brazilian capital market. Between 2008 and 2014, Brazilian Central Bank kept the basic interest rates at a relative high level, which discourages the risk taking by investors. Then, we use only Beta (of CAPM) once we intend to capture the volatility and not the magnitude of it to test the results robustness.
3.2. life cycle Stage meaSure
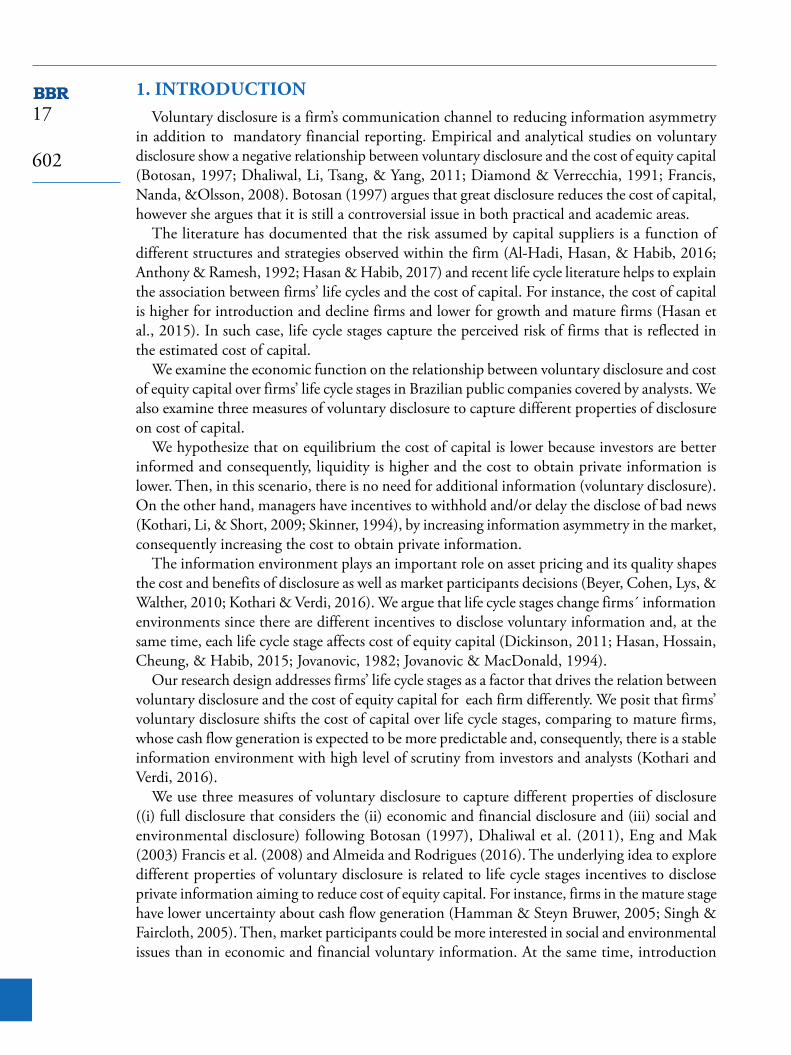
We use the approach developed by Dickinson (2011) to classify firms’ life cycle stages (Introduction, Growth, Maturity, Shake-Out and Decline) through Cash Flow patterns (combination of operating, investing and financing cash flow activities) (Chart 1).
Furthermore, previous studies show the advantages of cash flow patterns model (Dickinson, 2011; Hasan et al., 2015). We consider that this model better fits on small samples, avoiding sample reduction or to avoid portfolios with selection bias as well.
17
607
3.3. implied coSt of capital (icc)
We follow Gebhardt et al. (2001) to estimate the implied cost of capital, as an alternative approach to estimating the cost of equity capital. The understanding relies on an assignment of a discount rate assumption by the market, which denotes the need for a derivation of a firm valuation model using analysts’ forecasts (Hail & Leuz, 2006; Hou, van Dijk, & Zhang, 2012).
We use a three-stage approach to calculate the intrinsic value in a finite horizon of twelve years plus the terminal value (Gebhardt et al., 2001; Hail & Leuz, 2006; Verdi, 2005) as it follows: The first step is to use explicit earnings forecasts for the next three years; the second one derives earnings forecasts by linearly fading year t+3 return on equity (ROE) to the median market (industry) ROE by year t+3; The third calculates the intrinsic value of the firm by assuming the latest residual income as a perpetuity (terminal value). This leads to Equation 1:
(1)
Where Pt is the current stock price of the firm, four months after fiscal year-end t; ˆtx τ+ is the expected future accounting earnings for period (t+ τ τ-1, t+ τ), either explicitly forecasted, generated by a linear fading rate or assumed to be constant; re represents the estimate of the ex-ante cost of capital calculated as the internal rate of return to solve the equation; and expected future accounting book value of equity at date t+τ, where 1 ˆ ˆt t t tbv bv x dτ τ τ τ+ + + + += + − and ˆ
td τ+ corresponds to the expected future net dividends for period (t+τ-1, t+τ), derived from the dividend payout ratio k times the earnings forecast ˆtx τ+ .
We use the forecasted three years ahead (FY3) to avoid database reduction, different from Hail and Leuz (2006) who used forecasted earnings of two years ahead (FY1 and FY2) and the long term growth rate (LTG) to calculate the third year. “We considered the forecasts average EPS values (analysts’ consensus) one year before the announcement”.
This model presents limitations and the literature provides an alternative method (Hou et al., 2012). However, we anticipate that it does not fit in our sample data. Such an alternative would require a large data panel to firstly build a robust forecasting regression model to then estimate the earnings in explicit horizon.
3.4. Voluntary diScloSure index
Voluntary disclosure is measured by the amount of detail of voluntary information contained in the management report based on previous studies (Botosan, 1997; Eng & Mak, 2003; Gisbert & Navallas, 2013; Hail & Leuz, 2006) and adjusted to the Brazilian reality by Almeida and Rodrigues (2016), who has kindly provided to be updated. We use 38 attributes hand-collected
Chart 1 Combination of Cash Flows Signals
Cash Flows Intro Growth Mature Shake-out Decline
From Operating Activities - + + - + + - -
From Investing Activities - - - - + + + +
From Financing Activities + + - - + - + -
Source: Dickinson (2011).

17
608
information in an amount of 1,406 annual reports (both management’ report and footnotes) from 2008 to 2014.
The full voluntary disclosure index (Discl) consists of 38 binary information, divided into Economic and Financial Voluntary Disclosure (EFDiscl) – which is comprised of 25 items, and Social and Environmental Voluntary Disclosure (SEDiscl), comprised of the 13 remaining items. The calculation is based on the frequency scaled by the total of the corresponding group or the full index (Discl).
3.5. econometric procedureS
Before discussing regression issues for these variables, we find statistical differences (t-tests) across all life cycle stages for the voluntary disclosure indexes and also for the implied cost of capital (ICC). All tables are available upon request.
In order to assess the differences among disclosure indexes across life cycle stages, we run the following regression model, including some control variables:
(2)
Where is the full voluntary disclosure index for the three (j) measures of voluntary disclosure as mentioned previously; introi is the introduction stage; mati represents firms in maturity stage; and decli for those companies into the decline stage according to Dickinson (2011). All dummy variables have to be interpreted in relation to the shake-out stage. Implicitly, it is also expected that the other stages present lower levels of voluntary disclosure as compared to the mature stage.
We include in the model several control variables to reduce problems caused by omitted variables to isolate their effects of interest independent variable on dependent variables according to the literature: size, as measured by the natural logarithm of total assets in the year-end; mtb, which means the Market-to-Book ratio, indicating the growth opportunity measured by the firms’ market value divided by book value; lev is the firm’ leverage measured by short and long term debt divided by total assets; beta is the alternative proxy for ICC on robustness tests and it represents the inherent risk of the company, measured by the covariance between company and market 36 (and 60) months realized returns divided by the market return variance.
All dummy variables have to be interpreted in relation to the shake-out stage. We expect growth and maturity stage to have significant and positive (negative) coefficient of voluntary disclosure (implied cost of capital), in comparison with shake-out stage. Implicitly, we expected the other stages to present higher (lower) levels of voluntary disclosure (implied cost of capital).
Finally, to assess the main hypothesis of this study (H2), the implied cost of capital is regressed against the interaction between voluntary disclosure indexes and firms’ life cycle stages:
(3)
To the best of our knowledge there is no previous study explicitly guiding the impact of life cycle stages (LCSit) on the relation between voluntary disclosure level and cost of capital. The arguments presented here convey the idea that β6 and β10 are expected to be the most negative
17
609
and significant coefficient, which means that firms have more benefits by disclosing voluntary information when they are in stages with high level of uncertainty to mitigate.
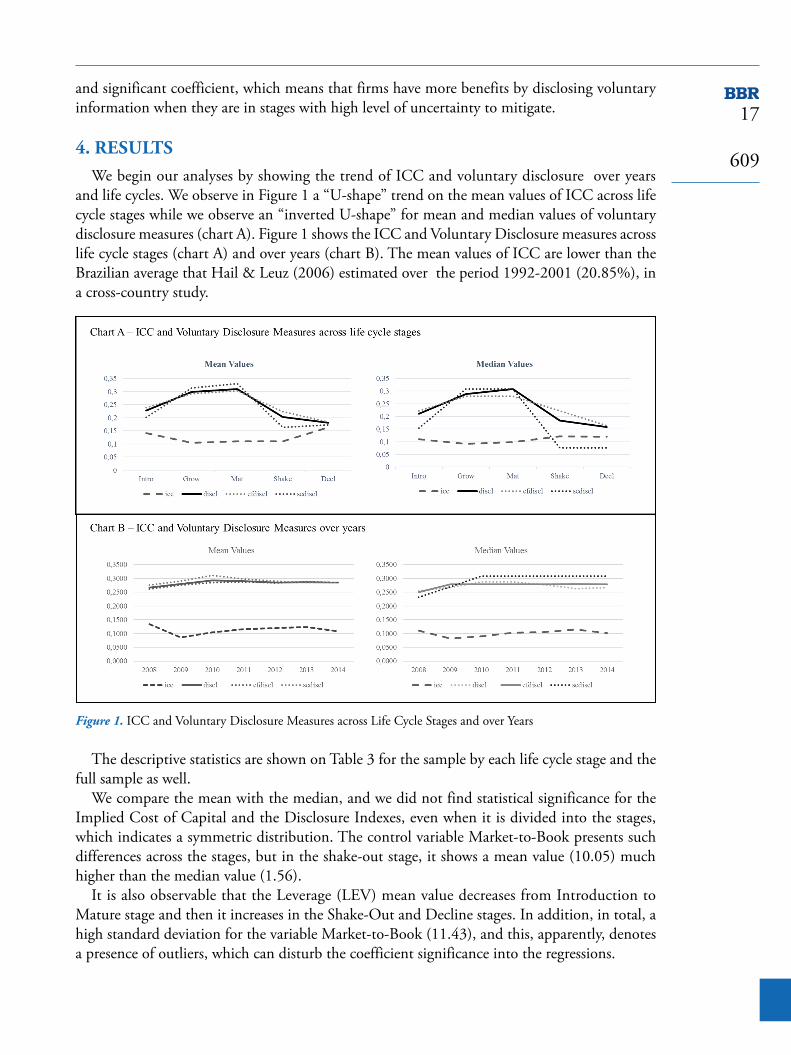
4. RESULTSWe begin our analyses by showing the trend of ICC and voluntary disclosure over years
and life cycles. We observe in Figure 1 a “U-shape” trend on the mean values of ICC across life cycle stages while we observe an “inverted U-shape” for mean and median values of voluntary disclosure measures (chart A). Figure 1 shows the ICC and Voluntary Disclosure measures across life cycle stages (chart A) and over years (chart B). The mean values of ICC are lower than the Brazilian average that Hail & Leuz (2006) estimated over the period 1992-2001 (20.85%), in a cross-country study.
Figure 1. ICC and Voluntary Disclosure Measures across Life Cycle Stages and over Years
The descriptive statistics are shown on Table 3 for the sample by each life cycle stage and the full sample as well.
We compare the mean with the median, and we did not find statistical significance for the Implied Cost of Capital and the Disclosure Indexes, even when it is divided into the stages, which indicates a symmetric distribution. The control variable Market-to-Book presents such differences across the stages, but in the shake-out stage, it shows a mean value (10.05) much higher than the median value (1.56).
It is also observable that the Leverage (LEV) mean value decreases from Introduction to Mature stage and then it increases in the Shake-Out and Decline stages. In addition, in total, a high standard deviation for the variable Market-to-Book (11.43), and this, apparently, denotes a presence of outliers, which can disturb the coefficient significance into the regressions.

17
610
Table 3 Descriptive statistics of variables by life cycle stages
Stage Stats ICC Discl Efdiscl Sediscl Size MTB Liquidity Lev Beta
Intro
ducti
onN. Obs 76 84 84 84 84 83 83 79 84Mean 0.141 0.204 0.210 0.182 15.064 1.702 0.673 0.349 0.543SD 0.140 0.097 0.075 0.193 1.211 1.392 1.356 0.144 0.666Min 0.028 0.041 0.056 0.000 11.560 0.000 0.000 0.059 0.000Q1 0.073 0.123 0.167 0.000 14.375 0.860 0.040 0.264 0.000Med 0.110 0.175 0.194 0.154 15.040 1.370 0.200 0.329 0.035Q3 0.157 0.288 0.250 0.308 15.850 2.030 0.830 0.427 1.110Max 1.079 0.432 0.389 0.692 19.430 8.400 8.400 0.734 1.940
Gro
wth
N. Obs 184 202 202 202 202 200 200 190 202Mean 0.104 0.285 0.272 0.314 15.702 2.655 0.917 0.369 0.655SD 0.063 0.124 0.102 0.218 1.563 3.039 1.819 0.147 0.523Min 0.017 0.103 0.111 0.000 12.260 0.000 0.000 0.051 0.000Q1 0.067 0.185 0.194 0.154 14.580 1.025 0.090 0.252 0.020Med 0.093 0.267 0.264 0.308 15.415 1.730 0.355 0.377 0.640Q3 0.132 0.370 0.333 0.462 16.710 2.870 0.755 0.476 1.090Max 0.581 0.617 0.583 0.769 20.440 21.180 15.170 0.737 2.060
Mat
urity
N. Obs 243 262 262 262 262 256 256 243 262Mean 0.109 0.298 0.280 0.341 15.348 3.943 1.110 0.293 0.589SD 0.077 0.119 0.093 0.221 1.548 7.016 3.310 0.151 0.677Min 0.009 0.082 0.111 0.000 7.170 0.000 0.000 0.000 -0.010Q1 0.056 0.206 0.194 0.154 14.170 1.145 0.115 0.185 0.090Med 0.099 0.308 0.278 0.385 15.245 1.880 0.430 0.269 0.495Q3 0.145 0.391 0.333 0.462 16.440 4.040 0.810 0.390 0.850Max 0.648 0.617 0.583 0.769 19.490 85.340 42.880 0.689 7.590
Stage Stats ICC Discl Efdiscl Sediscl Size MTB Liquidity Lev Beta
Shak
e-ou
t
N. Obs 21 31 31 31 31 30 30 28 31Mean 0.110 0.229 0.227 0.228 15.347 10.059 0.835 0.260 0.556SD 0.053 0.097 0.077 0.192 2.088 45.455 0.837 0.153 0.568Min 0.000 0.062 0.083 0.000 12.380 0.180 0.000 0.001 0.000Q1 0.063 0.144 0.194 0.077 13.950 1.060 0.090 0.126 0.000Med 0.122 0.206 0.222 0.154 14.520 1.565 0.605 0.309 0.410Q3 0.144 0.308 0.278 0.462 16.480 2.760 1.400 0.362 0.940Max 0.223 0.452 0.417 0.615 20.270 250.660 2.890 0.494 1.960
Dec
line
N. Obs 12 16 16 16 16 16 16 13 16Mean 0.164 0.204 0.210 0.183 15.551 1.446 1.068 0.332 0.978SD 0.116 0.085 0.058 0.212 0.908 0.905 0.917 0.087 0.872Min 0.036 0.103 0.139 0.000 12.690 0.300 0.240 0.204 0.000Q1 0.074 0.134 0.153 0.000 15.260 0.695 0.340 0.249 0.000Med 0.120 0.185 0.222 0.115 15.930 1.395 0.790 0.345 1.470Q3 0.236 0.278 0.250 0.385 16.050 1.965 1.445 0.402 1.690Max 0.375 0.349 0.333 0.692 16.550 3.530 3.530 0.483 2.230

17
611
The correlation matrix for the numeric variables used in the models (available upon request) show the three variables of disclosure to be highly correlated (Mingoti, 2005), as expected. However, for the pair EFDiscl and SEDiscl, the coefficient is 0.718. Also, the spearman correlations between ICC with DISCL, EFDiscl and SEDiscl and ICC and EFDiscl are 0.096, 0.124 and 0.051, respectively.
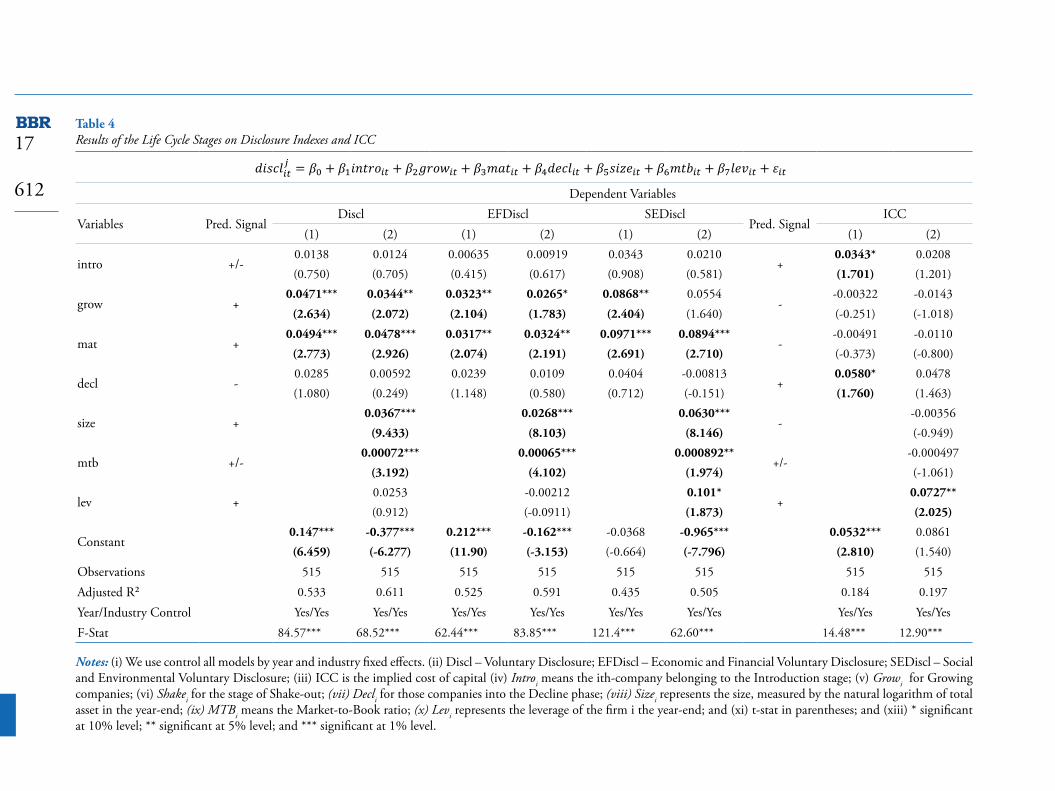
Table 4 shows the results of regressions for the impact of the life cycle stages on both the voluntary disclosure indexes and the implied cost of capital controlling by size, market-to-book, leverage, and year and industry dummy variables.
We used an unbalanced panel data, because of some missing values for both ICC and control variables, while we used a dummy variable to enable a comparison among the estimators coefficients and respective variances. Then, during the period of analysis (2008-2014), the sample consists of 74, 78, 77, 79, 79, 78 and 50 firms, respectively. Moreover, we presented models with and without control variables (1 and 2, respectively), to provide the evidence that the explanatory variables are not substituting the classical relation between the control variables and dependent one. On the voluntary disclosure indexes models, the coefficients of growth and mature stages are significantly positive, compared with shake-out stage, but in general the coefficients of mature stage are greater than growth stage, as expected. We verified such comparison by the F test for coefficients differences, finding a prob>F of 0.0901 for the Discl and 0.3512 for EFDiscl. Then, considering an alfa of 5%, the results suggest that mature firms present an average disclosure level significantly higher than growth firms.
However, both stages have no significant coefficients when they are related to ICC, in model (2). In such case, only introduction and decline stage show positive and significant coefficients on ICC (0.0343* and 0.0580*, respectively). In other words, when we observe the model without the control variables, the firms on introduction, and decline stages have a greater cost of equity capital, relative to firms in shake-out stage.
These results are aligned with the prediction of higher voluntary information level for firms with positive cash flow (Al-Hadi et al., 2016), characteristic of growing and mature firms. Moreover, results confirm the expectation of lower uncertainty on mature firms compared with firms in other stages (Chay & Suh, 2009).
Stage Stats ICC Discl Efdiscl Sediscl Size MTB Liquidity Lev Beta
Tota
l
N. Obs 536 595 595 595 595 585 585 553 595Mean 0.113 0.274 0.263 0.299 15.434 3.430 0.967 0.326 0.613SD 0.086 0.121 0.096 0.222 1.540 11.430 2.500 0.152 0.630Min 0.000 0.041 0.056 0.000 7.170 0.000 0.000 0.000 -0.010Q1 0.063 0.164 0.194 0.077 14.410 1.040 0.090 0.225 0.000Med 0.101 0.267 0.250 0.308 15.280 1.700 0.370 0.310 0.520Q3 0.141 0.370 0.333 0.462 16.400 2.930 0.830 0.425 1.010Max 1.079 0.617 0.583 0.769 20.440 250.660 42.880 0.737 7.590
Notes: (i) Sizei is measured by the natural logarithm of total assets in the year-end; (ii) MTBi is the Market-to-Book ratio; (iii) Liquidityi is the liquidity of the share i in the year-end; (iv) Levi is the leverage measured by total liabilities divided by total assets of the firm i in the year-end; and (v) Betai represents the inherent risk of the company.
Table 3 Cont.
17
612
Table 4 Results of the Life Cycle Stages on Disclosure Indexes and ICC
Dependent Variables
Variables Pred. SignalDiscl EFDiscl SEDiscl
Pred. SignalICC
(1) (2) (1) (2) (1) (2) (1) (2)
intro +/-0.0138 0.0124 0.00635 0.00919 0.0343 0.0210
+0.0343* 0.0208
(0.750) (0.705) (0.415) (0.617) (0.908) (0.581) (1.701) (1.201)
grow +0.0471*** 0.0344** 0.0323** 0.0265* 0.0868** 0.0554
--0.00322 -0.0143
(2.634) (2.072) (2.104) (1.783) (2.404) (1.640) (-0.251) (-1.018)
mat +0.0494*** 0.0478*** 0.0317** 0.0324** 0.0971*** 0.0894***
--0.00491 -0.0110
(2.773) (2.926) (2.074) (2.191) (2.691) (2.710) (-0.373) (-0.800)
decl -0.0285 0.00592 0.0239 0.0109 0.0404 -0.00813
+0.0580* 0.0478
(1.080) (0.249) (1.148) (0.580) (0.712) (-0.151) (1.760) (1.463)
size +0.0367*** 0.0268*** 0.0630***
--0.00356
(9.433) (8.103) (8.146) (-0.949)
mtb +/-0.00072*** 0.00065*** 0.000892**
+/--0.000497
(3.192) (4.102) (1.974) (-1.061)
lev +0.0253 -0.00212 0.101*
+0.0727**
(0.912) (-0.0911) (1.873) (2.025)
Constant0.147*** -0.377*** 0.212*** -0.162*** -0.0368 -0.965*** 0.0532*** 0.0861(6.459) (-6.277) (11.90) (-3.153) (-0.664) (-7.796) (2.810) (1.540)
Observations 515 515 515 515 515 515 515 515
Adjusted R² 0.533 0.611 0.525 0.591 0.435 0.505 0.184 0.197
Year/Industry Control Yes/Yes Yes/Yes Yes/Yes Yes/Yes Yes/Yes Yes/Yes Yes/Yes Yes/Yes
F-Stat 84.57*** 68.52*** 62.44*** 83.85*** 121.4*** 62.60*** 14.48*** 12.90***
Notes: (i) We use control all models by year and industry fixed effects. (ii) Discl – Voluntary Disclosure; EFDiscl – Economic and Financial Voluntary Disclosure; SEDiscl – Social and Environmental Voluntary Disclosure; (iii) ICC is the implied cost of capital (iv) Introi means the ith-company belonging to the Introduction stage; (v) Growi for Growing companies; (vi) Shakei for the stage of Shake-out; (vii) Decli for those companies into the Decline phase; (viii) Sizei represents the size, measured by the natural logarithm of total asset in the year-end; (ix) MTBi means the Market-to-Book ratio; (x) Levi represents the leverage of the firm i the year-end; and (xi) t-stat in parentheses; and (xiii) * significant at 10% level; ** significant at 5% level; and *** significant at 1% level.
17
613
Moreover, we ran the “Ramsay test” for specification errors in the models with voluntary disclosure indexes as dependent variables did not reject the null hypotheses of correct specification, at a 1% alfa (Prob > F 0.0954 and 0.2320, respectively to Discl and SEdiscl), which means there is no problem of omitted variables, except for EFDiscl (Prob > F 0.0011). Meanwhile, the rejection of null hypothesis for models of ICC enables the investigation to be done in subsequent models presented on this paper.
Our results expand prior studies and theoretical arguments (Mueller, 1972; Hasan et al., 2015) by showing that, even in a developing country, the higher uncertainty of firms in the introduction and decline stages face higher cost of capital possible due to the lack of significance of voluntary disclosure of introduction and decline firms.
Therefore, the results confirm the hypothesis H1, since the results show that firms in initial and final stages present lower (higher) levels of voluntary disclosure (implied cost of capital) than the others, compared to shake-out.
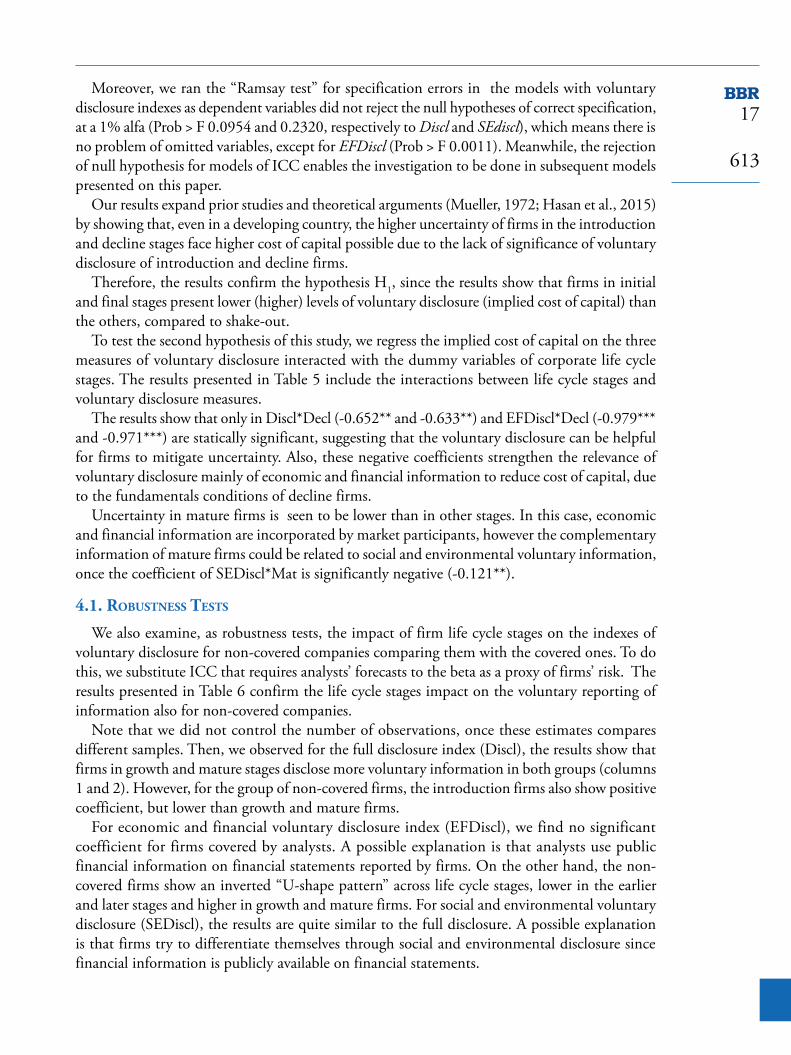
To test the second hypothesis of this study, we regress the implied cost of capital on the three measures of voluntary disclosure interacted with the dummy variables of corporate life cycle stages. The results presented in Table 5 include the interactions between life cycle stages and voluntary disclosure measures.
The results show that only in Discl*Decl (-0.652** and -0.633**) and EFDiscl*Decl (-0.979*** and -0.971***) are statically significant, suggesting that the voluntary disclosure can be helpful for firms to mitigate uncertainty. Also, these negative coefficients strengthen the relevance of voluntary disclosure mainly of economic and financial information to reduce cost of capital, due to the fundamentals conditions of decline firms.
Uncertainty in mature firms is seen to be lower than in other stages. In this case, economic and financial information are incorporated by market participants, however the complementary information of mature firms could be related to social and environmental voluntary information, once the coefficient of SEDiscl*Mat is significantly negative (-0.121**).
4.1. robuStneSS teStS
We also examine, as robustness tests, the impact of firm life cycle stages on the indexes of voluntary disclosure for non-covered companies comparing them with the covered ones. To do this, we substitute ICC that requires analysts’ forecasts to the beta as a proxy of firms’ risk. The results presented in Table 6 confirm the life cycle stages impact on the voluntary reporting of information also for non-covered companies.
Note that we did not control the number of observations, once these estimates compares different samples. Then, we observed for the full disclosure index (Discl), the results show that firms in growth and mature stages disclose more voluntary information in both groups (columns 1 and 2). However, for the group of non-covered firms, the introduction firms also show positive coefficient, but lower than growth and mature firms.
For economic and financial voluntary disclosure index (EFDiscl), we find no significant coefficient for firms covered by analysts. A possible explanation is that analysts use public financial information on financial statements reported by firms. On the other hand, the non-covered firms show an inverted “U-shape pattern” across life cycle stages, lower in the earlier and later stages and higher in growth and mature firms. For social and environmental voluntary disclosure (SEDiscl), the results are quite similar to the full disclosure. A possible explanation is that firms try to differentiate themselves through social and environmental disclosure since financial information is publicly available on financial statements.
17
614
Table 5 Results of ICC on voluntary disclosure indexes controlled by firm life cycle stages
Depend. Variable: ICC Voluntary Disclosure Measures
Variables Pred. Signal
Discl EFDiscl SEDiscl(1) (2) (1) (2) (1) (2)
intro+
0.0892 0.0736 0.116 0.106 0.0525* 0.0355(1.538) (1.366) (1.432) (1.378) (1.762) (1.347)
grow-
-0.0162 -0.0366 -0.0325 -0.0496 -0.000635 -0.0184(-0.602) (-1.303) (-1.007) (-1.511) (-0.0353) (-0.908)
mat-
0.0411 0.0292 0.0283 0.0205 0.0304 0.0196(1.328) (0.950) (0.764) (0.570) (1.499) (0.907)
decl+
0.189** 0.173** 0.267*** 0.253*** 0.0900* 0.0743(2.544) (2.344) (3.074) (2.942) (1.774) (1.463)
discl-
-0.0323 -0.0589 -0.0748 -0.0651 0.0220 -0.00440(-0.304) (-0.553) (-0.570) (-0.478) (0.403) (-0.0759)
discl*intro-
-0.266 -0.261 -0.388 -0.410 -0.0943 -0.0794(-1.236) (-1.203) (-1.214) (-1.265) (-1.154) (-0.958)
discl*grow-
0.0342 0.0675 0.103 0.122 -0.0264 -0.00105(0.320) (0.643) (0.772) (0.907) (-0.479) (-0.0178)
discl*mat-
-0.167 -0.141 -0.125 -0.120 -0.121** -0.0980(-1.431) (-1.248) (-0.849) (-0.823) (-2.046) (-1.571)
discl*decl-
-0.652** -0.633** -0.979*** -0.971*** -0.186 -0.170(-2.340) (-2.311) (-2.787) (-2.801) (-1.102) (-1.017)
size-
-0.000372 -0.00234 -0.000279(-0.0846) (-0.526) (-0.0688)
mtb+/-
-0.000432 -0.000452 -0.000442(-0.908) (-0.936) (-0.934)
lev+
0.0819** 0.0803** 0.0800**
(2.180) (2.143) (2.175)
Constant 0.0614** 0.0546 0.0746** 0.0915 0.0452** 0.0326(2.112) (0.816) (2.207) (1.402) (2.025) (0.513)
Observations 515 515 515 515 515 515Adjusted R² 0.215 0.230 0.221 0.236 0.199 0.213Year/Industry Control Yes/Yes Yes/Yes Yes/Yes Yes/Yes Yes/Yes Yes/Yes
F-Stat 13.17*** 10.68*** 14.99*** 12.21*** 13.84*** 11.12***
Notes: (i) We control all models by year and industry fixed effects. (ii) ICC is the implied cost of capital; (iii) Voluntary disclosure is divided into full (discl), economic and financial (efdiscl) and social and environmental (sediscl) indexes; (iv) Discl_Introi means the index of voluntary disclosure for ith-company belonging to the Introduction stage; (v) Discl_Growi is the same for Growing companies; (vi) Discl_Shakei for the stage of Shake-out; (vii) Discl_Decli for those companies into the Decline phase; (viii) Sizei represents the size, measured by the natural logarithm of total asset in the year-end; (ix) MTBi means the Market-to-Book ratio; and (x) Levi represents the leverage of the firm i the year-end; and (xi) * significant at 10% level; ** significant at 5% level; and *** significant at 1% level.

17
615
Table 6 Results of Voluntary Disclosure on life cycle stages for matched sample
Variablesdiscl efdiscl sediscl beta
(1) (2) (1) (2) (1) (2) (1) (2)Intro 0.0110 0.0503** 0.00388 0.0468* 0.0304 0.0552* -0.0592 -0.149*
(0.644) (2.072) (0.267) (1.865) (0.845) (1.678) (-0.503) (-1.696)
Grow 0.0297* 0.0777*** 0.0195 0.0685*** 0.0574* 0.0936*** -0.0104 -0.107(1.857) (3.616) (1.352) (3.168) (1.702) (3.384) (-0.0971) (-1.562)
Mat 0.0372** 0.0923*** 0.0231 0.0820*** 0.0753** 0.110*** 0.0110 -0.0423(2.336) (4.407) (1.599) (3.944) (2.264) (4.061) (0.107) (-0.666)
Decl 0.00119 -0.0379 0.00318 -0.0526** -0.00431 -0.0117 0.288 -0.0498(0.0490) (-1.437) (0.163) (-1.966) (-0.0786) (-0.321) (1.098) (-0.543)
Size 0.0346*** 0.0346*** 0.0249*** 0.0308*** 0.0604*** 0.0420*** 0.133*** 0.0448***
(8.840) (6.331) (7.391) (5.929) (7.726) (5.689) (4.911) (2.838)
MTB 0.00501*** 0.000989 0.00310*** 0.000981 0.0102*** 0.00105 -0.00159 0.00950(5.105) (0.335) (3.378) (0.363) (5.291) (0.259) (-0.238) (1.096)
Beta 0.0138* 0.00102 0.0110* -0.00252 0.0210 0.00822(1.764) (0.0765) (1.862) (-0.200) (1.273) (0.434)
Constant -0.358*** -0.206** -0.148*** -0.0266 -0.930*** -0.547*** -1.475*** -0.946***
(-6.119) (-2.054) (-2.931) (-0.279) (-7.685) (-4.177) (-3.483) (-3.677)
Observations 515 566 515 566 515 566 515 566Adjusted R² 0.623 0.337 0.597 0.221 0.520 0.428 0.327 0.113Year/Industry Control Yes/Yes Yes/Yes Yes/Yes Yes/Yes Yes/Yes Yes/Yes Yes/Yes Yes/Yes
F stat 53.43*** 16.87*** 62.66*** 14.07*** 49.30*** 27.22*** 17.77*** 10.30***
Notes: (i) Column (1) represents the covered sample and (2) non-covered companies. (ii) Discl is the full index of voluntary disclosure; EFDiscl is the index of economic and financial voluntary disclosure; SEDiscl is the social and environmental voluntary disclosure index;(iii) Beta is used in substitution for the CAPM as proxy for Cost of Capital. t-stats are presented in parentheses; (iv) Introi is the Introduction stage; (v) Growi for Growth companies; (vi) Shakei for the stage of Shake-out; (vii) Decli for those companies into the Decline stage; and (vii) * significant at 10% level; ** significant at 5% level; and *** significant at 1% level.
17
616
We also used quantile regressions in unreported tables to check if our results are affected by outliers and the results are weaker for the full disclosure, but similar to the other measures of voluntary disclosure. Yet, we estimated the models with a single dummy for mature firms, interacted with the disclosure indexes. Again, the model for the full index did not show a statistical significance for such variable. However, we observed for both EFDiscl (-.13048**) and SEDiscl (-0.1115*) that mature firms benefit significantly by the reduction in ICC when they disclose more specific voluntary information. Results are available on request.
The results in Table 6 show no statistical significance for life cycle stages on Beta. We used Beta instead of ICC to allow the comparison between non-covered and covered firms by analysts. However, the results are weak, because only introduction firms in the non-covered sample show negative significant coefficient (at 10%). For the treatment group (covered companies - column 1), there are no differences across the life cycle stages. These results are contrary to the expectation of lower risk (proxied by beta) for mature companies.
5. CONCLUSIONWe examined the effects of firms’ life cycle stages on voluntary disclosure and the cost of equity
capital and also on the relationship between them. We showed that Brazilian public companies in the growth and mature stages are more transparent through voluntary disclosure practices. However, only firms in decline stage are benefitted by the reduction of the cost of capital when they improve the disclosure of voluntary information. The findings expand evidence of previous studies (Ali Boujelbene & Affes, 2013; Botosan, 1997; Dhaliwal et al., 2011; Petrova et al., 2012; Villiers & van Staden, 2010).
This paper showed that the level of the three voluntary disclosure indexes are different among the life cycle stages. As expected (Al-Hadi et al., 2016; Chay & Suh, 2009), the voluntary disclosure (implied cost of capital) level is greater (lower) in growth and mature stages, compared with the firms in shake-out stage. Although, since firms in the decline stage show relatively higher uncertainty (information asymmetry) in their fundamentals, they should reduce them by increasing voluntary disclosure. Then, the results confirmed the findings of Hyytinen & Pajarinen (2005), which argue that firms in introduction and decline stages could improve the transparency to surpass financial constraints.
Additionally, we provided evidence that mature firms reduce the uncertainty by disclosing social and environmental voluntary information. This evidence enhance the findings of Villiers & van Staden (2011), which show that despite North American firms more exposed to environmental crises and low environmental reputation tend to disclose more specific voluntary disclosure, they find no evidence of different levels of environmental disclosure under different conditions.
According to Villiers & van Staden (2010), shareholders from Australia, US and UK demands for such information to account for environmental impacts. However, our results stand for the use of such mechanism to rescue the confidence, in terms of cost of capital, at the Brazilian capital market.
Aligned with the theoretical expectation (Al-Hadi et al., 2016; El Ghoul, Guedhami, Kwok, & Mishra, 2011; Hasan et al., 2015; Jenkins & Kane, 2004; Villiers & van Staden, 2011; Zhao & Xiao, 2018), our findings enhance the notion that in imperfect market conditions, the information plays a significant role of separating the assessment of risk (Armstrong et al., 2011). This shows that firm life cycle stage is a relevant conditioning variable when examining the relationship between voluntary disclosure and implied cost of capital.
17
617
Growing and mature firms have better prospects, then market analysts are more safe about the financial drivers. Then, the managers provide more social and environmental information, while the firms in other stages need to emphasis the financial indicators to enhance the transparency of their future prospectus.
We applied several robustness checks to improve our results partially converged to the main sample, except for cost of equity capital because the matched sample has only firms non-covered by analysts, which is a limitation of this study as well.
REFERENCES Aerts, W., Cormier, D., & Magnan, M. (2007). The Association Between Web-Based Corporate
Performance Disclosure and Financial Analyst Behaviour Under Different Governance Regimes. Corporate Governance: An International Review, 15(6), 1301–1329. https://doi.org/10.1111/j.1467-8683.2007.00648.x
Al-Hadi, A., Hasan, M. M., & Habib, A. (2016). Risk Committee, Firm Life Cycle, and Market Risk Disclosures. Corporate Governance: An International Review. https://doi.org/10.1111/corg.12115
Al-Hadi, A., Hasan, M. M., & Habib, A. (2015). Risk Committee, Firm Life Cycle, and Market Risk Disclosures. Corporate Governance: An International Review, 24(2), 145–170. https://doi.org/10.1111/corg.12115
Al-Hadi, A., Taylor, G., & Hossain, M. (2015). Disaggregation, auditor conservatism and implied cost of equity capital: An international evidence from the GCC. Journal of Multinational Financial Management, 29, 66–98. https://doi.org/10.1016/j.mulfin.2014.11.005
Ali Boujelbene, M., & Affes, H. (2013). El impacto de la divulgación de capital intelectual sobre el coste del capital social: El caso de las empresas francesas. Journal of Economics, Finance and Administrative Science, 18(34), 45–53.
Almeida, J. E. F. de, & Dalmácio, F. Z. (2015). The Effects of Corporate Governance and Product Market Competition on Analysts’ Forecasts: Evidence from the Brazilian Capital Market. The International Journal of Accounting. https://doi.org/10.1016/j.intacc.2015.07.007
Almeida, J. E. F., & Rodrigues, H. S. (2016). Effects of ifrs, analysts and adr on voluntary disclosure of brazilian public companies. Journal of International Accounting Research. https://doi.org/10.2308/jiar-51649
Anthony, J. H., & Ramesh, K. (1992). Association between accounting performance measures and stock prices: A test of the life cycle hypothesis. Journal of Accounting and Economics, 15(2–3), 203–227.
Armstrong, C. S., Core, J. E., Taylor, D. J., & Verrecchia, R. E. (2011). When Does Information Asymmetry Affect the Cost of Capital? Journal of Accounting Research, 49(1), 1–40. https://doi.org/10.1111/j.1475-679X.2010.00391.x
Balakrishnan, K., Billings, M. B., Kelly, B., & Ljungqvist, A. (2014). Shaping Liquidity: On the Causal Effects of Voluntary Disclosure. The Journal of Finance, 69(5), 2237–2278. https://doi.org/10.1111/jofi.12180
Beiruth, A. X., Fávero, L. P. L., Dal Ri Murcia, F., de Almeida, J. E. F., & Brugni, T. (2017). Structural changes in covenants through the adoption of IFRS in Brazil. Accounting Forum, 41(3), 147–160. https://doi.org/10.1016/j.accfor.2017.06.004

17
618
Beyer, A., Cohen, D. A., Lys, T. Z., & Walther, B. R. (2010). The financial reporting environment: Review of the recent literature. Journal of Accounting and Economics, 50(2–3), 296–343. https://doi.org/10.1016/j.jacceco.2010.10.003
Botosan, C. A. (1997). Disclosure level and the cost of equity capital. The Accounting Review, 72(N. 3), 323–349.
Bowen, R. M., Chen, X., & Cheng, Q. (2008). Analyst Coverage and the Cost of Raising Equity Capital: Evidence from Underpricing of Seasoned Equity Offerings*. Contemporary Accounting Research, 25(3), 657–700. https://doi.org/10.1506/car.25.3.1
Chauhan, Y., & Kumar, S. B. (2018). Do investors value the nonfinancial disclosure in emerging markets? Emerging Markets Review. https://doi.org/10.1016/j.ememar.2018.05.001
Chay, J. B., & Suh, J. (2009). Payout policy and cash-flow uncertainty. Journal of Financial Economics, 93(1), 88–107. https://doi.org/10.1016/j.jfineco.2008.12.001
Clarkson, P., Fang, X., Li, Y., & Richardson, G. D. (2010). The Relevance of Environmental Disclosures for Investors and Other Stakeholder Groups: Are Such Disclosures Incrementally Informative? (SSRN Scholarly Paper ID 1687475). Social Science Research Network. http://papers.ssrn.com/abstract=1687475
Derrien, F., & Kecskés, A. (2013). The Real Effects of Financial Shocks: Evidence from Exogenous Changes in Analyst Coverage. The Journal of Finance, 68(4), 1407–1440. https://doi.org/10.1111/jofi.12042
Dhaliwal, D. S., Li, O. Z., Tsang, A., & Yang, Y. G. (2011). Voluntary Nonfinancial Disclosure and the Cost of Equity Capital: The Initiation of Corporate Social Responsibility Reporting. The Accounting Review, 86(1), 59–100. https://doi.org/10.2308/accr.00000005
Diamond, D. W., & Verrecchia, R. E. (1991). Disclosure, Liquidity, and the Cost of Capital. The Journal of Finance, 46(4), 1325–1359. https://doi.org/10.2307/2328861
Dickinson, V. (2011). Cash Flow Patterns as a Proxy for Firm Life Cycle. The Accounting Review, 86(6), 1969–1994. https://doi.org/10.2308/accr-10130
El Ghoul, S., Guedhami, O., Kwok, C. C. Y., & Mishra, D. R. (2011). Does corporate social responsibility affect the cost of capital? Journal of Banking & Finance, 35(9), 2388–2406.
Eng, L. L., & Mak, Y. T. (2003). Corporate governance and voluntary disclosure. Journal of Accounting and Public Policy, 22(4), 325–345.
Francis, J., Nanda, D., & Olsson, P. (2008). Voluntary Disclosure, Earnings Quality, and Cost of Capital. Journal of Accounting Research, 46(1), 53–99. https://doi.org/10.1111/j.1475-679X.2008.00267.x
Gebhardt, W. R., Lee, C. M. C., & Swaminathan, B. (2001). Toward an Implied Cost of Capital. Journal of Accounting Research, 39(1), 135–176. https://doi.org/10.1111/1475-679X.00007
Gisbert, A., & Navallas, B. (2013). The association between voluntary disclosure and corporate governance in the presence of severe agency conflicts. Advances in Accounting, 29(2), 286–298. https://doi.org/10.1016/j.adiac.2013.07.001
Gray, S. J., Radebaugh, L. H., & Roberts, C. B. (1990). International Perceptions of Cost Constraints on Voluntary Information Disclosures: A Comparative Study of U.K. and U.S. Multinationals. Journal of International Business Studies, 21(4), 597–622. https://doi.org/10.1057/palgrave.jibs.8490343
Grossman, S. J., & Hart, O. D. (1980). Disclosure Laws and Takeover Bids. The Journal of Finance, 35(2), 323–334. https://doi.org/10.2307/2327390

17
619
Hail, L., & Leuz, C. (2006). International Differences in the Cost of Equity Capital: Do Legal Institutions and Securities Regulation Matter? Journal of Accounting Research, 44(3), 485–531. https://doi.org/10.1111/j.1475-679X.2006.00209.x
Hamman, W. d., & Steyn Bruwer, B. w. (2005). Cash flow patterns in listed South African industrial companies. Meditari Accountancy Research, 13(1), 1–17. https://doi.org/10.1108/10222529200500001
Hasan, M. M., & Habib, A. (2017). Firm life cycle and idiosyncratic volatility. International Review of Financial Analysis, 50, 164–175. https://doi.org/10.1016/j.irfa.2017.01.003
Hasan, M. M., Hossain, M., Cheung, A. (2015). Corporate life cycle and cost of equity capital. Journal of Contemporary Accounting & Economics, 11(1), 46–60. https://doi.org/10.1016/j.jcae.2014.12.002
Ho, P., & Taylor, G. (2013). Corporate governance and different types of voluntary disclosure: Evidence from Malaysian listed firms. Pacific Accounting Review, 25(1), 4–29. https://doi.org/10.1108/01140581311318940
Hou, K., van Dijk, M. A., & Zhang, Y. (2012). The implied cost of capital: A new approach. Journal of Accounting and Economics, 53(3), 504–526. https://doi.org/10.1016/j.jacceco.2011.12.001
Huang, Y., & Li, N. (2014). Market Competition and Voluntary Disclosure: Evidence from Industry Research Reports (SSRN Scholarly Paper ID 2411864). Social Science Research Network. http://papers.ssrn.com/abstract=2411864
Hyytinen, A., & Pajarinen, M. (2005). External Finance, Firm Growth and the Benefits of Information Disclosure: Evidence from Finland. European Journal of Law and Economics, 19(1), 69–93. https://doi.org/10.1007/s10657-005-5276-3
Jenkins, D. S., & Kane, G. D. (2004). The Impact of the Corporate Life‐Cycle on the Value‐Relevance of Disaggregated Earnings Components. Review of Accounting and Finance, 3(4), 5–20. https://doi.org/10.1108/eb043411
Jiang, F., Jiang, Z., & Kim, K. A. (2017). Capital markets, financial institutions, and corporate finance in China. Journal of Corporate Finance, 63: 101309. https://doi.org/10.1016/j.jcorpfin.2017.12.001
Jovanovic, B. (1982). Selection and the Evolution of Industry. Econometrica: Journal of the Econometric Society, 649–670.
Jovanovic, B., & MacDonald, G. M. (1994). The Life Cycle of a Competitive Industry. Journal of Political Economy, 102(2), 322–347.
Kothari, S. P., Li, X., & Short, J. E. (2009). The Effect of Disclosures by Management, Analysts, and Business Press on Cost of Capital, Return Volatility, and Analyst Forecasts: A Study Using Content Analysis. The Accounting Review, 84(5), 1639–1670. https://doi.org/10.2308/accr.2009.84.5.1639
Kothari, S. P., & Verdi, R. S. (2016). Analysts’ Forecasts and Asset Pricing: A Survey. Annual Review of Financial Economics, 8(1), 197–219. https://doi.org/10.1146/annurev-financial-121415-032930
Lee, C.-H., & Chou, P.-I. (2017). Financial openness and market liquidity in emerging markets. Finance Research Letters. https://doi.org/10.1016/j.frl.2017.10.024
Lima, G. A. S. F. de. (2009). Disclosure level × cost of debt of Brazilian companies. Revista Contabilidade & Finanças, 20(49), 95–108. https://doi.org/10.1590/S1519-70772009000100007
Lopes, A. B., & de Alencar, R. C. (2010). Disclosure and cost of equity capital in emerging markets: The Brazilian case. The International Journal of Accounting, 45(4), 443–464. https://doi.org/10.1016/j.intacc.2010.09.003

17
620
Mendes-Da-Silva, W., Onusic, L. M., & Bergmann, D. R. (2014). The Influence of E-disclosure on the Ex-Ante Cost of Capital of Listed Companies in Brazil. Journal of Emerging Market Finance, 13(3), 335–365. https://doi.org/10.1177/0972652714550928
Mingoti, S. A. (2005). Análise de dados através de métodos de estatística multivariada uma abordagem aplicada. Editora UFMG.
Mueller, D. C. (1972). A Life Cycle Theory of the Firm. The Journal of Industrial Economics, 20(3), 199–219. https://doi.org/10.2307/2098055
Petrova, E., Georgakopoulos, G., Sotiropoulos, I., & Vasileiou, K. Z. (2012). Relationship between Cost of Equity Capital and Voluntary Corporate Disclosures. International Journal of Economics and Finance, 4(3). https://doi.org/10.5539/ijef.v4n3p83
Shattarat, A. K W., Haddad, A. E., & Al-Hares, O. M. (2013). The Extent of Voluntary Disclosure in an Emerging Capital Market: The Case of Jordan (SSRN Scholarly Paper ID 1841683). Social Science Research Network. http://papers.ssrn.com/abstract=1841683
Singh, M., & Faircloth, S. (2005). The impact of corporate debt on long term investment and firm performance. Applied Economics, 37(8), 875–883. https://doi.org/10.1080/00036840500076762
Skinner, D. J. (1994). Why Firms Voluntarily Disclose Bad News. Journal of Accounting Research, 32(1), 38–60. JSTOR. https://doi.org/10.2307/2491386
Verdi, R. S. (2005). Information Environment and the Cost of Equity Capital (SSRN Scholarly Paper ID 757966). Social Science Research Network. http://papers.ssrn.com/abstract=757966
Villiers, C. de, & van Staden, C. J. (2010). Shareholders’ requirements for corporate environmental disclosures: A cross country comparison. The British Accounting Review, 42(4), 227–240. https://doi.org/10.1016/j.bar.2010.08.002
Villiers, C. de, & van Staden, C. J. (2011). Where firms choose to disclose voluntary environmental information. Journal of Accounting and Public Policy, 30(6), 504–525. https://doi.org/10.1016/j.jaccpubpol.2011.03.005
Zhao, T., & Xiao, X. (2018). The impact of corporate social responsibility on financial constraints: Does the life cycle stage of a firm matter? International Review of Economics & Finance. https://doi.org/10.1016/j.iref.2018.08.010


![Voluntary Disclosure by Levered Firms · The rst models of voluntary disclosure in accounting (e.g., Dye [1985], Jung and Kwon [1988], Verrecchia [1983]) studied disclosures by what](https://static.fdocuments.us/doc/165x107/5e53d5601e173275a04bd3a5/voluntary-disclosure-by-levered-firms-the-rst-models-of-voluntary-disclosure-in.jpg)