The role of fgfr3 mutation in tumour initiation, progression and invasion of urothelial cell...
280
Glasgow Theses Service http://theses.gla.ac.uk/ [email protected] Foth, Mona (2014) The role of FGFR3 mutation in tumour initiation, progression and invasion of urothelial cell carcinoma in mice. PhD thesis. http://theses.gla.ac.uk/5642/ Copyright and moral rights for this thesis are retained by the author A copy can be downloaded for personal non-commercial research or study, without prior permission or charge This thesis cannot be reproduced or quoted extensively from without first obtaining permission in writing from the Author The content must not be changed in any way or sold commercially in any format or medium without the formal permission of the Author When referring to this work, full bibliographic details including the author, title, awarding institution and date of the thesis must be given
Transcript of The role of fgfr3 mutation in tumour initiation, progression and invasion of urothelial cell...

Glasgow Theses Service http://theses.gla.ac.uk/
Foth, Mona (2014) The role of FGFR3 mutation in tumour initiation, progression and invasion of urothelial cell carcinoma in mice. PhD thesis. http://theses.gla.ac.uk/5642/ Copyright and moral rights for this thesis are retained by the author A copy can be downloaded for personal non-commercial research or study, without prior permission or charge This thesis cannot be reproduced or quoted extensively from without first obtaining permission in writing from the Author The content must not be changed in any way or sold commercially in any format or medium without the formal permission of the Author When referring to this work, full bibliographic details including the author, title, awarding institution and date of the thesis must be given

The role of FGFR3 mutation in tumour initiation,
progression and invasion of urothelial cell
carcinoma in mice
Mona Foth
Submitted in fulfilment of the requirements for the Degree of PhD
Beatson Institute for Cancer Research
University of Glasgow
College of Medical, Veterinary and Life Sciences (MVLS)
2014

Abstract 1
Abstract
Bladder cancer is the 5th most common and the 9th most lethal cancer in the
UK. Based on histopathological and genomic analysis, a model of two
independent pathogenesis pathways has been suggested, resulting in either non-
invasive superficial or invasive urothelial tumours with potential to metastasise.
Prominently, the fibroblast growth factor receptor 3 (FGFR3) is found mutated in
up to 84% of non-invasive superficial tumours. Alterations in FGFR3 such as
mutation or wild type receptor overexpression are also found in 54% of muscle-
invasive tumours. FGFR3 is a tyrosine kinase receptor for fibroblast growth
factors (FGFs), which stimulates both the RAS/MAPK and the PI3K/AKT pathways
and regulates a range of cellular processes such as cell growth and division
during development. In this study we examined the role of FGFR3 in bladder
cancer by using mice as a model organism.
Firstly, we addressed whether combination of Fgfr3 and Pten mutation, UroIICre
Fgfr3+/K644E Ptenflox/flox, is able to drive non-invasive superficial bladder cancer.
We observed that the thickness of the double mutant urothelium was
significantly increased compared to singly mutated Fgfr3 or Pten, UroIICre
Fgfr3+/K644E and UroIICre Ptenflox/flox. Moreover, several cellular abnormalities
were detected that were accompanied by differential expression of layer-
specific markers, which strongly suggested that they were caused cooperatively
by Fgfr3 mutation and Pten deletion. The results supported the hypothesis that
FGFR3 activation can play a causative role in urothelial pathogenesis of non-
invasive superficial bladder cancer together with upregulated PI3K-AKT
signalling.
Secondly, we aimed to identify mutations that cooperate with Fgfr3 and with
other common bladder cancer mutations such as Pten and Ras, in promoting
urothelial tumourigenesis by Sleeping Beauty (SB) insertional mutagenesis in
mice. The SB system may constitute an inefficient tool in the bladder to induce
urothelial tumourigenesis, since it failed to produce bladder tumours in Fgfr3 as
well as in Hras mutant mice. In mice with Pten deletion, one tumour was
generated and general hypertrophy with cellular abnormalities was observed in
all samples. No direct association between Fgfr3 and Pten mutations was found;
Abstract 2
however, SB mutagenesis supported that Fgfr3 and Pten cooperation may merge
at the signalling downstream.
Thirdly, we examined the role of the most common mutation in FGFR3, S249C, in
the urothelium and in tumour progression and invasion by subjecting Fgfr3
mutant mice to a bladder-specific carcinogen, N-butyl-N-(hydroxybutyl)-
nitrosamine (OH-BBN). We showed that FGFR3 S249C mutation by itself does not
lead to urothelial abnormalities. However, in OH-BBN-induced tumours the
presence of S249C increased the number of animals that formed bladder tumours
by 4.4-fold. Our results present for the first time an effect of FGFR3 S249C
mutation in invasive bladder cancer.
Lastly, we sought to establish methods to generate and assess invasive bladder
tumours using in vivo and in vitro techniques. First we examined the
effectiveness of a Cre-expressing adenovirus (AdenoCre) to generate mouse
models of bladder cancer with different combinations of genetic mutations. p53
deletion or mutation together with Pten loss led to formation of aggressive
bladder tumours; however the origin of these tumours was likely to be the
bladder muscle. Hras activation in combination with Pten deletion did not
produce tumours or any cellular abnormalities by 8 months. AdenoCre-mediated
tumour induction was successful in the presence of β-catenin and Hras mutation.
However, an issue of AdenoCre transduction was the frequent observation of
tumours in various other tissues such as the pelvic soft tissue, liver, pancreas
and lung. Using an optimised AdenoCre procedure, the technique would allow
lineage tracing of cancer stem cells in a developing bladder tumour and
potentially during metastatic spread. Secondly, we tested imaging techniques in
the living animals and validated ultrasound as a functional method to detect
bladder wall thickening, as well as to monitor tumour growth in vivo. Thirdly,
with the aim to assess cell transformation, migration and response to drug
treatment, we tested essential ex vivo techniques and assays such as 3D sphere
culture, organotypic slice culture as well as a Collagen-I invasion assay. The 3D
tumour sphere culture was successful with murine Wnt-activated tumours as well
as with invasive human cell lines. The organotypic slice culture was assessed as a
system to test the effect of therapeutic drugs on the tumour cells; however, an
issue of tissue disintegration has yet to be overcome. The Collagen-I assay

Abstract 3
successfully recapitulated invasion of a human bladder cancer cell line;
however, the system needs to be adapted to murine bladder tumours.
Taken together, this study presents for the first time evidence that support the
functional role of FGFR3 signalling in the early stages of non-invasive urothelial
carcinoma as well as in tumour progression of established neoplasms in mice.
Given the wide availability of inhibitors specific to FGF signalling, our FGFR3
mouse models in conjunction with optimised ex vivo assays and imaging systems
may open the avenue for FGFR3-targeted translation in urothelial disease.

Table of Contents 4
Table of Contents
Abstract ...................................................................................... 1
Table of Contents .......................................................................... 4
List of Tables ................................................................................ 9
List of Figures .............................................................................. 10
Acknowledgements ........................................................................ 13
Author’s declaration ...................................................................... 15
Abbreviations .............................................................................. 16
Chapter 1 (Introduction)……………………………………………………………………………………….19
1.1 The Bladder ...................................................................... 20
1.1.1 The Urothelium ............................................................. 22
1.1.2 Urothelial lineage and stem cells ........................................ 24
1.2 Bladder cancer ................................................................... 26
1.2.1 Epidemiology ................................................................ 26
1.2.2 Causes ........................................................................ 26
1.2.3 Types of bladder cancer ................................................... 27
1.2.4 Symptoms .................................................................... 27
1.2.5 Diagnosis ..................................................................... 28
1.2.6 Treatment ................................................................... 28
1.2.7 Prognosis ..................................................................... 29
1.2.8 Pathology of urothelial cell carcinoma .................................. 29
1.2.9 Genetics behind bladder cancer .......................................... 34
1.2.10 Model of two independent pathways of bladder cancer progression 40
1.3 Fibroblast Growth Factor Receptors (FGFRs) ................................ 42
1.3.1 Downstream signalling ..................................................... 44
1.3.2 Negative regulation of FGFRs ............................................. 46
1.3.3 FGFRs in cancer ............................................................. 46
1.3.4 Fibroblast growth factor receptor 3 (FGFR3) ........................... 48
1.3.5 FGFR as a target of therapy ............................................... 52
1.4 Modelling bladder cancer in vivo and in vitro ............................... 55
1.4.1 Cell culture .................................................................. 55
1.4.2 Orthotopic models .......................................................... 57
1.4.3 Carcinogen-induced models ............................................... 58
1.4.4 Genetically engineered models ........................................... 60
1.5 Aims of the study ................................................................ 69

Table of Contents 5
Chapter 2 (Materials and Method…………………………………………………………………………71 2.1 Mice ................................................................................ 72
2.1.1 Mouse lines and genotyping alleles ...................................... 72
2.1.2 Genetic background of mice .............................................. 73
2.2 Sleeping Beauty mutagenesis .................................................. 74
2.2.1 T2/Onc3 excision PCR assay .............................................. 74
2.2.2 Splinkerette PCR and Sequencing ........................................ 75
2.3 Generation of Tg(UroII-hFGFR3IIIbS249C) .................................... 75
2.4 OH-BBN treatment............................................................... 78
2.5 Virus injections .................................................................. 79
2.5.1 Virus preparation ........................................................... 79
2.5.2 Anaesthesia .................................................................. 79
2.5.3 Surgical procedure ......................................................... 80
2.6 Live imaging ...................................................................... 81
2.6.1 Fluorescent imaging ........................................................ 81
2.6.2 Ultrasound scanning ........................................................ 81
2.7 Tissue harvest and fixation..................................................... 81
2.8 Histology .......................................................................... 82
2.9 Immunohistochemistry .......................................................... 82
2.9.1 Chromogenic signals ........................................................ 85
2.9.2 Fluorescent signals ......................................................... 85
2.9.3 Scanning of slides ........................................................... 86
2.10 Microscopy ..................................................................... 86
2.11 Measurements of urothelial thickness ..................................... 86
2.12 Measurements of urothelial cell size ....................................... 86
2.13 Human tissue microarray (TMA) ............................................. 87
2.14 Statistics ........................................................................ 87
2.15 Cell and tissue culture ....................................................... 88
2.15.1 Preparation of cell stocks ............................................... 88
2.15.2 Cell counting .............................................................. 88
2.15.3 Culture of human cell line EJ138 ...................................... 88
2.15.4 Primary cell culture from mouse bladder ............................ 88
2.15.5 Matrigel culture and colony formation assay ........................ 89
2.15.6 Collagen-I invasion assay ................................................ 90
2.15.7 Organotypic slice culture ............................................... 90
2.15.8 Tamoxifen induction of organotypic slice culture ................... 91
2.15.9 R3Mab treatment of organotypic slice culture....................... 91
Table of Contents 6
Chapter 3 (Results)………………………………………………………………………………………..…….94 3.1 Introduction ...................................................................... 95
3.2 Establishment of the UroIICre Fgfr3+/K644E Ptenflox/flox mouse model ..... 97
3.2.1 Generation of the cohorts ................................................. 97
3.2.2 FGFR3 and PTEN protein expression ..................................... 98
3.2.3 Recombination under the UroIICre promoter .......................... 100
3.3 Increased thickness of the UroIICre Fgfr3+/K644E Ptenflox/flox urothelium 101
3.4 Abnormal morphology of UroIICre Fgfr3+/K644E Ptenflox/flox urothelium .. 104
3.5 Differential expression of layer-specific markers .......................... 105
3.6 Increase in the size of intermediate cells in UroIICre Fgfr3+/K644E Ptenflox/flox urothelium ................................................................. 107
3.7 Increased proliferation in UroIICre Fgfr3+/K644E Ptenflox/flox urothelium . 109
3.8 Increased apoptosis in the UroIICre Fgfr3+/K644E urothelium.............. 111
3.9 Changes in MAPK/AKT signalling and cell cycle regulation ............... 113
3.10 Analysis of pathway association between FGFR3 and AKT signalling by tissue microarray (TMA) .............................................................. 115
3.11 Discussion ..................................................................... 118
3.11.1 The UroIICre Fgfr3+/K644E Ptenflox/flox model .......................... 118
3.11.2 UroIICre recombination ................................................ 118
3.11.3 Urothelial thickening ................................................... 119
3.11.4 Abnormal urothelial differentiation .................................. 120
3.11.5 Cell size and cell number .............................................. 121
3.11.6 Changes in downstream signalling .................................... 121
3.11.7 Limitations of the model ............................................... 122
3.11.8 Future plans .............................................................. 123
3.11.9 Conclusion ................................................................ 123
Chapter 4 (Results)……………………………………………………………………………………….…….124 4.1 Introduction ..................................................................... 125
4.2 Sleeping Beauty mutagenesis in the urothelium of UroIICre Fgfr3+/K644E
128
4.3 Sleeping Beauty mutagenesis in the urothelium of UroIICre Ptenflox/flox131
4.4 Sleeping Beauty mutagenesis in the urothelium of UroIICre Hras+/G12V . 138
4.5 Discussion ........................................................................ 140
4.5.1 SB in UroIICre Fgfr3+/K644E ................................................ 140
4.5.2 SB in UroIICre Ptenflox/flox ................................................. 140
4.5.3 Identification of cooperating mutations in SB-induced UroIICre Ptenfllox/flox tumours ................................................................. 141
4.5.4 SB in UroIICre Hras+/G12V .................................................. 142
4.5.5 SB as an insertional mutagenesis tool in the bladder ................ 142
Table of Contents 7
4.5.6 Future work ................................................................ 143
4.5.7 Conclusion .................................................................. 144
Chapter 5 (Results)………………………………………………………………………………………..……145 5.1 Introduction ..................................................................... 146
5.2 Generation of the Tg(UroII-hFGFR3IIIbS249C) mouse ...................... 150
5.3 Mouse cohorts that were subjected to OH-BBN ............................ 154
5.4 FGFR3 S249C mutation increases sensitivity to tumourigenesis after long-term OH-BBN exposure ................................................................ 155
5.5 Fgfr3 K644E mutation increases sensitivity to tumourigenesis after long-term OH-BBN exposure ................................................................ 160
5.6 FGFR3 S249C mutation promotes pre-neoplastic changes in a time course of OH-BBN exposure ................................................................... 166
5.7 Analysis of DNA damage in Wild type and FGFR3 mutants ............... 169
5.8 Discussion ........................................................................ 172
5.8.1 Tg(UroII-hFGFR3IIIbS249C) line .......................................... 172
5.8.2 FGFR3 mutation increases sensitivity to tumourigenesis after OH-BBN exposure .............................................................................. 173
5.8.3 DNA damage response upon OH-BBN .................................... 175
5.8.4 OH-BBN as a tool to induce invasive bladder cancer in mice ....... 176
5.8.5 Future work ................................................................ 177
5.8.6 Conclusion .................................................................. 178
Chapter 6 (Results)………………………………………………………………………………………..……179 6.1 Introduction ..................................................................... 180
6.1.1 AdenoCre ................................................................... 180
6.1.2 In vivo imaging ............................................................. 182
6.1.3 In vitro models ............................................................. 183
6.2 Establishment of techniques to generate and detect invasive bladder cancer in mice ......................................................................... 185
6.2.1 Generation of mouse cohorts to test AdenoCre recombination efficiency ............................................................................. 185
6.2.2 Assessment of recombination ............................................ 186
6.2.3 Monitoring tumour formation and progression in vivo ............... 190
6.3 Highly aggressive tumours in AdenoCre p53 Pten bladders ............... 192
6.3.1 Tumours in AdenoCre p53flox/flox Ptenflox/flox bladders ................. 192
6.3.2 Tumours in AdenoCre p53R172H/R172H Ptenflox/flox bladders ............. 198
6.4 Exophytic tumours in AdenoCre β-cateninexon3/exon3 HrasG12V/G12V bladders 203
6.5 Hypertrophy in AdenoCre Hras+/G12V Ptenflox/flox bladders ................. 208

Table of Contents 8
6.6 AdenoCre off-target effects: soft tissue tumours and other non-urothelial tumours ..................................................................... 211
6.7 The use of LentiCre as an alternative to AdenoCre ....................... 214
6.8 Establishment of techniques to assess growth and invasion in vitro .... 215
6.8.1 Development of an organotypic collagen-I invasion assay ........... 215
6.8.2 Development of an ex vivo assay to test the effects of therapeutic drugs 217
6.9 Discussion ........................................................................ 229
6.9.1 Recombination ............................................................. 229
6.9.2 In vivo imaging ............................................................. 231
6.9.3 AdenoCre ................................................................... 232
6.9.4 In vitro models ............................................................. 236
6.9.5 Future work ................................................................ 237
6.9.6 Conclusion .................................................................. 238
Chapter 7 (Discussion)………………………………………………………………………………………..239 7.1 Summary of the findings ....................................................... 240
7.2 Contribution of FGFR3 to tumour initiation, progression and invasion . 241
7.3 Tumour progression across pathogenesis pathways ....................... 243
7.4 Cooperating mutations......................................................... 244
7.5 Current models of bladder cancer ........................................... 245
7.6 FGFR3 as a biomarker in bladder cancer .................................... 246
7.7 FGFR3-targeted therapy ....................................................... 248
7.8 Future direction ................................................................ 249
7.9 Significance ...................................................................... 250
References ................................................................................. 252
Appendices ................................................................................ 278
Appendix 1 – Publications ............................................................. 278

List of Tables 9
List of Tables
Table 1-1: WHO classification of urinary tumours in 1973 and 2004 ............... 32
Table 1-2: Common genetic alterations in urothelial tumours ..................... 39
Table 1-3: Human bladder cancer cell lines ........................................... 56
Table 2-1: Mouse lines and genotyping alleles ........................................ 73
Table 2-2: T2/Onc3 excision PCR primers ............................................. 74
Table 2-3: T2/Onc3 excision PCR conditions .......................................... 75
Table 2-4: Tg(UroII-hFGFR3IIIbS249C) PCR primers................................... 77
Table 2-5: FGFR3 S249C PCR conditions ............................................... 78
Table 2-6: Cre viruses..................................................................... 79
Table 2-7: Processing methods for histological staining ............................. 82
Table 2-8: Primary antibodies ........................................................... 84
Table 2-9: Biotinylated secondary antibodies ......................................... 85
Table 2-10: Fluorescent secondary antibodies ........................................ 85
Table 2-11: Media components .......................................................... 92
Table 2-12: Growth factors .............................................................. 93
Table 3-1: Summary of mouse cohorts with Fgfr3 and Pten mutation ............ 97
Table 4-1: Sleeping Beauty mouse cohorts with Fgfr3 mutation .................. 128
Table 4-2: Sleeping Beauty mouse cohorts with Pten mutation ................... 131
Table 4-3: Common insertional sites in UroIICre Ptenflox/flox SB+ .................. 137
Table 4-4: Sleeping Beauty mouse cohorts with Hras mutation ................... 138
Table 5-1: Summary of mouse cohorts for FGFR3-S249C transgene analysis .... 151
Table 5-2: OH-BBN-treated mouse cohorts ........................................... 154
Table 5-3: Histological changes of OH-BBN-treated mouse cohorts (“10+10 weeks”) .................................................................................... 159
Table 5-4: Histological changes of OH-BBN-treated mouse cohorts (“20 weeks”) .............................................................................................. 161
Table 6-1: Summary of mice injected for recombination analysis ................ 185
Table 6-2: Summary of p53 and Pten deleted mice injected with AdenoCre ... 192
Table 6-3: Summary of p53 and Pten deleted mice injected with AdenoCre ... 198
Table 6-4: Summary of β-catenin and Hras mutant mice injected with AdenoCre .............................................................................................. 204
Table 6-5: Summary of Hras and Pten mutant mice injected with AdenoCre ... 208
Table 6-6: Summary of non-urothelial tumours upon AdenoCre injection ....... 211
Table 6-7: Summary of in vivo imaging techniques tested in the study .......... 231
Table 6-8: Summary of in vitro techniques tested in the study ................... 236
List of Figures 10
List of Figures
Figure 1-1: Anatomy of the normal bladder ........................................... 21
Figure 1-2: Normal mouse urothelium .................................................. 23
Figure 1-3: Staging of bladder cancer .................................................. 31
Figure 1-4: Current model of bladder cancer progression in two independent pathways .................................................................................... 41
Figure 1-5: Fibroblast Growth Factor Receptor (FGFR) .............................. 43
Figure 1-6: Fibroblast growth factor receptor signalling ............................ 45
Figure 1-7: Mutations in Fibroblast growth factor receptor 3 (FGFR3) ............ 50
Figure 2-1: Tg(UroII-hFGFR3IIIbS249C) vector map ................................... 76
Figure 2-2: Virus injection into mouse bladder ....................................... 80
Figure 3-1: FGFR3 and PTEN expression in the UroIICre Fgfr3+/K644E Ptenflox/flox
urothelium .................................................................................. 99
Figure 3-2: Recombination in the urothelium under UroIICre ..................... 100
Figure 3-3: Increased thickness of the UroIICre Fgfr3+/K644E Ptenflox/flox urothelium by H&E ..................................................................................... 101
Figure 3-4: Quantification of thickness in UroIICre Fgfr3+/K644E Ptenflox/flox urothelium ................................................................................. 102
Figure 3-5: Thickening of the urothelium in UroIICre Fgfr3K644E/K644E and UroIICre Fgfr3K644E/K644E Ptenflox/flox ................................................................ 103
Figure 3-6: Abnormal morphology of the UroIICre Fgfr3+/K644E Ptenflox/flox
urothelium ................................................................................. 104
Figure 3-7: Abnormal cellular identity in the UroIICre Fgfr3+/K644E Ptenflox/flox
urothelium ................................................................................. 106
Figure 3-8: Differential effects of Fgfr3 and Pten mutations in regulation of cell size in the urothelium ................................................................... 108
Figure 3-9: Differential effects of Fgfr3 and Pten mutations in regulation of proliferation in the urothelium ......................................................... 110
Figure 3-10: Increased apoptosis in the UroIICre Fgfr3+/K644E Ptenflox/flox
urothelium ................................................................................. 112
Figure 3-11: Deregulation of downstream signalling and cell cycle arrest in the UroIICre Fgfr3+/K644E Ptenflox/flox urothelium ........................................... 114
Figure 3-12: Tissue microarray analysis of FGFR3 and p-mTOR expression levels in T1 urothelial tumours .................................................................... 115
Figure 3-13: Tissue microarray analysis of FGFR3 and p-mTOR expression levels according to tumour grade .............................................................. 117
Figure 4-1: T2/Onc3 excision PCR ..................................................... 129
Figure 4-2: Sleeping Beauty insertional mutagenesis in the presence of Fgfr3 mutation ................................................................................... 130
Figure 4-3: Sleeping Beauty insertional mutagenesis in the presence of Pten mutation ................................................................................... 132
Figure 4-4: FGFR3 expression in UroIICre Ptenfllox/flox SB+ urothelium ............ 133
Figure 4-5: Sleeping Beauty insertional mutagenesis in the presence of Fgfr3 and Pten mutation ............................................................................. 135
Figure 4-6: Upregulation of pAKT in the Ptenflox/flox SB+ tumour ................... 136
Figure 4-7: Sleeping Beauty insertional mutagenesis in the presence of Hras mutation and/or in combination with Fgfr3 mutation .............................. 139
Figure 5-1: Establishment of the Tg(UroII-hFGFR3IIIbS249C) model .............. 150
Figure 5-2: Urothelial appearance of Wild type, Fgfr3-K644E, FGFR3-S249C and FGFR3-S249C Pten at 12 months ....................................................... 153
Figure 5-3: OH-BBN treated urothelia after 10+10 weeks .......................... 156
List of Figures 11
Figure 5-4: Abnormal features in FGFR3-S249C at high magnification upon OH-BBN treatment ............................................................................ 157
Figure 5-5: Frequency of histological features and tumour formation in OH-BBN-treated cohorts after 10+10 weeks .................................................... 159
Figure 5-6: Frequency of histological features and tumour formation in OH-BBN-treated cohorts with Fgfr3 K644E mutation after 20 weeks continuously ....... 161
Figure 5-7: Abnormal protein expression in Fgfr3-K644E at high magnification after 20 weeks continuous OH-BBN treatment ....................................... 163
Figure 5-8: The effects of Fgfr3 K644E mutation in tumour progression upon OH-BBN treatment ............................................................................ 165
Figure 5-9: Histological changes of Wild type and FGFR3-S249C bladders after two and six weeks of OH-BBN exposure ............................................... 166
Figure 5-10: Histological changes of Wild type, FGFR3-S249C and UroIICre Ptenflox/flox bladders after 10+2 weeks of OH-BBN exposure ....................... 167
Figure 5-11: Frequency of histological features and tumour formation after 10+2 weeks ....................................................................................... 168
Figure 5-12: Double-strand breaks upon OH-BBN treatment ....................... 171
Figure 6-1: Cre recombination upon adenoviral transduction visualised by IVIS Spectrum................................................................................... 187
Figure 6-2: Cre recombination at cellular level upon high-dose AdenoCre transduction ............................................................................... 189
Figure 6-3: Monitoring of tumour progression using Vevo 770 Visualsonics ultrasound ................................................................................. 191
Figure 6-4: Ultrasound of AdenoCre p53flox/flox Ptenflox/flox bladders at 3.5 months post injection ............................................................................. 193
Figure 6-5: Histology of AdenoCre p53flox/flox Ptenflox/flox bladders at 3.5 months post injection ............................................................................. 194
Figure 6-6: Immunohistochemistry of AdenoCre-induced p53flox/flox Ptenflox/flox
bladders at 3.5 months post injection ................................................ 196
Figure 6-7: Smooth muscle actin staining on AdenoCre-induced p53flox/flox
Ptenflox/flox bladders at 3.5 months post injection ................................... 197
Figure 6-8: Histology of AdenoCre-induced p53R172H/R172H Ptenflox/flox bladders at 1.7 months post injection ............................................................... 200
Figure 6-9: Histology of an AdenoCre-induced p53R172H/R172H Ptenflox/flox lung at 1.7 months post injection .................................................................... 201
Figure 6-10: Histology of an AdenoCre-induced p53R172H/R172H Ptenflox/flox liver at 1.7 months post injection ............................................................... 202
Figure 6-11: AdenoCre β-cateninexon3/exon3 HrasG12V/G12V bladders at 2 months (A-B) and 3.5 months (C-D) post injection ................................................... 205
Figure 6-12: AdenoCre β-cateninexon3/exon3 HrasG12V/G12V tumours in liver and pancreas ................................................................................... 206
Figure 6-13: Ultrasound of AdenoCre β-cateninexon3/exon3 HrasG12V/G12V bladders at 8 months post injection .................................................................... 207
Figure 6-14: Ultrasound of AdenoCre Hras+/G12V Ptenflox/flox bladders at 6.5 months post injection ............................................................................. 209
Figure 6-15: Histology of AdenoCre Ptenflox/flox and Hras+/G12V Ptenflox/flox bladders at 8 months post injection .............................................................. 210
Figure 6-16: Pelvic tumour formation at 2.8 -3.5 post AdenoCre injection ..... 212
Figure 6-17: Histology of pelvic tumours at 2.8 -3.5 post AdenoCre injection .. 213
Figure 6-18: EJ138 human cell line migrating into organotypic collagen-I matrix .............................................................................................. 216
Figure 6-19: Matrigel culture of wild type urothelium, non-invasive tumour, and invasive tumour ........................................................................... 218

List of Figures 12
Figure 6-20: Effect of EGF on UroIICre β-cateninexon3/exon3 HrasG12V/G12V tumour sphere culture ............................................................................ 219
Figure 6-21: Effect of different growth factors on UroIICre Hras+/G12V sphere culture ..................................................................................... 221
Figure 6-22: Sphere culture of OH-BBN-treated Wild type and Tg(UroII-hFGFR3IIIbS249C) after 3 and 14 days ................................................. 223
Figure 6-23: Organotypic slice culture of fluorescent reporter bladders ........ 226
Figure 6-24: Organotypic slice culture of Wild type and Tg(UroII-hFGFR3IIIbS249C) tumours treated with FGFR3 inhibitor (R3Mab) ................ 228

Acknowledgements 13
Acknowledgements
I would like to thank my supervisors Dr Tomoko Iwata and Prof Owen Samson, as
well as my advisor Prof Hing Leung for collectively making this project possible,
and for great supervision and helpful input; especially, Dr Tomoko Iwata and
Prof Owen Samson for supporting me during grant applications, oversea
collaborations, conference travel, scientific writing and publishing, and for
giving career advice.
I’m indebted to Colin Nixon and the Histology Service at the Beatson Institute for
Cancer Research for their significant contribution to my experiments, as well as
to all the involved staff at the Beatson Animal Unit for indispensable practical
support, especially Derek Miller for the surgical training in orthotopic virus
injections.
Many thanks also to my colleagues from the Beatson Institute and Glasgow
University for fruitful discussions and experimental support, especially the
members of groups R18, R8 and P1. I would also like to thank Imran Ahmad, who
significantly contributed to the UroIICre Fgfr3+/K644E Ptenflox/flox project, Max
Nobis for experimental support with the organotypic Collagen-I invasion assay,
Saadia Karim for sharing her expertise in in vivo imaging, Despoina Natsiou for
her contribution to immunofluorescent staining experiments and Louise King for
her contribution to the urothelial cell measurements.
Furthermore, I would like to thank our collaborators for helpful discussions and
expertise: Prof Cathy Mendelsohn and Dr Ekaterina Batourina from Columbia
University in New York, USA, for the warm welcome in their lab and for sharing
their expertise on organotypic slice culture; Dr David Adams and Dr Louise van
der Weiden from the Sanger Institute in Cambridge, UK, for contributing to the
Sleeping Beauty project with sequencing and insertional sites analysis; Dr
Theodorus van der Kwast at the Princess Margaret Cancer Centre, Toronto,
Canada, and Dr Bas van Rhijn at the National Cancer Institute, Amsterdam,
Netherlands, for their contribution to TMA analysis; Prof Margaret Knowles and
Dr Darren Tomlinson at the Leeds Institute of Molecular Medicine, Leeds, UK, for
their contribution to the generation of the Tg(UroII-hFGFR3IIIbS249C) mouse line;
Dr Paul Timpson at the Garvan Institute, Sydney, Australia, for sharing his
Acknowledgements 14
expertise on the Collagen-I invasion assay; Dr Sioban Fraser from the Southern
General Hospital, Glasgow, UK, for pathological analysis of the UroIICre
Fgfr3+/K644E Ptenflox/flox model and the carcinogen-induced tumour models.
I gratefully acknowledge the funding sources that made my PhD work possible.
My PhD studies were funded by the Beatson Institute for Cancer Research (BICR)
as part of Cancer Research UK (CRUK), the University of Glasgow (GU), and the
Medical Research council (MRC). I would also like to thank the Medical Research
council (MRC) for a Centenary Award in 2012 of £22,188, which enabled me to
carry out adenovirus-mediated in vivo gene transfer and organotypic invasion
assays.
Finally, I would like to thank my family and friends for great support and
encouragement from abroad throughout the three (and a bit) years of my PhD.
Many thanks to friends and colleagues in Glasgow for giving some necessary
distraction during the course of research, and who have become very close
friends of mine.
Mona Foth
April 2014

Author’s declaration 15
Author’s declaration
I declare that, except where explicit reference is made to the contribution of
others, that this dissertation is the result of my own work and has not been
submitted for any other degree at the University of Glasgow or any other
institution.
Mona Foth
April 2014
Abbreviations 16
Abbreviations
AdCre AdenoCre
APC Adenomatous Polyposis Coli
B-cat β-Catenin
BSA Bovine serum albumin
cDNA Complementary DNA
CGH Comparative genomic hybridisation
CIS Carcinoma in situ
CK Cytokeratin
CMV Cytomegalovirus
CRUK Cancer Research UK
CT Computerised tomography
DNA Desoxyribonucleic acid
E11 Embryonic day 11
eGFP Enhanced green fluorescent protein
EGF Epidermal growth factor
EGFR Epidermal growth factor receptor
ERK Extracellular signal regulated kinase
ES cells Embryonic stem cells
FACS Fluorescence-activated cell sorting
FANFT N-(4,5-nitro-2-furyl-2-thiazolyl)-formamide
FGF Fibroblast growth factor
FGFR3 Fibroblast growth factor receptor 3
GAB1 GRB2-associated-binding protein 1
GRB2 Growth factor receptor-bound protein 2
GCE GFP-Cre-ERT2
gDNA Genomic DNA
GDNF Glial cell line-derived neurotrophic factor

Abbreviations 17
GFP Green fluorescent protein
GSTM1 glutathione S-transferase mu 1
H&E Hematoxylin and eosin
HGF Hepatocyte growth factor
HLA Human leukocyte antigen
HRAS Harvey rat sarcoma viral oncogene homolog
IHC Immunohistochemistry
ISUP International Society of Urologic Pathology
ITR Inverted terminal repeat
IVIS In vivo imaging system
JAK Janus protein tyrosine kinase
KGF Keratinocyte growth factor
LiCl Lithium chloride
LOH Loss of heterozygosity
LSL Lox stop lox
MAPK Mitogen-activated protein kinase
MDM2 Mouse double minute 2
MMTV Mouse mammary tumour virus
MNU N-methyl-N-nitrosurea
mRNA Messenger RNA
mTOR Mammalian target of rapamycin
NAT2 N-acetyltransferase
Neo Neomycin resistance gene
OH-BBN N-butyl-N-(4-hydroxybutyl) nitrosamine
PAH Polycyclic aromatic hydrocarbon
PCR Polymerase chain reaction
PFU Plaque-forming unit
PIP3 Phosphatidylinositol (3,4,5)-triphosphate

Abbreviations 18
PI3K Phosphatidylinositol 3-kinase
PIK3CA Phosphatidylinositol-4,5-bisphosphate 3-kinase, catalytic subunit
alpha
PTEN Phosphatase and tensin homolog
PUNLMP Papillary urothelial neoplasms of low-malignant potential
RA Retinoic acid
RB Retinoblastoma protein
RFP Red fluorescent protein
RNA Ribonucleic acid
RTK Receptor tyrosine kinase
SB Sleeping Beauty
SHH Sonic hedgehog
SMA Smooth muscle actin
SOS Son of sevenless
STAT3 Signal transducer and activator of transcription 3
SV40 Simian virus 40
Tg Transgene, transgenic
TGF Transforming growth factor, Tumour growth factor
TK Tyrosine kinase
TMA Tissue microarray
TNM Tumour-Node-Metastasis
TURBT Trans-urethral resection of bladder tumours
UroIICre Uroplakin II Cre
WHO World Health Organisation
WNT1 Wingless-int1
X-gal 5-Bromo-4-chloro-3-indolyl-β-D-galactopyranoside
YFP Yellow fluorescent protein
Z/EG lac Z/enhanced green fluorescent protein
ZEB1 Zinc finger E-box-binding homeobox 1

Introduction – Bladder Cancer (Chapter 1) 19
Chapter 1
Introduction
Introduction – Bladder Cancer (Chapter 1) 20
1.1 The Bladder
In order to study bladder cancer initiation, progression and invasion, it is
essential to understand the normal function of the healthy bladder as part of the
urinary system, as well as the composition and function of the urothelium, the
tissue from which urothelial cell carcinoma emerges.
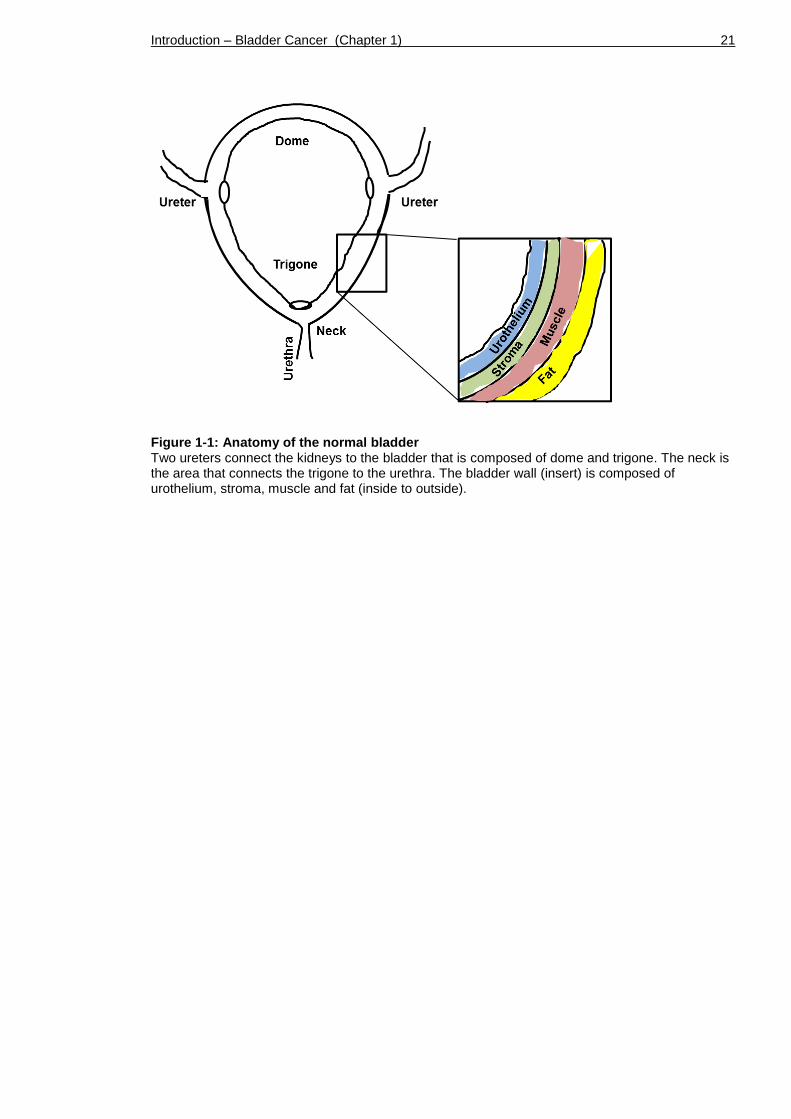
The mammalian urinary system comprises kidneys, ureters, bladder and urethra.
Anatomically, the bladder is composed of the dome, which is the roof of the
bladder reaching laterally down to the two ureters, and the funnel-shaped
trigone reaching from the ureters down to the bladder neck that connects to the
urethra (Figure 1-1).
The bladder, a hollow muscular organ, is composed of a so-called ‘detrusor
muscle’ made of smooth muscles fibres covered in perivesical fat layers. Below
the muscular coat, a layer of fibrous connective tissue interlaces with the
urothelium, the inside layer of the bladder that faces the lumen. The connective
tissue (also called stroma, submucosa or lamina propria) contains blood and
lymphatic vessels, nerves and occasional glands.
As a storage organ, the bladder can hold between 400 to 600ml of urine for
about five hours. During this time the urothelium is continuously in contact with
the urine and with any toxins or tumourigenic agents that may be dissolved
therein.
Introduction – Bladder Cancer (Chapter 1) 21
Figure 1-1: Anatomy of the normal bladder Two ureters connect the kidneys to the bladder that is composed of dome and trigone. The neck is the area that connects the trigone to the urethra. The bladder wall (insert) is composed of urothelium, stroma, muscle and fat (inside to outside).

Introduction – Bladder Cancer (Chapter 1) 22
1.1.1 The Urothelium
The urothelium is also called transitional cell epithelium, due the fact that it
can stretch out into a single layer when storing the urine, and contract back
upon releasing it. The urothelium is comprised of a sheet of extracellular matrix
rich in collagen-IV and laminin that separates the stroma from the urothelium
(Brown et al., 2006).
The human urothelium consists of four to seven cell layers, including a single
basal cell layer, multiple intermediate cell layers, as well as a single umbrella
cell layer facing the lumen. The murine urothelium has a similar composition,
but comprises only three of these cell type layers in total (Figure 1-2).
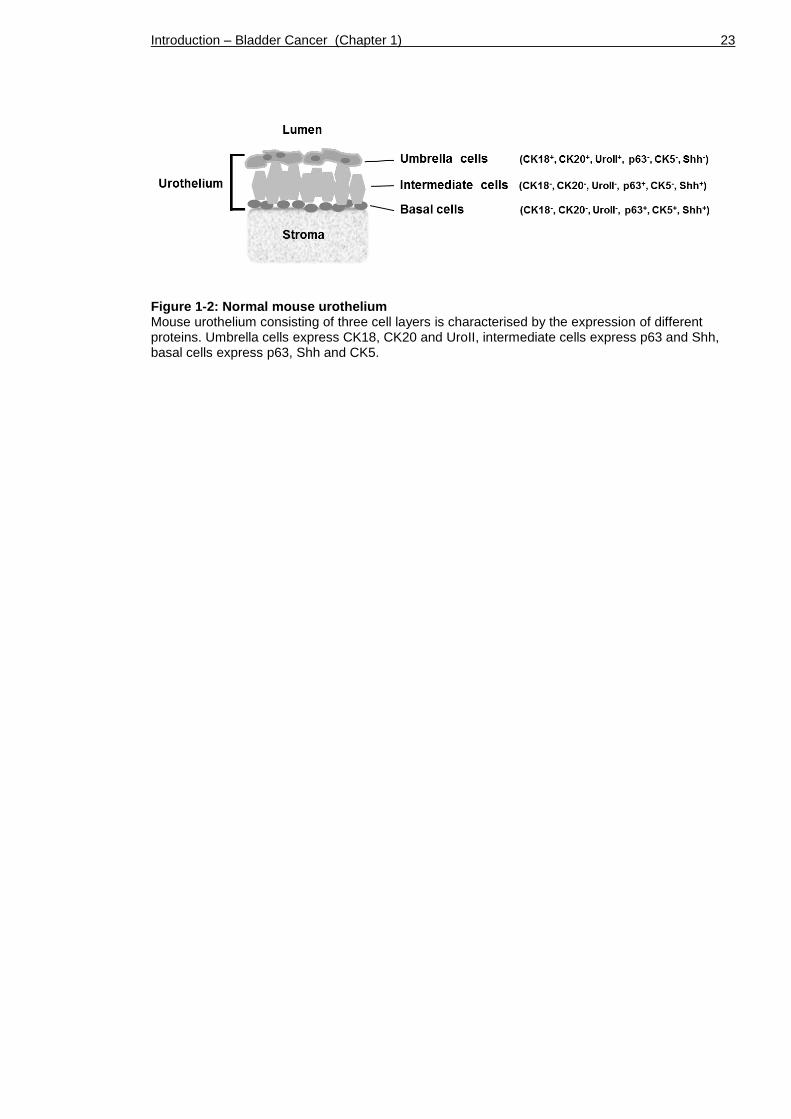
Basal cells are small round-shaped cells that line up along the basement
membrane. They are characterised by the expression of Cytokeratin-5 (CK5),
p63, and Sonic hedgehog (Shh) (Castillo-Martin et al., 2010, Gandhi et al., 2013,
Shin et al., 2011, Karni-Schmidt et al., 2011). The same studies report that basal
cells are negative for Cytokeratin-18 (CK18), Cytokeratin-20 (CK20) and
Uroplakins.
Intermediate cells are oriented perpendicular to umbrella and basal cells and
can stretch into 1-4 layers. They express p63, Shh, and occasionally Uroplakins,
but rarely CK5 (Castillo-Martin et al., 2010, Gandhi et al., 2013, Shin et al.,
2011).
Umbrella cells are the terminally differentiated cell type in the urothelium that
are facing the lumen. They are often binucleated and present morphologically
with a stretched shape, covering the intermediate cell layer in an umbrella-like
manner. Umbrella cells are marked by the expression of CK18 and CK20, which
are absent in other layers (Castillo-Martin et al., 2010, Veranic et al., 2004).
Umbrella cells also express Uroplakins (Kong, 2004, Gandhi et al., 2013), which
are involved in the assembly of a protective barrier against urine, the apical
plaques (Khandelwal et al., 2009). Expression of p63, Shh and CK5 is absent in
umbrella cells (Castillo-Martin et al., 2010, Gandhi et al., 2013, Shin et al.,
2011, Karni-Schmidt et al., 2011).
Introduction – Bladder Cancer (Chapter 1) 23
Figure 1-2: Normal mouse urothelium Mouse urothelium consisting of three cell layers is characterised by the expression of different proteins. Umbrella cells express CK18, CK20 and UroII, intermediate cells express p63 and Shh, basal cells express p63, Shh and CK5.
Introduction – Bladder Cancer (Chapter 1) 24
1.1.2 Urothelial lineage and stem cells
The question of urothelial lineage by which umbrella, intermediate and basal
cells are generated has been debated for a long time and still remains
controversial (Castillo-Martin et al., 2010, Khandelwal et al., 2009).
The adult urothelium is a quiescent epithelium with a proliferation rate of 0.02-
0.05% in human and 0.1-1% in mice (Stewart et al., 1980). The turnover time is
estimated to be 3-6 months (Khandelwal et al., 2009). However, upon chemical
or mechanical injury the urothelium can rapidly regenerate (Khandelwal et al.,
2009, Shin et al., 2011), suggesting the presence of urothelial stem cells.
Stem cells are unspecialised cells that have the ability to self-renew and to
differentiate into several cell types (Weiner, 2008). In other epithelia such as
the epidermis, there are populations of stem cells which are characterised as
slowly cycling in vivo but showing a high proliferative potential in vitro (Morris
and Potten, 1994). Elegant experiments have used these properties of slow
turnover and long-term residence in tissue to characterise these cells. Labelling
retaining studies first using BrdU, tritiated thymidine or EdU, and more latterly
through the use of eGFP-tagged histone 2B (H2B-eGFP) allowed the visualisation
and purification of these cells in vivo (Tumbar, 2004, Barker et al., 2007,
Kurzrock et al., 2008).
Unlike in many other organs, stem cells in the bladder have not been
unambiguously identified. For a long time it had been assumed that urothelial
stem cells reside exclusively in the basal cell compartment (Kurzrock et al.,
2008, Gaisa et al., 2011, Shin et al., 2011, Chan et al., 2009b).
Much effort has been made in order to narrow down urothelial stem cells within
the basal cell compartment using marker expression studies and lineage tracing.
It has been suggested that 10% of the basal cells could represent candidate stem
cells, which show long-term regenerative potential and retain BrdU label one
year after its administration (Kurzrock et al., 2008).
Furthermore, it was suggested that p63-expressing cells are the stem cells of the
urothelium and that these are able to regenerate basal, intermediate and

Introduction – Bladder Cancer (Chapter 1) 25
umbrella (Pignon et al., 2013). However, it has been shown that p63 and its
isoforms are also expressed in intermediate cells (Karni-Schmidt et al., 2011),
which therefore does not limit urothelial progenitor cells to reside in the basal
cell compartment.
Another study reported the expression of secreted protein Shh in a
subpopulation of CK5-positive basal cells, which are capable of regenerating all
cell types within the urothelium (Shin et al., 2011). CK5-expressing basal cells
are undetectable in the urothelium between E11 and E14 when progenitor
potential is high, and they form after umbrella and intermediate cells (Gandhi
et al., 2013).
Recently, a new model of urothelial regeneration was suggested where at least
two urothelial progenitor populations exist within the Shh-expressing population
(Gandhi et al., 2013). The study describes fate-mapping in the urothelium upon
chemical injury, where it was shown that CK5-positive cells do not generate
umbrella cells. The study strongly suggested that lineage-tagged umbrella cells
are descendants of intermediate cells, and it was therefore speculated that
umbrella and intermediate cells arise from a separate lineage in the adult
urothelium. The research group identified a second progenitor population,
namely P-cells, which are a transient in the embryonic urothelium between day
E11 and E13 and are marked by the expression of Foxa2, p63, Shh and Uroplakin.
Fate-mapping suggested that P-cells are the progenitors of intermediate cells,
which are present in the embryonic and adult urothelium. It remained unclear in
the study where CK5-positive basal cells arise from and whether umbrella cells
derive directly from P-cells or from P-cell-descendent intermediate cells.
The study by Gandhi was supported by previous immunohistochemical
characterisation of the mouse urothelium using layer-specific markers, which
suggested that umbrella cells do not differentiate from basal to intermediate
cells, but constitute a different cell lineage (Castillo-Martin et al., 2010, Karni-
Schmidt et al., 2011). The proposed model from the Castillo-Martin and Karni-
Schmidt protein expression studies was that a urothelial progenitor or stem cell
population gives rise to two separate cell lineages with distinct expression
profiles, namely basal/intermediate and umbrella cells.

Introduction – Bladder Cancer (Chapter 1) 26
Taken together, further studies are necessary in order to clearly identify
urothelial stem cells and to better understand urothelial generation and
development. Expansion of such studies into mechanisms of cancer cell
transformation could help to shed light on bladder cancer initiation and
progression. Furthermore, better understanding of urothelial stem cells and
their exact location would be of great benefit to the generation of mouse
models of bladder cancer, where the availability of a reliable stem cell targeting
Cre is still a limitation. Thus we will be examining the recombination efficiency
of an established promoter-driven UroplakinII-Cre as well as of a novel technique
using adenoviral Cre delivery to the urothelium.
1.2 Bladder cancer
1.2.1 Epidemiology
Bladder cancer is the 5th most common and the 9th most lethal cancer in the UK
(Parkin et al., 2005), Cancer Research UK statistics, 2013). According to Cancer
Research UK statistics 2013, about 10,300 people were diagnosed in 2010 in the
UK, which is about 28 people per day. Worldwide, it is estimated that 383,000
new cases are diagnosed per year. Generally, bladder cancer occurs in people
aged 65 and over. Overall more men than women are affected, with bladder
cancer being the 4th most common cancer in men in the UK and the 11th most
common cancer in UK women (Cancer Research UK statistics, 2013). Between
the mid-1970s and the 1990s male bladder cancer incidence rates increased,
while female rates were lower but followed the same pattern. Bladder cancer is
still prevalent in males, although both rates have decreased since the 1990s
(Cancer Research UK statistics, 2013).
1.2.2 Causes
The principal risk factor of bladder cancer is smoking, which is estimated to
account for 35% of the cases in the UK per year (Brennan et al., 2000, Wallerand
et al., 2005)(Cancer Research UK statistics, 2013). Smoking is also associated
with high stage and high grade urothelial tumours (Wallerand et al., 2005).
Furthermore, occupational exposure to chemical carcinogens such as polycyclic
aromatic hydrocarbons (PAHs), diesel exhausts, and aromatic amines is linked to
a considerable number of bladder cancers as well (Kogevinas et al., 2003).

Introduction – Bladder Cancer (Chapter 1) 27
Although familial cases of bladder cancer are relatively rare, the risk is 2-fold
higher in first degree relatives of bladder cancer patients (Burger et al., 2013).
Inherited genetic factors such as N-acetyltransferase (NAT2), glutathione S-
transferase mu 1 (GSTM1) and a sequence variant on 4p16.3 are associated with
genetic predisposition (Garcia-Closas et al., 2005). In Africa and the Middle East
a large number of bladder cancers are caused by schistosomiasis, a parasitic
disease (Cancer Research UK statistics, 2013).
1.2.3 Types of bladder cancer
Urothelial cell carcinoma is the most common type of bladder cancer (90%) in
the Western world (Cancer Research UK statistics, 2013). Urothelial cell
carcinoma develops from the innermost layer of the bladder wall, the
urothelium (Chapter 1.1.1). Urothelial cell carcinoma can be of non-invasive or
muscle invasive nature (Chapter 1.2.10).
Squamous cell carcinoma accounts for 5% of the UK bladder cancers (Cancer
Research UK statistics, 2013). This type of bladder cancer presents with a
stratified skin-like tissue architecture. Squamous cell carcinoma is more common
in developing countries in Africa and the Middle East, where it is linked to the
infectious disease schistosomiasis (bilharzia). Squamous cell carcinoma of the
bladder is also linked to chronic inflammation resulting from indwelling
catheters, urinary calculi and urinary outflow obstruction (Cancer Research UK
statistics, 2013).
Other rare types of bladder cancer include adenocarcinoma, which accounts for
1-2% of all bladder tumours and develops from mucus-producing glandular cells
(Cancer Research UK statistics, 2013). Another rare type is soft tissue sarcoma,
which originates in the detrusor muscle of the bladder (Cancer Research UK
statistics, 2013).
1.2.4 Symptoms
The most common symptom of bladder cancer is blood in the urine (haematuria)
seen in 80% of bladder cancer patients (Cancer Research UK statistics, 2013).
Haematuria is usually not painful. Other symptoms can include frequency and
urgency of passing urine.

Introduction – Bladder Cancer (Chapter 1) 28
1.2.5 Diagnosis
Bladder cancer is mostly diagnosed by examination of the bladder lining using
cystoscopy, where a tube with optic cables is inserted through the urethra under
(local or) general anaesthesia. Tissue samples taken (biopsies) are taken from
normal and abnormal looking areas. Moreover, a computerised tomography (CT)
scan can be performed to examine the whole urinary tract. Blood and urine tests
for early detection of bladder cancer are in development where hormone levels
or ratios of specific proteins such as Bladder Tumour Antigen (BTA), Nuclear
Matrix Protein 22 (NMP-22) or Mini Chromosome Maintenance 5 (MCM5) are
analysed.
1.2.6 Treatment
Depending on the stage and behaviour of the bladder tumour, the treatment for
each patient is managed differently.
Superficial early bladder cancer can be removed by trans-urethral resection of
the bladder tumour (TURBT) followed by regular cystoscopic surveillance.
Adjuvant immunotherapy (intravesical instillation) is often given in form of
Bacillus Calmette-Guerin (BCG) to stimulate the immune system and lower the
chances of recurrence and progression (Babjuk et al., 2008). The exact
mechanism by which BCG is effective is still unclear.
Invasive bladder tumours can often only be treated by removing parts or the
entire bladder by radical cystectomy. Alternatively, radiotherapy can save the
bladder from being removed, but this treatment requires daily presence in the
hospital for 6 weeks to receive the treatment, and it can cause bowel
inflammation as a side effect. Neoadjuvant chemotherapy (intravenous) is often
given before the surgery, and can be used in combination with radiotherapy to
aid these treatments. Chemotherapy is often based on a Cisplatin-containing
drug combination, such as Gemcitabine/Cisplatin (GC) or Methotrexate/
Vinblastine/ Doxorubicin (Adriamycin)/Cisplatin (MVAC) (Niegisch et al., 2013).
The current standard care for metastatic disease, GC, shows a 49% response rate
in the patients (von der Maase et al., 2005). Cisplatin acts by forming crosslinks
to the DNA, leading to irreparable DNA damage that triggers cell death through
Introduction – Bladder Cancer (Chapter 1) 29
the apoptotic pathway (Bambury and Rosenberg, 2013). Gemcitabine is
pyrimidine analogue that is integrated into the DNA during replication, leading
to faulty nucleosides, and therefore triggering apoptosis (von der Maase et al.,
2000).
Bladder cancer is one of the most expensive cancers of all to treat (Sangar et
al., 2005). This is partly due to the intensive treatments that are necessary in
case of an invasive tumour. Moreover, non-invasive tumours tend to recur
frequently and therefore require repeated follow-up surveillance.
1.2.7 Prognosis
According to Cancer Research UK statistics 2013, about 80 to 90% of patients
with non-invasive bladder cancer can live for more than 5 years. The prognosis
for patients with muscle-invasive disease is less favourable, with only 50%
survival at 5 years. Once the disease has become metastatic, the average
survival drops to 12-18 months.
1.2.8 Pathology of urothelial cell carcinoma
1.2.8.1 Grading and staging
Based on the growth pattern of urothelial tumours, four diagnostic categories
are described (flat, exophytic papillary, endophytic, and invasive) (Montironi et
al., 2008).
Flat lesions show unaltered thickness of the urothelium, but are more
characterised by atypic cellular features such as mitotic figures and loss of
polarity. Flat lesions can present features such as reactive (inflammatory)
atypia, dysplasia, or carcinoma in situ (CIS).
Exophytic papillary neoplasms include papilloma, PUNLMP, and low- and high-
grade papillary carcinoma. These growths are characterised by a central
fibrovascular core. Endophytic lesions, such as inverted papilloma, show features
that are similar to exophytic papilloma; however, without the presence of a
Introduction – Bladder Cancer (Chapter 1) 30
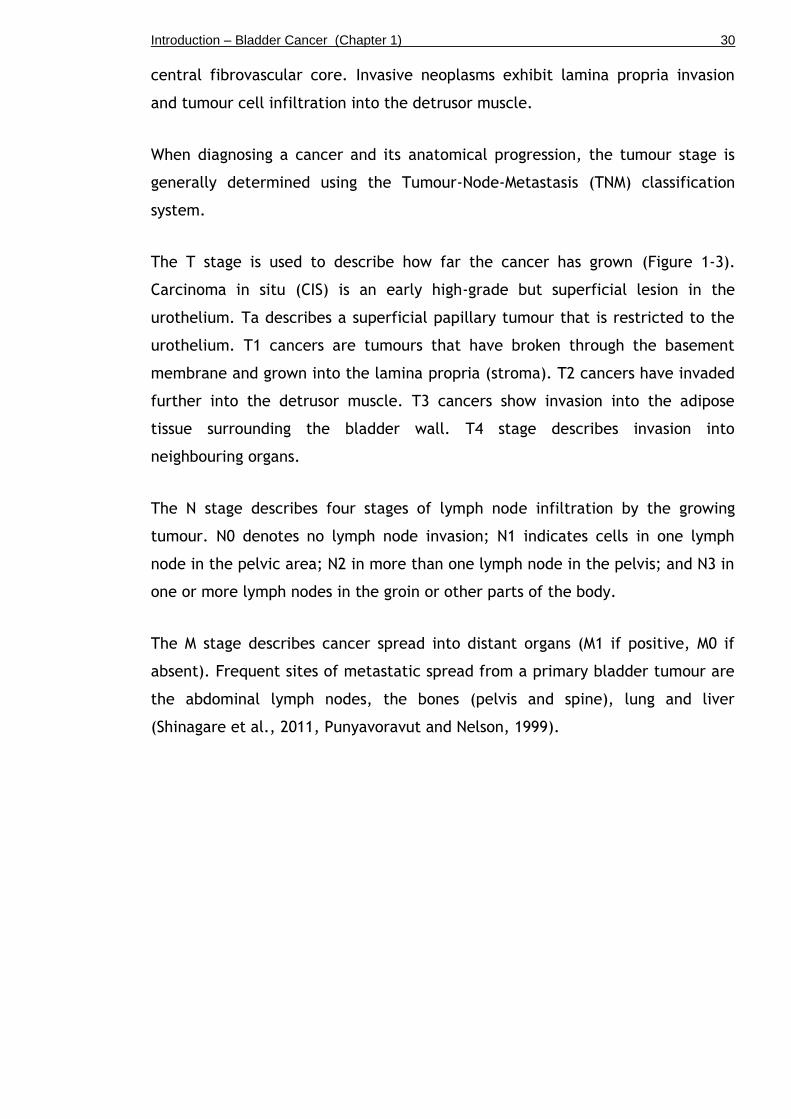
central fibrovascular core. Invasive neoplasms exhibit lamina propria invasion
and tumour cell infiltration into the detrusor muscle.
When diagnosing a cancer and its anatomical progression, the tumour stage is
generally determined using the Tumour-Node-Metastasis (TNM) classification
system.
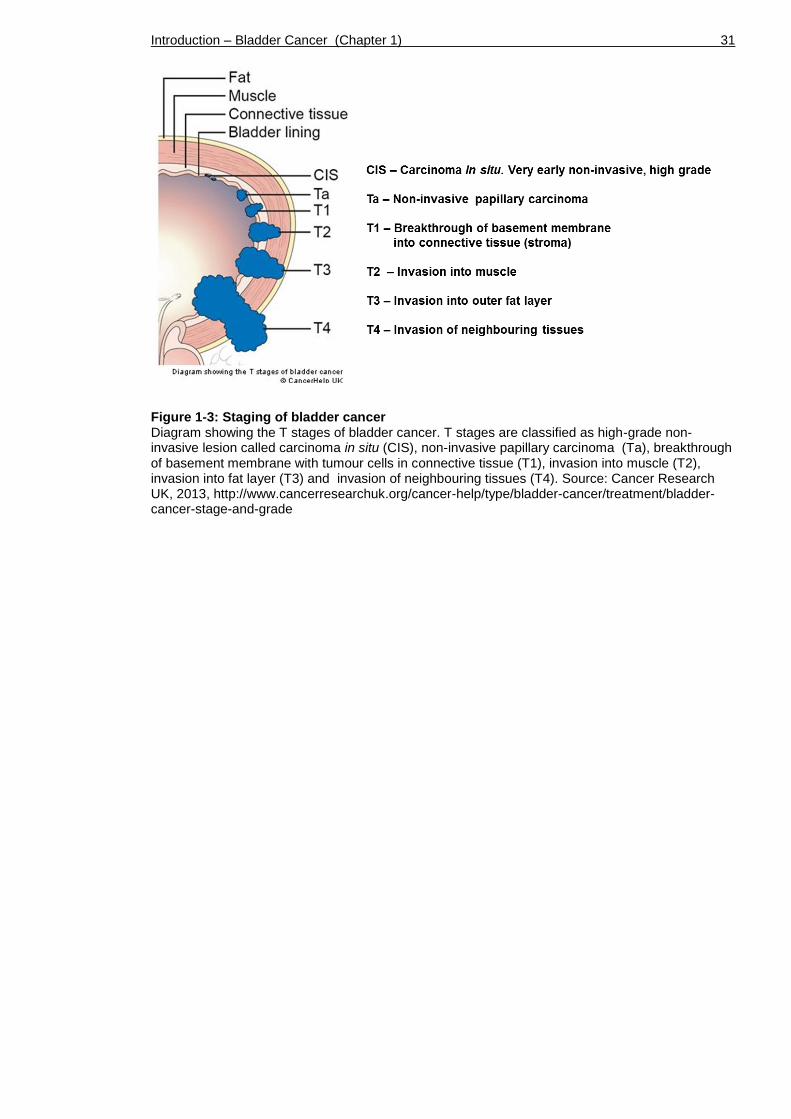
The T stage is used to describe how far the cancer has grown (Figure 1-3).
Carcinoma in situ (CIS) is an early high-grade but superficial lesion in the
urothelium. Ta describes a superficial papillary tumour that is restricted to the
urothelium. T1 cancers are tumours that have broken through the basement
membrane and grown into the lamina propria (stroma). T2 cancers have invaded
further into the detrusor muscle. T3 cancers show invasion into the adipose
tissue surrounding the bladder wall. T4 stage describes invasion into
neighbouring organs.
The N stage describes four stages of lymph node infiltration by the growing
tumour. N0 denotes no lymph node invasion; N1 indicates cells in one lymph
node in the pelvic area; N2 in more than one lymph node in the pelvis; and N3 in
one or more lymph nodes in the groin or other parts of the body.
The M stage describes cancer spread into distant organs (M1 if positive, M0 if
absent). Frequent sites of metastatic spread from a primary bladder tumour are
the abdominal lymph nodes, the bones (pelvis and spine), lung and liver
(Shinagare et al., 2011, Punyavoravut and Nelson, 1999).
Introduction – Bladder Cancer (Chapter 1) 31
Figure 1-3: Staging of bladder cancer Diagram showing the T stages of bladder cancer. T stages are classified as high-grade non-invasive lesion called carcinoma in situ (CIS), non-invasive papillary carcinoma (Ta), breakthrough of basement membrane with tumour cells in connective tissue (T1), invasion into muscle (T2), invasion into fat layer (T3) and invasion of neighbouring tissues (T4). Source: Cancer Research UK, 2013, http://www.cancerresearchuk.org/cancer-help/type/bladder-cancer/treatment/bladder-cancer-stage-and-grade

Introduction – Bladder Cancer (Chapter 1) 32
Grading of a cancer is determined upon microscopic examination of the biopsy
sample. Low-grade cancers usually consist of cells that are normal looking and
well differentiated and are associated with relatively slow growth, whereas
high-grade cancers show high heterogeneity, poor differentiation and a tendency
to grow quickly and progress.
Non-invasive urothelial tumours were classified in 1973 by the World Health
Organisation (WHO) and the International Society of Urologic Pathology (ISUP) as
urothelial papilloma, tumours of grade 1 (G1; well differentiated), grade 2 (G2;
moderately differentiated) or grade 3 (G3; poorly differentiated) (Table 1-1).
In 2004 the WHO/ISUP made an attempt to re-classify early bladder tumours in
order to improve their recognition and to provide better correlation of the
neoplastic lesions with their cellular behaviour. Neoplasms were classified as
urothelial papilloma, papillary urothelial neoplasms of low-malignant potential
(PUNLMP), low-grade papillary urothelial carcinoma and high-grade urothelial
carcinoma (Table 1-1).
Although the 2004 system was meant to replace the urological cancer
classification of 1973, the old system is still being used by many pathologists,
since it has been validated in terms of prognosis and patient outcome (Chen et
al., 2012).
Table 1-1: WHO classification of urinary tumours in 1973 and 2004
Introduction – Bladder Cancer (Chapter 1) 33
1.2.8.2 Multifocality of urothelial tumours
Urothelial cell carcinoma typically presents with multifocal lesions (Habuchi,
2005). These individual tumours within the same tissue can be of similar or
completely different stage, grade and site. Two basic mechanisms of how these
multifocal lesions arise have been debated (Hafner et al., 2002). The multiple
tumours may either arise independently by separate genetic events or they can
be of monoclonal origin.
The majority of the reports have been suggesting a monoclonal origin of the
multiple lesions, where one progenitor cell is transformed initially (Sidransky et
al., 1992, Takahashi et al., 1998, Jones et al., 2005, Hartmann et al., 2000,
Denzinger et al., 2006, Simon et al., 2001). Cells can subsequently undergo
intraluminal spread using the urine to distribute and to implant at a different
site within the bladder. Alternatively, they may reach other regions by
intraepithelial migration, a process in which malignant cells spread throughout
the urothelial lining.
The second theory, which is also called “field effect” or “field cancerisation”, is
supported by a number of studies, where the multiple tumours show indications
of oligoclonal origin (Hafner et al., 2001, Spruck et al., 1994, Stoehr et al.,
2000). According to this concept individual cells acquire different mutations over
time, and tumour lesions arise and develop independently.
It needs to be kept in mind that the two clonality concepts are not mutually
exclusive. The correct classification of multifocal urothelial tumours, however,
is of clinical importance in terms of prognosis as well as on deciding on the most
suitable treatment.

Introduction – Bladder Cancer (Chapter 1) 34
1.2.9 Genetics behind bladder cancer
Genomic analysis such as by fluorescence in situ hybridisation (FISH),
comparative genomic hybridisation (CGH) and sequencing techniques indicates a
number of genes that are commonly deleted or mutated in bladder tumours
(Knowles, 2008, Al Hussain and Akhtar, 2013) (Table 1-2).
Genome-wide alterations, such as copy number changes or deletions of whole
chromosomes, chromosome arms, and individual loci on chromosome arms, are
frequent events in both non-invasive and invasive bladder cancer (Knowles,
2008). Bladder tumours also frequently present with activation of major
signalling pathways involving cell cycle regulating genes, genes involved in cell
communication or transcriptional regulators.
1.2.9.1 Genome-wide alterations
Alterations in chromosome 9 (9p, 9q) are found in more than 50% of all bladder
tumours of all grades and stages (Cairns et al., 1993), suggesting that this may
be one of the earliest events in bladder cancer development (Kallioniemi et al.,
1995). Partial deletions of chromosome 9 are found in 35-65% of non-invasive
bladder tumours (Blaveri et al., 2005, Simoneau et al., 2000), suggesting the
presence of tumour suppressor genes in this genomic region. Chromosome 9
contains an estimate of 800 to 900 genes (Humphray et al., 2004). A specific
region on chromosome 9, 9p21-22, referred to as CDKN2A encoding for
p16/INK4A and p14/ARF is frequently deleted in bladder cancer (Cairns et al.,
1994). However, the value of p16 as a prognostic biomarker in bladder cancer is
still not entirely clear (Friedrich et al., 2001). Although it is not entirely clear
which genes exactly are responsible for cancer relapse, chromosome 9 deletions
are also associated with recurrence of non-invasive papillary bladder tumours
(Simoneau et al., 2000). Loss of heterozygosity (LOH) of chromosome 10 is a
frequent event in advanced tumours (Kagan et al., 1998, Cappellen et al., 1997).
Chromosome 10 harbours the tumour suppressor gene PTEN, which is frequently
deleted in bladder cancer and associated with a higher tumour grade (Aveyard et
al., 1999).

Introduction – Bladder Cancer (Chapter 1) 35
1.2.9.2 Changes in genes related to the p53 pathway and cell cycle
Alterations in genes that are involved in the regulation of p53 function, including
TP53, p21, and RB1 are highly associated with advanced and muscle-invasive
tumours (Sidransky et al., 1991, Stein et al., 1998, Cairns et al., 1991). MDM2, a
negative p53 regulator is often found overexpressed in non-invasive tumours
(Habuchi et al., 1994, Lianes et al., 1994).
TP53 deletion is found in up to 70% of muscle-invasive bladder cancers (Sidransky
et al., 1991, Lu et al., 2002). p53 is a nuclear phosphoprotein, which is encoded
by the TP53 gene (Vogelstein et al., 2000). The transcription factor p53 acts as a
major tumour suppressor and gate keeper at the G1/S checkpoint of cell cycle.
Nuclear accumulation of p53 protein can be an indication of TP53 mutation,
which is associated with greater risk of muscle-invasive disease and reduced
survival (Esrig et al., 1994). Loss of wild type TP53 in tumour cells may help to
escape growth control (Sidransky et al., 1991).
TP53 mutations, such as point mutations and frameshift mutations, are also
frequent events (~70%) in bladder cancer, resulting in functionally silent,
missense, or dominant-negative forms of p53 protein (Habuchi et al., 1994).
There are about six hotspot mutations in TP53 that lead to a dominant-negative
form of p53 protein function (Greenblatt et al., 1994). An example is R175H, a
gain-of-function missense mutation which strongly promotes tumour formation
and metastatic spread in vivo (Liu et al., 2000). Mutant p53 may provide a
growth advantage to tumour cells (Sidransky et al., 1991).
LOH of the tumour suppressor ‘Retinoblastoma protein’ (RB) is found in 37% of
muscle-invasive bladder tumours (Cairns et al., 1991). Encoded by the RB1 gene
the RB protein functions as a regulator of the cell cycle at the G1/S phase and as
a recruiter of chromatin remodelling enzymes and transcription factors (Classon
and Harlow, 2002). RB also regulates p53 activity through mouse double minute
2 homolog (MDM2) activation (Hsieh et al., 1999). During the G1 phase of the cell
cycle, cyclin-dependent kinases (CDKs) phosphorylate and thereby inactivate RB.
Not only loss of function but also phospho-RB (pRB) overexpression and
hyperphosphorylation has been reported in bladder cancer (Chatterjee et al.,
2004).

Introduction – Bladder Cancer (Chapter 1) 36
Loss of p21 (CIP1/WAF1) expression in patients with muscle-invasive bladder
cancer has been shown to be an indicator of tumour progression (Stein et al.,
1998). p21 is a cyclin-dependent kinase inhibitor protein that is encoded by the
CDKN1A gene. p21 is a direct target of p53 and regulates cell cycle progression
at the G1/S phase (el-Deiry et al., 1993). Loss of p21 was also strongly
associated with higher recurrence and decreased overall survival (Stein et al.,
1998), supporting a generally protective function of p21 against disease
progression. However, in carcinoma in situ patients, p21 expression on its own,
as well as co-expressed with p53, was associated with recurrence, progression
and mortality (Shariat et al., 2003), suggesting a context-dependent role of p21
in bladder cancer.
The mouse double minute 2 homolog (MDM2) has been found overexpressed in
about 30% of non-invasive tumours (Habuchi et al., 1994, Lianes et al., 1994),
and is mutually exclusive in the relationship with TP53 mutations (Network,
2014). MDM2 encodes for an E3 ubiquitin-protein ligase that targets p53 protein
for proteasomal degradation.
1.2.9.3 Activation of tyrosine kinase receptors
The fibroblast growth factor receptor 3 (FGFR3) is found mutated in 60-80% of
non-invasive bladder cancers (Billerey et al., 2001, Cappellen et al., 1999,
Tomlinson et al., 2007a, van Rhijn et al., 2012). FGFR3 is a tyrosine kinase
receptor for FGFs, which stimulates both the RAS/MAPK and the PI3K/AKT
pathways and triggers a range of cellular processes such as cell growth and
division during development (Bottcher, 2005, Goetz and Mohammadi, 2013). In
muscle-invasive disease, FGFR3 is found mutated in 0-30% of the cases (Billerey
et al., 2001); however wild type receptor overexpression has been found in 54%
of muscle-invasive tumours (Tomlinson et al., 2007a). A recent attempt to re-
classify urothelial cell carcinomas primarily based on molecular features has
revealed that FGFR3 mutations and overexpression are associated with a
subgroup of muscle-invasive bladder cancer with significantly poor prognosis
(Sjodahl et al., 2012). In a recent study with focus on gene cooperation, FGFR3
mutations were predominantly found alone (65%) (Juanpere et al., 2012). FGFR3
and HRAS mutations have been shown to be mutually exclusive events in bladder
Introduction – Bladder Cancer (Chapter 1) 37
cancer, possibly due to redundant activation of downstream signalling (Kompier
et al., 2010, Jebar et al., 2005, Juanpere et al., 2012).
The epidermal growth factor receptor (EGFR; ERBB-1; HER1) is often found
overexpressed in up to 50% of human invasive carcinomas (Colquhoun and
Mellon, 2002). EGFR is a tyrosine kinase receptor for ligands including EGF and
TGF-α, which stimulate both the RAS/MAPK and the PI3K/AKT pathways and
leading to DNA synthesis, cell proliferation and angiogenesis (Oda et al., 2005).
Interestingly, it has been shown that the EGFR pathway is upregulated upon
FGFR3 inhibition, which constitutes a resistance mechanism to receptor
inhibition (Herrera-Abreu et al., 2013). In the same study EGFR dominated the
downstream signalling through repression of mutant FGFR3 expression. It was
speculated that FGFR3 may initiate cancer development until at some point
increased EGFR signalling dominates and represses FGFR signalling (Herrera-
Abreu et al., 2013).
1.2.9.4 Changes in genes related to the MAPK/ERK pathway
Activated MAPK/ERK signalling is implicated to be involved in bladder cancer
(Kompier et al., 2010, Billerey et al., 2001). Hyperactive MAPK/ERK signalling is
not only triggered by activated tyrosine kinase receptor signalling, but can also
be caused by mutations in the rat sarcoma viral oncogene homolog (RAS).
Harvey-RAS (HRAS) was the first oncogene isolated from a human bladder cancer
cell line (Reddy et al., 1982). HRAS is a GTPase that is involved in regulating cell
division in response to growth factor stimulation (Campbell et al., 1998). Point
mutations in the HRAS gene can lead to constitutive activation of the GTPase
protein and increased MAPK/ERK signalling, and thereby inducing uncontrolled
cell division. HRAS is found mutated in non-invasive and invasive bladder cancer
at a frequency that strongly varies between the different studies (15-40%) (Jebar
et al., 2005, Knowles and Williamson, 1993, Fitzgerald et al., 1995, Ooi et al.,
1994, Czerniak et al., 1992).
1.2.9.5 Changes in genes related to the PI3K/AKT pathway
The Phosphatidylinositol 3-kinase (PI3K)/AKT pathway is implicated to be
involved in bladder cancer with a large number of tumours showing mutations in
PIK3CA or AKT1 or deletion of the tumour suppressor gene PTEN (Wu et al.,

Introduction – Bladder Cancer (Chapter 1) 38
2004, Knowles et al., 2009, Askham et al., 2010, Juanpere et al., 2012, Duenas
et al., 2013).
PI3K is an enzyme that leads to AKT pathway activation by catalysing the
production of Phosphatidylinositol (3,4,5)-triphosphate (PIP3), the substrate of
the Phosphatase and tensin homolog (PTEN) (Maehama and Dixon, 1998). A
catalytic subunit of PI3K, PIK3CA, is mutated in 15-25% of non-invasive tumours,
leading to a significant proliferative advantage through increased lipid kinase
activity and constitutive AKT activation (Lopez-Knowles et al., 2006, Askham et
al., 2010, Ross et al., 2013, Juanpere et al., 2012, Knowles et al., 2009, Kompier
et al., 2010). In non-invasive tumours, PIK3CA mutation was associated with
reduced recurrence (Duenas et al., 2013). In invasive bladder cancer cell lines,
inhibition of PI3K has been shown to reduce the invasive capacity (Wu et al.,
2004). Co-occurrence of FGFR3 and PIK3CA mutations was found in urothelial
cell carcinoma across all stages and grades (Lopez-Knowles et al., 2006, Kompier
et al., 2010, Duenas et al., 2013). On the other hand, PIK3CA and AKT1
mutations have been shown to be mutually exclusive, possibly due to redundant
activation of downstream signalling (Juanpere et al., 2012).
Loss of heterozygosity (LOH) of PTEN has been found in 30% of invasive tumours
(Aveyard et al., 1999, Cappellen et al., 1997, Cairns et al., 1998). PTEN is a
well-known negative regulator of the AKT/PI3K pathway. PTEN inhibits the PI3K-
AKT pathway by dephosphorylating PIP3, the product of PI3K (Maehama and
Dixon, 1998). PTEN is located on chromosome 10, a chromosome that is also
frequently affected by LOH in advanced tumours (Kagan et al., 1998, Cappellen
et al., 1997, Dahia, 2000). Point mutations or homozygous deletion of PTEN have
been found in 14-23% of invasive tumours (Wang et al., 2000, Cairns et al.,
1998).
1.2.9.6 Changes in genes related to the WNT pathway
The WNT pathway controls many events during development and regulates
homeostasis in adult tissues (Reya and Clevers, 2005). Deregulation of WNT
signalling can occur upon mutations in multiple components of the pathway, for
example through LOH of the Adenomatous polyposis coli (APC) gene, which has
been reported in 50% of bladder tumours (Bohm et al., 1997). Expression of ß-
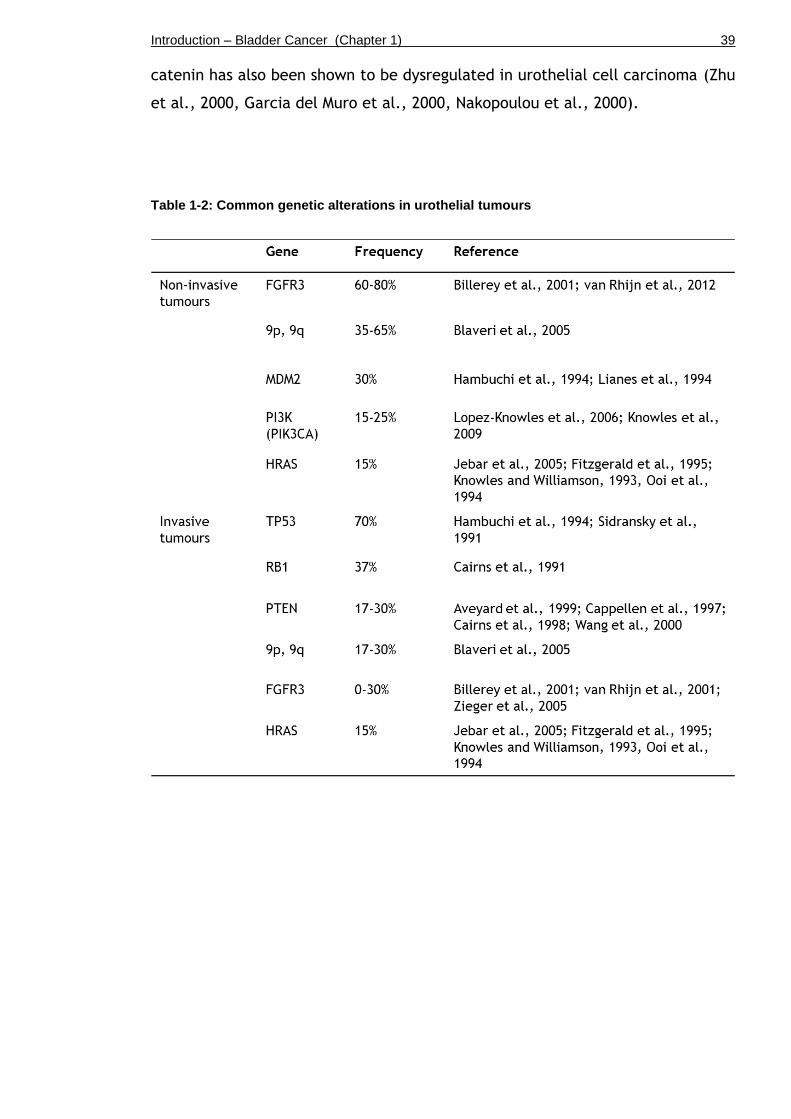
Introduction – Bladder Cancer (Chapter 1) 39
catenin has also been shown to be dysregulated in urothelial cell carcinoma (Zhu
et al., 2000, Garcia del Muro et al., 2000, Nakopoulou et al., 2000).
Table 1-2: Common genetic alterations in urothelial tumours

Introduction – Bladder Cancer (Chapter 1) 40
1.2.10 Model of two independent pathways of bladder cancer progression
Based on histopathological and genomic analysis, a model of two independent
pathogenesis pathways has been suggested, which could result in two different
forms of urothelial cell carcinoma (Figure 1-1, adapted from (Knowles, 2008).
According to the model, seventy percent of all urothelial cell carcinomas
constitute non-invasive papillary tumours (Ta and T1), which are assumed to
develop from a hyperplastic urothelium. Seventy percent of these papillary non-
invasive tumours have a low potential to progress (Ta), but high potential to
reoccur after removal. Thirty percent of the non-invasive tumours present with a
higher grade and show breakthrough of cancer cells beyond the basement
membrane into the connective tissue (T1), which are potentially life
threatening. Non-invasive papillary carcinomas can progress to a higher grade;
however, whether high-grade non-invasive lesions can stage progress to an
invasive lesion is still a subject of investigation (Sylvester et al., 2006, Zieger et
al., 2000, Herr, 2000, Cheng et al., 1999, Leblanc et al., 1999). In contrast,
thirty percent of all urothelial cell carcinomas constitute muscle-invasive
tumours (T2), which are assumed to develop from a dysplastic urothelium or a
carcinoma in situ (CIS). CIS is regarded as the precursor of invasive bladder
carcinoma, which mostly present as flat lesions with a high potential to progress
and to metastasise.
Genomic analysis supports the model of two independent pathogenesis pathways
since non-invasive and invasive tumours generally harbour different sets of
mutations (Knowles, 2008). Alterations in chromosome 9 (9p, 9q) are found in
more than 50% of all bladder tumours of all grades and stages (Cairns et al.,
1993) (Chapter 1.2.8). Mutations in RAS are frequent events of both pathways as
well (Jebar et al., 2005). Prominently, FGFR3 is found mutated in 60-80% of non-
invasive bladder cancer (Billerey et al., 2001). On the other hand, invasive
bladder carcinomas often carry TP53 and RB mutations. Analysis of gene
cooperation and mutual exclusivity of certain genetic changes further support
the two-pathway model. In a recent study with focus on gene cooperation,
PIK3CA was mostly found co-mutated with FGFR3 or KRAS (35%) (Juanpere et al.,
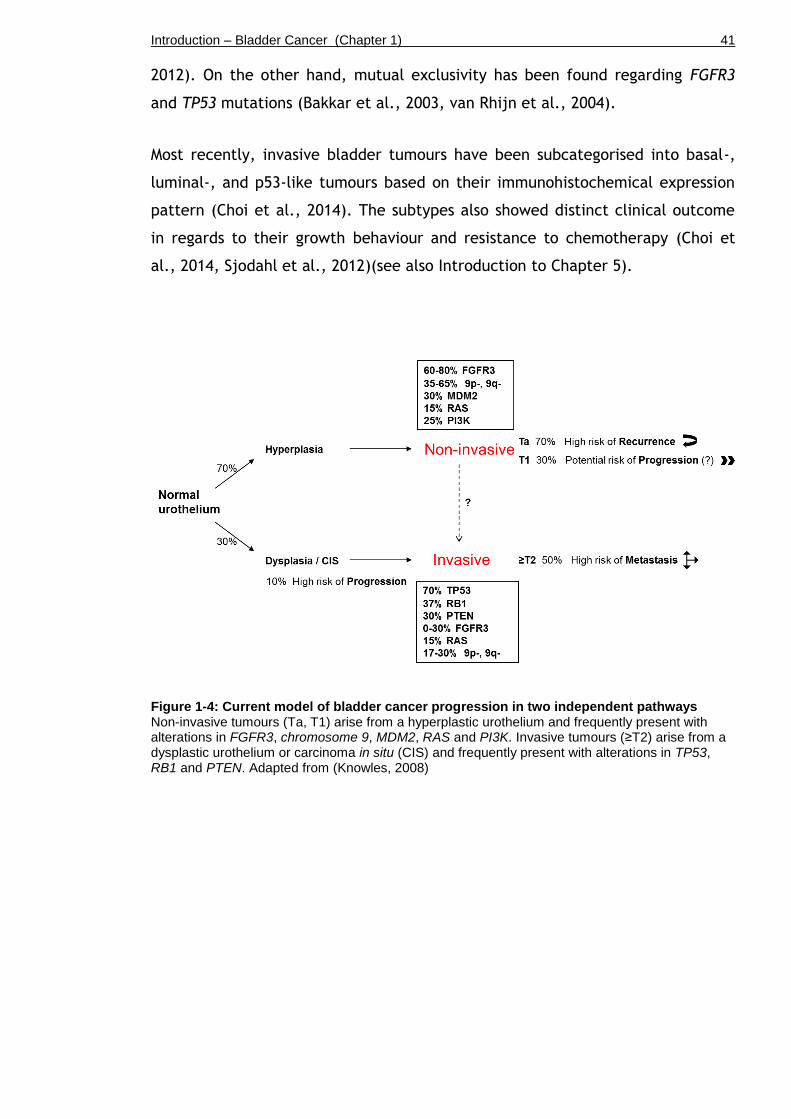
Introduction – Bladder Cancer (Chapter 1) 41
2012). On the other hand, mutual exclusivity has been found regarding FGFR3
and TP53 mutations (Bakkar et al., 2003, van Rhijn et al., 2004).
Most recently, invasive bladder tumours have been subcategorised into basal-,
luminal-, and p53-like tumours based on their immunohistochemical expression
pattern (Choi et al., 2014). The subtypes also showed distinct clinical outcome
in regards to their growth behaviour and resistance to chemotherapy (Choi et
al., 2014, Sjodahl et al., 2012)(see also Introduction to Chapter 5).
Figure 1-4: Current model of bladder cancer progression in two independent pathways Non-invasive tumours (Ta, T1) arise from a hyperplastic urothelium and frequently present with alterations in FGFR3, chromosome 9, MDM2, RAS and PI3K. Invasive tumours (≥T2) arise from a dysplastic urothelium or carcinoma in situ (CIS) and frequently present with alterations in TP53, RB1 and PTEN. Adapted from (Knowles, 2008)

Introduction – Fibroblast growth factor receptor (Chapter 1) 42
1.3 Fibroblast Growth Factor Receptors (FGFRs)
Fibroblast growth factor receptors (FGFRs) are tyrosine kinase receptors that
mediate the effects of Fibroblast Growth Factors (FGFs) (Goetz and Mohammadi,
2013). FGFRs are involved in a range of cellular processes such as cell division
and differentiation, vascularisation and wound healing by stimulation of both the
RAS/ Mitogen-Activated Protein Kinase (MAPK) and the Phosphatidylinositide-3
Kinase (PI3K)/AKT pathway (Bottcher, 2005).
The FGFR family consists of five receptors (FGFR1-FGFR5) that comprise several
alternative splicing isoforms, which can bind 18 different FGF ligands (Wesche et
al., 2011). FGFR1 is known to bind FGF1 (acidic-FGF, aFGF), FGF2 (basic-FGF,
bFGF), FGF3, FGF4, FGF5, FGF6, FGF8 and FGF10; FGFR2 can additionally bind
FGF7 and FGF9 (Powers et al., 2000). FGFR3 is known to be activated by FGF1,
FGF2, FGF8, FGF9, and FGF18; and FGFR4 can bind to FGF 1, FGF 2, FGF 4, FGF
6, FGF8 and FGF 9 (Powers et al., 2000, Davidson et al., 2005). A fifth member
of the FGFR family, FGFR5, has been identified, which in contrast to FGFR1-4
lacks a cytoplasmic tyrosine kinase domain (Sleeman et al., 2001, Kim et al.,
2001).
FGF receptors are located at the cell surface, and are composed of an
extracellular domain to receive FGF signals, a transmembrane domain, and an
intracellular domain that mediates signal transmission into the nucleus (Figure
1-5). The extracellular domain (ligand binding domain) of each monomer consists
of three immunoglobulin (Ig)-like domains (Ig I, Ig II and Ig III) (Wesche et al.,
2011). The Ig II and III domains generally bind to the secreted FGF ligands. The
transmembrane domain comprises a single helix structure, which anchors the
receptor to the cell membrane. The intracellular domain (signal transmitting
domain) is composed of two tyrosine kinase domains, TK1 and TK2.

Introduction – Fibroblast growth factor receptor (Chapter 1) 43
Figure 1-5: Fibroblast Growth Factor Receptor (FGFR) The extracellular domain of FGFR3 is composed of three immunoglobulin (Ig)-like domains that bind to FGF ligands. The transmembrane domain comprises a single helix structure. The intracellular domain is composed of two tyrosine kinase (TK) domains to transmit the signal. Adapted from (Iyer and Milowsky, 2012)
Based on immunohistochemistry, FGFRs are expressed in many tissues with a
distinct spatial pattern (Hughes, 1997). High levels of FGFR1 are seen in the
skin, heart, lung, kidney and ureter. FGFR2 is expressed in the prostate and
stomach. FGFR3 is expression is seen in the appendix, colon, liver and cervix.
FGFR4 expression is seen in the liver, kidney, ureter and some vasculature
tissues (Hughes, 1997).
In the normal bladder, expression of FGFR1 at the protein level is prominently
seen in the urothelium but not in the detrusor muscle (Hughes, 1997). FGFR2
mRNA and protein levels are exclusively detectable in the urothelial
compartment but not in the submucosa or muscle, based on semi-quantitative
RT-PCR and immunohistochemistry respectively (Diez de Medina et al., 1997).
Expression of FGFR3 is generally low or undetectable by Western blotting and
immunohistochemical analysis of tissue microarray (Gomez-Roman et al., 2005,
Tomlinson et al., 2007a). FGFR4 expression is detected in the urothelium and in
the muscle (Hughes, 1997).
Introduction – Fibroblast growth factor receptor (Chapter 1) 44
FGFs such as FGF2 (bFGF) are expressed at higher levels in mesenchymal bladder
tissue rather than in epithelial cells like the urothelium (Cheng et al., 2013).
1.3.1 Downstream signalling
FGF-mediated receptor kinase activity stimulates major signalling pathways such
as the RAS/MAPK, PI3K/AKT and the JAK/STAT pathway, and thereby promotes a
range of cellular processes including cell growth and division, vascularisation,
wound healing, and embryonic development (Bottcher, 2005).
Upon binding of an FGF molecule to the Ig-like region in the extracellular
domain, the receptor dimerises and undergoes a conformational change that
allows transphosphorylation of the tyrosine kinase domains of the intracellular
part of the receptor (Brooks et al., 2012). The phosphorylated residues recruit
adaptor proteins such as Phospholipase-C gamma (PLC-γ) or FGFR substrate 2
(FRS2), which help form a complex composed of Son of sevenless (SOS), Growth
factor receptor-bound protein 2 (GRB2) and GRB2-associated-binding protein 1
(GAB1) (Wesche et al., 2011).
The phosphorylated complex can activate the RAS/MAPK via phosphorylated
GRB2/SOS (Figure 1-6) (Hart et al., 2001). PI3K/AKT activation is mediated by
GRB2/GAB1 interaction with PI3K (Hart et al., 2001). FGFR can also activate the
STAT pathway by direct interaction with Proline-rich tyrosine kinase 2 (PYK2) or
indirectly through Janus-family kinase (JAK) activation (Hart et al., 2000).
Furthermore, it has been shown that FGF receptor signalling can also activate
Src kinases (Cunningham et al., 2010, Sandilands et al., 2007).
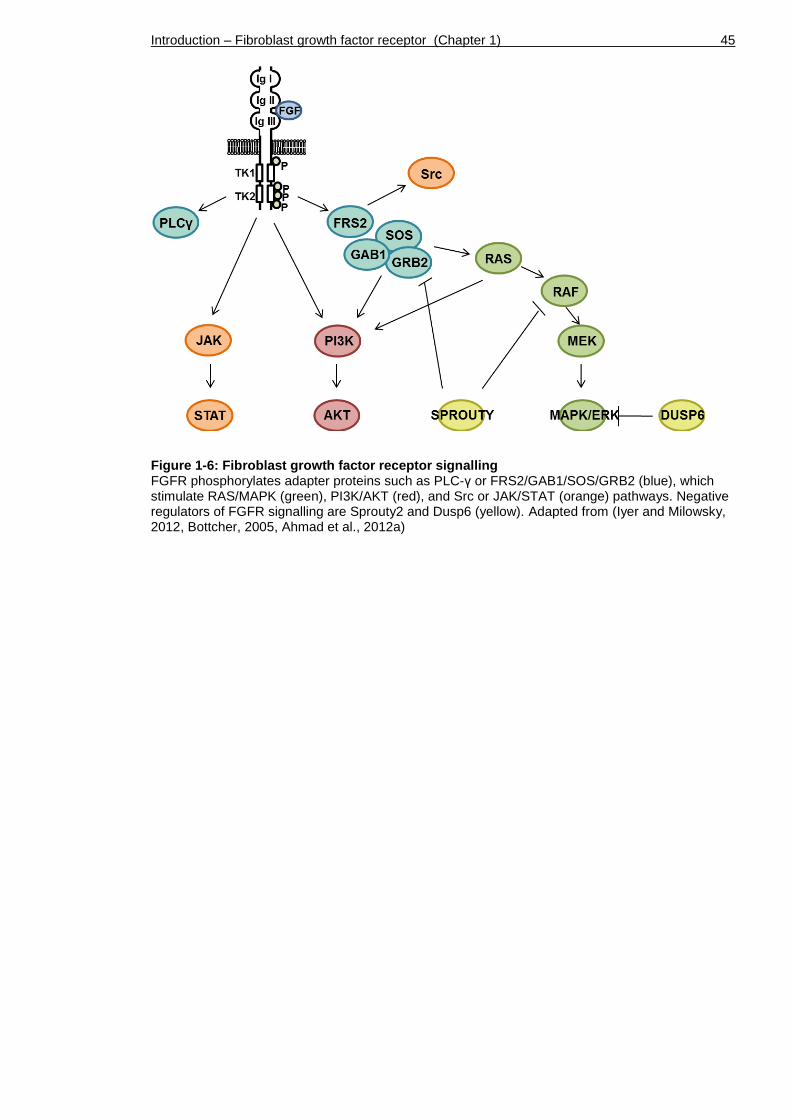
Introduction – Fibroblast growth factor receptor (Chapter 1) 45
Figure 1-6: Fibroblast growth factor receptor signalling FGFR phosphorylates adapter proteins such as PLC-γ or FRS2/GAB1/SOS/GRB2 (blue), which stimulate RAS/MAPK (green), PI3K/AKT (red), and Src or JAK/STAT (orange) pathways. Negative regulators of FGFR signalling are Sprouty2 and Dusp6 (yellow). Adapted from (Iyer and Milowsky, 2012, Bottcher, 2005, Ahmad et al., 2012a)
Introduction – Fibroblast growth factor receptor (Chapter 1) 46
1.3.2 Negative regulation of FGFRs
FGFR signalling can be regulated in the extracellular space, and at the
transmembrane level, as well as within the cell.
Well-known negative regulators of FGFR signalling are Sprouty (SPRY) family
members, which disrupt downstream signalling by binding to GRB2 or RAF (Figure
1-6) (Hacohen et al., 1998). Furthermore, MAPK phosphatase 3 (MKP3; DUSP6)
and ‘Similar to FGF’ (SEF) proteins can compete for binding sites or directly
inhibit downstream signalling by dephosphorylation (Kovalenko et al., 2003, Li et
al., 2007).
FGFR gene expression can be transcriptionally regulated by certain microRNAs.
For example, mir-99, which is found downregulated in various human cancers,
targets FGFR3 at the post-transcriptional level for its degradation (Oneyama et
al., 2011, Catto et al., 2009, Kang et al., 2012).
1.3.3 FGFRs in cancer
Mutations in FGFR or receptor overexpression have been implicated to play a
role in several cancer types, including multiple myeloma, cervical, prostate,
breast, lung, gastric cancer and melanoma (Ahmad et al., 2012a, Wesche et al.,
2011, Turner and Grose, 2010).
FGFR1 amplification is found in 17% of squamous cell carcinoma (Freier et al.,
2007), 21% of lung adenocarcinoma (Dutt et al., 2011), and in up to 10% of
breast cancer (Jacquemier et al., 1994). FGFR1 overexpression has also been
shown to play a role in tumourigenesis of the prostate (Sahadevan et al., 2007).
Interestingly, overexpression of FGFR1 is also found in urothelial cell carcinoma
across all stages and grades (Tomlinson et al., 2009).
FGFR2 is found amplified in 10% of gastric cancers (Jang et al., 2001, Kunii et
al., 2008) and 12% of endometrial cancers (Pollock et al., 2007). Overexpression
of FGFR2 has also been shown to increase the susceptibility to breast cancer
(Meier et al., 2008), indicating similar oncogenic properties to FGFR1 and 3. On
the other hand, FGFR2 has also been suggested to act as a tumour suppressor,
since expression of the receptor was found downregulated in a number of cancer
Introduction – Fibroblast growth factor receptor (Chapter 1) 47
types, including bladder, liver, salivary glands, prostate and melanoma (Amann
et al., 2010, Diez de Medina et al., 1997, Naimi et al., 2002, Gartside et al.,
2009). It is currently unclear whether FGFR2 is a tumourigenesis promoting or
suppressing factor, or whether it may exhibit those opposite characteristics in a
context-dependent manner (Ahmad et al., 2012a).
FGFR3 mutations have been identified in several cancer types, including multiple
myeloma, cervical and bladder cancer (Chesi, 2001, Cappellen et al., 1999,
Billerey et al., 2001). The functional role of FGFR3 mutation in tumour
formation was first demonstrated multiple myeloma (Chesi, 2001), skin
hyperplasia in transgenic mice overexpressing mutant FGFR3 (Logie, 2005),
induction of transformation of transfected cell lines (Bernard-Pierrot et al.,
2006) and in xenograft models (Qing et al., 2009, Bernard-Pierrot et al., 2006).
The role of FGFR3 in bladder cancer is discussed in more detail in (Chapter
1.3.4.1).
FGFR4 is mutated in 7-8% of soft tissue sarcoma (Taylor et al., 2009) and has
been described as a potential driver of tumour growth in human breast tissue
(Roidl et al., 2010). Overexpression of FGFR4 has also been shown to play a role
in tumourigenesis of the prostate (Murphy et al., 2010, Sahadevan et al., 2007).
Moreover, high levels of FGF expression have been detected in several cancers,
including FGF3, FGF8 and FGF10 in breast carcinoma (Theodorou et al., 2004,
Naidu et al., 2001, Marsh et al., 1999). Elevated levels of FGF2 are found in
bladder cancer (Marzioni et al., 2009, Cheng et al., 2013). Upregulation of FGF1,
FGF2, FGF6, FGF7, FGF8 and FGF9 levels are detectable in prostate cancer
(Kwabi-Addo et al., 2004).
Taken together, the reports on genetic mutations and altered expression levels
of FGFs and their receptors indicate a major role for FGF signalling in the
development of a number of cancers.
Introduction – Fibroblast growth factor receptor (Chapter 1) 48
1.3.4 Fibroblast growth factor receptor 3 (FGFR3)
FGFR3 is well-known to play a vital role in bone development and growth
(Bottcher, 2005). Activating FGFR3 mutations in the germ line can cause several
forms of dwarfism, such as hypochondroplasia, achondroplasia and thanatophoric
dysplasia and malformation of the cerebral cortex (Laederich and Horton, 2012,
Iwata and Hevner, 2009, Iwata et al., 2000). In mice it has been shown that loss
of FGFR3 leads to a neonatally lethal form of dwarfism (Colvin et al., 1996).
Tissue-specific alternative splicing events give rise to two major FGFR3 isoforms,
which differ in their Ig-like domains (Ig III) but share the same structure in their
tyrosine kinase domains (Chellaiah et al., 1994). Isoforms IIIb and IIIc therefore
vary in their ligand-receptor binding specificity (Chellaiah et al., 1994, Miki et
al., 1992). FGFR3IIIb for example shows higher affinity for FGF1 (aFGF) and FGF7
(KGF), but a lower affinity for FGF8 and FGF9, while FGFR3IIIc binds FGF1, FGF2,
FGF4, FGF8 and FGF9 (Chellaiah et al., 1994, Ahmad et al., 2012a). The
FGFR3IIIb splice variant appears to be expressed in epithelial lineages whereas
FGFR3IIIc is predominantly expressed in fibroblastic cells (Scotet and Houssaint,
1995).
Based on quantitative RT-PCR, FGFR3 is 20 times higher expressed than any
other FGFR in the urothelium (Tomlinson et al., 2005). FGFR3 mRNA levels were
higher in epithelial cells, namely the urothelium, of the normal non-neoplastic
bladder (Cheng et al., 2013).
1.3.4.1 FGFR3 in bladder cancer
Activating FGFR3 mutations and overexpression of the wild type receptor are
two major mechanisms which are associated with urothelial tumourigenesis (Iyer
and Milowsky, 2012). Enhanced receptor signalling poses a proliferation and
survival advantage to urothelial cells (di Martino et al., 2009). Around 80% of
non-invasive and more than 50% of invasive urothelial cell carcinomas present
with alterations in FGFR3 signalling either by mutation, overexpression or both
(Iyer and Milowsky, 2012).
Introduction – Fibroblast growth factor receptor (Chapter 1) 49
1.3.4.2 FGFR3 mutation
FGFR3 mutations are found in 60-80% of non-invasive urothelial cell carcinoma
(Billerey et al., 2001, Cappellen et al., 1999, Tomlinson et al., 2007a, van Rhijn
et al., 2012). Muscle-invasive tumours of high grade carry FGFR3 mutations in
only 10-15% of the cases (Billerey et al., 2001). FGFR3 wild type tumours are
generally associated with higher grade and higher stage compared to tumours
with FGFR3 mutation (Bernard-Pierrot et al., 2006).
Presence of an FGFR3 mutation in bladder cancer patients has been linked to
favourable patient prognosis, as it is associated with low grade/stage pTa
tumours (van Rhijn et al., 2012, Billerey et al., 2001, Hernandez et al., 2006).
Previous studies have shown association between FGFR3 mutation in non-
invasive papillary tumours of low grade with a higher risk of recurrence
(Hernandez et al., 2006, Hernandez et al., 2005). Non-invasive papillary tumours
of high grade, on the other hand, were not associated with recurrence or
progression in patients (Hernandez et al., 2006, Hernandez et al., 2005).
However, in a more recent study, no association was found between FGFR3
mutational status and recurrence, progression or muscle invasion (Ploussard et
al., 2011).
FGFR3 mutations in urothelial cell carcinoma can occur at different codons in
the extracellular domain, the transmembrane domain, or the cytoplasmic
tyrosine kinase domain, which can cause various changes in the receptor and
aberrant signalling (Tomlinson et al., 2007a, di Martino et al., 2009).
Common FGFR3 mutations are S249C (~66%) and R248C (~10%) leading to changes
in the extracellular domain; Y373/375C (~15%) and G370/372C (~4%) occurring in
the transmembrane domain; and K650/K652E (<2%) altering the cytoplasmic
tyrosine kinase domain (Tomlinson et al., 2007a, Hernandez et al., 2006,
Bernard-Pierrot et al., 2006) (Figure 1-7).
The most frequent mutation in FGFR3, S249C, accounts for ~66% of human non-
invasive urothelial cell carcinoma with FGFR3 mutant status (Tomlinson et al.,
2007a, Duenas et al., 2013, Bernard-Pierrot et al., 2006). S249C is a point

Introduction – Fibroblast growth factor receptor (Chapter 1) 50
mutation leading to a serine to cysteine exchange at position 249 in the linker
region between the extracellular immunoglobulin-like domains Ig2 and Ig3 (d'Avis
et al., 1998, Adar et al., 2002). S249C mutation triggers kinase activation
through constitutive receptor dimerisation as a result of a higher level of
disulfide bond formation in a completely ligand-independent manner (d'Avis et
al., 1998, di Martino et al., 2009).
A less frequent mutation (<2%) in FGFR3, K650E or K652E, leads to highly
activated receptor signalling (Naski et al., 1996, Tomlinson et al., 2007a). K650E
constitutes a point mutation in the tyrosine kinase (TK) domain, leading to a
lysine to glutamic acid exchange at position 650 in the TK activation loop
(Tavormina et al., 1995). K650E mutation causes a conformational change in the
receptor which favours autophosphorylation (Naski et al., 1996). K650E mutant
receptor signalling shows increased mitogenic activity, which is partially ligand-
independent, meaning it can be further enhanced by FGF binding (Naski et al.,
1996).
Figure 1-7: Mutations in Fibroblast growth factor receptor 3 (FGFR3) Common FGFR3 mutations are found in the immunoglobulin (Ig)-like domain (S249C, R248C), in the transmembrane domain (Y375C, G372C), and in the tyrosine kinase domain (K652E, K652M). Adapted from (Iyer and Milowsky, 2012)

Introduction – Fibroblast growth factor receptor (Chapter 1) 51
1.3.4.3 FGFR3 overexpression
Overexpression of FGFR3 protein is also frequently found in urothelial cell
carcinoma; however between the reports there is variation in terms of
stage/grade association. For example, one study reported overexpression of
FGFR3 protein in 49% of the bladder tumours, but no statistically significant
stage or grade association was found (Matsumoto et al., 2004).
In bladder carcinomas with unknown FGFR3 mutation status, elevated FGFR3
expression was associated with non-invasive tumours of low-grade and early
stage (Mhawech-Fauceglia et al., 2006, Tomlinson et al., 2007a). Another group
reported 73% of non-invasive papillary carcinomas with unknown mutation status
showed FGFR3 overexpression across all stages (Gomez-Roman et al., 2005).
When FGFR3 expression levels were examined in relation to FGFR3 mutation
status, correlation between receptor overexpression and presence of FGFR3
mutation was indeed demonstrated, but the study lacked information on stage
or grade of these tumours (Bernard-Pierrot et al., 2006).
A later study confirmed that bladder carcinomas with known FGFR3 mutation are
associated with FGFR3 overexpression, with 85% of the tumours showing strong
FGFR3 expression (Tomlinson et al., 2007a). These tumours were predominantly
non-invasive papillary carcinomas of low grade and early stage, demonstrating
for the first time correlation between FGFR3 mutation, receptor overexpression,
and low grade/early stage association.
On the other hand, the same study also reported overexpression of FGFR3 in 42%
of carcinomas with non-mutated wild type receptor, with the majority being
high-grade muscle-invasive tumours (Tomlinson et al., 2007a).
Given the high frequency activating FGFR3 mutations and overexpression of the
wild type receptor in bladder cancer, it would be essential to further elucidate
the functional importance of the receptor signalling in the urothelium and
urothelial tumours. We will address this by using two different mouse models
harbouring murine Fgfr3 K644E or human FGFR3 S249C mutation.
Introduction – Fibroblast growth factor receptor (Chapter 1) 52
1.3.4.4 FGFR3 downregulation
Interestingly, two studies have also reported tumour suppressive properties of
FGFR3. In one, FGFR3 protein expression was downregulated in colorectal cancer
(Sonvilla et al., 2010). In a second study, FGFR3 overexpression had tumour
suppressive effects on pancreatic cancer (PDAC) cell lines (Lafitte et al., 2013).
Interestingly, there is association between FGFR3 loss and tumour stage in high-
grade urothelial bladder cancers (Billerey et al., 2001, Tomlinson et al., 2007a,
van Rhijn et al., 2012). Although yet unclear, it is possible that FGFR3 can either
promote or suppress tumour development or progression in a context-dependent
manner.
1.3.5 FGFR as a target of therapy
Inhibitors of FGF signalling have increasingly been developed to target many
types of cancer (Brooks et al., 2012, Liang et al., 2013). Inhibition of FGFR has
been suggested as a therapeutic option in urothelial cell carcinoma (Lamont et
al., 2011, Tomlinson et al., 2007b). Several novel drugs against FGFRs including
monoclonal antibodies, small-molecule inhibitors as well as ligand traps have
been developed and show effectiveness in cell lines and xenograft models. An
advantage of monoclonal antibodies is that they can be designed to specifically
target one single type of FGFR; therefore, the dose-level can be maximised.
Small-molecule inhibitors on the other hand cross-inhibit all FGFRs. A
disadvantage of pan-FGFR3 inhibition is that this can cause more side-effects in
the patient such as nausea or diarrhoea due to the involvement of FGFR
pathways in phosphate and vitamin D homeostasis (Brooks et al., 2012).
R3Mab is a monoclonal antibody against wild type and mutant forms of FGFR3IIIb
and IIIc, which has been shown to exhibit anti-tumour activity against bladder
carcinoma and multiple myeloma xenografts in mice (Qing et al., 2009). R3Mab
prevents FGF-binding as well as receptor dimerisation by inducing a
conformational change to the receptor (Qing et al., 2009). NVP-BGJ398 is a
small-molecule inhibitor of pan-FGFR (FGFR 1, 2 and 3) which showed significant
inhibition of angiogenesis, tumour cell proliferation, and induction of tumour
cell death in bladder cancer xenografts that overexpress wild type FGFR3
(Guagnano et al., 2011). NVP-BGJ398 prevents receptor phosphorylation and can
have cytostatic or cytotoxic properties in a cell-dependent manner (Guagnano et
Introduction – Fibroblast growth factor receptor (Chapter 1) 53
al., 2011). AZD4547, also a small-molecule inhibitor of pan-FGFR (FGFR 1, 2 and
3), showed anti-tumour activity in FGFR-overexpressing tumour cell lines
including acute myeloid leukemia, breast cancer and multiple myeloma (Gavine
et al., 2012). Similarly to NVP-BGJ398, AZD4547 prevents receptor
phosphorylation and can have cytostatic or cytotoxic properties in a cell-
dependent manner (Gavine et al., 2012). All of the named drugs are currently
being used in clinical trials (Brooks et al., 2012, Liang et al., 2013).
However, it needs to be kept in mind that the role of FGFR3 as a promoter or
suppressor of tumourigenesis is not entirely elucidated and may be context-
dependent (Chapter 1.3.4.4.). FGFR3-targeted therapy therefore needs to be
considered individually with caution.
A major limitation to the clinical development of FGFR inhibitors is the
resistance mechanisms of tumours against FGFR3-targeted therapy. Inhibition of
the FGFR3 pathway using parallel siRNA screens has been shown to trigger EGFR
pathway activation as an escape mechanism (Herrera-Abreu et al., 2013). EGFR
dominated the downstream signalling through repression of mutant FGFR3
expression. A reciprocal relationship was shown between FGFR and EGFR,
demonstrated by upregulation of EGFR following FGFR inhibition and FGFR
upregulation following EGFR inhibition. It was speculated that FGFR3 may
initiate cancer development until at some point increased EGFR signalling
dominates and represses FGFR signalling (Herrera-Abreu et al., 2013). Activation
of the alternative receptor was capable of partially compensating for loss of the
drug-targeted receptor tyrosine kinase signalling, which therefore constitutes a
resistance mechanism that is of major clinical relevance in cancers where EGFR
or FGFR are targeted. Another possible mechanism of acquired resistance to
FGFR inhibition is the emergence of a second mutation site in FGFR3 as shown
recently (Chell et al., 2013). In this study, human multiple myeloma cell lines
with drug resistance to AZ4547 were generated. Sequencing then revealed the
emergence of FGFR3 V555M as a gatekeeper mutation to evade FGFR3 inhibition
(Chell et al., 2013). Similarly, FGFR3-dependent malignant melanoma cell lines
have shown to gain resistance to NVP-BGJ398 (pan-FGFR) small-molecule
inhibition by acquiring BRAFV600E or KRAS mutation (Guagnano et al., 2012).

Introduction – Fibroblast growth factor receptor (Chapter 1) 54
For a translational benefit, further studies of the FGFR3 signalling pathway and
its inhibitors are therefore essential and will aid the development of therapies
for both non muscle-invasive and muscle-invasive bladder cancer with
deregulation of FGF signalling.
Introduction – Modelling bladder cancer in vivo and in vitro (Chapter 1) 55
1.4 Modelling bladder cancer in vivo and in vitro
The progress of medical research relies on the generation and use of suitable
animal models. Therefore, different strategies have been employed to induce
bladder tumourigenesis using approaches such as xenografts, carcinogen-induced
models as well as genetically engineered mouse (GEM) models (Chan et al.,
2009a). The incidence of spontaneous bladder tumours in mice is very low (<1 %)
and is therefore not suitable as an investigational strategy (Oliveira et al.,
2006). Experimental models of urothelial cell carcinoma also include cell culture
of human primary tumour cells or bladder cancer cell lines for investigation in
vitro. Cell culture provides the opportunity to analyse cancer initiation and
progression, as well as the effectiveness of therapeutic drugs in a controlled
environment.
1.4.1 Cell culture
Non-invasive human bladder cancer cell lines with superficial papillary
characteristics include RT112, 97-7 and Ku-7 (Table 1-3). RT112 is derived from
a non-invasive papillary urothelial cell carcinoma of histological grade 2 (G2) in a
female Caucasian (ATCC, American Type Culture Collection). RT112
overexpresses FGFR3 with no detectable point mutations (Qing et al., 2009). 97-
7 is derived from a non-invasive urothelial cell carcinoma of histological grade 2-
3 (G2-3) in a female Caucasian, and carries an FGFR3 S249C mutation (Qing et
al., 2009). Ku-7 is derived from a superficial papillary carcinoma of low grade
with no detectable FGFR3 mutation (COSMIC, Catalogue of Somatic Mutations in
Cancer database 2013).
Invasive human bladder cancer cell lines with advanced stage and aggressive
growth behaviour include T24, EJ138, RT4, KU-19-19 and UM-UC3 (Table 1-3).
T24 is derived from an invasive urothelial cell carcinoma of grade 3 (G3) in a
female Caucasian and carries a homozygous mutation in HRAS and TP53 (COSMIC,
2013). EJ138 is in fact T24 (or sometimes referred to as MGH-U1), which has
been shown by isoenzyme analysis and HLA profiles (O'Toole et al., 1983). RT4 is
derived from a well-differentiated grade 1 (G1) but muscle-invasive urothelial
cell carcinoma in a male Caucasian, and carries a homozygous mutation in
CDKN2A and TSC1 (ATCC and COSMIC, 2013). RT4 overexpresses FGFR3 with no
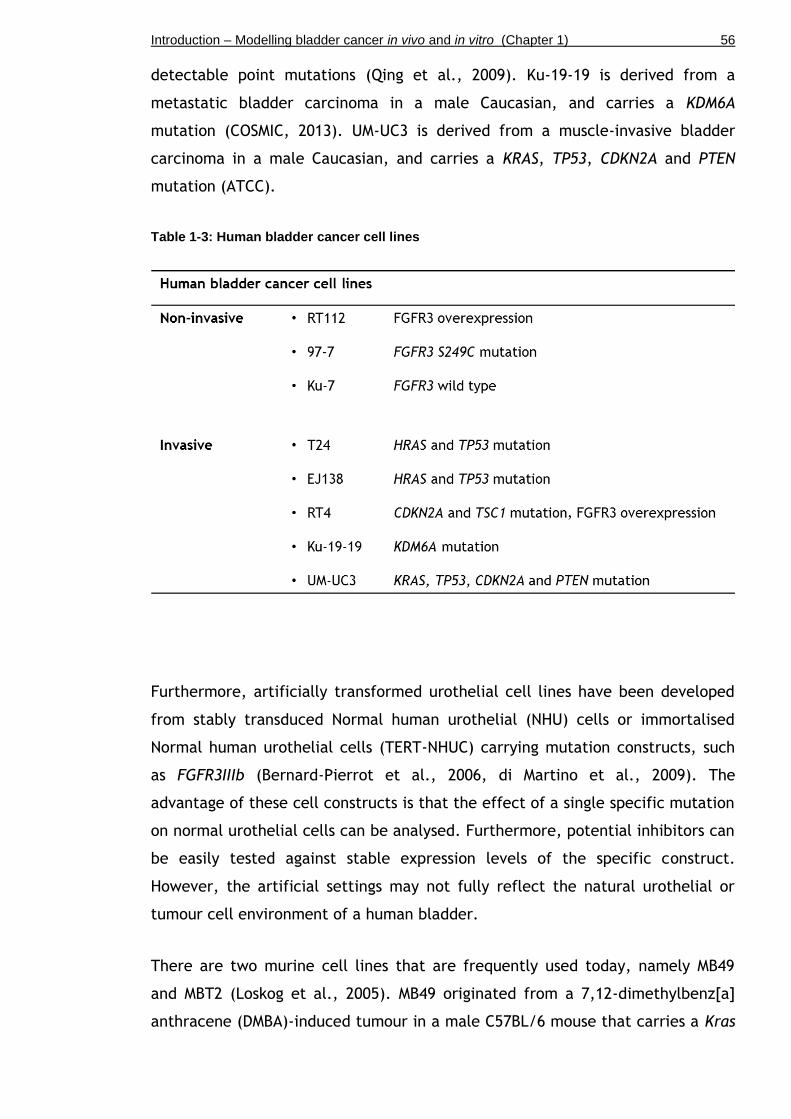
Introduction – Modelling bladder cancer in vivo and in vitro (Chapter 1) 56
detectable point mutations (Qing et al., 2009). Ku-19-19 is derived from a
metastatic bladder carcinoma in a male Caucasian, and carries a KDM6A
mutation (COSMIC, 2013). UM-UC3 is derived from a muscle-invasive bladder
carcinoma in a male Caucasian, and carries a KRAS, TP53, CDKN2A and PTEN
mutation (ATCC).
Table 1-3: Human bladder cancer cell lines
Furthermore, artificially transformed urothelial cell lines have been developed
from stably transduced Normal human urothelial (NHU) cells or immortalised
Normal human urothelial cells (TERT-NHUC) carrying mutation constructs, such
as FGFR3IIIb (Bernard-Pierrot et al., 2006, di Martino et al., 2009). The
advantage of these cell constructs is that the effect of a single specific mutation
on normal urothelial cells can be analysed. Furthermore, potential inhibitors can
be easily tested against stable expression levels of the specific construct.
However, the artificial settings may not fully reflect the natural urothelial or
tumour cell environment of a human bladder.
There are two murine cell lines that are frequently used today, namely MB49
and MBT2 (Loskog et al., 2005). MB49 originated from a 7,12-dimethylbenz[a]
anthracene (DMBA)-induced tumour in a male C57BL/6 mouse that carries a Kras
Introduction – Modelling bladder cancer in vivo and in vitro (Chapter 1) 57
mutation (Summerhayes and Franks, 1979). MBT2 is derived from a N-(4,5-nitro-
2-furyl-2-thiazolyl)-formamide (FANFT)-induced bladder tumour in C3H mice that
carries p53 deficiency (Rikenbase, Japan, 2013)
1.4.2 Orthotopic models
Since cell culture cannot model the stroma and the complex microenvironment
of a tissue or a tumour in vitro, techniques have been developed to inject
cancer cells into living hosts by subcutaneous grafting or orthotopic injection
directly into the organ. Therefore, in the case of bladder cancer, orthotopic
models involve the implantation of primary tumour cells or cell lines directly
into the urinary bladder of mice by catheterisation or laparotomy.
Orthotopic models are divided in two categories, namely xenograft and
syngeneic models. In orthotopic xenograft models, human bladder cancer cells
are implanted into nude mice. Human cell lines include KU7, KU19, T24 and UM-
UC3, which resulted in tumour formation (Watanabe et al., 2000, Jurczok et al.,
2008). A disadvantage of a xenograft model is that the immune response of the
host cannot be assessed, which plays an important role in regulating tumour
growth. In orthotopic syngeneic models, murine bladder cancer cells are
implanted into immunocompetent mice (Summerhayes and Franks, 1979,
Gunther et al., 1999). The disadvantage of syngeneic models is that the
introduced cancer cells are of murine origin that may not fully reflect human
neoplasms, and that the resulting tumours tend to grow fast.
Further limitations of orthotopic models are that they may differ from the
original tumour in terms of morphology, growth behaviour and signalling
characteristics, since cell lines in culture can acquire additional mutations over
time and therefore undergo functional changes (Gabriel et al., 2007).
Furthermore, the instillation procedure can be challenging as it involves either
catheterisation of female mice or surgical laparotomy, both of which require
general anaesthesia. Moreover, the tumour “take” rate in mice can vary from
30-100%, depending on the cell line, genetic background of the mice, and pre-
treatment conditioning (Chan et al., 2009a).

Introduction – Modelling bladder cancer in vivo and in vitro (Chapter 1) 58
1.4.3 Carcinogen-induced models
Over the past 30 years, much effort has been made to model invasive urothelial
cell carcinoma in mice using bladder-specific carcinogens (Becci et al., 1981,
Ohtani et al., 1986, McCormick et al., 1981).
Three chemicals have been shown to be most effective, namely FANFT (N-(4,5-
nitro-2-furyl-2-thiazolyl)-formamide), MNU (N-methyl-N-nitrosurea), and OH-BBN
(N-butyl-N-(4-hydroxybutyl) nitrosamine) (Oliveira et al., 2006). FANFT is a
nitrofuran, which induces invasive and metastatic bladder neoplasms that often
exhibit squamous cell transformation (Soloway, 1977, Cohen et al., 1976).
However, administration of FANFT via the diet requires 8-11 months for tumour
induction and progression (Erturk et al., 1970). MNU is an alkylating agent that
transfers methyl groups to nucleobases, which can generate derivatives such as
6-O-methylguanine that can provoke transition mutations (PubChem Compound
NCBI, 2014). MNU can trigger tumourigenesis of the urothelium upon a single
dose via catheterisation (Kunze et al., 1989, Steinberg et al., 1991). For health
and safety reasons, FANFT and MNU have been widely replaced by OH-BBN,
which is derived from tobacco smoke, and which has now become one of the
most well studied bladder carcinogens in mice (Becci et al., 1981, Ohtani et al.,
1986).
Although OH-BBN is administered systemically by gavage or in drinking water, it
induces tumourigenesis specifically in the urothelium (Becci et al., 1981, Ohtani
et al., 1986, McCormick et al., 1981, He et al., 2012). The reason for bladder-
specificity is not entirely clear, but it is speculated that this may be due to
prolonged exposure in the bladder, presence (or absence) of metabolic enzymes
that activate (or detoxify) OH-BBN in the bladder as compared to other organs,
or lower DNA repair capacity of urothelial cells compared to non-urothelial cells
(He et al., 2012).
OH-BBN causes different histological lesions in mouse and rat bladder models. In
rats, OH-BBN administration promotes mainly superficial non-invasive tumours
(Fukushima et al., 1976, Dunois-Larde et al., 2005). In mice, OH-BBN-induced
tumours present with similar histology to advanced human urothelial cell
carcinoma (Becci et al., 1981, McCormick et al., 1981, Ohtani et al., 1986). They
Introduction – Modelling bladder cancer in vivo and in vitro (Chapter 1) 59
are generally of highly invasive nature and often show a mixed histology with
features of both urothelial cell carcinoma and squamous cell differentiation
(Becci et al., 1981, McCormick et al., 1981, Yamamoto et al., 1998). Similar to
observations in human bladder cancer, OH-BBN causes clonally independent
multifocal urothelial tumours in the same bladder (Yamamoto et al., 1998).
Within these, an individual tumour generally originates from the same precursor
cell and is therefore monoclonal (Yamamoto et al., 1998).
OH-BBN tumours also show a similar molecular profile that is comparable to
invasive human bladder tumours (Williams et al., 2008). Strikingly, TP53
mutations are frequent events (~80%) in OH-BBN-induced invasive carcinomas
(Ogawa et al., 1998, Yamamoto et al., 1997, Yamamoto et al., 1995). Mutations
in the Hras gene were reported to be low (Ogawa et al., 1998, Yamamoto et al.,
1995). Consistent with the genetic profile of human invasive bladder carcinomas,
activating FGFR3 mutations are a rare event in invasive tumours induced by OH-
BBN in mice (Billerey et al., 2001, Dunois-Larde et al., 2005).
Analysis of gene expression in OH-BBN-induced tumours showed differential
expression of cell cycle regulating genes such as p53, and signalling pathways
involving RAS, EGFR, TGF-β (el-Marjou et al., 2000, Yao et al., 2004). In human
invasive carcinomas EGFR is found overexpressed in up to 50% of the tumours
(Colquhoun and Mellon, 2002). Similarly, in invasive OH-BBN-induced mouse
tumours, EGFR is frequently found overexpressed (el-Marjou et al., 2000, Yao et
al., 2004).
Overall, mouse models of chemically induced bladder cancer are excellent
models to investigate the mechanisms of urinary bladder carcinogenesis, since
they promote tumourigenesis in a bladder-specific fashion and recapitulate
tumour development in well-defined stages from carcinoma in situ (CIS) to
invasive carcinoma. However, tumour induction and progression in carcinogen-
induced models can take as long as 8-14 months. Furthermore, the experiments
require adequate health and safety regulations for the involved staff.

Introduction – Modelling bladder cancer in vivo and in vitro (Chapter 1) 60
1.4.4 Genetically engineered models
Genetically engineered mice (GEM) have significantly advanced the
understanding of urothelial cell carcinoma at the molecular level over the past
20 years (Frese and Tuveson, 2007). GEM include transgenic mice, knock-in and
knock-out mice, as well as a variety of genetic modification tools to achieve
tissue-specificity and/or temporal induction of the genetic modification (Frese
and Tuveson, 2007).
1.4.4.1 Generation of GEM
Transgenic mice are generated by pronuclear injection, by which foreign
homologous DNA is injected into the pronucleus of a zygote that is subsequently
transplanted into a foster female (Gordon and Ruddle, 1981). Transgene
integration, however, takes place in a random manner. Thus, the integration
site, copy number and integration pattern are usually not predictable.
Endogenous GEM such as knockin and knockout mice are generated by targeted
recombination via embryonic stem (ES) cell injection. In this procedure,
embryonic stem cells are isolated from a blastocyst and cultured in vitro. A
plasmid with the gene of interest is introduced into the ES cells by
electroporation where the sequence integrates into the host genome by
homologous recombination. Recombined cell clones are then selected against a
toxin to which they are resistant through a resistance gene introduced by the
plasmid. Successfully recombined and selected ES cells are injected into a
blastocyst and subsequently implanted into a pseudopregnant foster female
(Capecchi, 1994). Replacement by the artificial construct can lead to complete
disruption of the endogenous gene in the case of a targeted tumour suppressor,
or to mutant protein expression at physiological levels in the case of an
introduced oncogenic mutation.
Constitutive knockouts present the introduced genetic modification in all cells of
the body. A variety of conditional modification tools have been engineered in
order to achieve tissue-specificity or time-specific gene alteration, for example
the Cre/loxP recombination technology or the inducible CreER-T system (Nagy,
2000).
Introduction – Modelling bladder cancer in vivo and in vitro (Chapter 1) 61
The Cre/loxP system utilises the Cre recombinase enzyme, which targets two
specific sequences loxP sequences placed before and after the gene of interest
in order to excise it from its original location (Nagy, 2000). The CreER-T system
is used to generate inducible knockins and knockouts in order to control
temporal activity. The system is based on a fusion protein of CMV/Cre with a
mutant ligand-binding domain of the estrogen receptor (ER). Therefore, Cre
expression can specifically be activated by treatment with tamoxifen, an ER
antagonist, providing a time-specific switch between a wild type and a mutant
state.
1.4.4.2 Cre promoters
The expression of the gene of interest can be modulated by the nature of the
promoter that controls Cre expression. For example, constitutive GEM can be
generated using a ubiquitous promoter for Cre expression, whereas conditional
GEM carry a tissue-specific promoter to express Cre in only one specific cell
type.
In order to express Cre recombinase in the bladder, a number of tissue-specific
promoters have been employed. The Uroplakin II (UroII) promoter is one of the
most frequently used promoters of transgene expression in the urinary bladder.
UroplakinII is expressed in mice in umbrella and intermediate cells (Choi et al.,
2009, Lin et al., 1995, Kong, 2004) from embryonic day 16 (E16)
(Oottamasathien et al., 2007). The UroII promoter has been used to promote the
expression of Cre enzyme for loxP-specific gene targeting in knockin and
knockout models (Ahmad et al., 2012b). Furthermore, the UroII promoter has
been used to directly promote the expression of oncogenes such as SV40T, Hras
and Egfr without the use of Cre recombinase expression (Zhang et al., 1999,
Zhang et al., 2001, Cheng et al., 2002).
Recently, it was found that the original promoter contained a region of UroII
that was oppositely inserted, which may result in a differential expression
pattern of Uroplakin. Therefore, a modified Uroplakin II promoter has been
cloned to express Cre (UPKIICre) with the correct insertion (Ayala de la Pena et
al., 2011). This new UPKIICre promoter has shown differences in the effects of
Cre-mediated recombination in the bladder compared to the original UroIICre

Introduction – Modelling bladder cancer in vivo and in vitro (Chapter 1) 62
promoter. For example, mice expressing SV40T under the UPKII promoter
developed CIS only (Ayala de la Pena et al., 2011), while SV40T under the
UroIICre promoter resulted in muscle-invasive bladder cancer (Grippo and
Sandgren, 2000, Zhang et al., 1999).
Other Cre drivers in the urothelium include the fatty acid-binding protein (Fabp)
promoter, which drives Cre expression in all cell layers of the urothelium as well
as in the renal calyces and pelvis, ureters, and small intestinal and colonic
epithelium (Saam and Gordon, 1999, Tsuruta, 2006). Shh-Cre is primarily active
in a subgroup of urothelial basal cells; but it is also expressed in the prostate
(Shin et al., 2011). CK5-and ΔNp63-Cre have been used to drive the expression of
the recombinase in the urothelium (Pignon et al., 2013, Gandhi et al., 2013).
However, CK5 and p63 are also commonly expressed in the skin (Di Como et al.,
2002, Moll et al., 2008). A relatively novel technique has been developed to
deliver Cre recombinase to the urothelium using a Cre-expressing adenovirus
(AdenoCre; AdCre) (Puzio-Kuter et al., 2009). In contrast to promoter-based Cre
expression, AdenoCre allows transduction and recombination of a specific
number of cells (see also Introduction to Chapter 6).
1.4.4.3 Advantages and disadvantages of GEM
The advantages of GEM are that candidate tumour suppressor genes or
oncogenes can be deleted or mutated singly or in combination, constitutively or
conditionally, and thereby model the conditions of known cancer signalling
pathways. On the other hand, tumours of GEM models often show less
heterogeneity than is generally found in human tumours (Ahmad et al., 2012b).
Secondly, the cancer cell of origin may not be the same as in the humans since
the location of tumourigenesis strongly depends on the promoter that is used.
Furthermore, due to the fact that only a small number of candidate mutations
are introduced, GEM models may not represent the full spectrum of mutations
and genome-wide alterations that are seen in human tumours. Finally, GEM
models often have long latency and incomplete penetrance. Furthermore,
depending on the nature of the promoter that is used, the introduced constructs
may be expressed at non-physiological levels (Ahmad et al., 2012b).

Introduction – Modelling bladder cancer in vivo and in vitro (Chapter 1) 63
1.4.4.4 Human bladder cancer genetics in mice
Fgfr3 models
Given the preponderance of FGFR3 mutations in urothelial cell carcinoma, a
number of attempts have been made to model this event in the mice.
Surprisingly, as yet these attempts have failed to produce a mouse model of
tumourigenesis that recapitulates human tumourigenesis. Much of this study will
be investigating why this is the case and how we could generate models that
develop tumours driven by FGFR3.
It has been shown in mice that Fgfr3 K644E mutation alone under the control of
Uroplakin II promoter to drive Cre expression in the urothelium (UroIICre
Fgfr3+/K644E) did not result in urothelial tumourigenesis by 18 months (Ahmad et
al., 2011c), indicating that mutant FGFR3 alone it is insufficient to drive
urothelial tumourigenesis.
Fgfr3 mutation in combination with Kras activation under the control of UroIICre
(UroIICre Fgfr3+/K644E Kras+/G12D) also failed to produce tumours by 12 months
(Ahmad et al., 2011c), indicating that FGFR3 and KRAS do not cooperate in
driving urothelial tumourigenesis. This result supports the finding that FGFR3
and HRAS are unlikely to occur together in human bladder tumours (Jebar et al.,
2005). However, UroIICre Fgfr3+/K644E Kras+/G12D mice developed skin papilloma
due to unexpected UroII promoter activity in the skin (Ahmad et al., 2011c),
indicating a functional role of activated FGFR3 signalling in contributing to
tumourigenesis.
Similarly, Fgfr3 mutation in combination with ß-catenin activation (UroIICre
Fgfr3+/K644E ß-catenin+/exon3) did not result in urothelial tumourigenesis (Ahmad et
al., 2011c). However, these mice developed lung carcinoma due to UroII
promoter activity in the lung. These results support that FGFR3 plays a
functional role in tumourigenesis in the presence of cooperating mutations in a
tissue-specific fashion.
One potential reason why these studies did not observe urothelial cancer could
be that they were using an Fgfr3 K644E mutation that is relatively uncommon in
bladder cancer. Thus in this study we will assess whether the most common

Introduction – Modelling bladder cancer in vivo and in vitro (Chapter 1) 64
FGFR3 mutation in bladder cancer, S249C, might be more tumour promoting in
this system.
Egfr models
The effect of other receptor tyrosine kinases such as EGFR that stimulate the
RAS/MAPK pathway in a similar manner as FGFR3 has extensively been
investigated in the mouse bladder.
Overexpression of EGFR using the UroII promoter (UroII EGFR+) has been shown
to produce urothelial hyperplasia in mice around 10 months of age, without
progression to carcinoma (Cheng et al., 2002).
EGFR activation in combination with HRAS activation (UroII EGFR+ Hras Q61L) did
not promote neoplastic progression of the hyperplastic urothelium by 10 months
(Cheng et al., 2002). However, EGFR activation in combination with SV40T
overexpression (UroII EGFR+ SV40T+) promoted the development of high-grade
bladder carcinomas by 10 months (Cheng et al., 2002), indicating that activated
EGF receptor tyrosine kinase signalling functionally contributes to
tumourigenesis in the presence of cooperating mutations.
Hras models
Aberrant signalling through RAS/MAPK as a major signalling pathway downstream
of FGFR3 has been implicated to play a role in urothelial cancer. In mice, HRAS
activation with low copy number (1-2 copies) under the control of the UroII
promoter (UroII Hras Q61L) led to urothelial hyperproliferation by 10 months and
low-grade non-invasive urothelial carcinoma formation between 12-26 months
(Zhang et al., 2001). Similar observations were made in mice with high copy
number (30-48 copies) where mice presented low-grade non-invasive urothelial
carcinoma already by 5 months of age (Zhang et al., 2001). This finding was
supported by another study using the same mouse model (UroII Hras Q61L), where
homozygous Hras hyperactivation led to urothelial hyperplasia with progression
to low-grade superficial papillary bladder tumours by 6 months in 100% of the
cases (Mo et al., 2007). However, the very same model (UroII HrasQ61L) used by
our group showed urothelial hyperplasia, but no tumour formation was observed

Introduction – Modelling bladder cancer in vivo and in vitro (Chapter 1) 65
by 12 months (Ahmad et al., 2011b).This could be due to different mouse
genetic background or different animal units.
HRAS activation in combination with ß-catenin activation under the control of
UroIICre (UroIICre HrasQ61L ß-cateninexon3/exon3) resulted in low-grade, non-
invasive urothelial carcinoma (Ahmad et al., 2011b). HRAS activation in
combination with p53 deletion (UroIICre Hras+ p53flox/flox) resulted in superficial
low-grade papillary tumours or high-grade tumours in 30% of the mice by 3-6
months (Gao et al., 2004). HRAS activation in combination with EGFR activation
(UroII Hras Q61L EGFR+) resulted in urothelial hyperplasia without indication of
tumour formation by 10 months (Cheng et al., 2002).
Given that Hras in combination with cooperating mutations is a potent driver of
urothelial tumourigenesis, we will investigate the effect of RAS/MAPK activation
through Hras G12V mutation and relevant cooperating mutations in an AdenoCre-
induced mouse model and in a Sleeping Beauty insertional mutagenesis mouse
model.
p53 models
A dominant-negative p53 truncation mutation expressed under the UroII
promoter in mice (UroII p53dom.neg.), leading to disruption of endogenous p53
protein function in the urothelium, has been shown to produce hyperplasia and
dysplasia without progression to carcinoma by 20 months (Gao et al., 2004).
Similar results were obtained when p53 was homozygously deleted under the
control of a modified UroplakinII-Cre promoter (UPKIICre p53flox/flox), where the
mice failed to form urothelial tumours (Ayala de la Pena et al., 2011). Likewise,
using an AdenoCre-driven mouse model of p53 deletion (AdCre p53flox/flox), no
urothelial abnormalities were observed (Puzio-Kuter et al., 2009).
However, p53 inactivation in combination with homozygous Pten deletion using
AdenoCre (AdCre p53flox/flox Ptenflox/flox) led to formation of CIS or invasive
bladder tumours with 100% penetrance by 6 months including metastasis in 60%
of the cases by 4-6 months (Puzio-Kuter et al., 2009). p53 deletion in
combination with HRAS activation (UroIICre p53flox/flox Hras+) resulted in

Introduction – Modelling bladder cancer in vivo and in vitro (Chapter 1) 66
superficial low-grade papillary tumours or high-grade tumours in 30% of the mice
by 3-6 months (Gao et al., 2004).
Rb models
Deletion of Rb1 using the UroIICre promoter in mice (UroIICre Rb1flox/flox) has
been shown to promote apoptosis, but failed to produce urothelial cell
carcinoma (He et al., 2009).
Rb1 deletion in combination with p53 inactivation under the control of UroIICre
(UroIICre Rb1flox/flox) resulted in urothelial hyperplasia with nuclear
abnormalities in 10-20% of the cases without progression to carcinoma by 28
months (He et al., 2009). Similarly, using the AdenoCre promoter, Rb1 deletion
in combination with Pten deletion (AdCre Rb1flox/flox Ptenflox/flox) or p53
inactivation (AdCre Rb1flox/flox p53flox/flox) did not promote carcinoma formation
(Puzio-Kuter et al., 2009).
SV40 T models
The Simian vacuolating virus 40 (SV40) is a polyomavirus (DNA virus) that can
integrate into infected host cells and potentially induce tumours (Ali and
DeCaprio, 2001). Through expression of large T antigen, SV40 can suppress p53
and pRB protein function (Ali and DeCaprio, 2001), which makes it a useful
experimental tool to assess the effect of inactivation of the two key tumour
suppressors in mice.
SV40 T antigen overexpression under the control of UroIICre (UroII SV40T+) using
a low copy number results in severe urothelial dysplasia followed by CIS
formation (Zhang et al., 1999). Using a high copy number of the transgene, UroII
SV40T+ mice presented with invasive, metastatic bladder cancer (Cheng et al.,
2002). Interestingly, a follow-up study using the same model reported that the
majority of CIS eventually evolved into high-grade, superficial papillary tumours
before a small fraction of them advanced to invasive and metastatic cancer
(Cheng et al., 2003). SV40 expression under the Cytokeratin 19 (CK19) promoter
(CK19 SV40T+) resulted in CIS followed by highly invasive bladder tumours by 12
weeks of age, as well as 20% of the mice developing metastasis to the lungs at
12 weeks (Grippo and Sandgren, 2000). Papillary lesions were not observed in

Introduction – Modelling bladder cancer in vivo and in vitro (Chapter 1) 67
this model. Expression of SV40 under the control of a modified Uroplakin II
promoter (UPKII SV40T+) resulted in CIS at one week after birth (Ayala de la Pena
et al., 2011). However, muscle invasion and metastasis was an infrequent event
in this model.
SV40 T antigen overexpression in combination with EGFR overexpression (UroII
EGFR+ SV40T+) promoted the development of high-grade bladder carcinomas in
mice by 10 months (Cheng et al., 2002). Given that SV40T targets many
pathways, this could suggest that in mice multiple hits are required to transform
the quiescent bladder epithelium into bona fide urothelial tumours. Thus in this
study we combine a number of events with FGFR3 mutation to assess whether
this can provoke urothelial carcinogenesis.
Pten models
Homozygous Pten deletion under the control of UroIICre in mice (UroIICre
Ptenflox/flox) did not lead to any abnormal urothelial phenotype (Ahmad et al.,
2011a). Similarly, using the AdenoCre promoter, homozygous Pten deletion
(AdCre Ptenflox/flox) did not lead to any urothelial abnormalities (Puzio-Kuter et
al., 2009).
However, using the Fabp promoter to drive Cre expression in all layers of the
urothelium, along with intestinal epithelium (FabpCre Ptenflox/flox), homozygous
Pten deletion resulted in urothelial hyperplasia by 6 weeks and high-grade
muscle-invasive carcinoma formation in 22% of cases by 13 months of age (Yoo et
al., 2006). Another study using the same mouse model (FabpCre Ptenflox/flox)
reported hyperplasia by 2 months and the development of non-invasive bladder
tumours in 10% of cases by 10 months (Tsuruta, 2006). This inconsistency
between studies is still unclear but could represent different cell populations
targeted by the different Cre promoters, mouse genetic background or even
different animal units.
Pten deletion in combination with ß-catenin activation under the control of
UroIICre (UroIICre ß-catenin+/exon3 Ptenflox/flox) resulted in low-grade non-invasive
urothelial carcinoma (Ahmad et al., 2011a). Homozygous Pten inactivation in
combination with p53 deletion using AdenoCre (AdCre p53flox/flox Ptenflox/flox) led

Introduction – Modelling bladder cancer in vivo and in vitro (Chapter 1) 68
to formation of CIS or invasive bladder tumours with 100% penetrance by 6
months including metastasis in 60% of the cases by 4-6 months (Puzio-Kuter et
al., 2009).
Given that loss of PTEN appears to be able to contribute to urothelial
tumourigenesis, we will use a model with Pten deletion as an experimental tool
to assess the effects of PI3K-AKT activation in the presence of Fgfr3 mutation in
the urothelium.
Wnt models
ß-catenin activation under the control of the UroIICre promoter (UroIICre ß-
cateninexon3/exon3) has been shown to produce localised hyperproliferative lesions
in the bladder epithelium by 3 months without progression to carcinoma (Ahmad
et al., 2011a).
ß-catenin activation in combination with Pten deletion (UroIICre ß-catenin+/exon3
Ptenflox/flox) resulted in low-grade, non-invasive urothelial carcinoma (Ahmad et
al., 2011a). Similarly, ß-catenin activation in combination with HRAS activation
(UroIICre ß-cateninexon3/exon3 HrasQ61L) resulted in low-grade, non-invasive
urothelial carcinoma (Ahmad et al., 2011b).
Introduction – Aims of the study (Chapter 1) 69
1.5 Aims of the study
Bladder cancer poses a major health issue worldwide that causes considerable
morbidity and mortality due to ineffective or lacking therapeutic strategies. It is
therefore essential to better understand the disease process and the molecular
changes and mechanisms behind bladder cancer formation and progression in
order to develop novel therapy approaches. Alterations in FGFR3 signalling are
frequently found in bladder cancer, either by mutation, overexpression or both.
However, there are open questions that urgently need to be addressed, such as
the functional role of FGFR3 in cancer initiation, invasion and progression of
tumours, as well as the exact mechanism of FGFR3-dependent tumourigenesis as
a valuable step towards the discovery of novel therapeutic targets.
The overall aim of this study is to examine the role of FGFR3 mutation in
bladder cancer initiation and progression by using mouse models.
The following 4 objectives were addressed:
I. To investigate the role of FGFR3 in non-invasive bladder cancer. This
first experiment was based on our previous findings that Fgfr3 mutation
alone is insufficient to drive tumourigenesis in the urothelium (Ahmad et
al., 2011c), suggesting that a cooperating mutation may be obligatory for
FGFR3-dependent tumorigenesis. We found an indication that increased
PI3K/AKT signalling may be required for tumour formation in the bladder.
Hypothesising that the putative cooperating mutation is a regulator of
PI3K/AKT signalling, we targeted a candidate gene, Pten, to test the
synergistic effects of FGFR3 and PI3K-AKT signalling activation in the
bladder (Chapter 3).
II. To identify mutations that cooperate with FGFR3, PTEN, or RAS in
promoting urothelial tumourigenesis. It has been shown in mouse models
that Fgfr3, Pten and Ras are unable to drive urothelial tumourigenesis
when mutated individually. It would therefore be important to test their
potential to cooperate with a second, randomly introduced mutation that
can be identified and validated. This unbiased screening approach could
also help to identify novel mutations that play an important role in

Introduction – Aims of the study (Chapter 1) 70
bladder cancer. Hypothesising that Fgfr3, Pten, and Hras are
fundamentally able to promote cancer formation in the presence of
cooperating mutations, we generated mice with these mutations in
conjunction with transposable “Sleeping Beauty” elements. (Chapter 4).
III. To investigate the role of FGFR3 mutation in tumour progression and
invasion. Alterations in FGFR3 signalling either by mutation or
overexpression are found in 50% of invasive bladder tumours. However, it
is unclear whether FGFR3 activation can actively promote tumour
progression, or whether it is acquired during the evolution of the cancer
without functional contribution to its progression. To address whether an
FGFR3 mutation can predispose urothelial cells to tumourigenesis, and to
evaluate its role in tumour progression in established tumours, we
subjected Fgfr3-mutant and Wild type mice to a bladder-specific
carcinogen, N-butyl-N-(hydroxybutyl)-nitrosamine (OH-BBN). We
compared the effect of two different point mutations in Fgfr3, as well as
the effect of Pten deletion and Fgfr3-Pten double mutation in the invasive
tumours (Chapter 5).
IV. To establish techniques in order to generate and assess invasive
bladder tumours. The progress of anti-cancer drug development relies on
the generation and use of suitable animal models, as well as on the
essential techniques to analyse and assess the effect of the therapy. We
therefore first aimed to generate an invasive bladder cancer model with
metastatic potential, in which recombination is promoted in a spatially
and temporally controlled fashion using a Cre-expressing adenovirus. In
order to then detect and monitor tumour development and progression in
the living animals, we tested fluorescent imaging and ultrasound imaging
in the mouse bladder. Furthermore, with the aim to assess cell
transformation, migration and response to drug treatment, we tested
essential ex vivo techniques and assays (Chapter 6).

Materials and Methods (Chapter 2) 71
Chapter 2
Materials and Methods

Materials and Methods (Chapter 2) 72
2.1 Mice
All mice were maintained under non-barrier conditions and given a standard diet
(CRM (E) expanded diet from Special Diets Services; Cat no 801730) and water ad
libitum.
The Biological Services department at the Beatson Institute provided animal
husbandry including setting up matings, weaning pups, and tail tipping for
genotyping.
Mice were sacrificed using an approved schedule 1 procedure. All experiments
were carried out with the Personal Licence 60/12893 in accordance with the
Project Licence 60/4271 under the UK Home Office guidelines.
2.1.1 Mouse lines and genotyping alleles
Mouse lines used throughout the project are indicated in (Table 2-1).
DNA extraction from tail tips and genotyping by PCR was performed by
Transnetyx, USA, (http://www.transnetyx.com/). The company uses a method
based on real time PCR and DNA hybridisation to detect the presence or absence
of alleles in the DNA.

Materials and Methods (Chapter 2) 73
Table 2-1: Mouse lines and genotyping alleles
2.1.2 Genetic background of mice
UroIICre transgenic mice were originally on FVB/N background (Mo et al., 2005).
Tg(UroII-hFGFR3IIIbS249C) transgenic mice were on C57/CBA mixed background
(Chapter 2.3). The background of all other mice was C57Bl/6.

Materials and Methods (Chapter 2) 74
2.2 Sleeping Beauty mutagenesis
Bladders were gently emptied of urine. Tissues were generally snap-frozen in
liquid nitrogen immediately after collection and stored at -80C until further
preparation.
2.2.1 T2/Onc3 excision PCR assay
Excision of the T2/Onc3 transposon in the UroIICreFgfr3+/K644E RosaSBaseLSL
T2/Onc3 bladder was assessed by PCR (Collier et al., 2005). Bladders and tail
tips were thawed on ice, and genomic DNA was extracted using the QIAamp DNA
Mini kit (Qiagen). PCR products were visualised in a 1.5% agarose gel containing
ethidium bromide.
T2/Onc3 excision PCR primers and PCR conditions were as follows (Table 2-2 and
Table 2-3):
Table 2-2: T2/Onc3 excision PCR primers

Materials and Methods (Chapter 2) 75
Table 2-3: T2/Onc3 excision PCR conditions
2.2.2 Splinkerette PCR and Sequencing
Splinkerette PCR was performed to amplify transposon junctions from genomic
DNA of mice carrying transposon insertions.
Genomic DNA was extracted from snap frozen mouse bladders and tails using
DNeasy kit (Qiagen). Splinkerette PCR, sequencing and bioinformatics analysis
was performed by Dr Louise Van Der Weyden and Dr David J. Adams at the
Sanger Institute (Cambridge, UK) as previously described (Uren et al., 2009). See
also Introduction to Chapter 4.
2.3 Generation of Tg(UroII-hFGFR3IIIbS249C)
The vector design was performed by Dr Tomoko Iwata (University of Glasgow), Dr
Darren Tomlinson (LIMM, Leeds, UK) and Prof Margaret Knowles (LIMM, Leeds,
UK).
A pGEM-T vector (Promega) was used containing a multiple cloning site (MCS) for
EcoRI, SpeI, SalI, and NotI (Figure 1-1). The MCS was cloned into pGEM digested
with NcoI and SacI. The UroplakinII (UroII) fragment of 2.5kb was released from
a vector supplied by Robert Weeks (Dunedin, New Zealand) using EcoRI and SpeI,

Materials and Methods (Chapter 2) 76
and ligated into the same sites in the pGEM MCS. Human FGFR3IIIb cDNA was
mutated at position 249 and at the stop codon. The clones contained restriction
sites for SalI at the 5’ end and NotI at the 3’ end of the gene for ease of cloning
into pGEM-UroII. A poly-A sequence was added 156 bp after the 3’ end of the
FGFR3 gene. The resulting pGEM-UroII-hFGFR3IIIb-S249C construct contained
10,294 bp and was fully sequenced.
Figure 2-1: Tg(UroII-hFGFR3IIIbS249C) vector map Schematic representation of pGEM-T vector containing murine UroplakinII promoter and human FGFR3IIIb cDNA with S249C mutation.
Materials and Methods (Chapter 2) 77
In order to test the expression level of the construct, three human bladder
cancer cell lines (VMCUB-1, VMCUB-3 and UMUC-3) were transfected with pGEM-
UroII-hFGFR3IIb-S249C or the empty vector. RNA was extracted and an RT-PCR
was performed to determine FGFR3 expression levels. A 1.8-fold increase in
FGFR3 expression was detected in cells with the full construct compared to
control cells containing the empty vector (Dr Darren Tomlinson, data not
shown).
Transgenic animals were generated by pronuclear injection of the pGEM-UroII-
hFGFR3IIb-S249C vector construct. Mouse studs and donors were on C57/CBA F1
background. Tg(UroII-hFGFR3IIIbS249C) transgenic mice were therefore on
C57/CBA F2 mixed background and further crossed with C57Bl/6. The presence
of the transgene in the offspring was confirmed in two mice by sequencing (Dr
Tomoko Iwata, data not shown).
Presence of the FGFR3 S249C mutation in Tg(UroII-hFGFR3IIIbS249C) bladders
was assessed by PCR. PCR primers and conditions are indicated in (Table 2-4 and
Table 2-5). Tail tips were thawed on ice, and genomic DNA was extracted using
the QIAamp DNA Mini kit (Qiagen). PCR products were visualised in a 1.5%
agarose gel containing ethidium bromide.
Amplified PCR product of Tg(UroII-hFGFR3IIIbS249C) was extracted from 1.5%
agarose gels using the QIAquick PCR purification kit (Qiagen #28104). Sequencing
was done by the Beatson Sequencing Service (AB Applied Biosystems, 3130XL).
Table 2-4: Tg(UroII-hFGFR3IIIbS249C) PCR primers

Materials and Methods (Chapter 2) 78
Table 2-5: FGFR3 S249C PCR conditions
2.4 OH-BBN treatment
Mice were administered 0.05% w/v N-butyl-N-(4-hydroxybutyl) nitrosamine (OH-
BBN, TCI UK #B0938) in drinking water, which was prepared freshly three times a
week. Two different lengths of treatment were performed. In one, animals were
treated for 10 weeks with OH-BBN followed by 10 weeks of regular water
(further called “10+10 weeks”). In the other, animals were subjected to 20
weeks continuously of OH-BBN (further called “20 weeks”). Animals were
sacrificed at different time points during the procedure or when 20 weeks were
completed.
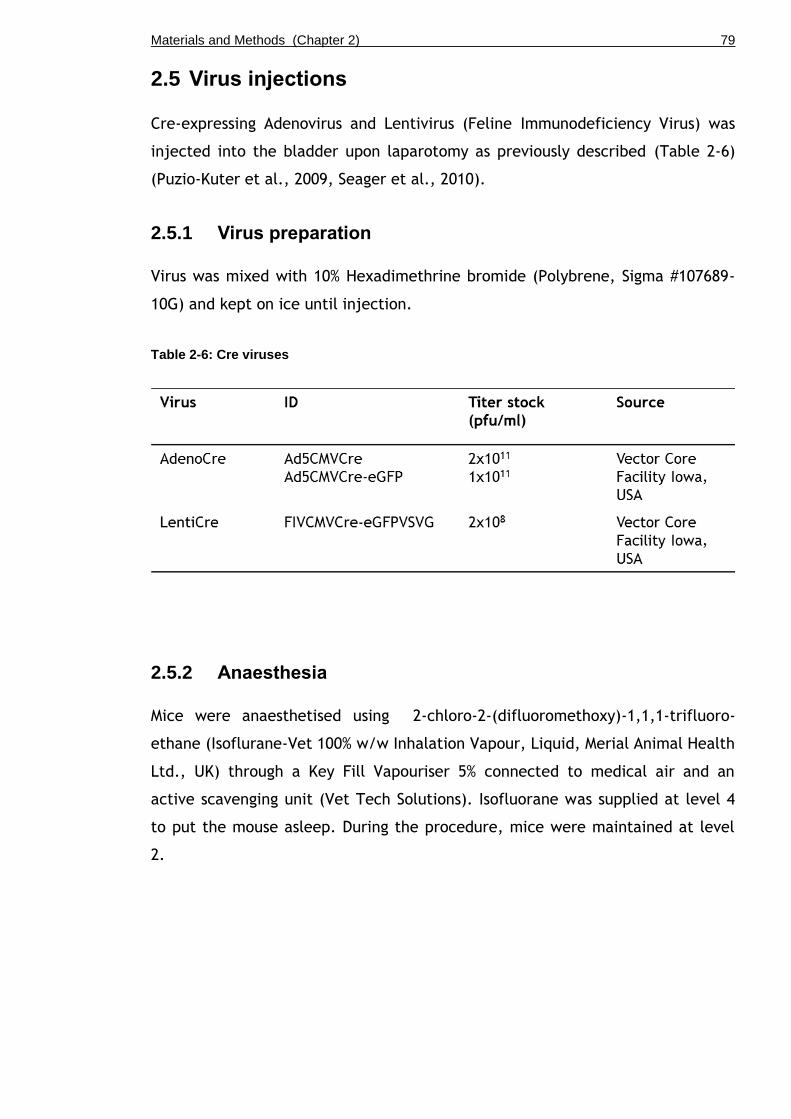
Materials and Methods (Chapter 2) 79
2.5 Virus injections
Cre-expressing Adenovirus and Lentivirus (Feline Immunodeficiency Virus) was
injected into the bladder upon laparotomy as previously described (Table 2-6)
(Puzio-Kuter et al., 2009, Seager et al., 2010).
2.5.1 Virus preparation
Virus was mixed with 10% Hexadimethrine bromide (Polybrene, Sigma #107689-
10G) and kept on ice until injection.
Table 2-6: Cre viruses
2.5.2 Anaesthesia
Mice were anaesthetised using 2-chloro-2-(difluoromethoxy)-1,1,1-trifluoro-
ethane (Isoflurane-Vet 100% w/w Inhalation Vapour, Liquid, Merial Animal Health
Ltd., UK) through a Key Fill Vapouriser 5% connected to medical air and an
active scavenging unit (Vet Tech Solutions). Isofluorane was supplied at level 4
to put the mouse asleep. During the procedure, mice were maintained at level
2.
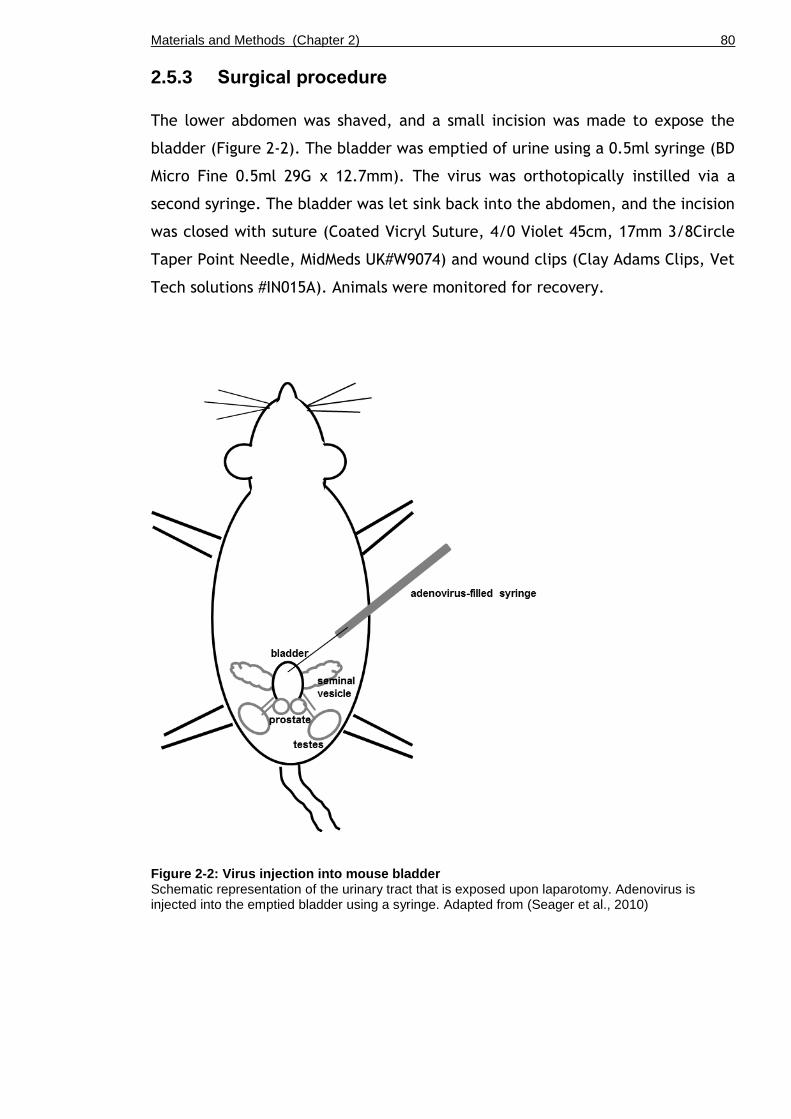
Materials and Methods (Chapter 2) 80
2.5.3 Surgical procedure
The lower abdomen was shaved, and a small incision was made to expose the
bladder (Figure 2-2). The bladder was emptied of urine using a 0.5ml syringe (BD
Micro Fine 0.5ml 29G x 12.7mm). The virus was orthotopically instilled via a
second syringe. The bladder was let sink back into the abdomen, and the incision
was closed with suture (Coated Vicryl Suture, 4/0 Violet 45cm, 17mm 3/8Circle
Taper Point Needle, MidMeds UK#W9074) and wound clips (Clay Adams Clips, Vet
Tech solutions #IN015A). Animals were monitored for recovery.
Figure 2-2: Virus injection into mouse bladder Schematic representation of the urinary tract that is exposed upon laparotomy. Adenovirus is injected into the emptied bladder using a syringe. Adapted from (Seager et al., 2010)
Materials and Methods (Chapter 2) 81
2.6 Live imaging
Prior to live imaging, mice were either anaesthetised (Chapter 2.5.2) or
sacrificed before the procedure.
2.6.1 Fluorescent imaging
The abdominal area of mice was shaved using an electric hair trimmer. Mice
were scanned by IVIS Spectrum (Perkin Elmer). Filter-pair imaging with epi-
illumination was used. mCherry (red channel) was used with excitation
wavelength at 587 nm and emission at 610 nm. GFP (green channel) was used
with excitation at 465 nm and emission at 520 nm. The field of view was set at
13.3 cm. The focus of subject height was set at 1.5 cm. Auto settings were used
for exposure and photo acquisition. Pictures were analysed using Photoshop
software (Adobe Photoshop CS2).
2.6.2 Ultrasound scanning
Hair in the abdominal region was removed using depilatory cream (Nair).
Ultrasound gel (Henleys Medical, salt-free) was applied to the abdomen, and the
animal was tape-secured to a heated (40 C) ultrasound platform. Bladders were
then imaged by ultrasound (Vevo 770, Visualsonics Inc., 25MHz transducer) and
photos were converted to JPEG format using OsiriX software (OsiriX 5.7 32-bit,
Geneva, Switzerland) and analysed using ImageJ software (NIH, Bethesda, USA).
2.7 Tissue harvest and fixation
Bladders were gently emptied of urine and placed in 10% formalin for overnight
fixation. Fixed bladders were embedded in paraffin by the Beatson Histology
Service with the bladder dome facing up and the trigone down. Alternatively for
X-Gal staining, formalin-fixed bladders were transferred into 10%, 20%, and 30%
sucrose in PBS, OCT-embedded with the bladder dome facing up and the trigone
down, and frozen in liquid nitrogen. Paraffin or OCT-frozen sections were cut
starting from the trigone side of the bladder.

Materials and Methods (Chapter 2) 82
2.8 Histology
Haematoxylin and eosin (H&E) and PAS staining (Leica Microsystems staining
solutions #3803812 and #03800E) was performed on 4 m paraffin-embedded
sections by the Beatson histology Service (Table 2-7).
X-Gal staining (K1465-01, Invitrogen Life Technologies, UK) was performed on 10
m formalin-fixed OCT-embedded frozen sections by the Beatson histology
Service (Table 2-7).
Table 2-7: Processing methods for histological staining
2.9 Immunohistochemistry
Routine immunohistochemistry was performed by the Beatson histology service
(Caspase-3, E-Cadherin, GFP, Ki67, Pten, pAKT, pERK, p21, p63, SMA, β-
catenin). Immunofluorescent staining experiments were greatly supported by
Despoina Natsiou (University of Glasgow).
The specificity of each antibody has been carefully examined at the outset of
the experiments at the Histology Services of the Beatson Institute for Cancer
Research and by myself. Ki67, Caspase-3, E-cadherin, pERK, pAKT, p-mTOR,
PTEN and p21, are routinely used in the Institute and validated in multiple
tissue/cancer types. For pERK we have performed an experiment with p-Erk1/2
antibody (Cell Signaling, #4370; 1:100) together with the Blocking Peptide
specific to this antibody (Cell Signaling, #1150; 1:50, as directed by the
manufacturer's instructions). CK5, CK18, Uroplakin II and p63 have been

Materials and Methods (Chapter 2) 83
optimised for bladder tissue: positive and negative control slides were added to
each experiment as appropriate. As an internal control, we evaluated negative
staining in the areas that are not supposed to be stained within the same
sections together with the presence of staining in the intended tissue/cellular
components.
Slides were dewaxed in xylene for 2x5min, and rehydrated in 100%, 95% and 70%
ethanol with a final step in PBS.
To reduce endogenous peroxidase activity, samples were incubated in 0.3% H2O2
in distilled water for 20 min.
Antigen retrieval was routinely performed in 0.01M citric acid (pH 6) in a boiling
waterbath for 20-30 minutes. For β-catenin immunostaining, retrieval was
performed for 50 min. For CK5, CK18 and UroII immunostaining, retrieval was
performed in a pressure cooker inside a microwave with open lid for 15 min and
with closed lid for 4 minutes at full power. Slides were then allowed to cool
down for 20 min at room temperature. 1M citric acid was made up by 105.07g in
500 ml (no pH adjustment); 5ml of 1M solution were used to make 500ml of
0.01M citric acid to be pH adjusted by NaOH.
To prevent endogenous staining, non-specific sites were blocked with 5% normal
goat serum in PBS for 1 hour. Incubation with primary antibody was performed
overnight at 4ºC (Table 2-8).
Signals were subsequently visualised by chromogenic or fluorescent procedure.
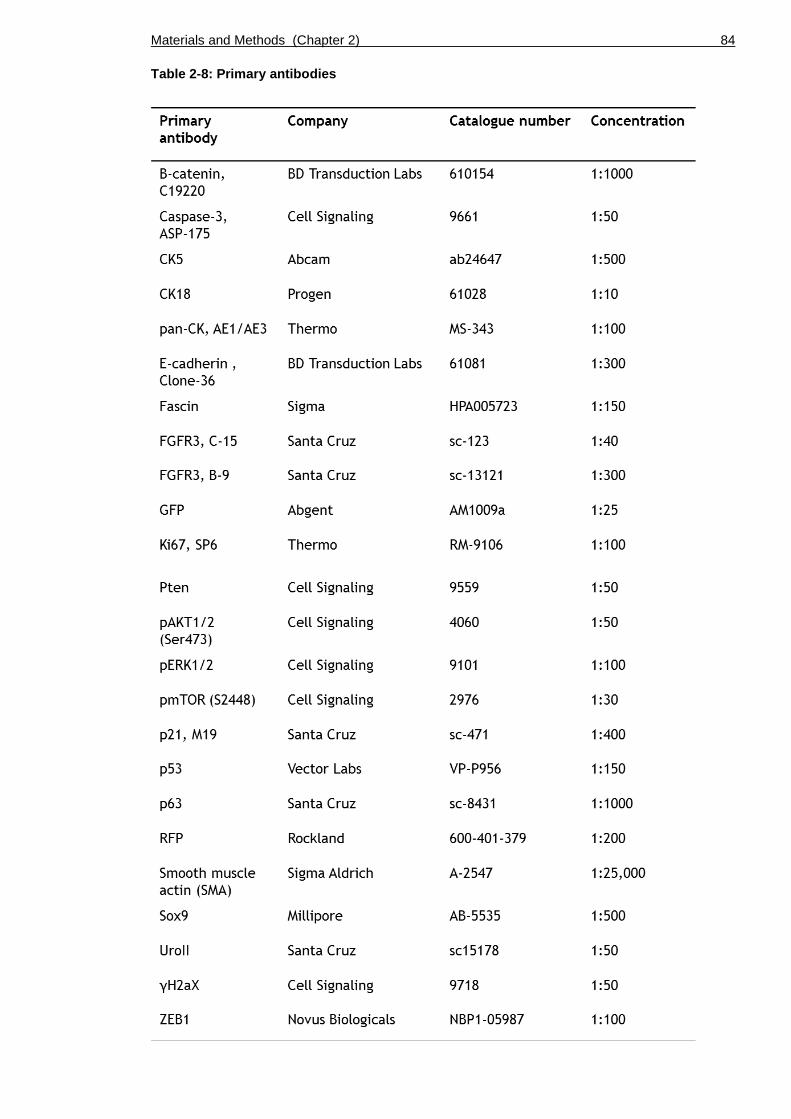
Materials and Methods (Chapter 2) 84
Table 2-8: Primary antibodies
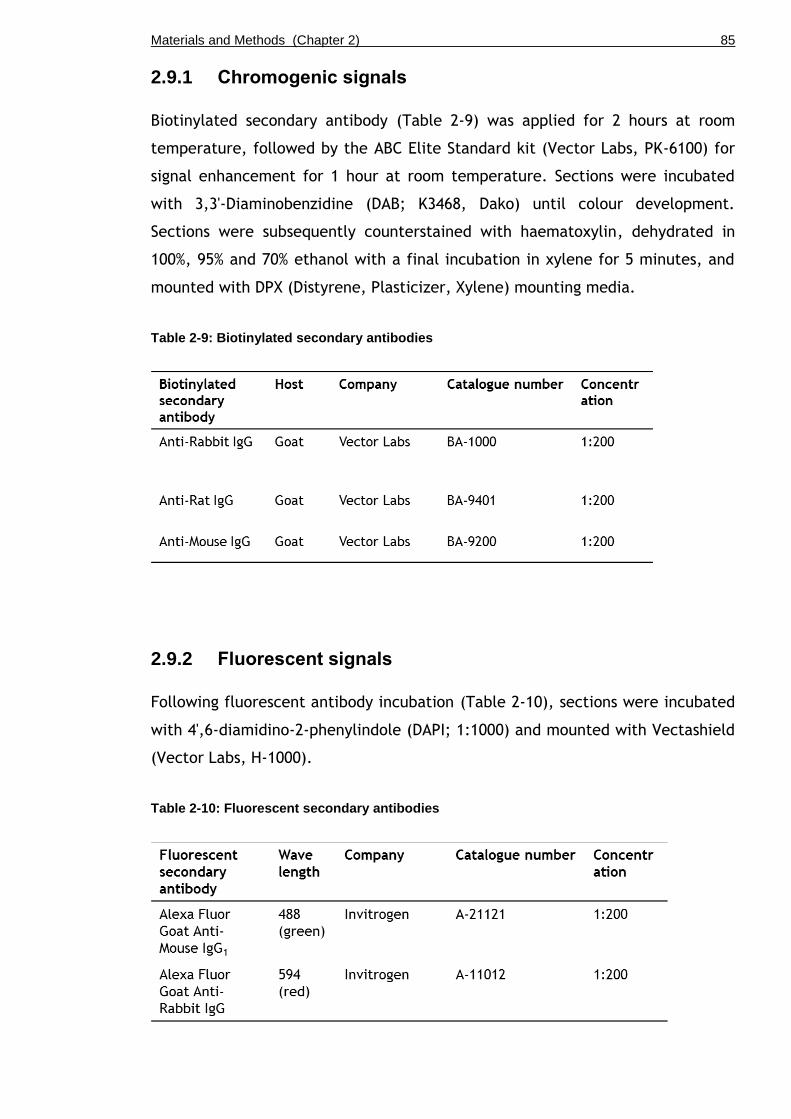
Materials and Methods (Chapter 2) 85
2.9.1 Chromogenic signals
Biotinylated secondary antibody (Table 2-9) was applied for 2 hours at room
temperature, followed by the ABC Elite Standard kit (Vector Labs, PK-6100) for
signal enhancement for 1 hour at room temperature. Sections were incubated
with 3,3'-Diaminobenzidine (DAB; K3468, Dako) until colour development.
Sections were subsequently counterstained with haematoxylin, dehydrated in
100%, 95% and 70% ethanol with a final incubation in xylene for 5 minutes, and
mounted with DPX (Distyrene, Plasticizer, Xylene) mounting media.
Table 2-9: Biotinylated secondary antibodies
2.9.2 Fluorescent signals
Following fluorescent antibody incubation (Table 2-10), sections were incubated
with 4',6-diamidino-2-phenylindole (DAPI; 1:1000) and mounted with Vectashield
(Vector Labs, H-1000).
Table 2-10: Fluorescent secondary antibodies

Materials and Methods (Chapter 2) 86
2.9.3 Scanning of slides
Slides were scanned by Nanozoomer slide scanner (Hamamastu) and analysed by
SlidePath Digital Image Hub (Leica Biosystems).
2.10 Microscopy
Pictures of chromogenic staining were taken by Axio Imager light microscope
(Zeiss A1). Pictures of fluorescent staining were taken by Zeiss upright confocal
microscope (Zeiss 710). IHC staining was examined in the minimum of n=3 per
genotype.
2.11 Measurements of urothelial thickness
Three representative photos were taken for each H&E stained section at 40x
magnification. Urothelial thickness was measured in 25-30 µm intervals at
random fashion using ImageJ software (NIH, Bethesda, USA). Each picture
contained 20-50 measurements. The mean value of the thickness was initially
calculated per sample, and was then subsequently used to determine the mean
value per genotype as presented in the results.
2.12 Measurements of urothelial cell size
To determine the cell size, IHC with E-cadherin was performed by the Beatson
Histology Service. Measurement of urothelial cell size was performed by Louise
King (University of Glasgow).
Three representative photos were taken for each tissue section at 40x
magnification. Each cell was marked around the cell membrane and the areas
were quantified using ImageJ. The sizes of fifteen cells each layer were
measured per layer per sample.

Materials and Methods (Chapter 2) 87
2.13 Human tissue microarray (TMA)
TMA staining of clinical specimen was performed by Dr Tomoko Iwata (University
of Glasgow) and the Beatson Histology Service. TMA scoring was performed by Dr
Theo van der Kwast (UHN, Toronto, Canada) and Dr Bas van Rhijn (NCI,
Amsterdam, Netherlands).
The medical-ethical committee of the University Health Network, Toronto (02-
0515-C and 08-0263-T) and the Research Ethics Board (REB), Canada, approved
the work with human tissue and to extract clinical data.
66 samples of T1 urothelial tumours of low- and high-grade according to WHO
2004 classification system, and G2 and G3 according to WHO 1973 classification
system were subjected to immunohistochemistry for pmTOR and FGFR3 (B9).
TMA sections were scored according to the 4 point scale (0=negative, 1=faint,
2=intermediate, 3=strong/intense) and the 2 point scale (0= normal,
1=overexpression).
2.14 Statistics
Statistics were performed using SPSS software (SPSS Statistics Version 19, IBM).
For thickness, cell size, proliferation, and apoptosis experiments we used the
Kruskal-Wallis test for non-parametric distribution of data in order to define
overall significance across multiple categories (genotypes). The Mann-Whitney
test was subsequently used to analyse individual significance between the
genotypes. For human tissue micro array (TMA) analysis and frequency analysis
of histological features in OH-BBN-induced tumours we used Pearson Chi-Square
test.
Materials and Methods (Chapter 2) 88
2.15 Cell and tissue culture
2.15.1 Preparation of cell stocks
Cells were harvested at 70-80% confluency, frozen in the specific growth media
(Table 2-11) containing 10% DMSO, and stored at -80C. For reconstitution, cells
in cryovials (Starlab, Milton Keynes, UK) were thawed in a 37°C water bath,
washed with PBS or growth media, resuspended in Matrigel and subsequently
seeded.
2.15.2 Cell counting
Cells were counted using either a haemocytometer (Marienfeld, Neubauer-
improved) for absolute numbers or by a cell counter (Roche, Casy Innovatis) for
relative cell numbers. For cell counts in the haemocytometer, single cells were
mixed 1:1 with Trypan blue. A 10l aliquot was then applied to the
haemocytometer chamber. Cells in the 4 x 16 squares were counted using a light
microscope with phase contrast. The number of cells was then calculated by
multiplying the total cell number of all 4 squares by the Trypan blue dilution
factor (2), which results in the number of cells x 104/ml. For the automated cell
counter, cell pellets were resuspended in 5-10ml PBS. 400l of the suspension
was mixed with 19.6ml of Casiton solution (Roche). The automated cell counter
displays the number of cells/ml.
2.15.3 Culture of human cell line EJ138
A liquid nitrogen stock of EJ138 at passage 34 was obtained from the Radiation
Oncology group, University of Glasgow. EJ138 was maintained in DMEM with 2mM
of L-Glutamine, 10% FBS and 1% of Penicillin-Streptomycin without addition of
growth factors. Cell culture dishes were incubated at 37°C under 5% CO2, and
the media was changed three times a week. Cells were counted and seeded on
Collagen-I matrices (Chapter 2.15.6).
2.15.4 Primary cell culture from mouse bladder
Bladders were harvested and placed in cold PBS until preparation of the culture.
To generate single cells, bladders were inverted and the urothelium or tumorous
Materials and Methods (Chapter 2) 89
tissue was scraped off using a scalpel. Cell clumps were manually broken down
using a pipette.
After washing with PBS, the cell pellet was incubated for 20-30 min in 1ml
TrypLE (Gibco, Invitrogen) containing 10l (0.8 g/ml) recombinant DNase I
(Roche) and 100l DNase I reaction buffer (Roche). Cells were washed in PBS and
filtered through a 70m cell strainer (BD Falcon, 70m yellow). Cells were then
used for Matrigel culture or Collagen-I invasion assay.
2.15.5 Matrigel culture and colony formation assay
Single cells were counted and seeded in approximately 25l Matrigel droplets
(BD Biosciences, #356231) in 24-well plates and covered with either ADF media
(Table 2-11) supplemented with growth factors (Table 2-12).
Cells were resuspended in Matrigel at a known concentration and droplets of the
mixture were seeded in 24-well plates. After allowing the Matrigel droplets to
solidify for a few minutes at 37°C, 0.5ml of ADF growth media (Table 2-11)
supplemented with growth factors (Table 2-12) was added per well. Plates were
incubated at 37°C under 5% CO2, and the media was changed three times a
week.
Colonies were counted using a light microscope with phase contrast at 10x
magnification.
To passage the cells, colonies in the Matrigel were resuspended into single cells
using a 1000ul pipette tip; cells were washed 2-3 times with PBS, counted and
re-seeded.
Materials and Methods (Chapter 2) 90
2.15.6 Collagen-I invasion assay
Invasion into an organotypic matrix containing human fibroblasts from skin
explants and Collagen-I from rat tails has been described previously (Timpson et
al., 2011).
Single cells at a known concentration in 1ml DMEM media were seeded onto
Collagen-I matrices containing either normal human fibroblasts (NHF) (Timpson
et al., 2011) or telomerase-immortalised fibroblasts (red TIFF) (Munro et al.,
2001). Cells were allowed to attach to the matrix for 3-4 days.
Matrices were then transferred onto grids with an air-media interface. Cells
were allowed to invade for 14 days with DMEM media being changed every other
day. Matrices were cut in halves and fixed in 4% PFA overnight. H&E staining as
well as immunohistochemistry was performed on 4 m-thick paraffin-embedded
sections.
2.15.7 Organotypic slice culture
Organotypic slice culture of the bladder was performed as previously described
(Batourina et al., 2012).
Bladders or bladder tumours were cut into 2-3mm slices using dissecting scissors
(Straight 7mm blades, Coherent Vannas #500086) under a dissection microscope.
Duplicate slices were placed with the urothelium facing down on membrane
culture inserts (Millipore #PICM0RG50) in glass bottom dishes (In Vitro Scientific
#D35-20-1-N) containing basal conditional media (Table 2-11) supplemented with
recombinant rat glial cell line-derived neurotrophic factor (rGDNF), human
hepatocyte growth factor (hHGF), and human keratinocyte growth factor (hKGF,
also known as FGF7) (Table 2-12). Explants were covered with a drop of sterile
mineral oil (Sigma-Aldrich # M5904).
Cultures were maintained at 37°C with 5% CO2 concentration. Basal conditional
medium was changed three times a week.

Materials and Methods (Chapter 2) 91
2.15.8 Tamoxifen induction of organotypic slice culture
Organotypic slice cultures were induced by addition of 1uM 4-Hydroxytamoxifen
solution or for controls using 1.2 μl 100% ethanol. 5mg of 4-OH-Tamoxifen
powder (Sigma, H7904-25mg) was resuspended in 2.5ml 100% ethanol to produce
a 5mM stock solution. 1ul of the 4-OH-Tamoxifen stock solution was added per
10ml media. The organotypic slices were then incubated at 37˚C in 5% CO2
atmosphere for 20hrs before the culturing media was changed and new growth
factors were added.
2.15.9 R3Mab treatment of organotypic slice culture
Organotypic slice explants were subjected to 10nM R3Mab (Genentech,
MFGR1877s) or 10nM control antibody (Genentech, gD 5237) every other day for
4 days in basal conditional media. Slices were placed in 4% PFA overnight,
paraffin-embedded and processed for histological staining.

Materials and Methods (Chapter 2) 92
Table 2-11: Media components
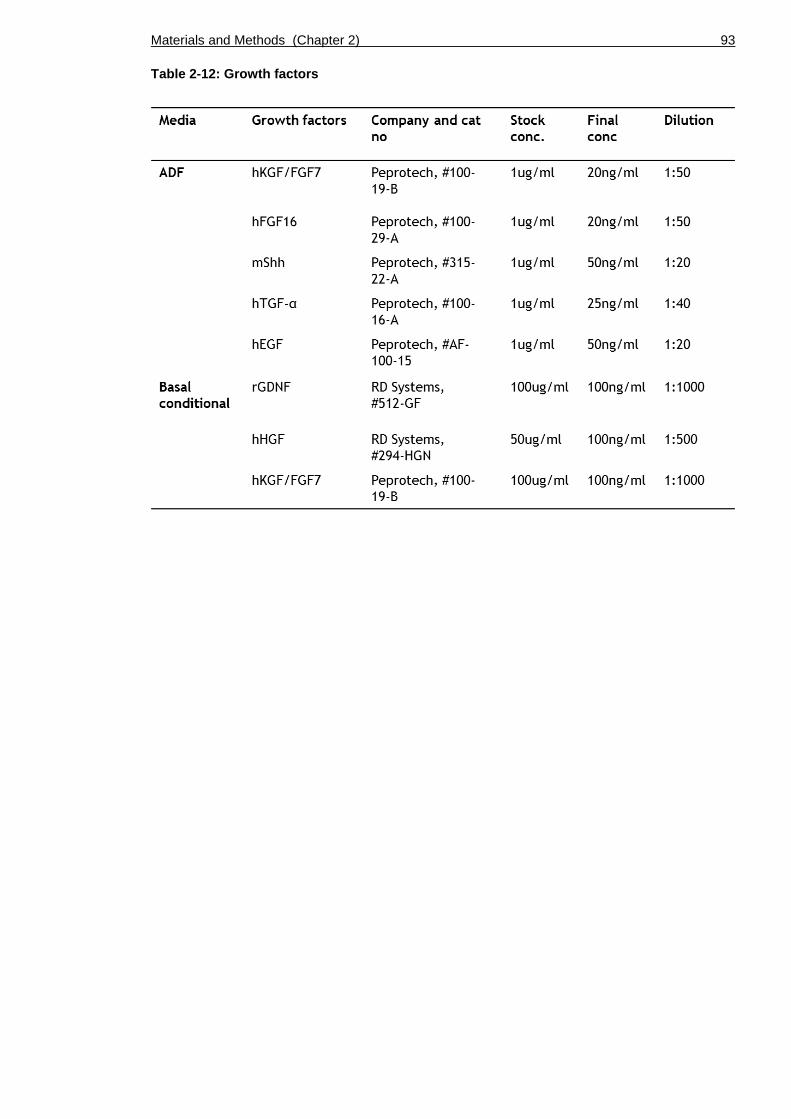
Materials and Methods (Chapter 2) 93
Table 2-12: Growth factors

Results – The role of FGFR3 in non-invasive bladder cancer (Chapter 3) 94
Chapter 3
The role of FGFR3 in non-invasive bladder cancer

Results – The role of FGFR3 in non-invasive bladder cancer (Chapter 3) 95
3.1 Introduction
In order to study the functional role of FGFR3 activation in bladder
tumourigenesis, we have previously generated a mouse model in which Fgfr3
K644E, a constitutively active form of FGFR3 (Iwata et al., 2000), is conditionally
expressed in the urothelium by placing Cre recombinase expression under the
Uroplakin II (UroII) promoter (UroIICre Fgfr3+/K644E) (Ahmad et al., 2011c). These
mice did not develop bladder cancer at 18 months, suggesting that cooperating
mutations are required for FGFR3 to drive tumourigenesis in the bladder. In the
same study in combination with K-Ras or β-Catenin, Fgfr3 activation caused
tumours in the skin and in the lungs, respectively, suggesting that FGFR3 is able
to induce tumourigenesis in the presence of cooperating mutations (UroIICre
Fgfr3+/K644EKras+/G12D and UroIICre Fgfr3+/K644E ß-catenin+/exon3). It was observed
that the PI3K/AKT pathway was highly upregulated in these lung tumours, while
it remained unchanged in the bladder of mice with the same genotype (Ahmad
et al., 2011c). This could indicate that increased PI3K/AKT signalling may be
required for tumour formation in the bladder.
In human bladder tumours, mutations in FGFR3 and PI3K/AKT pathway genes and
their activation are strongly co-associated (Lopez-Knowles et al., 2006, Kompier
et al., 2010, Duenas et al., 2013). A catalytic subunit of PI3K, PIK3CA, is
frequently mutated in non-invasive urothelial cell carcinoma, leading to a
significant proliferative advantage through increased lipid kinase activity and
constitutive AKT activation (Lopez-Knowles et al., 2006, Askham et al., 2010,
Ross et al., 2013). FGFR3 signalling can activate the PI3K/AKT pathway by
phosphorylated GRB2/GAB1 interaction with PI3K (Hart et al., 2001).
The PI3K/AKT pathway is involved in a range of cellular processes such as
proliferation, apoptosis, survival and migration by controlling the expression of a
range of proteins including Bcl-2-associated X (Bax), nuclear factor kappa-light-
chain-enhancer of activated B cells (NF-kB), mouse double minute 2 homolog
(MDM2) and mammalian target of rapamycin (mTOR) (Fresno Vara et al., 2004).
mTOR has been shown to be a candidate for effective therapeutic targeting
(Ahmad et al., 2011a, Puzio-Kuter et al., 2009). Furthermore, PI3K/AKT
signalling increases the expression of cell-cycle regulating genes such as p21 by
suppressing GSK3β and activating mTOR (Yohn et al., 2011). p21 was previously

Results – The role of FGFR3 in non-invasive bladder cancer (Chapter 3) 96
shown to be up-regulated in the mouse urothelium in which Pten is deleted (Yoo
et al., 2006).
In this chapter we aimed to test the synergistic effects of FGFR3 and PI3K-AKT
signalling activation. At the time of planning and initiating the experiments, a
mouse model with activating Pi3k mutation was unavailable. Therefore we used
a mouse line with Pten deletion as an experimental tool to assess the effects of
PI3K-AKT activation in the presence of Fgfr3 mutation in the urothelium.
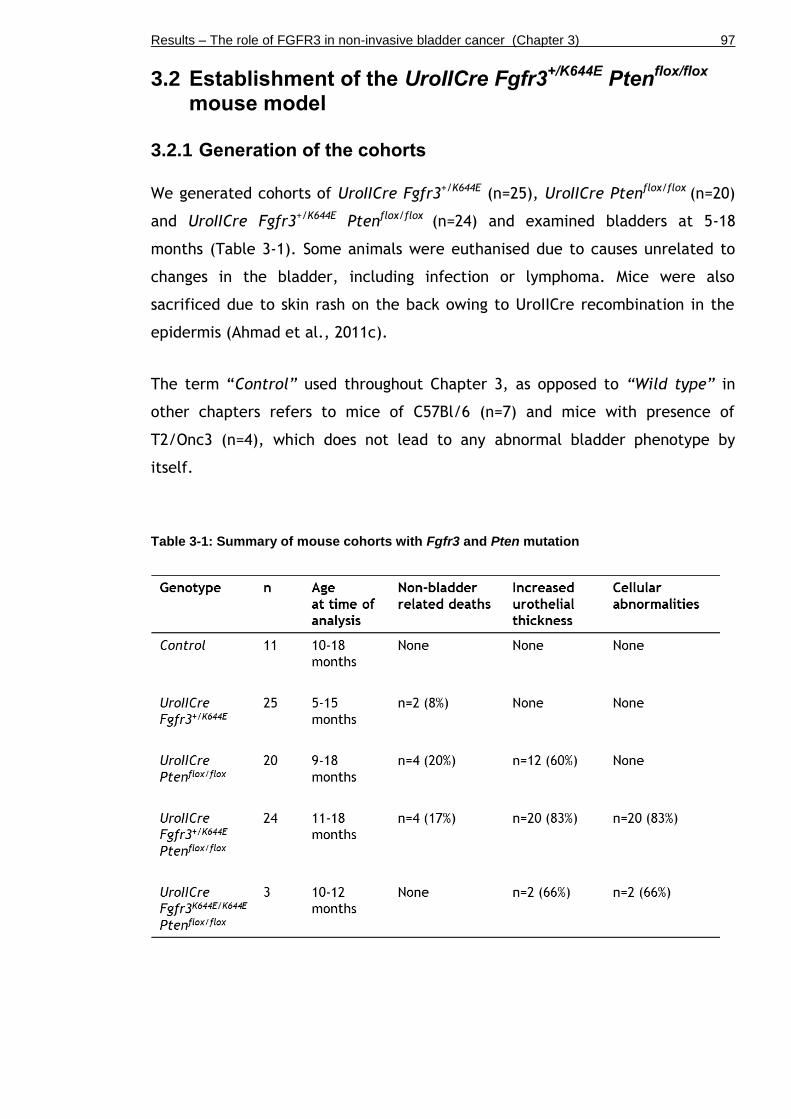
Results – The role of FGFR3 in non-invasive bladder cancer (Chapter 3) 97
3.2 Establishment of the UroIICre Fgfr3+/K644E
Ptenflox/flox
mouse model
3.2.1 Generation of the cohorts
We generated cohorts of UroIICre Fgfr3+/K644E (n=25), UroIICre Ptenflox/flox (n=20)
and UroIICre Fgfr3+/K644E Ptenflox/flox (n=24) and examined bladders at 5-18
months (Table 3-1). Some animals were euthanised due to causes unrelated to
changes in the bladder, including infection or lymphoma. Mice were also
sacrificed due to skin rash on the back owing to UroIICre recombination in the
epidermis (Ahmad et al., 2011c).
The term “Control” used throughout Chapter 3, as opposed to “Wild type” in
other chapters refers to mice of C57Bl/6 (n=7) and mice with presence of
T2/Onc3 (n=4), which does not lead to any abnormal bladder phenotype by
itself.
Table 3-1: Summary of mouse cohorts with Fgfr3 and Pten mutation

Results – The role of FGFR3 in non-invasive bladder cancer (Chapter 3) 98
3.2.2 FGFR3 and PTEN protein expression
Protein levels of the targeted genes were assessed by immunohistochemistry in
n=3 samples per genotype (Figure 3-1). We detected similar levels and patterns
of FGFR3 protein expression in the urothelium of Control (A) and UroIICre
Fgfr3+/K644E (C) as we have reported previously (Ahmad et al., 2011c). FGFR3
levels were also similar in UroIICre Ptenflox/flox (E) and UroIICre Fgfr3+/K644E
Ptenflox/flox (G), indicating that FGFR3 expression was neither influenced by Fgfr3
mutation nor deletion of Pten.
Levels of PTEN protein were similarly low in Control (B) and UroIICre Fgfr3+/K644E
(D), indicating that PTEN expression is unaltered in the presence of Fgfr3 K644E
mutation. Knockdown of Pten expression in the urothelium of UroIICre
Ptenflox/flox was considered as successful (F).
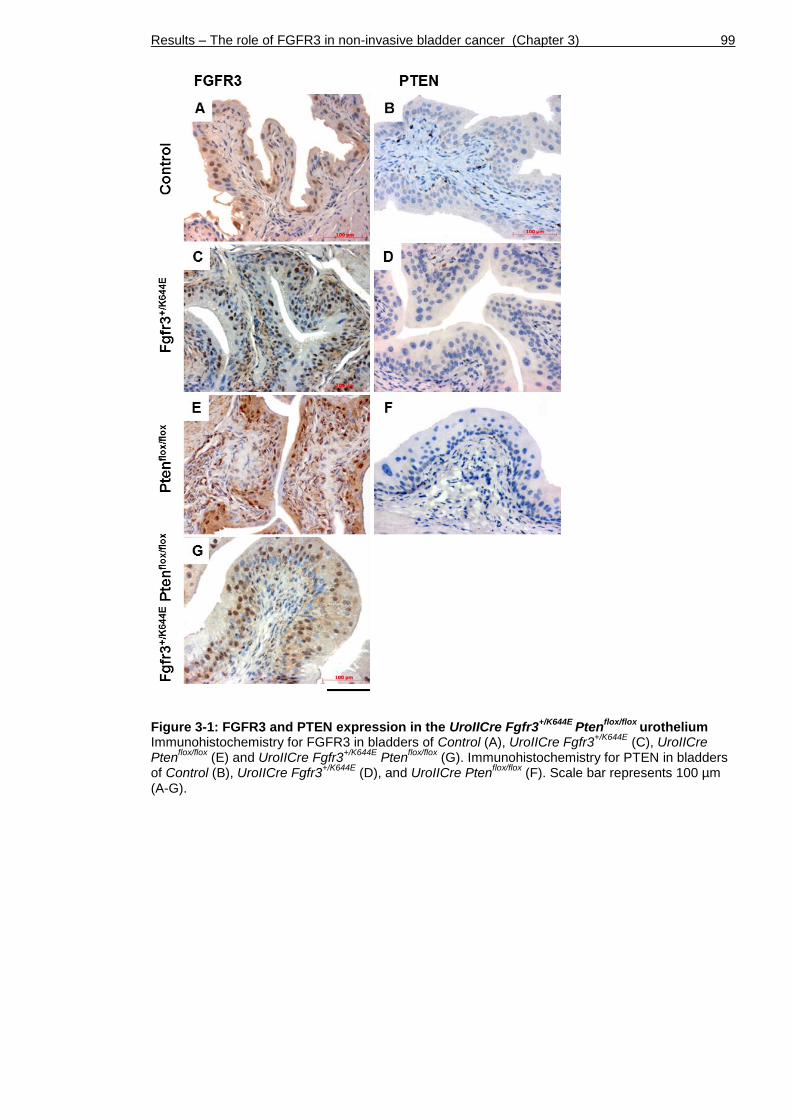
Results – The role of FGFR3 in non-invasive bladder cancer (Chapter 3) 99
Figure 3-1: FGFR3 and PTEN expression in the UroIICre Fgfr3+/K644E
Ptenflox/flox
urothelium Immunohistochemistry for FGFR3 in bladders of Control (A), UroIICre Fgfr3
+/K644E (C), UroIICre
Ptenflox/flox
(E) and UroIICre Fgfr3+/K644E
Ptenflox/flox
(G). Immunohistochemistry for PTEN in bladders of Control (B), UroIICre Fgfr3
+/K644E (D), and UroIICre Pten
flox/flox (F). Scale bar represents 100 µm
(A-G).
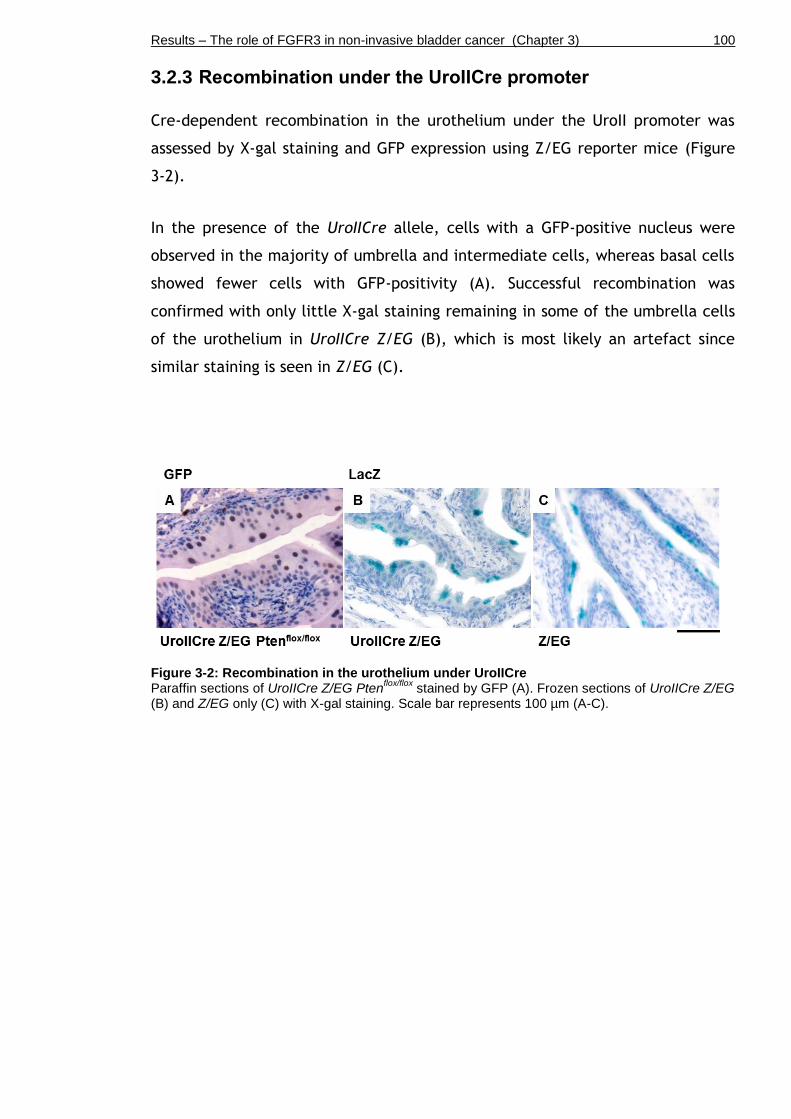
Results – The role of FGFR3 in non-invasive bladder cancer (Chapter 3) 100
3.2.3 Recombination under the UroIICre promoter
Cre-dependent recombination in the urothelium under the UroII promoter was
assessed by X-gal staining and GFP expression using Z/EG reporter mice (Figure
3-2).
In the presence of the UroIICre allele, cells with a GFP-positive nucleus were
observed in the majority of umbrella and intermediate cells, whereas basal cells
showed fewer cells with GFP-positivity (A). Successful recombination was
confirmed with only little X-gal staining remaining in some of the umbrella cells
of the urothelium in UroIICre Z/EG (B), which is most likely an artefact since
similar staining is seen in Z/EG (C).
Figure 3-2: Recombination in the urothelium under UroIICre Paraffin sections of UroIICre Z/EG Pten
flox/flox stained by GFP (A). Frozen sections of UroIICre Z/EG
(B) and Z/EG only (C) with X-gal staining. Scale bar represents 100 µm (A-C).

Results – The role of FGFR3 in non-invasive bladder cancer (Chapter 3) 101
3.3 Increased thickness of the UroIICre Fgfr3+/K644E
Pten
flox/flox urothelium
To see the effect of Pten deletion together with Fgfr3 mutation in the
urothelium, we analysed H&E-stained sections of Wild type (Control), UroIICre
Fgfr3+/K644E, UroIICre Ptenflox/flox, and UroIICre Fgfr3+/K644E Ptenflox/flox (Figure
3-3).
The UroIICre Fgfr3+/K644E urothelium (n=25) (b, f) appeared similar to that of
Control (n=11) (a, e) in regards to the morphology of the three layers, namely
umbrella, intermediate and basal cells (e, insert). A mild increase in urothelial
thickness was observed in UroIICre Ptenflox/flox (n=12 out of 20, 60%) (c, g).
Furthermore, we observed a severe increase in thickness in the urothelium of
UroIICre Fgfr3+/K644E Ptenflox/flox bladders (n=20 out of 24, 83%) (d, h) compared to
Control.
Figure 3-3: Increased thickness of the UroIICre Fgfr3+/K644E
Ptenflox/flox
urothelium by H&E Representative H&E sections of Control (a, e), UroIICre Fgfr3
+/K644E (b, f), UroIICre Pten
flox/flox (c, g),
and UroIICre Fgfr3+/K644E
Ptenflox/flox
(d, h) at low (a-d) and high magnification (e-h). Scale bar represents 200 µm in panel a-d and 100 µm in panel e-h.

Results – The role of FGFR3 in non-invasive bladder cancer (Chapter 3) 102
We have quantified the changes in urothelial thickness in mice aged to 11-18
months. Consistent with our previous observations (Ahmad et al., 2011c, Ahmad
et al., 2011a), we found no significant difference in urothelial thickness between
UroIICre Fgfr3+/K644E and Control, or between UroIICre Ptenflox/flox and Control
(Figure 3-4). There was no significant difference when UroIICre Fgfr3+/K644E and
UroIICre Ptenflox/flox were compared. However, urothelial thickness was
significantly increased when both mutations were present in UroIICre Fgfr3+/K644E
Ptenflox/flox (n=13) compared to either UroIICre Fgfr3+/K644E (n=9) (p=0.00005,
Mann-Whitney test) and UroIICre Ptenflox/flox (n=7) (p=0.00049), suggesting that
this increase is owing to the cooperation of Fgfr3 and Pten mutation.
Figure 3-4: Quantification of thickness in UroIICre Fgfr3+/K644E
Ptenflox/flox
urothelium Thickness of the urothelium in Control, UroIICre Fgfr3
+/K644E (Fgfr3), UroIICre Pten
flox/flox (Pten) and
UroIICre Fgfr3+/K644E
Ptenflox/flox
(Fgfr3 Pten).

Results – The role of FGFR3 in non-invasive bladder cancer (Chapter 3) 103
We have also analysed the effect of homozygous mutation in Fgfr3 (UroIICre
Fgfr3K644E/K644E) (Figure 3-5). The urothelium of UroIICre Fgfr3K644E/K644E mice
indeed showed thickening (n=11 out of 12) (A, B). Furthermore, mice with
double homozygous mutations in Fgfr3 and Pten (UroIICre Fgfr3K644E/K644E
Ptenflox/flox) revealed a similar phenotype to that of UroIICre Fgfr3+/K644E
Ptenflox/flox (n=2 out of 3) (C, D).
Figure 3-5: Thickening of the urothelium in UroIICre Fgfr3K644E/K644E
and UroIICre Fgfr3
K644E/K644E Pten
flox/flox
Representative H&E sections of bladders of UroIICre Fgfr3K644E/K644E
(A, B) and UroIICre Fgfr3
K644E/K644E Pten
flox/flox (C, D). Scale bar represents 100 µm (A-D).
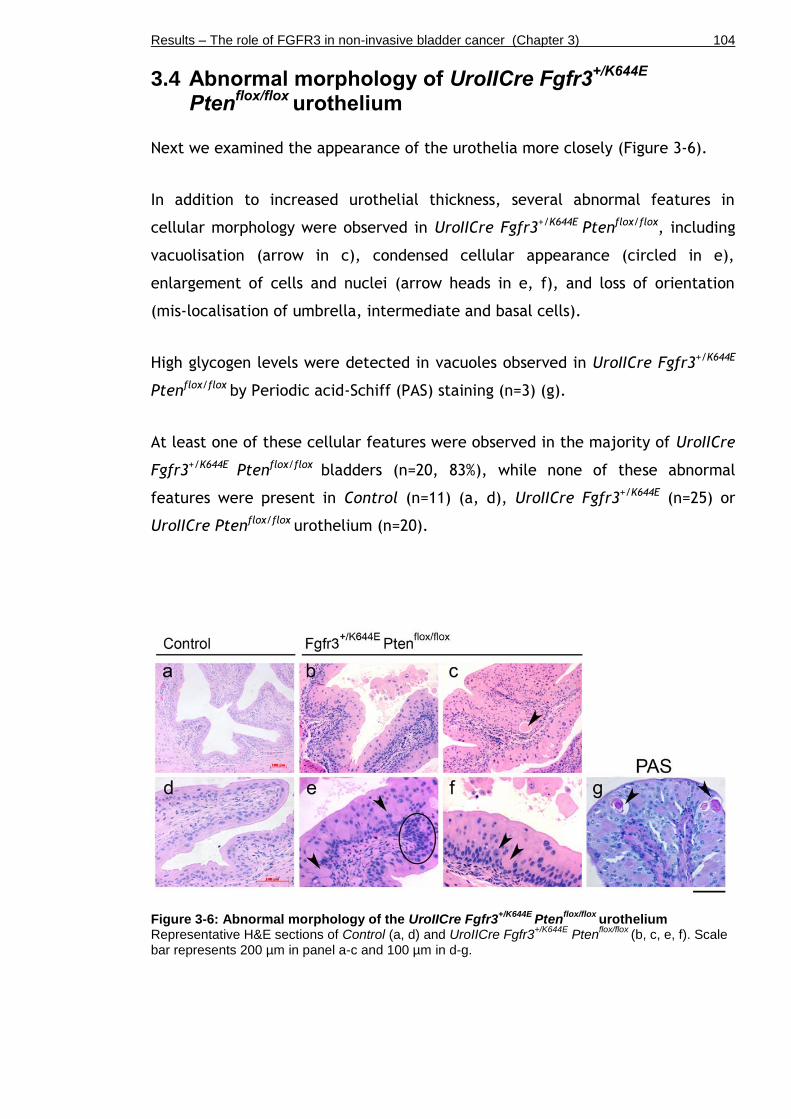
Results – The role of FGFR3 in non-invasive bladder cancer (Chapter 3) 104
3.4 Abnormal morphology of UroIICre Fgfr3+/K644E
Pten
flox/flox urothelium
Next we examined the appearance of the urothelia more closely (Figure 3-6).
In addition to increased urothelial thickness, several abnormal features in
cellular morphology were observed in UroIICre Fgfr3+/K644E Ptenflox/flox, including
vacuolisation (arrow in c), condensed cellular appearance (circled in e),
enlargement of cells and nuclei (arrow heads in e, f), and loss of orientation
(mis-localisation of umbrella, intermediate and basal cells).
High glycogen levels were detected in vacuoles observed in UroIICre Fgfr3+/K644E
Ptenflox/flox by Periodic acid-Schiff (PAS) staining (n=3) (g).
At least one of these cellular features were observed in the majority of UroIICre
Fgfr3+/K644E Ptenflox/flox bladders (n=20, 83%), while none of these abnormal
features were present in Control (n=11) (a, d), UroIICre Fgfr3+/K644E (n=25) or
UroIICre Ptenflox/flox urothelium (n=20).
Figure 3-6: Abnormal morphology of the UroIICre Fgfr3+/K644E
Ptenflox/flox
urothelium Representative H&E sections of Control (a, d) and UroIICre Fgfr3
+/K644E Pten
flox/flox (b, c, e, f). Scale
bar represents 200 µm in panel a-c and 100 µm in d-g.

Results – The role of FGFR3 in non-invasive bladder cancer (Chapter 3) 105
3.5 Differential expression of layer-specific markers
In order to see whether the abnormal phenotype is caused by a change in
urothelial cell identities, the bladders were stained with urothelial markers well-
established in mice (Figure 3-7).
UroplakinII (UroII) is a marker for umbrella and some intermediate cells (Kong,
2004), while Cytokeratin 5 (CK5) is expressed in basal cells of the normal
urothelium (Shin et al., 2011, Castillo-Martin et al., 2010) (a, b).
However, in the UroIICre Fgfr3+/K644E Ptenflox/flox urothelium, UroII-positive cells
were present in deeper layers close to the submucosa, while CK5 expression was
absent in some parts of the innermost layers of the urothelium, showing an
inverse expression pattern (e, f, i, j).
Furthermore, p63, which is normally present in the nuclei of basal and
intermediate cells (Castillo-Martin et al., 2010) (c), showed a disorganised
expression pattern (g, k).
Double staining of CK18, an alternative marker of umbrella cells in mice
(Castillo-Martin et al., 2010), together with CK5 clearly showed the abnormal
localisation of CK18-positive cells deep in the urothelium of UroIICre Fgfr3+/K644E
Ptenflox/flox (h, l), indicating abnormal differentiation of urothelial cells in
UroIICre Fgfr3+/K644E Ptenflox/flox.
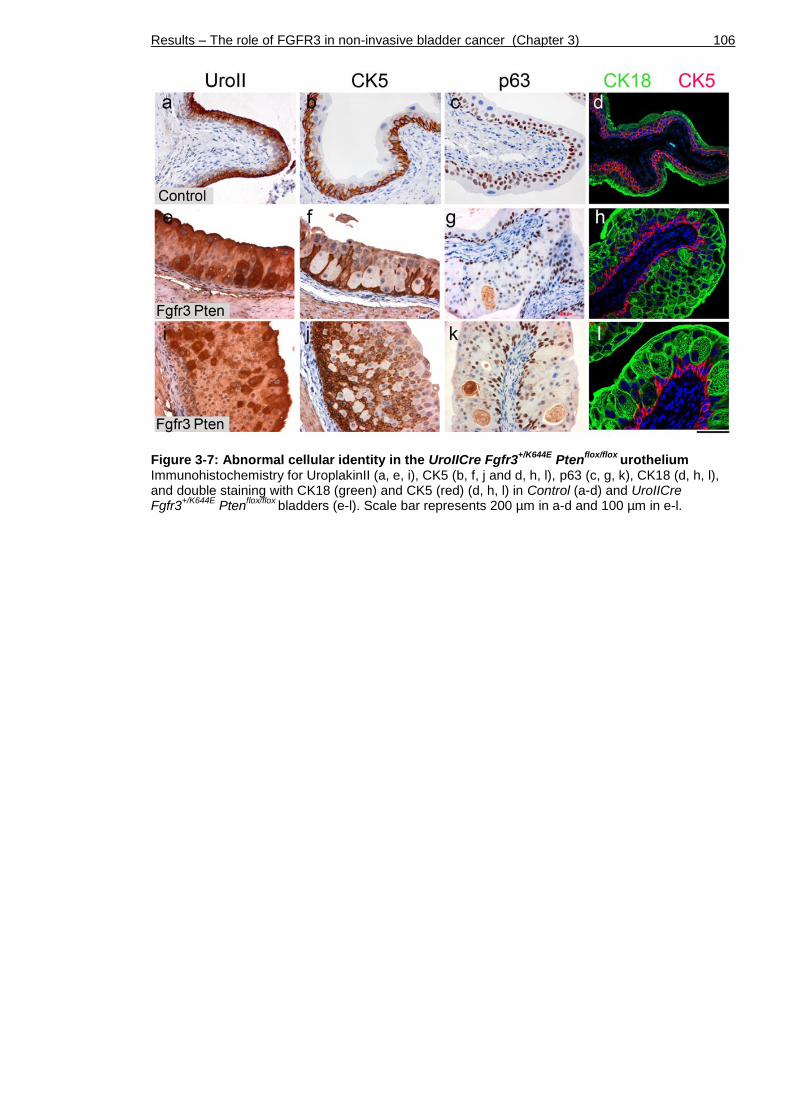
Results – The role of FGFR3 in non-invasive bladder cancer (Chapter 3) 106
Figure 3-7: Abnormal cellular identity in the UroIICre Fgfr3+/K644E
Ptenflox/flox
urothelium Immunohistochemistry for UroplakinII (a, e, i), CK5 (b, f, j and d, h, l), p63 (c, g, k), CK18 (d, h, l), and double staining with CK18 (green) and CK5 (red) (d, h, l) in Control (a-d) and UroIICre Fgfr3
+/K644E Pten
flox/flox bladders (e-l). Scale bar represents 200 µm in a-d and 100 µm in e-l.

Results – The role of FGFR3 in non-invasive bladder cancer (Chapter 3) 107
3.6 Increase in the size of intermediate cells in UroIICre Fgfr3
+/K644E Pten
flox/flox urothelium
The increase in the urothelial thickness can be caused by deregulation of cell
size and/or cell number.
We first addressed whether these were due to changes in cell size, and if so,
whether the cell size change was seen in specific urothelial cell populations
(Figure 3-8). An example of E-cadherin staining is shown in UroIICre Fgfr3+/K644E
Ptenflox/flox bladder (a), in which cells are lined in red for the measurement of
surface area.
No significant difference in cell size was observed in the innermost basal and
outermost umbrella layers among the cohorts (b, d). In contrast, in the
intermediate layer (between the inner and outermost layers), while Fgfr3
mutation alone did not influence the cell size (UroIICre Fgfr3+/K644E, n=5), Pten
mutation alone (UroIICre Ptenflox/flox, n=6) increased the cell size compared to
Control (n=5, p=0.017, Mann-Whitney test) (c). Furthermore, the presence of
both Fgfr3 and Pten mutations (UroIICre Fgfr3+/K644E Ptenflox/flox urothelia, n=10)
further increased the cell size comparing to Fgfr3 mutation alone (p=0.001), as
well as to Pten alone (p=0.016), suggesting that the Fgfr3 mutation cooperates
with the Pten loss to further increase the cell size.

Results – The role of FGFR3 in non-invasive bladder cancer (Chapter 3) 108
Figure 3-8: Differential effects of Fgfr3 and Pten mutations in regulation of cell size in the urothelium Example of cell surface measurement on E-cadherin-stained section (a). The sizes of umbrella (b), intermediate (c) and basal cells (d) among the different genotypes.
Results – The role of FGFR3 in non-invasive bladder cancer (Chapter 3) 109
3.7 Increased proliferation in UroIICre Fgfr3+/K644E
Pten
flox/flox urothelium
Next we examined the proliferation in the urothelium by Ki67
immunohistochemistry (Figure 3-9). Albeit in a relatively small number of cells,
Ki67 positivity was identified in all layers of the urothelium, including umbrella
cells (a) (Castillo-Martin et al., 2010).
Taken all layers together, a significant increase in Ki67-positive cells was seen in
the presence of both Fgfr3 and Pten mutation (UroIICre Fgfr3+/K644E Ptenflox/flox,
n=9, p=0.004), as well as in the presence of Pten mutation only (UroIICre
Ptenflox/flox, n=6, p=0.009, Mann-Whitney test), compared to Fgfr3 mutation only
(UroIICre Fgfr3+/K644E, n=5) (c). This indicates that cell proliferation was
increased due to Pten loss.
Similar effects were observed in the outermost umbrella and intermediate layer
(d, e), while no significant changes were seen in the innermost basal layer (f).
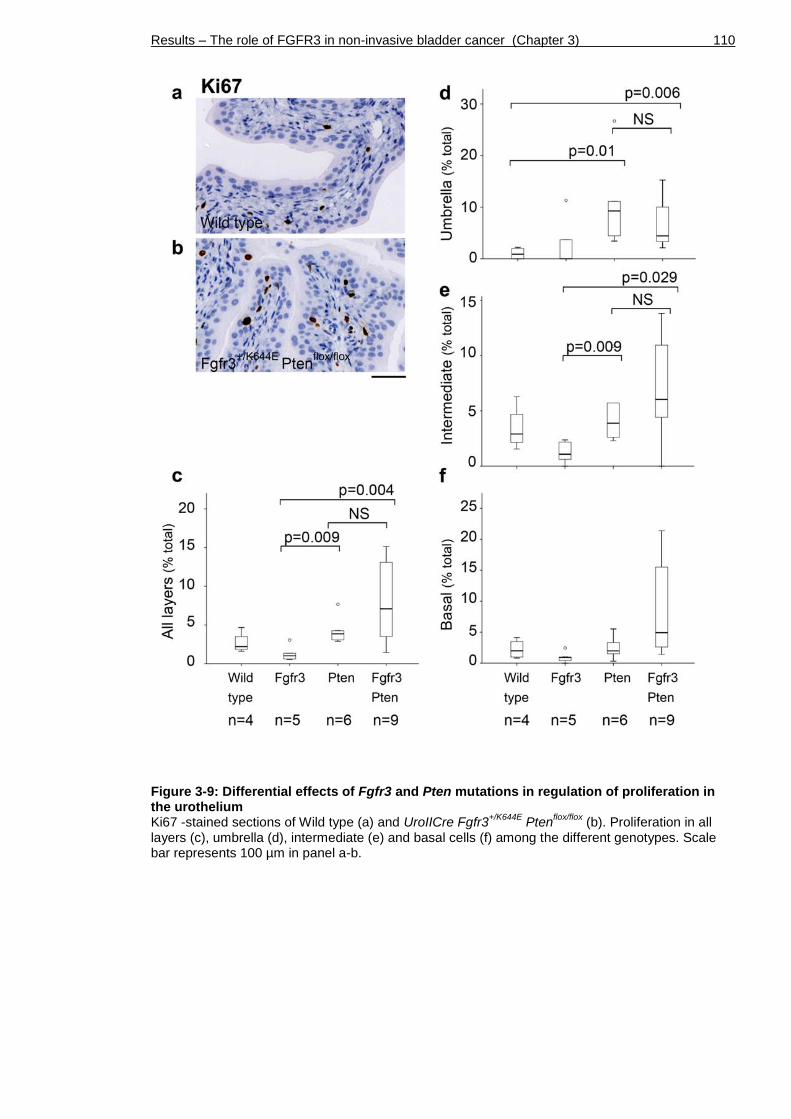
Results – The role of FGFR3 in non-invasive bladder cancer (Chapter 3) 110
Figure 3-9: Differential effects of Fgfr3 and Pten mutations in regulation of proliferation in the urothelium Ki67 -stained sections of Wild type (a) and UroIICre Fgfr3
+/K644E Pten
flox/flox (b). Proliferation in all
layers (c), umbrella (d), intermediate (e) and basal cells (f) among the different genotypes. Scale bar represents 100 µm in panel a-b.

Results – The role of FGFR3 in non-invasive bladder cancer (Chapter 3) 111
3.8 Increased apoptosis in the UroIICre Fgfr3+/K644E
urothelium
We have also examined apoptotic events (Figure 3-10). Very few apoptotic
events were observed in the urothelium of all cohorts including Control (a) and
UroIICre Fgfr3+/K644E Ptenflox/flox urothelium (b).
Overall, apoptosis was significantly increased when both Fgfr3 and Pten
mutations were present (UroIICre Fgfr3+/K644E Ptenflox/flox, n=10) or Fgfr3
mutation alone (UroIICre Fgfr3+/K644E, n=5) compared to UroIICre Ptenflox/flox
(p=0.004 and 0.032, respectively, Mann-Whitney test) (c). As there was no
additional increase with both mutations together comparing to Fgfr3 mutation
alone, the increase in the apoptosis is likely to be owing to the Fgfr3 mutation.
Similar effects were observed in the outermost umbrella and intermediate cell
layers (d, e).
In contrast, in the innermost basal cell layer, apoptotic events were increased
when Pten mutation was present (UroIICre Ptenflox/flox, n=5) (f). However, the
overall small number of apoptotic cells in the basal layer made the
interpretation of results difficult.
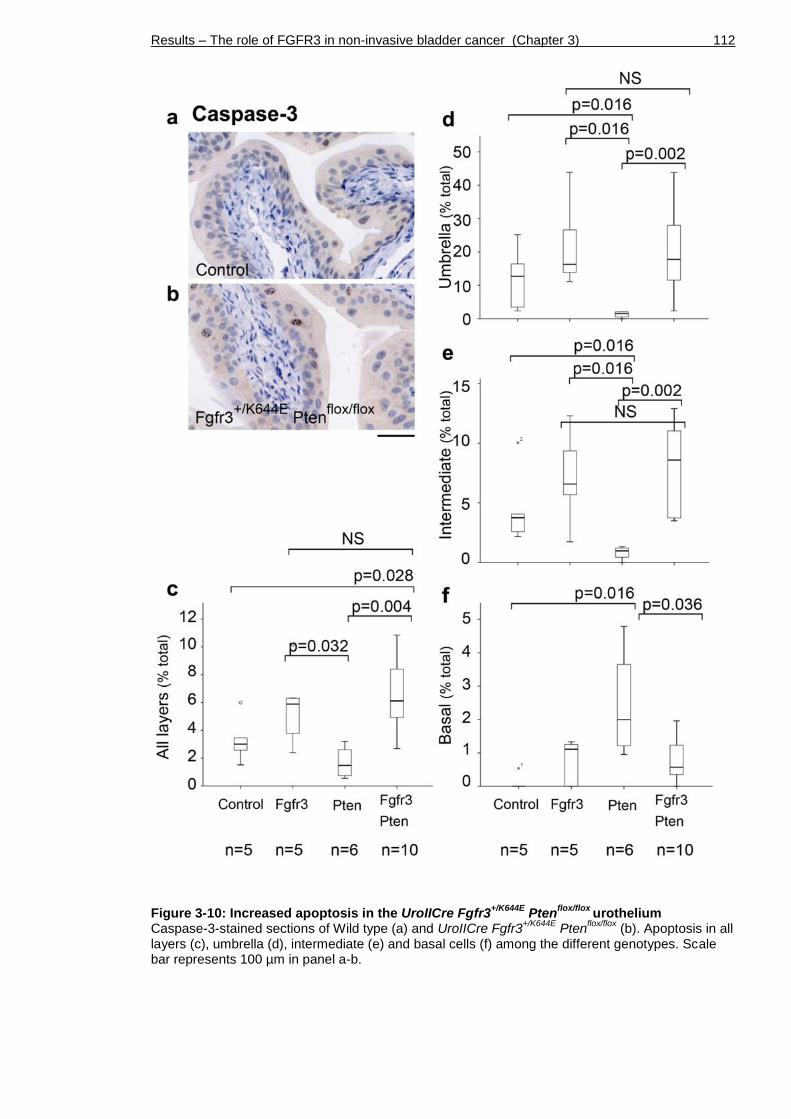
Results – The role of FGFR3 in non-invasive bladder cancer (Chapter 3) 112
Figure 3-10: Increased apoptosis in the UroIICre Fgfr3+/K644E
Ptenflox/flox
urothelium Caspase-3-stained sections of Wild type (a) and UroIICre Fgfr3
+/K644E Pten
flox/flox (b). Apoptosis in all
layers (c), umbrella (d), intermediate (e) and basal cells (f) among the different genotypes. Scale bar represents 100 µm in panel a-b.
Results – The role of FGFR3 in non-invasive bladder cancer (Chapter 3) 113
3.9 Changes in MAPK/AKT signalling and cell cycle regulation
To examine underlying mechanisms leading to the observed phenotype, we
addressed how Fgfr3 and Pten mutations altered their downstream signalling
cascades. The activation of MAPK and PI3K-AKT pathways were characterised in
the bladder using antibodies that recognise the phosphorylated forms of ERK1/2
(pERK1/2) and AKT (Ser473) (pAKT), respectively (Figure 3-11).
In Controls, phosphorylated ERK1/2 (pERK1/2) was observed in a cell-specific
fashion in the urothelium, however not limited to a particular layer (n=9) (a).
Staining was similar in UroIICre Fgfr3+/K644E (n=9) and UroIICre Ptenflox/flox (n=9)
(d, g). In contrast, in UroIICre Fgfr3+/K644E Ptenflox/flox samples (n=9/12, 75%)
pERK1/2 was seen in all layers in a cell-specific fashion (j), which resembles the
overall pattern of UroII and CK5 staining (Figure 3-7).
Phosphorylated AKT (Ser473) (pAKT) was absent in Control (n=3), UroIICre
Fgfr3+/K644E (n=6) and UroIICre Ptenflox/flox (n=7) (Figure 3-11 b, e, h), but up-
regulated in 55% of UroIICre Fgfr3+/K644E Ptenflox/flox samples (n=6/11, k).
p21 was present most abundantly in the outermost umbrella layer in Control
(n=3) (c), and this remained similar in UroIICre Fgfr3+/K644E (n=3) and UroIICre
Ptenflox/flox (n=3) (f, i). However, in UroIICre Fgfr3+/K644E Ptenflox/flox urothelium
(n=4), p21 was expressed throughout all urothelial layers (l). This p21
upregulation appeared to have coincided with the overall up-regulation of PI3K-
AKT signalling (k).

Results – The role of FGFR3 in non-invasive bladder cancer (Chapter 3) 114
Figure 3-11: Deregulation of downstream signalling and cell cycle arrest in the UroIICre Fgfr3
+/K644E Pten
flox/flox urothelium
Immunohistochemistry for phosphorylated ERK (pERK) (a, d, g, j), phosphorylated AKT (pAKT) (b, e, h, k) and p21 (c, f, i, l) on Control (a-c), UroIICre Fgfr3
+/K644E (d-f), UroIICre Pten
flox/flox (g-i), and
UroIICre Fgfr3+/K644E
Ptenflox/flox
bladders (j-l). Scale bar represents 50 µm in a, b, d, e, g, h, j, k, and 100 µm in c, f, i, l.
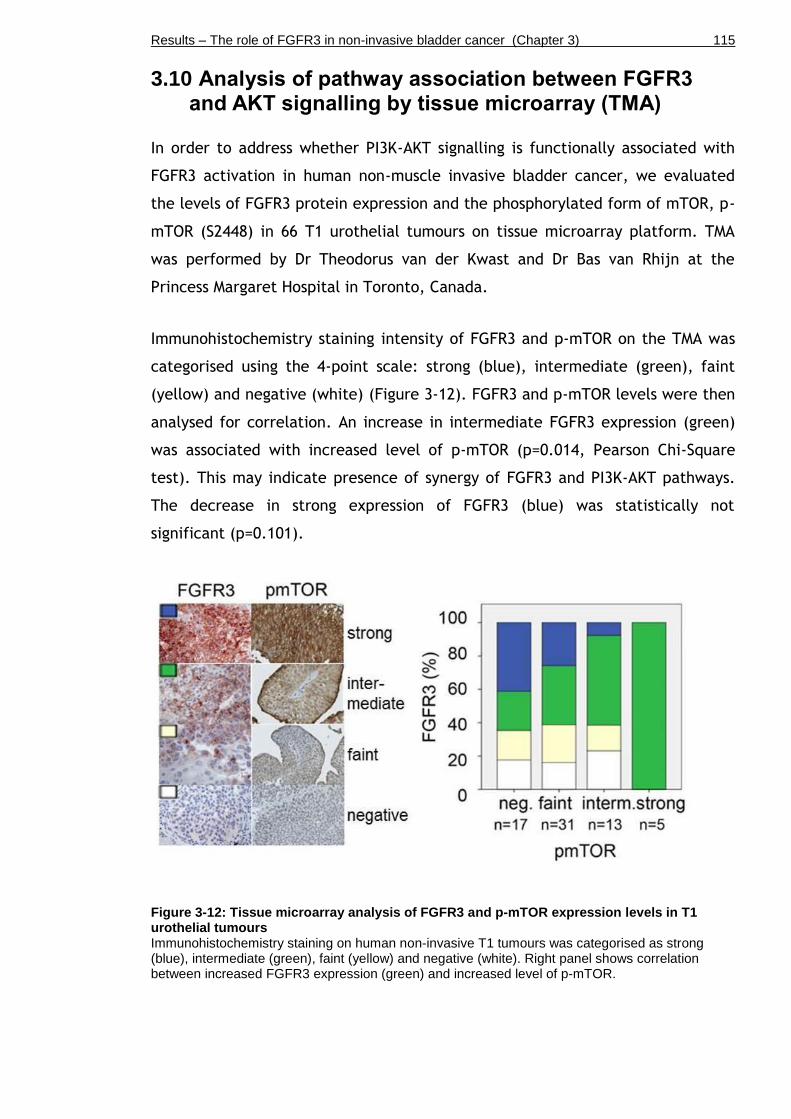
Results – The role of FGFR3 in non-invasive bladder cancer (Chapter 3) 115
3.10 Analysis of pathway association between FGFR3 and AKT signalling by tissue microarray (TMA)
In order to address whether PI3K-AKT signalling is functionally associated with
FGFR3 activation in human non-muscle invasive bladder cancer, we evaluated
the levels of FGFR3 protein expression and the phosphorylated form of mTOR, p-
mTOR (S2448) in 66 T1 urothelial tumours on tissue microarray platform. TMA
was performed by Dr Theodorus van der Kwast and Dr Bas van Rhijn at the
Princess Margaret Hospital in Toronto, Canada.
Immunohistochemistry staining intensity of FGFR3 and p-mTOR on the TMA was
categorised using the 4-point scale: strong (blue), intermediate (green), faint
(yellow) and negative (white) (Figure 3-12). FGFR3 and p-mTOR levels were then
analysed for correlation. An increase in intermediate FGFR3 expression (green)
was associated with increased level of p-mTOR (p=0.014, Pearson Chi-Square
test). This may indicate presence of synergy of FGFR3 and PI3K-AKT pathways.
The decrease in strong expression of FGFR3 (blue) was statistically not
significant (p=0.101).
Figure 3-12: Tissue microarray analysis of FGFR3 and p-mTOR expression levels in T1 urothelial tumours Immunohistochemistry staining on human non-invasive T1 tumours was categorised as strong (blue), intermediate (green), faint (yellow) and negative (white). Right panel shows correlation between increased FGFR3 expression (green) and increased level of p-mTOR.

Results – The role of FGFR3 in non-invasive bladder cancer (Chapter 3) 116
Similar trends were observed when the levels were characterised in each tumour
grade (Figure 3-13). The increasing trend of intermediate expression of FGFR3
(green) along the increased p-mTOR level was not statistically significant in non-
invasive low-grade (a) and high-grade (b) papillary urothelial carcinoma
according to WHO 2004 classification system, and G2 (c) and G3 (d) according to
WHO 1973 classification system (p=0.579, 0.056, 0.124, and 0.058, in a-d,
respectively). This may be due to the low number of available samples
indicated.

Results – The role of FGFR3 in non-invasive bladder cancer (Chapter 3) 117
Figure 3-13: Tissue microarray analysis of FGFR3 and p-mTOR expression levels according to tumour grade Non-invasive low-grade (a) and high-grade (b) papillary urothelial carcinoma according to WHO 2004 classification system, and G2 (c) and G3 (d) according to WHO 1973 classification system
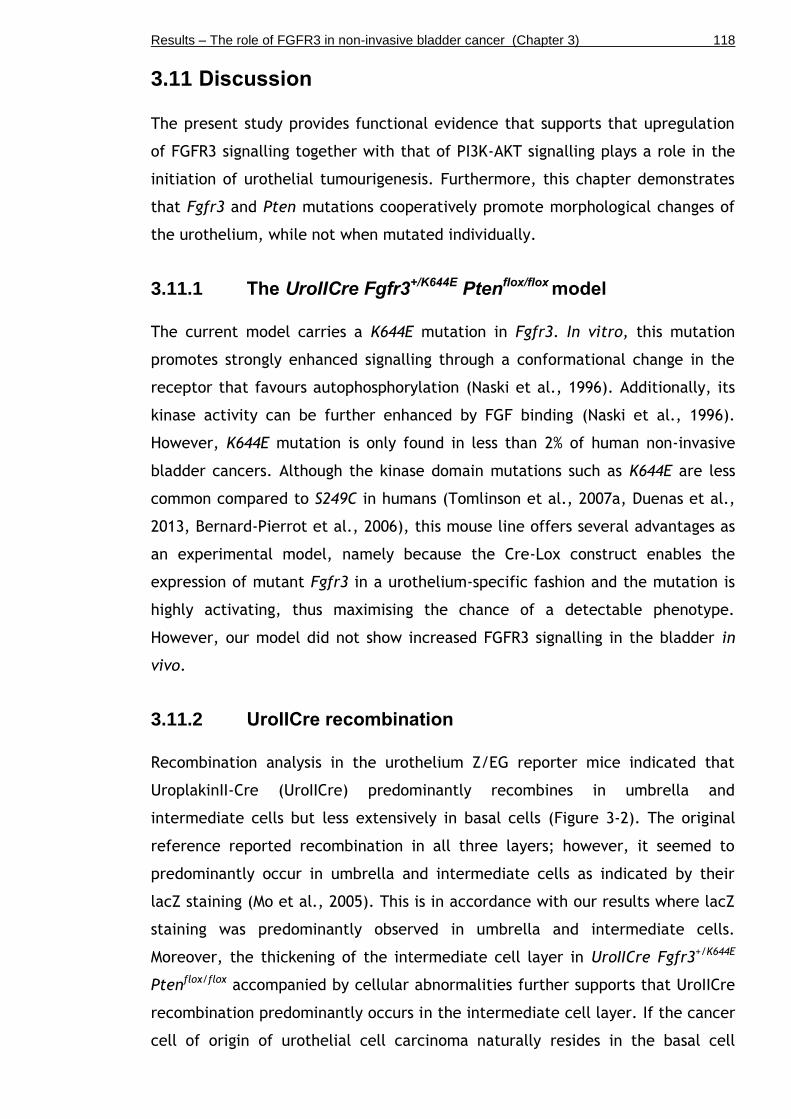
Results – The role of FGFR3 in non-invasive bladder cancer (Chapter 3) 118
3.11 Discussion
The present study provides functional evidence that supports that upregulation
of FGFR3 signalling together with that of PI3K-AKT signalling plays a role in the
initiation of urothelial tumourigenesis. Furthermore, this chapter demonstrates
that Fgfr3 and Pten mutations cooperatively promote morphological changes of
the urothelium, while not when mutated individually.
3.11.1 The UroIICre Fgfr3+/K644E Ptenflox/flox model
The current model carries a K644E mutation in Fgfr3. In vitro, this mutation
promotes strongly enhanced signalling through a conformational change in the
receptor that favours autophosphorylation (Naski et al., 1996). Additionally, its
kinase activity can be further enhanced by FGF binding (Naski et al., 1996).
However, K644E mutation is only found in less than 2% of human non-invasive
bladder cancers. Although the kinase domain mutations such as K644E are less
common compared to S249C in humans (Tomlinson et al., 2007a, Duenas et al.,
2013, Bernard-Pierrot et al., 2006), this mouse line offers several advantages as
an experimental model, namely because the Cre-Lox construct enables the
expression of mutant Fgfr3 in a urothelium-specific fashion and the mutation is
highly activating, thus maximising the chance of a detectable phenotype.
However, our model did not show increased FGFR3 signalling in the bladder in
vivo.
3.11.2 UroIICre recombination
Recombination analysis in the urothelium Z/EG reporter mice indicated that
UroplakinII-Cre (UroIICre) predominantly recombines in umbrella and
intermediate cells but less extensively in basal cells (Figure 3-2). The original
reference reported recombination in all three layers; however, it seemed to
predominantly occur in umbrella and intermediate cells as indicated by their
lacZ staining (Mo et al., 2005). This is in accordance with our results where lacZ
staining was predominantly observed in umbrella and intermediate cells.
Moreover, the thickening of the intermediate cell layer in UroIICre Fgfr3+/K644E
Ptenflox/flox accompanied by cellular abnormalities further supports that UroIICre
recombination predominantly occurs in the intermediate cell layer. If the cancer
cell of origin of urothelial cell carcinoma naturally resides in the basal cell
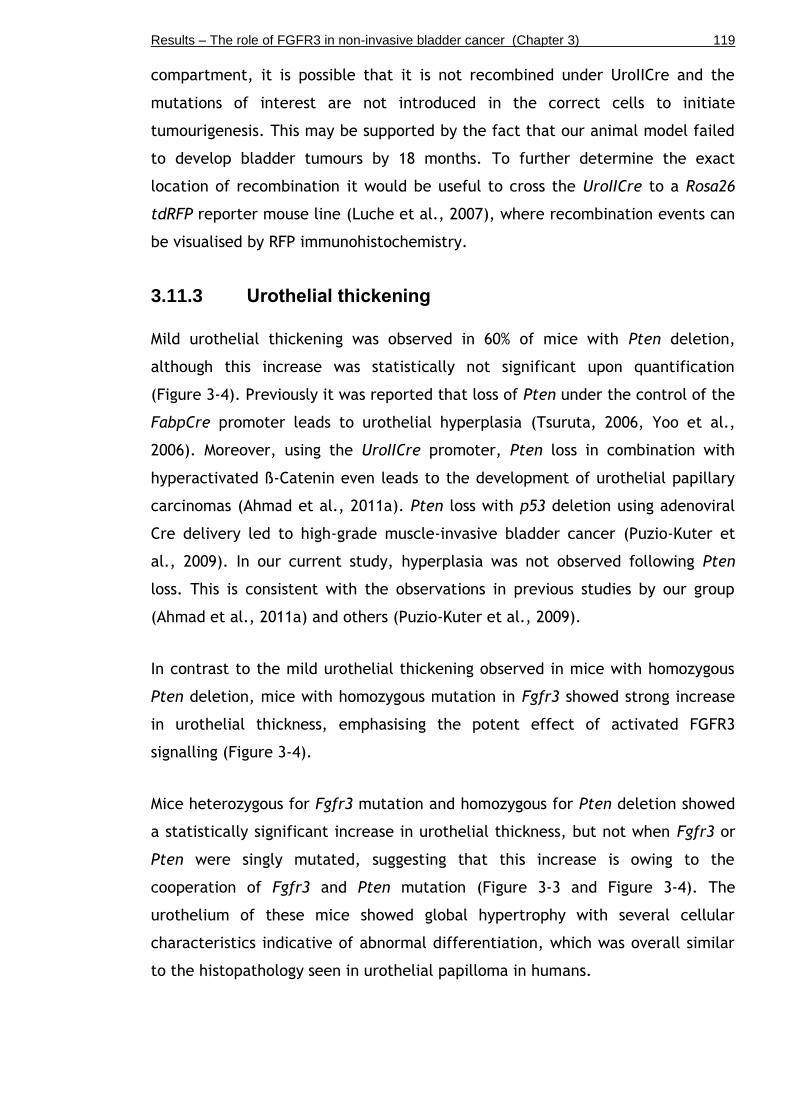
Results – The role of FGFR3 in non-invasive bladder cancer (Chapter 3) 119
compartment, it is possible that it is not recombined under UroIICre and the
mutations of interest are not introduced in the correct cells to initiate
tumourigenesis. This may be supported by the fact that our animal model failed
to develop bladder tumours by 18 months. To further determine the exact
location of recombination it would be useful to cross the UroIICre to a Rosa26
tdRFP reporter mouse line (Luche et al., 2007), where recombination events can
be visualised by RFP immunohistochemistry.
3.11.3 Urothelial thickening
Mild urothelial thickening was observed in 60% of mice with Pten deletion,
although this increase was statistically not significant upon quantification
(Figure 3-4). Previously it was reported that loss of Pten under the control of the
FabpCre promoter leads to urothelial hyperplasia (Tsuruta, 2006, Yoo et al.,
2006). Moreover, using the UroIICre promoter, Pten loss in combination with
hyperactivated ß-Catenin even leads to the development of urothelial papillary
carcinomas (Ahmad et al., 2011a). Pten loss with p53 deletion using adenoviral
Cre delivery led to high-grade muscle-invasive bladder cancer (Puzio-Kuter et
al., 2009). In our current study, hyperplasia was not observed following Pten
loss. This is consistent with the observations in previous studies by our group
(Ahmad et al., 2011a) and others (Puzio-Kuter et al., 2009).
In contrast to the mild urothelial thickening observed in mice with homozygous
Pten deletion, mice with homozygous mutation in Fgfr3 showed strong increase
in urothelial thickness, emphasising the potent effect of activated FGFR3
signalling (Figure 3-4).
Mice heterozygous for Fgfr3 mutation and homozygous for Pten deletion showed
a statistically significant increase in urothelial thickness, but not when Fgfr3 or
Pten were singly mutated, suggesting that this increase is owing to the
cooperation of Fgfr3 and Pten mutation (Figure 3-3 and Figure 3-4). The
urothelium of these mice showed global hypertrophy with several cellular
characteristics indicative of abnormal differentiation, which was overall similar
to the histopathology seen in urothelial papilloma in humans.

Results – The role of FGFR3 in non-invasive bladder cancer (Chapter 3) 120
Although mice with Fgfr3 mutation and Pten deletion showed a thickened
urothelium with increased proliferation, it did not produce tumours in the
animal model up to 18 months. This indicates that pathogenesis caused by FGFR3
and PI3K-AKT signalling pathway mutations are unlikely to progress unless
further mutations occur that overcome the intact cell cycle inhibitor machinery.
In humans, FGFR3 mutations are highly associated with non-muscle-invasive
bladder cancer with better clinical outcome (Billerey et al., 2001, van Rhijn et
al., 2002).
3.11.4 Abnormal urothelial differentiation
Significantly, while the papillary structures with fibro-vascular cores seen in
human non-muscle-invasive bladder cancer were not observed, the urothelium of
UroIICre Fgfr3+/K644E Ptenflox/flox did demonstrate several morphological
abnormalities that may reflect pathogenesis in humans. These included
increased urothelial thickness, caused by an increase in cell size and cell
proliferation, and loss of polarity (Figure 3-6 and Figure 3-7). These
histopathological features are comparable to hyperplasia and dysplasia,
regarded as early stages in the putative model of bladder cancer pathogenesis in
humans.
This functional cooperation was also reflected by the atypical expression of
layer-specific markers indicating abnormal differentiation and/or maturation of
cells in the UroIICre Fgfr3+/K644E Ptenflox/flox urothelium (Figure 3-7). UroplakinII-
positive cells were present in deeper layers close to the submucosa, while CK5
was absent in some parts of the deeper layers of the urothelium, showing an
inverse expression pattern. Double staining with CK18 together with CK5 clearly
showed the abnormal localisation of umbrella cells deep in the urothelium of
UroIICre Fgfr3+/K644E Ptenflox/flox, indicating abnormal differentiation and/or
maturation of cells as an effect of Fgfr3 and Pten mutation in combination. A
recent study in vitro showed similar large, vacuolated and flattened cell
morphology and increased proliferation of Normal Human Urothelial (NHU) cells
stably expressing hotspot PI3KCA mutations (Ross et al., 2013). Despite the
difference that these effects solely resulted from PIK3CA activation in vitro, the
findings are supportive of our observations in mice. This may reflect the

Results – The role of FGFR3 in non-invasive bladder cancer (Chapter 3) 121
complexity of signalling events leading to tumourigenesis in vivo, in which
multiple gene mutations and epigenetic events are likely to be required.
3.11.5 Cell size and cell number
The increase in intermediate cell size was observed owing to both Fgfr3 and
Pten mutations in combination, whereas that of cell proliferation was mainly an
effect of Pten deletion (Figure 3-8 and Figure 3-9). These results indicate that
Fgfr3 and Pten mutation cooperatively caused urothelial hypertrophy, while
Pten contributed to hyperplasia in the UroIICre Fgfr3+/K644E Ptenflox/flox
urothelium. The effects of Fgfr3 and Pten mutations were cell-type specific,
particularly in intermediate and umbrella cell layers. The basal cell layer was
not significantly affected in this model.
3.11.6 Changes in downstream signalling
Cooperation of Fgfr3 and Pten mutations seem to have resulted in deregulation
of the MAPK pathway in the double mutant, which may correlate with abnormal
differentiation and/or maturation of urothelial cells, indicating the local
involvement of the MAPK pathway in pathogenesis through regulation of cell
differentiation (Figure 3-11).
The observed p21 upregulation appeared to have coincided with the overall up-
regulation of PI3K-AKT signalling, which is in accordance with the evidence in
vitro that activation of PI3K-AKT pathway up-regulates p21 (Yohn et al., 2011).
The elucidation of precise causal mechanisms, however, requires further
studies.
Furthermore, up-regulation of pAKT was observed when both Fgfr3 and Pten
mutations together, and not in single mutants (Figure 3-11). In humans, a higher
pAKT level was found in 50% bladder tumours, independent of stage/grade and is
associated with the presence of mutations, including PIK3CA, FGFR3, and both
together (Juanpere et al., 2012).
Potential cooperation of the FGFR3 and the AKT pathways was further supported
by a TMA of human T1 samples where an increase in expression of FGFR3 protein
was correlated with increased level of p-mTOR (Figure 3-12). Activation of PI3K-
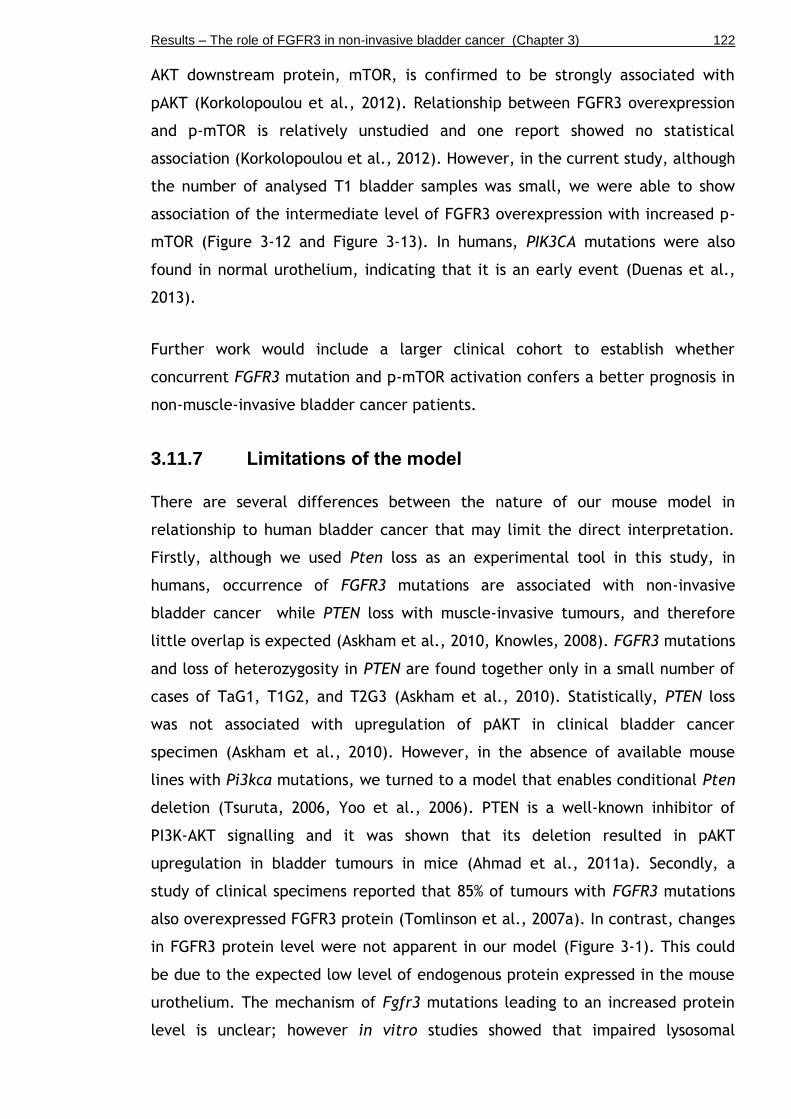
Results – The role of FGFR3 in non-invasive bladder cancer (Chapter 3) 122
AKT downstream protein, mTOR, is confirmed to be strongly associated with
pAKT (Korkolopoulou et al., 2012). Relationship between FGFR3 overexpression
and p-mTOR is relatively unstudied and one report showed no statistical
association (Korkolopoulou et al., 2012). However, in the current study, although
the number of analysed T1 bladder samples was small, we were able to show
association of the intermediate level of FGFR3 overexpression with increased p-
mTOR (Figure 3-12 and Figure 3-13). In humans, PIK3CA mutations were also
found in normal urothelium, indicating that it is an early event (Duenas et al.,
2013).
Further work would include a larger clinical cohort to establish whether
concurrent FGFR3 mutation and p-mTOR activation confers a better prognosis in
non-muscle-invasive bladder cancer patients.
3.11.7 Limitations of the model
There are several differences between the nature of our mouse model in
relationship to human bladder cancer that may limit the direct interpretation.
Firstly, although we used Pten loss as an experimental tool in this study, in
humans, occurrence of FGFR3 mutations are associated with non-invasive
bladder cancer while PTEN loss with muscle-invasive tumours, and therefore
little overlap is expected (Askham et al., 2010, Knowles, 2008). FGFR3 mutations
and loss of heterozygosity in PTEN are found together only in a small number of
cases of TaG1, T1G2, and T2G3 (Askham et al., 2010). Statistically, PTEN loss
was not associated with upregulation of pAKT in clinical bladder cancer
specimen (Askham et al., 2010). However, in the absence of available mouse
lines with Pi3kca mutations, we turned to a model that enables conditional Pten
deletion (Tsuruta, 2006, Yoo et al., 2006). PTEN is a well-known inhibitor of
PI3K-AKT signalling and it was shown that its deletion resulted in pAKT
upregulation in bladder tumours in mice (Ahmad et al., 2011a). Secondly, a
study of clinical specimens reported that 85% of tumours with FGFR3 mutations
also overexpressed FGFR3 protein (Tomlinson et al., 2007a). In contrast, changes
in FGFR3 protein level were not apparent in our model (Figure 3-1). This could
be due to the expected low level of endogenous protein expressed in the mouse
urothelium. The mechanism of Fgfr3 mutations leading to an increased protein
level is unclear; however in vitro studies showed that impaired lysosomal
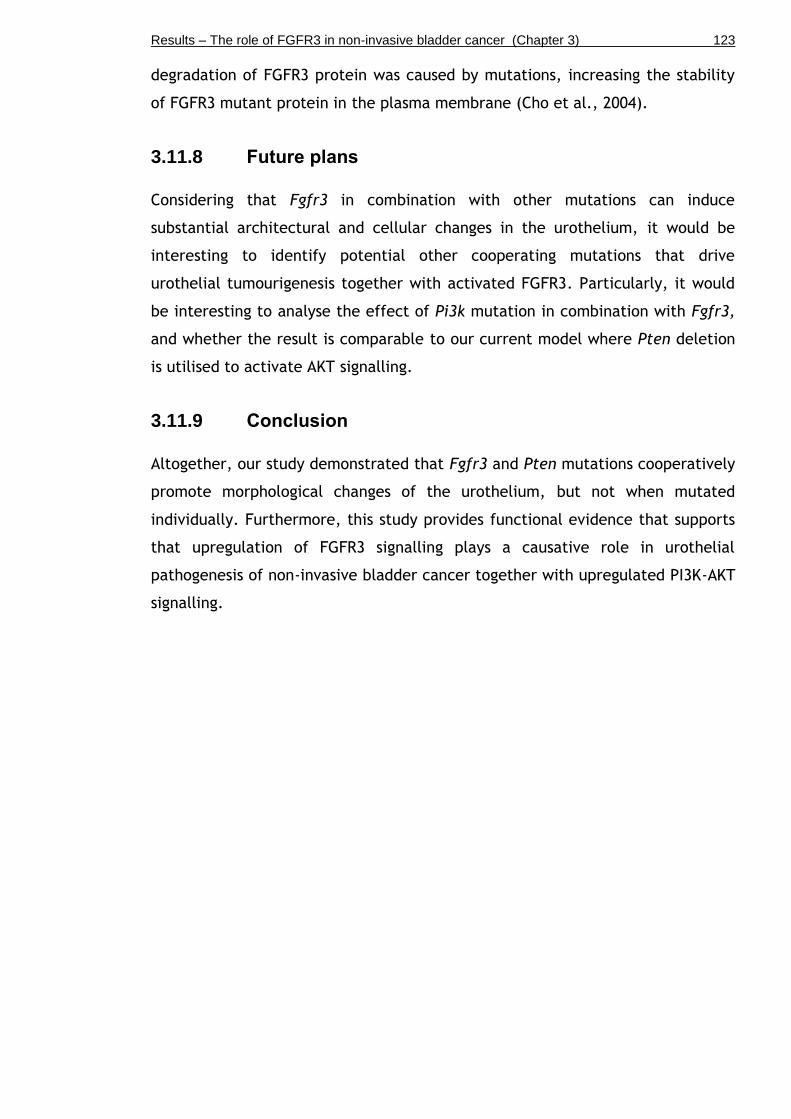
Results – The role of FGFR3 in non-invasive bladder cancer (Chapter 3) 123
degradation of FGFR3 protein was caused by mutations, increasing the stability
of FGFR3 mutant protein in the plasma membrane (Cho et al., 2004).
3.11.8 Future plans
Considering that Fgfr3 in combination with other mutations can induce
substantial architectural and cellular changes in the urothelium, it would be
interesting to identify potential other cooperating mutations that drive
urothelial tumourigenesis together with activated FGFR3. Particularly, it would
be interesting to analyse the effect of Pi3k mutation in combination with Fgfr3,
and whether the result is comparable to our current model where Pten deletion
is utilised to activate AKT signalling.
3.11.9 Conclusion
Altogether, our study demonstrated that Fgfr3 and Pten mutations cooperatively
promote morphological changes of the urothelium, but not when mutated
individually. Furthermore, this study provides functional evidence that supports
that upregulation of FGFR3 signalling plays a causative role in urothelial
pathogenesis of non-invasive bladder cancer together with upregulated PI3K-AKT
signalling.
Results – Search for cooperating genes by Sleeping Beauty mutagenesis (Chapter 4) 124
Chapter 4
Search for cooperating genes by Sleeping Beauty mutagenesis

Results – Search for cooperating genes by Sleeping Beauty mutagenesis (Chapter 4) 125
4.1 Introduction
The Sleeping Beauty (SB) system is a method to screen functional genes by
insertional mutagenesis (Dupuy et al., 2005, Dupuy et al., 2009). The SB system
is based on transposon excision by a transposase and subsequent reintegration
into a random location in the genome (“cut and paste”), which can either lead
to a gain-of-function event or to interruption of the reading frame and therefore
silencing of a gene (Copeland and Jenkins, 2010). Transposon-derived sequences
are common components (40%) of the human and mouse genome, which
demonstrates the importance of transposition in the context of evolution
(Lander et al., 2001, Waterston et al., 2002).
Sleeping Beauty transposons belong to the group of Tc1/mariner transposable
elements that were initially isolated from salmonid fish species (Ivics et al.,
1997). Thereafter, great effort has been made to genetically improve these
transposable elements in order to generate a powerful tool for forward genetic
screens, and for generating novel phenotypes in mice in a less time-consuming
and less technically challenging manner in contrast to vector-based gene-trap
approaches with ES cells.
The SB transposase is encoded by the Cre-inducible RosaSBaseLSL allele, which
allows tissue-restricted expression of the enzyme (Dupuy et al., 2009). The
T2/Onc3 transposon concatemer on the other hand contains ~200 copies of the
SB transposon (Dupuy, 2005). The SB transposase recognises two imperfect
terminal sequences called “inverted repeats” up- and downstream of each
individual transposon (T2/Onc3), excises it from its concatemer and reintegrates
about 40-50% of the mobilised T2/Onc3s into another place in the genome in a
random fashion (Copeland and Jenkins, 2010). T2/Onc3 is equipped with a bi-
directional polyA (pA) sequence that allows integration in either orientation.
Furthermore, due to the presence of splice donor and splice acceptor sequences
in T2/Onc3, the transposon integration can promote expression of an oncogene
or terminate transcription of a tumour suppressor gene along with neutral
mutations resulting from integration into non-functional sites within the genome
(Dupuy et al., 2005, Collier et al., 2005). 90% of all insertions lead to a gain-of-
function effect (Copeland and Jenkins, 2010).
Results – Search for cooperating genes by Sleeping Beauty mutagenesis (Chapter 4) 126
The frequency of SB transposition in somatic cells varies greatly in a tissue-
dependent manner (5-30 events per cell type) (Collier et al., 2005, Dupuy et al.,
2005). In the mouse germline 1-2 transpositions occur per animal born (Dupuy et
al., 2001). T2/Onc3 can continuously be re-mobilised into subsequent locations.
It generally leaves a footprint of about five nucleotides at its previous insertion
site, and can therefore potentially still interrupt the reading frame of a gene
after its departure, even though this event remains undetected by splinkerette
PCR (Copeland and Jenkins, 2010).
Splinkerette PCR is an assay in which transposon junctions are amplified from
genomic DNA of mice carrying transposon insertions. Following restriction
enzyme digestion, DNA fragments are ligated to a linker sequence
(“splinkerette”). After a clean-up digestion reaction to remove DNA segments
with splinkerette adapters on both ends of the fragment, a primary PCR with
splinkerette-specific primers is performed. Thereafter, a secondary nested PCR
is performed using the primary PCR product. Secondary PCR products are
visualised by agarose electrophoresis, purified from the gel, and cloned into a
vector (“TOPO-shotgun cloning”). TOPO-shotgun cloning is a de-multiplexing
step for the pool of different splinkerette-PCR products that have resulted from
the multiple SB transposition events in the tissue of interest. Ligation products
are transformed into bacterial cells and amplified in 96-well plates for
subsequent capillary read sequencing.
Although generally the entire genome is accessible to SB transposition (Collier et
al., 2005), it has been reported that 50-80% of the SB germline transpositions
show preference in the site of relocation, which is particularly near the original
location (“local hopping” (Carlson et al., 2003). A lower frequency of local
hopping has been reported in ES cells (Liang et al., 2009) and various somatic
cell types (Collier et al., 2005, Starr et al., 2009, Dupuy et al., 2005).
The SB system has been established in tissues such as the liver (Keng et al.,
2009), gastrointestinal tract (March et al., 2011, Starr et al., 2009), pancreas
(Mann et al., 2012), hematopoietic system (Dupuy et al., 2005), soft tissue
(Collier et al., 2005), mouse embryonic stem cells (Luo et al., 1998) and in the
germline (Dupuy et al., 2001). SB has also been shown to carry on its insertional
mutagenesis activity in metastatic lesions (Dupuy et al., 2009, Keng et al., 2009,

Results – Search for cooperating genes by Sleeping Beauty mutagenesis (Chapter 4) 127
Mann et al., 2012). However, Sleeping Beauty has not been tested in the bladder
yet.
In this chapter we aimed to identify genes that cooperate with Fgfr3 or Pten to
promote tumourigenesis using an unbiased screening approach. More
specifically, we sought to elucidate whether Fgfr3 K644E mutation is
fundamentally able to drive urothelial cell carcinoma in the presence of SB-
induced mutations. Furthermore, since our previous results indicated functional
cooperation between Fgfr3 and Pten mutation (Chapter 3), we sought to
investigate whether insertional mutagenesis may support these data. We
hypothesised that Fgfr3 mutation may be identified among the common
insertional sites in sequenced Pten-mutant Sleeping Beauty tumours; and that
Pten inactivation may be found in Fgfr3-mutant SB tumours.
In addition, we sought to identify genes that can cooperate with a strongly
activating Hras mutation to promote bladder cancer. HRAS is found mutated at
variable frequencies in different reports on human bladder cancer, ranging from
6-70% (Czerniak et al., 1992, Jebar et al., 2005, Fitzgerald et al., 1995).
However, it may not be the sole initiator (Knowles and Williamson, 1993, Ahmad
et al., 2011b), indicating that a second mutation may be required. In mice, Hras
mutation is known to cause low-grade non-invasive bladder cancer either by
itself (Zhang et al., 2001, Mo et al., 2007) or together with activated WNT
signalling (Ahmad et al., 2011b), as well as high-grade invasive urothelial cell
carcinoma in combination with p53 inactivation (Gao et al., 2004).
Experimentally, we approached the question of gene cooperation by generating
Sleeping Beauty mouse cohorts that carried an additional Fgfr3, Pten or Hras
mutation. We intended to sequence any resulting SB-induced tumours for the
common insertional sites in order to reveal the genetic alterations that
cooperatively promoted tumourigenesis.

Results – Search for cooperating genes by Sleeping Beauty mutagenesis (Chapter 4) 128
4.2 Sleeping Beauty mutagenesis in the urothelium of UroIICre Fgfr3
+/K644E
We generated a cohort of n=29 mice in which heterozygous K644E mutation in
Fgfr3 is combined with the transposase allele RosaSBaseLSL and the transposon
donor T2/Onc3 (Dupuy et al., 2009) in the urothelium, UroIICre Fgfr3+/K644E
RosaSBaseLSL T2/Onc3 (Table 4-1). We also generated a cohort of mice with
Sleeping Beauty elements only, UroIICre RosaSBaseLSL T2/Onc3 (n=10), as well as
a cohort with homozygous Fgfr3 mutation, UroIICre Fgfr3K644E/K644E RosaSBaseLSL
T2/Onc3 (n=18). None of the mice showed clinical signs of bladder tumours by 8-
21 months.
Table 4-1: Sleeping Beauty mouse cohorts with Fgfr3 mutation *UroIICre Fgfr3
K644E/K644E RosaSBase
LSL T2/Onc3 mice were sacrificed at the time where kyphosis
became prevalent. This phenotype is due to a low-level of FGFR3 expression in the presence of homozygous Fgfr3
K644Eneo allele (Li et al., 1999, Iwata et al., 2000, Deng et al., 1996). **The
increase in urothelial thickness observed in UroIICre Fgfr3K644E/K644E
RosaSBaseLSL
T2/Onc3 was milder comparing to those in UroIICre Fgfr3
+/K644E Pten
flox/flox.

Results – Search for cooperating genes by Sleeping Beauty mutagenesis (Chapter 4) 129
We evaluated whether Sleeping Beauty transposon excision had occurred in the
bladder by T2/Onc3 PCR assay (Figure 4-1).
Successful mobilisation of the transposon (225 bp) from its concatemer form (2.2
kb) was confirmed in all of ten tested samples of UroIICre Fgfr3+/K644E
RosaSBaseLSL T2/Onc3. DNA extract from the tail, where transposon jumping is
not expected to occur, was used as negative control (lane: Tail), while colon
crypt cells, in which successful transposition had been confirmed previously
(unpublished), was used as a positive control (lane: Crypt).
Figure 4-1: T2/Onc3 excision PCR 1.5% agarose gel showing mobilisation of transposon (225 bp) in UroIICre Fgfr3
+/K644E
RosaSBaseLSL
T2/Onc3 T2/Onc3 samples (lanes: 1-10) and controls (lanes: tail, crypt, water).
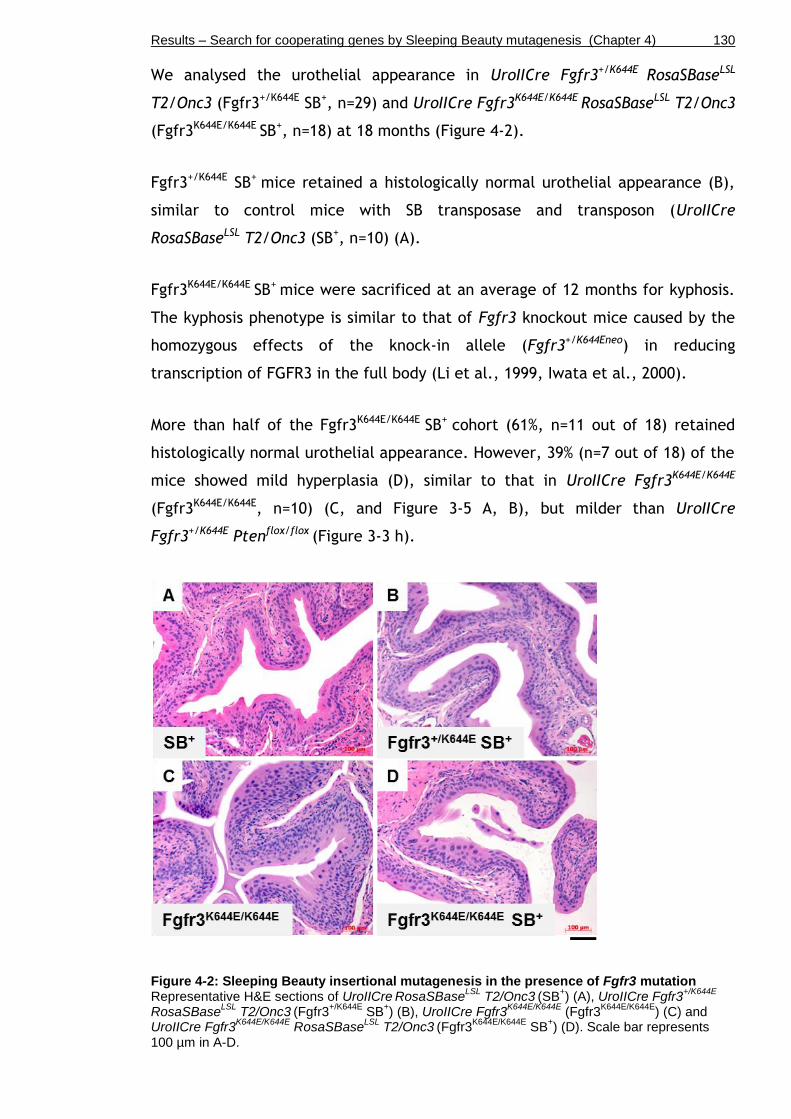
Results – Search for cooperating genes by Sleeping Beauty mutagenesis (Chapter 4) 130
We analysed the urothelial appearance in UroIICre Fgfr3+/K644E RosaSBaseLSL
T2/Onc3 (Fgfr3+/K644E SB+, n=29) and UroIICre Fgfr3K644E/K644E RosaSBaseLSL T2/Onc3
(Fgfr3K644E/K644E SB+, n=18) at 18 months (Figure 4-2).
Fgfr3+/K644E SB+ mice retained a histologically normal urothelial appearance (B),
similar to control mice with SB transposase and transposon (UroIICre
RosaSBaseLSL T2/Onc3 (SB+, n=10) (A).
Fgfr3K644E/K644E SB+ mice were sacrificed at an average of 12 months for kyphosis.
The kyphosis phenotype is similar to that of Fgfr3 knockout mice caused by the
homozygous effects of the knock-in allele (Fgfr3+/K644Eneo) in reducing
transcription of FGFR3 in the full body (Li et al., 1999, Iwata et al., 2000).
More than half of the Fgfr3K644E/K644E SB+ cohort (61%, n=11 out of 18) retained
histologically normal urothelial appearance. However, 39% (n=7 out of 18) of the
mice showed mild hyperplasia (D), similar to that in UroIICre Fgfr3K644E/K644E
(Fgfr3K644E/K644E, n=10) (C, and Figure 3-5 A, B), but milder than UroIICre
Fgfr3+/K644E Ptenflox/flox (Figure 3-3 h).
Figure 4-2: Sleeping Beauty insertional mutagenesis in the presence of Fgfr3 mutation Representative H&E sections of UroIICre
RosaSBase
LSL T2/Onc3
(SB
+) (A), UroIICre Fgfr3
+/K644E
RosaSBaseLSL
T2/Onc3 (Fgfr3
+/K644E SB
+) (B), UroIICre Fgfr3
K644E/K644E (Fgfr3
K644E/K644E) (C) and
UroIICre Fgfr3K644E/K644E
RosaSBaseLSL
T2/Onc3 (Fgfr3
K644E/K644E SB
+) (D). Scale bar represents
100 µm in A-D.
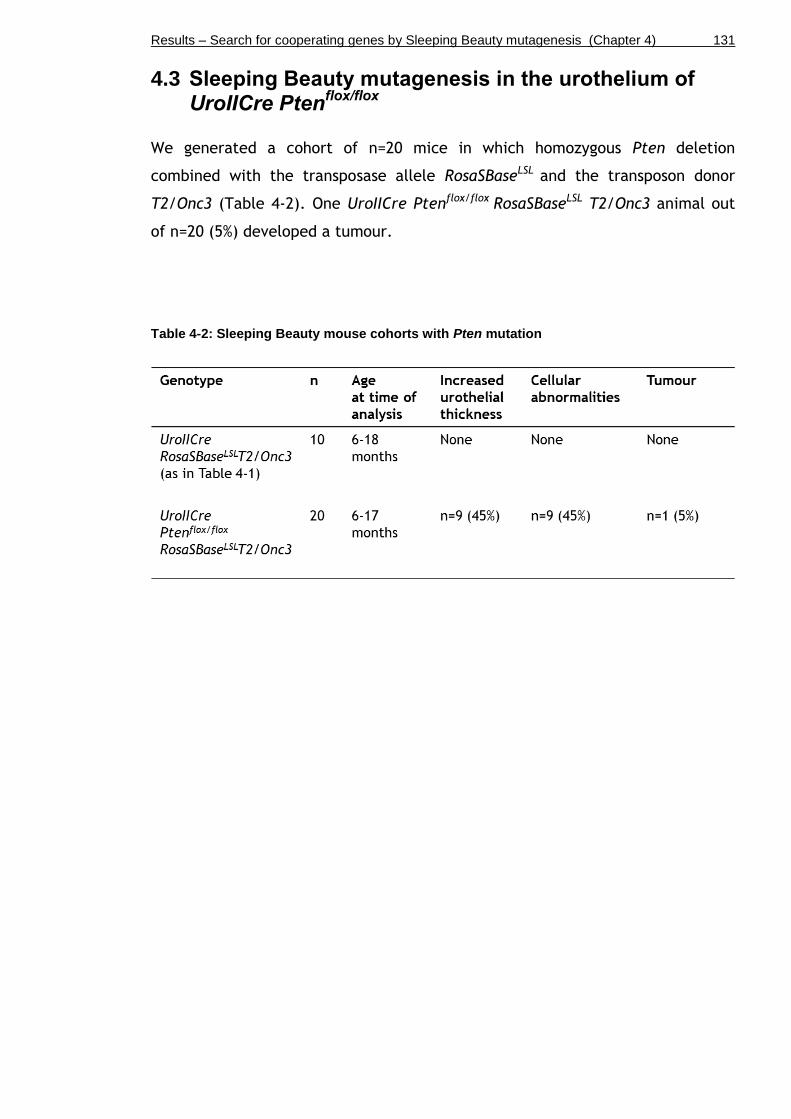
Results – Search for cooperating genes by Sleeping Beauty mutagenesis (Chapter 4) 131
4.3 Sleeping Beauty mutagenesis in the urothelium of UroIICre Pten
flox/flox
We generated a cohort of n=20 mice in which homozygous Pten deletion
combined with the transposase allele RosaSBaseLSL and the transposon donor
T2/Onc3 (Table 4-2). One UroIICre Ptenflox/flox RosaSBaseLSL T2/Onc3 animal out
of n=20 (5%) developed a tumour.
Table 4-2: Sleeping Beauty mouse cohorts with Pten mutation

Results – Search for cooperating genes by Sleeping Beauty mutagenesis (Chapter 4) 132
Histologically, the bladder tumour in UroIICre Ptenflox/flox RosaSBaseLSL T2/Onc3
(Ptenflox/flox SB+) was superficial and of low grade (n=1) (Figure 4-3 A).
Furthermore, in 45% (n=9 out of 20) of Ptenflox/flox SB+, a global hypertrophic
phenotype was observed (B), similar to UroIICre Fgfr3+/K644E Ptenflox/flox (Figure
3-3 h).
Figure 4-3: Sleeping Beauty insertional mutagenesis in the presence of Pten mutation Representative H&E sections of a UroIICre Pten
fllox/flox RosaSBase
LSL T2/Onc3 tumour (Pten
flox/flox
SB+
tumour, n=1) (A) and UroIICre Ptenfllox/flox
RosaSBaseLSL
T2/Onc3 urothelium (Ptenflox/flox
SB+,
n=9) (B). Scale bar represents 100 µm in A-B.
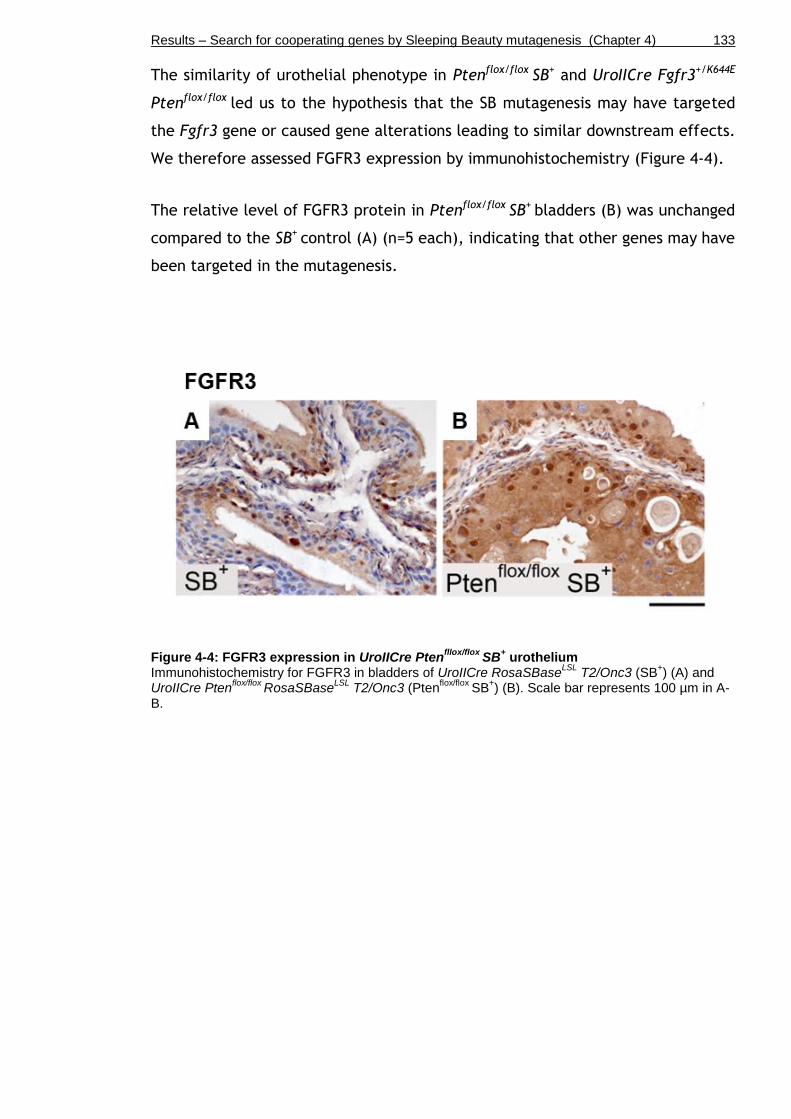
Results – Search for cooperating genes by Sleeping Beauty mutagenesis (Chapter 4) 133
The similarity of urothelial phenotype in Ptenflox/flox SB+ and UroIICre Fgfr3+/K644E
Ptenflox/flox led us to the hypothesis that the SB mutagenesis may have targeted
the Fgfr3 gene or caused gene alterations leading to similar downstream effects.
We therefore assessed FGFR3 expression by immunohistochemistry (Figure 4-4).
The relative level of FGFR3 protein in Ptenflox/flox SB+ bladders (B) was unchanged
compared to the SB+ control (A) (n=5 each), indicating that other genes may have
been targeted in the mutagenesis.
Figure 4-4: FGFR3 expression in UroIICre Ptenfllox/flox
SB+ urothelium
Immunohistochemistry for FGFR3 in bladders of UroIICre RosaSBaseLSL
T2/Onc3 (SB+) (A) and
UroIICre Ptenflox/flox
RosaSBaseLSL
T2/Onc3 (Ptenflox/flox
SB+) (B). Scale bar represents 100 µm in A-
B.

Results – Search for cooperating genes by Sleeping Beauty mutagenesis (Chapter 4) 134
Since Fgfr3 was not likely a direct target, we tested by immunohistochemistry in
n=3 samples each whether the MAPK or the AKT pathway had generally been
affected by the SB mutagenesis (Figure 4-5 and Figure 4-6).
Similar to UroIICre Fgfr3+/K644E Ptenflox/flox (Figure 3-11 j), phosphorylated ERK
was observed in a cell-specific fashion in the urothelium of Ptenflox/flox SB+
(Figure 4-5 H), while its level remained low in UroIICre RosaSBaseLSL T2/Onc3
(SB+), UroIICre Fgfr3+/K644E RosaSBaseLSL T2/Onc3 (Fgfr3+/K644E SB+), and in the
tumour of Ptenflox/flox SB+ (B, E, K).
Expression of p21 was restricted to umbrella cells in SB+ (C) and Fgfr3+/K644E SB+
(F). In contrast, p21-positive cells were scattered in all layers of the Ptenflox/flox
SB+ urothelium (I), however, less extensive than in UroIICre Fgfr3+/K644E
Ptenflox/flox (Figure 3-11 l). Increased numbers of p21-positive cells were
observed in the tumour developed in Ptenflox/flox SB+ (Figure 4-5 L).
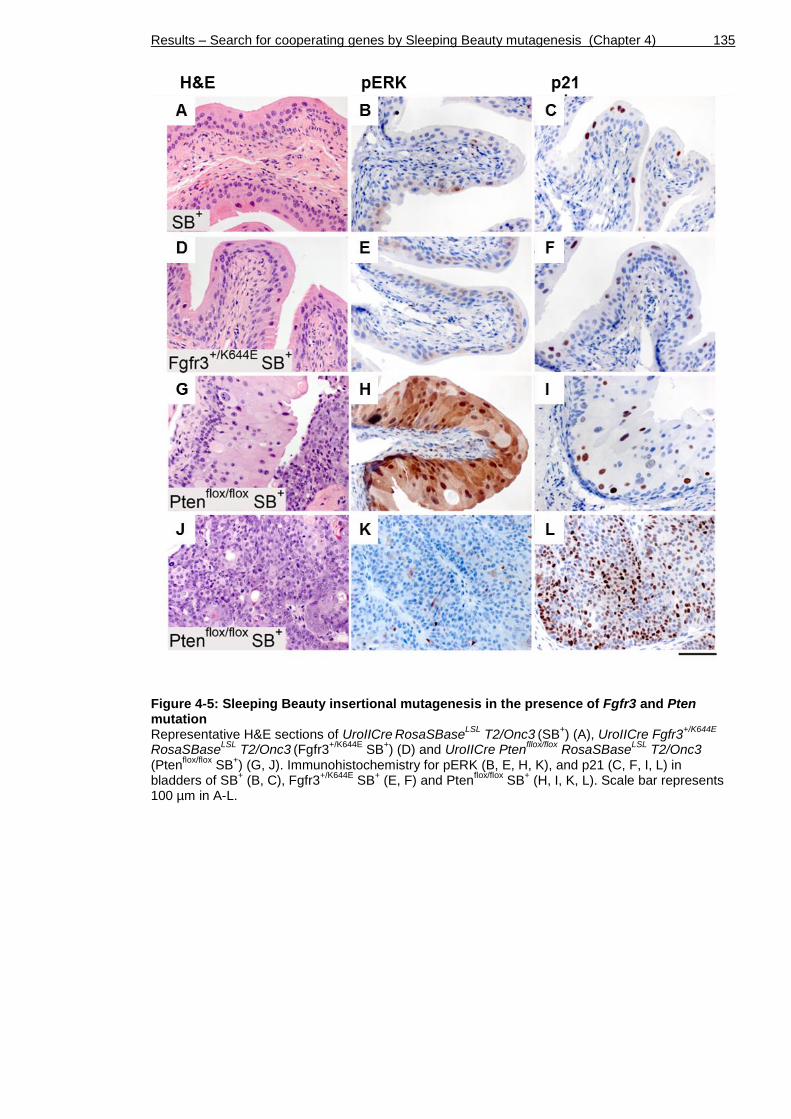
Results – Search for cooperating genes by Sleeping Beauty mutagenesis (Chapter 4) 135
Figure 4-5: Sleeping Beauty insertional mutagenesis in the presence of Fgfr3 and Pten mutation Representative H&E sections of UroIICre
RosaSBase
LSL T2/Onc3
(SB
+) (A), UroIICre Fgfr3
+/K644E
RosaSBaseLSL
T2/Onc3 (Fgfr3
+/K644E SB
+) (D) and UroIICre Pten
fllox/flox RosaSBase
LSL T2/Onc3
(Ptenflox/flox
SB+) (G, J). Immunohistochemistry for pERK (B, E, H, K), and p21 (C, F, I, L) in
bladders of SB+ (B, C), Fgfr3
+/K644E SB
+ (E, F) and Pten
flox/flox SB
+ (H, I, K, L). Scale bar represents
100 µm in A-L.

Results – Search for cooperating genes by Sleeping Beauty mutagenesis (Chapter 4) 136
Phospho-AKT was up-regulated in the Ptenflox/flox SB+ tumour (Figure 4-6 D).
However, unlike UroIICre Fgfr3+/K644E Ptenflox/flox (Figure 3-11 k), its level
remained low in the Ptenflox/flox SB+ urothelium (n=3) (Figure 4-6 C). Phospho-AKT
levels were similarly low in the urothelium of SB+ (n=3) (A) and Fgfr3+/K644E SB+
(B).
Figure 4-6: Upregulation of pAKT in the Ptenflox/flox
SB+ tumour
Immunohistochemistry for pAKT in bladders of UroIICre RosaSBase
LSL T2/Onc3
(SB
+) (A) UroIICre
Fgfr3+/K644E
RosaSBaseLSL
T2/Onc3 (Fgfr3
+/K644E SB
+) (B) and UroIICre Pten
fllox/flox RosaSBase
LSL
T2/Onc3 (Pten
flox/flox SB
+) (C, D). Scale bar represents 100 µm in A-D.
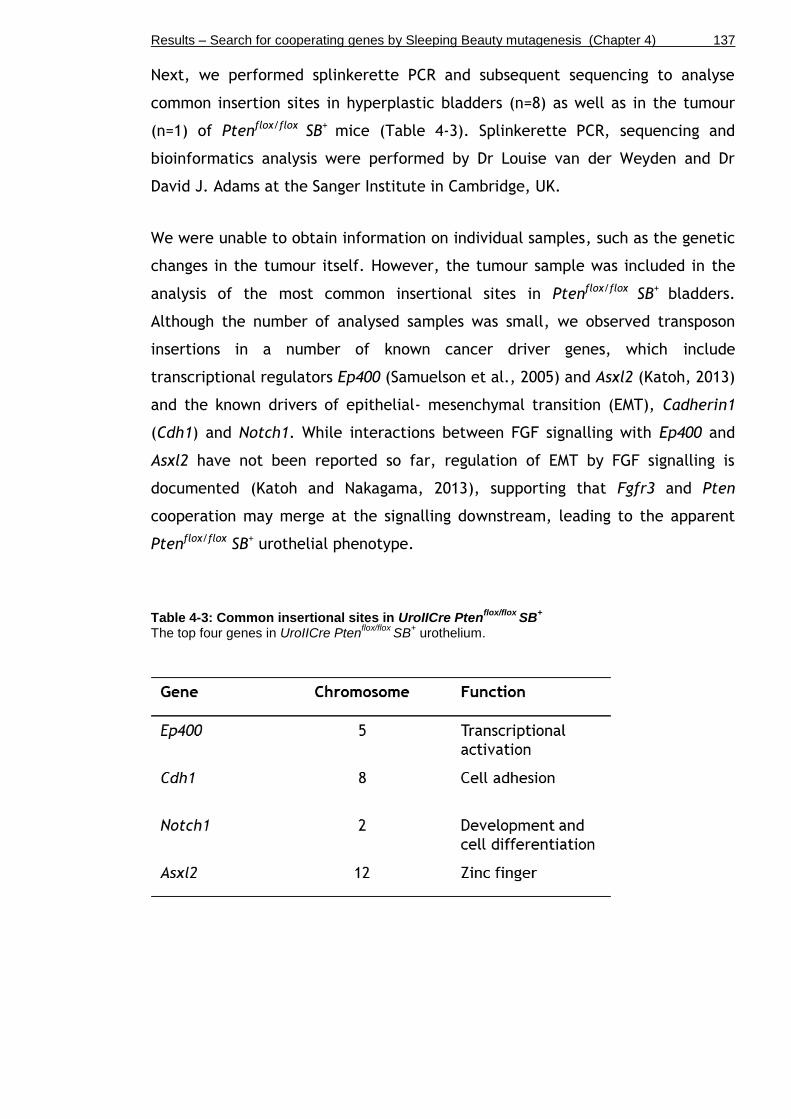
Results – Search for cooperating genes by Sleeping Beauty mutagenesis (Chapter 4) 137
Next, we performed splinkerette PCR and subsequent sequencing to analyse
common insertion sites in hyperplastic bladders (n=8) as well as in the tumour
(n=1) of Ptenflox/flox SB+ mice (Table 4-3). Splinkerette PCR, sequencing and
bioinformatics analysis were performed by Dr Louise van der Weyden and Dr
David J. Adams at the Sanger Institute in Cambridge, UK.
We were unable to obtain information on individual samples, such as the genetic
changes in the tumour itself. However, the tumour sample was included in the
analysis of the most common insertional sites in Ptenflox/flox SB+ bladders.
Although the number of analysed samples was small, we observed transposon
insertions in a number of known cancer driver genes, which include
transcriptional regulators Ep400 (Samuelson et al., 2005) and Asxl2 (Katoh, 2013)
and the known drivers of epithelial- mesenchymal transition (EMT), Cadherin1
(Cdh1) and Notch1. While interactions between FGF signalling with Ep400 and
Asxl2 have not been reported so far, regulation of EMT by FGF signalling is
documented (Katoh and Nakagama, 2013), supporting that Fgfr3 and Pten
cooperation may merge at the signalling downstream, leading to the apparent
Ptenflox/flox SB+ urothelial phenotype.
Table 4-3: Common insertional sites in UroIICre Ptenflox/flox
SB+
The top four genes in UroIICre Ptenflox/flox
SB+ urothelium.

Results – Search for cooperating genes by Sleeping Beauty mutagenesis (Chapter 4) 138
4.4 Sleeping Beauty mutagenesis in the urothelium of UroIICre Hras
+/G12V
We generated a cohort of n=16 Sleeping Beauty mice carrying a strongly
activating Hras G12V mutation combined with the transposase allele
RosaSBaseLSL and the transposon donor T2/Onc3 (Table 4-4).
In order to test whether enhanced MAPK signalling can promote tumourigenesis
in the mouse urothelium by adding an activating Fgfr3 mutation to the HRAS-
hyperactivated bladder, we also generated a cohort of n=5 UroIICre Fgfr3+/K644E
Hras+/G12V animals combined with the Sleeping Beauty elements (Table 4-4).
None of the Hras mutant mice or Fgfr3-Hras mutant mice with the Sleeping
Beauty elements showed clinical signs of bladder tumours by 18 months.
Table 4-4: Sleeping Beauty mouse cohorts with Hras mutation

Results – Search for cooperating genes by Sleeping Beauty mutagenesis (Chapter 4) 139
We then analysed the histological appearance of the Sleeping Beauty urothelia
with Hras and Fgfr3-Hras mutation and the ones of Hras and Fgfr3-Hras controls
without Sleeping Beauty elements (Figure 4-7).
UroIICre Hras+/G12V controls alone did not show gross urothelial abnormalities
apart from mild hyperplasia at 12 months of age (Hras+/G12V, n=16, A). Similar
observations were made in mice with Hras mutation and the additional SB
elements, UroIICre Hras+/G12V RosaSBaseLSL T2/Onc3 (Hras+/G12V SB+, n=16, B).
A normal urothelial phenotype and occasionally mild hyperplasia was present in
UroIICre Fgfr3+/K644E Hras+/G12V animals at 12 months (Fgfr3 Hras, n=15, C).
Additional SB elements did not produce any abnormal urothelial phenotype in
UroIICre Fgfr3+/K644E Hras+/G12V RosaSBaseLSL T2/Onc3 either (Fgfr3 Hras SB+, n=3
at 18 months, n=2 at 7 months, D).
Figure 4-7: Sleeping Beauty insertional mutagenesis in the presence of Hras mutation and/or in combination with Fgfr3 mutation Representative H&E sections of UroIICre Hras
+/G12V (Hras
+/G12V) (A), UroIICre Hras
+/G12V
RosaSBaseLSL
T2/Onc3 (Hras
+/G12V SB
+) (B), UroIICre Fgfr3
+/K644E Hras
+/G12V (Fgfr3 Hras) (C), and
UroIICre Fgfr3+/K644E
Hras+/G12V
RosaSBaseLSL
T2/Onc3 (Fgfr3 Hras SB
+) (D). Scale bar represents
100 µm in A-D.

Results – Search for cooperating genes by Sleeping Beauty mutagenesis (Chapter 4) 140
4.5 Discussion
The aim of this chapter was to identify mutations that cooperate with FGFR3,
PTEN, or RAS mutation in promoting urothelial tumourigenesis an unbiased
fashion. We have therefore performed Sleeping Beauty (SB) insertional
mutagenesis. This unbiased screening approach was also intended to identify
novel mutations that play an important role in urothelial tumourigenesis.
4.5.1 SB in UroIICre Fgfr3+/K644E
We generated a cohort of n=29 mice in which a heterozygous Fgfr3 K644E
mutation is introduced together with transposable Sleeping Beauty (SB)
elements. SB controls presented a histologically normal urothelium that were
indistinguishable from Wild type bladders. None of the UroIICre Fgfr3+/K644E SB+
mice showed clinical signs of bladder tumours, but a histologically normal
urothelial appearance, suggesting that a second mutation by SB mutagenesis
alongside Fgfr3 was insufficient to cause bladder tumours.
Nor did a homozygous mutation in Fgfr3, Fgfr3K644E/K644E SB+, promote
tumourigenesis (Figure 4-2). It could be hypothesised that an additional
mutation in combination with Fgfr3 K644E is generally insufficient for
tumourigenesis to occur, indicating that Fgfr3 may require more than one
additional mutation in order to successfully transform urothelial cells.
In anticipation of potential gene cooperation with Pten, the lack of hypertrophic
phenotype in Fgfr3+/K644E SB+, as observed in UroIICre Fgfr3+/K644E Ptenflox/flox
(Chapter 3) is likely to be due to the low probability of homozygous targeting
that would be required for Pten loss to take effect.
4.5.2 SB in UroIICre Ptenflox/flox
We also performed the SB mutagenesis in the presence of Pten mutation (n=20),
where one UroIICre Ptenfllox/flox SB+ animal (5%) developed a bladder tumour. In
45% (n=9) we observed global hypertrophy (Figure 4-3), phenocopying the
changes that we previously observed in UroIICre Fgfr3+/K644E Ptenflox/flox urothelia
(Chapter 3). Immunohistochemistry indicated that FGFR3 is unlikely a direct co-
operator with Pten deletion in the SB model. However, it could be involved at
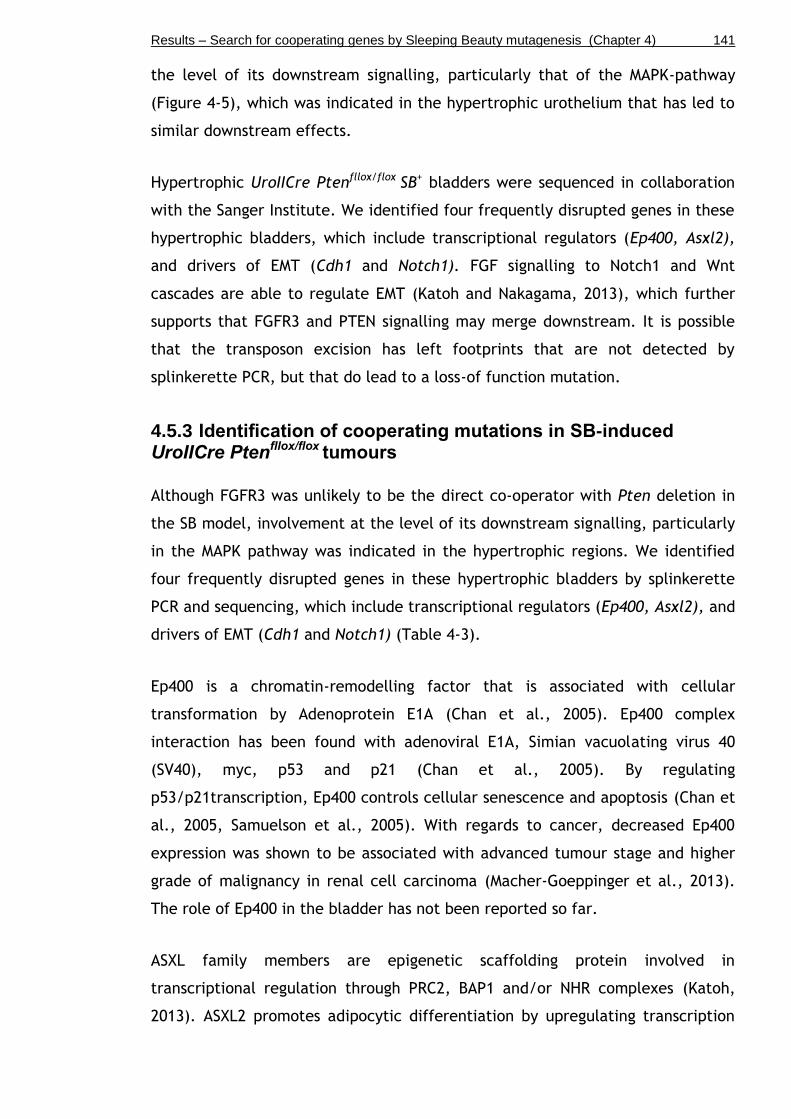
Results – Search for cooperating genes by Sleeping Beauty mutagenesis (Chapter 4) 141
the level of its downstream signalling, particularly that of the MAPK-pathway
(Figure 4-5), which was indicated in the hypertrophic urothelium that has led to
similar downstream effects.
Hypertrophic UroIICre Ptenfllox/flox SB+ bladders were sequenced in collaboration
with the Sanger Institute. We identified four frequently disrupted genes in these
hypertrophic bladders, which include transcriptional regulators (Ep400, Asxl2),
and drivers of EMT (Cdh1 and Notch1). FGF signalling to Notch1 and Wnt
cascades are able to regulate EMT (Katoh and Nakagama, 2013), which further
supports that FGFR3 and PTEN signalling may merge downstream. It is possible
that the transposon excision has left footprints that are not detected by
splinkerette PCR, but that do lead to a loss-of function mutation.
4.5.3 Identification of cooperating mutations in SB-induced UroIICre Ptenfllox/flox tumours
Although FGFR3 was unlikely to be the direct co-operator with Pten deletion in
the SB model, involvement at the level of its downstream signalling, particularly
in the MAPK pathway was indicated in the hypertrophic regions. We identified
four frequently disrupted genes in these hypertrophic bladders by splinkerette
PCR and sequencing, which include transcriptional regulators (Ep400, Asxl2), and
drivers of EMT (Cdh1 and Notch1) (Table 4-3).
Ep400 is a chromatin-remodelling factor that is associated with cellular
transformation by Adenoprotein E1A (Chan et al., 2005). Ep400 complex
interaction has been found with adenoviral E1A, Simian vacuolating virus 40
(SV40), myc, p53 and p21 (Chan et al., 2005). By regulating
p53/p21transcription, Ep400 controls cellular senescence and apoptosis (Chan et
al., 2005, Samuelson et al., 2005). With regards to cancer, decreased Ep400
expression was shown to be associated with advanced tumour stage and higher
grade of malignancy in renal cell carcinoma (Macher-Goeppinger et al., 2013).
The role of Ep400 in the bladder has not been reported so far.
ASXL family members are epigenetic scaffolding protein involved in
transcriptional regulation through PRC2, BAP1 and/or NHR complexes (Katoh,
2013). ASXL2 promotes adipocytic differentiation by upregulating transcription

Results – Search for cooperating genes by Sleeping Beauty mutagenesis (Chapter 4) 142
of the fatty acid binding protein 4 (Fabp4) (Katoh, 2013). Truncation of ASXL2
occurs in prostate, pancreatic and breast cancer (Katoh, 2013). A potential role
of ASXL2 in the bladder has not been reported to date.
Cadherins are involved in cell–cell adhesion, determination of cell polarity and
differentiation (Berx and van Roy, 2009). Cadherin 1 (Cdh1, or E-Cadherin) binds
to p120-catenin and β-catenin (Berx and van Roy, 2009). Loss of Cdh1 is
associated with cancer cell motility and constitutes a marker of EMT (Berx and
van Roy, 2009). E-cadherin is repressed by other EMT indicator proteins such as
Snail, ZEB2 and Slug (Berx and van Roy, 2009).
Notch1 is a transmembrane receptor that regulates an evolutionarily conserved
intercellular signalling pathway that controls differentiation, survival,
proliferation, and cell-to-cell interactions (Allenspach et al., 2002). Upregulated
Notch signalling through overexpression of Notch-ligand Jagged2 in bladder
carcinoma cell lines was associated with invasion and metastasis (Li et al.,
2013).
4.5.4 SB in UroIICre Hras+/G12V
We also performed the SB mutagenesis in the presence of Hras mutation (n=16).
UroIICre Hras+/G12V SB+ showed a normal urothelial phenotype apart from mild
hyperplasia at 12 months of age. An additional Fgfr3 mutation to further
enhance MAPK signalling in combination with Hras mutation in the presence of
the SB elements did not result in any abnormal urothelial phenotype either.
4.5.5 SB as an insertional mutagenesis tool in the bladder
The PCR assay confirmed successful excision of the T2/Onc3 transposon from the
concatemer in all tested samples (Figure 4-1). However, it should be noted that
this assay does not address transposon re-integration. Furthermore, the assay
does not reveal potentially altered expression patterns of the transposase in
terms of time and location.
The fact that mice carrying a strongly activating Hras mutation did not develop
tumours at any stage (Figure 4-7) indicates that Sleeping Beauty is a rather
inefficient tool for the analysis of the urothelium in contrast to other organs

Results – Search for cooperating genes by Sleeping Beauty mutagenesis (Chapter 4) 143
(Keng et al., 2009, Starr et al., 2009, March et al., 2011). Neither did the
combination of Fgfr3 and Hras mutation with SB mutagenesis lead to urothelial
pathogenesis (Figure 4-7).
An explanation for the inefficiency of SB in the urothelium could be the low
proliferation rate of the mouse bladder (0.1-1%) (Stewart et al., 1980), which
likely results in only few transposition and insertional mutagenesis events. In our
experimental settings it is possible that tumour initiation may not have occurred
in the relatively small number of cohort samples that underwent the SB
experiment (n=29), considering that n=60-100 mice were used for SB
mutagenesis in other organs with tumourigenesis occurring in 70-100% of the
animals (Starr et al., 2009, Keng et al., 2009, Dupuy et al., 2009). Another
possible explanation for the inefficient outcome of the SB screening could be
that bladder cells in comparison to other somatic cell types may express certain
host factors (e.g. DNA-bending proteins; (Zayed et al., 2003) at insufficient
levels, which are required for transposition. Moreover, Sleeping Beauty can
potentially miss small genetic loci such as miRNAs, which may influence bladder
tumourigenesis. The role of miRNAs in bladder tumourigenesis has recently
become a subject of investigation (Guancial et al., 2014a).
4.5.6 Future work
For future analysis of cooperating mutations in bladder cancer it may be of
interest to test other insertional mutagenesis systems. An alternative to Sleeping
Beauty that has been shown to mobilise transposable elements even with better
efficiency in somatic cells (up to 300 times) is the Piggy Bac insertional
mutagenesis system (Liang et al., 2009, Cadinanos and Bradley, 2007). Piggy Bac
(PB) is also based on transposon integration, but displays higher transposition
efficiency as well as no indication of local hopping (Ding et al., 2005, Liang et
al., 2009). PB carries an inducible ERT2 domain, which allows the transposition
to be turned off in the absence of tamoxifen after the tumours are initiated
(Cadinanos and Bradley, 2007). However, similar to SB, the low proliferation
rate of the bladder may as well lower the chances of obtaining sufficient results
when screening for gene cooperation. Furthermore, the type of mutation that is
induced by PB may be similar to the SB system, where 90% of all insertions
represent gain-of-function mutations (Copeland and Jenkins, 2010).

Results – Search for cooperating genes by Sleeping Beauty mutagenesis (Chapter 4) 144
4.5.7 Conclusion
Altogether, no direct association between Fgfr3 and Pten mutations was found in
urothelial tumours despite confirmation of successful transposon excision.
However, the SB system itself may constitute a tool of questionable efficiency in
the bladder since even a strongly activating Hras mutation in conjunction with
SB was unable to induce urothelial tumourigenesis and Pten deletion together
with Sleeping Beauty only produced one single bladder tumour. We therefore
decided to move to another system to increase mutations within the bladder to
cooperate with FGFR3 with a relevant mutational spectrum.

Results – The role of FGFR3 in tumour progression and invasion (Chapter 5) 145
Chapter 5
The role of FGFR3 in tumour progression and invasion
Results – The role of FGFR3 in tumour progression and invasion (Chapter 5) 146
5.1 Introduction
Carcinogen-induced bladder tumour models have been studied in order to
investigate the effect of specific genetic alterations on malignant progression
such as loss of p53, activation of Signal transducer and activator of transcription
3 (Stat3), as well as deficiency of Secreted protein acidic and rich in cysteine
(Sparc) or p21 (Ho et al., 2012, Tsuruta, 2006, Said et al., 2013, Ozaki et al.,
1998). Heterozygous p53 knockout mice showed increased susceptibility to
urothelial tumour formation upon OH-BBN exposure compared to carcinogen-
treated Wild type controls, emphasising the role of p53 as a tumour suppressor
(Ozaki et al., 1998). Loss of SPARC, a protein whose role in bladder physiology
and tumourigenesis had been unclear and conflicting, was shown to accelerate
bladder carcinogenesis and progression compared to Wild type litter mates (Said
et al., 2013). Stat3 activation in the urothelium promoted the development of
invasive bladder cancer though the carcinoma in situ (CIS) pathway as opposed
to Wild type mice that frequently developed urothelial hyperplasia and non-
invasive cancer (Ho et al., 2012).
Presence of an FGFR3 mutation in bladder cancer patients has been linked to
favourable patient prognosis, as it is associated with low grade/stage pTa
tumours (van Rhijn et al., 2012, Billerey et al., 2001, Hernandez et al., 2006).
On the other hand, FGFRs have also been implicated in the regulation of
epithelial-to-mesenchymal transition (EMT), invasion, and formation of distant
metastasis in bladder cancer cell lines (Tomlinson et al., 2012, Cheng et al.,
2013, Billottet et al., 2008, Savagner et al., 1994, Chaffer et al., 2006). FGFR3
wild type receptor overexpression has been found in 42% of muscle-invasive
tumours (Tomlinson et al., 2007a). Mutations in FGFR3 are found in 10-15% of
high grade invasive neoplasms (Billerey et al., 2001). Therefore, in total more
than 50% of invasive urothelial cell carcinomas present with alterations in FGFR3
signalling either by mutation, overexpression or both (Iyer and Milowsky, 2012).
However, the mechanistic role of FGFR3 in muscle-invasive bladder cancer is
still not entirely clear. A recent attempt to re-classify urothelial cell carcinomas
primarily based on molecular features has revealed a subgroup of muscle-
invasive bladder cancer that present with FGFR3 mutations and overexpression,
which was associated with significantly poor prognosis (Sjodahl et al., 2012).
p63-positivity has been identified as an indicator of progression and lethality in

Results – The role of FGFR3 in tumour progression and invasion (Chapter 5) 147
muscle-invasive bladder cancer (Choi et al., 2012, Karni-Schmidt et al., 2011).
Interestingly, p63 has been shown to be capable of inducing FGFR3 transcription
(Sayan et al., 2010). Moreover, FGFR3 expression appeared to directly correlate
with p63 expression in a set of human bladder cancer cell lines (Cheng et al.,
2013). Altogether, these observations imply a role of FGFR3 mutation in tumour
progression and invasion.
Recently, a study suggested subcategorising muscle-invasive bladder cancers into
basal-, luminal-, and p53-like tumours (Choi et al., 2014). According to the
results of a large number of tumours that were analysed, basal-like tumours are
characterised by the expression of CK5, CK6, CK14, CD44, ZEB, Cadherin-3
(CDH3), Vimentin (VIM), MYC and EGFR and are associated with squamous
differentiation. Luminal-like tumours were enriched with CK20, CD24, Forkhead
box protein A1 (FOXA1), Trans-acting T-cell-specific transcription factor
(GATA3), X-box binding protein 1 (XBP1), E-Cadherin and FGFR3. p53-like
tumours expressed luminal biomarkers and an additional wild type p53 gene
expression signature. p53-like tumours were associated with chemotherapy
resistance. The basal-like subtype-associated expression of MYC, CD44, CK5, CK6
and CK14 has been shown to be widely controlled by the p63 isoform ΔNp63 in
other tissues (Romano et al., 2009, Boldrup et al., 2007, Marquis et al., 2012).
p63 expression was associated with progression of muscle-invasive tumours (Choi
et al., 2012, Karni-Schmidt et al., 2011). TP53 mutation frequencies were similar
in all of the muscle-invasive subtypes (Choi et al., 2014).
Exposure to carcinogens often causes DNA damage, which can be lethal to the
cell if not fully repaired (Roos and Kaina, 2006). Alternatively, it can lead to
genomic instability promoting cancer formation (Lord and Ashworth, 2012). The
induction of double-strand breaks activates the ATM/ChK2 DNA repair machinery
leading to the phosphorylation of histone H2aX (γH2aX) (Bartkova et al., 2005).
γH2aX has been shown to be expressed in rat bladders following OH-BBN
treatment (Toyoda et al., 2013). γH2aX has also been shown to be expressed in
human non-invasive low-grade urothelial carcinoma (Cheung et al., 2009).
Epithelial tumours progressing towards invasion often express proteins indicative
of epithelial-to-mesenchymal-transition (EMT), such as Fascin, zinc finger E-box
binding homeobox 1 (ZEB1), β-catenin, Sex Determining Region Y-Box 9 (Sox9)
and E-cadherin (Schmalhofer et al., 2009, Thiery, 2002). Fascin has been
Results – The role of FGFR3 in tumour progression and invasion (Chapter 5) 148
reported to be expressed in various stages of bladder tumours (Karasavvidou et
al., 2008, Chen et al., 2012), and is often found at high levels in tumour cells
where it marks the invasive edge (Karasavvidou et al., 2008, Tong et al., 2005).
ZEB1, a zinc finger transcription factor, is another marker of EMT that is
associated with tumour cell migration and invasion by regulating cell fate
(Schmalhofer et al., 2009). β-catenin and Sox9 expression is associated with
stemness/progenitor properties, cancer progression and invasiveness (Wang et
al., 2008, Fodde and Brabletz, 2007). E-Cadherin expression is associated with
loss of cell-cell adhesion in the process of malignant progression, stabilising the
invasive mesenchymal phenotype (Schmalhofer et al., 2009). Nuclear
accumulation of p53 protein can be an indication of TP53 mutation, which is
associated with greater risk of muscle-invasive disease and reduced survival
(Esrig et al., 1994). p21 is a direct target of p53 and regulates cell cycle
progression at the G1/S phase (el-Deiry et al., 1993). Loss of p21 (CIP1/WAF1)
expression has been shown to be an indicator of bladder cancer progression, and
it was strongly associated with higher recurrence and lower patient survival
(Stein et al., 1998).
In this chapter, we aimed to investigate the role of FGFR3 in tumour progression
and invasion in vivo. Based on our results in Chapter 3, we hypothesised that an
FGFR3 mutation can predispose urothelial cells to tumourigenesis. Moreover,
based on two recent publications that FGFR3 mutation is also found in a subset
of muscle-invasive bladder tumours, we hypothesised that the receptor mutation
can contribute to cancer progression. Experimentally, we approached the
question of the role of FGFR3 mutation in tumour progression by subjecting
Fgfr3-mutant and Wild type mice to OH-BBN. Furthermore, we also analysed
Fgfr3-Pten double mutation in OH-BBN-induced tumours.
We have based our previous in vivo experiments on an Fgfr3 K644E mutation,
which leads to highly activated receptor signalling (Naski et al., 1996). However,
the frequency of the human equivalent FGFR3 K650E is less than 2% of the FGFR3
mutations in bladder cancer (Tomlinson et al., 2007a). In contrast, FGFR3 S249C
accounts for ~66% of all FGFR3 mutations in human non-invasive urothelial cell
carcinoma (Tomlinson et al., 2007a, Duenas et al., 2013, Bernard-Pierrot et al.,
2006). Therefore, it is possible that the two mutations have a differential
oncogenic effect in the urothelium. This is supported by cell culture studies

Results – The role of FGFR3 in tumour progression and invasion (Chapter 5) 149
where different FGFR3 mutations caused different mechanisms of kinase activity
affecting morphological transformation, cell proliferation, and anchorage-
independent growth (Tomlinson et al., 2007a, di Martino et al., 2009). In order
to resemble the conditions of human bladder cancer more closely, it would be of
interest to analyse the effect of an S249C mutation in FGFR3 in the urothelium.
We therefore generated a transgenic line carrying Tg(UroII-hFGFR3IIIbS249C)
construct to introduce a human FGFR3 S249C mutation to the murine
urothelium. We then sought to compare two different point mutations in FGFR3,
namely murine Fgfr3 K644E and human FGFR3 S249C, in the normal untreated
urothelium as well their effect on tumour progression in established OH-BBN-
induced neoplasms.
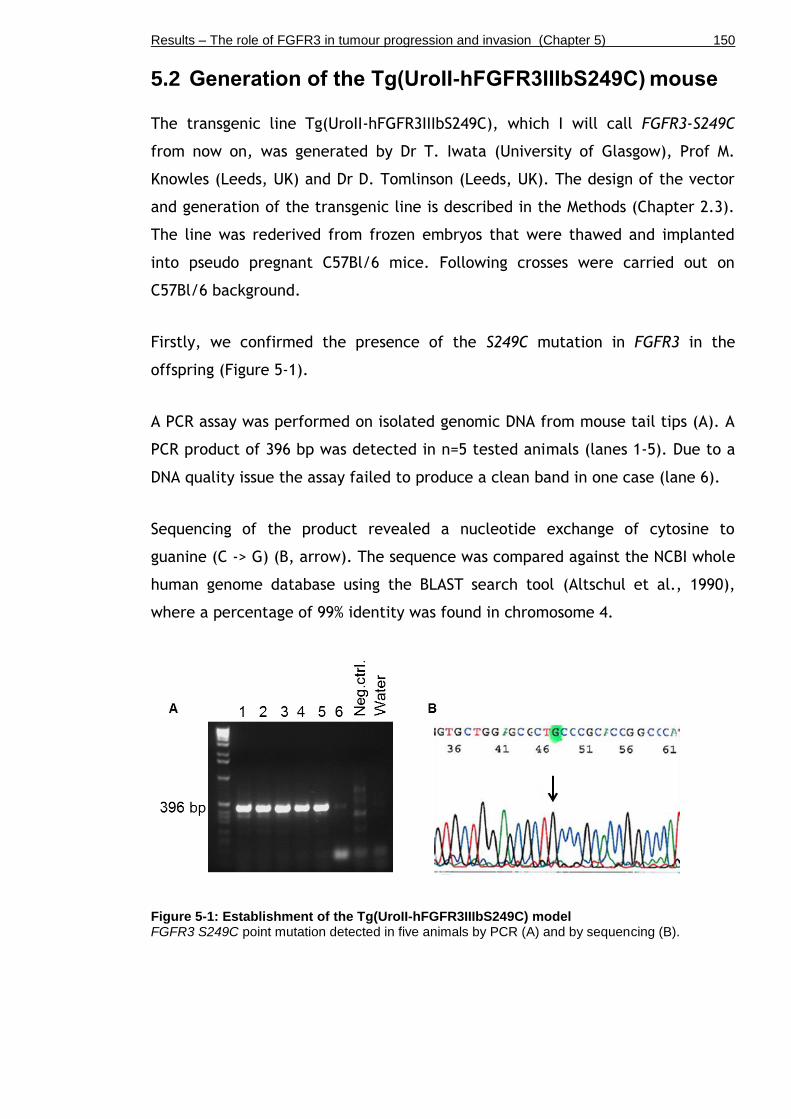
Results – The role of FGFR3 in tumour progression and invasion (Chapter 5) 150
5.2 Generation of the Tg(UroII-hFGFR3IIIbS249C) mouse
The transgenic line Tg(UroII-hFGFR3IIIbS249C), which I will call FGFR3-S249C
from now on, was generated by Dr T. Iwata (University of Glasgow), Prof M.
Knowles (Leeds, UK) and Dr D. Tomlinson (Leeds, UK). The design of the vector
and generation of the transgenic line is described in the Methods (Chapter 2.3).
The line was rederived from frozen embryos that were thawed and implanted
into pseudo pregnant C57Bl/6 mice. Following crosses were carried out on
C57Bl/6 background.
Firstly, we confirmed the presence of the S249C mutation in FGFR3 in the
offspring (Figure 5-1).
A PCR assay was performed on isolated genomic DNA from mouse tail tips (A). A
PCR product of 396 bp was detected in n=5 tested animals (lanes 1-5). Due to a
DNA quality issue the assay failed to produce a clean band in one case (lane 6).
Sequencing of the product revealed a nucleotide exchange of cytosine to
guanine (C -> G) (B, arrow). The sequence was compared against the NCBI whole
human genome database using the BLAST search tool (Altschul et al., 1990),
where a percentage of 99% identity was found in chromosome 4.
Figure 5-1: Establishment of the Tg(UroII-hFGFR3IIIbS249C) model FGFR3 S249C point mutation detected in five animals by PCR (A) and by sequencing (B).
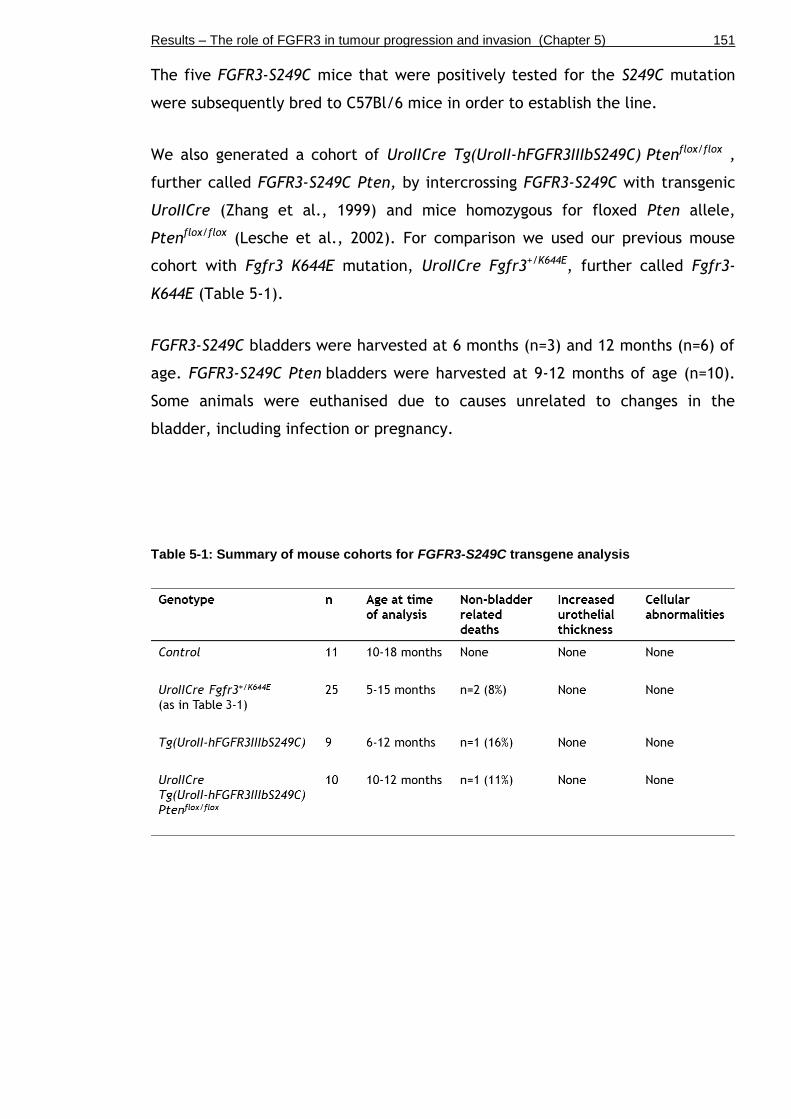
Results – The role of FGFR3 in tumour progression and invasion (Chapter 5) 151
The five FGFR3-S249C mice that were positively tested for the S249C mutation
were subsequently bred to C57Bl/6 mice in order to establish the line.
We also generated a cohort of UroIICre Tg(UroII-hFGFR3IIIbS249C) Ptenflox/flox ,
further called FGFR3-S249C Pten, by intercrossing FGFR3-S249C with transgenic
UroIICre (Zhang et al., 1999) and mice homozygous for floxed Pten allele,
Ptenflox/flox (Lesche et al., 2002). For comparison we used our previous mouse
cohort with Fgfr3 K644E mutation, UroIICre Fgfr3+/K644E, further called Fgfr3-
K644E (Table 5-1).
FGFR3-S249C bladders were harvested at 6 months (n=3) and 12 months (n=6) of
age. FGFR3-S249C Pten bladders were harvested at 9-12 months of age (n=10).
Some animals were euthanised due to causes unrelated to changes in the
bladder, including infection or pregnancy.
Table 5-1: Summary of mouse cohorts for FGFR3-S249C transgene analysis

Results – The role of FGFR3 in tumour progression and invasion (Chapter 5) 152
In order to examine the effect of FGFR3 S249C mutation in the bladder alone
and in combination with Pten deletion, we analysed the appearance of the
transgenic urothelia (Figure 5-2).
The urothelia of Wild type (n=11) (A) and Fgfr3-K644E (n=25) (D) appeared
similar to FGFR3-S249C (n=9) (G) at 12 months of age. FGFR3-S249C Pten
bladders did not show any histological abnormalities (n=10) (J) in contrast to
UroIICre Fgfr3+/K644E Ptenflox/flox (Chapter 3), where severe morphological changes
of the urothelium had been observed.
Proliferation was similarly low in Wild type (B), Fgfr3-K644E (E), FGFR3-S249C
(H) and FGFR3-S249C Pten (K) in all layers of the urothelium.
Similar levels and patterns of FGFR3 protein expression were detected in the
urothelium of Wild type (C), Fgfr3-K644E (F) and FGFR3-S249C (I), indicating
that FGFR3 expression was not influenced by the nature of the Fgfr3 mutation.
FGFR3 staining of FGFR3-S249C Pten urothelia was not available at the time of
writing.
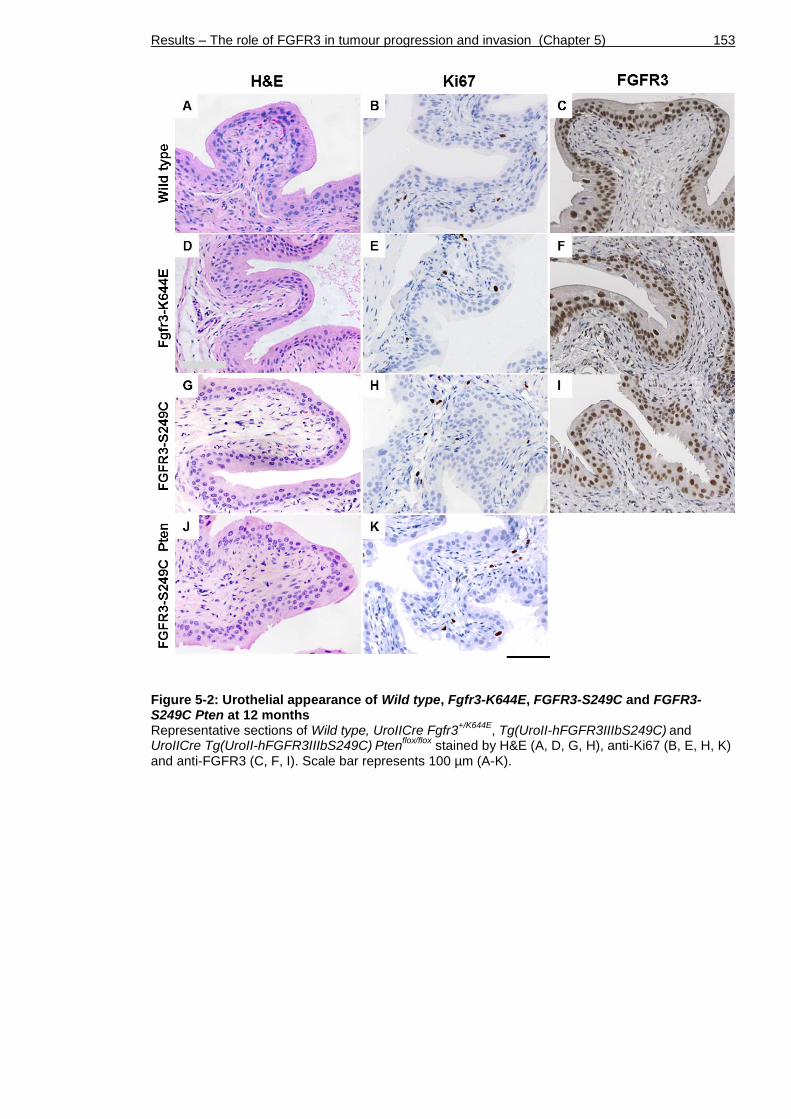
Results – The role of FGFR3 in tumour progression and invasion (Chapter 5) 153
Figure 5-2: Urothelial appearance of Wild type, Fgfr3-K644E, FGFR3-S249C and FGFR3-S249C Pten at 12 months Representative sections of Wild type, UroIICre Fgfr3
+/K644E, Tg(UroII-hFGFR3IIIbS249C)
and
UroIICre Tg(UroII-hFGFR3IIIbS249C) Pten
flox/flox stained by H&E (A, D, G, H), anti-Ki67 (B, E, H, K)
and anti-FGFR3 (C, F, I). Scale bar represents 100 µm (A-K).

Results – The role of FGFR3 in tumour progression and invasion (Chapter 5) 154
5.3 Mouse cohorts that were subjected to OH-BBN
In order to evaluate the role of FGFR3 S249C mutation in tumour progression, we
subjected FGFR3-S249C mice as well as Wild type to 0.05% w/v N-butyl-N-(4-
hydroxybutyl)-nitrosamine (OH-BBN) for 10 weeks followed by a period of 10
weeks with normal drinking water (further called “10+10 weeks”) (Table 5-2).
Furthermore, we generated cohorts of UroIICre Ptenflox/flox (Pten) and FGFR3-
S249C Ptenflox/flox (FGFR3-S249C Pten). At the time of writing, no UroIICre
Fgfr3+/K644E (Fgfr3-K644E) mice had been subjected to OH-BBN due to insufficient
numbers.
Table 5-2: OH-BBN-treated mouse cohorts Mice were subjected to 0.05% w/v N-butyl-N-(4-hydroxybutyl)-nitrosamine for 10 weeks, followed by 10 weeks of normal drinking water. Mice were sampled over a time course as indicated

Results – The role of FGFR3 in tumour progression and invasion (Chapter 5) 155
5.4 FGFR3 S249C mutation increases sensitivity to tumourigenesis after long-term OH-BBN exposure
We compared the histological changes in the urothelium of Wild type, FGFR3-
S249C, UroIICre Ptenflox/flox (Pten), FGFR3-S249C Cre Ptenflox/flox (FGFR3-S249C
Cre Pten) and UroIICre Fgfr3+/K644E Ptenflox/flox (Fgfr3-K644E Pten) subjected to 10
weeks of carcinogen exposure followed by 10 weeks of normal drinking water
(“10+10”) (Figure 5-3). As an example of histological features of OH-BBN-treated
urothelia at high magnification, FGFR3-S249C bladders are shown (Figure 5-4).
Based on their cell-morphological changes, tumours among all five cohorts
seemed to be comparable in terms of grade and severity (Figure 5-3). Cell-
morphological changes among all cohorts included the absence of umbrella cells
in the urothelium, small nests with cellular atypia (Figure 5-3 C and H, black
arrows).
While none of these abnormal features were seen in untreated FGFR3-S249C
bladders (n=9) (Figure 5-4 A), we observed characteristics of advanced tumours
in OH-BBN-treated bladders, including squamous cell transformation with
keratinisation (Figure 5-3 C, red arrow, and (Figure 5-4 C, arrow), carcinoma in
situ (CIS) with lobular appearance of the urothelium-stroma boundary cohorts
(Figure 5-4 B, dotted line), and invasion through the basement membrane
(Figure 5-3 G, black arrow and (Figure 5-4 D, arrow with dotted line).
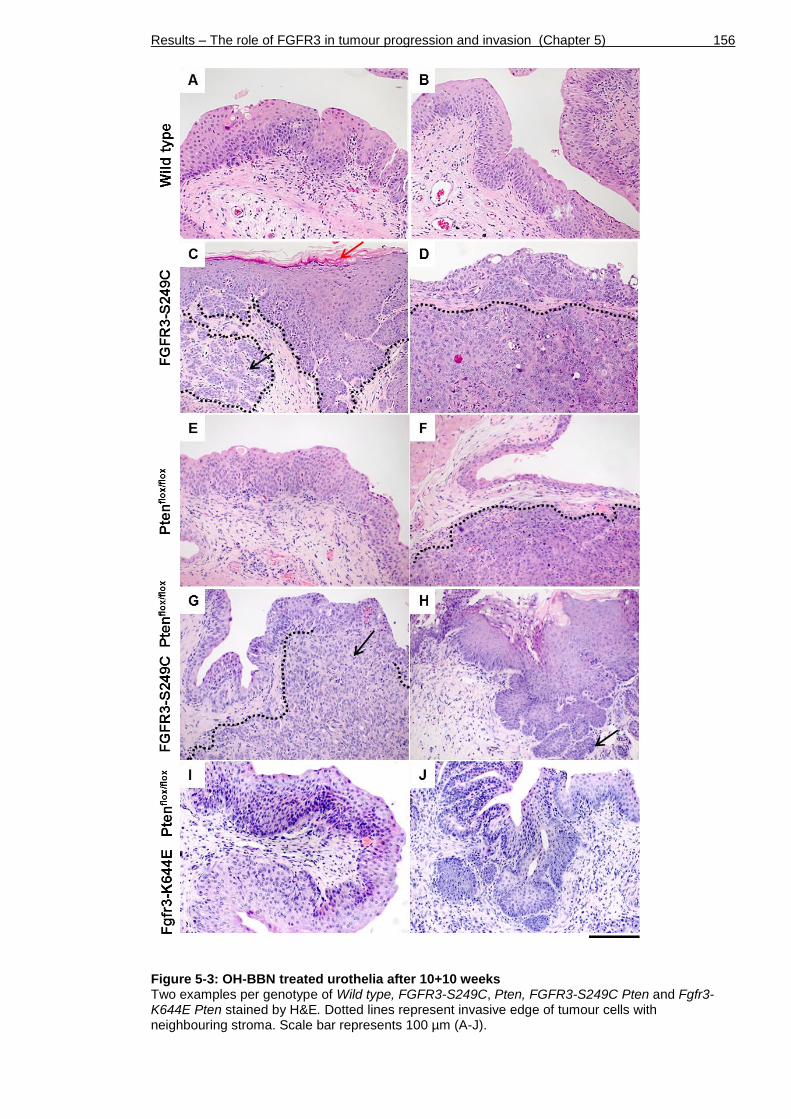
Results – The role of FGFR3 in tumour progression and invasion (Chapter 5) 156
Figure 5-3: OH-BBN treated urothelia after 10+10 weeks Two examples per genotype of Wild type, FGFR3-S249C, Pten, FGFR3-S249C Pten and Fgfr3-K644E Pten stained by H&E. Dotted lines represent invasive edge of tumour cells with neighbouring stroma. Scale bar represents 100 µm (A-J).

Results – The role of FGFR3 in tumour progression and invasion (Chapter 5) 157
Figure 5-4: Abnormal features in FGFR3-S249C at high magnification upon OH-BBN treatment Untreated FGFR3-S249C (A) and OH-BBN-treated FGFR3-S249C (B-D) sections stained by H&E showing CIS in the urothelium with lobulation (B), squamous cell transformation with keratinisation (C) and invasion through the basement membrane (D). Dotted line indicates basement membrane. Scale bar represents 100 µm in A, D and 50 µm in B, C.

Results – The role of FGFR3 in tumour progression and invasion (Chapter 5) 158
Next we scored the presence of carcinoma in situ (CIS), hyperplasia, keratinised
squamous epithelium, lobulation of the urothelium-stroma boundary, tumour
incidence and invasion in bladders of Wild type (n=17), FGFR3-S249C (n=17),
Pten (n=16), FGFR3-S249C Pten (n=19) and Fgfr3-K644E Pten (n=7) after 10+10
weeks of OH-BBN exposure Table 5-3 and Figure 5-5).
A significantly higher incidence of CIS was observed in FGFR3-S249C (71%) and
FGFR3-S249C Pten (74%) compared to Wild type (29%) (Pearson Chi-Square,
p=0.015 and p=0.018 respectively). The incidence of CIS in Fgfr3-K644E Pten was
also higher (57%), but did not reach significance compared to Wild type.
Hyperplasia was observed in the majority of samples across all genotypes.
Keratinising squamous metaplasia was significantly more frequent in FGFR3-
S249C (53%) compared to Wild type (12%) (p=0.026). Lobulation of the
urothelium-stroma boundary was more often seen in FGFR3-S249C (71%)
(p=0.038), FGFR3-S249C Pten (74%) (p= 0.018) and Fgfr3-K644E Pten (71%; NS)
compared to Wild type (29%). Tumours occurred significantly more often in
FGFR3-S249C (53%) (p=0.026), FGFR3-S249C Pten (60%) (p=0.006) and Fgfr3-
K644E Pten (43%; NS) compared to Wild type (12%). Invasion was more often seen
in FGFR3-S249C (47%) (p=0.024) and FGFR3-S249C Pten (47%) (p= 0.031)
compared to Wild type (12%). In Fgfr3-K644E Pten invasion was at a similar
frequency (14%) compared to Wild type (12%).

Results – The role of FGFR3 in tumour progression and invasion (Chapter 5) 159
Table 5-3: Histological changes of OH-BBN-treated mouse cohorts (“10+10 weeks”) Mice were subjected to 0.05% w/v N-butyl-N-(4-hydroxybutyl)-nitrosamine for 10 weeks, followed by 10 weeks of normal drinking water. *Initially we generated n=20 UroIICre Tg(UroII-hFGFR3IIIbS249C) Pten
flox/flox animals. One was found dead with a bladder tumour, which was not
included into histological analysis with the other n=19. However, it was counted for “tumour incidence” with a total of 12 out of 20 animals.
Figure 5-5: Frequency of histological features and tumour formation in OH-BBN-treated cohorts after 10+10 weeks Wild type (Wt, green), FGFR3-S249C (S249C, yellow), UroIICre Pten
flox/flox (Pten, blue), FGFR3-
S249C Ptenflox/flox
(S249CPten, red) and Fgfr3-K644E Ptenflox/flox
(K644EPten, pink). CIS= Carcinoma in situ

Results – The role of FGFR3 in tumour progression and invasion (Chapter 5) 160
5.5 Fgfr3 K644E mutation increases sensitivity to tumourigenesis after long-term OH-BBN exposure
In order to examine the effects of Fgfr3 mutation on malignant progression
towards potential metastatic development, we subjected a small cohort of
UroIICre Fgfr3+/K644E mice (Fgfr3-K644E, n=7) as well as Controls (n=6) to 0.05%
w/v OH-BBN for 20 weeks continuously without a following water period (“20
weeks”) (Table 5-4 and Figure 5-6). We also generated cohorts of UroIICre
Ptenflox/flox (Pten, n=7) and UroIICre Fgfr3+/K644E Ptenflox/flox (Fgfr3-K644E Pten,
n=6) that were subjected to the same OH-BBN time schedule. At the time of
writing, no FGFR3-S249C mice had been treated for 20 weeks continuously due
to insufficient numbers.
It has to be noted that the mice in this experiment were 4-9 months older than
the mice that were previously treated for 10+10 weeks, starting the treatment
at 8-11 months of age. The term “Control” in this 20-weeks experiment as
opposed to “Wild type” in other Chapters refers to mice of C57Bl/6 and mice
with presence of T2/Onc3 which does not lead to any bladder phenotype by
itself.
CIS was most frequently observed in Wild type (100%) and Pten (100%), compared
to Fgfr3-K644E (86%) and Fgfr3-K644E Pten (67%). Hyperplasia was observed
most frequently in Fgfr3-K644E (100%), Pten (100%) and Fgfr3-K644E Pten
(100%), compared to Wild type (67%). Squamous transformation was more
frequently seen in Fgfr3-K644E (86%), Pten (57%) and Fgfr3-K644E Pten (50%),
compared to Wild type (33%). The difference in squamous cell transformation
between Fgfr3-K644E and Wild type was statistically significant (p=0.029,
Pearson Chi-Square test). Lobulation of the urothelium-stroma boundary was
more often seen in Fgfr3-K644E (100%) and Fgfr3-K644E Pten (100%) compared to
Wild type (50%) and Pten (86%). Tumours were more frequently seen in Fgfr3-
K644E (71%) than in Wild type (33%), Pten (57%) and Fgfr3-K644E Pten (50%).
Invasion was also more often seen in Fgfr3-K644E (71%) than in Wild type (17%),
Pten (57%) and Fgfr3-K644E Pten (50%).
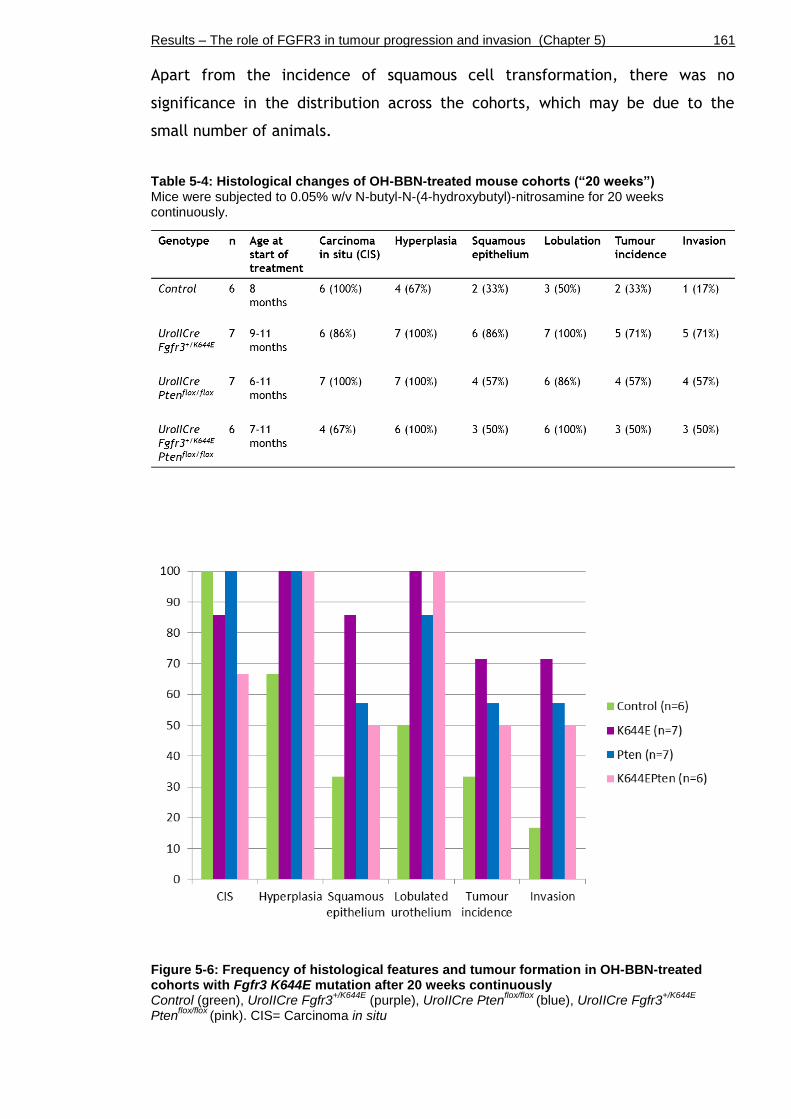
Results – The role of FGFR3 in tumour progression and invasion (Chapter 5) 161
Apart from the incidence of squamous cell transformation, there was no
significance in the distribution across the cohorts, which may be due to the
small number of animals.
Table 5-4: Histological changes of OH-BBN-treated mouse cohorts (“20 weeks”) Mice were subjected to 0.05% w/v N-butyl-N-(4-hydroxybutyl)-nitrosamine for 20 weeks continuously.
Figure 5-6: Frequency of histological features and tumour formation in OH-BBN-treated cohorts with Fgfr3 K644E mutation after 20 weeks continuously Control (green), UroIICre Fgfr3
+/K644E (purple), UroIICre Pten
flox/flox (blue), UroIICre Fgfr3
+/K644E
Ptenflox/flox
(pink). CIS= Carcinoma in situ

Results – The role of FGFR3 in tumour progression and invasion (Chapter 5) 162
Next we examined proliferation, expression of cell cycle regulating genes, as
well as expression of markers indicating epithelial-to mesenchymal transition
(EMT) in OH-BBN-induced tumours. Fgfr3-K644E mutant bladders, with a high
incidence of tumours, were used as an example (Figure 5-7).
Ki67 expression was seen at low levels in the untreated Fgfr3-K644E urothelium
(A). Increased proliferation was typically found along the basal layer of cells of
the transformed urothelium (B) as well as in the tumour mass (D).
p53 expression was low in untreated Fgfr3-K644E bladders(D). Following OH-
BBN-induced DNA damage, p53 protein was elevated along the basal cell layer as
well as in some of the intermediate cells (E). p53 expression had not been lost in
most of the invading tumour cells; in fact it seemed to have accumulated in
some regions of the tumours (F).
p21 expression was restricted to umbrella cells in untreated Fgfr3-K644E
bladders (G). Following OH-BBN exposure, a fraction of p53-positive cells, in
particular along the basal cell layer, was p21-positive (H). Invading tumour cells
also expressed p21 (I, above black dotted line); however, the expression was less
intense in areas with high p53 expression (I, between black and white dotted
lines). This could indicate that the p53-antibody, particularly noticeable in (I),
may have visualised regions with mutant p53 rather than wild type p53, which
could explain the lack of p21 induction in those regions.
To visualise breakthrough of the basement membrane as well as the invasive
edge, Fascin expression levels were analysed. In the untreated Fgfr3-K644E
urothelium, Fascin was observed in basal and some intermediate cells (J). Fascin
expression was seen along the lobulated urothelium-stroma boundary (K) and
marked the invasive edge (L, arrow heads).

Results – The role of FGFR3 in tumour progression and invasion (Chapter 5) 163
Figure 5-7: Abnormal protein expression in Fgfr3-K644E at high magnification after 20 weeks continuous OH-BBN treatment Immunohistochemistry showing Ki67 (A-C), p53 (D-F) p21 (G-I) and Fascin (J-L) levels of untreated Fgfr3-K644E (A, D, G, J) and OH-BBN-treated Fgfr3-K644E bladders (B, C, E, F, H, I, K, L). Scale bar represents 100 µm in A-L.
Results – The role of FGFR3 in tumour progression and invasion (Chapter 5) 164
We further characterised the nature of the tumours by analysing the expression
of urothelial layer-specific proteins as well as markers indicative of epithelial-
mesenchymal transition (EMT) (Figure 5-8).
Expression of Cytokeratin 5 (CK5), which is normally expressed in basal cells
(Castillo-Martin et al., 2010), was seen along the lobulated urothelium-stroma
boundary as well as in invading tumour cells (a). Similarly, p63, which is
normally expressed in basal and intermediate cells (Castillo-Martin et al., 2010),
was seen along the basal layer and in tumour cells (b), indicating that these
tumour cells could potentially be of basal cell origin.
Invading cells were also positive for β-catenin (c) and Sox9 (d), indicating that
these cells had undergone a change in their genetic program. Loss of
membranous E-Cadherin expression was observed in invading cells (e), indicating
loss of cell-cell adhesion in the process of malignant progression (Schmalhofer et
al., 2009). Invading cells were also positive for ZEB1 (f), further supporting that
EMT had occurred.
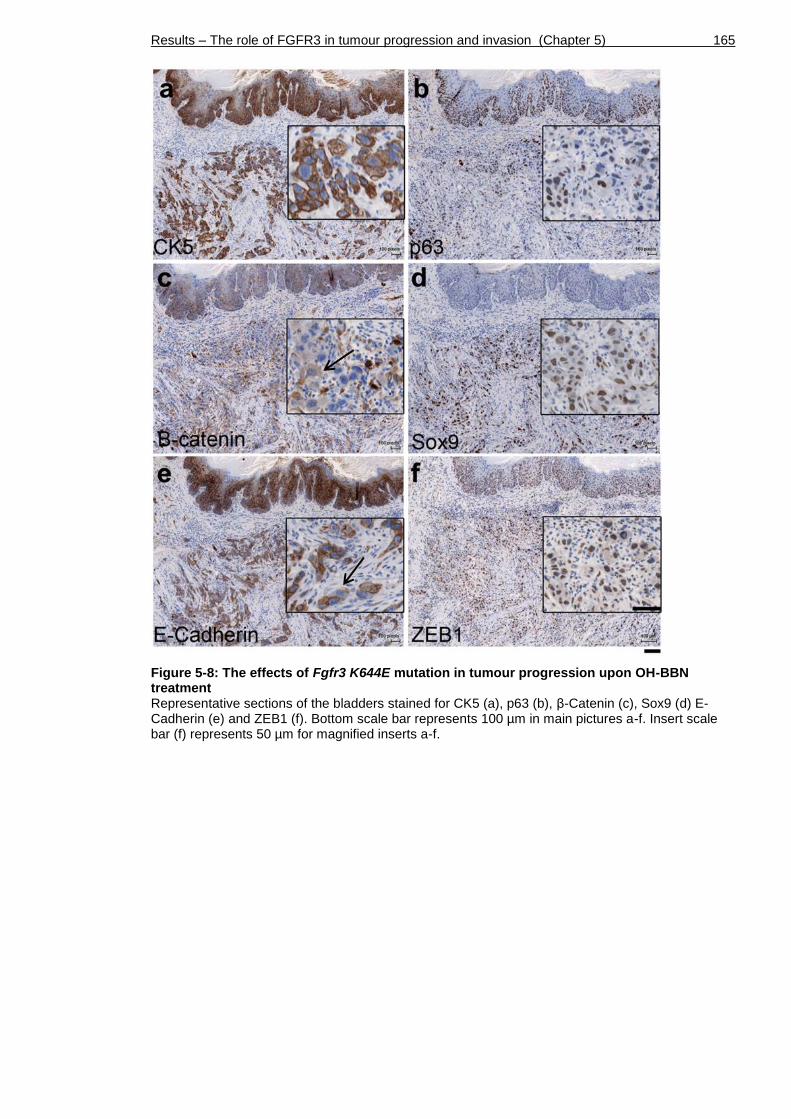
Results – The role of FGFR3 in tumour progression and invasion (Chapter 5) 165
Figure 5-8: The effects of Fgfr3 K644E mutation in tumour progression upon OH-BBN treatment Representative sections of the bladders stained for CK5 (a), p63 (b), β-Catenin (c), Sox9 (d) E-Cadherin (e) and ZEB1 (f). Bottom scale bar represents 100 µm in main pictures a-f. Insert scale bar (f) represents 50 µm for magnified inserts a-f.
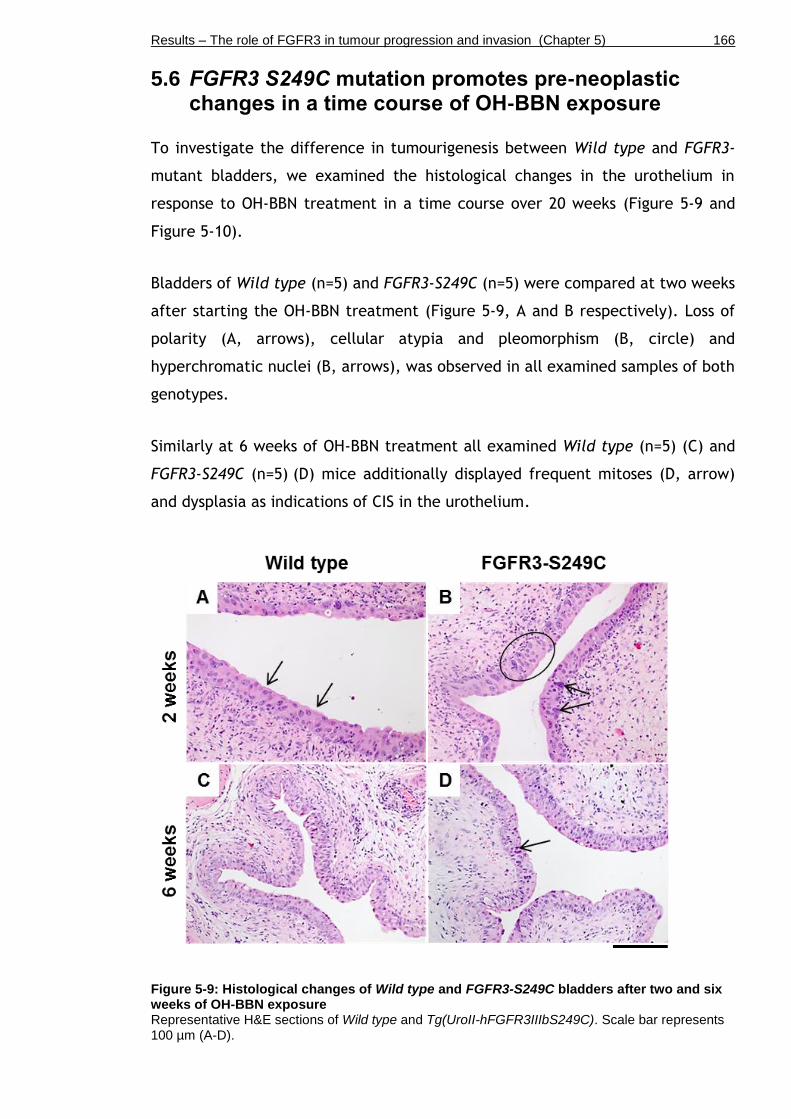
Results – The role of FGFR3 in tumour progression and invasion (Chapter 5) 166
5.6 FGFR3 S249C mutation promotes pre-neoplastic changes in a time course of OH-BBN exposure
To investigate the difference in tumourigenesis between Wild type and FGFR3-
mutant bladders, we examined the histological changes in the urothelium in
response to OH-BBN treatment in a time course over 20 weeks (Figure 5-9 and
Figure 5-10).
Bladders of Wild type (n=5) and FGFR3-S249C (n=5) were compared at two weeks
after starting the OH-BBN treatment (Figure 5-9, A and B respectively). Loss of
polarity (A, arrows), cellular atypia and pleomorphism (B, circle) and
hyperchromatic nuclei (B, arrows), was observed in all examined samples of both
genotypes.
Similarly at 6 weeks of OH-BBN treatment all examined Wild type (n=5) (C) and
FGFR3-S249C (n=5) (D) mice additionally displayed frequent mitoses (D, arrow)
and dysplasia as indications of CIS in the urothelium.
Figure 5-9: Histological changes of Wild type and FGFR3-S249C bladders after two and six weeks of OH-BBN exposure Representative H&E sections of Wild type and Tg(UroII-hFGFR3IIIbS249C). Scale bar represents 100 µm (A-D).

Results – The role of FGFR3 in tumour progression and invasion (Chapter 5) 167
We continued the OH-BBN treatment up to a total of 10 weeks followed by
additional 2 weeks of normal drinking water (“10+2 weeks”, Figure 5-10).
Additional features such as hyperplasia (A, B, arrows), squamous cell
transformation (C, arrows), and lobulation of the urothelial-stroma boundary (A,
B, C, dotted lines) were observed in samples of Wild type (n=5) (A), FGFR3-
S249C (n=5) (B), as well as in UroIICre Ptenflox/flox (n=5) (C).
Figure 5-10: Histological changes of Wild type, FGFR3-S249C and UroIICre Ptenflox/flox
bladders after 10+2 weeks of OH-BBN exposure Representative H&E sections of Wild type (n=5) and Tg(UroII-hFGFR3IIIbS249C) (n=5). Scale bar represents 100 µm (A-C).
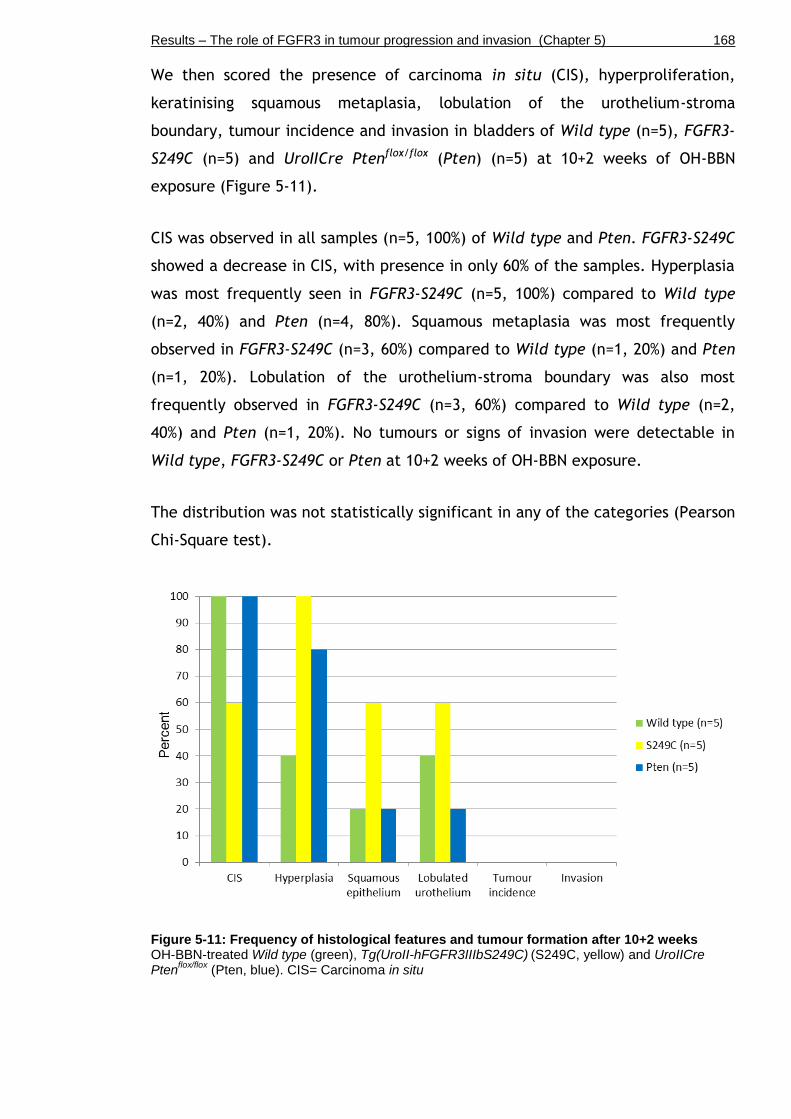
Results – The role of FGFR3 in tumour progression and invasion (Chapter 5) 168
We then scored the presence of carcinoma in situ (CIS), hyperproliferation,
keratinising squamous metaplasia, lobulation of the urothelium-stroma
boundary, tumour incidence and invasion in bladders of Wild type (n=5), FGFR3-
S249C (n=5) and UroIICre Ptenflox/flox (Pten) (n=5) at 10+2 weeks of OH-BBN
exposure (Figure 5-11).
CIS was observed in all samples (n=5, 100%) of Wild type and Pten. FGFR3-S249C
showed a decrease in CIS, with presence in only 60% of the samples. Hyperplasia
was most frequently seen in FGFR3-S249C (n=5, 100%) compared to Wild type
(n=2, 40%) and Pten (n=4, 80%). Squamous metaplasia was most frequently
observed in FGFR3-S249C (n=3, 60%) compared to Wild type (n=1, 20%) and Pten
(n=1, 20%). Lobulation of the urothelium-stroma boundary was also most
frequently observed in FGFR3-S249C (n=3, 60%) compared to Wild type (n=2,
40%) and Pten (n=1, 20%). No tumours or signs of invasion were detectable in
Wild type, FGFR3-S249C or Pten at 10+2 weeks of OH-BBN exposure.
The distribution was not statistically significant in any of the categories (Pearson
Chi-Square test).
Figure 5-11: Frequency of histological features and tumour formation after 10+2 weeks OH-BBN-treated Wild type (green), Tg(UroII-hFGFR3IIIbS249C)
(S249C, yellow) and UroIICre
Ptenflox/flox
(Pten, blue). CIS= Carcinoma in situ
Results – The role of FGFR3 in tumour progression and invasion (Chapter 5) 169
5.7 Analysis of DNA damage in Wild type and FGFR3 mutants
We compared the DNA-damaging effect of OH-BBN on the urothelium of Wild
type and FGFR3-S249C bladders in a time course over 20 weeks (Figure 5-12).
In the absence of carcinogen treatment, γH2aX phosphorylation was seen in Wild
type bladders (n=3 out of 3) (A) as well as in FGFR3-S249C bladders (n=3/3) (B)
at low levels. In two out of three untreated Wild type samples (n=2/3), γH2aX
positivity was observed throughout all layers of the urothelium in (A). In
untreated FGFR3-S249C bladders (n=3/3), γH2aX phosphorylation was mainly
observed in the umbrella cells, but not in intermediate or basal cells (B).
At two weeks of OH-BBN treatment, strong phosphorylation of γH2aX was
detected in Wild type (n=2/2) (C), as well as in FGFR3-S249C (n=2/3) (D),
indicating a high incidence of double strand breaks.
Similarly, at six weeks of OH-BBN treatment, γH2aX phosphorylation was seen at
high levels in Wild type (n=3/3) (E), as well as in FGFR3-S249C (n=2/3) (F),
which was overall comparable with the γH2aX phosphorylation level at two
weeks of OH-BBN exposure (C-D).
At ten weeks of OH-BBN exposure followed by two weeks of normal drinking
water (10+2 weeks), a decrease in γH2aX phosphorylation was observed in Wild
type (n=2/3) (G), as well as in FGFR3-S249C (n=2/3) (H) compared to γH2aX
phosphorylation at two and six weeks (C-F). Cells that had undergone squamous
transformation in FGFR3-S249C (n=1/3) were negative for γH2aX (H, black
arrow); whereas cells along the lobulated urothelium-stroma boundary were
positive (H, red arrow).
At ten weeks of OH-BBN exposure followed by ten weeks of normal drinking
water (10+10 weeks), two tumours had developed in FGFR3-S249C, which
showed high levels of γH2aX (J, red arrows, n=2/2). No tumours had developed
in the Wild type cohort at this point, where therefore no comparison of γH2aX
phosphorylation levels could be made. In areas of Wild type samples that
retained relatively normal urothelium, γH2aX phosphorylation was present

Results – The role of FGFR3 in tumour progression and invasion (Chapter 5) 170
(n=3/3) (I), however at much lower levels compared to Wild type samples at
two- or six-weeks of treatment (C, E). FGFR3-S249C urothelia underwent more
dramatic changes, such as hyperplasia or CIS with varying γH2aX phosphorylation
in each sample (n=3 total), which requires to be addressed in future experiments
in order to generate conclusive data.
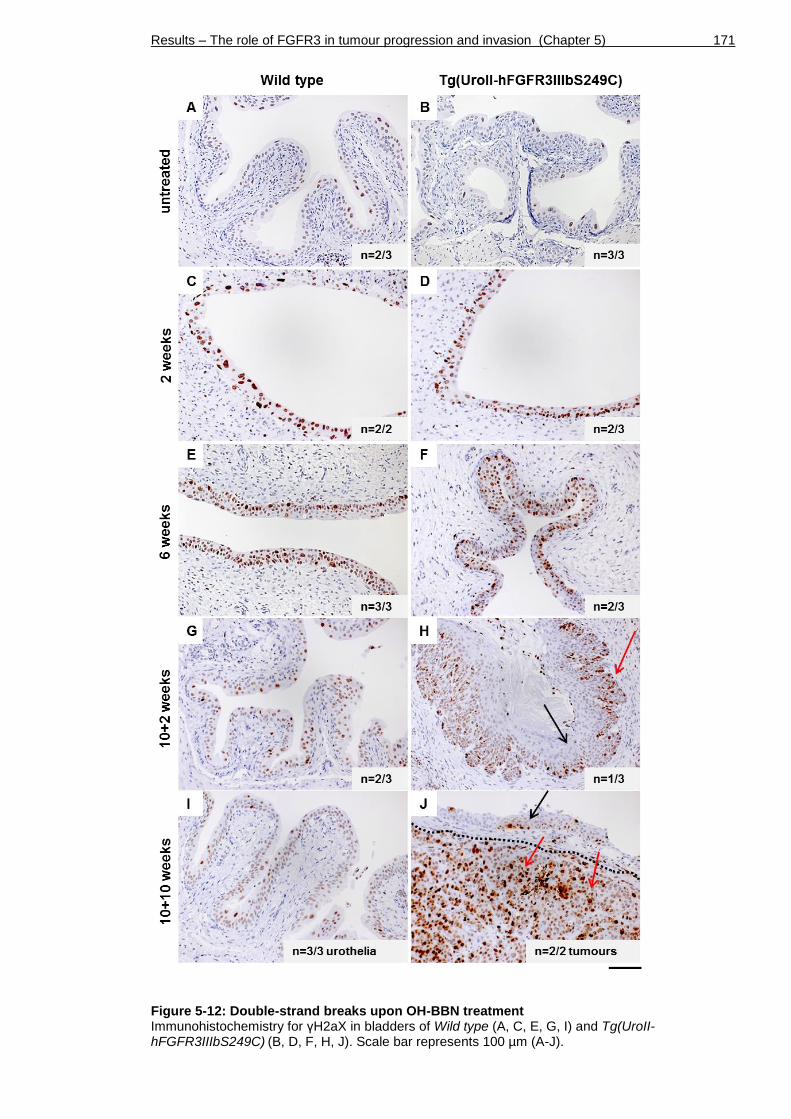
Results – The role of FGFR3 in tumour progression and invasion (Chapter 5) 171
Figure 5-12: Double-strand breaks upon OH-BBN treatment Immunohistochemistry for γH2aX in bladders of Wild type (A, C, E, G, I) and Tg(UroII-hFGFR3IIIbS249C)
(B, D, F, H, J). Scale bar represents 100 µm (A-J).
Results – The role of FGFR3 in tumour progression and invasion (Chapter 5) 172
5.8 Discussion
To address the question whether an FGFR3 mutation could predispose urothelial
cells to tumourigenesis, and to evaluate its role in tumour progression, we
subjected Fgfr3- and FGFR3-mutant as well as Wild type mice to a bladder-
specific carcinogen, N-butyl-N-(hydroxybutyl)-nitrosamine (OH-BBN). We
compared two different point mutations in Fgfr3 and FGFR3, as well as the
effect of Pten deletion and Fgfr3-Pten double mutation in OH-BBN-induced
tumours.
5.8.1 Tg(UroII-hFGFR3IIIbS249C) line
The generation of FGFR3-S249C transgenic mice revealed that mice carrying the
FGFR3-S249C transgene retained a histologically normal urothelial appearance at
12 months (Figure 5-2), consistent with our observations with heterozygous Fgfr3
K644E knock-in mutation in the urothelium (Ahmad et al., 2011c). In the
presence of either of the two Fgfr3 mutations, the proliferation rate in the
urothelium was similarly low as in Wild type. Furthermore, FGFR3 expression
levels were comparable between both genotypes and compared with Wild type.
These results support our previous experiments, suggesting that FGFR3
activation by itself is not able to induce urothelial pathogenesis.
In contrast to UroIICre Fgfr3+/K644E Ptenflox/flox bladders, where significant
increase in urothelial thickness and severe cell-morphological changes were
observed (Chapter 3), we did not see any urothelial abnormalities in UroIICre
FGFR3-S249C Ptenflox/flox bladders (Figure 5-3). FGFR3-S249C Ptenflox/flox urothelia
showed no similarities to UroIICre Fgfr3+/K644E Ptenflox/flox, which suggests that
activated FGFR-signalling with a K644E mutation is more potent than an S249C
mutation to induce urothelial cell changes in a Pten deficient background in a
non-tumour context.
In the comparison of the two FGFR3 mutations, S249C and K644E, it needs to be
noted that Tg(UroII-hFGFR3IIIbS249C) is a transgene (see Methods, Chapter 2.3),
which is expressed in addition to endogenous FGFR3 levels. UroIICre Fgfr3+/K644E
on the other hand is a knock-in construct, generating a heterozygous activating
mutation at the expense of one endogenous Fgfr3 copy (Iwata et al., 2000,

Results – The role of FGFR3 in tumour progression and invasion (Chapter 5) 173
Ahmad et al., 2011c). Furthermore, FGFR3-S249C generates human recombinant
FGFR3 protein in the mouse bladder, whereas UroIICre Fgfr3+/K644E produces
FGFR3 protein of murine origin. Both S249C and K652E have been shown to be
able to transform NIH-3T3 cells, but to have no obvious effect on normal
urothelial cells in culture (di Martino et al., 2009).
Although both K644E and S249C mutation lead to highly activated FGFR3
signalling, their mechanisms may be different and could explain the different
urothelial phenotypes seen in our in vivo studies. K644E mutation leads to a
conformational change in the receptor that favours autophosphorylation (Naski
et al., 1996). It has been suggested that K644E mutation may therefore
deregulate a mechanism for controlling the kinase activity (Naski et al., 1996),
which may possibly result in differential downstream signalling activation. S249C
on the other hand triggers constitutive receptor dimerisation as a result of a
higher level of disulfide bond formation (d'Avis et al., 1998, di Martino et al.,
2009). This may lead to a different shape of the FGFR3 protein and could affect
receptor function or preference in binding to certain adapter proteins
downstream.
S249C may be of greater clinical relevance since it accounts for ~66% of human
non-invasive urothelial cell carcinoma with FGFR3 mutant status (Tomlinson et
al., 2007a, Duenas et al., 2013, Bernard-Pierrot et al., 2006).
5.8.2 FGFR3 mutation increases sensitivity to tumourigenesis after OH-BBN exposure
In response to OH-BBN treatment, and regardless of the nature of additional
genetically introduced mutations, the urothelia underwent a number of pre-
neoplastic changes, such as loss of polarity, cellular atypia and pleomorphism,
hyperchromatic nuclei, frequent mitoses and dysplasia as indications of
carcinoma in situ (CIS) (Figure 5-4). Keratinising squamous metaplasia, which is
considered rather a pre-neoplastic condition, is infrequently found in human
bladder biopsies in the UK (Ahmad et al., 2008). However, it may pose a risk of
malignant transformation to invasive bladder cancer (Guo et al., 2006). In fact,
squamous cell transformation, which is a neoplastic condition, frequently co-
occurs with urothelial cell carcinoma at an advanced stage at the time of
Results – The role of FGFR3 in tumour progression and invasion (Chapter 5) 174
diagnosis, and it is associated with enhanced expression of EGFR and p53 (Guo et
al., 2006).
Strikingly, after 10+10 weeks of OH-BBN treatment we found that FGFR3 S249C
mutation can promote malignant progression in carcinogen-induced bladder
tumours (Figure 5-3 and Figure 5-4). FGFR3 mutated mice exhibited a 2.4-fold
higher incidence of CIS and a 4.4-fold higher incidence of squamous cell
transformation upon administration of OH-BBN compared to Wild type controls.
They also showed a 4.4-fold higher incidence of tumour formation and 3.9-fold
higher incidence of invasion. The urothelium showed characteristics of advanced
tumours including breakthrough of the basement membrane and expression of
Fascin (Karasavvidou et al., 2008). It is therefore possible that FGFR3 mutation
predisposes urothelial cells to tumourigenesis or acts as a tumour promoter in
already established neoplasms. This could be of relevance to the prognosis of
patients with a bladder tumour with FGFR3 mutation, as FGFR3 signalling may
provide a growth advantage to the cells and may drive progression of an existing
tumour towards muscle invasion. In human invasive bladder cancer, wild type
FGFR3 is frequently found overexpressed (Tomlinson et al., 2007a). However, we
have not addressed FGFR3 expression levels in our carcinogen-induced mouse
tumour model with FGFR3 mutation.
Surprisingly, we observed a lower incidence of tumour formation and invasion as
well as lower incidence of CIS and squamous metaplasia in UroIICre Ptenflox/flox
compared to FGFR3-S249C, suggesting that the presence of an FGFR3 S249C
mutation promotes tumourigenesis upon OH-BBN exposure considerably more
than Pten loss. In fact, the frequency of these features in UroIICre Ptenflox/flox
was overall similar to OH-BBN-treated Wild type mice. It is possible that MAPK
activation may be more potent than Akt activation in order to promote
progression of an existing tumour.
This was also supported by the fact that FGFR3 S249C in combination with Pten
deletion (FGFR3 S249C Ptenflox/flox) had a higher incidence in tumour formation
as well as CIS, squamous cell transformation, lobulation and invasion than
UroIICre Ptenflox/flox alone, emphasising the potent effect of FGFR3 S249C on
malignant progression (Figure 5-5). A similar trend was observed for Fgfr3 K644E
in combination with Pten deletion treated for 10+10 weeks (Figure 5-5).
Results – The role of FGFR3 in tumour progression and invasion (Chapter 5) 175
Although not significant, these mice also showed a higher incidence of CIS and
tumour formation compared to Pten only. These results indicate that an Fgfr3
K644E mutation may have a similar effect towards malignant progression as
FGFR3 S249C in the presence of Pten deletion. However, at the time of writing
there were no OH-BBN-treated UroIICre Fgfr3+/K644E mice available for a direct
comparison between S249C and K644E mutation upon OH-BBN treatment in
tumour progression.
Using a treatment schedule where OH-BBN was administered for 20 weeks
continuously, Fgfr3 K644E also showed 2-fold increase in tumourigenesis, a 2.5-
fold increase in squamous metaplasia and a 4-fold increase in invasion compared
to Wild type (Figure 5-6). This result supports the suggestion that Fgfr3 mutation
is likely to play a role in carcinogen-induced bladder cancer in mice, and that
Fgfr3 mutation may be involved in promotion of squamous cell transformation as
well as invasion. A similar trend was observed in UroIICre Ptenflox/flox urothelia as
well as both Fgfr3 and Pten mutations in combination. It has to be noted that a
longer OH-BBN protocol was used, the number of animals was too low for
statistically solid conclusions, and that the mice in this experiment were older
than the mice that were previously treated for 10+10 weeks. In a recent study,
where Secreted Protein Acidic and Rich in Cysteine (Sparc)-deficient mice were
treated for 25 weeks continuously with OH-BBN, mice showed decreased survival
and accelerated urothelial pathology with metastasis to the lymph nodes and
lungs (Said et al., 2013). It would be interesting to extend our current treatment
protocol to a time where metastases occur in the animal model in order to
investigate the effect of FGFR3 mutation in late stages of cancer progression.
5.8.3 DNA damage response upon OH-BBN
Although no obvious phenotypic difference was evident by H&E staining between
Wild type and FGFR3 S249C mutant bladders, we examined the urothelia at the
molecular level to see whether the sensitivity to DNA damage or the DNA repair
machinery is altered in FGFR3-mutant cells (Figure 5-12). Due to the small
number of samples no conclusive statement could be made. However, in two out
of three untreated Wild type samples, γH2aX positivity was observed throughout
all layers of the urothelium, whereas in untreated FGFR3-S249C bladders, γH2aX
phosphorylation was mainly observed in the umbrella cells but not in
Results – The role of FGFR3 in tumour progression and invasion (Chapter 5) 176
intermediate or basal cells in three out of three samples. Whether this indicates
a possible difference between Wild type and FGFR3 S249C in frequency and
location of urothelial cells carrying double strand breaks remains to be
addressed in future experiments. It would also be interesting to include γH2aX
levels of Fgfr3 K644E mutant bladders in future analyses.
Upon carcinogen exposure, γH2aX phosphorylation was the highest at 2-6 weeks
of OH-BBN treatment in both Wild type and FGFR3-S249C. When the carcinogen
was removed after 10 weeks of OH-BBN treatment and the mice were continued
on normal drinking water, the bladders showed a mild decrease in γH2aX
phosphorylation in samples from 10+2 and 10+10 weeks. This may be due to
elimination of cells with DNA damage alongside urothelial hyperproliferation,
resulting in increased production of new cells with intact DNA. Interestingly, in
other organs such as the intestine, cells with DNA damage are eliminated and
renewed after 4-5 days (van der Flier and Clevers, 2009). In the bladder,
presumably due to the slow turnover rate of the urothelium (Khandelwal et al.,
2009), these cells were still present even 10 weeks after OH-BBN-induced DNA
damage. Due to the difference in the number of tumours that had formed in
FGFR3 S249C but not in Wild type, no comparison could be made in terms of
expression level and pattern of γH2aX in the tumour cells. Future experiments
could also include Western blotting in order to examine γH2aX phosphorylation
levels; however the separation of the urothelium from the bladder wall in mice
is technically challenging and the amount of cells is usually low or insufficient
for protein extraction.
5.8.4 OH-BBN as a tool to induce invasive bladder cancer in mice
OH-BBN provides a reliable tool to induce urothelial cell carcinoma in mice,
since it resembles human bladder cancer not only histologically, but also at a
molecular level (Becci et al., 1981, Yao et al., 2004). They are generally of
highly invasive nature and often show a mixed histology with features of both
urothelial cell carcinoma and squamous cell differentiation (Becci et al., 1981).
Molecularly, OH-BBN tumours frequently carry mutations in genes that regulate
major signalling pathways such as p53, RAS, EGFR and TGF-β (Yao et al., 2004).
Despite the fact of systemic distribution by administration through gavage or
drinking water, the carcinogen appears to induce mutations in an organ-specific
Results – The role of FGFR3 in tumour progression and invasion (Chapter 5) 177
manner (He et al., 2012). However, a limitation of carcinogen-induced
mutagenesis is that the DNA damage occurs in a random fashion. Therefore, OH-
BBN cannot induce specific DNA mutations, which may be desired in an
experimental setting.
Exposure to chemical carcinogens is one of the risk factors of developing bladder
cancer. It is estimated that more than one third of bladder tumours are
associated with cigarette smoking (Parkin, 2011). Smoking appears to influence
p53 mutation status and is associated with invasive, high-grade bladder cancer
(Wallerand et al., 2005). In contrast, FGFR3 mutations are not associated with
smoking and may result from endogenous DNA damage (Wallerand et al., 2005).
Our data show that FGFR3 does have an effect on progression of existing tumours
in mice. It is possible that in humans FGFR3 mutation as an early event may
initially help the tumour to progress, and that it is lost later at a more advanced
stage of the tumour.
5.8.5 Future work
Firstly, it would be interesting to confirm in a larger cohort of carcinogen-
induced Fgfr3-mutant mice whether Fgfr3 K644E mutation has an effect similar
to FGFR3 S249C in accelerating bladder tumour formation.
Secondly, further studies of the FGFR3 signalling pathway are essential and will
aid the development of therapies for both non muscle-invasive and muscle-
invasive bladder cancer with deregulation of FGF signalling. For example, it
would be essential to test the effect of FGFR3 inhibitors on OH-BBN-induced
FGFR3-S249C bladder tumours. This could be done in vitro and in vivo. FGF
signalling inhibitors have been developed and applied in many cancer types
(Brooks et al., 2012). Inhibition of FGFR has been suggested as a therapeutic
option in urothelial cell carcinoma (Lamont et al., 2011, Tomlinson et al.,
2007b, Network, 2014). Several novel drugs against FGFRs including R3Mab (Qing
et al., 2009), BGJ398 (Guagnano et al., 2011) and AZD4547 (Gavine et al., 2012)
have been shown to be effective in cell lines and xenograft models. For a
translational benefit, further studies of the FGFR3 signalling pathway and its
inhibitors are therefore essential. However, it has to be kept in mind that

Results – The role of FGFR3 in tumour progression and invasion (Chapter 5) 178
inhibition of the FGFR3 pathway may trigger EGFR activation (or other pathway
activation) as an escape mechanism (Herrera-Abreu et al., 2013).
Lastly, it would be interesting to identify FGFR3-cooperating mutations that can
promote tumour progression alongside FGFR3. This could be elucidated by
exome sequencing of OH-BBN-induced tumours of Fgfr3 mutant bladders, which
would help to identify molecular events that occur together with Fgfr3 mutation
to drive urothelial cell carcinoma or potentially further aid progression.
5.8.6 Conclusion
Altogether, the present results demonstrate that an FGFR3 S249C mutation alone
does not lead to tumourigenesis in the urothelium, similar to Fgfr3 K644E
mutation alone. Differential effects between K644E and S249C on the cellular
architecture were only apparent in combination with another mutation such as
Pten deletion. Moreover, our results indicate that FGFR3 can predispose
urothelial cells to tumourigenesis or can even act as an active tumour promoter
in already established neoplasms. This could be of relevance to the prognosis of
patients with a high-grade bladder tumour with FGFR3 mutation, as FGFR3
signalling may provide a growth advantage to the cells and may drive progression
of an existing tumour towards muscle invasion.

Results – Technological improvement of an invasive bladder cancer model (Chapter 6) 179
Chapter 6
Technological improvement of an invasive bladder cancer model
Results – Technological improvement of an invasive bladder cancer model (Chapter 6) 180
6.1 Introduction
6.1.1 AdenoCre
Given that UroIICre recombination appeared to be missing the basal cells which
have been a putative cell origin for urothelial cell carcinoma, we next wished to
use a model where basal cells can be targeted. Moreover, due to UroplakinII
expression in other tissues, some of our previous UroIICre models had developed
tumours in the skin and lung (Ahmad et al., 2011c). This may indicate a later
cancer onset in the bladder and therefore require more specific recombination
in a smaller number of urothelial cells to allow the emergence of bladder
tumours.
Most urothelial Cre promoters, including the fatty acid-binding protein (Fabp),
Sonic hedgehog (Shh), Cytokeratin 5 (CK5), p63 (ΔNp63) and Uroplakin-II (UroII)
also drive the expression of the recombinase in other tissues. For example, the
Fabp promoter drives Cre expression in all cell layers of the urothelium as well
as in the renal calyces and pelvis, ureters, and small intestinal and colonic
epithelium (Saam and Gordon, 1999, Tsuruta, 2006). Shh-Cre is primarily
expressed in a subgroup of basal cells; but it is also expressed in the prostate
(Shin et al., 2011). CK5-and ΔNp63-Cre have been used to drive the expression of
the recombinase in the urothelium (Pignon et al., 2013, Gandhi et al., 2013).
However, CK5 and p63 are also commonly expressed in the skin (Di Como et al.,
2002, Moll et al., 2008).
At the time of our previous experiments (Chapters 3, 4 and 5) the UroplakinII
promoter was the best available option to drive Cre recombination in the
urothelium. UroIICre-driven recombination to express FGFR3 in combination with
OH-BBN exposure, which specifically targets the bladder, resulted in invasive
urothelial tumours (Chapter 5). However, OH-BBN acts on the entire bladder,
which can potentially promote tumourigenesis in all exposed urothelial cells.
The resulting tumours present with large and fast growth behaviour, which likely
reach the pre-determined end point of the experiment before potential
metastasis can occur. With the use of OH-BBN it is difficult to induce specific
genetic mutations, because the carcinogen induces random DNA damage in all
cells. Therefore, each of the resulting tumours is composed of a large set of
Results – Technological improvement of an invasive bladder cancer model (Chapter 6) 181
different mutations, leading to great variability of genetic profiles at the time of
tumour examination.
An alternative method of Cre delivery to the tissue of interest involves the use
of a recombinant Adenovirus (Anderson et al., 2000, Anton and Graham, 1995).
Cre-recombinant Adenovirus type 5 (AdenoCre) is a viral vector that is
replication-deficient due to deletion of the 0-9.2 map units, which include the
left inverted terminal repeat (ITR) region, as well as transformation-deficient
due to lack of the original E1a sequence (Anderson et al., 2000). In replacement
of E1a, AdenoCre harbours the Cre transgene, which is controlled by a
Cytomegalovirus (CMV) promoter (Anton and Graham, 1995). Since Adenoviruses
do not integrate into the host genome, the expression of Cre is transient (Brody
and Crystal, 1994).
Adenoviral gene transfer has successfully been used to transduce cells in culture
(Hawley et al., 2010, Prost et al., 2001), as well as tissues in vivo such as the
lung (Jackson, 2001), breast (Russell et al., 2003), uterus (Wang et al., 2006)
and brain (Davidson et al., 1993).
AdenoCre has recently also been tested in the bladder, where the virus was
orthotopically instilled via laparotomy or catheterisation (Puzio-Kuter et al.,
2009, Yang et al., 2013). The work by Puzio-Kuter suggested that AdenoCre
could target basal cells (Puzio-Kuter et al., 2009). The study further reported
muscle-invasive tumours by six months with 100% penetrance in p53flox/flox
Ptenflox/flox mice (Puzio-Kuter et al., 2009). 60% of these tumours metastasised to
lymph nodes and distant sites between 4-6 months. No tumours were observed in
p53 or Pten single mutants. Loss of either p53 or Pten in combination with loss
of Retinoblastoma protein (Rb) following AdenoCre injection did not result in
tumour formation or a visibly abnormal urothelial phenotype (Puzio-Kuter et al.,
2009). In a second study in which p53flox/flox Kras+/LSLG12D mice were orthotopically
instilled with AdenoCre, bladders developed mild urothelial hyperplasia at six
months but showed no evidence of tumour initiation (Yang et al., 2013).
In this chapter we aimed to generate an invasive bladder cancer model in which
the effect of different gene combinations can be tested in a spatially and
temporally controlled fashion. We therefore sought to replace UroIICre-driven

Results – Technological improvement of an invasive bladder cancer model (Chapter 6) 182
recombination by AdenoCre delivery. AdenoCre infection not only allows
bladder-restricted recombination (Puzio-Kuter et al., 2009, Seager et al., 2010)
but also may enable recombination in a smaller number of cells that are
individually surrounded by a normal tissue environment. Furthermore, we wished
to assess whether these smaller lesions may allow models to survive longer and
therefore tumours to have the potential to progress and eventually metastasise.
6.1.2 In vivo imaging
In the bladder, clinical signs of tumours such as a palpable mass or haematuria
are generally present at late stages of the disease. Therefore, a number of non-
invasive in vivo imaging techniques have been developed to detect tumours at
early stages and to monitor disease progression as well as drug response. These
include ultrasound, magnetic resonance imaging, computer tomography, and
bioluminescent or fluorescent imaging (Lyons, 2005).
Ultrasound imaging has been used to detect tumours as small as 0.52 mm3 in an
orthotopic bladder cancer model (Patel et al., 2010). Optimised micro-
ultrasound with targeted contrast enhancement involves detection of a probe
that has been inserted into the bladder via a catheter (Chan et al., 2011).
Probes such as microbubbles coated with a monoclonal antibody against a target
molecule can be detected and quantified. A drawback of ultrasound imaging
techniques is the variability of the images acquired from the same tumour as
well as motion artefacts resulting from breathing (Chan et al., 2009a).
Magnetic resonance imaging (MRI) provides the advantage of early tumour
detection with high resolution (Kikuchi et al., 2003). However, image acquisition
and processing is very costly and time consuming. MRI scanners are therefore not
available at every institute.
Computer tomography (CT) is an x-ray-based technology that allows creating a 3-
dimensional picture with high spatial resolution based on the density of the
analysed tissue (Martiniova et al., 2010). Positron emission tomography (PET) is
often used in combination with CT (CT-PET), where a biologically active
molecule is introduced into the body to improve image acquisition. However,
introduction of contrast-enhancing agents may trigger an immune response.

Results – Technological improvement of an invasive bladder cancer model (Chapter 6) 183
Furthermore, due to the high sensitivity of this technology, minor tissue
abnormalities can lead to misinterpretations.
Bioluminescent imaging (BLI) is based on luciferase, an enzyme that converts
substrates such as luciferin into light signals emitting between 500-620nm.
Luciferase-transfected cancer cells can therefore easily be detected in
orthotopic models; however, it is unclear whether luciferase may trigger an
immune response in the animal and it gives no information on tumour anatomy
(Henriquez et al., 2007).
Fluorescent imaging is based on genetically introduced reporters such as GFP or
RFP (Lyons, 2005). An RFP signal can be detected between 570-620nm, whereas
GFP is between 465-520nm. Fluorescent reporters can also be used in
combination. However, this imaging method suffers from autofluorescence of
abdominal hair and internal organs, and in the case of the bladder from the
presence of urine.
With the aim to detect and monitor tumour development and progression in
living animals, we tested fluorescent imaging and ultrasound imaging in the
mouse bladder.
6.1.3 In vitro models
In vitro cell culture provides the opportunity to analyse cancer initiation and
progression, as well as to test the effectiveness of therapeutic drugs in a
controlled environment. In vitro approaches to investigate urothelial cell
carcinoma include cell culture techniques of human and mouse primary tumour
cells, bladder cancer cell lines, as well as organotypic cultures.
Sphere formation in a 3-dimensional (3D) environment such as in Matrigel has
been described as an indication of self-renewal as characteristic of stem cells
(Sato et al., 2009, Xin et al., 2007) and cancer stem cells (Nicolis, 2007). For
example, the highly invasive human bladder cancer cell line T24 cultured on
ultra-low attachment plates starts to form spherical colonies after 7 days as an
indicator of stem cell behaviour (Zhang et al., 2012). Sphere formation has also
been tested using cells from Stat3-activated bladder tumours in mice (Chen et
Results – Technological improvement of an invasive bladder cancer model (Chapter 6) 184
al., 2012). Furthermore, it was shown in normal mouse bladders that FACS-
sorted Shh-expressing urothelial cells are capable of forming spheres in Matrigel
(Shin et al., 2011). In contrast to monolayer cultures, it has been shown that 3D
tumour sphere cultures match the in vivo response to chemotherapeutics better
(Kim and Alexander, 2013), supporting the use of 3D culture systems.
Organotypic slice culture of the bladder has been described as a tool to analyse
tissue development and the underlying signalling pathways in a well-defined
environment (Batourina et al., 2012). The advantage of this culture technique is
that the tumour can be kept in its original environment, surrounded by
urothelium, connective tissue and striated muscle. The effect of therapeutic
drugs on invasion in this ex vivo system has not been tested yet; however, the
technique can potentially constitute useful assay.
With the aim to image invasive bladder cancer in vivo, and to assess
transformation and cell migration we set out to establish essential ex vivo
techniques and assays.
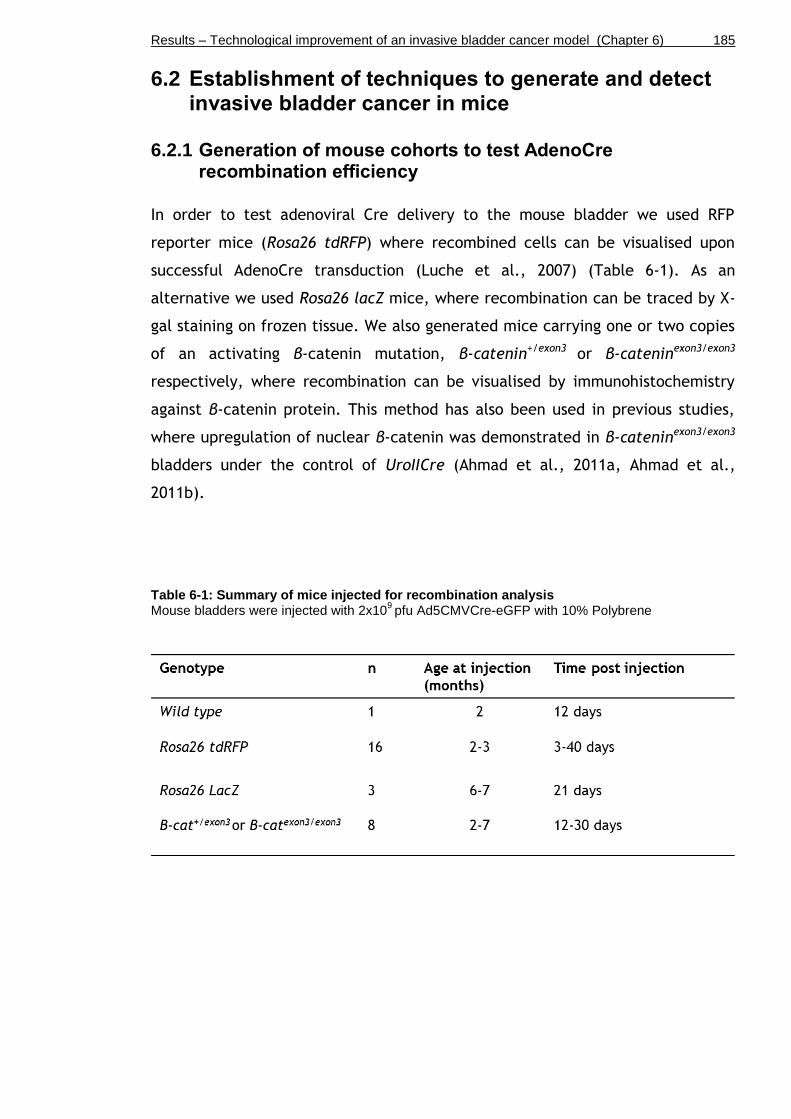
Results – Technological improvement of an invasive bladder cancer model (Chapter 6) 185
6.2 Establishment of techniques to generate and detect invasive bladder cancer in mice
6.2.1 Generation of mouse cohorts to test AdenoCre recombination efficiency
In order to test adenoviral Cre delivery to the mouse bladder we used RFP
reporter mice (Rosa26 tdRFP) where recombined cells can be visualised upon
successful AdenoCre transduction (Luche et al., 2007) (Table 6-1). As an
alternative we used Rosa26 lacZ mice, where recombination can be traced by X-
gal staining on frozen tissue. We also generated mice carrying one or two copies
of an activating β-catenin mutation, β-catenin+/exon3 or β-cateninexon3/exon3
respectively, where recombination can be visualised by immunohistochemistry
against β-catenin protein. This method has also been used in previous studies,
where upregulation of nuclear β-catenin was demonstrated in β-cateninexon3/exon3
bladders under the control of UroIICre (Ahmad et al., 2011a, Ahmad et al.,
2011b).
Table 6-1: Summary of mice injected for recombination analysis Mouse bladders were injected with 2x10
9 pfu Ad5CMVCre-eGFP with 10% Polybrene

Results – Technological improvement of an invasive bladder cancer model (Chapter 6) 186
6.2.2 Assessment of recombination
In order to analyse the location and frequency of AdenoCre recombination upon
infection, as well as to establish an imaging technique by which disease
progression can be monitored in living animals, we tested the IVIS Spectrum in
vivo imaging system.
We instilled Rosa26 tdRFP (n=16) and a Wild type control (n=1) orthotopically
with Ad5CMVCre-eGFP and imaged the mice after 12-40 days using the IVIS
Spectrum (Figure 6-1). In the bladder, an AdenoCre dose of 1x10⁹ pfu has been
demonstrated to successfully generate tumours in a p53flox/flox Ptenflox/flox
background (Puzio-Kuter et al., 2009). We used an Ad5CMVCre-eGFP dose of
1x10⁹ pfu in Rosa26 tdRFP (n=8), as well as 2x10⁹ pfu in Rosa26 tdRFP (n=8) and
Wild type (n=1).
An RFP (mCherry) signal between 587-610nm was expected from cells that have
undergone recombination. A strong RFP signal was observed in the guts of Wild
type (A, circled) as well as the reporter mice (B), a background signal which
most likely results from alfalfa, a plant that is part of the rodent diet that the
animals are commonly provided with at the Beatson animal unit. The bladders of
Wild type and reporter mice (A, B, yellow arrows) emitted only a weak RFP
signal. Due to high background fluorescence in the guts, and the weak signal
from the bladders, the occurrence of recombination in the bladder could not be
unambiguously determined. No difference was observed between AdenoCre-
injected low-dose (1x10⁹ pfu) and high-dose (2x10⁹ pfu) mice based on
fluorescent signal intensity using the IVIS spectrum (data not shown).
The transduction of cells by AdenoCre can be visualised through an eGFP
reporter carried by the recombinant adenovirus (Ad5CMVCre-eGFP).
A GFP signal between 465-520nm was expected from AdenoCre-infected bladder
cells. A strong GFP signal was observed in Wild type (C, yellow arrow) as well as
the reporter mice (D, black arrows). However, this is likely to have resulted
from urine that is autofluorescent. This is supported by the fact that a
prominent spot of GFP-positive urine was seen in Wild type (C, white arrow).
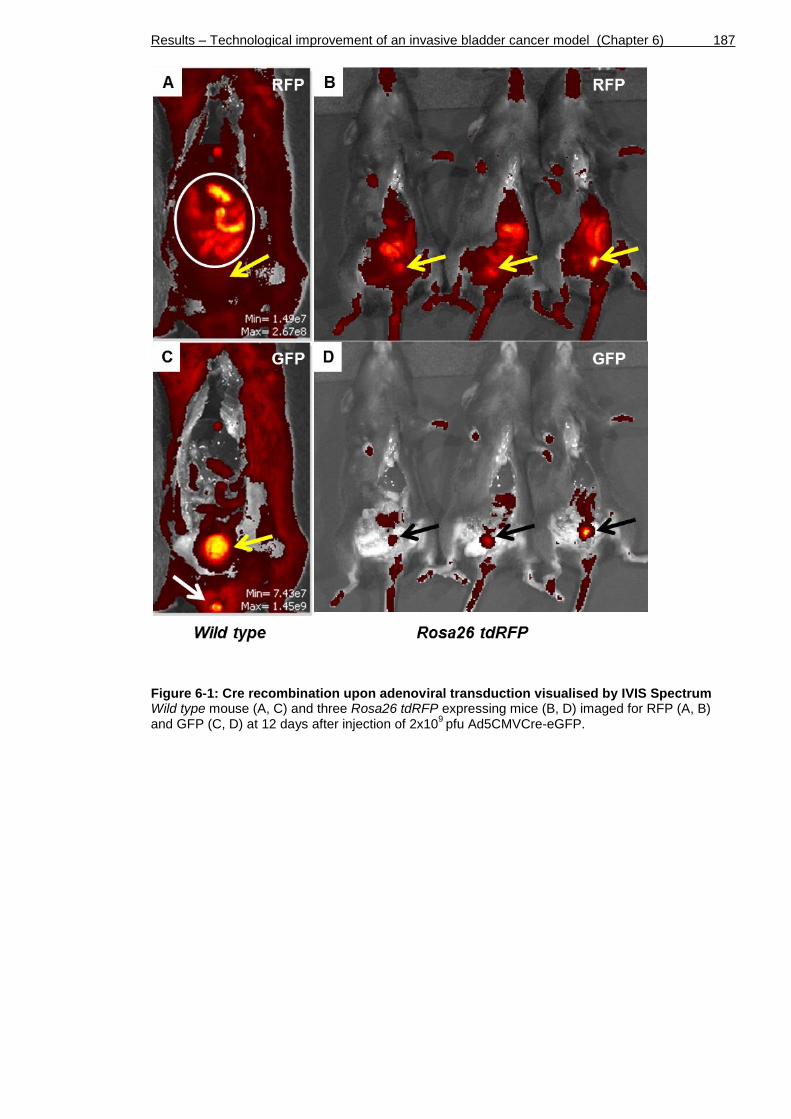
Results – Technological improvement of an invasive bladder cancer model (Chapter 6) 187
Figure 6-1: Cre recombination upon adenoviral transduction visualised by IVIS Spectrum Wild type mouse (A, C) and three Rosa26 tdRFP expressing mice (B, D) imaged for RFP (A, B) and GFP (C, D) at 12 days after injection of 2x10
9 pfu Ad5CMVCre-eGFP.

Results – Technological improvement of an invasive bladder cancer model (Chapter 6) 188
Next we examined AdenoCre transduction and recombination in the urothelium
at the cellular level (Figure 6-2). We first examined the expression of GFP and
RFP to visualise the events of transduction and recombination, respectively, in
the urothelium of Rosa26 tdRFP mice.
GFP expression was detected in a low number of urothelial cells located in the
umbrella and intermediate layer of Rosa26 tdRFP reporter mouse bladders (A),
indicating successful transduction of a small number of cells by AdenoCre.
RFP antibody staining showed broad unspecific positivity in the majority of cells
in the urothelium (B). Some individual cells in the umbrella and intermediate
layer occasionally showed stronger staining intensity (B, arrows), similar to the
one observed in the GFP staining (A).
X-gal staining was performed on frozen sections from bladders carrying a lacZ
reporter (n=3) (C). The majority of umbrella cells showed positive blue staining,
indicating recombination to have occurred. However, as shown in (Figure 3-2),
X-gal generally stains umbrella cells independently of a recombination event.
As an alternative to the RFP and lacZ reporter systems, we aimed to visualise
AdenoCre recombination in β-cateninexon3/exon3 bladders using a β-catenin
antibody. In our experiments, a small number of positive recombination events
was observed in urothelial cells, along with broad recombination in a large
number of cells in the stromal compartment (D, arrows).
Altogether, AdenoCre recombination was most effectively detected by nuclear
β-catenin expression in the presence of a β-cateninexon3/exon3 activating mutation.
GFP expression was generally low in the urothelium, and at times even absent in
a full bladder section. Furthermore, GFP positivity only reveals successful
transduction and not recombination. Therefore, GFP staining was only used in
combination with other reporters in future experiments. Due to the non-
specificity on the RFP antibody, no conclusions could be drawn on urothelial
recombination, and therefore the staining was discontinued. Likewise, X-gal
staining was discontinued in future experiments due to non-specific blue staining
of umbrella cells. The exact percentage of successfully recombined cells could
not be determined by immunohistochemistry.
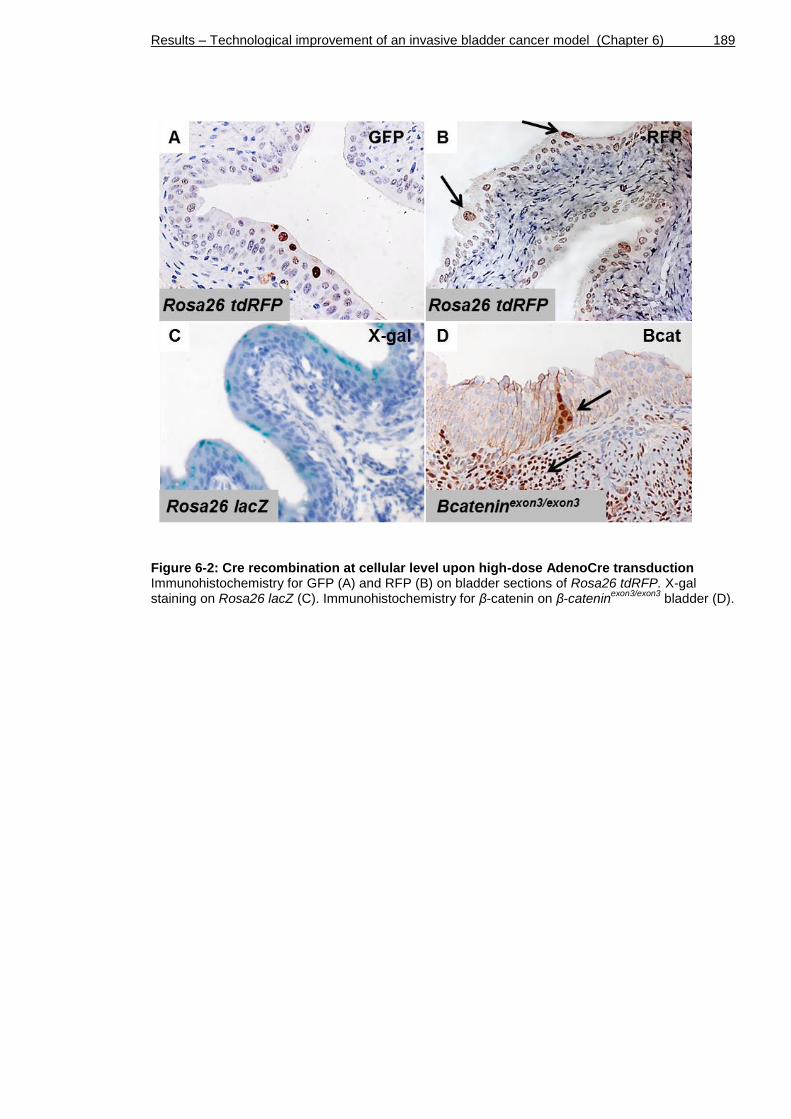
Results – Technological improvement of an invasive bladder cancer model (Chapter 6) 189
Figure 6-2: Cre recombination at cellular level upon high-dose AdenoCre transduction Immunohistochemistry for GFP (A) and RFP (B) on bladder sections of Rosa26 tdRFP. X-gal staining on Rosa26 lacZ (C). Immunohistochemistry for β-catenin on β-catenin
exon3/exon3 bladder (D).

Results – Technological improvement of an invasive bladder cancer model (Chapter 6) 190
6.2.3 Monitoring tumour formation and progression in vivo
Although IVIS Spectrum has only been used to image healthy bladders of reporter
mice, it seemed to provide an insufficient tool to monitor bladder tumours due
to high level of background signal at two different wavelengths (Chapter 6.2.2).
We therefore aimed to establish an alternative, the Vevo 770 Visualsonics
ultrasound, as an imaging system for the bladder in order to monitor tumour
progression in living animals.
To establish the methodology, we first aimed to image transgenic animals that
were known to develop carcinoma in the bladder. In a previous study, we had
generated mice with β-catenin and Hras activation, UroIICre β-cateninexon3/exon3
HrasQ61L, which reliably produced tumours by 8 months of age (Ahmad et al.,
2011b). We then generated mice without UroIICre, where AdenoCre was be used
to induce cell transformation, namely β -cateninexon3/exon3 HrasG12V/G12V (Chapter
6.4). In contrast to the H-Ras Q61L overexpression model (Ahmad et al., 2011b),
our Hras G12V cohort carries a homozygous knock-in mutation that allows
expression of endogenous levels of oncogenic Hras G12V. Bladders were
examined using ultrasound (Figure 6-3).
Injected Wild type bladders (n=1) and non-injected Wild type bladders (n=3)
showed a normal bladder wall of approximately 0.3-0.4 mm in thickness (A). In
AdenoCre-injected β-cateninexon3/exon3 HrasG12V/G12V mice (n=6), we observed
bladder wall thickening with an irregular surface towards the bladder lumen at
5.5 months post injection in all bladders (B).
Upon bladder wall thickening, tumours were monitored in n=4 mice over 14
weeks, all of which showed increasing growth. Shown as representative in
(Figure 6-3), we observed a small exophytic tumour of 0.5 mm in diameter in the
same animal at 8 months post injection (C, arrow). At 9 months post injection,
the tumour had grown to a larger size, filling a considerable part of the bladder
lumen (D). These results indicated that ultrasound imaging is likely to be
sensitive enough to detect relatively small growths (≥0.5 mm) within the
bladder.

Results – Technological improvement of an invasive bladder cancer model (Chapter 6) 191
Figure 6-3: Monitoring of tumour progression using Vevo 770 Visualsonics ultrasound Bladders of non-injected Wild type (A) and AdenoCre-injected β-catenin
exon3/exon3 Hras
G12V/G12V (B-D)
at different stages post AdenoCre injection. Scale bar represents 1 mm (A-D).
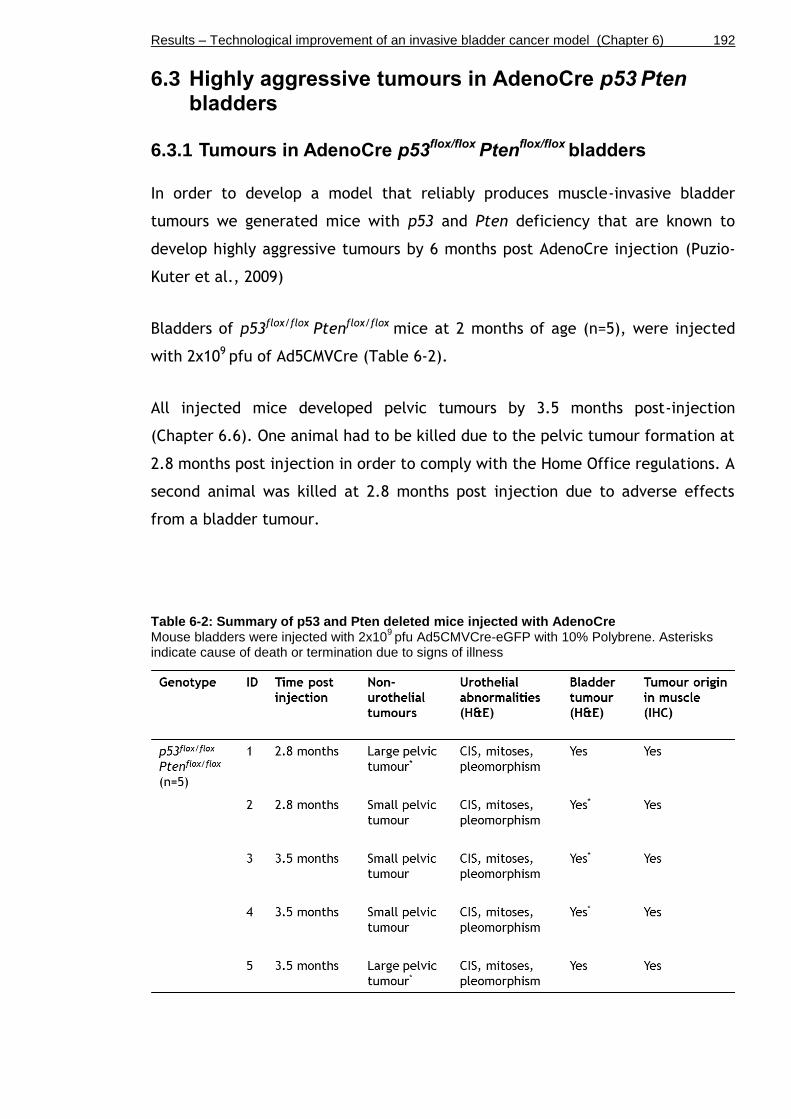
Results – Technological improvement of an invasive bladder cancer model (Chapter 6) 192
6.3 Highly aggressive tumours in AdenoCre p53 Pten
bladders
6.3.1 Tumours in AdenoCre p53flox/flox Ptenflox/flox bladders
In order to develop a model that reliably produces muscle-invasive bladder
tumours we generated mice with p53 and Pten deficiency that are known to
develop highly aggressive tumours by 6 months post AdenoCre injection (Puzio-
Kuter et al., 2009)
Bladders of p53flox/flox Ptenflox/flox mice at 2 months of age (n=5), were injected
with 2x10⁹ pfu of Ad5CMVCre (Table 6-2).
All injected mice developed pelvic tumours by 3.5 months post-injection
(Chapter 6.6). One animal had to be killed due to the pelvic tumour formation at
2.8 months post injection in order to comply with the Home Office regulations. A
second animal was killed at 2.8 months post injection due to adverse effects
from a bladder tumour.
Table 6-2: Summary of p53 and Pten deleted mice injected with AdenoCre Mouse bladders were injected with 2x10
9 pfu Ad5CMVCre-eGFP with 10% Polybrene. Asterisks
indicate cause of death or termination due to signs of illness
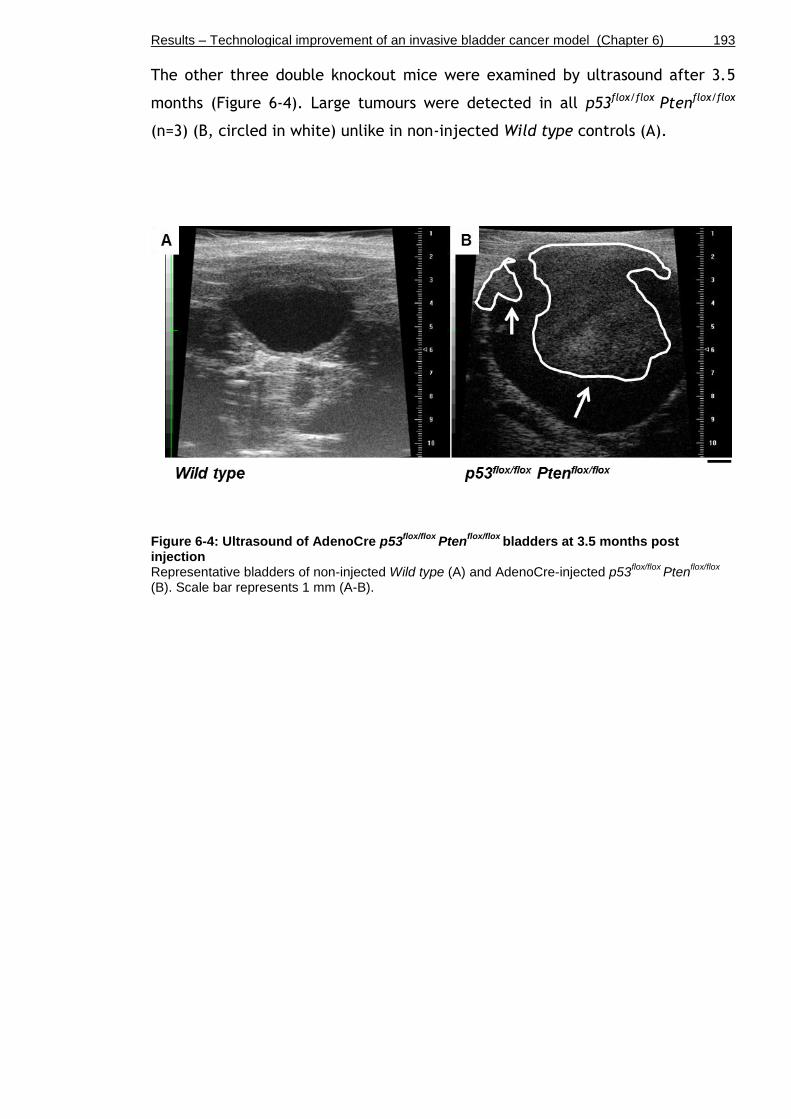
Results – Technological improvement of an invasive bladder cancer model (Chapter 6) 193
The other three double knockout mice were examined by ultrasound after 3.5
months (Figure 6-4). Large tumours were detected in all p53flox/flox Ptenflox/flox
(n=3) (B, circled in white) unlike in non-injected Wild type controls (A).
Figure 6-4: Ultrasound of AdenoCre p53flox/flox
Ptenflox/flox
bladders at 3.5 months post injection Representative bladders of non-injected Wild type (A) and AdenoCre-injected p53
flox/flox Pten
flox/flox
(B). Scale bar represents 1 mm (A-B).

Results – Technological improvement of an invasive bladder cancer model (Chapter 6) 194
Following tumour detection via ultrasound imaging, bladders were harvested at
3.5 months post injection.
Upon examination of the H&E-stained sections, we observed characteristics of
highly aggressive tumours in four out of five p53flox/flox Ptenflox/flox bladders
(Figure 6-5). Bladders presented CIS in the urothelium (A, arrow). There was also
a surrounding tumour mass; however this had no obvious connection to the
urothelium (A, dotted line). Tumours displayed poorly differentiated cells with
pleomorphism and frequent mitoses (B, arrows), invasion of cells into the
bladder muscle (C, arrows and dotted line), as well as invasion into the
“honeycomb”-shaped adipose tissue (D, arrows).
Figure 6-5: Histology of AdenoCre p53flox/flox
Ptenflox/flox
bladders at 3.5 months post injection Representative bladder sections stained by H&E. Scale bar represents 100 µm in A, C, D, and 50 µm in B).

Results – Technological improvement of an invasive bladder cancer model (Chapter 6) 195
In order to further characterise the tumour type, we performed
immunohistochemistry for the urothelial markers pan-cytokeratin (pan-CK) and
p63 to determine the cell of origin, as well as immunohistochemistry for Fascin
and Sox9 as indicators of invasion and stemness (Figure 6-6).
Pan-CK was strongly expressed in the urothelium of p53flox/flox Ptenflox/flox
bladders, but not in the underlying tumour cells, indicating a non-epithelial
origin of the tumours (A, arrows; for orientation of tissue compare with H&E
Figure 6-5 A). Similarly, p63 was exclusively present in the urothelium and
absent in the tumour (B, arrows), further supporting non-epithelial origin of
these tumours.
Fascin was expressed along the basal cells of the urothelium as shown before in
Chapter 5 (Figure 5-7 J). Furthermore, it was widely expressed in the underlying
tumour (C, arrows), indicating aggressive growth and potential for invasion
(Karasavvidou et al., 2008). Sox9 was seen in a small number of cells within the
tumour (D, arrows). This may indicate that these cells had undergone a change
in their genetic program as Sox9 expression is associated with
stemness/progenitor properties, cancer progression and invasiveness (Wang et
al., 2008).
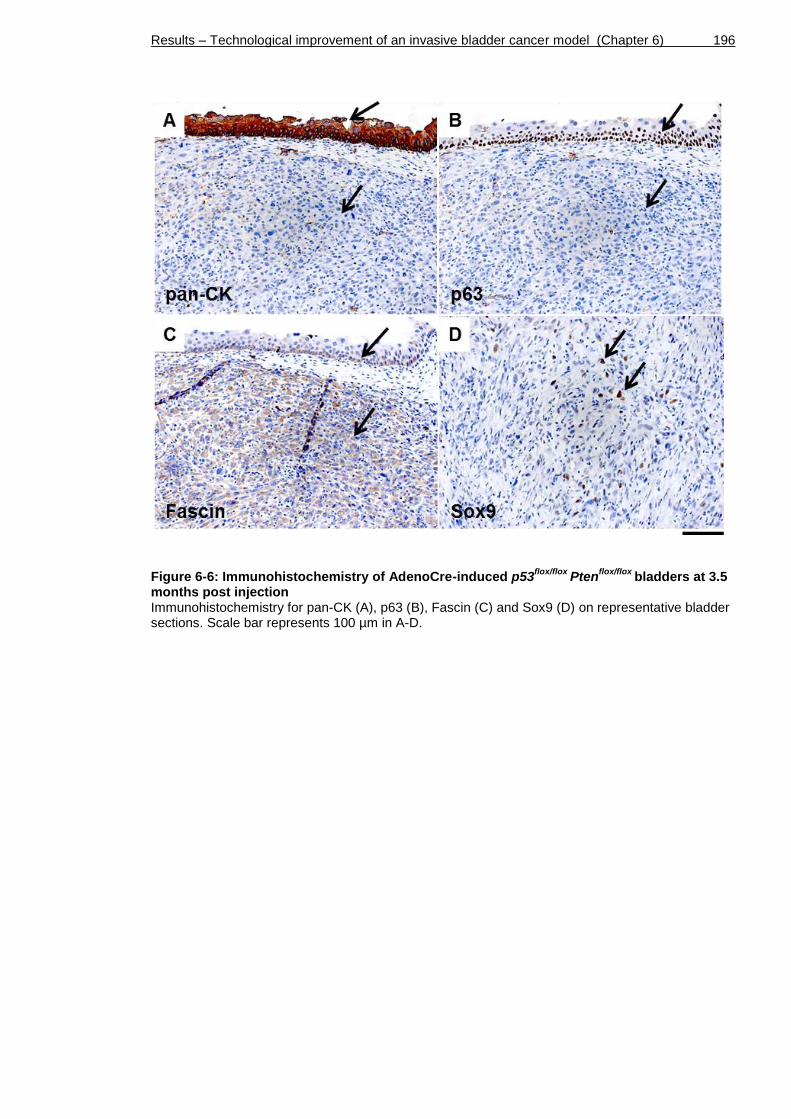
Results – Technological improvement of an invasive bladder cancer model (Chapter 6) 196
Figure 6-6: Immunohistochemistry of AdenoCre-induced p53flox/flox
Ptenflox/flox
bladders at 3.5 months post injection Immunohistochemistry for pan-CK (A), p63 (B), Fascin (C) and Sox9 (D) on representative bladder sections. Scale bar represents 100 µm in A-D.

Results – Technological improvement of an invasive bladder cancer model (Chapter 6) 197
In order to confirm that the AdenoCre p53flox/flox Ptenflox/flox tumours originated in
the muscle and not in the urothelium, we performed immunohistochemistry for
smooth muscle actin (SMA) (Kirsch et al., 2007) (Figure 6-7).
SMA was expressed in the normal bladder muscle (A, white arrow). SMA was
strongly expressed in the tumour, supporting that the tumours originated in the
smooth muscle of the bladder (A, black arrow, and B).
Based on our histology and immunohistochemistry results, our AdenoCre
p53flox/flox Ptenflox/flox tumours are different from the ones that were previously
described in the same bladder cancer model (Puzio-Kuter et al., 2009). We
suggest that these highly aggressive tumours in p53flox/flox Ptenflox/flox originated in
the muscle around the site of AdenoCre injection rather than from recombined
urothelium.
Figure 6-7: Smooth muscle actin staining on AdenoCre-induced p53flox/flox
Ptenflox/flox
bladders at 3.5 months post injection Immunohistochemistry for smooth muscle actin (SMA) on two representative bladder sections (A-B). Scale bar represents 200 µm in A and 100 µm in B.
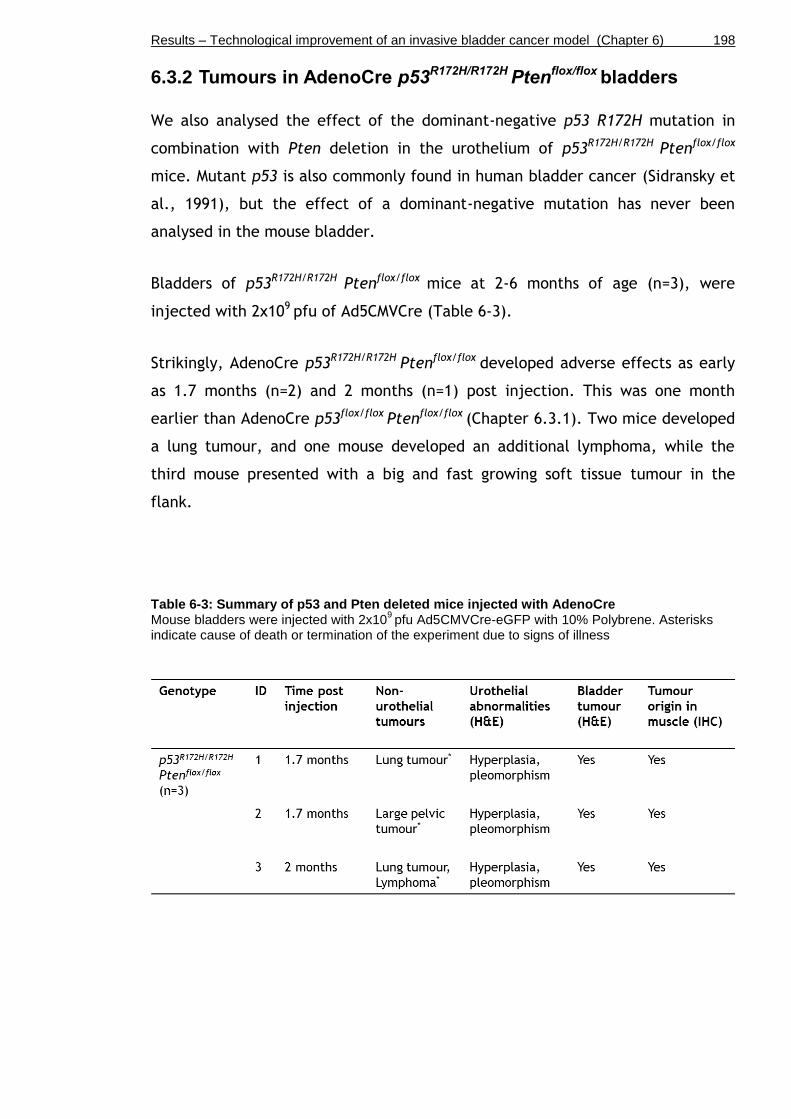
Results – Technological improvement of an invasive bladder cancer model (Chapter 6) 198
6.3.2 Tumours in AdenoCre p53R172H/R172H Ptenflox/flox bladders
We also analysed the effect of the dominant-negative p53 R172H mutation in
combination with Pten deletion in the urothelium of p53R172H/R172H Ptenflox/flox
mice. Mutant p53 is also commonly found in human bladder cancer (Sidransky et
al., 1991), but the effect of a dominant-negative mutation has never been
analysed in the mouse bladder.
Bladders of p53R172H/R172H Ptenflox/flox mice at 2-6 months of age (n=3), were
injected with 2x10⁹ pfu of Ad5CMVCre (Table 6-3).
Strikingly, AdenoCre p53R172H/R172H Ptenflox/flox developed adverse effects as early
as 1.7 months (n=2) and 2 months (n=1) post injection. This was one month
earlier than AdenoCre p53flox/flox Ptenflox/flox (Chapter 6.3.1). Two mice developed
a lung tumour, and one mouse developed an additional lymphoma, while the
third mouse presented with a big and fast growing soft tissue tumour in the
flank.
Table 6-3: Summary of p53 and Pten deleted mice injected with AdenoCre Mouse bladders were injected with 2x10
9 pfu Ad5CMVCre-eGFP with 10% Polybrene. Asterisks
indicate cause of death or termination of the experiment due to signs of illness

Results – Technological improvement of an invasive bladder cancer model (Chapter 6) 199
In order to see whether the bladders had developed urothelial abnormalities or
tumours, we examined H&E-stained sections (Figure 6-8).
Bladders presented with a hyperplastic urothelium (A). This was, however,
without increased proliferation as indicated by Ki67 immunohistochemistry (B).
The surrounding muscle showed a similar histological phenotype as p53flox/flox
Ptenflox/flox, including poorly differentiated cells with pleomorphism and frequent
mitoses (C, arrows). In contrast to the hyperplastic urothelium, these tumours
underneath were highly proliferative as indicated by Ki67 immunohistochemistry
(D).
p53 was highly upregulated in these muscle tumours (E) compared to a
representative area of the muscle that was not affected by the tumour (E,
insert), indicating that the R172H mutant form of p53 was expressed upon
AdenoCre recombination.
Tumours were positive for smooth muscle actin (SMA) (F), indicating that the
origin of these tumours was likely to be the bladder muscle.

Results – Technological improvement of an invasive bladder cancer model (Chapter 6) 200
Figure 6-8: Histology of AdenoCre-induced p53R172H/R172H
Ptenflox/flox
bladders at 1.7 months post injection Representative bladder sections stained by H&E (A, C), Ki67 (B, D), p53 (E) and smooth muscle actin (SMA) (F). Non-tumourous area of the muscle stained by p53 (E, insert). Scale bar represents 100 µm in A-F.

Results – Technological improvement of an invasive bladder cancer model (Chapter 6) 201
We also examined the lung lesions that had developed in 2 out of 3 AdenoCre
p53R172H/R172H Ptenflox/flox mice (Figure 6-9).
The lung harboured one large mass of tumour cells as well as multiple small
lesions as visualised by H&E (A, arrows), accompanied by a large number of small
dark-nucleated immune cells. Ki67 staining indicated high proliferative activity
in these areas (B).
p53 expression was absent, suggesting that both copies of mutant p53 may have
been lost as a characteristic of advanced grade and stage of the primary tumour
(C).
Tumours were negative for smooth muscle actin (SMA) (D), indicating that these
lesions were most likely lung primary, and not metastatic from the bladder
muscle.
Figure 6-9: Histology of an AdenoCre-induced p53R172H/R172H
Ptenflox/flox
lung at 1.7 months post injection Representative lung sections stained by H&E (A), Ki67 (B), p53 (C) and smooth muscle actin (SMA) (D). Scale bar represents 100 µm in A-D.

Results – Technological improvement of an invasive bladder cancer model (Chapter 6) 202
We also examined the grossly normal looking livers of AdenoCre p53R172H/R172H
Ptenflox/flox mice that had been sacrificed due to lung tumour formation (Figure
6-10).
As visualised by H&E, the livers harboured multiple areas of small dark cells
surrounding the blood vessels (A, arrows). Ki67 staining indicated high
proliferative potential of these areas (B).
Together with the presence of primary tumours in various organs (Figure 6-9),
these results indicate that the adenovirus may have accessed the blood stream,
distributed throughout the body, and recombined tissue at distant sites leading
to tumour formation outside of the bladder.
Figure 6-10: Histology of an AdenoCre-induced p53R172H/R172H
Ptenflox/flox
liver at 1.7 months post injection Representative liver sections stained by H&E (A) and Ki67 (B). Scale bar represents 100 µm in A-B.

Results – Technological improvement of an invasive bladder cancer model (Chapter 6) 203
6.4 Exophytic tumours in AdenoCre β-cateninexon3/exon3
Hras
G12V/G12V bladders
In a previous study we have generated mice with β-catenin and Hras activation,
UroIICre β-cateninexon3/exon3 HrasQ61L, which reliably produced tumours by 8
months of age (Ahmad et al., 2011b). Mice had to be sacrificed at 8 months due
to clinical signs of illness such as haematuria or abdominal swelling. No
metastases were found in these mice, and the tumours showed histological
characteristics of low-grade, non-invasive urothelial carcinoma.
We aimed to refine this model of Wnt activation in order to allow more time for
β-catenin and Hras activated tumours to grow and adopt invasive behaviour.
Since AdenoCre infection allows recombination in a smaller number of cells
(Puzio-Kuter et al., 2009, Seager et al., 2010), we wished to assess whether
these fewer lesions may allow models to survive longer and therefore the
tumours would have the potential to progress and eventually metastasise.
We generated a cohort without UroIICre, where AdenoCre was used to induce β-
cateninexon3/exon3 HrasG12V/G12V. We injected n=9 bladders with 2x10⁹ pfu of
Ad5CMVCre-eGFP of mice that were 2 months of age (Table 6-4).
Two out of eight β-cateninexon3/exon3 HrasG12V/G12 mice had to be killed due to
pelvic tumour formation after 2 and 3.5 months respectively (Figure 6-16). Two
mice developed a large liver tumour after 6.5 and 9 months respectively. One
mouse developed a pancreatic tumour after 9.3 months (Figure 6-12).
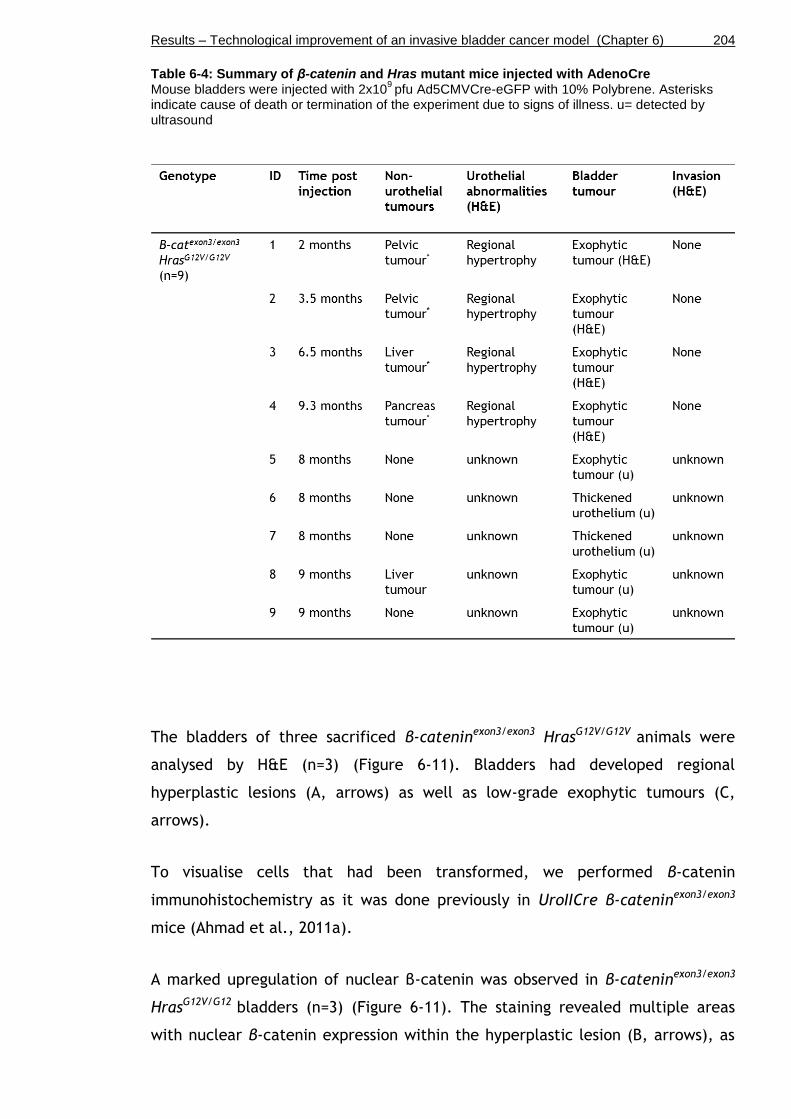
Results – Technological improvement of an invasive bladder cancer model (Chapter 6) 204
Table 6-4: Summary of β-catenin and Hras mutant mice injected with AdenoCre Mouse bladders were injected with 2x10
9 pfu Ad5CMVCre-eGFP with 10% Polybrene. Asterisks
indicate cause of death or termination of the experiment due to signs of illness. u= detected by ultrasound
The bladders of three sacrificed β-cateninexon3/exon3 HrasG12V/G12V animals were
analysed by H&E (n=3) (Figure 6-11). Bladders had developed regional
hyperplastic lesions (A, arrows) as well as low-grade exophytic tumours (C,
arrows).
To visualise cells that had been transformed, we performed β-catenin
immunohistochemistry as it was done previously in UroIICre β-cateninexon3/exon3
mice (Ahmad et al., 2011a).
A marked upregulation of nuclear β-catenin was observed in β-cateninexon3/exon3
HrasG12V/G12 bladders (n=3) (Figure 6-11). The staining revealed multiple areas
with nuclear β-catenin expression within the hyperplastic lesion (B, arrows), as

Results – Technological improvement of an invasive bladder cancer model (Chapter 6) 205
well as positivity throughout the entire tumour (D, arrows), indicating that the
tumour originated from recombined cells. Furthermore, stromal β-catenin
activation was observed (B, circled), indicating that recombination had not only
occurred in the urothelium but also in surrounding tissue layers such as the
connective tissue.
Figure 6-11: AdenoCre β-cateninexon3/exon3
HrasG12V/G12V
bladders at 2 months (A-B) and 3.5 months (C-D) post injection Representative bladder sections stained by H&E (A, C) and immunohistochemistry for β-catenin (B, D). Scale bar represents 200 µm (A-D).

Results – Technological improvement of an invasive bladder cancer model (Chapter 6) 206
The two tumours that developed in the liver and pancreas in two animals,
respectively, were also assessed by H&E and β-catenin immunohistochemistry
(Figure 6-12). Both organs harboured large mass of tumour cells as visualised by
H&E (A, B). β-catenin immunohistochemistry revealed nuclear β-catenin
translocation in both tumours (C, D), indicating that the neoplasms in these
distant organs were caused by AdenoCre recombination.
Figure 6-12: AdenoCre β-cateninexon3/exon3
HrasG12V/G12V
tumours in liver and pancreas Representative sections of hepatic tumour (A, C) and pancreatic tumour (B, D) stained by H&E (A, B) and immunohistochemistry for β-catenin (C, D). Scale bar represents 100 µm (A-D).
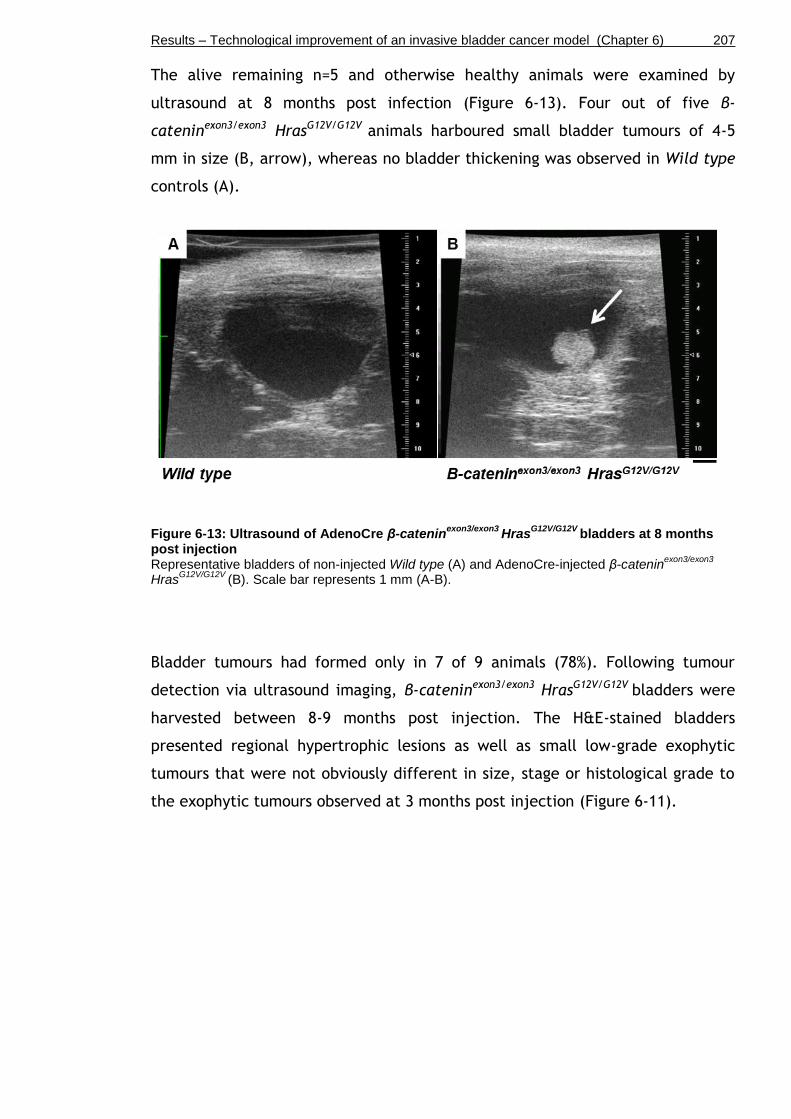
Results – Technological improvement of an invasive bladder cancer model (Chapter 6) 207
The alive remaining n=5 and otherwise healthy animals were examined by
ultrasound at 8 months post infection (Figure 6-13). Four out of five β-
cateninexon3/exon3 HrasG12V/G12V animals harboured small bladder tumours of 4-5
mm in size (B, arrow), whereas no bladder thickening was observed in Wild type
controls (A).
Figure 6-13: Ultrasound of AdenoCre β-cateninexon3/exon3
HrasG12V/G12V
bladders at 8 months post injection Representative bladders of non-injected Wild type (A) and AdenoCre-injected β-catenin
exon3/exon3
HrasG12V/G12V
(B). Scale bar represents 1 mm (A-B).
Bladder tumours had formed only in 7 of 9 animals (78%). Following tumour
detection via ultrasound imaging, β-cateninexon3/exon3 HrasG12V/G12V bladders were
harvested between 8-9 months post injection. The H&E-stained bladders
presented regional hypertrophic lesions as well as small low-grade exophytic
tumours that were not obviously different in size, stage or histological grade to
the exophytic tumours observed at 3 months post injection (Figure 6-11).

Results – Technological improvement of an invasive bladder cancer model (Chapter 6) 208
6.5 Hypertrophy in AdenoCre Hras+/G12V
Ptenflox/flox
bladders
We also analysed the effect of the Hras mutation in combination with Pten
deletion in the urothelium of Hras+/G12V Ptenflox/flox mice. HRAS mutation and loss
of PTEN are both frequently found in human bladder tumours (Hras in 15-40%
and Pten in 30%) (Jebar et al., 2005, Aveyard et al., 1999). However, co-
occurrence of these mutations have been shown to be rare (Jebar et al., 2005)
suggesting some redundancy between these pathways. In a mouse model of
prostate cancer, it has been shown that Pten deletion and KRAS activation
cooperate to promote EMT and metastatic progression (Mulholland et al., 2012).
Also, it was shown that loss of Pten cooperates with HRAS activation to promote
the development of melanoma and its metastasis (Kim, 2010). Furthermore, the
combination of Pten and Kras mutation dramatically accelerated the
development of endometrial cancer (Kim et al., 2010). However, in the bladder
the combined effect of Hras and Pten mutation has never been analysed.
We generated Hras+/G12V Ptenflox/flox mice (n=9) and injected them with 2x10⁹ pfu
of Ad5CMVCre-eGFP at 2-3 month of age (Table 6-5). We also generated
Ptenflox/flox mice (n=8) to see the effect of Pten deletion by itself in the
urothelium upon AdenoCre transduction.
None of the animals showed any adverse effect or clinical signs of bladder
tumours at 6.5 months post infection.
Table 6-5: Summary of Hras and Pten mutant mice injected with AdenoCre Mouse bladders were injected with 2x10
9 pfu Ad5CMVCre-eGFP with 10% Polybrene

Results – Technological improvement of an invasive bladder cancer model (Chapter 6) 209
In order to assess tumour development, two animals from the AdenoCre
Hras+/G12V Ptenflox/flox cohort were examined by ultrasound imaging (Figure 6-14).
Bladders of Hras+/G12V Ptenflox/flox presented with a normal bladder wall and no
indication of tumours or irregularities in thickness (B) compared to non-injected
Wild type controls (A). Since the double mutants did not show any urothelial
abnormalities, mice with single mutation (AdenoCre Ptenflox/flox) were not
examined by ultrasound.
Figure 6-14: Ultrasound of AdenoCre Hras+/G12V
Ptenflox/flox
bladders at 6.5 months post injection Bladders of non-injected Wild type (A) and AdenoCre-injected Hras
+/G12V Pten
flox/flox (B). Scale bar
represents 1 mm (A-B).
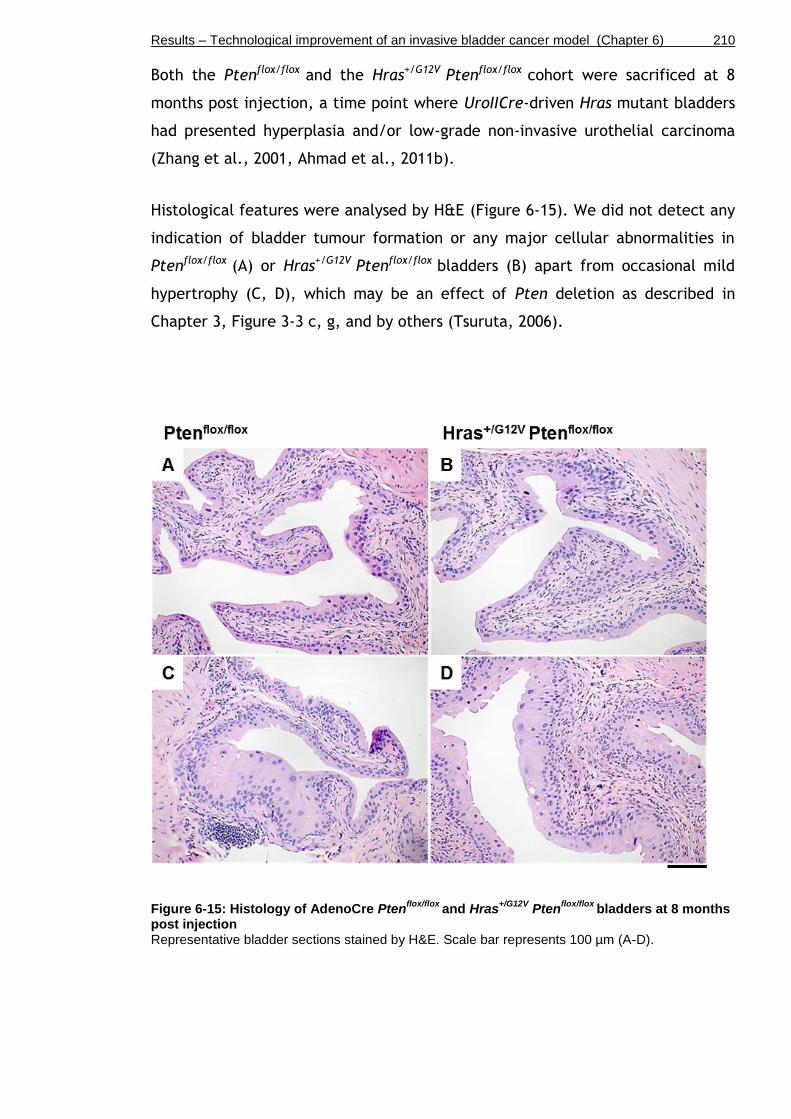
Results – Technological improvement of an invasive bladder cancer model (Chapter 6) 210
Both the Ptenflox/flox and the Hras+/G12V Ptenflox/flox cohort were sacrificed at 8
months post injection, a time point where UroIICre-driven Hras mutant bladders
had presented hyperplasia and/or low-grade non-invasive urothelial carcinoma
(Zhang et al., 2001, Ahmad et al., 2011b).
Histological features were analysed by H&E (Figure 6-15). We did not detect any
indication of bladder tumour formation or any major cellular abnormalities in
Ptenflox/flox (A) or Hras+/G12V Ptenflox/flox bladders (B) apart from occasional mild
hypertrophy (C, D), which may be an effect of Pten deletion as described in
Chapter 3, Figure 3-3 c, g, and by others (Tsuruta, 2006).
Figure 6-15: Histology of AdenoCre Ptenflox/flox
and Hras+/G12V
Ptenflox/flox
bladders at 8 months post injection Representative bladder sections stained by H&E. Scale bar represents 100 µm (A-D).
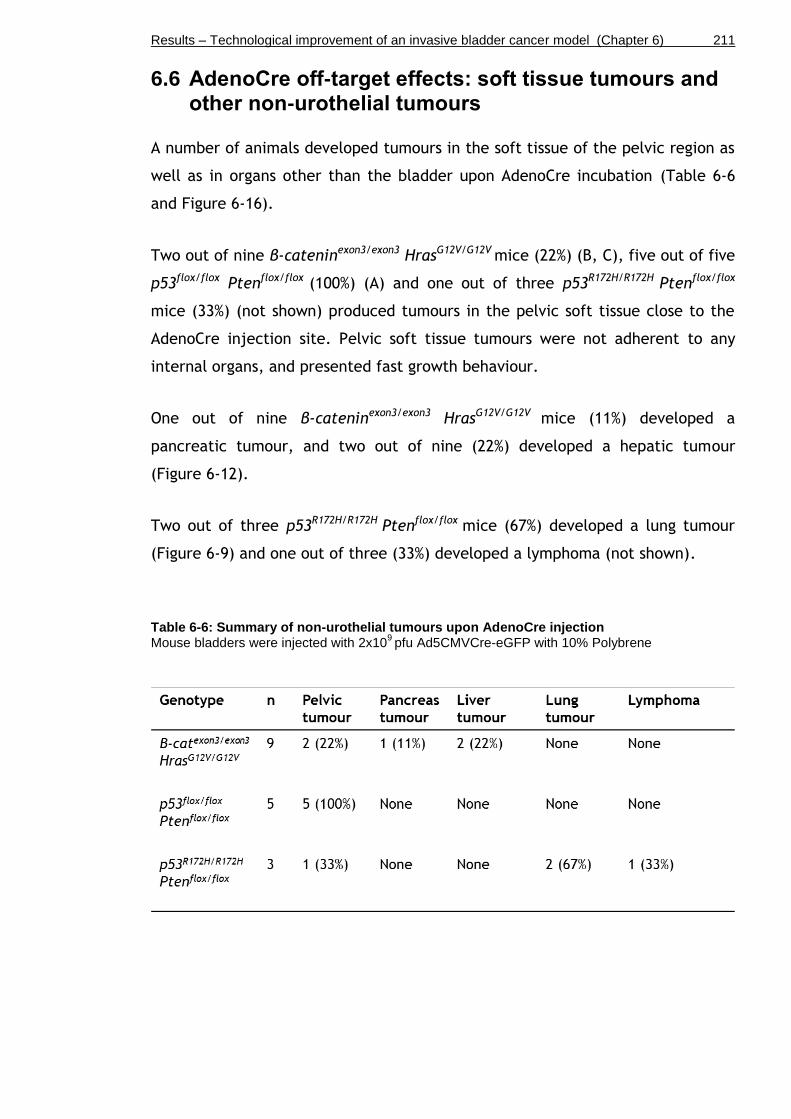
Results – Technological improvement of an invasive bladder cancer model (Chapter 6) 211
6.6 AdenoCre off-target effects: soft tissue tumours and other non-urothelial tumours
A number of animals developed tumours in the soft tissue of the pelvic region as
well as in organs other than the bladder upon AdenoCre incubation (Table 6-6
and Figure 6-16).
Two out of nine β-cateninexon3/exon3 HrasG12V/G12V mice (22%) (B, C), five out of five
p53flox/flox Ptenflox/flox (100%) (A) and one out of three p53R172H/R172H Ptenflox/flox
mice (33%) (not shown) produced tumours in the pelvic soft tissue close to the
AdenoCre injection site. Pelvic soft tissue tumours were not adherent to any
internal organs, and presented fast growth behaviour.
One out of nine β-cateninexon3/exon3 HrasG12V/G12V mice (11%) developed a
pancreatic tumour, and two out of nine (22%) developed a hepatic tumour
(Figure 6-12).
Two out of three p53R172H/R172H Ptenflox/flox mice (67%) developed a lung tumour
(Figure 6-9) and one out of three (33%) developed a lymphoma (not shown).
Table 6-6: Summary of non-urothelial tumours upon AdenoCre injection Mouse bladders were injected with 2x10
9 pfu Ad5CMVCre-eGFP with 10% Polybrene

Results – Technological improvement of an invasive bladder cancer model (Chapter 6) 212
Figure 6-16: Pelvic tumour formation at 2.8 -3.5 post AdenoCre injection Male p53
flox/flox Pten
flox/flox mouse with a bladder tumour (A, red arrow) and a soft tissue tumour (A,
white arrow). Female β-cateninexon3/exon3
HrasG12V/G12V
with soft tissue tumour (B, C, white arrows; bladder removed).
In order to characterise the cellular morphology as well as the origin of the
pelvic tumours from β-cateninexon3/exon3 HrasG12V/G12V mice, we performed H&E
and immunohistochemistry.
H&E-stained sections presented features of invasive, keratin-rich squamous cell
carcinomas (Figure 6-17). The pelvic tumours showed glandular areas (A, circled)
mixed with regions of squamous metaplasia and poorly differentiated of cells
(A). Keratinisation was observed in some regions of the tumours (A, arrow).
We observed pan-CK positivity along the borders of the glandular structures (B,
dotted line), indicating that these tumour cells could potentially be of basal cell
origin.
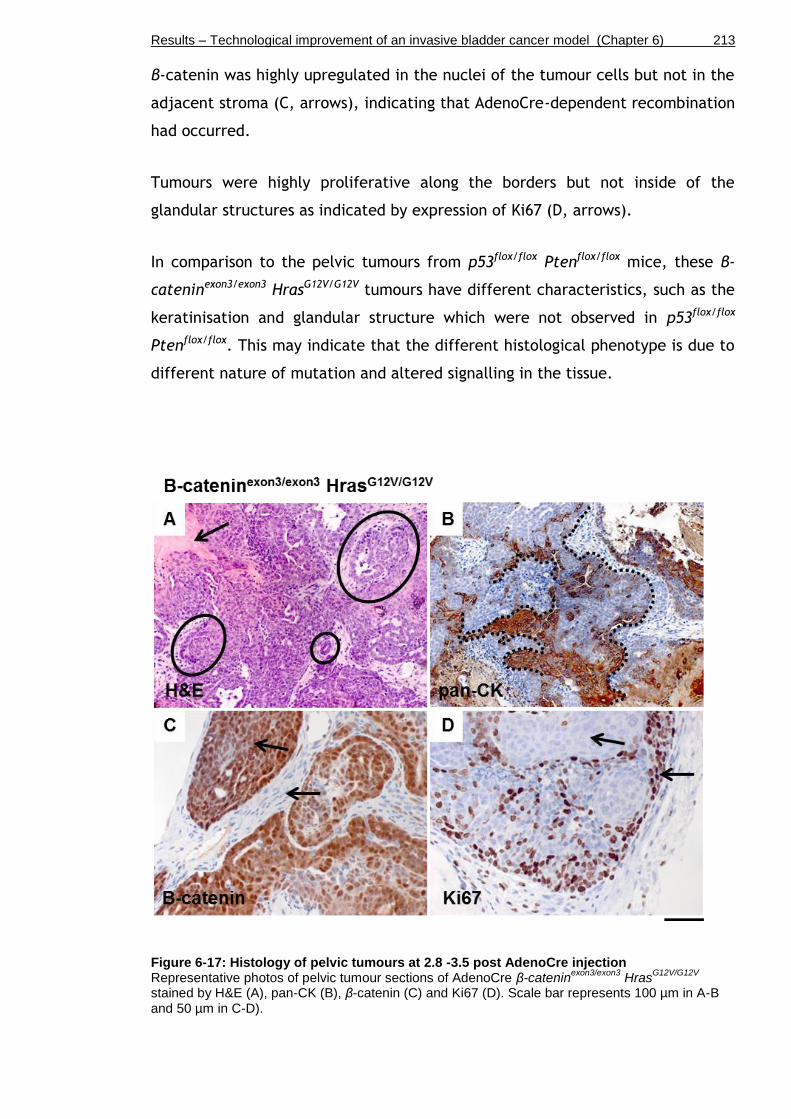
Results – Technological improvement of an invasive bladder cancer model (Chapter 6) 213
β-catenin was highly upregulated in the nuclei of the tumour cells but not in the
adjacent stroma (C, arrows), indicating that AdenoCre-dependent recombination
had occurred.
Tumours were highly proliferative along the borders but not inside of the
glandular structures as indicated by expression of Ki67 (D, arrows).
In comparison to the pelvic tumours from p53flox/flox Ptenflox/flox mice, these β-
cateninexon3/exon3 HrasG12V/G12V tumours have different characteristics, such as the
keratinisation and glandular structure which were not observed in p53flox/flox
Ptenflox/flox. This may indicate that the different histological phenotype is due to
different nature of mutation and altered signalling in the tissue.
Figure 6-17: Histology of pelvic tumours at 2.8 -3.5 post AdenoCre injection Representative photos of pelvic tumour sections of AdenoCre β-catenin
exon3/exon3 Hras
G12V/G12V
stained by H&E (A), pan-CK (B), β-catenin (C) and Ki67 (D). Scale bar represents 100 µm in A-B and 50 µm in C-D).

Results – Technological improvement of an invasive bladder cancer model (Chapter 6) 214
6.7 The use of LentiCre as an alternative to AdenoCre
In order to explore an alternative for AdenoCre-mediated recombination, we
tested Cre delivery via lentivirus (LentiCre) (Kumar et al., 2008). Lentiviruses
are routinely used as vectors to transduce cells and tissues (Heldt and Ressler,
2009). In contrast to adenoviruses, lentiviruses integrate into the host genome
resulting in stable transgenic Cre expression (Naldini et al., 1996). Lentiviruses
also detain host immune response after infection, a defence mechanism which
aims to eliminate transiently infected cells from the microenvironment (Brody
and Crystal, 1994).
In order to test the effectiveness of lentivirus in mediating recombination via
Cre recombinase, we injected n=3 β-cateninexon3/exon3 HrasG12V/G12V mice with
4x10⁶ pfu LentiCre to analyse the recombination efficiency. At the time of
writing at six months post injection, the LentiCre-injected mice are healthy and
show no clinical signs of illness.

Results – Technological improvement of an invasive bladder cancer model (Chapter 6) 215
6.8 Establishment of techniques to assess growth and invasion in vitro
6.8.1 Development of an organotypic collagen-I invasion assay
It is yet unclear whether invasion can be detected using ultrasound. In order to
develop a platform from which tumour invasion can be addressed at the cellular
level, we adapted an organotypic collagen-I assay to murine primary bladder
cancer cells in collaboration with Dr Paul Timpson (Garvan Institute, Sydney,
Australia). This fibroblast-containing collagen-I assay had previously been used
to assess invasion of pancreatic ductal adenocarcinoma and melanoma cells
(Timpson et al., 2011). In the assay, cells with invasive behaviour migrate out
into the matrix along a nutrient gradient, which is created by placing the
matrices on a grid that is in contact with DMEM media only from the bottom.
We sought for a suitable cell type to model tumour invasion in collagen-I. β-
cateninexon3/exon3 HrasG12V/G12V is not a model of muscle-invasive bladder cancer
per se. In our previous study, β-catenin and Hras activation (UroIICre β-
cateninexon3/exon3 HrasQ61L), resulted in non-invasive papillary carcinomas with no
signs of invasion (Ahmad et al., 2011b). Also, unpublished data from our group of
mice with β-catenin and Hras activation using UroIICre (UroIICre β-
cateninexon3/exon3 HrasG12V/G12V), did not obviously exhibit an invasive cancer
phenotype.
Instead, the highly invasive human bladder cancer cell line EJ138 was chosen to
test the system (Figure 6-18). EJ138 is in fact T24 (or sometimes referred to as
MGH-U1), which has been shown by isoenzyme analysis and HLA profiles (O'Toole
et al., 1983).
Invasion of EJ138 (4x10⁴ seeded cells) into the collagen-I matrix containing
human telomerase-immortalised fibroblasts (TIFFs) was clearly detectable after
14 days by H&E staining (A). Ki67 staining showed strong proliferation of invading
cells (B). The direction of cell migration is indicated by the black arrows (A-C).
To visualise migrating cells in the matrix, Fascin expression levels were
analysed. Fascin has been reported to be expressed in various stages of bladder
tumours and is associated with cell dedifferentiation (Karasavvidou et al., 2008).
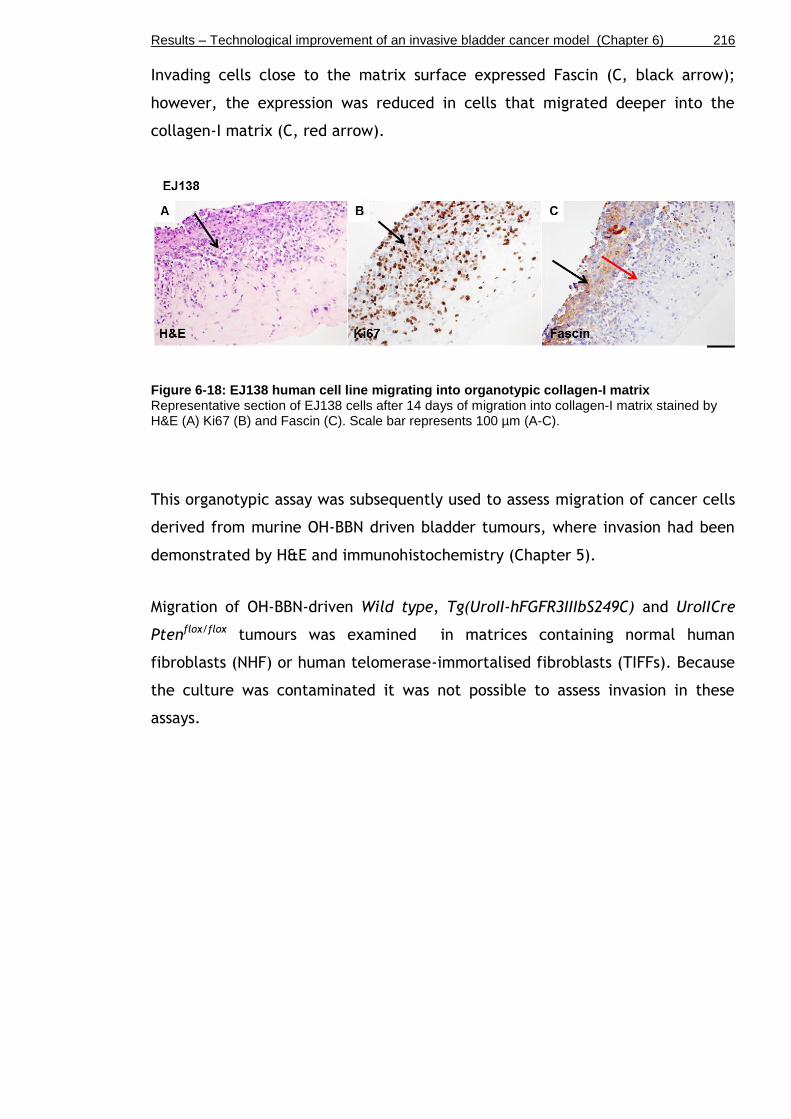
Results – Technological improvement of an invasive bladder cancer model (Chapter 6) 216
Invading cells close to the matrix surface expressed Fascin (C, black arrow);
however, the expression was reduced in cells that migrated deeper into the
collagen-I matrix (C, red arrow).
Figure 6-18: EJ138 human cell line migrating into organotypic collagen-I matrix Representative section of EJ138 cells after 14 days of migration into collagen-I matrix stained by H&E (A) Ki67 (B) and Fascin (C). Scale bar represents 100 µm (A-C).
This organotypic assay was subsequently used to assess migration of cancer cells
derived from murine OH-BBN driven bladder tumours, where invasion had been
demonstrated by H&E and immunohistochemistry (Chapter 5).
Migration of OH-BBN-driven Wild type, Tg(UroII-hFGFR3IIIbS249C) and UroIICre
Ptenflox/flox tumours was examined in matrices containing normal human
fibroblasts (NHF) or human telomerase-immortalised fibroblasts (TIFFs). Because
the culture was contaminated it was not possible to assess invasion in these
assays.

Results – Technological improvement of an invasive bladder cancer model (Chapter 6) 217
6.8.2 Development of an ex vivo assay to test the effects of therapeutic drugs
6.8.2.1 Sphere culture
In order to examine the potential of urothelial cells to form 3D spheres in
Matrigel, we used three bladder cell cultures with different growth
characteristics. We examined the growth of normal murine Wild type urothelial
cells, cells from a murine non-invasive tumour, and cells of a human invasive
bladder carcinoma cell line. Murine cells from normal bladders and bladder
tumours were scraped off the urothelium and pooled. Based on established
sphere culture protocols of intestinal crypts and adenoma (Sansom laboratory,
BICR), urothelial spheres were grown in Matrigel with ADF media without growth
factors (Figure 6-19).
The urothelium of n=9 Wild type mouse bladders was scraped off and pooled,
processed into single cells, and resuspended in Matrigel and distributed into 10
wells. These Wild type cells did not form spheres after 9 days in culture (A) and
died after the first passaging.
Pieces of bladder tumours from UroIICre β-cateninexon3/exon3 HrasG12V/G12V (n=3)
were processed into single cells, resuspended in Matrigel and distributed into 10
wells. Tumour cells formed spheres of a variety of different shapes, including
perfectly round (B, white arrow), polarised (not shown), or blobbing and
sprouting (B, yellow arrow) as early as after 3 days in culture. We were able to
passage UroIICre β-cateninexon3/exon3 HrasG12V/G12V formed spheres up to 7 times,
freeze and recover for another 4 passages until all cells had died.
The highly invasive human bladder cancer cell line EJ138 (passage 34 upon
arrival) was processed into single cells, resuspended in Matrigel and distributed
into 10 wells. EJ138 formed sphere-like structures with outgrowths of stretched
differentiated cells (C, arrows). Cells were viable after passaging, freezing and
recovering without impairment of secondary sphere formation.

Results – Technological improvement of an invasive bladder cancer model (Chapter 6) 218
Figure 6-19: Matrigel culture of wild type urothelium, non-invasive tumour, and invasive tumour Representative bright field photos of Wild type urothelium (A), UroIICre β-catenin
exon3/exon3
HrasG12V/G12V
bladder tumour (B) and EJ138 cell line (C) after 3 days in Matrigel culture. Scale bar represents 10 µm (A-C).

Results – Technological improvement of an invasive bladder cancer model (Chapter 6) 219
6.8.2.2 Optimisation of sphere culture
Upon successful culture of UroIICre β-cateninexon3/exon3 HrasG12V/G12V tumour
spheres, where a variety of different shapes had formed after 3 days in culture
(Chapter 6.8.2.1), we sought to define the optimal growth conditions by testing
different growth factors using this cell type (Figure 6-20).
A piece of UroIICre β-cateninexon3/exon3 HrasG12V/G12V bladder tumour (n=1) was
processed into single cells, resuspended in Matrigel. In a triplicate experiment
the addition of 50 ng/ml recombinant human EGF (hEGF) in ADF media resulted
in a mild increase in the number of tumour spheres of UroIICre β-
cateninexon3/exon3 HrasG12V/G12V (B) compared to wells where no growth factors had
been added (None) (A).
Figure 6-20: Effect of EGF on UroIICre β-cateninexon3/exon3
HrasG12V/G12V
tumour sphere culture Representative bright field photos of UroIICre β-catenin
exon3/exon3 Hras
G12V/G12V sphere culture with
no addition of growth factors (A) and supplemented with hEGF (B) after 3 days in Matrigel. Scale bar represents 10 µm (A-B).

Results – Technological improvement of an invasive bladder cancer model (Chapter 6) 220
Next, we tested the effect of a number of other growth factors on sphere
formation, including mouse Sonic hedgehog (mShh), human tumour growth
factor alpha (hTGF-α), human fibroblast growth factor 16 (hFGF16), human
keratinocyte growth factor (hKGF, also known as FGF7), as well as a TNF-α
inducing salt compound, lithium chloride (LiCl) (Figure 6-21). We examined the
growth of a hyperproliferative urothelium where no tumours are expected of
mice with a heterozygous Hras mutation; UroIICre Hras+/G12V (compare H&E of
UroIICre Hras+/G12V in Chapter 4, Figure 4-7 A).
Pooled urothelium of n=9 UroIICre Hras+/G12V bladders was processed into single
cells, resuspended in Matrigel and distributed into 12 wells. Growth factor
addition was carried out in duplicate wells.
The addition of 10mM LiCl to ADF media resulted in a mild decrease in the
number of spheres (Figure 6-21 B) compared to wells where no growth factors
had been added (None) (A).
The addition of 25ng/ml of recombinant hTGF-α, or 20ng/ml of hFGF16 had no
obvious effect on the number or size of UroIICre Hras+/G12V spheres (D and E
respectively).
The addition of 50ng/ml recombinant mShh, or 20 ng/ml hKGF, also known as
FGF7, resulted in an increase in the number and size of spheres (C and F
respectively).
In summary, this result shows that the addition of 50ng/ml mShh and 20ng/ml
KGF/FGF7 to the media may enhance sphere number and size, and is therefore
likely to improve growth conditions for spheres from non-tumourous urothelial
tissue.

Results – Technological improvement of an invasive bladder cancer model (Chapter 6) 221
Figure 6-21: Effect of different growth factors on UroIICre Hras+/G12V
sphere culture Representative bright field photos of UroIICr
Hras
+/G12V sphere culture with no addition of growth
factors (A) and supplemented with 10mM LiCl (B), 50ng/ml mShh (C), 25ng/ml hTGF-α (D), 20ng/ml hFGF16 (E), 20ng/ml hKGF/FGF7 (F) after 11 days in Matrigel. Scale bar represents 10 µm (A-F).
Results – Technological improvement of an invasive bladder cancer model (Chapter 6) 222
6.8.2.3 Sphere culture of OH-BBN-induced bladder tumours
Next, we sought to examine the growth of cells derived from invasive mouse
bladder tumours in Matrigel. Invasive tumours had been established in Wild type
and Tg(UroII-hFGFR3IIIbS249C) mutant mice by OH-BBN treatment for 10+10
weeks (Chapter 5; compare H&E in Figure 5-6)
Cells from macroscopically thickened bladders of Wild type and Tg(UroII-
hFGFR3IIIbS249C) were processed into single cells, resuspended in Matrigel and
distributed into 8 wells per genotype. Matrigel with ADF media was
supplemented with 50ng/ml mShh and 20ng/ml KGF/FGF7 (Figure 6-22).
Cultures form OH-BBN-treated Wild type bladders (n=3) showed little sphere
formation after 3 days (A) and died by 14 days (C). After 3 days, spheres were as
few as 1 sphere in 8 wells, which were generated from one half of a bladder.
OH-BBN Tg(UroII-hFGFR3IIIbS249C) cultures (n=8) showed a larger number of
spheres after 3 days (B) compared to OH-BBN Wild type (A). OH-BBN Tg(UroII-
hFGFR3IIIbS249C) spheres grew up to 3-times of the initial diameter size in 11
days (day 14 in culture) (D).
OH-BBN cultures of Ptenflox/flox (n=1) and Tg(UroII-hFGFR3IIIbS249C) Ptenflox/flox
(n=1) under the same conditions failed to form spheres after 3 days and died by
22 days in culture (data not shown).

Results – Technological improvement of an invasive bladder cancer model (Chapter 6) 223
Figure 6-22: Sphere culture of OH-BBN-treated Wild type and Tg(UroII-hFGFR3IIIbS249C) after 3 and 14 days Representative bright field photos of OH-BBN-treated Wild type (A, C) and Tg(UroII-hFGFR3IIIbS249C) (B, D) sphere culture supplemented with mShh and hKGF/FGF7 after 3 days (A, B) and 14 days (C, D) in Matrigel. Scale bar represents 10 µm (A-D).
In summary, cells derived from the OH-BBN-induced invasive mouse bladder
tumours of Wild type, FGFR3 mutant, Pten deletion, or a combination thereof,
formed only very few spheres in Matrigel.
Results – Technological improvement of an invasive bladder cancer model (Chapter 6) 224
6.8.2.4 Organotypic slice culture
A major disadvantage of the Matrigel culture is the fact that urothelial cells are
disconnected from their natural environment of the surrounding stroma and the
bladder muscle. We therefore sought to develop a technique where the
urothelium or the tumour cells can be cultured with a minimum of distortion of
the natural signalling from surrounding tissue.
We aimed to establish an organotypic bladder slice culture to grow bladder
tumour explants ex vivo in order to examine the effect of inhibitor treatment in
real time. These experiments were performed in collaboration with Prof Cathy
Mendelsohn’s lab at Columbia University, New York, USA.
In a pilot experiment we cultured bladder slices of normal bladders on
membrane culture inserts soaked in basal conditional media supplemented with
recombinant rat glial cell line-derived neurotrophic factor (rGDNF), human
hepatocyte growth factor (hHGF), and human keratinocyte growth factor (hKGF,
also known as FGF7) as previously described (Batourina et al., 2012).
Bladders of established reporter lines were used, including UroIIIa-GFP-Cre-ERT2
mCherry (UroIIIa-GCE; mCherry), K5-CreERT mTomato/mGFP (K5-CreERT
mT/mG), and Shh-Cre YFP. UroIIIa-GCE; mCherry expresses an eGFP-Cre-ERT2
fusion protein under the Uroplakin IIIa (UroIIIa) promoter. mCherry is expressed
upon tamoxifen induction in this model (Gandhi et al., 2013). K5-CreERT
mTomato/mGFP expresses a Cre-ERT2 fusion protein under the Cytokeratin-5
(K5) promoter. mTomato is expressed before tamoxifen induction, mGFP is
expressed afterwards(Gandhi et al., 2013). Shh-Cre YFP expresses Cre and YFP
under the Sonic hedgehog (Shh) promoter (Gandhi et al., 2013).

Results – Technological improvement of an invasive bladder cancer model (Chapter 6) 225
Bladder explants were analysed under a fluorescent microscope, and
immunohistochemistry was subsequently performed on paraffin-embedded
sections of the explants (Figure 6-23).
Tamoxifen-induced UroIIIa-GCE; mCherry bladders (A, B) showed overall healthy
appearance until termination of the experiment at day 14 in culture.
UroplakinIIIa-expressing cells were detected by mCherry-positivity (B, arrows).
In order to see whether the cultured organotypic slices maintain the bladder
morphology, immunohistochemistry was performed on paraffin-embedded
sections of Wild type bladder explants after 8 days in culture (C). We observed
p63-positivity in basal and intermediate cells (C, red), as well as UroII-positivity
in umbrella cells of the explant (C, green). This was similar to Wild type
bladders that are processed directly from the animal (Chapter 3, compare Figure
3-7).
Tamoxifen-induced K5-CreERT mT/mG bladders (D, E, F) showed overall healthy
appearance until termination of the experiment at day 12 in culture. Keratin5-
expressing cells were detected by GFP-positivity (E, arrows, magnified in F,
arrows).
Bladder explants of Shh-Cre YFP mice were viable for 21 days in culture until
termination of the experiment (data now shown).

Results – Technological improvement of an invasive bladder cancer model (Chapter 6) 226
Figure 6-23: Organotypic slice culture of fluorescent reporter bladders Representative photos of slice culture of a tamoxifen-induced UroIIIa-GFP-Cre-ERT2 mCherry under bright field (A) and red channel (B). Immunohistochemistry for UroplakinII (green) and p63 (red) on section of paraffin-embedded organotypic bladder slice from Wild type (C). Representative photos of slice culture of a tamoxifen-induced K5-CreERT mTomato/mGFP under bright field (D) and green channel (E). GFP expression of same animal at higher magnification (white insert in E) (F). Scale bar represents 200 µm in A-B and D-E, 100 µm in F, and 50 µm in C.

Results – Technological improvement of an invasive bladder cancer model (Chapter 6) 227
6.8.2.5 Organotypic slice culture of OH-BBN-induced bladder tumours
In order to test whether the effect of therapeutic drugs can be assessed by the
organotypic slice assay, we set out to culture explants of OH-BBN-induced
tumours that we treated with the FGFR3 inhibitor R3Mab.
R3Mab is a monoclonal antibody against wild type and mutant forms of FGFR3,
which has been shown to exhibit anti-tumour activity against bladder carcinoma
and multiple myeloma xenografts in mice (Qing et al., 2009). The control
antibody is a non-functional version of the R3Mab molecule that is dissolved in
the same buffer.
We used OH-BBN-induced Tg(UroII-hFGFR3IIIbS249C) bladder tumours (n=2) and
OH-BBN-induced Wild type control bladders (n=6) to be subjected to 10nM
R3Mab or 10nM of a control antibody mixed into basal conditional media for 4
days starting from the first day of culture. Explants were paraffin-embedded and
stained by H&E to analyse a potential inhibitory effect of R3Mab on invasion.
We encountered difficulties in the interpretation of the H&E results on the
effect of R3Mab, since both OH-BBN-induced Wild type and Tg(UroII-
hFGFR3IIIbS249C) tumour slices showed signs of urothelial cell disintegration and
tumour cell disintegration in the H&E stained sections (Figure 6-24).
Regarding the orientation of the tissues, a minimal layer of coherent cells (A,
arrow) was visible and defined as the urothelium. Dotted lines represent the
invasive edge down to which urothelial cells have migrated. In panel (B), the
urothelium is most likely located above the fine dotted line with invading
tumour cells between the two dotted lines, and striated muscle below the thick
dotted line. A clear cut of striated muscle can be identified in (C, arrow). The
formation of blood vessels was visible in (D, arrow).
In OH-BBN-induced Wild type and Tg(UroII-hFGFR3IIIbS249C) bladder slices,
tumour cells were visible far beyond the urothelial lining in deep layers of the
bladder (dotted lines in A, C and B, D, respectively). No obvious difference in
the overall depth of invasion was observed comparing the two genotypes.

Results – Technological improvement of an invasive bladder cancer model (Chapter 6) 228
Comparing OH-BBN-induced Wild type tumour slices that had been treated with
Control- or R3Mab antibody, no obvious difference in the overall depth of
invasion was observed (A, C).
Similarly, in OH-BBN-induced Tg(UroII-hFGFR3IIIbS249C) tumour slices that had
been treated with Control- or R3Mab antibody, no obvious difference in the
overall depth of invasion was observed (B, D).
R3Mab treatment for 14 days resulted in further disintegration of the urothelium
within the tumour slice and greater difficulties in interpreting H&E results in
terms of an inhibitory effect on invasion (data not shown).
Figure 6-24: Organotypic slice culture of Wild type and Tg(UroII-hFGFR3IIIbS249C) tumours treated with FGFR3 inhibitor (R3Mab) Representative H&E sections of paraffin-embedded organotypic bladder slices from OH-BBN-induced Wild type (A, C) and Tg(UroII-hFGFR3IIIbS249C) (B, D) tumours that were treated with control antibody (A, B) or R3Mab antibody (C, D). Scale bar represents 200 µm (A-D).
Results – Technological improvement of an invasive bladder cancer model (Chapter 6) 229
6.9 Discussion
In this chapter we examined the effectiveness of AdenoCre to generate
urothelial tumours with different combinations of genetic mutations. We
replaced UroIICre-driven recombination by AdenoCre delivery. Furthermore, we
tested fluorescent imaging and ultrasound imaging in the mouse bladder in order
to detect and monitor tumour development and progression in living animals.
Moreover, we tested in vitro systems such as an organotypic collagen-I assay, 3D
sphere culture, and an organotypic slice culture to assess cell migration and the
effect of therapeutic drugs ex vivo.
6.9.1 Recombination
In order to assess the recombination efficiency at a cellular level, we performed
lacZ staining as well as immunohistochemistry for GFP, RFP and β-catenin
(Figure 6-2). We showed that GFP immunohistochemistry can be used to detect
infected cells; however the staining is not sufficient to specify recombination.
RFP and lacZ detection was discontinued due to unspecific staining. In this
study, AdenoCre recombination was most effectively detected by β-catenin
staining in the presence of a β-cateninexon3/exon3 activating mutation. The exact
percentage of successfully recombined cells could not be determined in our
experiments. It has been shown that viral transduction efficiency can be
influenced by the pH, as well as by addition of calcium phosphate (Jackson,
2001), which poses a chance to optimise recombination rates for future
experiments.
Some studies have shown that urothelial stem cells, or at least a subgroup
thereof, may reside in the basal cell compartment (Kurzrock et al., 2008, Gaisa
et al., 2011, Shin et al., 2011, Chan et al., 2009b, Gandhi et al., 2013). From
this study it appears that the incidence of stem cell recombination upon
adenovirus infection may be very low. However, it unknown at this point
whether more than one type of urothelial progenitors exists, and whether
urothelial stem cells are the cancer initiating cells in the bladder.
AdenoCre penetration has previously been assessed in human ureters (Chester et
al., 2003). In the study, intact normal human ureters were transduced ex vivo
Results – Technological improvement of an invasive bladder cancer model (Chapter 6) 230
with Adv-cmv-β-gal viral solution and stained for β-galactosidase activity.
Immersion with Adv-cmv-β-gal resulted in transduction of the most superficial
layers of the urothelium only, with no obvious time dependence of viral
exposure. Taken into account that those experiments were performed on human
ureters, the results could indicate that deeper layers may not be transduced
using adenoviral Cre infection in mice. However, in contrast to the human
urothelium which consists of seven layers on average, the mouse urothelium is
composed of only three layers, which could help the virus to penetrate deeper
layers. In the first publication using AdenoCre in the mouse bladder, it was
described that the entire urothelium can be targeted with 10% recombination
efficiency using a titre of 1x10⁹ pfu (Puzio-Kuter et al., 2009). Our results did
not recapitulate these data. In our hands, AdenoCre recombination was mainly
observed in umbrella and intermediate cells, consistent with previous
suggestions in human ureters (Chester et al., 2003).
Comparing the recombination efficiency of AdenoCre and UroIICre, it is evident
that UroIICre promotes recombination in the majority of cells in the urothelium
(Figure 3-2) whereas AdenoCre mediates recombination only in a small number
of cells (Figure 6-2). UroIICre recombination was predominantly observed in
umbrella and intermediate cells, whereas basal cells showed fewer cells with
GFP-positivity (Figure 3-2). AdenoCre recombination was mainly observed in
umbrella and intermediate cells (Figure 6-2). Therefore, the basal cell
compartment may not have been effectively targeted yet in our models. It would
be interesting to utilise a Cre promoter that drives the expression of the
recombinase in the basal cell layer given that the cancer cell of origin may
reside therein. A study on urothelial regeneration has utilised a tamoxifen-
inducible Sonic hedgehog-Cre (ShhCreER), where recombination in the basal cell
compartment of the urothelium was reported (Shin et al., 2011). ShhCreER has
not yet been tested in controlling the expression of bladder-specific mutations.
Furthermore to the comparison of AdenoCre and UroIICre recombination, both
systems promoted the growth of exophytic papillary tumours in β-catenin and
Hras mutated bladders (Chapter 6.4 and (Ahmad et al., 2011b). However,
AdenoCre-driven tumours seemed to be smaller in size compared to UroIICre β-
cateninexon3/exon3 HrasQ61L bladders upon dissection at 8 months. This may indicate
that the fewer number of recombined cells by AdenoCre results in fewer

Results – Technological improvement of an invasive bladder cancer model (Chapter 6) 231
tumours or a smaller tumour mass combined. By defining a suitable and potent
combination of genetic mutations, this may pose an opportunity to potentially
study metastatic progression before the urothelial tumour reaches a lethal size.
6.9.2 In vivo imaging
In order to monitor tumour progression in living animals, we tested fluorescent
imaging and ultrasound imaging in the mouse bladder (Table 6-7).
Table 6-7: Summary of in vivo imaging techniques tested in the study
Monitoring of AdenoCre –induced tumours in vivo was assessed by IVIS Spectrum
(Figure 6-1). We were confronted with high background signal from the guts and
urine, which made assessment difficult at both RFP and GFP wavelengths. It may
be possible to reduce the background signal from the guts by feeding an alfalfa-
free diet, which may help to obtain a clearer RFP signal from the bladder (Inoue
et al., 2008). Furthermore, it is possible that collective RFP emission from a
tumour cell mass may result in a stronger signal. However, bladder tumours with
an RFP reporter construct were not available at the time of experiments.
Moreover, it is possible that the expression level of the RFP reporter is
particularly low in the bladder and that changing to a different reporter system
such as an mTomato or mCherry line could be an alternative to potentially
enhance the signal from the bladder (Muzumdar et al., 2007),
(http://www.gudmap.org).
Using ultrasound imaging we were able to monitor tumour progression in vivo
(Figure 6-3). Bladder wall thickening, as well as tumours as small as 0.5 mm in
diameter, can be detected and the growth can be monitored. This is consistent
Results – Technological improvement of an invasive bladder cancer model (Chapter 6) 232
with a previous study where tumours as small as 0.53 mm3 were detected using
this method (Patel et al., 2010). However, it is as yet unclear whether invasion
can be addressed by this method. Ultrasound imaging could further be improved
by targeted contrast enhancement (Chan et al., 2011).
6.9.3 AdenoCre
We have confirmed that orthotopic AdenoCre injection mediates recombination
in the bladder, leading to tumours with different combinations of genetic
mutations. The combination of β-catenin and Hras mutation caused exophytic
papillary tumours in the urothelium as early as 3.5 months post injection in β-
cateninexon3/exon3 HrasG12V/G12V. AdenoCre-driven tumours seemed to be smaller in
size, compared to UroIICre β-cateninexon3/exon3 HrasQ61L bladders, upon dissection
at 8 months (Ahmad et al., 2011b). This may reflect the smaller number of cells
that was likely to be recombined by AdenoCre compared to broad recombination
in umbrella and intermediate cells using UroIICre. Bladder tumours had formed
only in 7 of 9 animals (78%). Whether these tumours will develop muscle-invasive
potential or metastatic disease has to be tested in future experiments.
Hras activation in combination with Pten deletion did not produce tumours or
any cellular abnormalities by 8 months in HrasG12V/G12V Ptenflox/flox, indicating that
AdenoCre-induced Pten deletion on its own or in combination with Hras is
insufficient to induce urothelial tumourigenesis. This is in accordance with the
findings in Chapter 3, where a mouse model of co-activated MAPK/AKT signalling
through FGFR3 in combination with Pten deletion (UroIICre Fgfr3+/K644E
Ptenflox/flox) presented a hypertrophic urothelium but did not result in carcinoma
development (Chapter 3). As speculated before, this may be due to redundant
pathway activation (Jebar et al., 2005). Mutual exclusivity of Pten and Ras
pathways has also been demonstrated in skin papilloma formation (Mao et al.,
2004). Alternatively, it is possible that the AdenoCre induction was incomplete.
p53 and Pten deletion in combination, p53flox/flox Ptenflox/flox, caused tumours in
the bladder as reported before (Puzio-Kuter et al., 2009). However, in the study
by Puzio-Kuter it was not fully clarified whether these tumours were of
epithelial- or muscle origin. Based on our immunohistochemistry and histological
observations, we and other groups (Yang et al., 2013) define these tumours as of

Results – Technological improvement of an invasive bladder cancer model (Chapter 6) 233
non-urothelial origin. Due to AdenoCre recombination in the muscle upon needle
insertion, these tumours seem to have originated in the striated muscle or other
soft tissue surrounding the injection site. Our tumours were negative for
urothelial markers such as CK5 and p63, which is in accordance with the work
done by Yang, where pan-cytokeratin was used to demonstrate non-urothelial
origin. Furthermore, our tumours resemble the appearance of the sarcomas in
the p53flox/flox Kras+/LSLG12D mouse model generated by Kirsch that were also
positive for smooth muscle actin (SMA) (Kirsch et al., 2007). In contrast to Puzio-
Kuter, we did not observe metastasis in the p53flox/flox Ptenflox/flox model.
p53 dominant-negative mutation and Pten deletion in combination, p53R172H/R172H
Ptenflox/flox , caused tumours in the bladder muscle that were similar to the ones
observed in p53 and Pten deficient mice; however the tumour onset was 1
month earlier, indicating that a homozygous dominant-negative p53 mutation
may promote faster tumour growth than homozygous p53 deletion.
An issue of AdenoCre infection was the frequent observation of non-urothelial
tumours. Depending on the type of mutations that were introduced, we observed
sarcoma formation in the bladder muscle, tumours in other areas of the pelvic
region, as well as tumours in distant organs. For example, AdenoCre-injected
p53R172H/R172H Ptenflox/flox mice developed lymphoma, lung tumours, and soft
tissue tumours in the pelvis. In our hands all p53flox/flox Ptenflox/flox mice (n=5)
developed soft tissue sarcomas in the bladder muscle, which was not reported in
the original study where the AdenoCre-mediated p53 Pten mouse model was first
described (Puzio-Kuter et al., 2009). However, pelvic soft tissue tumours with
similar histology have been observed in p53flox/flox Kras+/LSLG12D bladders after
8.46x10⁸ pfu AdenoCre treatment using catheterisation and urethral suture (Yang
et al., 2013). Similar to our sarcomas in p53flox/flox Ptenflox/flox, Yang also
observed invasion of these tumours into adipose tissue and striated muscle
layers at 4-8 weeks post AdenoCre exposure. Our β-cateninexon3/exon3 HrasG12V/G12V
mice developed tumours in the liver and pancreas, as well as keratin-rich
squamous cell carcinomas in the pelvic region. Based on histological observations
and immunohistochemistry these distant growths were primary tumours (Figure
6-9). Furthermore, transformed cells were particularly present nearby blood
vessels (Figure 6-10), suggesting presence of the adenovirus in the blood stream,
which has led to recombination in distant sites outside of the bladder.
Results – Technological improvement of an invasive bladder cancer model (Chapter 6) 234
Mouse sarcomas induced by AdenoCre were originally described in p53flox/flox
Kras+/LSLG12D mice (Kirsch et al., 2007). Soft tissue sarcomas in our cohorts
generally developed in the pelvic region around the area of injection. We
speculate that the exposed muscle tissue around the entry site of the needle is
infected by AdenoCre and undergoes recombination. The issue with sarcoma
formation is that these growths occur before the development of urothelial
tumours, which may be due to the different proliferation rates of the two
tissues. To overcome soft tissue sarcoma development, the technique of virus
delivery needs to be improved. However, both methods, orthotopic instillation
(this study, (Puzio-Kuter et al., 2009)) and catheterisation (Yang et al., 2013),
have led to the formation of sarcomas. It would be possible to surgically remove
pelvic sarcomas in order to allow more time for urothelial pathogenesis to occur.
However, non-urothelial tumours such as in the liver, lung or pancreas were not
easy to detect at an early stage and most likely difficult to remove without
risking the wellbeing of the animal. Another possible modification of the
technique could be the use Matrigel to solidify the virus solution in order to
reduce virus influx into the blood stream. It could also be considered to pre-
treat the urothelium with chemical agents in order to increase the transduction
efficiency.
The virus titre is a parameter that needs to be chosen carefully in order to allow
sufficient but specific recombination in the urothelium. The bladder lining is
equipped with an effective defence barrier, the urothelial plaques made of a
thick polyglucan layer and crystallised Uroplakin particles, which reduce the
absorption of toxic substances that are present in the urine. We speculated that
this natural barrier may also hamper the viral infection process, and that a high
virus titre would be beneficial to maximise transduction. Furthermore, in case of
a not completely voided bladder, the dilution of urine may pose a second hurdle
to the amount of virus needed. Therefore, it needs to be ensured that the
bladder has been sufficiently voided of urine before virus injection. The virus
titre can also be adjusted according to the nature of the targeted mutations. For
example, if a model of metastasis is desired, it may be beneficial to select
“strong” tumourigenesis-inducing mutations in combination with a low virus
titre. This would ensure recombination in only a small number of cells and
therefore allow more time for metastasis to occur.

Results – Technological improvement of an invasive bladder cancer model (Chapter 6) 235
When AdenoCre was introduced for the first time as a driver of recombination in
p53flox/flox Ptenflox/flox mice, a titre of 1x10⁹ pfu was used (Puzio-Kuter et al.,
2009). This resulted in a recombination efficiency of 10% of successfully
transduced urothelial cells (Puzio-Kuter et al., 2009). In a different study with
p53flox/flox Kras+/LSLG12D mutant mice, a titre of 8.5x10⁸ pfu was administered by
catheterisation (Yang et al., 2013). This method resulted in higher
recombination efficiency, however, the procedure is more time consuming and
only female mice could be used for catheter instillation. Furthermore, this
method has been shown to also result in soft tissue sarcomas (Yang et al., 2013)
and would therefore not pose an advantage to our current surgical method of
AdenoCre delivery. In our study, we used twice the amount of virus (2x10⁹ pfu)
as Puzio-Kuter to induce tumourigenesis in the same p53flox/flox Ptenflox/flox mouse
model (Figure 6-5). Our p53flox/flox Ptenflox/flox mice developed tumours by 3
months post injection, while Puzio-Kuter reported tumours by 6 months post
injection. However, our p53flox/flox Ptenflox/flox tumours arose in the muscle where
recombination had taken place. It is possible that a lower AdenoCre titre may
result in a higher rate of urothelial tumours rather than sarcomas as reported by
Puzio-Kuter (Puzio-Kuter et al., 2009).
As an alternative to AdenoCre-mediated recombination we tested LentiCre-
mediated Cre delivery in a still ongoing experiment. As a consequence of virus
integration into the genome, the possibility of insertional mutagenesis cannot be
excluded. LentiCre is currently not commercially available at the same high titre
as AdenoCre.
Overall, AdenoCre has the advantage of recombining a small number of cells that
are surrounded by a normal tissue environment, which would allow examination
of signalling interaction between tumour and host tissue. In this matter,
AdenoCre represents an interesting tool for modelling bladder cancer. The
technique could also allow lineage tracing of cancer stem cells in a developing
bladder tumour. However, at this point AdenoCre also comes with the
disadvantage of frequent non-urothelial tumour formation in adjacent soft tissue
or distant organs which precede the emergence of urothelial tumours and
remains to be addressed in future experiments.
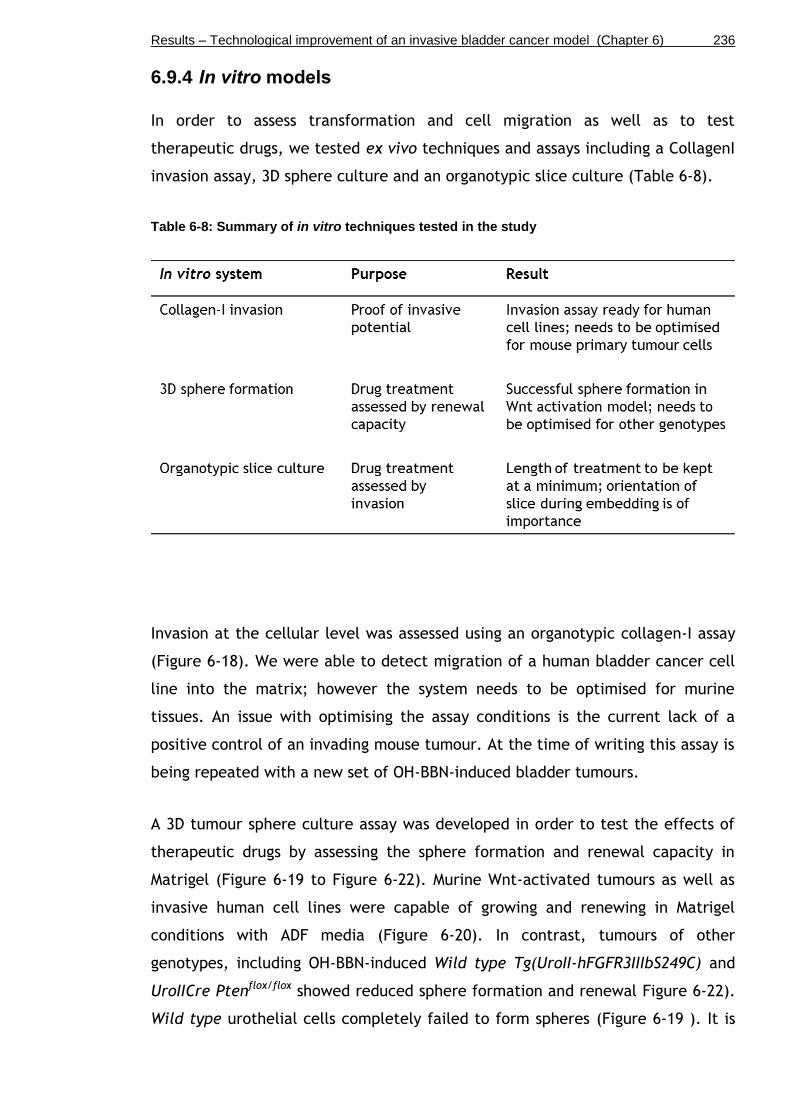
Results – Technological improvement of an invasive bladder cancer model (Chapter 6) 236
6.9.4 In vitro models
In order to assess transformation and cell migration as well as to test
therapeutic drugs, we tested ex vivo techniques and assays including a CollagenI
invasion assay, 3D sphere culture and an organotypic slice culture (Table 6-8).
Table 6-8: Summary of in vitro techniques tested in the study
Invasion at the cellular level was assessed using an organotypic collagen-I assay
(Figure 6-18). We were able to detect migration of a human bladder cancer cell
line into the matrix; however the system needs to be optimised for murine
tissues. An issue with optimising the assay conditions is the current lack of a
positive control of an invading mouse tumour. At the time of writing this assay is
being repeated with a new set of OH-BBN-induced bladder tumours.
A 3D tumour sphere culture assay was developed in order to test the effects of
therapeutic drugs by assessing the sphere formation and renewal capacity in
Matrigel (Figure 6-19 to Figure 6-22). Murine Wnt-activated tumours as well as
invasive human cell lines were capable of growing and renewing in Matrigel
conditions with ADF media (Figure 6-20). In contrast, tumours of other
genotypes, including OH-BBN-induced Wild type Tg(UroII-hFGFR3IIIbS249C) and
UroIICre Ptenflox/flox showed reduced sphere formation and renewal Figure 6-22).
Wild type urothelial cells completely failed to form spheres (Figure 6-19 ). It is

Results – Technological improvement of an invasive bladder cancer model (Chapter 6) 237
possible that adult Wild type urothelial cells do not have sufficient renewal
capacity to form spheres. On the other hand, these cells may need special media
conditions and a particular supply of growth factors, which was not further
tested. In future experiments the diameters of spheres could be considered to
be measured by ImageJ software. However, the number of urothelial cells from
normal bladders was generally low, and therefore cells from multiple bladders
had to be pooled in order to reach sufficient material to be plated. Therapeutic
drugs were not tested in this assay due to the low rate of tumour sphere
formation. Although the 3D sphere culture assay has successfully been used for
drug screening in tumour spheres derived from other tissues such as the breast
(Kim and Alexander, 2013), it may not be suitable for application in the bladder.
Organotypic slice culture was developed in order to test the effects of
therapeutic drugs on invasion under natural conditions of a generally intact
organ environment (Figure 6-23). In this slice culture system, normal bladder
explants were viable for up to 21 days. However, slices of tumours quickly
showed signs of urothelial cell and tumour cell disintegration, which made the
interpretation of the results on the effect of R3Mab difficult (Figure 6-24). The
orientation of the tumour slice in paraffin and properly cut sections are of great
importance in order to analyse the depth of tumour cell invasion or impairment
thereof. At the time of writing, this FGFR3 inhibition assay is being repeated in a
new set of OH-BBN-induced Fgfr3-mutant bladder tumours.
6.9.5 Future work
For in vivo imaging it would be interesting to assess tumour growth or drug
response in a three dimensional (3D) space. Therefore, it would be essential to
work out volume measurements in the ultrasound software.
Regarding viral Cre injections, we are awaiting the results of the LentiCre
experiment (Chapter 6.7), which will shed light on the effectiveness of LentiCre
as an alternative to AdenoCre. Recombination efficiency and tumour
development can be assessed in direct comparison with the AdenoCre-injected
β-cateninexon3/exon3 HrasG12V/G12V mice. Furthermore, AdenoCre could also be a
useful tool for lineage tracing of cancer stem cells in a developing bladder
tumour and potentially during metastatic spread.

Results – Technological improvement of an invasive bladder cancer model (Chapter 6) 238
For the in vitro assays, it would be essential to optimise the collagen-I assay
using a positive control of invasive mouse tumour cells, as well as to optimise
the organotypic slice culture conditions to impede the disintegration of the
tissue in the culture in order to test therapeutic drugs.
6.9.6 Conclusion
We have validated the effectiveness of AdenoCre to generate urothelial tumours
in mice with β-cateninexon3/exon3 HrasG12V/G12V mutation and used ultrasound to
monitor the growing tumours in vivo. Furthermore, we tested in vitro systems
such as an organotypic collagen-I assay, 3D sphere culture, and an organotypic
slice culture, which may become useful applications to assess cell migration and
the effect of therapeutic drugs ex vivo.

Final Discussion (Chapter 7) 239
Chapter 7
Final Discussion

Final Discussion (Chapter 7) 240
7.1 Summary of the findings
The overall aim of this study was to examine the role of FGFR3 mutation in
bladder cancer initiation and progression by using mice as a model organism.
Firstly, we demonstrated that Fgfr3 and Pten mutations cooperatively promote
morphological changes of the urothelium, but not when mutated individually
(Chapter 3). Our results provided functional evidence that supports the
hypothesis that upregulation of FGFR3 signalling plays a causative role in
urothelial pathogenesis of non-invasive bladder cancer together with
upregulated PI3K-AKT signalling. However, mice still did not develop urothelial
cell carcinoma.
Therefore, we searched for cooperating mutations of urothelial tumourigenesis
in mice with FGFR3, PTEN or RAS mutation using Sleeping Beauty (SB) insertional
mutagenesis (Chapter 4). The SB system failed to produce bladder tumours in
Fgfr3 as well as in Hras mutant mice and may therefore constitute an inefficient
tool in the bladder to induce urothelial tumourigenesis. Furthermore, it is
possible that other more realistic mutations are required to drive cancer in the
bladder. In mice with Pten deletion, one tumour was generated and general
hypertrophy with cellular abnormalities was observed in all samples. No direct
association between Fgfr3 and Pten mutations was found; however, SB
mutagenesis supported that Fgfr3 and Pten cooperation may merge at the
signalling downstream.
Thirdly, we compared two point mutations, S249C and K644E, in FGFR3 and
Fgfr3 respectively in the otherwise normal urothelium in vivo, and demonstrated
that an FGFR3 S249C mutation alone does not lead to tumourigenesis, similar to
Fgfr3 K644E mutation alone (Chapter 5). Differential effects between K644E and
S249C on the cellular architecture were only apparent in combination with
another mutation such as Pten deletion. Furthermore, we compared S249C and
K644E, as well as the effect of Pten deletion and Fgfr3-Pten double mutation in
OH-BBN-induced tumours (Chapter 5). Our results indicated that Fgfr3 mutation
may have an effect on tumour progression of established neoplasms.
Final Discussion (Chapter 7) 241
Lastly, we validated the effectiveness of AdenoCre to generate urothelial
tumours in mice with β-cateninexon3/exon3 HrasG12V/G12V mutation and used
ultrasound imaging to detect and monitor tumour development and progression
in vivo (Chapter 6). Moreover, we tested in vitro systems such as an organotypic
collagen-I assay, 3D sphere culture, and an organotypic slice culture, which may
become useful applications to assess cell migration and the effect of therapeutic
drugs ex vivo.
Taken together, our data supported previous evidence of functional involvement
of FGFR3 in the development and progression of urothelial cell carcinoma.
Furthermore, technological improvement of our in vivo and in vitro models may
create useful tools to generate and assess invasive bladder cancer, and to
perform preclinical drug testing.
7.2 Contribution of FGFR3 to tumour initiation, progression and invasion
Regarding tumour initiation, FGFR3 seems unlikely to be the sole driver of
bladder tumourigenesis. This is in accordance with the current understanding of
cancer biology where multiple ‘hits’ to DNA are required for a tumour to arise.
Interestingly, in vitro, a single FGFR3 mutation is able to induce morphological
transformation, cell proliferation, and anchorage independent growth (di
Martino et al., 2009). However, in mice we showed that a single mutation in the
kinase domain of the receptor, K644E, was insufficient to promote cancer
formation (Ahmad et al., 2011c). Similarly, a mutation in the linker region of the
Ig-like domains in FGFR3, S249C, on its own did not lead to tumour initiation in
the mouse bladder (Chapter 5). These results strongly suggest that FGFR3 needs
a cooperating mutation to induce urothelial tumourigenesis.
It has been suggested that FGFR3 mutation is an early event during bladder
cancer development (Knowles, 2007, Zieger et al., 2005, Bakkar et al., 2003)
due to the fact that FGFR3 is found mutated in 60-80% of non-invasive bladder
cancers including papilloma, PUNLMP, and low- and high-grade papillary
carcinoma (Billerey et al., 2001, Cappellen et al., 1999, Tomlinson et al., 2007a,
van Rhijn et al., 2012, van Rhijn et al., 2002). The urothelia of our mouse
models with Fgfr3 mutation and activated PI3K/AKT signalling showed
Final Discussion (Chapter 7) 242
histological features comparable with hyperplasia and dysplasia, which are
regarded as early stages bladder cancer pathogenesis in humans (Chapter 3). The
model supports that these early-stage lesions with FGFR3 mutation are unlikely
to progress, as they did not produce tumours in the life time of the animal
models up to 18 months (Chapter 3).
In terms of tumour progression of established neoplasms, we showed in vivo that
FGFR3 S249C mutation can have an effect on cancer progression and invasion
upon carcinogen-induced tumourigenesis (Chapter 5). Similar observations were
made with a kinase domain mutation, Fgfr3 K644E, supporting the tumour-
promoting properties of activated FGFR3 signalling (Chapter 5). Previous studies
have linked FGFR3 mutation to the development of early papillary lesions;
however, the progression of advanced bladder cancer seemed to be unaffected
by the presence of FGFR3 mutations (Zieger et al., 2005). It would therefore be
interesting to sequence our OH-BBN-induced tumours with FGFR3- or Fgfr3-
mutant status in order to obtain information on potential cancer initiating
mutations or cooperating mutations.
Mechanistically, the role of FGFR3 in bladder cancer is still being debated. It was
proposed that FGFR3 can promote cellular proliferation and provide a growth
advantage while apoptotic mechanisms and genomic stability are still
maintained (Bakkar et al., 2003). This was supported in cell culture studies,
where increased FGFR signalling provided a proliferation and survival advantage
to urothelial cells (di Martino et al., 2009). FGFR3 may also bypass the cell cycle
checkpoint at G1, which could promote the development of benign precursor
lesions that may be able to progress due to accumulated replicative stress
(Bartkova et al., 2005, Zieger et al., 2005). Our results potentially support the
concept of FGFR3 in promoting cellular proliferation and/or providing a growth
advantage to urothelial cells, since FGFR3-mutant bladders were linked to a
significantly higher incidence of tumours compared to Wild type upon carcinogen
treatment (Chapter 5). To further elucidate the mechanism behind FGFR3-
dependent progression in OH-BBN-induced tumours, it would be essential to
analyse alterations in the pathways downstream of FGFR3 S249C mutant
signalling. It would also be interesting to investigate further to our experiments
on γH2aX phosphorylation in FGFR3-S249C and Wild type bladders (Chapter 5),
whether the presence of an FGFR3 mutation can alter the sensitivity to DNA
Final Discussion (Chapter 7) 243
damage or the DNA repair machinery in FGFR3-mutant cells in a larger number
of samples.
7.3 Tumour progression across pathogenesis pathways
The current model of two independent pathogenesis pathways of urothelial cell
carcinoma has been suggested based on histological and genomic analysis of non-
invasive and invasive tumours (Knowles, 2008, Lindgren et al., 2012). A question
of immense clinical relevance remains: that is whether these pathways can
overlap, or whether tumours can stage progress across these pathways to adopt
a more aggressive phenotype and growth behaviour.
Indication of potential overlap of the tumourigenesis pathways comes from a
study in mice where SV40T was overexpressed under the UroII promoter (Cheng
et al., 2003). Cheng reported that the majority of mice developed CIS that
evolved into high-grade, superficial papillary tumours before a small fraction of
them advanced to invasive and metastatic cancer. This suggests that a fraction
of CIS may constitute precursors of high-grade, papillary tumours with increased
risk of progressing to invasive and metastatic disease. This could also fit with the
study by Choi, where muscle-invasive bladder cancer was suggested to be
subcategorised into basal-, luminal-, and p53-like tumours based on their
immunohistochemical expression pattern (Choi et al., 2014). In this model,
luminal-like tumours were enriched with FGFR3 mutations amongst others, and
could therefore potentially represent a subset of muscle-invasive tumours that
have derived from non-invasive papillary tumours where FGFR3 mutations are
frequent (van Rhijn et al., 2012, Billerey et al., 2001, Hernandez et al., 2006).
FGFR3 has been associated with non-invasive low grade/stage pTa tumours.
However, in muscle-invasive bladder tumours, FGFR3 is mutated in only 10-15%
of the cases (Billerey et al., 2001). This could indicate that non-invasive lesions
with FGFR3 mutation never progress to invasive tumours, and that invasive
lesions arise predominantly from wild type FGFR3 cells (Tomlinson et al.,
2007a). It is possible that a subset of FGFR3-mutated invasive lesions may
acquire FGFR3 mutation later during stage progression (Choi et al., 2014, Sjodahl
et al., 2012). However, it is also possible that the mutant FGFR3 allele is lost
during potential stage progression from non-invasive to invasive tumours.

Final Discussion (Chapter 7) 244
Studies showed that non-invasive papillary carcinomas can indeed progress to a
higher grade (Zieger et al., 2000, Herr, 2000, Cheng et al., 1999, Leblanc et al.,
1999). It was also demonstrated that human FGFR3-mutant tumours can progress
and acquire a CIS gene signature following the muscle-invasive pathway (Zieger
et al., 2005). However, the presence of FGFR3 mutation did not seem to be
directly involved in the cancer progression (Zieger et al., 2005). This observation
could potentially be explained under the hypothesis that the tumours were part
of the 10-15% muscle-invasive tumour subset that carries FGFR3 mutation
(Billerey et al., 2001).
Our data indicates that FGFR3 mutation can be functionally involved in
urothelial changes that may represent early changes in human urothelial
papilloma (Chapter 3) as well as in cancer progression of OH-BBN-induced
tumours (Chapter 5). Whether superficial papillary tumours with FGFR3 mutation
can progress towards the muscle-invasive pathogenesis pathway where the
receptor mutation then promotes tumour progression and invasion requires
further experiments.
7.4 Cooperating mutations
Mutations that cooperate with activated FGFR3 in the formation and progression
of urothelial cell carcinoma have not fully been discovered.
Our previous data suggested that one of the potential candidates of FGFR3-
cooperating mutations could be a component of the PI3K/AKT pathway (Ahmad
et al., 2011c). Moreover, we have shown in mice that AKT pathway activation
though Pten deletion together with FGFR3 activation induced global hypertrophy
with several cellular characteristics indicative of abnormal differentiation,
which was overall similar to the early histopathological changes seen in human
urothelial papilloma (Chapter 3 and 4). The morphological changes were likely to
be caused cooperatively by Fgfr3 and Pten. Potential cooperation of the
PI3K/AKT and the FGFR signalling pathways is supported by the fact that FGFR3
and PIK3CA mutations often co-occur in human bladder tumours across all stages
and grades (Lopez-Knowles et al., 2006, Kompier et al., 2010, Duenas et al.,
2013). However, the PI3K/AKT pathway may not be the only signalling pathway
that is potentially able to cooperate with FGFR3 activation.

Final Discussion (Chapter 7) 245
FGFR3-cooperating mutations within the RAS/MAPK pathway were not identified
in our models. Mice that carried heterozygous Fgfr3 and Hras mutation in
combination showed no urothelial abnormalities at 12 months apart from
occasionally mild hyperplasia (Chapter 4). Although RAS/MAPK signalling cannot
be fully excluded as a potential functional cooperator, co-occurrence of FGFR3
and RAS mutations in human bladder tumours have been shown to be rare
events, possibly due to redundancy of pathway activation (Kompier et al., 2010,
Jebar et al., 2005, Juanpere et al., 2012, Ahmad et al., 2011c).
7.5 Current models of bladder cancer
Mice have been shown to resemble human urothelial cell carcinoma better than
any other available laboratory animal by sharing many histological features with
human bladder cancer, and by recapitulating tumour development in well-
defined stages (Chan et al., 2009a). Recently, we presented for the first time a
mouse model with Fgfr3 mutation in the bladder (Ahmad et al., 2011c). Here we
present a mouse model where the bladder of Fgfr3 Pten double mutant mice
showed histological features that may be comparable with those of early
urothelial papilloma in humans (Chapter 3). Furthermore, our results suggested
that FGFR3 activation can have an effect on progression in an invasive model of
carcinogen-induced bladder cancer (Chapter 5), in which the effect of signalling
inhibitors could be tested in vivo in future experiments. The use of a recently
published AdenoCre technique to allow tissue-specific recombination in a small
number of cells in order to generate tumours of the bladder has been evaluated
in this study. The technique requires technological improvement but could
potentially help to refine existing mouse models of bladder cancer, and could
also allow lineage tracing of cancer stem cells in a developing urothelial tumour.
Our results emphasise the importance of in vivo tumour models in cancer
research to investigate the mechanisms of cancer development and progression.
However, the bladder also poses a challenge as a target organ of cancer research
in mice, since it is slowly proliferative (Stewart et al., 1980), which makes it a
slow system to model tumour development. Therefore, it may be crucial to
introduce mutations that promote proliferation in order to drive bladder
tumourigenesis. Depending on the promoter that is used, this may promote
earlier tumour formation in other organs that proliferate more quickly than the
bladder as we have shown before (Ahmad et al., 2011c). Furthermore, stem cells
Final Discussion (Chapter 7) 246
of the bladder have not been clearly identified, which may create ambiguity of
which promoters are the most suitable ones to induce mutations in the putative
stem cells of the mouse urothelium.
With the objective to assess tumour behaviour such as proliferation, renewal,
invasion, as well as to test the effect of therapeutic drugs on cancer cells, the
necessity of in vitro assays becomes evident. Our in vitro assays, including
sphere formation, Collagen-I invasion, and organotypic slice culture are
currently under development (Chapter 6). The assays can potentially be valuable
in order to test therapeutic drugs as well as to study the characteristics of
cancer cells ex vivo. Similar organotypic cell culture systems that serve as
experimental intermediates towards living organisms have been tested with
tumour cells derived from other organs, such as from pancreas, skin, intestine
and breast (Kim and Alexander, 2013, Timpson et al., 2011, Sato et al., 2009).
Cultures of cells derived from the normal urothelium or from bladder tumours
have also been described previously (Chen et al., 2012, Shin et al., 2011,
Batourina et al., 2012). However, these culturing systems appear to be more
difficult compared to cultures of other organs, since they require FACS-based
cell sorting of the urothelium, complex growth conditions specific to the nature
of cell type, as well as a large number of urothelial cells with sufficient
proliferative potential.
7.6 FGFR3 as a biomarker in bladder cancer
Biomarkers in cancer research are defined by the National Cancer Research
Institute (NCI) as “A biological molecule found in blood, other body fluids, or
tissues that is a sign of a normal or abnormal process, or of a condition or
disease. A biomarker may be used to see how well the body responds to a
treatment for a disease or condition." (NCI Dictionary of Cancer Terms, National
Cancer Institute, 2014).
Biomarkers can be categorised as (1) diagnostic, (2) prognostic or (3) predictive.
Diagnostic biomarkers help to identify the current condition, such as early- or
late-stage disease. Prognostic biomarkers help to forecast whether the cancer is
likely to progress or whether it is stable in the absence of treatment. Predictive
biomarkers help to predict how well a patient will respond to treatment.
Final Discussion (Chapter 7) 247
Since recurrence is a major issue of bladder cancer management, there is great
interest in developing urine-based tests to reduce the necessity of expensive
cystoscopic surveillance. FGFR3 has been examined as a diagnostic biomarker in
urine (van Rhijn et al., 2003); however, due to lack of sensitivity and/or
specificity, the tests are still not standard use in the clinic.
To date there are no validated prognostic molecular biomarkers available in
bladder cancer (di Martino et al., 2012). However, several studies have
examined the prognostic value of FGFR3 in terms of recurrence, progression and
survival of bladder cancer patients. FGFR3 mutation is generally associated with
favourable disease characteristics as it is linked to low grade/stage pTa tumours
(van Rhijn et al., 2012, Billerey et al., 2001, Hernandez et al., 2006), whereas
p53 expression is generally associated with higher stage and grade and worse
clinical outcome (Schmitz-Drager et al., 2000, Malats et al., 2005).
We have demonstrated that FGFR3 mutation alone is unlikely to drive
tumourigenesis in the bladder (Ahmad et al., 2011, and Chapter 5 in this study).
However, we showed that FGFR3 activation can play a causative role in
urothelial pathogenesis of non-invasive bladder cancer in cooperation with
upregulated PI3K-AKT signalling in mice (Chapter 3). Since the animal model did
not produce tumours in the life time up to 18 months, we concluded that these
early-stage lesions with FGFR3 mutation are unlikely to progress. This is in
accordance with a rather good prognosis that is generally associated with the
presence of FGFR3 mutation in urothelial tumours (van Rhijn et al., 2012). In
contrast, our model of invasive bladder cancer induced by carcinogen treatment
suggests that presence of FGFR3 mutation may constitute a rather bad prognosis,
since FGFR3-mutant mice showed a 4.4-fold higher incidence of invasive bladder
tumours than carcinogen-treated Wild type mice (Chapter 5). These results
suggest context-dependence in terms of FGFR3 mutation as a biomarker of
progression. In order to clinically translate these observations to predict patient
prognosis, further experiments would be essential to clearly define the effects
of activated FGFR3 signalling in bladder cancer.
The prognostic value of FGFR3 as a biomarker of recurrence, which is generally
associated with non-invasive low-grade Ta tumours, is still a matter of debate
(Knowles, 2008). Some studies reported association of FGFR3 mutation in non-
Final Discussion (Chapter 7) 248
invasive tumours with low risk of recurrence (van Rhijn et al., 2001). Other
groups have confirmed association of FGFR3 mutation with non-invasive papillary
tumours of low grade, however, with a higher risk of recurrence (Hernandez et
al., 2006). Conversely, non-invasive papillary tumours of high grade were not
associated with recurrence or progression in patients (Hernandez et al., 2006,
Hernandez et al., 2005). Other studies have found no association between FGFR3
mutational status and recurrence, progression or muscle invasion (Ploussard et
al., 2011).
In conclusion, further research is required in order validate FGFR3 mutation as a
prognostic biomarker in urothelial cell carcinoma. Since the effect of activated
FGFR3 signalling may be context-dependent, the prognosis of patients with
FGFR3-mutated tumours should be assessed with caution.
7.7 FGFR3-targeted therapy
The wide availability of inhibitors specific to FGF signalling may provide an
opportunity for FGFR3-targeted translation using our in vivo models with FGFR3
mutation for preclinical experiments. We have shown that FGFR3 mutation can
play a functional role in bladder cancer, which suggests the possibility of FGFR3
inhibition as a therapeutic strategy.
FGFR3-inhibiting drugs have been suggested as a therapeutic option in urothelial
cell carcinoma (Lamont et al., 2011, Tomlinson et al., 2007b, Network, 2014).
Several novel drugs against FGFRs including R3Mab, NVP-BGJ398, and AZD4547
have been shown to be effective in cell lines and xenograft models (Qing et al.,
2009, Guagnano et al., 2011, Gavine et al., 2012). All of the named drugs are
currently being used in clinical trials (Brooks et al., 2012, Liang et al., 2013).
Our UroIICre Fgfr3+/K644E Ptenflox/flox mouse model indicated potential cooperation
of the PI3K/AKT and the FGFR signalling pathways. Analysis of human bladder
tumours supports that mutations in FGFR3 and PI3K/AKT pathway genes are co-
associated (Lopez-Knowles et al., 2006, Kompier et al., 2010, Duenas et al.,
2013), which represents a therapeutic opportunity for combinatorial inhibitors.
Combinatorial targeting is a valid approach for cancers with multiple activated
signalling pathways, and has been shown to be successful in models of breast
Final Discussion (Chapter 7) 249
cancer, where FGFR and PI3K/mTOR signalling were targeted in combination
(Issa et al., 2013). In order to generate an in vivo model for combinatorial drug
testing, our FGFR3-mutant mice can be crossed to any available mouse model
carrying candidate mutations that cooperate with FGFR3 in tumourigenesis.
Interestingly, two studies have reported tumour suppressive properties of
FGFR3. In one, FGFR3 protein expression was downregulated in colorectal cancer
(Sonvilla et al., 2010). In a second study, FGFR3 overexpression had tumour
suppressive effects on pancreatic cancer (PDAC) cell lines (Lafitte et al., 2013).
Although yet unclear, it is possible that FGFR3 can either promote or suppress
tumour development or progression in a context-dependent manner. Therefore
FGFR3-targeted therapy needs to be considered individually with caution.
Altogether, for a translational benefit, further studies of the FGFR3 signalling
pathway and its inhibitors are essential and will aid the development of
therapies for both non muscle-invasive and muscle-invasive bladder cancer with
deregulation of FGF signalling.
7.8 Future direction
Resistance to therapy is a major challenge of cancer treatment (Bambury and
Rosenberg, 2013). Often patients first respond to a given drug and subsequently
relapse. This is mostly due to the emergence of cellular mechanisms in the
tumour to escape the effects of the drug, such as the generation of efflux
pumps, alteration of the DNA repair machinery and modulation of apoptosis and
survival pathways (Drayton and Catto, 2012, Herrera-Abreu et al., 2013, Chell et
al., 2013). It would therefore be essential to elucidate resistance mechanisms in
detail, and to test drug combinations that collectively target pathways that are
used as escape routes. To this matter, it would also be vitally important to
identify cooperating mutations in bladder cancer, to understand which pathways
are co-activated and to identify drug targets within these pathways.
Comprehensive knowledge of the molecular mechanisms underlying bladder
cancer development and progression would also facilitate the identification of
patients who are most likely to respond to treatment.
Final Discussion (Chapter 7) 250
FGFR3 mutation or overexpression in the context of dissemination and
metastasis formation is largely unknown. However, FGF signalling has been
implicated in the regulation of EMT (Cheng et al., 2013, Tomlinson et al., 2012),
a process that is strongly associated with invasion and formation of distant
metastasis (Thiery, 2002). Our data suggests that FGFR3 can have an effect on
tumour progression of existing neoplasms. It would therefore be interesting to
investigate further whether FGFR3 can also play a role in the metastatic process
in late-stage disease. Two recent publications reported upregulated FGFR3
expression in bladder cancer metastases (Guancial et al., 2014b, Turo et al.,
2014).
The tumour microenvironment has been implicated to play a role in cancer
progression, metastasis and drug resistance (Sung et al., 2007). The stroma, as
part of the microenvironment, secretes a variety of cytokines such as FGF
ligands and interleukins that stimulate proliferation (Tlsty and Coussens, 2006,
Cheng et al., 2013). Furthermore, it can host inflammatory processes that may
influence tumour proliferation (Tlsty and Coussens, 2006). It would therefore be
important to examine the role of the stroma in urothelial cell carcinoma and its
potential contribution to the development or progression of bladder tumours.
7.9 Significance
Bladder cancer is a major health issue worldwide that causes considerable
morbidity and mortality due to ineffective or insufficient therapeutic strategies.
This study focused on the role of FGFR3 signalling in cancer initiation, invasion
and progression with the objective to generate models that can answer
questions of basic science as well as to aid preclinical drug testing.
From the basic science question our data supported previous evidence of a
functional role of FGFR3 in initiating changes towards superficial urothelial
carcinoma. Our data also suggested a potential role of FGFR3 in progression of
established neoplasms in mice. We showed that FGFR3 activation plays a
causative role in urothelial pathogenesis of non-invasive bladder cancer in
cooperation with Pten loss in vivo. Furthermore, we present indication of
functional involvement of FGFR3 S249C mutation in progression and invasion of
carcinogen-induced tumours.

Final Discussion (Chapter 7) 251
Our findings may also be of clinical relevance. It has previously been believed
that the presence of an FGFR3 mutation is a favourable prognostic factor since it
is associated with superficial papillary tumours with low potential to progress.
However, our data suggested that FGFR3 mutation in an established tumour can
act as a tumour promoter with worse prognosis than FGFR3 wild type.
FGFR3 may therefore constitute a promising drug target. Given the wide
availability of inhibitors specific to FGF signalling, our FGFR3 mouse models
together with technological improvement of our in vitro assays may provide a
platform for FGFR3-targeted translation in urothelial disease.

References 252
References
ADAR, R., MONSONEGO-ORNAN, E., DAVID, P. & YAYON, A. 2002. Differential
activation of cysteine-substitution mutants of fibroblast growth factor receptor 3 is determined by cysteine localization. J Bone Miner Res, 17, 860-8.
AHMAD, I., BARNETSON, R. J. & KRISHNA, N. S. 2008. Keratinizing squamous metaplasia of the bladder: a review. Urol Int, 81, 247-51.
AHMAD, I., IWATA, T. & LEUNG, H. Y. 2012a. Mechanisms of FGFR-mediated carcinogenesis. Biochim Biophys Acta, 1823, 850-60.
AHMAD, I., MORTON, J. P., SINGH, L. B., RADULESCU, S. M., RIDGWAY, R. A., PATEL, S., WOODGETT, J., WINTON, D. J., TAKETO, M. M., WU, X. R., LEUNG, H. Y. & SANSOM, O. J. 2011a. beta-Catenin activation synergizes with PTEN loss to cause bladder cancer formation. Oncogene, 30, 178-89.
AHMAD, I., PATEL, R., LIU, Y., SINGH, L. B., TAKETO, M. M., WU, X. R., LEUNG, H. Y. & SANSOM, O. J. 2011b. Ras mutation cooperates with beta-catenin activation to drive bladder tumourigenesis. Cell Death Dis, 2, e124.
AHMAD, I., SANSOM, O. J. & LEUNG, H. Y. 2012b. Exploring molecular genetics of bladder cancer: lessons learned from mouse models. Dis Model Mech, 5, 323-32.
AHMAD, I., SINGH, L. B., FOTH, M., MORRIS, C. A., TAKETO, M. M., WU, X. R., LEUNG, H. Y., SANSOM, O. J. & IWATA, T. 2011c. K-Ras and {beta}-catenin mutations cooperate with Fgfr3 mutations in mice to promote tumorigenesis in the skin and lung, but not in the bladder. Dis Model Mech, 4, 548-55.
AL HUSSAIN, T. O. & AKHTAR, M. 2013. Molecular basis of urinary bladder cancer. Adv Anat Pathol, 20, 53-60.
ALI, S. H. & DECAPRIO, J. A. 2001. Cellular transformation by SV40 large T antigen: interaction with host proteins. Semin Cancer Biol, 11, 15-23.
ALLENSPACH, E. J., MAILLARD, I., ASTER, J. C. & PEAR, W. S. 2002. Notch signaling in cancer. Cancer Biol Ther, 1, 466-76.
ALTSCHUL, S. F., GISH, W., MILLER, W., MYERS, E. W. & LIPMAN, D. J. 1990. Basic local alignment search tool. J Mol Biol, 215, 403-10.
AMANN, T., BATAILLE, F., SPRUSS, T., DETTMER, K., WILD, P., LIEDTKE, C., MUHLBAUER, M., KIEFER, P., OEFNER, P. J., TRAUTWEIN, C., BOSSERHOFF, A. K. & HELLERBRAND, C. 2010. Reduced expression of fibroblast growth factor receptor 2IIIb in hepatocellular carcinoma induces a more aggressive growth. Am J Pathol, 176, 1433-42.
ANDERSON, R. D., HASKELL, R. E., XIA, H., ROESSLER, B. J. & DAVIDSON, B. L. 2000. A simple method for the rapid generation of recombinant adenovirus vectors. Gene Ther, 7, 1034-8.
ANTON, M. & GRAHAM, F. L. 1995. Site-specific recombination mediated by an adenovirus vector expressing the Cre recombinase protein: a molecular switch for control of gene expression. J Virol, 69, 4600-6.
ASKHAM, J. M., PLATT, F., CHAMBERS, P. A., SNOWDEN, H., TAYLOR, C. F. & KNOWLES, M. A. 2010. AKT1 mutations in bladder cancer: identification of a novel oncogenic mutation that can co-operate with E17K. Oncogene, 29, 150-5.
AVEYARD, J. S., SKILLETER, A., HABUCHI, T. & KNOWLES, M. A. 1999. Somatic mutation of PTEN in bladder carcinoma. Br J Cancer, 80, 904-8.
References 253
AYALA DE LA PENA, F., KANASAKI, K., KANASAKI, M., TANGIRALA, N., MAEDA, G. & KALLURI, R. 2011. Loss of p53 and acquisition of angiogenic microRNA profile are insufficient to facilitate progression of bladder urothelial carcinoma in situ to invasive carcinoma. J Biol Chem, 286, 20778-87.
BABJUK, M., OOSTERLINCK, W., SYLVESTER, R., KAASINEN, E., BOHLE, A. & PALOU-REDORTA, J. 2008. EAU guidelines on non-muscle-invasive urothelial carcinoma of the bladder. Eur Urol, 54, 303-14.
BAKKAR, A. A., WALLERAND, H., RADVANYI, F., LAHAYE, J. B., PISSARD, S., LECERF, L., KOUYOUMDJIAN, J. C., ABBOU, C. C., PAIRON, J. C., JAURAND, M. C., THIERY, J. P., CHOPIN, D. K. & DE MEDINA, S. G. 2003. FGFR3 and TP53 gene mutations define two distinct pathways in urothelial cell carcinoma of the bladder. Cancer Res, 63, 8108-12.
BAMBURY, R. M. & ROSENBERG, J. E. 2013. Advanced Urothelial Carcinoma: Overcoming Treatment Resistance through Novel Treatment Approaches. Front Pharmacol, 4, 3.
BARKER, N., VAN ES, J. H., KUIPERS, J., KUJALA, P., VAN DEN BORN, M., COZIJNSEN, M., HAEGEBARTH, A., KORVING, J., BEGTHEL, H., PETERS, P. J. & CLEVERS, H. 2007. Identification of stem cells in small intestine and colon by marker gene Lgr5. Nature, 449, 1003-1007.
BARTKOVA, J., HOREJSI, Z., KOED, K., KRAMER, A., TORT, F., ZIEGER, K., GULDBERG, P., SEHESTED, M., NESLAND, J. M., LUKAS, C., ORNTOFT, T., LUKAS, J. & BARTEK, J. 2005. DNA damage response as a candidate anti-cancer barrier in early human tumorigenesis. Nature, 434, 864-70.
BATOURINA, E., GANDHI, D., MENDELSOHN, C. L. & MOLOTKOV, A. 2012. Organotypic culture of the urogenital tract. Methods Mol Biol, 886, 45-53.
BECCI, P. J., THOMPSON, H. J., STRUM, J. M., BROWN, C. C., SPORN, M. B. & MOON, R. C. 1981. N-butyl-N-(4-hydroxybutyl)nitrosamine-induced urinary bladder cancer in C57BL/6 X DBA/2 F1 mice as a useful model for study of chemoprevention of cancer with retinoids. Cancer Res, 41, 927-32.
BERNARD-PIERROT, I., BRAMS, A., DUNOIS-LARDE, C., CAILLAULT, A., DIEZ DE MEDINA, S. G., CAPPELLEN, D., GRAFF, G., THIERY, J. P., CHOPIN, D., RICOL, D. & RADVANYI, F. 2006. Oncogenic properties of the mutated forms of fibroblast growth factor receptor 3b. Carcinogenesis, 27, 740-7.
BERX, G. & VAN ROY, F. 2009. Involvement of members of the cadherin superfamily in cancer. Cold Spring Harb Perspect Biol, 1, a003129.
BILLEREY, C., CHOPIN, D., AUBRIOT-LORTON, M. H., RICOL, D., GIL DIEZ DE MEDINA, S., VAN RHIJN, B., BRALET, M. P., LEFRERE-BELDA, M. A., LAHAYE, J. B., ABBOU, C. C., BONAVENTURE, J., ZAFRANI, E. S., VAN DER KWAST, T., THIERY, J. P. & RADVANYI, F. 2001. Frequent FGFR3 mutations in papillary non-invasive bladder (pTa) tumors. Am J Pathol, 158, 1955-9.
BILLOTTET, C., TUEFFERD, M., GENTIEN, D., RAPINAT, A., THIERY, J. P., BROET, P. & JOUANNEAU, J. 2008. Modulation of several waves of gene expression during FGF-1 induced epithelial-mesenchymal transition of carcinoma cells. J Cell Biochem, 104, 826-39.
BLAVERI, E., BREWER, J. L., ROYDASGUPTA, R., FRIDLYAND, J., DEVRIES, S., KOPPIE, T., PEJAVAR, S., MEHTA, K., CARROLL, P., SIMKO, J. P. & WALDMAN, F. M. 2005. Bladder cancer stage and outcome by array-based comparative genomic hybridization. Clin Cancer Res, 11, 7012-22.
BOHM, M., KIRCH, H., OTTO, T., RUBBEN, H. & WIELAND, I. 1997. Deletion analysis at the DEL-27, APC and MTS1 loci in bladder cancer: LOH at the DEL-27 locus on 5p13-12 is a prognostic marker of tumor progression. Int J Cancer, 74, 291-5.

References 254
BOLDRUP, L., COATES, P. J., GU, X. & NYLANDER, K. 2007. DeltaNp63 isoforms regulate CD44 and keratins 4, 6, 14 and 19 in squamous cell carcinoma of head and neck. J Pathol, 213, 384-91.
BOTTCHER, R. T. 2005. Fibroblast Growth Factor Signaling during Early Vertebrate Development. Endocrine Reviews, 26, 63-77.
BRENNAN, P., BOGILLOT, O., CORDIER, S., GREISER, E., SCHILL, W., VINEIS, P., LOPEZ-ABENTE, G., TZONOU, A., CHANG-CLAUDE, J., BOLM-AUDORFF, U., JOCKEL, K. H., DONATO, F., SERRA, C., WAHRENDORF, J., HOURS, M., T'MANNETJE, A., KOGEVINAS, M. & BOFFETTA, P. 2000. Cigarette smoking and bladder cancer in men: a pooled analysis of 11 case-control studies. Int J Cancer, 86, 289-94.
BRODY, S. L. & CRYSTAL, R. G. 1994. Adenovirus-mediated in vivo gene transfer. Ann N Y Acad Sci, 716, 90-101; discussion 101-3.
BROOKS, A. N., KILGOUR, E. & SMITH, P. D. 2012. Molecular pathways: fibroblast growth factor signaling: a new therapeutic opportunity in cancer. Clin Cancer Res, 18, 1855-62.
BROWN, B., LINDBERG, K., REING, J., STOLZ, D. B. & BADYLAK, S. F. 2006. The basement membrane component of biologic scaffolds derived from extracellular matrix. Tissue Eng, 12, 519-26.
BURGER, M., CATTO, J. W., DALBAGNI, G., GROSSMAN, H. B., HERR, H., KARAKIEWICZ, P., KASSOUF, W., KIEMENEY, L. A., LA VECCHIA, C., SHARIAT, S. & LOTAN, Y. 2013. Epidemiology and risk factors of urothelial bladder cancer. Eur Urol, 63, 234-41.
CADINANOS, J. & BRADLEY, A. 2007. Generation of an inducible and optimized piggyBac transposon system. Nucleic Acids Res, 35, e87.
CAIRNS, P., EVRON, E., OKAMI, K., HALACHMI, N., ESTELLER, M., HERMAN, J. G., BOSE, S., WANG, S. I., PARSONS, R. & SIDRANSKY, D. 1998. Point mutation and homozygous deletion of PTEN/MMAC1 in primary bladder cancers. Oncogene, 16, 3215-8.
CAIRNS, P., PROCTOR, A. J. & KNOWLES, M. A. 1991. Loss of heterozygosity at the RB locus is frequent and correlates with muscle invasion in bladder carcinoma. Oncogene, 6, 2305-9.
CAIRNS, P., SHAW, M. E. & KNOWLES, M. A. 1993. Initiation of bladder cancer may involve deletion of a tumour-suppressor gene on chromosome 9. Oncogene, 8, 1083-5.
CAIRNS, P., TOKINO, K., EBY, Y. & SIDRANSKY, D. 1994. Homozygous deletions of 9p21 in primary human bladder tumors detected by comparative multiplex polymerase chain reaction. Cancer Res, 54, 1422-4.
CAMPBELL, S. L., KHOSRAVI-FAR, R., ROSSMAN, K. L., CLARK, G. J. & DER, C. J. 1998. Increasing complexity of Ras signaling. Oncogene, 17, 1395-413.
CAPECCHI, M. R. 1994. Targeted gene replacement. Sci Am, 270, 52-9. CAPPELLEN, D., DE OLIVEIRA, C., RICOL, D., DE MEDINA, S., BOURDIN, J.,
SASTRE-GARAU, X., CHOPIN, D., THIERY, J. P. & RADVANYI, F. 1999. Frequent activating mutations of FGFR3 in human bladder and cervix carcinomas. Nat Genet, 23, 18-20.
CAPPELLEN, D., GIL DIEZ DE MEDINA, S., CHOPIN, D., THIERY, J. P. & RADVANYI, F. 1997. Frequent loss of heterozygosity on chromosome 10q in muscle-invasive transitional cell carcinomas of the bladder. Oncogene, 14, 3059-66.
CARLSON, C. M., DUPUY, A. J., FRITZ, S., ROBERG-PEREZ, K. J., FLETCHER, C. F. & LARGAESPADA, D. A. 2003. Transposon mutagenesis of the mouse germline. Genetics, 165, 243-56.

References 255
CASTILLO-MARTIN, M., DOMINGO-DOMENECH, J., KARNI-SCHMIDT, O., MATOS, T. & CORDON-CARDO, C. 2010. Molecular pathways of urothelial development and bladder tumorigenesis. Urologic Oncology: Seminars and Original Investigations, 28, 401-408.
CATTO, J. W. F., MIAH, S., OWEN, H. C., BRYANT, H., MYERS, K., DUDZIEC, E., LARRE, S., MILO, M., REHMAN, I., ROSARIO, D. J., DI MARTINO, E., KNOWLES, M. A., MEUTH, M., HARRIS, A. L. & HAMDY, F. C. 2009. Distinct MicroRNA Alterations Characterize High- and Low-Grade Bladder Cancer. Cancer Research, 69, 8472-8481.
CHAFFER, C. L., BRENNAN, J. P., SLAVIN, J. L., BLICK, T., THOMPSON, E. W. & WILLIAMS, E. D. 2006. Mesenchymal-to-epithelial transition facilitates bladder cancer metastasis: role of fibroblast growth factor receptor-2. Cancer Res, 66, 11271-8.
CHAN, E., PATEL, A., HESTON, W. & LARCHIAN, W. 2009a. Mouse orthotopic models for bladder cancer research. BJU International, 104, 1286-1291.
CHAN, E. S., PATEL, A. R., LARCHIAN, W. A. & HESTON, W. D. 2011. In vivo targeted contrast enhanced micro-ultrasound to measure intratumor perfusion and vascular endothelial growth factor receptor 2 expression in a mouse orthotopic bladder cancer model. J Urol, 185, 2359-65.
CHAN, H. M., NARITA, M., LOWE, S. W. & LIVINGSTON, D. M. 2005. The p400 E1A-associated protein is a novel component of the p53 --> p21 senescence pathway. Genes Dev, 19, 196-201.
CHAN, K. S., ESPINOSA, I., CHAO, M., WONG, D., AILLES, L., DIEHN, M., GILL, H., PRESTI, J., CHANG, H. Y., VAN DE RIJN, M., SHORTLIFFE, L. & WEISSMAN, I. L. 2009b. Identification, molecular characterization, clinical prognosis, and therapeutic targeting of human bladder tumor-initiating cells. Proceedings of the National Academy of Sciences, 106, 14016-14021.
CHATTERJEE, S. J., GEORGE, B., GOEBELL, P. J., ALAVI-TAFRESHI, M., SHI, S. R., FUNG, Y. K., JONES, P. A., CORDON-CARDO, C., DATAR, R. H. & COTE, R. J. 2004. Hyperphosphorylation of pRb: a mechanism for RB tumour suppressor pathway inactivation in bladder cancer. J Pathol, 203, 762-70.
CHELL, V., BALMANNO, K., LITTLE, A. S., WILSON, M., ANDREWS, S., BLOCKLEY, L., HAMPSON, M., GAVINE, P. R. & COOK, S. J. 2013. Tumour cell responses to new fibroblast growth factor receptor tyrosine kinase inhibitors and identification of a gatekeeper mutation in FGFR3 as a mechanism of acquired resistance. Oncogene, 32, 3059-70.
CHELLAIAH, A. T., MCEWEN, D. G., WERNER, S., XU, J. & ORNITZ, D. M. 1994. Fibroblast growth factor receptor (FGFR) 3. Alternative splicing in immunoglobulin-like domain III creates a receptor highly specific for acidic FGF/FGF-1. J Biol Chem, 269, 11620-7.
CHEN, Z., DING, W., XU, K., TAN, J., SUN, C., GOU, Y., TONG, S., XIA, G., FANG, Z. & DING, Q. 2012. The 1973 WHO Classification is more suitable than the 2004 WHO Classification for predicting prognosis in non-muscle-invasive bladder cancer. PLoS One, 7, e47199.
CHENG, J., HUANG, H., PAK, J., SHAPIRO, E., SUN, T. T., CORDON-CARDO, C., WALDMAN, F. M. & WU, X. R. 2003. Allelic loss of p53 gene is associated with genesis and maintenance, but not invasion, of mouse carcinoma in situ of the bladder. Cancer Res, 63, 179-85.
CHENG, J., HUANG, H., ZHANG, Z. T., SHAPIRO, E., PELLICER, A., SUN, T. T. & WU, X. R. 2002. Overexpression of epidermal growth factor receptor in urothelium elicits urothelial hyperplasia and promotes bladder tumor growth. Cancer Res, 62, 4157-63.
References 256
CHENG, L., NEUMANN, R. M., WEAVER, A. L., SPOTTS, B. E. & BOSTWICK, D. G. 1999. Predicting cancer progression in patients with stage T1 bladder carcinoma. J Clin Oncol, 17, 3182-7.
CHENG, T., ROTH, B., CHOI, W., BLACK, P. C., DINNEY, C. & MCCONKEY, D. J. 2013. Fibroblast growth factor receptors-1 and -3 play distinct roles in the regulation of bladder cancer growth and metastasis: implications for therapeutic targeting. PLoS One, 8, e57284.
CHESI, M. 2001. Activated fibroblast growth factor receptor 3 is an oncogene that contributes to tumor progression in multiple myeloma. Blood, 97, 729-736.
CHESTER, J. D., KENNEDY, W., HALL, G. D., SELBY, P. J. & KNOWLES, M. A. 2003. Adenovirus-mediated gene therapy for bladder cancer: efficient gene delivery to normal and malignant human urothelial cells in vitro and ex vivo. Gene Ther, 10, 172-9.
CHEUNG, W. L., ALBADINE, R., CHAN, T., SHARMA, R. & NETTO, G. J. 2009. Phosphorylated H2AX in noninvasive low grade urothelial carcinoma of the bladder: correlation with tumor recurrence. J Urol, 181, 1387-92.
CHO, J. Y., GUO, C., TORELLO, M., LUNSTRUM, G. P., IWATA, T., DENG, C. & HORTON, W. A. 2004. Defective lysosomal targeting of activated fibroblast growth factor receptor 3 in achondroplasia. Proc Natl Acad Sci U S A, 101, 609-14.
CHOI, S. H., BYUN, Y. & LEE, G. 2009. Expressions of uroplakins in the mouse urinary bladder with cyclophosphamide-induced cystitis. J Korean Med Sci, 24, 684-9.
CHOI, W., PORTEN, S., KIM, S., WILLIS, D., PLIMACK, E. R., HOFFMAN-CENSITS, J., ROTH, B., CHENG, T., TRAN, M., LEE, I. L., MELQUIST, J., BONDARUK, J., MAJEWSKI, T., ZHANG, S., PRETZSCH, S., BAGGERLY, K., SIEFKER-RADTKE, A., CZERNIAK, B., DINNEY, C. P. & MCCONKEY, D. J. 2014. Identification of distinct Basal and luminal subtypes of muscle-invasive bladder cancer with different sensitivities to frontline chemotherapy. Cancer Cell, 25, 152-65.
CHOI, W., SHAH, J. B., TRAN, M., SVATEK, R., MARQUIS, L., LEE, I. L., YU, D., ADAM, L., WEN, S., SHEN, Y., DINNEY, C., MCCONKEY, D. J. & SIEFKER-RADTKE, A. 2012. p63 expression defines a lethal subset of muscle-invasive bladder cancers. PLoS One, 7, e30206.
CLASSON, M. & HARLOW, E. 2002. The retinoblastoma tumour suppressor in development and cancer. Nat Rev Cancer, 2, 910-7.
COHEN, S. M., WITTENBERG, J. F. & BRYAN, G. T. 1976. Effect of avitaminosis A and hypervitaminosis A on urinary bladder carcinogenicity of N-(4-(5-Nitro-2-furyl)-2-thiazolyl)formamide. Cancer Res, 36, 2334-9.
COLLIER, L. S., CARLSON, C. M., RAVIMOHAN, S., DUPUY, A. J. & LARGAESPADA, D. A. 2005. Cancer gene discovery in solid tumours using transposon-based somatic mutagenesis in the mouse. Nature, 436, 272-6.
COLQUHOUN, A. J. & MELLON, J. K. 2002. Epidermal growth factor receptor and bladder cancer. Postgrad Med J, 78, 584-9.
COLVIN, J. S., BOHNE, B. A., HARDING, G. W., MCEWEN, D. G. & ORNITZ, D. M. 1996. Skeletal overgrowth and deafness in mice lacking fibroblast growth factor receptor 3. Nat Genet, 12, 390-7.
COPELAND, N. G. & JENKINS, N. A. 2010. Harnessing transposons for cancer gene discovery. Nature Reviews Cancer, 10, 696-706.
CUNNINGHAM, D. L., SWEET, S. M., COOPER, H. J. & HEATH, J. K. 2010. Differential phosphoproteomics of fibroblast growth factor signaling:
References 257
identification of Src family kinase-mediated phosphorylation events. J Proteome Res, 9, 2317-28.
CZERNIAK, B., COHEN, G. L., ETKIND, P., DEITCH, D., SIMMONS, H., HERZ, F. & KOSS, L. G. 1992. Concurrent mutations of coding and regulatory sequences of the Ha-ras gene in urinary bladder carcinomas. Hum Pathol, 23, 1199-204.
D'AVIS, P. Y., ROBERTSON, S. C., MEYER, A. N., BARDWELL, W. M., WEBSTER, M. K. & DONOGHUE, D. J. 1998. Constitutive activation of fibroblast growth factor receptor 3 by mutations responsible for the lethal skeletal dysplasia thanatophoric dysplasia type I. Cell Growth Differ, 9, 71-8.
DAHIA, P. L. 2000. PTEN, a unique tumor suppressor gene. Endocr Relat Cancer, 7, 115-29.
DAVIDSON, B. L., ALLEN, E. D., KOZARSKY, K. F., WILSON, J. M. & ROESSLER, B. J. 1993. A model system for in vivo gene transfer into the central nervous system using an adenoviral vector. Nat Genet, 3, 219-23.
DAVIDSON, D., BLANC, A., FILION, D., WANG, H., PLUT, P., PFEFFER, G., BUSCHMANN, M. D. & HENDERSON, J. E. 2005. Fibroblast growth factor (FGF) 18 signals through FGF receptor 3 to promote chondrogenesis. J Biol Chem, 280, 20509-15.
DENG, C., WYNSHAW-BORIS, A., ZHOU, F., KUO, A. & LEDER, P. 1996. Fibroblast growth factor receptor 3 is a negative regulator of bone growth. Cell, 84, 911-21.
DENZINGER, S., MOHREN, K., KNUECHEL, R., WILD, P. J., BURGER, M., WIELAND, W. F., HARTMANN, A. & STOEHR, R. 2006. Improved clonality analysis of multifocal bladder tumors by combination of histopathologic organ mapping, loss of heterozygosity, fluorescence in situ hybridization, and p53 analyses. Hum Pathol, 37, 143-51.
DI COMO, C. J., URIST, M. J., BABAYAN, I., DROBNJAK, M., HEDVAT, C. V., TERUYA-FELDSTEIN, J., POHAR, K., HOOS, A. & CORDON-CARDO, C. 2002. p63 expression profiles in human normal and tumor tissues. Clin Cancer Res, 8, 494-501.
DI MARTINO, E., L'HOTE, C. G., KENNEDY, W., TOMLINSON, D. C. & KNOWLES, M. A. 2009. Mutant fibroblast growth factor receptor 3 induces intracellular signaling and cellular transformation in a cell type- and mutation-specific manner. Oncogene, 28, 4306-16.
DI MARTINO, E., TOMLINSON, D. C. & KNOWLES, M. A. 2012. A Decade of FGF Receptor Research in Bladder Cancer: Past, Present, and Future Challenges. Adv Urol, 2012, 429213.
DIEZ DE MEDINA, S. G., CHOPIN, D., EL MARJOU, A., DELOUVEE, A., LAROCHELLE, W. J., HOZNEK, A., ABBOU, C., AARONSON, S. A., THIERY, J. P. & RADVANYI, F. 1997. Decreased expression of keratinocyte growth factor receptor in a subset of human transitional cell bladder carcinomas. Oncogene, 14, 323-30.
DING, S., WU, X., LI, G., HAN, M., ZHUANG, Y. & XU, T. 2005. Efficient Transposition of the piggyBac (PB) Transposon in Mammalian Cells and Mice. Cell, 122, 473-483.
DRAYTON, R. M. & CATTO, J. W. 2012. Molecular mechanisms of cisplatin resistance in bladder cancer. Expert Rev Anticancer Ther, 12, 271-81.
DUENAS, M., MARTINEZ-FERNANDEZ, M., GARCIA-ESCUDERO, R., VILLACAMPA, F., MARQUES, M., SAIZ-LADERA, C., DUARTE, J., MARTINEZ, V., GOMEZ, M. J., MARTIN, M. L., FERNANDEZ, M., CASTELLANO, D., REAL, F. X., RODRIGUEZ-PERALTO, J. L., DE LA ROSA, F. & PARAMIO, J. M. 2013.
References 258
PIK3CA gene alterations in bladder cancer are frequent and associate with reduced recurrence in non-muscle invasive tumors. Mol Carcinog.
DUNOIS-LARDE, C., LEVREL, O., BRAMS, A., THIERY, J. P. & RADVANYI, F. 2005. Absence of FGFR3 mutations in urinary bladder tumours of rats and mice treated with N-butyl-N-(-4-hydroxybutyl)nitrosamine. Mol Carcinog, 42, 142-9.
DUPUY, A. J., AKAGI, K., LARGAESPADA, D. A., COPELAND, N. G. & JENKINS, N. A. 2005. Mammalian mutagenesis using a highly mobile somatic Sleeping Beauty transposon system. Nature, 436, 221-226.
DUPUY, A. J., FRITZ, S. & LARGAESPADA, D. A. 2001. Transposition and gene disruption in the male germline of the mouse. Genesis, 30, 82-8.
DUPUY, A. J., ROGERS, L. M., KIM, J., NANNAPANENI, K., STARR, T. K., LIU, P., LARGAESPADA, D. A., SCHEETZ, T. E., JENKINS, N. A. & COPELAND, N. G. 2009. A modified sleeping beauty transposon system that can be used to model a wide variety of human cancers in mice. Cancer Res, 69, 8150-6.
DUTT, A., RAMOS, A. H., HAMMERMAN, P. S., MERMEL, C., CHO, J., SHARIFNIA, T., CHANDE, A., TANAKA, K. E., STRANSKY, N., GREULICH, H., GRAY, N. S. & MEYERSON, M. 2011. Inhibitor-sensitive FGFR1 amplification in human non-small cell lung cancer. PLoS One, 6, e20351.
EL-DEIRY, W. S., TOKINO, T., VELCULESCU, V. E., LEVY, D. B., PARSONS, R., TRENT, J. M., LIN, D., MERCER, W. E., KINZLER, K. W. & VOGELSTEIN, B. 1993. WAF1, a potential mediator of p53 tumor suppression. Cell, 75, 817-25.
EL-MARJOU, A., DELOUVEE, A., THIERY, J. P. & RADVANYI, F. 2000. Involvement of epidermal growth factor receptor in chemically induced mouse bladder tumour progression. Carcinogenesis, 21, 2211-8.
ERTURK, E., COHEN, S. M. & BRYAN, G. T. 1970. Induction, histogenesis, and isotransplanta bility of renal tumors induced by formic acid 2-[4-(5-nitro-2-furyl)-2-triazolyl]-hydrazide in rats. Cancer Res, 30, 2098-106.
ESRIG, D., ELMAJIAN, D., GROSHEN, S., FREEMAN, J. A., STEIN, J. P., CHEN, S. C., NICHOLS, P. W., SKINNER, D. G., JONES, P. A. & COTE, R. J. 1994. Accumulation of nuclear p53 and tumor progression in bladder cancer. N Engl J Med, 331, 1259-64.
FITZGERALD, J. M., RAMCHURREN, N., RIEGER, K., LEVESQUE, P., SILVERMAN, M., LIBERTINO, J. A. & SUMMERHAYES, I. C. 1995. Identification of H-ras mutations in urine sediments complements cytology in the detection of bladder tumors. J Natl Cancer Inst, 87, 129-33.
FODDE, R. & BRABLETZ, T. 2007. Wnt/beta-catenin signaling in cancer stemness and malignant behavior. Curr Opin Cell Biol, 19, 150-8.
FREIER, K., SCHWAENEN, C., STICHT, C., FLECHTENMACHER, C., MUHLING, J., HOFELE, C., RADLWIMMER, B., LICHTER, P. & JOOS, S. 2007. Recurrent FGFR1 amplification and high FGFR1 protein expression in oral squamous cell carcinoma (OSCC). Oral Oncol, 43, 60-6.
FRESE, K. K. & TUVESON, D. A. 2007. Maximizing mouse cancer models. Nat Rev Cancer, 7, 645-58.
FRESNO VARA, J. A., CASADO, E., DE CASTRO, J., CEJAS, P., BELDA-INIESTA, C. & GONZALEZ-BARON, M. 2004. PI3K/Akt signalling pathway and cancer. Cancer Treat Rev, 30, 193-204.
FRIEDRICH, M. G., BLIND, C., MILDE-LANGOSCH, K., ERBERSDOBLER, A., CONRAD, S., LONING, T., HAMMERER, P. & HULAND, H. 2001. Frequent p16/MTS1 inactivation in early stages of urothelial carcinoma of the bladder is not associated with tumor recurrence. Eur Urol, 40, 518-24.

References 259
FUKUSHIMA, S., HIROSE, M., TSUDA, H., SHIRAI, T. & HIRAO, K. 1976. Histological classification of urinary bladder cancers in rats induced by N-butyl-n-(4-hydroxybutyl)nitrosamine. Gann, 67, 81-90.
GABRIEL, U., BOLENZ, C. & MICHEL, M. S. 2007. Experimental models for therapeutic studies of transitional cell carcinoma. Anticancer Res, 27, 3163-71.
GAISA, N. T., GRAHAM, T. A., MCDONALD, S. A., CANADILLAS-LOPEZ, S., POULSOM, R., HEIDENREICH, A., JAKSE, G., TADROUS, P. J., KNUECHEL, R. & WRIGHT, N. A. 2011. The human urothelium consists of multiple clonal units, each maintained by a stem cell. J Pathol, 225, 163-71.
GANDHI, D., MOLOTKOV, A., BATOURINA, E., SCHNEIDER, K., DAN, H., REILEY, M., LAUFER, E., METZGER, D., LIANG, F., LIAO, Y., SUN, T. T., ARONOW, B., ROSEN, R., MAUNEY, J., ADAM, R., ROSSELOT, C., VAN BATAVIA, J., MCMAHON, A., MCMAHON, J., GUO, J. J. & MENDELSOHN, C. 2013. Retinoid signaling in progenitors controls specification and regeneration of the urothelium. Dev Cell, 26, 469-82.
GAO, J., HUANG, H.-Y., PAK, J., CHENG, J., ZHANG, Z.-T., SHAPIRO, E., PELLICER, A., SUN, T.-T. & WU, X.-R. 2004. p53 deficiency provokes urothelial proliferation and synergizes with activated Ha-ras in promoting urothelial tumorigenesis. Oncogene, 23, 687-696.
GARCIA-CLOSAS, M., MALATS, N., SILVERMAN, D., DOSEMECI, M., KOGEVINAS, M., HEIN, D. W., TARDON, A., SERRA, C., CARRATO, A., GARCIA-CLOSAS, R., LLORETA, J., CASTANO-VINYALS, G., YEAGER, M., WELCH, R., CHANOCK, S., CHATTERJEE, N., WACHOLDER, S., SAMANIC, C., TORA, M., FERNANDEZ, F., REAL, F. X. & ROTHMAN, N. 2005. NAT2 slow acetylation, GSTM1 null genotype, and risk of bladder cancer: results from the Spanish Bladder Cancer Study and meta-analyses. Lancet, 366, 649-59.
GARCIA DEL MURO, X., TORREGROSA, A., MUNOZ, J., CASTELLSAGUE, X., CONDOM, E., VIGUES, F., ARANCE, A., FABRA, A. & GERMA, J. R. 2000. Prognostic value of the expression of E-cadherin and beta-catenin in bladder cancer. Eur J Cancer, 36, 357-62.
GARTSIDE, M. G., CHEN, H., IBRAHIMI, O. A., BYRON, S. A., CURTIS, A. V., WELLENS, C. L., BENGSTON, A., YUDT, L. M., ELISEENKOVA, A. V., MA, J., CURTIN, J. A., HYDER, P., HARPER, U. L., RIEDESEL, E., MANN, G. J., TRENT, J. M., BASTIAN, B. C., MELTZER, P. S., MOHAMMADI, M. & POLLOCK, P. M. 2009. Loss-of-function fibroblast growth factor receptor-2 mutations in melanoma. Mol Cancer Res, 7, 41-54.
GAVINE, P. R., MOONEY, L., KILGOUR, E., THOMAS, A. P., AL-KADHIMI, K., BECK, S., ROONEY, C., COLEMAN, T., BAKER, D., MELLOR, M. J., BROOKS, A. N. & KLINOWSKA, T. 2012. AZD4547: an orally bioavailable, potent, and selective inhibitor of the fibroblast growth factor receptor tyrosine kinase family. Cancer Res, 72, 2045-56.
GOETZ, R. & MOHAMMADI, M. 2013. Exploring mechanisms of FGF signalling through the lens of structural biology. Nat Rev Mol Cell Biol, 14, 166-80.
GOMEZ-ROMAN, J. J., SAENZ, P., MOLINA, M., CUEVAS GONZALEZ, J., ESCUREDO, K., SANTA CRUZ, S., JUNQUERA, C., SIMON, L., MARTINEZ, A., GUTIERREZ BANOS, J. L., LOPEZ-BREA, M., ESPARZA, C. & VAL-BERNAL, J. F. 2005. Fibroblast growth factor receptor 3 is overexpressed in urinary tract carcinomas and modulates the neoplastic cell growth. Clin Cancer Res, 11, 459-65.
GORDON, J. W. & RUDDLE, F. H. 1981. Integration and stable germ line transmission of genes injected into mouse pronuclei. Science, 214, 1244-6.

References 260
GREENBLATT, M. S., BENNETT, W. P., HOLLSTEIN, M. & HARRIS, C. C. 1994. Mutations in the p53 tumor suppressor gene: clues to cancer etiology and molecular pathogenesis. Cancer Res, 54, 4855-78.
GRIPPO, P. J. & SANDGREN, E. P. 2000. Highly invasive transitional cell carcinoma of the bladder in a simian virus 40 T-antigen transgenic mouse model. Am J Pathol, 157, 805-13.
GUAGNANO, V., FURET, P., SPANKA, C., BORDAS, V., LE DOUGET, M., STAMM, C., BRUEGGEN, J., JENSEN, M. R., SCHNELL, C., SCHMID, H., WARTMANN, M., BERGHAUSEN, J., DRUECKES, P., ZIMMERLIN, A., BUSSIERE, D., MURRAY, J. & GRAUS PORTA, D. 2011. Discovery of 3-(2,6-dichloro-3,5-dimethoxy-phenyl)-1-{6-[4-(4-ethyl-piperazin-1-yl)-phenylamin o]-pyrimidin-4-yl}-1-methyl-urea (NVP-BGJ398), a potent and selective inhibitor of the fibroblast growth factor receptor family of receptor tyrosine kinase. J Med Chem, 54, 7066-83.
GUAGNANO, V., KAUFFMANN, A., WOHRLE, S., STAMM, C., ITO, M., BARYS, L., PORNON, A., YAO, Y., LI, F., ZHANG, Y., CHEN, Z., WILSON, C. J., BORDAS, V., LE DOUGET, M., GAITHER, L. A., BORAWSKI, J., MONAHAN, J. E., VENKATESAN, K., BRUMMENDORF, T., THOMAS, D. M., GARCIA-ECHEVERRIA, C., HOFMANN, F., SELLERS, W. R. & GRAUS-PORTA, D. 2012. FGFR genetic alterations predict for sensitivity to NVP-BGJ398, a selective pan-FGFR inhibitor. Cancer Discov, 2, 1118-33.
GUANCIAL, E. A., BELLMUNT, J., YEH, S., ROSENBERG, J. E. & BERMAN, D. M. 2014a. The evolving understanding of microRNA in bladder cancer. Urol Oncol, 32, 41 e31-40.
GUANCIAL, E. A., WERNER, L., BELLMUNT, J., BAMIAS, A., CHOUEIRI, T. K., ROSS, R., SCHUTZ, F. A., PARK, R. S., O'BRIEN, R. J., HIRSCH, M. S., BARLETTA, J. A., BERMAN, D. M., LIS, R., LODA, M., STACK, E. C., GARRAWAY, L. A., RIESTER, M., MICHOR, F., KANTOFF, P. W. & ROSENBERG, J. E. 2014b. FGFR3 expression in primary and metastatic urothelial carcinoma of the bladder. Cancer Med, 3, 835-44.
GUNTHER, J. H., JURCZOK, A., WULF, T., BRANDAU, S., DEINERT, I., JOCHAM, D. & BOHLE, A. 1999. Optimizing syngeneic orthotopic murine bladder cancer (MB49). Cancer Res, 59, 2834-7.
GUO, C. C., FINE, S. W. & EPSTEIN, J. I. 2006. Noninvasive squamous lesions in the urinary bladder: a clinicopathologic analysis of 29 cases. Am J Surg Pathol, 30, 883-91.
HABUCHI, T. 2005. Origin of multifocal carcinomas of the bladder and upper urinary tract: molecular analysis and clinical implications. Int J Urol, 12, 709-16.
HABUCHI, T., KINOSHITA, H., YAMADA, H., KAKEHI, Y., OGAWA, O., WU, W. J., TAKAHASHI, R., SUGIYAMA, T. & YOSHIDA, O. 1994. Oncogene amplification in urothelial cancers with p53 gene mutation or MDM2 amplification. J Natl Cancer Inst, 86, 1331-5.
HACOHEN, N., KRAMER, S., SUTHERLAND, D., HIROMI, Y. & KRASNOW, M. A. 1998. sprouty encodes a novel antagonist of FGF signaling that patterns apical branching of the Drosophila airways. Cell, 92, 253-63.
HAFNER, C., KNUECHEL, R., STOEHR, R. & HARTMANN, A. 2002. Clonality of multifocal urothelial carcinomas: 10 years of molecular genetic studies. Int J Cancer, 101, 1-6.
HAFNER, C., KNUECHEL, R., ZANARDO, L., DIETMAIER, W., BLASZYK, H., CHEVILLE, J., HOFSTAEDTER, F. & HARTMANN, A. 2001. Evidence for oligoclonality and tumor spread by intraluminal seeding in multifocal

References 261
urothelial carcinomas of the upper and lower urinary tract. Oncogene, 20, 4910-5.
HART, K. C., ROBERTSON, S. C. & DONOGHUE, D. J. 2001. Identification of tyrosine residues in constitutively activated fibroblast growth factor receptor 3 involved in mitogenesis, Stat activation, and phosphatidylinositol 3-kinase activation. Mol Biol Cell, 12, 931-42.
HART, K. C., ROBERTSON, S. C., KANEMITSU, M. Y., MEYER, A. N., TYNAN, J. A. & DONOGHUE, D. J. 2000. Transformation and Stat activation by derivatives of FGFR1, FGFR3, and FGFR4. Oncogene, 19, 3309-20.
HARTMANN, A., ROSNER, U., SCHLAKE, G., DIETMAIER, W., ZAAK, D., HOFSTAEDTER, F. & KNUECHEL, R. 2000. Clonality and genetic divergence in multifocal low-grade superficial urothelial carcinoma as determined by chromosome 9 and p53 deletion analysis. Lab Invest, 80, 709-18.
HAWLEY, S. P., WILLS, M. K. & JONES, N. 2010. Adenovirus-mediated genetic removal of signaling molecules in cultured primary mouse embryonic fibroblasts. J Vis Exp.
HE, F., MO, L., ZHENG, X. Y., HU, C., LEPOR, H., LEE, E. Y., SUN, T. T. & WU, X. R. 2009. Deficiency of pRb family proteins and p53 in invasive urothelial tumorigenesis. Cancer Res, 69, 9413-21.
HE, Z., KOSINSKA, W., ZHAO, Z. L., WU, X. R. & GUTTENPLAN, J. B. 2012. Tissue-specific mutagenesis by N-butyl-N-(4-hydroxybutyl)nitrosamine as the basis for urothelial carcinogenesis. Mutat Res, 742, 92-5.
HELDT, S. A. & RESSLER, K. J. 2009. The Use of Lentiviral Vectors and Cre/loxP to Investigate the Function of Genes in Complex Behaviors. Front Mol Neurosci, 2, 22.
HENRIQUEZ, N. V., VAN OVERVELD, P. G., QUE, I., BUIJS, J. T., BACHELIER, R., KAIJZEL, E. L., LOWIK, C. W., CLEZARDIN, P. & VAN DER PLUIJM, G. 2007. Advances in optical imaging and novel model systems for cancer metastasis research. Clin Exp Metastasis, 24, 699-705.
HERNANDEZ, S., LOPEZ-KNOWLES, E., LLORETA, J., KOGEVINAS, M., AMOROS, A., TARDON, A., CARRATO, A., SERRA, C., MALATS, N. & REAL, F. X. 2006. Prospective study of FGFR3 mutations as a prognostic factor in nonmuscle invasive urothelial bladder carcinomas. J Clin Oncol, 24, 3664-71.
HERNANDEZ, S., LOPEZ-KNOWLES, E., LLORETA, J., KOGEVINAS, M., JARAMILLO, R., AMOROS, A., TARDON, A., GARCIA-CLOSAS, R., SERRA, C., CARRATO, A., MALATS, N. & REAL, F. X. 2005. FGFR3 and Tp53 mutations in T1G3 transitional bladder carcinomas: independent distribution and lack of association with prognosis. Clin Cancer Res, 11, 5444-50.
HERR, H. W. 2000. Tumor progression and survival of patients with high grade, noninvasive papillary (TaG3) bladder tumors: 15-year outcome. J Urol, 163, 60-1; discussion 61-2.
HERRERA-ABREU, M. T., PEARSON, A., CAMPBELL, J., SHNYDER, S. D., KNOWLES, M. A., ASHWORTH, A. & TURNER, N. C. 2013. Parallel RNA Interference Screens Identify EGFR Activation as an Escape Mechanism in FGFR3-Mutant Cancer. Cancer Discov, 3, 1058-71.
HO, P. L., LAY, E. J., JIAN, W., PARRA, D. & CHAN, K. S. 2012. Stat3 activation in urothelial stem cells leads to direct progression to invasive bladder cancer. Cancer Res, 72, 3135-42.
HSIEH, J. K., CHAN, F. S., O'CONNOR, D. J., MITTNACHT, S., ZHONG, S. & LU, X. 1999. RB regulates the stability and the apoptotic function of p53 via MDM2. Mol Cell, 3, 181-93.

References 262
HUGHES, S. E. 1997. Differential expression of the fibroblast growth factor receptor (FGFR) multigene family in normal human adult tissues. J Histochem Cytochem, 45, 1005-19.
HUMPHRAY, S. J., OLIVER, K., HUNT, A. R., PLUMB, R. W., LOVELAND, J. E., HOWE, K. L., ANDREWS, T. D., SEARLE, S., HUNT, S. E., SCOTT, C. E., JONES, M. C., AINSCOUGH, R., ALMEIDA, J. P., AMBROSE, K. D., ASHWELL, R. I., BABBAGE, A. K., BABBAGE, S., BAGGULEY, C. L., BAILEY, J., BANERJEE, R., BARKER, D. J., BARLOW, K. F., BATES, K., BEASLEY, H., BEASLEY, O., BIRD, C. P., BRAY-ALLEN, S., BROWN, A. J., BROWN, J. Y., BURFORD, D., BURRILL, W., BURTON, J., CARDER, C., CARTER, N. P., CHAPMAN, J. C., CHEN, Y., CLARKE, G., CLARK, S. Y., CLEE, C. M., CLEGG, S., COLLIER, R. E., CORBY, N., CROSIER, M., CUMMINGS, A. T., DAVIES, J., DHAMI, P., DUNN, M., DUTTA, I., DYER, L. W., EARTHROWL, M. E., FAULKNER, L., FLEMING, C. J., FRANKISH, A., FRANKLAND, J. A., FRENCH, L., FRICKER, D. G., GARNER, P., GARNETT, J., GHORI, J., GILBERT, J. G., GLISON, C., GRAFHAM, D. V., GRIBBLE, S., GRIFFITHS, C., GRIFFITHS-JONES, S., GROCOCK, R., GUY, J., HALL, R. E., HAMMOND, S., HARLEY, J. L., HARRISON, E. S., HART, E. A., HEATH, P. D., HENDERSON, C. D., HOPKINS, B. L., HOWARD, P. J., HOWDEN, P. J., HUCKLE, E., JOHNSON, C., JOHNSON, D., JOY, A. A., KAY, M., KEENAN, S., KERSHAW, J. K., KIMBERLEY, A. M., KING, A., KNIGHTS, A., LAIRD, G. K., LANGFORD, C., LAWLOR, S., LEONGAMORNLERT, D. A., LEVERSHA, M., LLOYD, C., LLOYD, D. M., LOVELL, J., MARTIN, S., MASHREGHI-MOHAMMADI, M., MATTHEWS, L., MCLAREN, S., MCLAY, K. E., et al. 2004. DNA sequence and analysis of human chromosome 9. Nature, 429, 369-74.
INOUE, Y., IZAWA, K., KIRYU, S., TOJO, A. & OHTOMO, K. 2008. Diet and abdominal autofluorescence detected by in vivo fluorescence imaging of living mice. Mol Imaging, 7, 21-7.
ISSA, A., GILL, J. W., HEIDEMAN, M. R., SAHIN, O., WIEMANN, S., DEY, J. H. & HYNES, N. E. 2013. Combinatorial targeting of FGF and ErbB receptors blocks growth and metastatic spread of breast cancer models. Breast Cancer Res, 15, R8.
IVICS, Z., HACKETT, P. B., PLASTERK, R. H. & IZSVAK, Z. 1997. Molecular reconstruction of Sleeping Beauty, a Tc1-like transposon from fish, and its transposition in human cells. Cell, 91, 501-10.
IWATA, T., CHEN, L., LI, C., OVCHINNIKOV, D. A., BEHRINGER, R. R., FRANCOMANO, C. A. & DENG, C. X. 2000. A neonatal lethal mutation in FGFR3 uncouples proliferation and differentiation of growth plate chondrocytes in embryos. Hum Mol Genet, 9, 1603-13.
IWATA, T. & HEVNER, R. F. 2009. Fibroblast growth factor signaling in development of the cerebral cortex. Dev Growth Differ, 51, 299-323.
IYER, G. & MILOWSKY, M. I. 2012. Fibroblast growth factor receptor-3 in urothelial tumorigenesis. Urol Oncol.
JACKSON, E. L. 2001. Analysis of lung tumor initiation and progression using conditional expression of oncogenic K-ras. Genes & Development, 15, 3243-3248.
JACQUEMIER, J., ADELAIDE, J., PARC, P., PENAULT-LLORCA, F., PLANCHE, J., DELAPEYRIERE, O. & BIRNBAUM, D. 1994. Expression of the FGFR1 gene in human breast-carcinoma cells. Int J Cancer, 59, 373-8.
JANG, J. H., SHIN, K. H. & PARK, J. G. 2001. Mutations in fibroblast growth factor receptor 2 and fibroblast growth factor receptor 3 genes associated with human gastric and colorectal cancers. Cancer Res, 61, 3541-3.
References 263
JEBAR, A. H., HURST, C. D., TOMLINSON, D. C., JOHNSTON, C., TAYLOR, C. F. & KNOWLES, M. A. 2005. FGFR3 and Ras gene mutations are mutually exclusive genetic events in urothelial cell carcinoma. Oncogene, 24, 5218-5225.
JONES, T. D., WANG, M., EBLE, J. N., MACLENNAN, G. T., LOPEZ-BELTRAN, A., ZHANG, S., COCCO, A. & CHENG, L. 2005. Molecular evidence supporting field effect in urothelial carcinogenesis. Clin Cancer Res, 11, 6512-9.
JUANPERE, N., AGELL, L., LORENZO, M., DE MUGA, S., LOPEZ-VILARO, L., MURILLO, R., MOJAL, S., SERRANO, S., LORENTE, J. A., LLORETA, J. & HERNANDEZ, S. 2012. Mutations in FGFR3 and PIK3CA, singly or combined with RAS and AKT1, are associated with AKT but not with MAPK pathway activation in urothelial bladder cancer. Hum Pathol, 43, 1573-82.
JURCZOK, A., FORNARA, P. & SOLING, A. 2008. Bioluminescence imaging to monitor bladder cancer cell adhesion in vivo: a new approach to optimize a syngeneic, orthotopic, murine bladder cancer model. BJU Int, 101, 120-4.
KAGAN, J., LIU, J., STEIN, J. D., WAGNER, S. S., BABKOWSKI, R., GROSSMAN, B. H. & KATZ, R. L. 1998. Cluster of allele losses within a 2.5 cM region of chromosome 10 in high-grade invasive bladder cancer. Oncogene, 16, 909-13.
KALLIONIEMI, A., KALLIONIEMI, O. P., CITRO, G., SAUTER, G., DEVRIES, S., KERSCHMANN, R., CAROLL, P. & WALDMAN, F. 1995. Identification of gains and losses of DNA sequences in primary bladder cancer by comparative genomic hybridization. Genes Chromosomes Cancer, 12, 213-9.
KANG, J., LEE, S. Y., KIM, Y. J., PARK, J. Y., KWON, S. J., NA, M. J., LEE, E. J., JEON, H. S. & SON, J. W. 2012. microRNA-99b acts as a tumor suppressor in non-small cell lung cancer by directly targeting fibroblast growth factor receptor 3. Exp Ther Med, 3, 149-153.
KARASAVVIDOU, F., BARBANIS, S., PAPPA, D., MOUTZOURIS, G., TZORTZIS, V., MELEKOS, M. D. & KOUKOULIS, G. 2008. Fascin determination in urothelial carcinomas of the urinary bladder: a marker of invasiveness. Arch Pathol Lab Med, 132, 1912-5.
KARNI-SCHMIDT, O., CASTILLO-MARTIN, M., SHEN, T. H., GLADOUN, N., DOMINGO-DOMENECH, J., SANCHEZ-CARBAYO, M., LI, Y., LOWE, S., PRIVES, C. & CORDON-CARDO, C. 2011. Distinct expression profiles of p63 variants during urothelial development and bladder cancer progression. Am J Pathol, 178, 1350-60.
KATOH, M. 2013. Functional and cancer genomics of ASXL family members. Br J Cancer, 109, 299-306.
KATOH, M. & NAKAGAMA, H. 2013. FGF Receptors: Cancer Biology and Therapeutics. Med Res Rev.
KENG, V. W., VILLANUEVA, A., CHIANG, D. Y., DUPUY, A. J., RYAN, B. J., MATISE, I., SILVERSTEIN, K. A., SARVER, A., STARR, T. K., AKAGI, K., TESSAROLLO, L., COLLIER, L. S., POWERS, S., LOWE, S. W., JENKINS, N. A., COPELAND, N. G., LLOVET, J. M. & LARGAESPADA, D. A. 2009. A conditional transposon-based insertional mutagenesis screen for genes associated with mouse hepatocellular carcinoma. Nat Biotechnol, 27, 264-74.
KHANDELWAL, P., ABRAHAM, S. N. & APODACA, G. 2009. Cell biology and physiology of the uroepithelium. Am J Physiol Renal Physiol, 297, F1477-501.
KIKUCHI, E., XU, S., OHORI, M., MATEI, C., LUPU, M., MENENDEZ, S., KOUTCHER, J. A. & BOCHNER, B. H. 2003. Detection and quantitative analysis of early
References 264
stage orthotopic murine bladder tumor using in vivo magnetic resonance imaging. J Urol, 170, 1375-8.
KIM, I., MOON, S., YU, K., KIM, U. & KOH, G. Y. 2001. A novel fibroblast growth factor receptor-5 preferentially expressed in the pancreas(1). Biochim Biophys Acta, 1518, 152-6.
KIM, M. 2010. Cooperative interactions of PTEN deficiency and RAS activation in melanoma metastasis. Small GTPases, 1, 161-164.
KIM, S. & ALEXANDER, C. M. 2013. Tumorsphere assay provides more accurate prediction of in vivo responses to chemotherapeutics. Biotechnol Lett.
KIM, T. H., WANG, J., LEE, K. Y., FRANCO, H. L., BROADDUS, R. R., LYDON, J. P., JEONG, J. W. & DEMAYO, F. J. 2010. The Synergistic Effect of Conditional Pten Loss and Oncogenic K-ras Mutation on Endometrial Cancer Development Occurs via Decreased Progesterone Receptor Action. J Oncol, 2010, 139087.
KIRSCH, D. G., DINULESCU, D. M., MILLER, J. B., GRIMM, J., SANTIAGO, P. M., YOUNG, N. P., NIELSEN, G. P., QUADE, B. J., CHABER, C. J., SCHULTZ, C. P., TAKEUCHI, O., BRONSON, R. T., CROWLEY, D., KORSMEYER, S. J., YOON, S. S., HORNICEK, F. J., WEISSLEDER, R. & JACKS, T. 2007. A spatially and temporally restricted mouse model of soft tissue sarcoma. Nat Med, 13, 992-7.
KNOWLES, M. A. 2007. Role of FGFR3 in urothelial cell carcinoma: biomarker and potential therapeutic target. World Journal of Urology, 25, 581-593.
KNOWLES, M. A. 2008. Molecular pathogenesis of bladder cancer. International Journal of Clinical Oncology, 13, 287-297.
KNOWLES, M. A., PLATT, F. M., ROSS, R. L. & HURST, C. D. 2009. Phosphatidylinositol 3-kinase (PI3K) pathway activation in bladder cancer. Cancer and Metastasis Reviews, 28, 305-316.
KNOWLES, M. A. & WILLIAMSON, M. 1993. Mutation of H-ras is infrequent in bladder cancer: confirmation by single-strand conformation polymorphism analysis, designed restriction fragment length polymorphisms, and direct sequencing. Cancer Res, 53, 133-9.
KOGEVINAS, M., T MANNETJE, A., CORDIER, S., RANFT, U., GONZALEZ, C. A., VINEIS, P., CHANG-CLAUDE, J., LYNGE, E., WAHRENDORF, J., TZONOU, A., JOCKEL, K. H., SERRA, C., PORRU, S., HOURS, M., GREISER, E. & BOFFETTA, P. 2003. Occupation and bladder cancer among men in Western Europe. Cancer Causes Control, 14, 907-14.
KOMPIER, L. C., LURKIN, I., VAN DER AA, M. N., VAN RHIJN, B. W., VAN DER KWAST, T. H. & ZWARTHOFF, E. C. 2010. FGFR3, HRAS, KRAS, NRAS and PIK3CA mutations in bladder cancer and their potential as biomarkers for surveillance and therapy. PLoS One, 5, e13821.
KONG, X. T. 2004. Roles of uroplakins in plaque formation, umbrella cell enlargement, and urinary tract diseases. The Journal of Cell Biology, 167, 1195-1204.
KORKOLOPOULOU, P., LEVIDOU, G., TRIGKA, E. A., PREKETE, N., KARLOU, M., THYMARA, I., SAKELLARIOU, S., FRAGKOU, P., ISAIADIS, D., PAVLOPOULOS, P., PATSOURIS, E. & SAETTA, A. A. 2012. A comprehensive immunohistochemical and molecular approach to the PI3K/AKT/mTOR (phosphoinositide 3-kinase/v-akt murine thymoma viral oncogene/mammalian target of rapamycin) pathway in bladder urothelial carcinoma. BJU Int, 110, E1237-48.
KOVALENKO, D., YANG, X., NADEAU, R. J., HARKINS, L. K. & FRIESEL, R. 2003. Sef inhibits fibroblast growth factor signaling by inhibiting FGFR1 tyrosine

References 265
phosphorylation and subsequent ERK activation. J Biol Chem, 278, 14087-91.
KUMAR, M. S., ERKELAND, S. J., PESTER, R. E., CHEN, C. Y., EBERT, M. S., SHARP, P. A. & JACKS, T. 2008. Suppression of non-small cell lung tumor development by the let-7 microRNA family. Proc Natl Acad Sci U S A, 105, 3903-8.
KUNII, K., DAVIS, L., GORENSTEIN, J., HATCH, H., YASHIRO, M., DI BACCO, A., ELBI, C. & LUTTERBACH, B. 2008. FGFR2-amplified gastric cancer cell lines require FGFR2 and Erbb3 signaling for growth and survival. Cancer Res, 68, 2340-8.
KUNZE, E., GRAEWE, T., SCHERBER, S., WEBER, J. & GELLHAR, P. 1989. Cell cycle dependence of N-methyl-N-nitrosourea-induced tumour development in the proliferating, partially resected rat urinary bladder. Br J Exp Pathol, 70, 125-42.
KURZROCK, E. A., LIEU, D. K., DEGRAFFENRIED, L. A., CHAN, C. W. & ISSEROFF, R. R. 2008. Label-retaining cells of the bladder: candidate urothelial stem cells. Am J Physiol Renal Physiol, 294, F1415-21.
KWABI-ADDO, B., OZEN, M. & ITTMANN, M. 2004. The role of fibroblast growth factors and their receptors in prostate cancer. Endocr Relat Cancer, 11, 709-24.
LAEDERICH, M. B. & HORTON, W. A. 2012. FGFR3 targeting strategies for achondroplasia. Expert Rev Mol Med, 14, e11.
LAFITTE, M., MORANVILLIER, I., GARCIA, S., PEUCHANT, E., IOVANNA, J., ROUSSEAU, B., DUBUS, P., GUYONNET-DUPERAT, V., BELLEANNEE, G., RAMOS, J., BEDEL, A., DE VERNEUIL, H., MOREAU-GAUDRY, F. & DABERNAT, S. 2013. FGFR3 has tumor suppressor properties in cells with epithelial phenotype. Mol Cancer, 12, 83.
LAMONT, F. R., TOMLINSON, D. C., COOPER, P. A., SHNYDER, S. D., CHESTER, J. D. & KNOWLES, M. A. 2011. Small molecule FGF receptor inhibitors block FGFR-dependent urothelial carcinoma growth in vitro and in vivo. Br J Cancer, 104, 75-82.
LANDER, E. S., LINTON, L. M., BIRREN, B., NUSBAUM, C., ZODY, M. C., BALDWIN, J., DEVON, K., DEWAR, K., DOYLE, M., FITZHUGH, W., FUNKE, R., GAGE, D., HARRIS, K., HEAFORD, A., HOWLAND, J., KANN, L., LEHOCZKY, J., LEVINE, R., MCEWAN, P., MCKERNAN, K., MELDRIM, J., MESIROV, J. P., MIRANDA, C., MORRIS, W., NAYLOR, J., RAYMOND, C., ROSETTI, M., SANTOS, R., SHERIDAN, A., SOUGNEZ, C., STANGE-THOMANN, N., STOJANOVIC, N., SUBRAMANIAN, A., WYMAN, D., ROGERS, J., SULSTON, J., AINSCOUGH, R., BECK, S., BENTLEY, D., BURTON, J., CLEE, C., CARTER, N., COULSON, A., DEADMAN, R., DELOUKAS, P., DUNHAM, A., DUNHAM, I., DURBIN, R., FRENCH, L., GRAFHAM, D., GREGORY, S., HUBBARD, T., HUMPHRAY, S., HUNT, A., JONES, M., LLOYD, C., MCMURRAY, A., MATTHEWS, L., MERCER, S., MILNE, S., MULLIKIN, J. C., MUNGALL, A., PLUMB, R., ROSS, M., SHOWNKEEN, R., SIMS, S., WATERSTON, R. H., WILSON, R. K., HILLIER, L. W., MCPHERSON, J. D., MARRA, M. A., MARDIS, E. R., FULTON, L. A., CHINWALLA, A. T., PEPIN, K. H., GISH, W. R., CHISSOE, S. L., WENDL, M. C., DELEHAUNTY, K. D., MINER, T. L., DELEHAUNTY, A., KRAMER, J. B., COOK, L. L., FULTON, R. S., JOHNSON, D. L., MINX, P. J., CLIFTON, S. W., HAWKINS, T., BRANSCOMB, E., PREDKI, P., RICHARDSON, P., WENNING, S., SLEZAK, T., DOGGETT, N., CHENG, J. F., OLSEN, A., LUCAS, S., ELKIN, C., UBERBACHER, E., FRAZIER, M., et al. 2001. Initial sequencing and analysis of the human genome. Nature, 409, 860-921.

References 266
LEBLANC, B., DUCLOS, A. J., BENARD, F., COTE, J., VALIQUETTE, L., PAQUIN, J. M., MAUFFETTE, F., FAUCHER, R. & PERREAULT, J. P. 1999. Long-term followup of initial Ta grade 1 transitional cell carcinoma of the bladder. J Urol, 162, 1946-50.
LESCHE, R., GROSZER, M., GAO, J., WANG, Y., MESSING, A., SUN, H., LIU, X. & WU, H. 2002. Cre/loxP-mediated inactivation of the murinePten tumor suppressor gene. genesis, 32, 148-149.
LI, C., CHEN, L., IWATA, T., KITAGAWA, M., FU, X. Y. & DENG, C. X. 1999. A Lys644Glu substitution in fibroblast growth factor receptor 3 (FGFR3) causes dwarfism in mice by activation of STATs and ink4 cell cycle inhibitors. Hum Mol Genet, 8, 35-44.
LI, C., SCOTT, D. A., HATCH, E., TIAN, X. & MANSOUR, S. L. 2007. Dusp6 (Mkp3) is a negative feedback regulator of FGF-stimulated ERK signaling during mouse development. Development, 134, 167-76.
LI, W., LIU, M., FENG, Y., HUANG, Y. F., XU, Y. F., CHE, J. P., WANG, G. C. & ZHENG, J. H. 2013. High expression of Notch ligand Jagged2 is associated with the metastasis and recurrence in urothelial carcinoma of bladder. Int J Clin Exp Pathol, 6, 2430-40.
LIANES, P., ORLOW, I., ZHANG, Z. F., OLIVA, M. R., SARKIS, A. S., REUTER, V. E. & CORDON-CARDO, C. 1994. Altered patterns of MDM2 and TP53 expression in human bladder cancer. J Natl Cancer Inst, 86, 1325-30.
LIANG, G., CHEN, G., WEI, X., ZHAO, Y. & LI, X. 2013. Small molecule inhibition of fibroblast growth factor receptors in cancer. Cytokine Growth Factor Rev, 24, 467-75.
LIANG, Q., KONG, J., STALKER, J. & BRADLEY, A. 2009. Chromosomal mobilization and reintegration ofSleeping BeautyandPiggyBactransposons. genesis, 47, 404-408.
LIN, J. H., ZHAO, H. & SUN, T. T. 1995. A tissue-specific promoter that can drive a foreign gene to express in the suprabasal urothelial cells of transgenic mice. Proc Natl Acad Sci U S A, 92, 679-83.
LINDGREN, D., SJODAHL, G., LAUSS, M., STAAF, J., CHEBIL, G., LOVGREN, K., GUDJONSSON, S., LIEDBERG, F., PATSCHAN, O., MANSSON, W., FERNO, M. & HOGLUND, M. 2012. Integrated genomic and gene expression profiling identifies two major genomic circuits in urothelial carcinoma. PLoS One, 7, e38863.
LIU, G., MCDONNELL, T. J., MONTES DE OCA LUNA, R., KAPOOR, M., MIMS, B., EL-NAGGAR, A. K. & LOZANO, G. 2000. High metastatic potential in mice inheriting a targeted p53 missense mutation. Proc Natl Acad Sci U S A, 97, 4174-9.
LOGIE, A. 2005. Activating mutations of the tyrosine kinase receptor FGFR3 are associated with benign skin tumors in mice and humans. Human Molecular Genetics, 14, 1153-1160.
LOPEZ-KNOWLES, E., HERNANDEZ, S., MALATS, N., KOGEVINAS, M., LLORETA, J., CARRATO, A., TARDON, A., SERRA, C. & REAL, F. X. 2006. PIK3CA mutations are an early genetic alteration associated with FGFR3 mutations in superficial papillary bladder tumors. Cancer Res, 66, 7401-4.
LORD, C. J. & ASHWORTH, A. 2012. The DNA damage response and cancer therapy. Nature, 481, 287-94.
LOSKOG, A., NINALGA, C., HEDLUND, T., ALIMOHAMMADI, M., MALMSTROM, P. U. & TOTTERMAN, T. H. 2005. Optimization of the MB49 mouse bladder cancer model for adenoviral gene therapy. Lab Anim, 39, 384-93.
LU, M. L., WIKMAN, F., ORNTOFT, T. F., CHARYTONOWICZ, E., RABBANI, F., ZHANG, Z., DALBAGNI, G., POHAR, K. S., YU, G. & CORDON-CARDO, C.

References 267
2002. Impact of alterations affecting the p53 pathway in bladder cancer on clinical outcome, assessed by conventional and array-based methods. Clin Cancer Res, 8, 171-9.
LUCHE, H., WEBER, O., NAGESWARA RAO, T., BLUM, C. & FEHLING, H. J. 2007. Faithful activation of an extra-bright red fluorescent protein in "knock-in" Cre-reporter mice ideally suited for lineage tracing studies. Eur J Immunol, 37, 43-53.
LUO, G., IVICS, Z., IZSVAK, Z. & BRADLEY, A. 1998. Chromosomal transposition of a Tc1/mariner-like element in mouse embryonic stem cells. Proc Natl Acad Sci U S A, 95, 10769-73.
LYONS, S. K. 2005. Advances in imaging mouse tumour models in vivo. J Pathol, 205, 194-205.
MACHER-GOEPPINGER, S., BERMEJO, J. L., SCHIRMACHER, P., PAHERNIK, S., HOHENFELLNER, M. & ROTH, W. 2013. Senescence-associated protein p400 is a prognostic marker in renal cell carcinoma. Oncol Rep, 30, 2245-53.
MAEHAMA, T. & DIXON, J. E. 1998. The tumor suppressor, PTEN/MMAC1, dephosphorylates the lipid second messenger, phosphatidylinositol 3,4,5-trisphosphate. J Biol Chem, 273, 13375-8.
MALATS, N., BUSTOS, A., NASCIMENTO, C. M., FERNANDEZ, F., RIVAS, M., PUENTE, D., KOGEVINAS, M. & REAL, F. X. 2005. P53 as a prognostic marker for bladder cancer: a meta-analysis and review. Lancet Oncol, 6, 678-86.
MANN, K. M., WARD, J. M., YEW, C. C., KOVOCHICH, A., DAWSON, D. W., BLACK, M. A., BRETT, B. T., SHEETZ, T. E., DUPUY, A. J., CHANG, D. K., BIANKIN, A. V., WADDELL, N., KASSAHN, K. S., GRIMMOND, S. M., RUST, A. G., ADAMS, D. J., JENKINS, N. A. & COPELAND, N. G. 2012. Sleeping Beauty mutagenesis reveals cooperating mutations and pathways in pancreatic adenocarcinoma. Proc Natl Acad Sci U S A, 109, 5934-41.
MAO, J. H., TO, M. D., PEREZ-LOSADA, J., WU, D., DEL ROSARIO, R. & BALMAIN, A. 2004. Mutually exclusive mutations of the Pten and ras pathways in skin tumor progression. Genes Dev, 18, 1800-5.
MARCH, H. N., RUST, A. G., WRIGHT, N. A., TEN HOEVE, J., DE RIDDER, J., ELDRIDGE, M., VAN DER WEYDEN, L., BERNS, A., GADIOT, J., UREN, A., KEMP, R., ARENDS, M. J., WESSELS, L. F., WINTON, D. J. & ADAMS, D. J. 2011. Insertional mutagenesis identifies multiple networks of cooperating genes driving intestinal tumorigenesis. Nat Genet, 43, 1202-9.
MARQUIS, L., TRAN, M., CHOI, W., LEE, I. L., HUSZAR, D., SIEFKER-RADTKE, A., DINNEY, C. & MCCONKEY, D. J. 2012. p63 expression correlates with sensitivity to the Eg5 inhibitor ZD4877 in bladder cancer cells. Cancer Biol Ther, 13, 477-86.
MARSH, S. K., BANSAL, G. S., ZAMMIT, C., BARNARD, R., COOPE, R., ROBERTS-CLARKE, D., GOMM, J. J., COOMBES, R. C. & JOHNSTON, C. L. 1999. Increased expression of fibroblast growth factor 8 in human breast cancer. Oncogene, 18, 1053-60.
MARTINIOVA, L., SCHIMEL, D., LAI, E. W., LIMPUANGTHIP, A., KVETNANSKY, R. & PACAK, K. 2010. In vivo micro-CT imaging of liver lesions in small animal models. Methods, 50, 20-5.
MARZIONI, D., LORENZI, T., MAZZUCCHELLI, R., CAPPARUCCIA, L., MORRONI, M., FIORINI, R., BRACALENTI, C., CATALANO, A., DAVID, G., CASTELLUCCI, M., MUZZONIGRO, G. & MONTIRONI, R. 2009. Expression of basic fibroblast growth factor, its receptors and syndecans in bladder cancer. Int J Immunopathol Pharmacol, 22, 627-38.

References 268
MATSUMOTO, M., OHTSUKI, Y., OCHII, K., SEIKE, Y., ISEDA, N., SASAKI, T., OKADA, Y., KURABAYASHI, A. & FURIHATA, M. 2004. Fibroblast growth factor receptor 3 protein expression in urothelial carcinoma of the urinary bladder, exhibiting no association with low-grade and/or non-invasive lesions. Oncol Rep, 12, 967-71.
MCCORMICK, D. L., RONAN, S. S., BECCI, P. J. & MOON, R. C. 1981. Influence of total dose and dose schedule on induction of urinary bladder cancer in the mouse by N-butyl-N-(4-hydroxybutyl)nitrosamine. Carcinogenesis, 2, 251-4.
MEIER, Y., ZODAN, T., LANG, C., ZIMMERMANN, R., KULLAK-UBLICK, G. A., MEIER, P. J., STIEGER, B. & PAULI-MAGNUS, C. 2008. Increased susceptibility for intrahepatic cholestasis of pregnancy and contraceptive-induced cholestasis in carriers of the 1331T>C polymorphism in the bile salt export pump. World J Gastroenterol, 14, 38-45.
MHAWECH-FAUCEGLIA, P., CHENEY, R. T., FISCHER, G., BECK, A. & HERRMANN, F. R. 2006. FGFR3 and p53 protein expressions in patients with pTa and pT1 urothelial bladder cancer. Eur J Surg Oncol, 32, 231-7.
MIKI, T., BOTTARO, D. P., FLEMING, T. P., SMITH, C. L., BURGESS, W. H., CHAN, A. M. & AARONSON, S. A. 1992. Determination of ligand-binding specificity by alternative splicing: two distinct growth factor receptors encoded by a single gene. Proc Natl Acad Sci U S A, 89, 246-50.
MO, L., CHENG, J., LEE, E. Y., SUN, T. T. & WU, X. R. 2005. Gene deletion in urothelium by specific expression of Cre recombinase. Am J Physiol Renal Physiol, 289, F562-8.
MO, L., ZHENG, X., HUANG, H. Y., SHAPIRO, E., LEPOR, H., CORDON-CARDO, C., SUN, T. T. & WU, X. R. 2007. Hyperactivation of Ha-ras oncogene, but not Ink4a/Arf deficiency, triggers bladder tumorigenesis. J Clin Invest, 117, 314-25.
MOLL, R., DIVO, M. & LANGBEIN, L. 2008. The human keratins: biology and pathology. Histochem Cell Biol, 129, 705-33.
MONTIRONI, R., MAZZUCCHELLI, R., SCARPELLI, M., LOPEZ-BELTRAN, A. & CHENG, L. 2008. Morphological diagnosis of urothelial neoplasms. J Clin Pathol, 61, 3-10.
MORRIS, R. J. & POTTEN, C. S. 1994. Slowly cycling (label-retaining) epidermal cells behave like clonogenic stem cells in vitro. Cell Prolif, 27, 279-89.
MULHOLLAND, D. J., KOBAYASHI, N., RUSCETTI, M., ZHI, A., TRAN, L. M., HUANG, J., GLEAVE, M. & WU, H. 2012. Pten loss and RAS/MAPK activation cooperate to promote EMT and metastasis initiated from prostate cancer stem/progenitor cells. Cancer Res, 72, 1878-89.
MUNRO, J., STEEGHS, K., MORRISON, V., IRELAND, H. & PARKINSON, E. K. 2001. Human fibroblast replicative senescence can occur in the absence of extensive cell division and short telomeres. Oncogene, 20, 3541-52.
MURPHY, T., DARBY, S., MATHERS, M. E. & GNANAPRAGASAM, V. J. 2010. Evidence for distinct alterations in the FGF axis in prostate cancer progression to an aggressive clinical phenotype. J Pathol, 220, 452-60.
MUZUMDAR, M. D., TASIC, B., MIYAMICHI, K., LI, L. & LUO, L. 2007. A global double-fluorescent Cre reporter mouse. Genesis, 45, 593-605.
NAGY, A. 2000. Cre recombinase: the universal reagent for genome tailoring. Genesis, 26, 99-109.
NAIDU, R., WAHAB, N. A., YADAV, M., KUTTY, M. K. & NAIR, S. 2001. Detection of amplified int-2/FGF-3 gene in primary breast carcinomas using differential polymerase chain reaction. Int J Mol Med, 8, 193-8.
References 269
NAIMI, B., LATIL, A., FOURNIER, G., MANGIN, P., CUSSENOT, O. & BERTHON, P. 2002. Down-regulation of (IIIb) and (IIIc) isoforms of fibroblast growth factor receptor 2 (FGFR2) is associated with malignant progression in human prostate. Prostate, 52, 245-52.
NAKOPOULOU, L., ZERVAS, A., GAKIOPOULOU-GIVALOU, H., CONSTANTINIDES, C., DOUMANIS, G., DAVARIS, P. & DIMOPOULOS, C. 2000. Prognostic value of E-cadherin, beta-catenin, P120ctn in patients with transitional cell bladder cancer. Anticancer Res, 20, 4571-8.
NALDINI, L., BLOMER, U., GALLAY, P., ORY, D., MULLIGAN, R., GAGE, F. H., VERMA, I. M. & TRONO, D. 1996. In vivo gene delivery and stable transduction of nondividing cells by a lentiviral vector. Science, 272, 263-7.
NASKI, M. C., WANG, Q., XU, J. & ORNITZ, D. M. 1996. Graded activation of fibroblast growth factor receptor 3 by mutations causing achondroplasia and thanatophoric dysplasia. Nat Genet, 13, 233-7.
NETWORK, T. C. G. A. R. 2014. Comprehensive molecular characterization of urothelial bladder carcinoma. Nature, 507, 315-22.
NICOLIS, S. K. 2007. Cancer stem cells and "stemness" genes in neuro-oncology. Neurobiol Dis, 25, 217-29.
NIEGISCH, G., LORCH, A., DROLLER, M. J., LAVERY, H. J., STENSLAND, K. D. & ALBERS, P. 2013. Neoadjuvant chemotherapy in patients with muscle-invasive bladder cancer: which patients benefit? Eur Urol, 64, 355-7.
O'TOOLE, C. M., POVEY, S., HEPBURN, P. & FRANKS, L. M. 1983. Identity of some human bladder cancer cell lines. Nature, 301, 429-30.
ODA, K., MATSUOKA, Y., FUNAHASHI, A. & KITANO, H. 2005. A comprehensive pathway map of epidermal growth factor receptor signaling. Mol Syst Biol, 1, 2005 0010.
OGAWA, K., UZVOLGYI, E., ST JOHN, M. K., DE OLIVEIRA, M. L., ARNOLD, L. & COHEN, S. M. 1998. Frequent p53 mutations and occasional loss of chromosome 4 in invasive bladder carcinoma induced by N-butyl-N-(4-hydroxybutyl)nitrosamine in B6D2F1 mice. Mol Carcinog, 21, 70-9.
OHTANI, M., KAKIZOE, T., NISHIO, Y., SATO, S., SUGIMURA, T., FUKUSHIMA, S. & NIIJIMA, T. 1986. Sequential changes of mouse bladder epithelium during induction of invasive carcinomas by N-butyl-N-(4-hydroxybutyl)nitrosamine. Cancer Res, 46, 2001-4.
OLIVEIRA, P. A., COLACO, A., DE LA CRUZ, P. L. & LOPES, C. 2006. Experimental bladder carcinogenesis-rodent models. Exp Oncol, 28, 2-11.
ONEYAMA, C., IKEDA, J., OKUZAKI, D., SUZUKI, K., KANOU, T., SHINTANI, Y., MORII, E., OKUMURA, M., AOZASA, K. & OKADA, M. 2011. MicroRNA-mediated downregulation of mTOR/FGFR3 controls tumor growth induced by Src-related oncogenic pathways. Oncogene, 30, 3489-501.
OOI, A., HERZ, F., II, S., CORDONCARDO, C., FRADET, Y. & MAYALL, B. 1994. Ha-ras codon 12 mutation in papillary tumors of the urinary-bladder - a retrospective study. Int J Oncol, 4, 85-90.
OOTTAMASATHIEN, S., WANG, Y., WILLIAMS, K., FRANCO, O. E., WILLS, M. L., THOMAS, J. C., SABA, K., SHARIF-AFSHAR, A. R., MAKARI, J. H., BHOWMICK, N. A., DEMARCO, R. T., HIPKENS, S., MAGNUSON, M., BROCK, J. W., 3RD, HAYWARD, S. W., POPE, J. C. T. & MATUSIK, R. J. 2007. Directed differentiation of embryonic stem cells into bladder tissue. Dev Biol, 304, 556-66.
OZAKI, K., SUKATA, T., YAMAMOTO, S., UWAGAWA, S., SEKI, T., KAWASAKI, H., YOSHITAKE, A., WANIBUCHI, H., KOIDE, A., MORI, Y. & FUKUSHIMA, S. 1998. High susceptibility of p53(+/-) knockout mice in N-butyl-N-(4-
References 270
hydroxybutyl)nitrosamine urinary bladder carcinogenesis and lack of frequent mutation in residual allele. Cancer Res, 58, 3806-11.
PARKIN, D. M. 2011. 2. Tobacco-attributable cancer burden in the UK in 2010. Br J Cancer, 105 Suppl 2, S6-S13.
PARKIN, D. M., BRAY, F., FERLAY, J. & PISANI, P. 2005. Global cancer statistics, 2002. CA Cancer J Clin, 55, 74-108.
PATEL, A. R., CHAN, E. S., HANSEL, D. E., POWELL, C. T., HESTON, W. D. & LARCHIAN, W. A. 2010. Transabdominal micro-ultrasound imaging of bladder cancer in a mouse model: a validation study. Urology, 75, 799-804.
PIGNON, J. C., GRISANZIO, C., GENG, Y., SONG, J., SHIVDASANI, R. A. & SIGNORETTI, S. 2013. p63-expressing cells are the stem cells of developing prostate, bladder, and colorectal epithelia. Proc Natl Acad Sci U S A, 110, 8105-10.
PLOUSSARD, G., SOLIMAN, H., DUBOSQ, F., MERIA, P., VERINE, J., DESGRAND-CHAMPS, F., DETHE, H. & MONGIAT-ARTUS, P. 2011. The prognostic value of FGFR3 mutational status for disease recurrence and progression depends on allelic losses at 9p22. Am J Cancer Res, 1, 498-507.
POLLOCK, P. M., GARTSIDE, M. G., DEJEZA, L. C., POWELL, M. A., MALLON, M. A., DAVIES, H., MOHAMMADI, M., FUTREAL, P. A., STRATTON, M. R., TRENT, J. M. & GOODFELLOW, P. J. 2007. Frequent activating FGFR2 mutations in endometrial carcinomas parallel germline mutations associated with craniosynostosis and skeletal dysplasia syndromes. Oncogene, 26, 7158-62.
POWERS, C. J., MCLESKEY, S. W. & WELLSTEIN, A. 2000. Fibroblast growth factors, their receptors and signaling. Endocr Relat Cancer, 7, 165-97.
PROST, S., SHEAHAN, S., RANNIE, D. & HARRISON, D. J. 2001. Adenovirus-mediated Cre deletion of floxed sequences in primary mouse cells is an efficient alternative for studies of gene deletion. Nucleic Acids Res, 29, E80.
PUNYAVORAVUT, V. & NELSON, S. D. 1999. Diffuse bony metastasis from transitional cell carcinoma of urinary bladder: a case report and review of literature. J Med Assoc Thai, 82, 839-43.
PUZIO-KUTER, A. M., CASTILLO-MARTIN, M., KINKADE, C. W., WANG, X., SHEN, T. H., MATOS, T., SHEN, M. M., CORDON-CARDO, C. & ABATE-SHEN, C. 2009. Inactivation of p53 and Pten promotes invasive bladder cancer. Genes Dev, 23, 675-80.
QING, J., DU, X., CHEN, Y., CHAN, P., LI, H., WU, P., MARSTERS, S., STAWICKI, S., TIEN, J., TOTPAL, K., ROSS, S., STINSON, S., DORNAN, D., FRENCH, D., WANG, Q. R., STEPHAN, J. P., WU, Y., WIESMANN, C. & ASHKENAZI, A. 2009. Antibody-based targeting of FGFR3 in bladder carcinoma and t(4;14)-positive multiple myeloma in mice. J Clin Invest, 119, 1216-29.
REDDY, E. P., REYNOLDS, R. K., SANTOS, E. & BARBACID, M. 1982. A point mutation is responsible for the acquisition of transforming properties by the T24 human bladder carcinoma oncogene. Nature, 300, 149-52.
REYA, T. & CLEVERS, H. 2005. Wnt signalling in stem cells and cancer. Nature, 434, 843-50.
ROIDL, A., FOO, P., WONG, W., MANN, C., BECHTOLD, S., BERGER, H. J., STREIT, S., RUHE, J. E., HART, S., ULLRICH, A. & HO, H. K. 2010. The FGFR4 Y367C mutant is a dominant oncogene in MDA-MB453 breast cancer cells. Oncogene, 29, 1543-52.

References 271
ROMANO, R. A., ORTT, K., BIRKAYA, B., SMALLEY, K. & SINHA, S. 2009. An active role of the DeltaN isoform of p63 in regulating basal keratin genes K5 and K14 and directing epidermal cell fate. PLoS One, 4, e5623.
ROOS, W. P. & KAINA, B. 2006. DNA damage-induced cell death by apoptosis. Trends Mol Med, 12, 440-50.
ROSS, R. L., ASKHAM, J. M. & KNOWLES, M. A. 2013. PIK3CA mutation spectrum in urothelial carcinoma reflects cell context-dependent signaling and phenotypic outputs. Oncogene, 32, 768-76.
RUSSELL, T. D., FISCHER, A., BEEMAN, N. E., FREED, E. F., NEVILLE, M. C. & SCHAACK, J. 2003. Transduction of the mammary epithelium with adenovirus vectors in vivo. J Virol, 77, 5801-9.
SAAM, J. R. & GORDON, J. I. 1999. Inducible gene knockouts in the small intestinal and colonic epithelium. J Biol Chem, 274, 38071-82.
SAHADEVAN, K., DARBY, S., LEUNG, H. Y., MATHERS, M. E., ROBSON, C. N. & GNANAPRAGASAM, V. J. 2007. Selective over-expression of fibroblast growth factor receptors 1 and 4 in clinical prostate cancer. J Pathol, 213, 82-90.
SAID, N., FRIERSON, H. F., SANCHEZ-CARBAYO, M., BREKKEN, R. A. & THEODORESCU, D. 2013. Loss of SPARC in bladder cancer enhances carcinogenesis and progression. J Clin Invest, 123, 4089.
SAMUELSON, A. V., NARITA, M., CHAN, H. M., JIN, J., DE STANCHINA, E., MCCURRACH, M. E., FUCHS, M., LIVINGSTON, D. M. & LOWE, S. W. 2005. p400 is required for E1A to promote apoptosis. J Biol Chem, 280, 21915-23.
SANDILANDS, E., AKBARZADEH, S., VECCHIONE, A., MCEWAN, D. G., FRAME, M. C. & HEATH, J. K. 2007. Src kinase modulates the activation, transport and signalling dynamics of fibroblast growth factor receptors. EMBO Rep, 8, 1162-9.
SANGAR, V. K., RAGAVAN, N., MATANHELIA, S. S., WATSON, M. W. & BLADES, R. A. 2005. The economic consequences of prostate and bladder cancer in the UK. BJU Int, 95, 59-63.
SATO, T., VRIES, R. G., SNIPPERT, H. J., VAN DE WETERING, M., BARKER, N., STANGE, D. E., VAN ES, J. H., ABO, A., KUJALA, P., PETERS, P. J. & CLEVERS, H. 2009. Single Lgr5 stem cells build crypt-villus structures in vitro without a mesenchymal niche. Nature, 459, 262-5.
SAVAGNER, P., VALLES, A. M., JOUANNEAU, J., YAMADA, K. M. & THIERY, J. P. 1994. Alternative splicing in fibroblast growth factor receptor 2 is associated with induced epithelial-mesenchymal transition in rat bladder carcinoma cells. Mol Biol Cell, 5, 851-62.
SAYAN, A. E., D’ANGELO, B., SAYAN, B. S., TUCCI, P., CIMINI, A., CERÙ, M. P., KNIGHT, R. A. & MELINO, G. 2010. p73 and p63 regulate the expression of fibroblast growth factor receptor 3. Biochemical and Biophysical Research Communications, 394, 824-828.
SCHMALHOFER, O., BRABLETZ, S. & BRABLETZ, T. 2009. E-cadherin, beta-catenin, and ZEB1 in malignant progression of cancer. Cancer Metastasis Rev, 28, 151-66.
SCHMITZ-DRAGER, B. J., GOEBELL, P. J., EBERT, T. & FRADET, Y. 2000. p53 immunohistochemistry as a prognostic marker in bladder cancer. Playground for urology scientists? Eur Urol, 38, 691-9;discussion 700.
SCOTET, E. & HOUSSAINT, E. 1995. The choice between alternative IIIb and IIIc exons of the FGFR-3 gene is not strictly tissue-specific. Biochim Biophys Acta, 1264, 238-42.

References 272
SEAGER, C., PUZIO-KUTER, A. M., CORDON-CARDO, C., MCKIERNAN, J. & ABATE-SHEN, C. 2010. Mouse Models of Human Bladder Cancer as a Tool for Drug Discovery.
SHARIAT, S. F., KIM, J., RAPTIDIS, G., AYALA, G. E. & LERNER, S. P. 2003. Association of p53 and p21 expression with clinical outcome in patients with carcinoma in situ of the urinary bladder. Urology, 61, 1140-5.
SHIN, K., LEE, J., GUO, N., KIM, J., LIM, A., QU, L., MYSOREKAR, I. U. & BEACHY, P. A. 2011. Hedgehog/Wnt feedback supports regenerative proliferation of epithelial stem cells in bladder. Nature, 472, 110-4.
SHINAGARE, A. B., RAMAIYA, N. H., JAGANNATHAN, J. P., FENNESSY, F. M., TAPLIN, M. E. & VAN DEN ABBEELE, A. D. 2011. Metastatic pattern of bladder cancer: correlation with the characteristics of the primary tumor. AJR Am J Roentgenol, 196, 117-22.
SIDRANSKY, D., FROST, P., VON ESCHENBACH, A., OYASU, R., PREISINGER, A. C. & VOGELSTEIN, B. 1992. Clonal origin bladder cancer. N Engl J Med, 326, 737-40.
SIDRANSKY, D., VON ESCHENBACH, A., TSAI, Y. C., JONES, P., SUMMERHAYES, I., MARSHALL, F., PAUL, M., GREEN, P., HAMILTON, S. R., FROST, P. & ET AL. 1991. Identification of p53 gene mutations in bladder cancers and urine samples. Science, 252, 706-9.
SIMON, R., ELTZE, E., SCHAFER, K. L., BURGER, H., SEMJONOW, A., HERTLE, L., DOCKHORN-DWORNICZAK, B., TERPE, H. J. & BOCKER, W. 2001. Cytogenetic analysis of multifocal bladder cancer supports a monoclonal origin and intraepithelial spread of tumor cells. Cancer Res, 61, 355-62.
SIMONEAU, M., LARUE, H., ABOULKASSIM, T. O., MEYER, F., MOORE, L. & FRADET, Y. 2000. Chromosome 9 deletions and recurrence of superficial bladder cancer: identification of four regions of prognostic interest. Oncogene, 19, 6317-23.
SJODAHL, G., LAUSS, M., LOVGREN, K., CHEBIL, G., GUDJONSSON, S., VEERLA, S., PATSCHAN, O., AINE, M., FERNO, M., RINGNER, M., MANSSON, W., LIEDBERG, F., LINDGREN, D. & HOGLUND, M. 2012. A molecular taxonomy for urothelial carcinoma. Clin Cancer Res, 18, 3377-86.
SLEEMAN, M., FRASER, J., MCDONALD, M., YUAN, S., WHITE, D., GRANDISON, P., KUMBLE, K., WATSON, J. D. & MURISON, J. G. 2001. Identification of a new fibroblast growth factor receptor, FGFR5. Gene, 271, 171-82.
SOLOWAY, M. S. 1977. Intravesical and systemic chemotherapy of murine bladder cancer. Cancer Res, 37, 2918-29.
SONVILLA, G., ALLERSTORFER, S., HEINZLE, C., STATTNER, S., KARNER, J., KLIMPFINGER, M., WRBA, F., FISCHER, H., GAUGLHOFER, C., SPIEGL-KREINECKER, S., GRASL-KRAUPP, B., HOLZMANN, K., GRUSCH, M., BERGER, W. & MARIAN, B. 2010. Fibroblast growth factor receptor 3-IIIc mediates colorectal cancer growth and migration. Br J Cancer, 102, 1145-56.
SPRUCK, C. H., 3RD, OHNESEIT, P. F., GONZALEZ-ZULUETA, M., ESRIG, D., MIYAO, N., TSAI, Y. C., LERNER, S. P., SCHMUTTE, C., YANG, A. S., COTE, R. & ET AL. 1994. Two molecular pathways to transitional cell carcinoma of the bladder. Cancer Res, 54, 784-8.
STARR, T. K., ALLAEI, R., SILVERSTEIN, K. A., STAGGS, R. A., SARVER, A. L., BERGEMANN, T. L., GUPTA, M., O'SULLIVAN, M. G., MATISE, I., DUPUY, A. J., COLLIER, L. S., POWERS, S., OBERG, A. L., ASMANN, Y. W., THIBODEAU, S. N., TESSAROLLO, L., COPELAND, N. G., JENKINS, N. A., CORMIER, R. T. & LARGAESPADA, D. A. 2009. A transposon-based genetic

References 273
screen in mice identifies genes altered in colorectal cancer. Science, 323, 1747-50.
STEIN, J. P., GINSBERG, D. A., GROSSFELD, G. D., CHATTERJEE, S. J., ESRIG, D., DICKINSON, M. G., GROSHEN, S., TAYLOR, C. R., JONES, P. A., SKINNER, D. G. & COTE, R. J. 1998. Effect of p21WAF1/CIP1 expression on tumor progression in bladder cancer. J Natl Cancer Inst, 90, 1072-9.
STEINBERG, G. D., BRENDLER, C. B., SQUIRE, R. A. & ISAACS, J. T. 1991. Experimental intravesical therapy for superficial transitional cell carcinoma in a rat bladder tumor model. J Urol, 145, 647-53.
STEWART, F. A., DENEKAMP, J. & HIRST, D. G. 1980. Proliferation kinetics of the mouse bladder after irradiation. Cell Tissue Kinet, 13, 75-89.
STOEHR, R., HARTMANN, A., HIENDLMEYER, E., MURLE, K., WIELAND, W. & KNUECHEL, R. 2000. Oligoclonality of early lesions of the urothelium as determined by microdissection-supported genetic analysis. Pathobiology, 68, 165-72.
SUMMERHAYES, I. C. & FRANKS, L. M. 1979. Effects of donor age on neoplastic transformation of adult mouse bladder epithelium in vitro. J Natl Cancer Inst, 62, 1017-23.
SUNG, S. Y., HSIEH, C. L., WU, D., CHUNG, L. W. & JOHNSTONE, P. A. 2007. Tumor microenvironment promotes cancer progression, metastasis, and therapeutic resistance. Curr Probl Cancer, 31, 36-100.
SYLVESTER, R. J., VAN DER MEIJDEN, A. P., OOSTERLINCK, W., WITJES, J. A., BOUFFIOUX, C., DENIS, L., NEWLING, D. W. & KURTH, K. 2006. Predicting recurrence and progression in individual patients with stage Ta T1 bladder cancer using EORTC risk tables: a combined analysis of 2596 patients from seven EORTC trials. Eur Urol, 49, 466-5; discussion 475-7.
TAKAHASHI, T., HABUCHI, T., KAKEHI, Y., MITSUMORI, K., AKAO, T., TERACHI, T. & YOSHIDA, O. 1998. Clonal and chronological genetic analysis of multifocal cancers of the bladder and upper urinary tract. Cancer Res, 58, 5835-41.
TAVORMINA, P. L., SHIANG, R., THOMPSON, L. M., ZHU, Y. Z., WILKIN, D. J., LACHMAN, R. S., WILCOX, W. R., RIMOIN, D. L., COHN, D. H. & WASMUTH, J. J. 1995. Thanatophoric dysplasia (types I and II) caused by distinct mutations in fibroblast growth factor receptor 3. Nat Genet, 9, 321-8.
TAYLOR, J. G. T., CHEUK, A. T., TSANG, P. S., CHUNG, J. Y., SONG, Y. K., DESAI, K., YU, Y., CHEN, Q. R., SHAH, K., YOUNGBLOOD, V., FANG, J., KIM, S. Y., YEUNG, C., HELMAN, L. J., MENDOZA, A., NGO, V., STAUDT, L. M., WEI, J. S., KHANNA, C., CATCHPOOLE, D., QUALMAN, S. J., HEWITT, S. M., MERLINO, G., CHANOCK, S. J. & KHAN, J. 2009. Identification of FGFR4-activating mutations in human rhabdomyosarcomas that promote metastasis in xenotransplanted models. J Clin Invest, 119, 3395-407.
THEODOROU, V., BOER, M., WEIGELT, B., JONKERS, J., VAN DER VALK, M. & HILKENS, J. 2004. Fgf10 is an oncogene activated by MMTV insertional mutagenesis in mouse mammary tumors and overexpressed in a subset of human breast carcinomas. Oncogene, 23, 6047-55.
THIERY, J. P. 2002. Epithelial-mesenchymal transitions in tumour progression. Nat Rev Cancer, 2, 442-54.
TIMPSON, P., MCGHEE, E. J., ERAMI, Z., NOBIS, M., QUINN, J. A., EDWARD, M. & ANDERSON, K. I. 2011. Organotypic collagen I assay: a malleable platform to assess cell behaviour in a 3-dimensional context. J Vis Exp, e3089.
TLSTY, T. D. & COUSSENS, L. M. 2006. Tumor stroma and regulation of cancer development. Annu Rev Pathol, 1, 119-50.
References 274
TOMLINSON, D. C., BALDO, O., HARNDEN, P. & KNOWLES, M. A. 2007a. FGFR3 protein expression and its relationship to mutation status and prognostic variables in bladder cancer. J Pathol, 213, 91-8.
TOMLINSON, D. C., BAXTER, E. W., LOADMAN, P. M., HULL, M. A. & KNOWLES, M. A. 2012. FGFR1-induced epithelial to mesenchymal transition through MAPK/PLCgamma/COX-2-mediated mechanisms. PLoS One, 7, e38972.
TOMLINSON, D. C., HURST, C. D. & KNOWLES, M. A. 2007b. Knockdown by shRNA identifies S249C mutant FGFR3 as a potential therapeutic target in bladder cancer. Oncogene, 26, 5889-99.
TOMLINSON, D. C., L'HOTE, C. G., KENNEDY, W., PITT, E. & KNOWLES, M. A. 2005. Alternative splicing of fibroblast growth factor receptor 3 produces a secreted isoform that inhibits fibroblast growth factor-induced proliferation and is repressed in urothelial carcinoma cell lines. Cancer Res, 65, 10441-9.
TOMLINSON, D. C., LAMONT, F. R., SHNYDER, S. D. & KNOWLES, M. A. 2009. Fibroblast growth factor receptor 1 promotes proliferation and survival via activation of the mitogen-activated protein kinase pathway in bladder cancer. Cancer Res, 69, 4613-20.
TONG, G. X., YEE, H., CHIRIBOGA, L., HERNANDEZ, O. & WAISMAN, J. 2005. Fascin-1 expression in papillary and invasive urothelial carcinomas of the urinary bladder. Hum Pathol, 36, 741-6.
TOYODA, T., AKAGI, J., CHO, Y. M., MIZUTA, Y., ONAMI, S., SUZUKI, I. & OGAWA, K. 2013. Detection of gamma-H2AX, a Biomarker for DNA Double-strand Breaks, in Urinary Bladders of N -Butyl- N -(4-Hydroxybutyl)-Nitrosamine-Treated Rats. J Toxicol Pathol, 26, 215-21.
TSURUTA, H. 2006. Hyperplasia and Carcinomas in Pten-Deficient Mice and Reduced PTEN Protein in Human Bladder Cancer Patients. Cancer Research, 66, 8389-8396.
TUMBAR, T. 2004. Defining the Epithelial Stem Cell Niche in Skin. Science, 303, 359-363.
TURNER, N. & GROSE, R. 2010. Fibroblast growth factor signalling: from development to cancer. Nat Rev Cancer, 10, 116-29.
TURO, R., HARNDEN, P., THYGESEN, H., FLEISCHMANN, A., THALMANN, G. N., SEILER, R., CROSS, W. R. & KNOWLES, M. A. 2014. FGFR3 expression in primary invasive bladder cancers and matched lymph node metastases. J Urol.
UREN, A. G., MIKKERS, H., KOOL, J., VAN DER WEYDEN, L., LUND, A. H., WILSON, C. H., RANCE, R., JONKERS, J., VAN LOHUIZEN, M., BERNS, A. & ADAMS, D. J. 2009. A high-throughput splinkerette-PCR method for the isolation and sequencing of retroviral insertion sites. Nat Protoc, 4, 789-98.
VAN DER FLIER, L. G. & CLEVERS, H. 2009. Stem cells, self-renewal, and differentiation in the intestinal epithelium. Annu Rev Physiol, 71, 241-60.
VAN RHIJN, B. W., LURKIN, I., CHOPIN, D. K., KIRKELS, W. J., THIERY, J. P., VAN DER KWAST, T. H., RADVANYI, F. & ZWARTHOFF, E. C. 2003. Combined microsatellite and FGFR3 mutation analysis enables a highly sensitive detection of urothelial cell carcinoma in voided urine. Clin Cancer Res, 9, 257-63.
VAN RHIJN, B. W., LURKIN, I., RADVANYI, F., KIRKELS, W. J., VAN DER KWAST, T. H. & ZWARTHOFF, E. C. 2001. The fibroblast growth factor receptor 3 (FGFR3) mutation is a strong indicator of superficial bladder cancer with low recurrence rate. Cancer Res, 61, 1265-8.
References 275
VAN RHIJN, B. W., MONTIRONI, R., ZWARTHOFF, E. C., JOBSIS, A. C. & VAN DER KWAST, T. H. 2002. Frequent FGFR3 mutations in urothelial papilloma. J Pathol, 198, 245-51.
VAN RHIJN, B. W., VAN DER KWAST, T. H., LIU, L., FLESHNER, N. E., BOSTROM, P. J., VIS, A. N., ALKHATEEB, S. S., BANGMA, C. H., JEWETT, M. A., ZWARTHOFF, E. C., ZLOTTA, A. R. & BAPAT, B. 2012. The FGFR3 mutation is related to favorable pT1 bladder cancer. J Urol, 187, 310-4.
VAN RHIJN, B. W., VAN DER KWAST, T. H., VIS, A. N., KIRKELS, W. J., BOEVE, E. R., JOBSIS, A. C. & ZWARTHOFF, E. C. 2004. FGFR3 and P53 characterize alternative genetic pathways in the pathogenesis of urothelial cell carcinoma. Cancer Res, 64, 1911-4.
VERANIC, P., ROMIH, R. & JEZERNIK, K. 2004. What determines differentiation of urothelial umbrella cells? Eur J Cell Biol, 83, 27-34.
VOGELSTEIN, B., LANE, D. & LEVINE, A. J. 2000. Surfing the p53 network. Nature, 408, 307-10.
VON DER MAASE, H., HANSEN, S. W., ROBERTS, J. T., DOGLIOTTI, L., OLIVER, T., MOORE, M. J., BODROGI, I., ALBERS, P., KNUTH, A., LIPPERT, C. M., KERBRAT, P., SANCHEZ ROVIRA, P., WERSALL, P., CLEALL, S. P., ROYCHOWDHURY, D. F., TOMLIN, I., VISSEREN-GRUL, C. M. & CONTE, P. F. 2000. Gemcitabine and cisplatin versus methotrexate, vinblastine, doxorubicin, and cisplatin in advanced or metastatic bladder cancer: results of a large, randomized, multinational, multicenter, phase III study. J Clin Oncol, 18, 3068-77.
VON DER MAASE, H., SENGELOV, L., ROBERTS, J. T., RICCI, S., DOGLIOTTI, L., OLIVER, T., MOORE, M. J., ZIMMERMANN, A. & ARNING, M. 2005. Long-term survival results of a randomized trial comparing gemcitabine plus cisplatin, with methotrexate, vinblastine, doxorubicin, plus cisplatin in patients with bladder cancer. J Clin Oncol, 23, 4602-8.
WALLERAND, H., BAKKAR, A. A., DE MEDINA, S. G., PAIRON, J. C., YANG, Y. C., VORDOS, D., BITTARD, H., FAUCONNET, S., KOUYOUMDJIAN, J. C., JAURAND, M. C., ZHANG, Z. F., RADVANYI, F., THIERY, J. P. & CHOPIN, D. K. 2005. Mutations in TP53, but not FGFR3, in urothelial cell carcinoma of the bladder are influenced by smoking: contribution of exogenous versus endogenous carcinogens. Carcinogenesis, 26, 177-84.
WANG, D. S., RIEGER-CHRIST, K., LATINI, J. M., MOINZADEH, A., STOFFEL, J., PEZZA, J. A., SAINI, K., LIBERTINO, J. A. & SUMMERHAYES, I. C. 2000. Molecular analysis of PTEN and MXI1 in primary bladder carcinoma. Int J Cancer, 88, 620-5.
WANG, H., LEAV, I., IBARAGI, S., WEGNER, M., HU, G. F., LU, M. L., BALK, S. P. & YUAN, X. 2008. SOX9 is expressed in human fetal prostate epithelium and enhances prostate cancer invasion. Cancer Res, 68, 1625-30.
WANG, H., XIE, H., ZHANG, H., DAS, S. K. & DEY, S. K. 2006. Conditional gene recombination by adenovirus-driven Cre in the mouse uterus. Genesis, 44, 51-6.
WATANABE, T., SHINOHARA, N., SAZAWA, A., HARABAYASHI, T., OGISO, Y., KOYANAGI, T., TAKIGUCHI, M., HASHIMOTO, A., KUZUMAKI, N., YAMASHITA, M., TANAKA, M., GROSSMAN, H. B. & BENEDICT, W. F. 2000. An improved intravesical model using human bladder cancer cell lines to optimize gene and other therapies. Cancer Gene Ther, 7, 1575-80.
WATERSTON, R. H., LINDBLAD-TOH, K., BIRNEY, E., ROGERS, J., ABRIL, J. F., AGARWAL, P., AGARWALA, R., AINSCOUGH, R., ALEXANDERSSON, M., AN, P., ANTONARAKIS, S. E., ATTWOOD, J., BAERTSCH, R., BAILEY, J., BARLOW, K., BECK, S., BERRY, E., BIRREN, B., BLOOM, T., BORK, P.,
References 276
BOTCHERBY, M., BRAY, N., BRENT, M. R., BROWN, D. G., BROWN, S. D., BULT, C., BURTON, J., BUTLER, J., CAMPBELL, R. D., CARNINCI, P., CAWLEY, S., CHIAROMONTE, F., CHINWALLA, A. T., CHURCH, D. M., CLAMP, M., CLEE, C., COLLINS, F. S., COOK, L. L., COPLEY, R. R., COULSON, A., COURONNE, O., CUFF, J., CURWEN, V., CUTTS, T., DALY, M., DAVID, R., DAVIES, J., DELEHAUNTY, K. D., DERI, J., DERMITZAKIS, E. T., DEWEY, C., DICKENS, N. J., DIEKHANS, M., DODGE, S., DUBCHAK, I., DUNN, D. M., EDDY, S. R., ELNITSKI, L., EMES, R. D., ESWARA, P., EYRAS, E., FELSENFELD, A., FEWELL, G. A., FLICEK, P., FOLEY, K., FRANKEL, W. N., FULTON, L. A., FULTON, R. S., FUREY, T. S., GAGE, D., GIBBS, R. A., GLUSMAN, G., GNERRE, S., GOLDMAN, N., GOODSTADT, L., GRAFHAM, D., GRAVES, T. A., GREEN, E. D., GREGORY, S., GUIGO, R., GUYER, M., HARDISON, R. C., HAUSSLER, D., HAYASHIZAKI, Y., HILLIER, L. W., HINRICHS, A., HLAVINA, W., HOLZER, T., HSU, F., HUA, A., HUBBARD, T., HUNT, A., JACKSON, I., JAFFE, D. B., JOHNSON, L. S., JONES, M., JONES, T. A., JOY, A., KAMAL, M., KARLSSON, E. K., et al. 2002. Initial sequencing and comparative analysis of the mouse genome. Nature, 420, 520-62.
WEINER, L. P. 2008. Definitions and criteria for stem cells. Methods Mol Biol, 438, 3-8.
WESCHE, J., HAGLUND, K. & HAUGSTEN, E. M. 2011. Fibroblast growth factors and their receptors in cancer. Biochem J, 437, 199-213.
WILLIAMS, P. D., LEE, J. K. & THEODORESCU, D. 2008. Molecular credentialing of rodent bladder carcinogenesis models. Neoplasia, 10, 838-46.
WU, X., OBATA, T., KHAN, Q., HIGHSHAW, R. A., DE VERE WHITE, R. & SWEENEY, C. 2004. The phosphatidylinositol-3 kinase pathway regulates bladder cancer cell invasion. BJU Int, 93, 143-50.
XIN, L., LUKACS, R. U., LAWSON, D. A., CHENG, D. & WITTE, O. N. 2007. Self-renewal and multilineage differentiation in vitro from murine prostate stem cells. Stem Cells, 25, 2760-9.
YAMAMOTO, S., CHEN, T., MURAI, T., MORI, S., MORIMURA, K., OOHARA, T., MAKINO, S., TATEMATSU, M., WANIBUCHI, H. & FUKUSHIMA, S. 1997. Genetic instability and p53 mutations in metastatic foci of mouse urinary bladder carcinomas induced by N-butyl-N-(4-hydroxybutyl)nitrosamine. Carcinogenesis, 18, 1877-82.
YAMAMOTO, S., MASUI, T., MURAI, T., MORI, S., OOHARA, T., MAKINO, S., FUKUSHIMA, S. & TATEMATSU, M. 1995. Frequent mutations of the p53 gene and infrequent H- and K-ras mutations in urinary bladder carcinomas of NON/Shi mice treated with N-butyl-N-(4-hydroxybutyl)nitrosamine. Carcinogenesis, 16, 2363-8.
YAMAMOTO, S., TATEMATSU, M., YAMAMOTO, M., FUKAMI, H. & FUKUSHIMA, S. 1998. Clonal analysis of urothelial carcinomas in C3H/HeN<-->BALB/c chimeric mice treated with N-butyl-N-(4-hydroxybutyl)nitrosamine. Carcinogenesis, 19, 855-60.
YANG, X., LA ROSA, F. G., GENOVA, E. E., HUBER, K., SCHAACK, J., DEGREGORI, J., SERKOVA, N. J., LI, Y., SU, L. J., KESSLER, E. & FLAIG, T. W. 2013. Simultaneous Activation of Kras and Inactivation of p53 Induces Soft Tissue Sarcoma and Bladder Urothelial Hyperplasia. PLoS One, 8, e74809.
YAO, R., LEMON, W. J., WANG, Y., GRUBBS, C. J., LUBET, R. A. & YOU, M. 2004. Altered gene expression profile in mouse bladder cancers induced by hydroxybutyl(butyl)nitrosamine. Neoplasia, 6, 569-77.
YOHN, N. L., BINGAMAN, C. N., DUMONT, A. L. & YOO, L. I. 2011. Phosphatidylinositol 3'-kinase, mTOR, and glycogen synthase kinase-3beta

References 277
mediated regulation of p21 in human urothelial carcinoma cells. BMC Urol, 11, 19.
YOO, L. I., LIU, D. W., LE VU, S., BRONSON, R. T., WU, H. & YUAN, J. 2006. Pten deficiency activates distinct downstream signaling pathways in a tissue-specific manner. Cancer Res, 66, 1929-39.
ZAYED, H., IZSVAK, Z., KHARE, D., HEINEMANN, U. & IVICS, Z. 2003. The DNA-bending protein HMGB1 is a cellular cofactor of Sleeping Beauty transposition. Nucleic Acids Res, 31, 2313-22.
ZHANG, Y., WANG, Z., YU, J., SHI, J., WANG, C., FU, W., CHEN, Z. & YANG, J. 2012. Cancer stem-like cells contribute to cisplatin resistance and progression in bladder cancer. Cancer Lett, 322, 70-7.
ZHANG, Z. T., PAK, J., HUANG, H. Y., SHAPIRO, E., SUN, T. T., PELLICER, A. & WU, X. R. 2001. Role of Ha-ras activation in superficial papillary pathway of urothelial tumor formation. Oncogene, 20, 1973-80.
ZHANG, Z. T., PAK, J., SHAPIRO, E., SUN, T. T. & WU, X. R. 1999. Urothelium-specific expression of an oncogene in transgenic mice induced the formation of carcinoma in situ and invasive transitional cell carcinoma. Cancer Res, 59, 3512-7.
ZHU, X., KANAI, Y., SAITO, A., KONDO, Y. & HIROHASHI, S. 2000. Aberrant expression of beta-catenin and mutation of exon 3 of the beta-catenin gene in renal and urothelial carcinomas. Pathol Int, 50, 945-52.
ZIEGER, K., DYRSKJOT, L., WIUF, C., JENSEN, J. L., ANDERSEN, C. L., JENSEN, K. M. & ORNTOFT, T. F. 2005. Role of activating fibroblast growth factor receptor 3 mutations in the development of bladder tumors. Clin Cancer Res, 11, 7709-19.
ZIEGER, K., WOLF, H., OLSEN, P. R. & HOJGAARD, K. 2000. Long-term follow-up of noninvasive bladder tumours (stage Ta): recurrence and progression. BJU Int, 85, 824-8.

Appendices 278
Appendices
Appendix 1 – Publications
FOTH M, AHMAD I, VAN RHIJN BW, VAN DER KWAST T, BERGMAN AM, KING L,
RIDGWAY R, LEUNG HY, FRASER S, SANSOM OJ, IWATA T. 2014. Fibroblast growth
factor receptor 3 activation plays a causative role in urothelial cancer
pathogenesis in cooperation with Pten loss in mice. J Pathol, Epub 2014 Mar 31.
doi: 10.1002/path.4334.