The Role of Education in Agricultural Productivity: The ...
98
Website www.ehl.lu.se Master programme in Economic Growth, Innovation and Spatial Dynamics The Role of Education in Agricultural Productivity: The Case of Village Institutes in Turkey, 1940-1966 Ayşegül Girgin [email protected] Abstract: This study examines the relationship between education and agricultural productivity through the Turkish phenomenon of Village Institutes (VIs). Having emerged as the fourth step of the agrarian reform in 1937, the VIs provided a 5 year secondary education and 3 optional years of higher education to successful graduates of 5 year elementary village schools. Based on the principles of “learning by doing”, the VIs’ intensive work education curriculum was aimed at training village teachers who would then diffuse their knowledge to the rural in order to achieve a nation- wide growth in agricultural productivity. The results of the study show that a statistically significant positive relationship exists between the number of VI- graduate teachers and per area wheat output at province level. Furthermore, a positive and significant relationship is traced between the number of VI-graduate teachers and literacy rates. Nevertheless, a number of weaknesses pertaining to the analysis methods leave a variety of options to improve the results of this study. Key words: Education, agricultural productivity, human capital, Village Institutes, Turkey EKHR 23 Master thesis (30 credits ECTS) June 2011 Supervisor: Jonas Ljungberg, Professor Examiner: Anders Nilsson, Professor
Transcript of The Role of Education in Agricultural Productivity: The ...
Website www.ehl.lu.se
Master programme in Economic Growth, Innovation and Spatial Dynamics
The Role of Education in Agricultural Productivity:
The Case of Village Institutes in Turkey, 1940-1966
Ayşegül Girgin
Abstract: This study examines the relationship between education and agricultural productivity through the Turkish phenomenon of Village Institutes (VIs). Having emerged as the fourth step of the agrarian reform in 1937, the VIs provided a 5 year secondary education and 3 optional years of higher education to successful graduates of 5 year elementary village schools. Based on the principles of “learning by doing”, the VIs’ intensive work education curriculum was aimed at training village teachers who would then diffuse their knowledge to the rural in order to achieve a nation-wide growth in agricultural productivity. The results of the study show that a statistically significant positive relationship exists between the number of VI-graduate teachers and per area wheat output at province level. Furthermore, a positive and significant relationship is traced between the number of VI-graduate teachers and literacy rates. Nevertheless, a number of weaknesses pertaining to the analysis methods leave a variety of options to improve the results of this study.
Key words: Education, agricultural productivity, human capital, Village Institutes, Turkey
EKHR 23 Master thesis (30 credits ECTS) June 2011 Supervisor: Jonas Ljungberg, Professor Examiner: Anders Nilsson, Professor
ACKNOWLEDGEMENTS
Having completed my thesis, I would like to thank several individuals and organizations that
have provided direct and indirect assistance at various stages of this study. I would like to start
by thanking my friend, Barış Alpertan, who inspired me about the Turkish Village Institutes
phenomenon and made me develop a serious interest in the topic. Second, the staff at the
Statistics Division of the Turkish State Meteorological Service and the Turkish Statistical
Institute (TurkStat) Library for delivering data that was not available online. Especially İrfan
Kocadağ, Ferhat Irmak and Filiz Özkan from the TurkStat Library deserve recognition for their
efforts above my expectations to provide me with the necessary data. Third, I would like to thank
my supervisor, Jonas Ljungberg, Professor of Economic History in Lund University for his
sincere assistance. His guidance and criticisms have been immensely valuable.
Finally, I would like to thank everyone who encouraged me to overcome bottlenecks. Among
these, I owe special thanks to Thomas Ring for proofreading my paper but even more for his
never ending efforts to motivate me and being there for me at times of stress; Ezgi Baran for
establishing my first contact with TurkStat; Vilma Stasiute for her advice on econometrics;
Roberto Cerrato for his constant belief in me; and my family for their support.
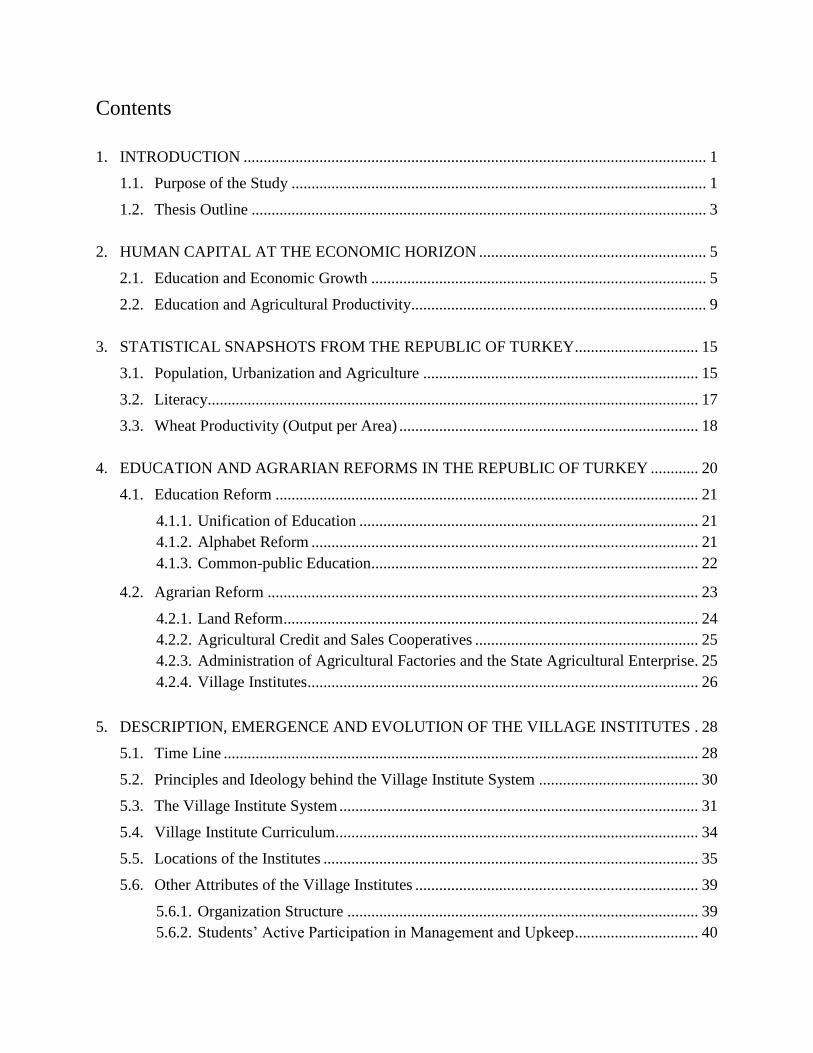
Contents
1. INTRODUCTION .................................................................................................................... 1
1.1. Purpose of the Study ........................................................................................................ 1
1.2. Thesis Outline .................................................................................................................. 3
2. HUMAN CAPITAL AT THE ECONOMIC HORIZON ......................................................... 5
2.1. Education and Economic Growth .................................................................................... 5
2.2. Education and Agricultural Productivity.......................................................................... 9
3. STATISTICAL SNAPSHOTS FROM THE REPUBLIC OF TURKEY............................... 15
3.1. Population, Urbanization and Agriculture ..................................................................... 15
3.2. Literacy........................................................................................................................... 17
3.3. Wheat Productivity (Output per Area) ........................................................................... 18
4. EDUCATION AND AGRARIAN REFORMS IN THE REPUBLIC OF TURKEY ............ 20
4.1. Education Reform .......................................................................................................... 21
4.1.1. Unification of Education ..................................................................................... 21
4.1.2. Alphabet Reform ................................................................................................. 21
4.1.3. Common-public Education .................................................................................. 22
4.2. Agrarian Reform ............................................................................................................ 23
4.2.1. Land Reform ........................................................................................................ 24
4.2.2. Agricultural Credit and Sales Cooperatives ........................................................ 25
4.2.3. Administration of Agricultural Factories and the State Agricultural Enterprise . 25
4.2.4. Village Institutes .................................................................................................. 26
5. DESCRIPTION, EMERGENCE AND EVOLUTION OF THE VILLAGE INSTITUTES . 28
5.1. Time Line ....................................................................................................................... 28
5.2. Principles and Ideology behind the Village Institute System ........................................ 30
5.3. The Village Institute System .......................................................................................... 31
5.4. Village Institute Curriculum........................................................................................... 34
5.5. Locations of the Institutes .............................................................................................. 35
5.6. Other Attributes of the Village Institutes ....................................................................... 39
5.6.1. Organization Structure ........................................................................................ 39
5.6.2. Students’ Active Participation in Management and Upkeep ............................... 40
5.6.3. Extra-curricular Activities ................................................................................... 41
5.7. Village Institutes of Higher Education ........................................................................... 41
5.8. Academic Literature on the Village Institutes ................................................................ 42
5.9. Counter-arguments on the Village Institutes .................................................................. 46
6. THE VILLAGE INSTITUTES’ INFLUENCE ...................................................................... 49
6.1. On the Economy ............................................................................................................. 49
6.2. On Agriculture................................................................................................................ 51
6.3. On Community Development ........................................................................................ 54
7. METHODOLOGY, DATA AND MEASURES .................................................................... 55
7.1. Choice of dimension....................................................................................................... 55
7.2. Data Sources ................................................................................................................... 56
7.3. Variable Descriptions ..................................................................................................... 57
7.4. Model Specification ....................................................................................................... 60
8. DATA ANALYSIS AND RESULTS ..................................................................................... 61
8.1. Modifying the Dataset .................................................................................................... 61
8.2. OLS Regression with per area wheat output (WY)........................................................ 62
8.2.1. Testing for Heteroscedasticity ............................................................................. 64
8.3. Simple Regression on Literacy Rate .............................................................................. 66
9. CONCLUSION AND EVALUATION .................................................................................. 69
9.1. Summary of Results ....................................................................................................... 69
9.2. Theory Implications ....................................................................................................... 70
9.3. Limitations / weaknesses of the Analysis ...................................................................... 71
9.3.1. Reliability of Data ............................................................................................... 71
9.3.2. Accuracy of the Estimations ................................................................................ 72
9.3.3. Limitations with the Time Dimension ................................................................. 72
9.3.4. Limitations of Linear Regression ........................................................................ 73
9.4. Ideas for further research................................................................................................ 74
10. APPENDICES ........................................................................................................................ 76
11. BIBLIOGRAPHY ................................................................................................................... 83
List of Tables
Table 1. Total population and urbanization level, Turkey, 1935-2000 ....................................................... 15
Table 2. Total population, urbanization level and number of provinces in Turkey in 1940 and 1945. ...... 36
Table 3. Population information on the locations of all 21 Village Institutes. ........................................... 37
Table 4. Linear regression results for Equation ( 1 )................................................................................... 62
Table 5. Linear regression results for Equation ( 2 )................................................................................... 63
Table 6. Linear regression results for Equation ( 3 )................................................................................... 64
Table 7. Model summary for White's test on Equation ( 2 ). ...................................................................... 66
Table 8. Regression results for Equation ( 4 ). ............................................................................................ 67
Table 9. Simple regression results for Equation ( 5 ). ................................................................................. 68
Table 10. Coefficients of variables in the multivariate and simple models. ............................................... 73
Table 11. Overall literacy and distribution of literacy by sex, Turkey, 1935-2000 .................................... 76
Table 12. Evolution of the Village Institutes from 1937 to 1954: Number of teachers, students and
institutes at national level. .......................................................................................................... 77
Table 13. Total number of village school teachers and number of those who have VI diplomas. (1939,
1946 and 1950) ........................................................................................................................... 77
Table 14. The Village Institute Education Program, 1943.......................................................................... 78
Table 15. Regression results for the model constructed for White's test on Equation ( 2 ), ....................... 79
Table 16. Number of tractors at province level and as national totals, Turkey, 1940-42, 1948 and 1964-66.
.................................................................................................................................................... 80
List of Charts
Chart 1. Total population and distribution of urban and rural population at national level, Turkey, 1927-
2000 .............................................................................................................................................. 16
Chart 2. Shares of sectors in Gross National Product, Turkey, 1923-2006 ................................................ 16
Chart 3. Overall literacy rate and distribution by sex, Turkey, 1935-2000................................................. 17
Chart 4. Coefficient of variation in province level literacy rates. ............................................................... 18
Chart 5. Output of wheat per hectare of area sown for wheat, Turkey, 1925-2007 .................................... 19
Chart 6. Coefficient of variation at province level for wheat output per area, Turkey, 1940-1942 and
1964-1966 .................................................................................................................................... 19
Ayşegül Girgin 1
1. INTRODUCTION
The role of human capital in productivity growth has been a topic of interest especially since the
middle of the twentieth century. Direct and indirect impacts of education have been
quantitatively analyzed through a number of studies ranging from area-specific to cross-country
contexts. This thesis is expected to contribute to the collective effort of understanding the role of
education by investigating a specific case from a phenomenon that is widely discussed
politically, sociologically and economically in the Republic of Turkey: The extent to which rural
revitalization and agricultural productivity growth have been facilitated by the Village Institutes
(VIs), which were 5-year middle schools located in rural areas and which aimed to “train
teachers as well as other professionals who were strongly needed in rural life, including
agricultural experts and midwives” (Uygun, 2007 cited in Uygun 2008, p. 302).
Measuring the full extent of this role requires considering a number of factors through which
economic growth can be amplified, demanding much more time and resources than what is
available for the task at hand. Narrowing down the focus is essential to any research; therefore it
will be this thesis’ objective to focus on the contribution of the Village Institutes of Turkey to the
nation’s wheat productivity.
1.1. Purpose of the Study
As stated above, the purpose of this study is to investigate the interaction between agricultural
productivity and the Village Institutes, regarding which further information will be provided in
Chapter 5. This relationship will be investigated by explaining how output of wheat per area
varies by the number of village school teachers who have graduated from a Village Institute,
while controlling for remaining natural, technological and intellectual factors. The analysis will
Ayşegül Girgin 2
be carried at province (city) level in order to account for the variations across different parts of
the country.
The most important motive behind the choice of this topic lies in the never-ending discussions on
the termination of the VIs. While the graduates and the left wing assert the benefits of the
institutes, there is still powerful opposition against this system on the grounds that they have
“failed in every respect to fulfil their intended purposes” (Yener, 1999). One of the common
counterarguments to the benefits of the institutes has been that they forced the rural population to
remain as peasants and labourers (Yener, 1999; Turan, 1979, p. 168). On the other hand, those
who support this initiative1 argue that “feudal landlords” and “pro-imperialist intellectuals”
were behind the termination of the VIs as they considered an enlightened rural population a
threat to their own wellbeing (Çezik, 2010; Tekeli, 1983, p. 666). With these arguments in mind,
the study aims to see whether the institutes were indeed useless in terms of agricultural
development (Yener, 1999).
The academic motive behind the topic, however, is to test whether it was possible to trace any
interaction between the institutes and changes in agricultural productivity. As stated clearly by
Karaömerlioğlu (1998a), one of the intended aims of the institutes was to increase productivity in
agriculture (p. 47). However, Yener (1999) suggests that the institutes failed to achieve any of
their aims, and Günaydın (2006) claims that they failed to achieve their agricultural aims in
1 Kemalist Thought Society [Atatürkçü Düşünce Derneği] and the New Generation of the People of Village
Institutes Community [Yeni Kuşak Köy Enstitülüler Derneği] have strong arguments about the impact of
imperialist authorities on the termination of the Village Institutes. One declaration made by the representatives of
these communities at the press conference that was held on the 70th
anniversary of the official promulgation of the
institutes is particularly interesting. According to them, the American researchers John Dewey and Fay Kirby
have been invited to Turkey as spies by pro-imperialism intellectuals in order to investigate the VI system. As
their investigations revealed certain attributes of the system that could eventually increase resistance to foreign
political influence and lay the foundation for a socialist system, the VI system was not appreciated by some
politicians and intellectuals who stood to profit from promoting outside political interference. (Çezik, 2010)
Ayşegül Girgin 3
particular (p. 13). Therefore this study aims to discuss the extent to which Yener and
Günaydın’s argument hold true in terms of the VIs’ influence in agriculture, and reveals results
significant enough to conclude that they achieved at least one of their aims: The quantitative
analysis that is presented in this study concludes that the number of village teachers who hold a
VI diploma interacts positively with the yield of wheat at the provincial level.
In a broader sense, the primary aim of this study is to offer one more set of empirical evidence to
the anticipated positive relationship between investment in human capital and agricultural
productivity. While setting the ground for the quantitative discussion of this interaction, a
detailed narrative will in addition be presented on the description, emergence, development and
termination of the Village Institutes allowing for a discussion on the efforts of the VIs to
contribute to the modernization process.
1.2. Thesis Outline
The study report has been divided into 9 chapters including this introduction. Chapter 2 has been
reserved for a literature review concerning the discussions on the dynamics in economic growth,
agricultural productivity and agrarian transition in relation to human capital. Chapter 3 will
present statistical snapshots from Turkey in terms of population, literacy and wheat productivity.
In Chapter 4 the picture of the newborn Republic of Turkey will be drawn in terms of the
reforms in the field of education and agriculture, prior to the emergence of the Village Institutes.
Chapter 5 is dedicated to the history of the Village Institutes in terms of their description and
evolution. Chapter 6 has been spared for a short discussion of the influence of the VIs in terms of
community development and agricultural productivity. In Chapter 7, the data and method used
for the investigation will be identified and described. Chapter 8 will follow to present and discuss
the results of the statistical analysis along with the weaknesses of the analysis and, finally,

Ayşegül Girgin 4
Chapter 9 will sum up the study through an evaluation of the results, theory implications,
weaknesses and proposals for future research.
Ayşegül Girgin 5
2. HUMAN CAPITAL AT THE ECONOMIC HORIZON
In this chapter, important works on the impact of education on economic growth and agricultural
productivity will be summarized. It will, however, be assumed that the audience has prior
knowledge on the basic theories of economic growth.
2.1. Education and Economic Growth
Education as an investment in human capital has been regarded as a growth factor as it was
expected to increase labour productivity, and reduce income inequality and poverty (Amin &
Awung, 2005, p.2). Arrow (1973) also reports that the productivity-adding human capital theory
suggests: “education adds to an individual’s productivity and therefore increases the market
value of his labour” (p.193). Therefore much research has tested the impact of education on
wages in an effort to discuss its contribution to economic growth. Nonetheless, the connection
that is drawn between education, performance and wages is open for debate, as it is still a hot
discussion topic how much the performance of the workers is reflected on their wages.
Building upon the basis that has earlier been provided by Friedman and Kuznets (1945), the
important role of human capital in economic growth has been discussed in detail by the human
capital model (Becker, 1963), the endogenous growth models (Lucas, 1988) and the application
of the augmented Solow model (Mankiw, Romer, & Weil, 1992 – as reviewed in Griliches,
1997, p. S331). Making use of the 1940 and 1950 censuses to obtain detailed earnings-by-
schooling data, Mincer’s (1958) work is considered immensely valuable among the early works
on human capital as well as the studies by Houthakker (1959) and Miller (1960) (as reviewed in
Griliches, 1997, p. S331). Fabricant (1954), Abramovitz (1956), Kendrick (1956), and Solow
(1957) point at the quality of labour force and capital measures as a potential factor in increasing

Ayşegül Girgin 6
economic growth, since their previous observations on the economic growth were not fully
explained by traditional labour and capital measures (Griliches, 1997, p. S331). These were then
followed by Schultz (1960), who connected these discussions to the concept of the “residual”
(Griliches, 1997, p. S331) .
Almost all models of economic growth have included some technological and knowledge based
elements in their functions. Schumpeterian growth is characterized by radical innovations which
lead to creative destruction at the turn of a growth cycle (Schumpeter, 1942), while the Solow
model adds the change in TFP, total factor productivity, as a measure of technological
advancement to the growth function (Solow, 1957). The modern economic growth argument
however blends the performance of the technological advancement with the ability of individuals
to absorb and expand it. Thus, the importance of education is stressed and referred to as an
investment in the human capital. Unlike physical capital, the human capital is proposed to create
increasing returns to scale, thus always having a beneficial side (Hansen & Knowles, 1998;
Romer P. M., 1987).
Statistical analysis aside, common sense predicts that a strong and positive correlation must exist
between education and growth. Nevertheless, the pool of literature on this hypothesis is rather
frustrating as there are a number of studies which only produce evidence for a negative or
insignificant relationship [One example being Islam (1995) as reviewed by Judson, 2002].
Mankiw et al (1992), Temple (1999), Kruger & Lindahl (2000), on the other hand, carry out a
careful analysis of error terms and exclusion of outliers, and find evidence on a strong, positive
and statistically significant relationship between education and growth (as reviewed in Judson,
2002, p. 211 and Ljungberg & Nilsson, 2009, p.73).
Ayşegül Girgin 7
Huffman (1977) draws attention to the relationship between human capital and allocative
efficiency. He suggests that surviving in a changing economic environment requires efficient
reallocation of resources to adapt to the change. This is done by first realizing the change, then
utilizing useful information, drawing suitable conclusions from the information and making
prompt and key action plans. Allocative efficiency is considered a skill that is acquired at a cost
and that yields benefits. Schooling is one way to acquire this skill, followed by research and
experience from reallocating resources (Huffman, 1977, p. 60). Thus Huffman’s (1977) study is
based on the following assumption: “If marginal returns to the allocative skill were to rise (fall),
as they would if the rate of economic growth were to increase (decrease), then individuals would
be induced to increase (decrease) their stock of allocative skill” (p.61). His findings provide
valuable evidence that investing in education increases the allocative performance of the U.S.
Corn Belt farmers, whereas lack of evidence is reported on an increase in the production directly
due to farmer education (Huffman, 1977, p. 77).
Ljungberg & Nilsson (2009) add valuable contributions to the human capital research by
investigating the direction of causality between education and economic growth. They point out
to the lack of agreement between Romer (1990), who suggests that economic growth reacts on
the stock of human capital”, and Lucas (1988), who suggests that it reacts on the increase of
human capital (Ljungberg & Nilsson, 2009, p. 72). They report evidence from Benhabib and
Spiegel (1994, 2002) who support Romer’s (1990) stock view, while challenging this view with
the findings of Vandenbussche, Aghion, & Meghir (2006), who show that tertiary education is
important for growth in countries above a certain technological level which themselves are
innovation producers whereas lower levels of education are important for countries which can
only follow and imitate technological leaders (Ljungberg & Nilsson, 2009, p. 72). Through a set

Ayşegül Girgin 8
of Granger causality tests, Ljungberg & Nilsson (2009) find that an increase in human capital
caused economic growth, and not the other way around2, up to the 1970s in Sweden, after which
no evidence for a robust pattern could be observed (p.72, 92). They note that their study does not
regard on-the-job-training, life-long learning forms or earlier forms of human capital like literacy
(Ljungberg & Nilsson, 2009, p. 91), and they conclude:
We do not suggest that more education could have prevented the structural
crisis in the 1970s but probably it would have facilitated the transformation of
the third industrial revolution and moderated the slow-down of growth in the
1980s (Ljungberg & Nilsson, 2009, p. 92).
In human capital research, identifying a proxy to depict human capital plays an important role.
The most common three proxies that we see in important works are literacy rates, enrolment
rates, and estimates of the average number of years of education attained by workers. However,
it is important to assure collinearity between the chosen proxy and the country’s whole human
capital stock (Judson, 2002, p. 211). It is therefore not useful to have for example literacy rate as
a human capital proxy for a dataset belonging to a developed country, because such countries
usually have literacy rates close to hundred percent while the expansion continues on the higher
education attainment. In short, Judson (2002) strongly argues that several errors exist in most of
the studies which find a negative or insignificant correlation between education and growth
(p.229). She suggests that better proxies should be identified for measuring human capital and
draws the following conclusions in her study: (1) When human capital is measured as a
combination of “the available data on education spending, enrolments and education attainment
of the labour force”, there is a significant and positive correlation between human capital
2 Some examples of research which investigate the causality with a direction from economic growth to human
capital are Barro (1991), Barro & Sala-i-Martin (1995), Barro (1997), and Diebolt & Monteils (2000), as reported
by Ljungberg & Nilsson (2009, p.73).
Ayşegül Girgin 9
accumulation and output growth; (2) At higher levels of output, the ratio of human capital to
output is larger; (3) “These observations match both the predictions of the endogenous growth
model of Romer (1990) and the neoclassical model of Barro et al. (1995), but not the predictions
of the models of Azariadis and Drazen (1990), Barro and Sala-i-Martin (1995) and others”
(Judson, 2002, p. 229).
This study focuses particularly on the relationship between the Village Institutes and agricultural
productivity growth. Therefore the number of village teachers who own a VI diploma will be
used as a proxy for VI-related education, and kilograms of wheat output per hectare of area sown
for wheat will be the proxy for agricultural productivity. The former choice is built upon the idea
that the VI-style education was spread only by those teachers who graduated from a VI and they
were expected to change the approach to agriculture in villages while promoting the cultural
enlightenment. The choice of per area wheat yield is justified with wheat being the main and
most cultivated crop in Turkey, which produced only a small variety of crops at the time.
Moreover, literacy rate will be used as a control variable which is expected to be among the
factors that influence agricultural productivity.
2.2. Education and Agricultural Productivity
The economic benefits of education have been discussed by economists through the correlation
between human capital investment and wages since Schultz (1961). However, this type of
assessment is not robust in terms of the evaluation of education’s role in productivity growth.
First, it would be a rather dogmatic assumption to expect labour productivity to be fully reflected
in wages. Second, the investigation becomes harder for sectors which are run in majority by the
self employed. Investigations of the agricultural sector probably suffer from both of these
inconveniences as the small farmers usually employ family members in their fields and thus do

Ayşegül Girgin 10
not always pay them back in terms of wages, and corporate farmers may not define wages
according to labour productivity as it can be the case in any sector. Therefore the economic
benefits of education in the agricultural sector have been investigated through direct productivity
measures in many studies, especially after 1980 (See Lockheed, Jamison, & Lau, 1980; Moock,
1981; Jamison & Moock, 1984; Appleton & Balihuta, 1996).
Nearly all studies on this issue regard education as a factor determining the likeliness to adopt
innovation and they expect innovation to increase productivity, thus drawing a connection
between education and productivity (Jamison & Moock, 1984, p. 68). This is how this study on
the Village Institutes in Turkey will differ from the mentioned works. In this study, although the
implicit assumption will be that one of the benefits of the institutes were to spread innovations,
this individual effect will not be measured. Instead, the overall effect of the VI system on wheat
productivity will be assessed.
The discussion of education’s impact on agriculture has also sparked the discussion on whether
the impact would be different in traditional compared to modernizing environments. Building
upon the argument proposed by Schultz (1975) that education has larger impacts in changing
technological and economic environments, Alene & Manyong (2007) present empirical results
from northern Nigeria that education’s productivity enhancing impact is positive only under
improved technology (p. 157). Another important point to mention is the importance of sample
selection, because education’s effect on productivity is different on technology adopters than
non-adopters (Alene & Manyong, 2007, p. 157).
Lockheed, Jamison & Lau (1980) find strong correlation between elementary school education
and farm efficiency. However, the relationship is found to be more likely to be positive in
Ayşegül Girgin 11
modernizing agricultural environments than in traditional ones (p.61) This finding is in parallel
with the argument of Schultz (1964), who considers human capital to be the basis for
productivity growth in modern, rather than traditional, agriculture (cited in Mineo, 2010, p. 17).
Moock (1981) finds, however, a negative return to elementary schooling in a modernizing
agricultural environment in Kenya (p. 739). Pointing out to this conflict between the two studies,
Lipton (1985, p. 167) criticizes the study of Moock (1981) on the grounds that it provided results
only at 10 percent significance level, which is apparently not enough for him; that too little has
been written about the possible multicollinearity problem among the 14-18 explanatory
variables; and that the relationships were assumed to be linear though there was not enough
motivation given. Second, Lipton (1985) argues that the relationship is not necessarily causal and
too much has been assumed in Moock’s study regarding causality (p. 168). Third, he suggests
that the way Moock constructed his variables would only yield results to show that “dropping
out from school leads to bad farming”, and “not that elementary schooling leads to bad
farming” (Lipton, 1985, p. 168), thus pointing out to a conceptual weakness in the construction
of the hypotheses.
Jamison and Moock (1984) test the effect of schooling on agricultural productivity in Nepal, by
using two parameters as a proxy for productivity (p. 83). They suggest that the choice of the type
of fertilizer and adopting new types of wheat crop for cultivation are two innovative decisions
that are expected to increase productivity, thus they measure the impact of education as well as
other factors in the farmers’ decision to adopt these innovations. Their results show that “having
attended school is related to the adoption of chemical fertilizer. […]It seems, however, that there
is no parallel effect of school attainment on the decision to grow wheat.” (Jamison & Moock,
1984, p. 83). The study also discusses the role of the government-run extension programme on
Ayşegül Girgin 12
the adoption of fertilizer and decision to grow wheat. They observe that the programme serves as
a “catalyst for the diffusion process” for fertilizer adoption (Jamison & Moock, 1984, p. 84).
One very important finding is that “a farmer is more likely to grow wheat or use chemical
fertilizer the greater the proportion of other farmers who do so in this farmer’s immediate area”
(Jamison & Moock, 1984, p. 84). This finding should be kept in mind while reading the results
of this study on the dynamics between the number of Village Institute graduate teachers and
wheat productivity. One of the ways in which the Village Institutes made villagers adopt new
techniques and new products for growing in their farms and fields was that they adopted these
innovations themselves first and proved that they worked well. In many cases, the villagers were
reluctant to change but this resistance was overcome when they witnessed successful results
achieved by either the institutes themselves, or the field cultivated by the village teacher who
was graduated from a Village Institute (UCTEA Chamber of Agricultural Engineers Izmir
Branch [TMMOB Ziraat Mühendisleri Odası İzmir Şubesi], 1995, pp. 21-22).
In his master’s thesis submitted to Lund University Department of Economic History, Mineo
(2010) investigates the relationship of education with production, earnings and off-farm mobility
in the U.S. counties of the Heartland agricultural region with the time dimension covering
specifically the years 1970, -80, -90, and 2000. The analysis of panel data in Mineo (2010)
reveals results as follows: (1) university attainment correlates negatively whereas high school
education correlates positively with corn output (p. 92), (2) no accurate relationship is observed
between education and earnings (p. 93), and (3) farm proprietors in counties with higher
secondary and tertiary school attainment were less likely to seek off-farm employment (p. 94).
Appleton & Balihuta (1996) mention the non-cognitive effects of education. They suggest that
education changes people’s attitudes and practices. The similarity between classroom discipline
Ayşegül Girgin 13
and work-floor is emphasized, noting that education equips one with discipline, acceptance of
hierarchy, punctuality and ability to work with a team (Appleton & Balihuta, 1996, p. 417). This
argument is in parallel with what Arrow (1973) refers to by the filtering function of education
(p.194). He discusses the function of education as a screening tool, in that it reports the abilities
of different individuals to employers in a world of imperfect information. Arrow (1973) charges
that the filter theory of higher education is not linked to the productivity-adding human capital
theory, while not entirely challenging it either (p. 194). Nevertheless, the screening function of
education can only be weakly discussed within the context of Turkish agricultural sector in the
1940-60s, as higher education was rarely required for farm labour, if at all. Especially in the
middle of the twentieth century, which is the period of interest for this specific study about the
Village Institutes, even primary school education was barely a requirement for farming and most
of the population was illiterate anyway. However, this does not change the possibility that
schooling would improve a person’s habits in terms of being punctual and disciplined, which
would very well be useful in agriculture as well as industry. The Village Institutes aimed to add
on top of this and equip the villagers with the ability to develop scientific approach towards
agriculture, which is expected to be a more effective factor in increasing productivity.
Appleton & Balihuta (1996) also touch upon the issue that schooling might cause off-farm
mobility in developing countries, encouraging the students to try for a formal sector employment
(p.417). They suggest that this might happen as schooling may encourage adopting modern
practices and being open to new ideas (Appleton & Balihuta, 1996, p. 417). This phenomenon is
discussed in two ways in the VI literature: The VIs both aimed to raise an open minded youth,
and to suppress their aspiration to leave their village to seek other kinds of employment. A
Ayşegül Girgin 14
positive relationship between VI education and agricultural productivity is expected as being
open to new practices usually results in productivity solutions.
Appleton & Balihuta’s (1996) study is interesting in the way that they summarize the findings of
many other studies which measure the impact of education on agricultural productivity. They
report that only a minority of the studies find a positive effect that is statistically significant,
which is rather frustrating. However, they explain the insignificance by the use of small sample
sizes, measurement errors related to agricultural productivity and the possibility of genuine
variability in the impact of education where the sample is not controlled for traditional and
modernizing environments (Appleton & Balihuta, 1996, p. 420).
Ayşegül Girgin 15
3. STATISTICAL SNAPSHOTS FROM THE REPUBLIC OF TURKEY
In this chapter, information on the evolution of population, urbanization, literacy, share of
agriculture in GNP and wheat productivity in the Republic of Turkey will be summarized in an
effort to draw a simple yet useful picture of the country in the readers’ mind. This will hopefully
help the reader to understand the importance of agriculture, rural development and education for
the Turkish population back in the first half of the twentieth century.
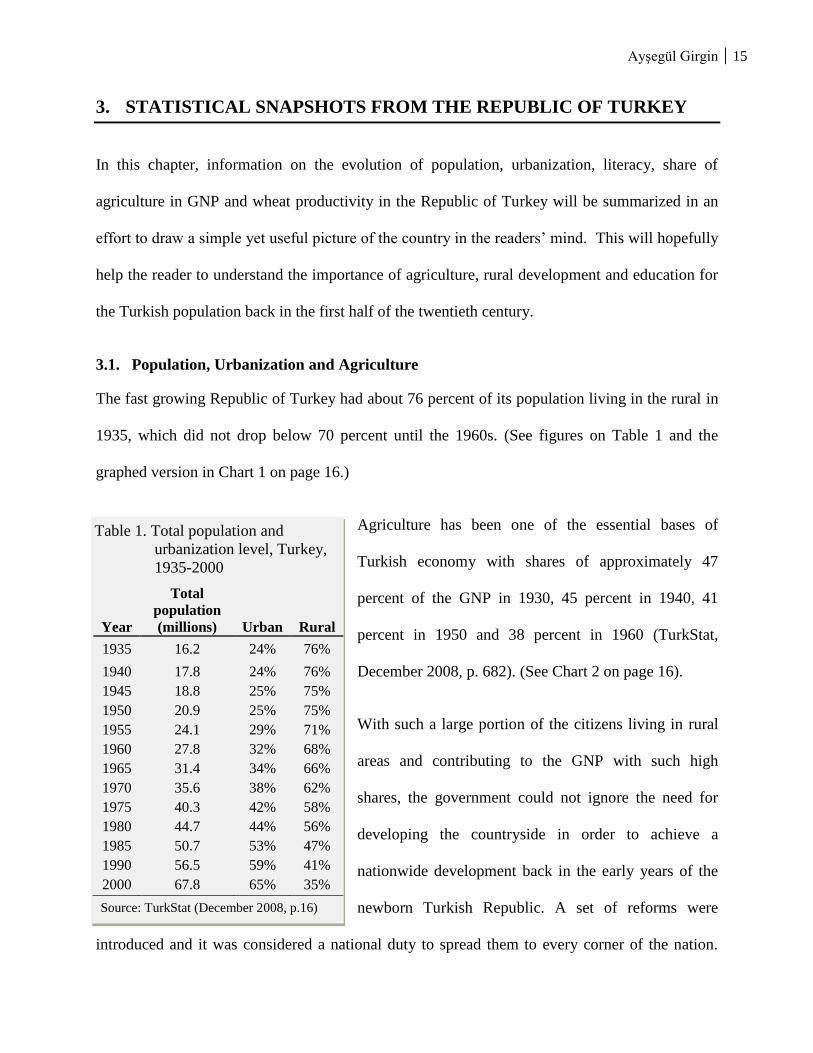
3.1. Population, Urbanization and Agriculture
The fast growing Republic of Turkey had about 76 percent of its population living in the rural in
1935, which did not drop below 70 percent until the 1960s. (See figures on Table 1 and the
graphed version in Chart 1 on page 16.)
Agriculture has been one of the essential bases of
Turkish economy with shares of approximately 47
percent of the GNP in 1930, 45 percent in 1940, 41
percent in 1950 and 38 percent in 1960 (TurkStat,
December 2008, p. 682). (See Chart 2 on page 16).
With such a large portion of the citizens living in rural
areas and contributing to the GNP with such high
shares, the government could not ignore the need for
developing the countryside in order to achieve a
nationwide development back in the early years of the
newborn Turkish Republic. A set of reforms were
introduced and it was considered a national duty to spread them to every corner of the nation.
Table 1. Total population and
urbanization level, Turkey,
1935-2000
Year
Total
population
(millions) Urban Rural
1935 16.2 24% 76%
1940 17.8 24% 76%
1945 18.8 25% 75%
1950 20.9 25% 75%
1955 24.1 29% 71%
1960 27.8 32% 68%
1965 31.4 34% 66%
1970 35.6 38% 62%
1975 40.3 42% 58%
1980 44.7 44% 56%
1985 50.7 53% 47%
1990 56.5 59% 41%
2000 67.8 65% 35%
Source: TurkStat (December 2008, p.16)

Ayşegül Girgin 16
The relevant reforms among these will be reported further in Chapter 4. Yet it is reasonable to
mention now that the emergence of the Village Institutes was intended to improve the rural
population and serve for both the agricultural and educational reforms.
Chart 1. Total population and distribution of urban and rural population at national level, Turkey,
1927-2000
Source: Percentages calculated by using the data in Table 1.
Chart 2. Shares of sectors in Gross National Product, Turkey, 1923-2006
0%
10%
20%
30%
40%
50%
60%
70%
80%
90%
100%
19
23
19
28
19
33
19
38
19
43
19
48
19
53
19
58
19
63
19
68
19
73
19
78
19
83
19
88
19
93
19
98
20
03
Agriculture
Industry
Services
Source: TurkStat (December 2008, p. 68)
0
10
20
30
40
50
60
70
1927 1935 1940 1945 1950 1955 1960 1965 1970 1975 1980 1985 1990 2000
Population (millions)
Total
Urban
Rural
Ayşegül Girgin 17
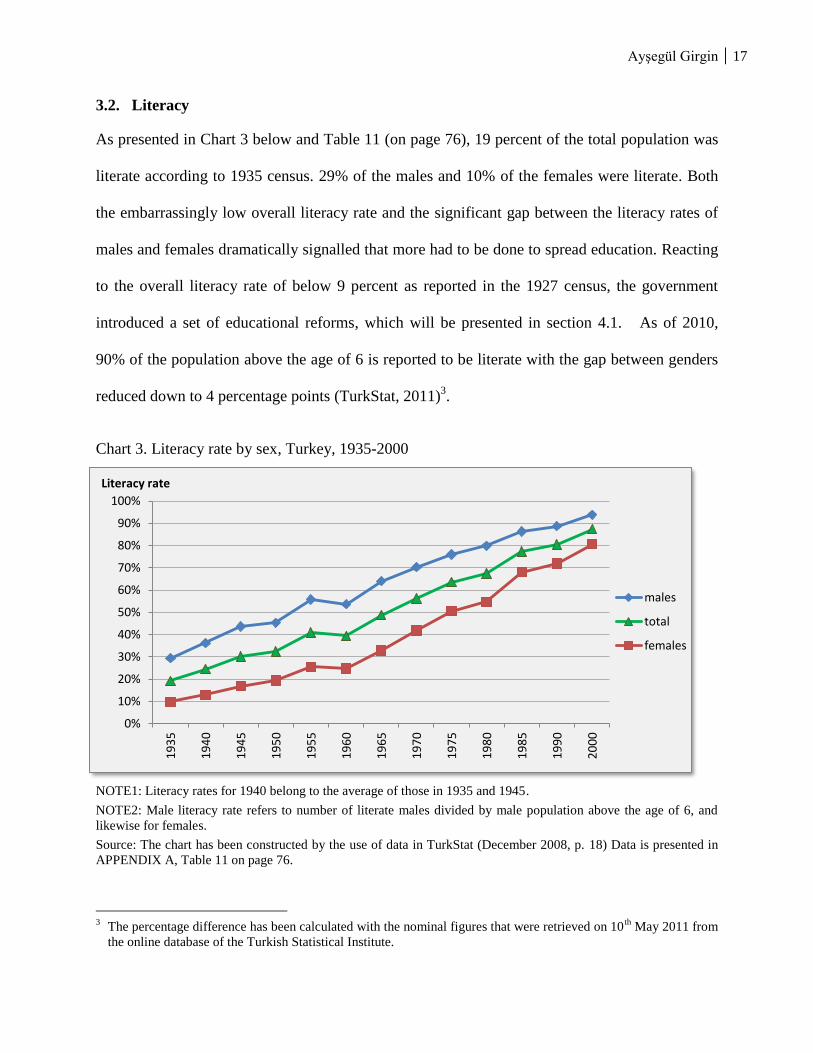
3.2. Literacy
As presented in Chart 3 below and Table 11 (on page 76), 19 percent of the total population was
literate according to 1935 census. 29% of the males and 10% of the females were literate. Both
the embarrassingly low overall literacy rate and the significant gap between the literacy rates of
males and females dramatically signalled that more had to be done to spread education. Reacting
to the overall literacy rate of below 9 percent as reported in the 1927 census, the government
introduced a set of educational reforms, which will be presented in section 4.1. As of 2010,
90% of the population above the age of 6 is reported to be literate with the gap between genders
reduced down to 4 percentage points (TurkStat, 2011)3.
Chart 3. Literacy rate by sex, Turkey, 1935-2000
NOTE1: Literacy rates for 1940 belong to the average of those in 1935 and 1945.
NOTE2: Male literacy rate refers to number of literate males divided by male population above the age of 6, and
likewise for females.
Source: The chart has been constructed by the use of data in TurkStat (December 2008, p. 18) Data is presented in
APPENDIX A, Table 11 on page 76.
3 The percentage difference has been calculated with the nominal figures that were retrieved on 10
th May 2011 from
the online database of the Turkish Statistical Institute.
0%
10%
20%
30%
40%
50%
60%
70%
80%
90%
100%
19
35
19
40
19
45
19
50
19
55
19
60
19
65
19
70
19
75
19
80
19
85
19
90
20
00
Literacy rate
males
total
females

Ayşegül Girgin 18
For a healthy discussion of convergence in the literacy rates at province level, coefficient of
variation can be used as a measure. Chart 4 presents CV for the years 1927, 1935, -40, -45, -50, -
55, -60 and -65.
Chart 4. Coefficient of variation in province level literacy rates.
83%
61%
51% 49%41% 41% 40% 38%
0%
10%20%
30%
40%
50%
60%
70%80%
90%
1927 1935 1940 1945 1950 1955 1960 1965
CV
NOTE: Province level literacy rates for 1940 are derived as the average of those in 1935 and 1945, as they did not
exist in the 1940 census.
Sources: State Institute of Statistics (1931, p. 42; 1950b, p. 190; 1961, p. 213) and General Statistical Office (1942,
p. 82; 1950, p. 175; 1961, p. 138)
3.3. Wheat Productivity (Output per Area)
Chart 5 presents the evolution of per area wheat production between 1925 and 2007 at national
level. The average annual growth rate in wheat productivity using a two-year approach, with
1925 as the starting point and 2007 as the ending point, is 8 percent.
Chart 6 presents the levels of variability across provinces in terms of per area wheat output for
the years 1940, 1941, 1942, 1964, 1965 and 1966. The period 1940-42 displays an increasing
trend in coefficient of variation (CV), implying divergence across provinces. 1964-66 on the
other hand is marked with a slow decline in CV, implying convergence. The overall picture,
needless to say, displays a significant fall in CV, implying convergence.

Ayşegül Girgin 19
Chart 5. Output of wheat per hectare of area sown for wheat, Turkey, 1925-2007
0
500
1000
1500
2000
2500
1925
1929
1933
1937
1941
1945
1949
1953
1957
1961
1965
1969
1973
1977
1981
1985
1989
1993
1997
2001
2005
kg/ha
Yield (kg/hectares)
Trend line
Source: Data retrieved from TurkStat (December 2008, pp. 196-197)
Chart 6. Coefficient of variation at province level for wheat
output per area, Turkey, 1940-1942 and 1964-1966
46% 47%
53%
25% 24% 23%
0%
10%
20%
30%
40%
50%
60%
1940 1941 1942 1964 1965 1966
CV
NOTE: CV calculated from nominal data on province level wheat output
and area sown for wheat.
Sources: State Institute of Statistics (1943, p. 8; 1968, p. 47)
Ayşegül Girgin 20
4. EDUCATION AND AGRARIAN REFORMS IN THE REPUBLIC OF
TURKEY
The history of the Turkish Republic starts on the 29th
October 1923, three years after the
establishment of the parliament on 23rd
April 1920. Independence was gained through the war of
independence led by Mustafa Kemal Atatürk, who is today considered the most important public
figure and a national hero in Turkey. The first fifty years of republican history is narrated by a
series of reforms that were expected to build an entirely new nation. Among all, the reforms in
the field of education and agriculture are the two most essential ones as they make it easier to
understand the role of the Village Institutes within the context of the modernization efforts and
economic development
In section 4.1 the education reform will be summarized through three important
implementations: (1) Unification of education, (2) alphabet reform, and (3) common-public
education. Section 4.2 will follow to summarize the efforts to implement agricultural
transformation, where (1) Land reform, (2) the Agricultural Credit and Sales Cooperatives, and
(3) the Agricultural Factories and the State Agricultural Enterprise will be summarized. The
emergence of the VIs will be introduced as a fourth step of the agrarian reform, yet will not be
further explained in this chapter. The VI project must rather be considered to have served both
the education and agrarian reforms. The grounds of this argument will become clearer with the
narratives and discussions in chapters 5 and 6.
Ayşegül Girgin 21
4.1. Education Reform
4.1.1. Unification of Education
On March 3rd
1924, only four months after the promulgation of the republic, the duality
between regular schools and madrasahs4 was abolished by the introduction of the act of
Unification of Education5 (Act no:430) (Tekeli, 1983, p. 660; Akyüz, 1999, p. 285). All
institutions of education were now governed by the Ministry of Education which would
accelerate the modernization process in education. In 1927, all courses related to religion
were removed from the national curriculum. Only the elementary schools in villages would
provide some courses with religious content, provided that the focus would be on modern
principals of ethics and morals (Tekeli, 1983, p. 660). This act also solved the problem of
training religious functionaries: The Faculty of Theology was first founded in İstanbul
University, to provide higher education to the graduates of the twenty six İmam Hatip
schools (secondary level schools that train imams) across the country (Tekeli, 1983, p. 660).
The Faculty of Theology was terminated in 1934 as a part of university reforms, after the
termination of Imam Hatip schools in 1930 and 1931 (Tekeli, 1983, p. 660; Sakaoğlu, 2003,
p. 170).
4.1.2. Alphabet Reform
The Ottoman language was a mix of Turkish, Persian and Arabic, which used to be written
in Arabic alphabet. The literacy rate in 1928 was less than 10 percent and Mustafa Kemal
Atatürk, the first president of republic in Turkey, suggested that this low figure was partly
caused by the extreme difficulty of learning the Arabic alphabet and its incompatibility with
4 Madrasah is an Arabic word that refers to schools which follow a rather religious and traditionalist curriculum and
is widely common in Muslim countries (The Turkish Language Association, Online dictionary, search word:
“medrese”. Accessed on February 25th
, 2011, via www.tdk.gov.tr).
5 The act is called “Tevhid-i Tedrisat Kanunu” in Ottoman and “Eğitimde Birlik Kanunu” in Turkish.
Ayşegül Girgin 22
the Turkish language (Akyüz, 1999, p. 298). To overcome the alphabet barrier, the new
Turkish letters based on the Latin alphabet were introduced by a law dated 1st November,
1928 (Akyüz, 1999, p. 298). This reform was accompanied by the establishment of The
Turkish Language Association, which immediately started working on finding Turkish
expressions for foreign words, phrases and terminology (Akyüz, 1999, pp. 298-299). The
literacy rate reached a level of approximately 19 percent in 1935 and 29 percent in 1945
(TurkStat, December 2008, p. 24; also see APPENDIX A, Table 11 on page 76), however,
with the majority of the achievement in the cities and towns rather than the villages (Ahmad,
1993, p. 82).
4.1.3. Common-public Education
The introduction of the new alphabet required an exhaustive project to train adults and
teenagers who were no longer studying. For this purpose, institutes by the name “Schools of
the nation”6 were founded primarily in order to teach the new alphabet. Thousands of men
and women between 16 and 45 years of age were trained in these schools usually in the
evenings, in periods of 4 months. There were two types of classes: Class A focused mainly
on literacy whereas class B would provide courses also in simple mathematics,
measurements, health and civics. More than 1.5 million adults received certificates from
these schools between 1928 and 1950, but the greatest achievement was made during the
first 5-10 years. The literacy rate of 10.7 percent in 1927 increased to 19.5 percent in 1935
and to 22.4 percent in 1940 (Akyüz, 1999, p. 351).
6 “Millet Mektepleri” in Turkish.

Ayşegül Girgin 23
4.2. Agrarian Reform
According to the agricultural census which included 1 million families in 1913, 5 percent of the
total number of farm families controlled 65 percent of the total land available for cultivation
whereas another 8 percent of farm families (approximately 80 thousand families) were landless
peasants (Günaydın, 2006, p.13; Dinler, 1996 as reviewed in Yavuz, 2005, p.7). This leaves a
block of 87 percent controlling only 35 percent of the land, drawing a picture of unequal land
ownership in the final years of the Ottoman Empire. In addition to the inequality of capital in
terms of land ownership, the country was short on work animals and tools: In 1927, 22 percent
of the rural citizens did not own any work animals and the average number of wooden ploughs
per farm family was less than one (Günaydın, 2006, p. 13).
The 1930s are thus important in the Turkish history of agriculture as they are marked as the
period when an agrarian transformation process was initiated. The aim was to design a structure
which would enable the rural families to own land and attain agricultural production techniques,
while encouraging them to actively participate in the Republic’s enlightenment project
(Günaydın, 2006, p. 13).
This project was designed into four steps: It would be initiated with the land reform, and would
be followed by the establishments of the agricultural credit and sales cooperatives in 1935, the
Administration of Agricultural Factories and the State Agricultural Enterprise in 1937. Finally,
the Village Institutes would be the final step towards setting up a web of institutions to provide
the farmers with knowledge and support. These institutions would teach the farmers modern
agricultural techniques (Günaydın, 2006, p. 13).

Ayşegül Girgin 24
4.2.1. Land Reform
The first modern agricultural policy was introduced in the beginning of the 19th
century by
Kavalalı Mehmet Ali Pasha in Egypt, which at that time belonged to the Ottoman Empire.
The arable part of land that belonged to some organizations and institutions were distributed
among farmers, who would be free to choose which products to grow (Yavuz, 2005, p. 46).
Nevertheless, this policy was unique to the region and some 40 percent of the land in the
rest of the empire belonged largely to the emperor, followed by a few other leaders in the
hierarchy from the viziers down until the cavalries (Gürbüz 1989 as reviewed in Yavuz &
Çağlayan, 2005, p.3; Parvin & Hiç, 1990, p.212). Farmers were the hereditary and perpetual
tenants of these lands and their right to cultivate these areas was subject to tax (Dinler, 1996
cited in Yavuz & Çağlayan, 2005, p.3). This was called the miri system. Vakıf (religious
foundation) and mülk (private) were the next two land categories that existed in the Ottoman
Empire (Parvin & Hiç, 1990, p. 212).
The villagers, who did not hold the legal right to sell land, became poorer and poorer in time
with the dramatic increases in tax levels (Tokgöz, 1995, cited in Yavuz & Çağlayan, 2005,
p.5). Later, in 1858, the Land Code made it legal for the holders of miri land to transfer or
sell their rights to others, thus taking a step towards privatization (Parvin & Hiç, 1990, p.
212).
After the Republic of Turkey was founded (1923), the miri system was dismantled and over
40 percent of the state land was distributed to the landless peasants of Anatolia and
immigrants from the Balkans, encouraging private land ownership. Since then, however,
despite three attempts to redistribute land to small farmers, a complete land reform
programme has failed to develop (Morvaridi, 1990, p. 304; Parvin & Hiç, 1990, p. 208).

Ayşegül Girgin 25
In 1945, Law no. 6062 was passed by the İnönü government, the only party that existed, to
distribute land to farmers based on the principles of land reform (Parvin & Hiç, 1990, p.
214). Unfortunately, the law could be implemented to a very low extent. When it was first
introduced the law allowed owning a maximum of 50 acres of land per person. After the
emergence of a second party in the democratic system of Turkey, İsmet İnönü’s government
increased the maximum limit to 5000 acres in an effort to soothe the opposition, which
consisted largely of landowners (Parvin & Hiç, 1990, p. 214).
4.2.2. Agricultural Credit and Sales Cooperatives
Agricultural Credit Cooperatives7 (ACCs) were introduced in 1935 by Law no. 2836 in
order to give loans to provide capital for the agricultural sector. In 1969, the number of
ACCs reached to 1991 with 49 percent of the 11,293,811 members being farm families
(CIHEAM, 1971, p. 104).
The same year, Agricultural Sales Cooperatives8 (ASCs) were introduced by Law no. 2834
in order to improve the conditions for the domestic and international sales of plant and
animal products produced by the farmers (CIHEAM, 1971, p. 104). By 1969, the number of
ASCs reached 556, serving 214,870 members in total (CIHEAM, 1971, p. 104).
4.2.3. Administration of Agricultural Factories and the State Agricultural Enterprise
The Administration of Agricultural Factories9 (AAFs) were established on 12
th February
1937 by Law no. 3130 in order to help farmers cultivate fallow land by lending them
agricultural machinery and tools (Republic of Turkey Ministry of Agriculture and Rural
7 “Tarım Kredi Kooperatifleri” in Turkish.
8 “Tarım Satış Kooperatifleri” in Turkish.
9 “Zirai (Tarımsal) Kombinalar İdaresi” in Turkish.
Ayşegül Girgin 26
Affairs, May 2004, p. 55). They implemented projects to increase cereal production between
the years 1937 and 1940. In 1943, they established State Farms10
on fallow land owned by
the state in order to increase production and meet the domestic demand for foodstuffs
(Republic of Turkey Ministry of Agriculture and Rural Affairs, May 2004, p. 55).
State Agricultural Enterprises11
were founded in 1937 when Mustafa Kemal Atatürk,
donated to the state all the farms he owned (Ulus, 1938, p. 84). Once owned and managed
by Atatürk himself, these lands would now be used by the government with the purpose of
setting a good example for the villagers by demonstrating modern agricultural techniques
(Ulus, 1938, p. 84). The organization was responsible for managing pieces of land whose
ownership would be transferred to them, while demonstrating the necessary agricultural
methods and techniques themselves at the new agricultural enterprises, factories and
workshops that they would establish and run in every region in order to guide the farmers in
the area (Ulus, 1938, p. 84).
4.2.4. Village Institutes
The Village Institute project emerged in 1937 as a result of an effort to educate the rural
population in order to increase their competence in various fields, with special emphasis on
agriculture. Following the “learning by doing” principle, the VIs were 5- year boarding
schools which would train elementary school graduates of the rural population to become
village school teachers while equipping them with the necessary knowledge that the rural
conditions required. Training teachers was not the only aim of the VIs; they also trained
agricultural experts, health technicians, midwives, carpenters and other specialists that were
10
“Devlet Üretme Çiftlikleri” in Turkish.
11 “Devlet Ziraat İşletmeleri Kurumu” in Turkish.

Ayşegül Girgin 27
necessary for the rural population. Moreover, they did not only aim to train the VI students
but also the public. A detailed story of the institutes will be presented in Chapter 5.

Ayşegül Girgin 28
5. HISTORY OF THE VILLAGE INSTITUTES AND RELATED
ACADEMIC LITERATURE
Understanding the expectations regarding the Village Institute (VI) project requires a thorough
knowledge of the emergence, evolution principles and the working mechanism of the VI system.
This chapter will begin with a short time line of the story of the VIs and will be followed by a
narrative on the principles and ideology behind the system. Next, further details about the system
will be given, after which their curriculum will be explained. The final sub-section in this chapter
will shortly summarize the decision elements for VIs choice of location and where in reality they
ended up being established. After presenting further attributes of the VIs, another sub-section
will describe the Village Institute of Higher Education. Finally, the chapter will be closed with a
review of VI literature, presenting both the supporting and dissenting arguments on the
achievements of the institutes.
5.1. Time Line
First established for testing in 1937, Village Institutes were promulgated in 1940, their curricula
were modified after 1946, and finally they were terminated in 1954 (Uygun, 2008, p. 32;
Altunya, 2000, p. 47; Türkmen, 2007, p. 334; Akyüz, 1999, p. 339).
The first two institutes were established in 1937 as pilot schools in Eskişehir and in İzmir under
law no.3803 (Uygun, 2008, p. 32), fourteen years after the republic was founded, thirteen years
after the Law of Unification in Education passed and nine years after the alphabet reform.
During the 3-year testing period, another VI was established in 1938 and one more in 1939.
Finally, VIs were officially promulgated on April 17th, 1940 (Uygun, 2008, p. 32). In 1940, ten
more VIs were established, followed by three more in 1941, one in 1942, two in 1944 and one in
Ayşegül Girgin 29
1948, totalling up to 21 institutes in the end. In the academic year of 1945-46, there were 20 VIs
employing 119 female and 403 male teachers; teaching 1727 female and 13806 male students
(Altunya, 2000, p. 47)(See the rest of the figures in Table 12 in APPENDIX A).
With the introduction of the institutes, the number of village school teachers increased
significantly in a period of 11 years. VIs had their first group of graduates in 1942. In 1946, 45
percent of the village school teachers across the country were graduates of VIs, which increased
to 72 percent in 1950 (Şimşek, 2006). The figures display valuable evidence that most of the
increase in the number of village school teachers could be attributed to the VIs. (See Table 13 in
APPENDIX A for nominal figures.)
The Institutes remained active and operative until the early 1950s, but the original phase of the
Village Institutes ended in 1946, soon after the withdrawal of Hasan Ali Yücel from the Ministry
of Education and Ismail Hakkı Tonguç from the administration of the Elementary Education
(Kirby, 1962, cited in Uygun, 2008, p.302; Tekeli, 1983, p.666). After the Second World War,
the VIs were attacked by the conservatives on the grounds that the students here were being
brainwashed with the undesired ideologies of the time like socialism and communism, and being
induced class conflict. The implicit reason behind these reactions is believed to be the fear of
“awakening the peasants by teaching them to read and write, teaching them about health care
and efficient agriculture, in short giving them a new sense of self reliance and confidence”
(Ahmad, 1993, p. 83). Other criticisms about the VIs will be reported further in Section 5.9 on
page 46.
Consequently, the curricula of the VIs were altered in 1946 and coeducational training was
abolished. The practical courses were replaced by theoretical lectures, the girls were registered to
Ayşegül Girgin 30
two separate institutes, and the notion of “learning by doing” left its place to mere “learning”
(Ahmad, 1993, p. 83). In 1953, the curricula of VIs were merged with those of the regular
primary teacher training schools. However, in 1954 with a number of reasons one of which was
that “a person could not do all the training and teaching jobs at the same time in a village”, the
VI system was terminated for good, leaving their place to regular teacher training schools
(Türkmen, 2007, p. 334). (Also see Sakaoğlu, 2003, p.247)
5.2. Principles and Ideology behind the Village Institute System
Although the adoption of the Latin alphabet in 1928 led to a dramatic increase in the literacy
levels by making it easier for people to learn to read and write, the countryside was unable to
catch up with the literacy rates of the urban citizens (Ahmad, 1993, p. 82). In order to help the
countryside gain speed, Mustafa Kemal Atatürk, appointed a commission to find a solution. They
realized that the youths from the villages should be trained not in the cities but again in villages
to avoid corruption12
(Ahmad, 1993, p. 83). Also, a practical curriculum was essential as the
rural understanding of education was more about “doing” rather than just “knowing” (Ahmad,
1993, p. 83).
After being appointed General Director of Primary Education, İsmail Hakkı Tonguç began to
work on his rural revitalization plan, aiming to achieve this through education. Despite being an
intellectual, he was distinguished by his thorough understanding of the rural needs and
conditions, which were the main reasons why he wanted to direct educational efforts to the rural
(Kirby, 1962, p. 78). With the approval of Hasan Ali Yücel, the Education Minister of the time,
he began the implementation of the Village Institutes projects in 1937.
12
“Corruption” here refers to the change in a young person’s feeling of belonging to the village, developing
willingness to move to the city.
Ayşegül Girgin 31
"The pioneer of the movement, Tonguç, focused on the implementation of a synthesis of work
school and production school in the Village Institutes in an attempt to create a more production-
oriented rural population" (Uygun, 2008, p. 303). In the light of this ambition, some of the aims
of the institutes were: (1) to modernize social relations, (2) to end poverty and ignorance among
the peasants, (3) to create peasant intellectuals, (4) to increase agricultural productivity and (5) to
help spread the Kemalist Revolution in the countryside (Karaömerlioğlu, 1999, p. 112). Within
the scope of this thesis, the focus will be on the fourth aim, while the others will be discussed
briefly with the purpose of making the picture of the institutes clearer in the readers’ mind.
5.3. The Village Institute System
The VIs were 5-year middle schools following the first 5 years of elementary education13
. Third
article of the Law of Village Institutes required that the healthy students with high academic
performance who complete a 5-year primary education in the villages located in the
neighbouring provinces would be accepted to these boarding schools (Sakaoğlu, 2003, p. 237;
Vexliard & Aytaç, 1964; Gedikoğlu, 1971 cited in Şeren, 2008, p. 214), which were located on
vast tracts of land in rural areas. Previous experience of training primary school teachers had
shown that teachers with urban origins were unable to understand the needs and conditions of the
villages, thus decreasing their ability to connect well with the students in village schools as well
as the rest of the inhabitants. This time, it was decided that the village students should become
village teachers (Aydın, 2007, p. 81; Sakaoğlu, 2003, p. 236; Şeren, 2008, p. 212). The VIs were
planned to develop a system that would best fit the rural conditions and equip the villagers with
13
Back in the time, primary education covered the grades prior to high school. Most commonly, children had a 5
year elementary school followed by 3 years of middle school, which were both managed by the Primary
Education unit of the Ministry of Education. The VIs were middle schools which offered a 5-year education
instead of 3 and gave the graduates the right to continue, if willing to, with the Village Institute of Higher
Education upon graduation.

Ayşegül Girgin 32
the kind of knowledge that they could actually utilize in practice (Türkmen, 2007, p. 334;
Sakaoğlu, 2003, p. 236). The students would come from the rural and go back to their villages to
serve as village school teachers, village trainers, health technicians14
, mechanics or carpenters for
twenty years (Şeren, 2008) after graduation. "Also, instead of regular salary like urban
elementary school teachers, they had to use designated agricultural fields by the government in a
village to make living. Only a small amount of salary and some agricultural equipment were
given to these village school teachers." (Dilaver, 1994, p.73 cited in Türkmen, 2007, p.334; also
see Sakaoğlu, 2003, p.238 and Keleş, 2007, p.8-9)
The perspective on knowledge in the rural was highly pragmatic. However, their approach to
practical, useful knowledge worked in both ways: (1) They were more willing to digest the kind
of knowledge that they could utilize in their lives, and (2) they were able to digest certain kinds
of knowledge better through practice. Thus, the VIs highly emphasized the principle of "learning
by doing" (Karaömerlioğlu, 1999, p. 120). The next main principle was "creating from nothing"
(Kirby, 1962), though this one emerged naturally by itself as the government was dealing with
difficult economic conditions. The students and teachers worked in building not only their
institutes but also helping other institutes' construction. Once they were erected, the students
would go on building farms, gardens, forests, aqueducts, wells, workshops, energy sources,
libraries and similar improvements in the coming years as part of their work-education (Evren,
1998, p. 35). “During the first five years the Institutes had built more than 300 buildings such as
dormitories, refectories, kitchens, workshops, warehouses, garages, class-rooms, etc. They had
installed electricity in sixteen of their twenty-one centers.” (Vexliard & Aytaç, 1964, p. 44)
14
A health technician was a person who was responsible from diagnosing and curing common and basic health
problems. These people were either graduates of vocational health schools or village institutes with a major in
health. These schools are not qualified as medical schools but provide their graduates with the necessary
knowledge and skills to cure basic problems which do not need to be taken to a specialist doctor.

Ayşegül Girgin 33
According to law no. 3803, the VIs were supposed to be built at the outskirts of big cities, to
have enough land to simulate village conditions while being close to main roads. They were
supposed to have access to water resources. The aim was to locate the VIs at points which had
the potential to become regional centres. The location must allow easy transportation of health
personnel, technicians, doctors and others to and between the villages. This was more or less
manageable in regions where there was enough land that belonged to the Treasury. However, in
other regions land was bought from villagers. As can be predicted, these pieces of land were
usually of the kind those villagers themselves were not able to achieve high yields on (Evren,
1998, p. 30).
According to the founder of the institutes, Tonguç, work education could be described as the
education provided through work within the work. This meant that the students did not exercise
on samples. They were responsible for all stages and details of the work in hand (Tonguç, 1998).
However, over time, the village institutes deviated from the work education approach (Uygun &
Kıncal, 2006).
Once erected, the VIs did not rely extensively on the government budget for running expenses,
excluding the small salaries paid to the teachers. (Stone, 1974, p. 422) The harvest from farms,
milk and other products from the dairy, furniture from the workshops, clothes from the weaving
workshop, honey from the hives and any other goods that they produced were consumed in the
institutes themselves, with the surplus being sold at nearby markets. This way, the VIs were
both able to finance themselves internally and let students experience the importance of being
productive. The better products they made, the better conditions they lived under (Kirby, 1962).
Ayşegül Girgin 34
5.4. Village Institute Curriculum
In the beginning, the VI principals had more autonomy on the curriculum that they'd like to
follow. In 1943, a common curriculum for the VIs was centrally administered by the Ministry of
Education. However, each institute was allowed to modify their program according to the needs
and conditions of their region. Some institutes emphasized cereal production while others
concentrated on fishing, apiculture (beekeeping) or livestock etc (Türkoğlu, 1997).
A graduate of a village institute would have completed 114 weeks’ worth of cultural courses, 58
weeks’ worth of agricultural courses, 58 weeks’ worth of technical studies15
and would have had
30 weeks of vacation (Türkoğlu, 1997).
The vacations would involve the students continuing
studying, though. They were taken in shifts among students. During these vacations, the students
would go back home and prepare "village files" that contained detailed information about the
conditions in their own villages (Evren, 1998, p. 35).
The cultural courses varied from Turkish language and literature to mathematics, from history to
natural sciences, from foreign languages to geography. Among interesting cultural courses was
music, military training, housekeeping & child-care, and agricultural business economics. The
agricultural studies ranged from basic agriculture, horticulture and zootechnics to apiculture,
sericulture and fishing. The technical courses offered to males and females were different. While
males could choose between ironworking, woodworking or construction, the females could
specialize in needlework, weaving & textile, or extra agricultural studies (Altunya, 2000, pp. 43-
44; Şimşek, 2006, p. 7). The full list of courses and their hourly distributions per week can be
found in Table 14 in APPENDIX A.
15
The technical studies included courses such as concreting, carpentery, iron working, home building, weaving etc.
(Türkoğlu, 2005)
Ayşegül Girgin 35
5.5. Locations of the Institutes
The VIs were located 5-10km away from urbanized areas in order to target villagers, but as close
to a train station as possible (Binbaşıoğlu, 1997, p.35; Gedikoğlu, 1971 cited in Şeren, 2008,
p.11). They were responsible for providing 5-year secondary education to the rural population of
three to six provinces located around them (Binbaşıoğlu, 1997).
The initial plan mandated that the VIs were to be located on land that (1) was arable and state-
owned, (2) had fertile soil which is easy to cultivate and has existing garden plots in and around,
and (3) was located approximately at the centre of two or three surrounding provinces with water
and air conditions allowing for good sanitary conditions (Kirby, 1962 cited in Şeren, 2008, p.
213). Nevertheless, it has been observed that these conditions were not applicable for all the
institutes although it is still a fact that they were located on areas which reflected most of the
common properties of the rest of the land in the region (Kirby, 1962 cited Şeren, 2008, p. 213).
Partly due to budget problems and partly to availability, not all land provided to the institutes
was highly fertile and had a good location; the first students of the institutes usually had to work
on making the land arable themselves (Vexliard & Aytaç, 1964, p. 44). In many locations, VIs
did not even have any water resources nearby; they had to build infrastructure to bring water
from distant rivers or construct wells (See UCTEA Chamber of Agricultural Engineers Izmir
Branch [TMMOB Ziraat Mühendisleri Odası İzmir Şubesi], 1995 and Kirby, 1962).
Table 3 on page 37 displays the population characteristics of the villages that the VIs were
located in, in terms of the population of the province (city), the district, sub-district and village
that each VI belongs to. To interpret Table 3, follow this example: Çifteler Village Institute was
established in 1937 in a village of 1625 inhabitants which belonged to a sub-district which in
1940 had 16 villages with an average of 630 inhabitants living in each. This sub-district belonged
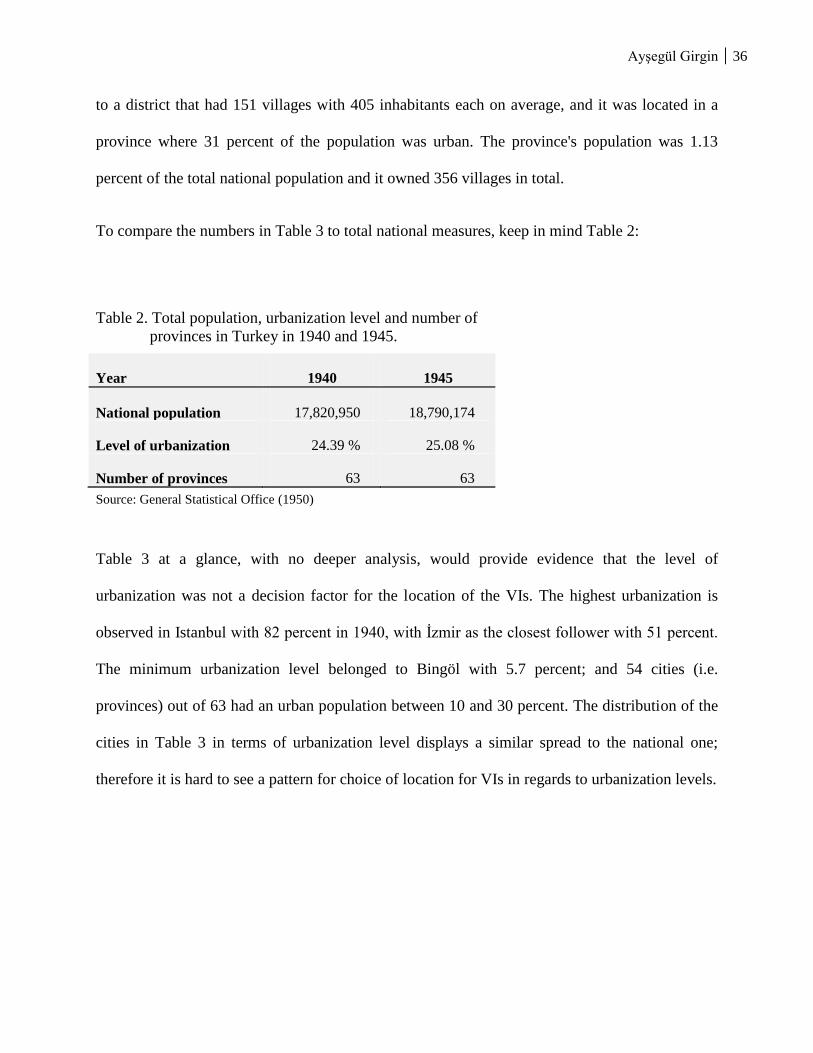
Ayşegül Girgin 36
to a district that had 151 villages with 405 inhabitants each on average, and it was located in a
province where 31 percent of the population was urban. The province's population was 1.13
percent of the total national population and it owned 356 villages in total.
To compare the numbers in Table 3 to total national measures, keep in mind Table 2:
Table 2. Total population, urbanization level and number of
provinces in Turkey in 1940 and 1945.
Year 1940 1945
National population 17,820,950 18,790,174
Level of urbanization 24.39 % 25.08 %
Number of provinces 63 63
Source: General Statistical Office (1950)
Table 3 at a glance, with no deeper analysis, would provide evidence that the level of
urbanization was not a decision factor for the location of the VIs. The highest urbanization is
observed in Istanbul with 82 percent in 1940, with İzmir as the closest follower with 51 percent.
The minimum urbanization level belonged to Bingöl with 5.7 percent; and 54 cities (i.e.
provinces) out of 63 had an urban population between 10 and 30 percent. The distribution of the
cities in Table 3 in terms of urbanization level displays a similar spread to the national one;
therefore it is hard to see a pattern for choice of location for VIs in regards to urbanization levels.
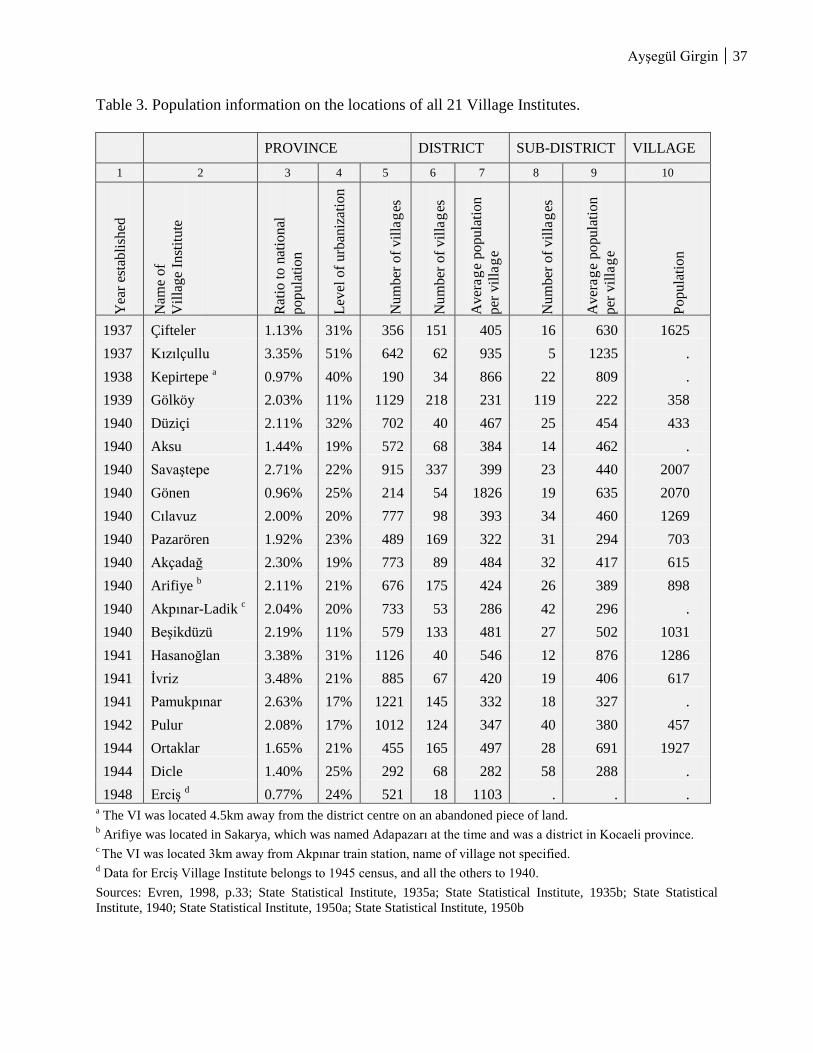
Ayşegül Girgin 37
Table 3. Population information on the locations of all 21 Village Institutes.
PROVINCE DISTRICT SUB-DISTRICT VILLAGE
1 2 3 4 5 6 7 8 9 10
Yea
r es
tab
lish
ed
Nam
e of
Vil
lag
e In
stit
ute
Rat
io t
o n
atio
nal
po
pu
lati
on
Lev
el o
f urb
aniz
atio
n
Nu
mb
er o
f v
illa
ges
Nu
mb
er o
f v
illa
ges
Av
erag
e p
opu
lati
on
per
vil
lag
e
Nu
mb
er o
f v
illa
ges
Av
erag
e p
opu
lati
on
per
vil
lag
e
Po
pu
lati
on
1937 Çifteler 1.13% 31% 356 151 405 16 630 1625
1937 Kızılçullu 3.35% 51% 642 62 935 5 1235 .
1938 Kepirtepe a 0.97% 40% 190 34 866 22 809 .
1939 Gölköy 2.03% 11% 1129 218 231 119 222 358
1940 Düziçi 2.11% 32% 702 40 467 25 454 433
1940 Aksu 1.44% 19% 572 68 384 14 462 .
1940 Savaştepe 2.71% 22% 915 337 399 23 440 2007
1940 Gönen 0.96% 25% 214 54 1826 19 635 2070
1940 Cılavuz 2.00% 20% 777 98 393 34 460 1269
1940 Pazarören 1.92% 23% 489 169 322 31 294 703
1940 Akçadağ 2.30% 19% 773 89 484 32 417 615
1940 Arifiye b 2.11% 21% 676 175 424 26 389 898
1940 Akpınar-Ladik c 2.04% 20% 733 53 286 42 296 .
1940 Beşikdüzü 2.19% 11% 579 133 481 27 502 1031
1941 Hasanoğlan 3.38% 31% 1126 40 546 12 876 1286
1941 İvriz 3.48% 21% 885 67 420 19 406 617
1941 Pamukpınar 2.63% 17% 1221 145 332 18 327 .
1942 Pulur 2.08% 17% 1012 124 347 40 380 457
1944 Ortaklar 1.65% 21% 455 165 497 28 691 1927
1944 Dicle 1.40% 25% 292 68 282 58 288 .
1948 Erciş d 0.77% 24% 521 18 1103 . . .
a The VI was located 4.5km away from the district centre on an abandoned piece of land.
b Arifiye was located in Sakarya, which was named Adapazarı at the time and was a district in Kocaeli province.
c The VI was located 3km away from Akpınar train station, name of village not specified.
d Data for Erciş Village Institute belongs to 1945 census, and all the others to 1940.
Sources: Evren, 1998, p.33; State Statistical Institute, 1935a; State Statistical Institute, 1935b; State Statistical
Institute, 1940; State Statistical Institute, 1950a; State Statistical Institute, 1950b

Ayşegül Girgin 38
On the other hand, the comparison between the seventh and tenth columns in Table 3 might hint
that village population could have been a factor of choice: All VIs were located in villages which
had a population above the average village population of the district they belonged to. Though
this could be coincidental, as the villages close to train stations tend to be larger in population
anyway.
Figure 1. Locations and names of the Village Institutes
Source: Köy Enstitüleri [Village Institutes] (2010)
Figure 1 illustrates the locations of the institutes on the map of Turkey. What this picture
indicates is that the aim could have been to locate them evenly across the country so that every
neighbouring city could have more or less equal distance to the institute. In other words, the
geographical distribution of VIs across the country displayed a "map of equal opportunity"
(Türkoğlu, 1997, p. 185).

Ayşegül Girgin 39
5.6. Other Attributes of the Village Institutes
5.6.1. Organization Structure
The Village Institutes demonstrated a unique system in terms of organization structure
compared to many other entities at the time. All the students were allowed and encouraged
to take part in the management along with the teachers, aiming to avoid the hegemony of the
principal and their assistants while letting the students internalize the fundamentals of
democracy in practice (Öztürk, 1961 cited in Şeren, 2008, p. 218).
The job descriptions within the organization of the institutes are summarized below:
Managers:
The principal was responsible from providing the instructors, teachers, advisors and the
inspectors with the necessary resources, tools and information while closely following their
progress.16
S/he in the beginning used to work together with a head of education and an
assistant. In addition, s/he used to receive assistance from the head of arts, head of
workshops, head of agriculture, head of music and head of health. The head of education
was responsible from all activities regarding the education of the students (Binbaşıoğlu,
1997, pp. 35-36).
Board of teachers:
The board of teachers would organize meetings regularly to discuss problems and take
decisions (Binbaşıoğlu, 1997, p. 36).
16
Köy Okulları ve Enstitüleri Teşkilat Kanunu [Village Schools and Institutes Organization Law], Article:38

Ayşegül Girgin 40
Group leader ["küme başı"]:
In every classroom was a teacher who would help the students on a wide variety of matters
including private issues. These teachers, who were called "group leaders" in the beginning,
were later named "classroom teachers" (Binbaşıoğlu, 1997, p. 36).
Expert students:
There were also a few students who had expertise in a specific area such as ironworking,
carpentry or weaving, and would have similar responsibilities to that of the teachers
(Binbaşıoğlu, 1997, p. 36).
5.6.2. Students’ Active Participation in Management and Upkeep
Each grade in VIs elected a representative group who would be responsible from managing
the activities and solving problems. At the end of each week there would be an assembly
where the representatives of the week would present a detailed report of what they had done
the whole week and the audience would challenge them with a critical discussion
(Binbaşıoğlu, 1997, p. 37). In these sessions, the students were also allowed to evaluate the
decisions of the management and could freely object to the principal's or the teachers'
actions. This was not only expected to equip the students with problem solving and
management skills, but also a better understanding of democracy through practice, which
was still a new term for the Turkish nation.
The VIs did not employ any caretakers or janitors. There were only one cook, one scullion
and a person to do the laundry. The students worked in shifts to clean, organize and manage
the classrooms, bathrooms, restrooms, dorms, workshops and any other facility located in
the campus (Binbaşıoğlu, 1997, p. 37).
Ayşegül Girgin 41
5.6.3. Extra-curricular Activities
The students usually started the day very early with playing national games or performing a
short session of folk dancing together in the school yard for morning exercise, after which
they would spend another hour before breakfast reading newspapers and books
(Binbaşıoğlu, 1997, p. 37).
Saturday evenings were occasionally reserved for entertainment. The students usually
organized concerts or wrote dramas themselves and performed them for the neighbouring
residents to watch, including the governors of the area (Binbaşıoğlu, 1997, p. 37).
Considering that cities and districts remote from the biggest few cities did not have much
opportunity to watch a concert or a theatre play at the time, these activities became good
ways at letting the rural population experience the wonders of art.
5.7. Village Institutes of Higher Education
According to the Village Institute Law the VIs could only employ teachers who graduated from
teacher training schools, vocational high schools or universities. However, the graduates of these
schools usually came from an urban culture, which sometimes made it hard for them to adapt to
village conditions and communicate well with the villagers. This led to the idea of establishing a
higher institute as an extension of the original VIs. Students who successfully completed their
five year education at a secondary level VI would be allowed to apply to the higher institute and
would be employed in VIs after graduation (Aydın, 2007, p. 99).
Hasanoğlan Institute of Higher Education was established in the same campus as its secondary
level counterpart, located 32 kilometers from Ankara (the capital city) at the skirts of the
mountain Elmadağ. The students were selected according to the results of an examination that
they would take after application. The first group of students that started their higher education

Ayşegül Girgin 42
here in 1942 was from Kızılçullu and Çifteler, which were the oldest two institutes (Aydın, 2007,
p. 100). In the coming years, the origins of the new students were more evenly distributed to
allow similar opportunities to the graduates of all VIs (Aydın, 2007, p. 101).
In the higher institutes which provided a 3-year education, at the end of every academic year the
students needed to work as interns in secondary level VIs for two months. Towards the end of
their final year, they had to prepare a research project about villages and village education. These
projects were usually published afterwards for the benefit of the other VIs (Aydın, 2007, p. 101).
This higher VI developed into a form of folk university that would seek solutions for the
problems of villages and the VIs (Arayıcı, 1999b, p. 248). However, Hasanoğlan Village
Institute of Higher Education became the focal point of discussions during the transition from
one-party regime to a multiple-party parliament (Başaran, 2003, pp. 100-101), and was finally
terminated on 27th November, 1947 (Aydın, 2007, p. 103). The students who were close to
graduation at the time were taken for military service but they were recruited as sergeants
although their level of education would allow them to be reserve officers. They ended up having
a lower rank in the military as the new Minister of Education tagged them as potential left-wing
anarchists (Aydın, 2007, p. 103).
5.8. Academic Literature on the Village Institutes
Most studies discuss the VIs from a sociological, political and educational perspective. Yet little
has been investigated through economic lenses. Fay Kirby’s PhD work which she submitted to
Columbia University Teachers College in 1962 is probably the most detailed narrative on the
story of the Village Institutes, though from an educational perspective. Despite including a sub-
section with an economic approach, the publicly available copy of her work does not present any
Ayşegül Girgin 43
quantitative analysis, and nothing could be confirmed as to whether the original dissertation17
included such analysis. Kirby’s (1962) discussion on the economic impacts of the VIs will be
reported in section 6.1 on page 49.
Vexliard & Aytaç (1964) report the story and the attributes of the VIs as a well-organized
summary while presenting short interpretations of their roles from an educational perspective.
Another PhD dissertation18
was submitted by M. Asım Karaömerlioğlu to the Ohio State
University Department of History in 1999. This work aimed to “challenge many mainstream
historiographical views which have been the cornerstones of history writing in Republican
Turkey” (p. 295), thus did not provide any quantitative approach to the economic impacts of the
institutes. Keseroğlu (2005) discusses the story of Village Institutes in terms of spreading
libraries and encouraging reading in Turkey. Arayıcı (1999a) presents an education perspective
on the institutes as well, though very briefly commenting on the possible effects on the socio-
economic development of the nation, however, with no quantitative inquiry and evidence. Şeren
(2008) presents an educational approach to the phenomenon, discussing the role and success of
the VIs as teacher-training institutions. Uygun (2008) spares a section for the story of the VIs in
order to pursue the main aim of discussing the impact of John Dewey, an American philosopher
and educator, on the teacher education system in Turkey. Finally, despite not being published in
a journal, Baran & Şahin (n.d.) too discuss the educational role of the institutes and the extent to
which they reflect John Dewey’s philosophy. There are a number of other publications which
either focus entirely on the Village Institutes or spare a section for it in the broader context of
17
The original dissertation is named “The Village Institute Movement of Turkey: An Educational Mobilization for
Social Change”.
18 The title of Karaömerlioğlu’s (1999) dissertation was “The cult of the peasant: Ideology and practice, Turkey,
1930-1946”.
Ayşegül Girgin 44
education and social development, yet they are not entirely relevant to the purpose of this study
which approaches the issue from an economic perspective.
As far as an economic focus is concerned, Şimşek19
(2006) is therefore the only work that was
possible to retrieve, which attempted to explain the impact of the VIs on agricultural productivity
through an econometric analysis. In the first part of the investigation, Şimşek (2006) utilizes an
analysis of panel data of 51 provinces covering the period 1949-52 in an effort to explain the
variations in total cereal output with the variations in total area sown, value of machinery, annual
rainfall, a set of VI factors20
and a dummy to control for unspecified factors (pp. 14-15). The
results of the analysis unfortunately show no statistically significant evidence for a positive
relationship between the VI-related factors and cereal output (Şimşek, 2006, p. 15). On the other
hand, the second part of the analysis provides evidence that the VIs contributed highly to raising
the human capital in Turkey by spreading education and increasing the literacy rates (Şimşek,
2006, p. 15). To interpret the findings of his analyses, Şimşek (2006) suggests:
The Village Institutes were successful in spreading education but they
probably did not have a significant effect in raising the short term
agricultural productivity of villages. The difficulties of teachers in
conducting the dual farmer-teacher role, the low quality of the land
assigned to them, and adverse relations between the teachers and the rest
of the village (Stirling, 1965, pp. 276-277) might explain the apparent
lack of the short term economic impact. Nevertheless, the Village
Institutes might have had a positive long term impact on Turkish
economy since they increased the human capital by spreading elementary
education and raising literacy rates. (p. 15)
19
Being a PhD student at the time, Alp Şimşek’s study was a term paper for the Economic History course in the
Massachusetts Institute of Technology in 2006 with the title “An Economic Look at the Village Institutes”.
20 The three VI-related factors were: (1) the number of village teachers who own a VI diploma, (2) yearly average
number of VI graduate teachers in the province in the past three years, and (3)yearly average number of VI
graduate teachers in the province in the past five years (Şimşek, 2006, pp. 14-15)
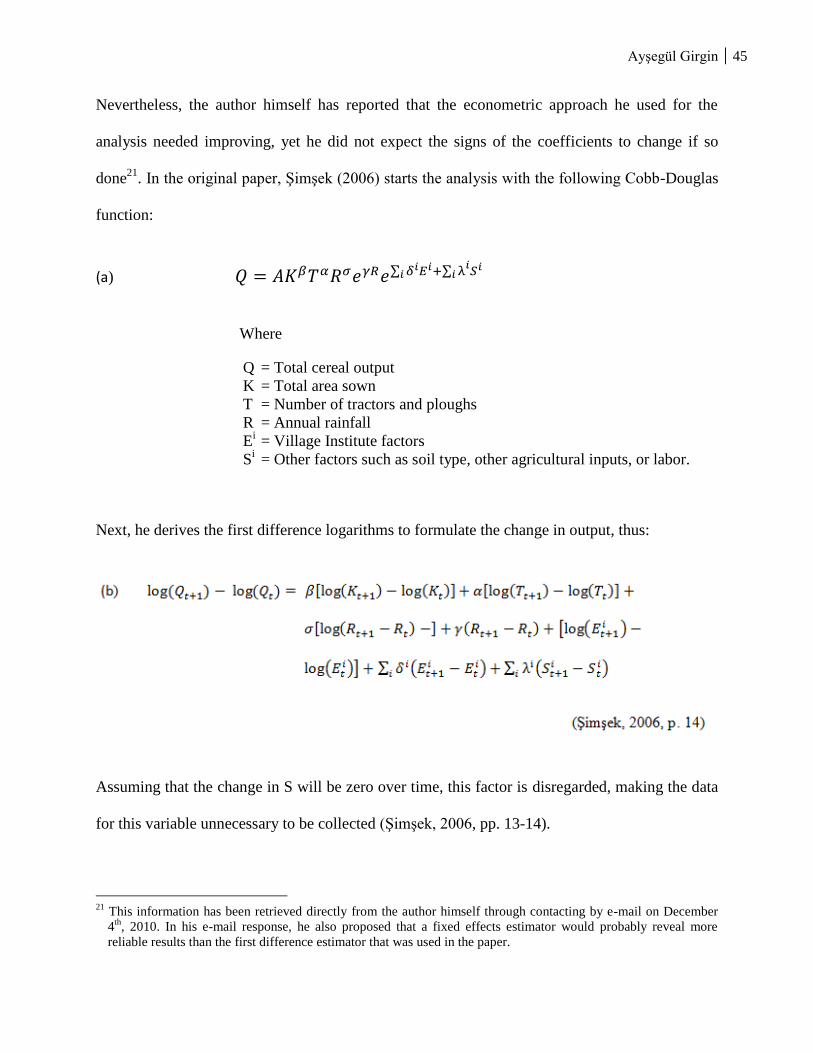
Ayşegül Girgin 45
Nevertheless, the author himself has reported that the econometric approach he used for the
analysis needed improving, yet he did not expect the signs of the coefficients to change if so
done21
. In the original paper, Şimşek (2006) starts the analysis with the following Cobb-Douglas
function:
(a)
Where
Next, he derives the first difference logarithms to formulate the change in output, thus:
Assuming that the change in S will be zero over time, this factor is disregarded, making the data
for this variable unnecessary to be collected (Şimşek, 2006, pp. 13-14).
21
This information has been retrieved directly from the author himself through contacting by e-mail on December
4th
, 2010. In his e-mail response, he also proposed that a fixed effects estimator would probably reveal more
reliable results than the first difference estimator that was used in the paper.
Q = Total cereal output
K = Total area sown
T = Number of tractors and ploughs
R = Annual rainfall
Ei = Village Institute factors
Si = Other factors such as soil type, other agricultural inputs, or labor.

Ayşegül Girgin 46
At this point, it is important to mention that Şimşek’s choice of first differences limits the
analysis to modeling the annual changes in a relatively shorter period (1949-52), whereas the
model that will be used in this thesis allows investigating the impact of various factors on wheat
productivity over a longer period of time (1940-66). The details of the model chosen for this
thesis will be explained further in section 7.
5.9. Counter-arguments on the Village Institutes
The reasons behind the official decision to terminate the Village Institutes could be traced back
to political as well as pedagogical perspectives (Stone, 1974, p. 423). The Village Institutes have
attracted much criticism, most of which focused on (1) their efforts to raise revolutionary
mentality among the students (Vexliard & Aytaç, 1964, p. 45) and (2) labour intensive workload
which did not let the students improve themselves in the cultural field (Yener, 1999; Turan,
1979, p. 168). Moreover, the villagers accused the teachers of not “showing a good example
from the religious standpoint” (Vexliard & Aytaç, 1964, p. 45).
One of the core aims of the VIs was to train teachers who would best fit the rural conditions and
customs. However, Dr. Mümtaz Turhan22
– Professor of Experimental Psychology at Istanbul
University back then – suggested that “the graduates of the VIs were simply disaffected and
alienated from rural customs” (Stone, 1974, p. 424). He defended that the VI students were too
young and inexperienced to overcome the resistance from the inhabitants of the villages they
have been sent to (Stone, 1974, p. 424). At this point, one must keep in mind that the graduates
were assigned such excruciating responsibility: They were obliged to teach the villagers new
techniques in agriculture which they have never heard of before, make them start cultivating
22
“One of the most prestigious opponents of the Village Institutes was Dr. Mümtaz Turhan, then Professor of
Experimental Psychology at Istanbul University. His attacks on the Village Institutes were all the more influential
because he was of eastern Anatolian stock and had kept in touch with village conditions.” (Stone, 1974, p. 423)
Ayşegül Girgin 47
crops they have never grown before or adopt a completely new approach to agriculture. While
doing so, they had to abolish the dogmas and the old customs that the villagers had established
centuries ago. Besides, the teachers were already despised by some of the villagers for their
superiority, which is not at all surprising. Leaving the village as an 11 year old child, the
graduate of the VI comes back to his village as a 16 year old young teacher who is obliged by
law to make the villagers adopt the new techniques in agriculture as well as broaden or even
change their perspectives in more abstract fields like literature, drama, philosophy, religion and
politics. As the most knowledgeable and educated person in the village, the 16 year old village
teacher was most certainly exposed to some level of jealousy and resistance, one of the reasons
being that the age hierarchy is a core element of Turkish culture.
Another argument presented by Dr. Turhan is that the VI graduate teachers did not train the
children to enable their admission to institutions of secondary and higher education (Turhan,
1967 as reviewed in Stone, 1974 p.424). Therefore it can be suggested that Dr. Mümtaz Turhan’s
criticisms regarded the contribution of the VIs to formal education rather than agricultural
productivity and thus will not be further discussed in this paper.
A further criticism was charged by Nureddin Ergin, who directed his focus on the living
conditions at the institutes. He suggested, through his observations at the VI in Adapazarı at the
North West region of Turkey, that the students’ health was destroyed by the harsh schedule,
primitive living conditions, heavy physical labor and inadequate diet (Stone, 1974 p.424).
Moreover, he commented on the lack of democracy and science at the institutes, which was
completely against the principles of the VI system (Stone, 1974 p.425).

Ayşegül Girgin 48
The Village Institutes received intensive negative opinions in terms of their distance to religion.
Among these stands out the writings of Nurettin Topçu, an academic in history, who holds a
doctorate from the Sorbonne in France (Stone, 1974, p.426). He claimed that the efforts to
Europeanize the Turkish youth were inappropriate and a distinctively Islamic renaissance should
instead be encouraged (Stone, 1974, p.427). This advice appealed to many Turkish Muslims and
they considered the advocators of the VIs “godless communists”. Having been considered a
“religious reactionary” by intellectuals, Topçu’s “arguments have been ignored by the makers
of Turkish educational policy in the Ministry of Education.” (Stone, 1974, p. 427).
In addition to the above, there were other reasons behind the VIs termination which were less
pronounced yet more effective. Parvin & Hiç (1990) suggest that a good number of seats in the
parliament supporting the Republican government were occupied by large land owners at the
time (p.212). The efforts to establish the land reform was the first action from the government
which put their authority and well-being at risk, and now the VIs were training highly skilled and
well educated teachers who had the duty of raising awakened peasants (Ahmad, 1993, p. 83). On
the other hand, “the landlords were loath to see literate and politicized peasants who understood
their rights and were capable of articulating their grievances” (Ahmad, 1993, p. 82). Feeling
threatened by the VIs efforts to awaken the peasants (Karaömerlioğlu, 1998a, p. 62), the aghas
and big landowners joined forces under the roof the new and expanding Democratic Party (DP)
in 1946, ending the single-party regime (Parvin & Hiç, 1990, p. 212). They denounced étatism
and encouraged liberal economy, while rejecting land reform and supporting agricultural reform
instead (Parvin & Hiç, 1990, p. 212).

Ayşegül Girgin 49
6. THE INFLUENCE OF THE VILLAGE INSTITUTES
In this chapter, the impacts of VIs on the economy, agriculture and community development will
be discussed. As the previous literature regarding this field lacks useful quantitative analysis, the
discussion on the VIs’ influence will have to remain highly hypothetical. Some examples from
the story of the VIs will be presented in order to create an understanding of why one must expect
positive influences from the institutes, yet the individual effects of these examples will not be
quantified.
6.1. On the Economy
Kirby (1962) posits that the VIs had valuable contributions to the economic lives of the villages
that were located nearby and quotes the following observations about how the economy was
revived by the Village Institute that was located in the Hasanoğlan Village in Ankara:
By becoming a market for the neighbouring villages, Hasanoğlan village
slowly adopted features of township. The inhabitants of Hasanoğlan village
applied to the related institutions to obtain a permit for setting a bazaar
once every week. There were also some who attempted to construct a hotel
in the village. The shops increased their supply and the variety of products,
bringing economic competition to the village. (Yasa, 1955, p. 238-9 cited
in Kirby 1962, p. 296, translated by Ayşegül Girgin)
Kirby (1962) also discusses the indirect impacts of the VIs on the economy of their
neighbourhood. For example, a section for goods trains was constructed at the train station near
Hasanoğlan VI in order to deliver supplies to the institute, which in time was also utilized by the
other economic entities in the area and along the route (Kirby, 1962, p. 298). Similarly, a bridge
was constructed for Düziçi VI in Adana, which eventually connected the villages and district
centres with the urban city centre (Kirby, 1962, p. 298). Gönen VI in Isparta was located in an
Ayşegül Girgin 50
area which was potentially wealthy yet was isolated from the market due to insufficient
availability of transportation. Therefore this region was among the first to be part of the new road
construction project after the Second World War, thanks to the formal endeavours of Gönen VI
(Kirby, 1962, p. 298). Pazaören VI in Kayseri constituted a major reason for the regular
maintenance and improvement of a 50 km stretch of road which was immensely important for
the interaction of the villages with the urban centres (Kirby, 1962, p. 298).
The direct economic impacts of the institutes have been discussed by Kirby (1962) through the
initiatives they have started due to lack of opportunities. For example, the infertility of the land
provided to Arifiye VI in Adapazarı made them focus on fishing in the nearby lake Sapanca,
which the inhabitants had not until then thought of doing at a commercial level. The institute also
planted fruit gardens in the area, a practice which was not widely spread before. Soon, the area
became an important supplier of fish and fruits, whose market extended even to Istanbul (Kirby,
1962, p. 299). Another VI which focused on fishing due to land infertility was Beşikdüzü VI in
Trabzon. Due to the tough conditions for fishing in the Black Sea, Beşikdüzü VI found a way to
compete in the fish market by starting a tinning industry, producing canned fish (Kirby, 1962, p.
300). Kepirtepe VI in Kırklareli, a city located in the European region of Turkey, brought an
important benefit to its neighbourhood by constructing the first artesian well, providing sanitised
drinking water to the village. The news spread quickly and a number of other wells were
constructed by other farmers throughout the European side. Previously low-yield fields became
the main source of fruits and vegetables for large cities like Edirne and İstanbul. Soon land
reclamations began and land prices increased in the area (Kirby, 1962, p. 300).
Nevertheless, Kirby (1962) argues that one must not expect to observe the true economic impacts
of the institutes as their initial system survived for only 6 years before they reduced emphasis on

Ayşegül Girgin 51
work education (p.302). Kirby’s study does not present any statistical analysis on the economic
impacts as it was a dissertation for her PhD in the field of education, not economics. In this
study, the contribution, if any, of the VIs to agricultural productivity growth will be analysed as
far as the data in hand allows.
6.2. On Agriculture
The VIs did not work in a closed system. They were always in interaction with the public. Article
no.6 in the Law of Village Institutes obliged the VI graduates to serve as village teachers back in
their home villages with the parallel duty of teaching the villagers agricultural techniques and
how to approach agriculture in a scientific way by applying these methods on the fields, gardens
and workshops provided to them by the government (Şeren, 2008). First of all, the villagers
could easily see what the students were doing on the field. There is a convincingly large number
of written accounts in which VI teachers and graduates tell of villagers visiting their fields and
challenging their agricultural method. In time, as they saw that the students were making many
things possible on those fields which the villagers once thought were impossible, they
themselves started to adopt those techniques or retrieve the same materials to use in their own
fields. The excerpt from the memoirs of a VI graduate on page 52 is interesting in the way that it
pictures the agricultural knowledge spillover process that initiated once he started teaching at his
home village.
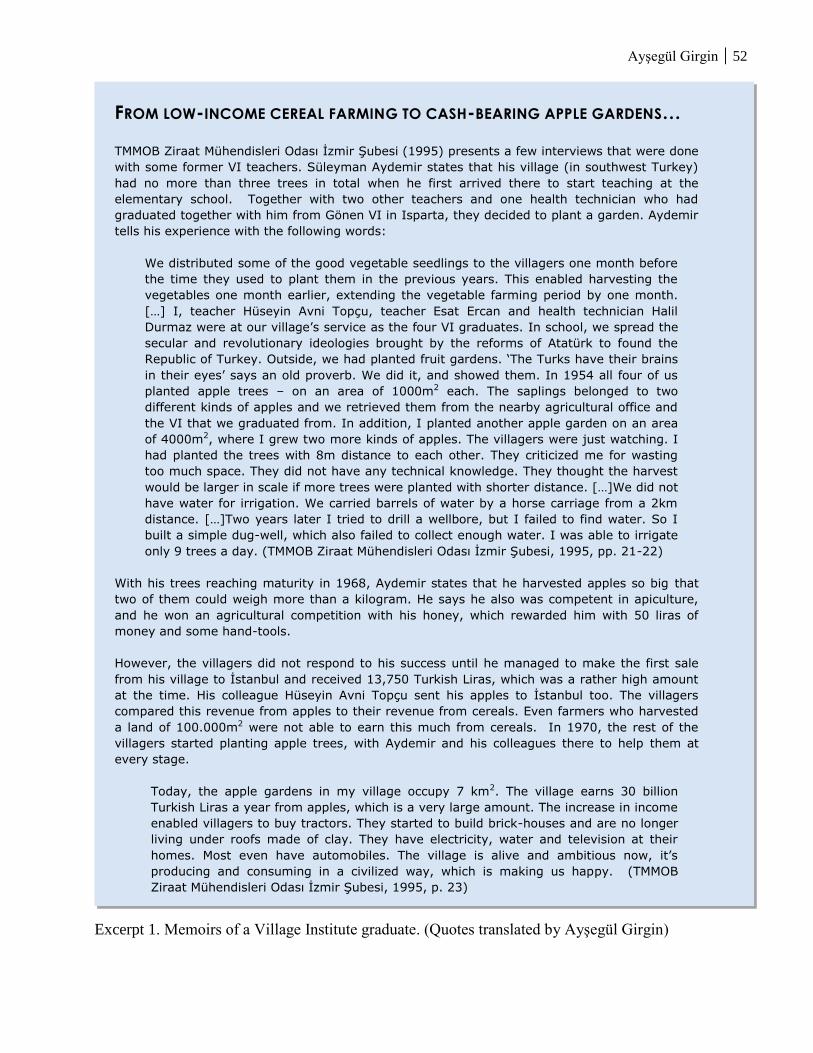
Ayşegül Girgin 52
FROM LOW-INCOME CEREAL FARMING TO CASH-BEARING APPLE GARDENS…
TMMOB Ziraat Mühendisleri Odası İzmir Şubesi (1995) presents a few interviews that were done
with some former VI teachers. Süleyman Aydemir states that his village (in southwest Turkey)
had no more than three trees in total when he first arrived there to start teaching at the
elementary school. Together with two other teachers and one health technician who had
graduated together with him from Gönen VI in Isparta, they decided to plant a garden. Aydemir
tells his experience with the following words:
We distributed some of the good vegetable seedlings to the villagers one month before
the time they used to plant them in the previous years. This enabled harvesting the
vegetables one month earlier, extending the vegetable farming period by one month.
[…] I, teacher Hüseyin Avni Topçu, teacher Esat Ercan and health technician Halil
Durmaz were at our village’s service as the four VI graduates. In school, we spread the
secular and revolutionary ideologies brought by the reforms of Atatürk to found the
Republic of Turkey. Outside, we had planted fruit gardens. ‘The Turks have their brains
in their eyes’ says an old proverb. We did it, and showed them. In 1954 all four of us
planted apple trees – on an area of 1000m2 each. The saplings belonged to two
different kinds of apples and we retrieved them from the nearby agricultural office and
the VI that we graduated from. In addition, I planted another apple garden on an area
of 4000m2, where I grew two more kinds of apples. The villagers were just watching. I
had planted the trees with 8m distance to each other. They criticized me for wasting
too much space. They did not have any technical knowledge. They thought the harvest
would be larger in scale if more trees were planted with shorter distance. […]We did not
have water for irrigation. We carried barrels of water by a horse carriage from a 2km
distance. […]Two years later I tried to drill a wellbore, but I failed to find water. So I
built a simple dug-well, which also failed to collect enough water. I was able to irrigate
only 9 trees a day. (TMMOB Ziraat Mühendisleri Odası İzmir Şubesi, 1995, pp. 21-22)
With his trees reaching maturity in 1968, Aydemir states that he harvested apples so big that
two of them could weigh more than a kilogram. He says he also was competent in apiculture,
and he won an agricultural competition with his honey, which rewarded him with 50 liras of
money and some hand-tools.
However, the villagers did not respond to his success until he managed to make the first sale
from his village to İstanbul and received 13,750 Turkish Liras, which was a rather high amount
at the time. His colleague Hüseyin Avni Topçu sent his apples to İstanbul too. The villagers
compared this revenue from apples to their revenue from cereals. Even farmers who harvested
a land of 100.000m2 were not able to earn this much from cereals. In 1970, the rest of the
villagers started planting apple trees, with Aydemir and his colleagues there to help them at
every stage.
Today, the apple gardens in my village occupy 7 km2. The village earns 30 billion
Turkish Liras a year from apples, which is a very large amount. The increase in income
enabled villagers to buy tractors. They started to build brick-houses and are no longer
living under roofs made of clay. They have electricity, water and television at their
homes. Most even have automobiles. The village is alive and ambitious now, it’s
producing and consuming in a civilized way, which is making us happy. (TMMOB
Ziraat Mühendisleri Odası İzmir Şubesi, 1995, p. 23)
Excerpt 1. Memoirs of a Village Institute graduate. (Quotes translated by Ayşegül Girgin)

Ayşegül Girgin 53
The example presented in Excerpt 1 on page 52 is unique in its details, yet highly similar to
numerous other success stories told by many other VI teachers and graduates (Aydın, 2007;
TMMOB Ziraat Mühendisleri Odası İzmir Şubesi, 1995; Şimşek, 2006). This kind of spillover is
essential as it usually results in a better product and/or increased productivity or at least
increased variety, which consequently increases the farmers’ income.
The effects of VI graduates, however, were not only about unintentional knowledge spillovers.
They had direct effects in agricultural productivity, as they themselves spent valuable efforts to
help the villagers directly in various ways from suggesting new techniques to giving them new
and healthy saplings and seedlings (TMMOB Ziraat Mühendisleri Odası İzmir Şubesi, 1995). In
many occasions, the emergence of a VI in a village brought many developments in the
infrastructure, such as drainage of swamps, building aqueducts and bridges, drilling wells and
planting gardens and forests, while teaching the villagers why they were necessary and how they
could be constructed and maintained (Stone, 1974; TMMOB Ziraat Mühendisleri Odası İzmir
Şubesi, 1995).
The institutes aimed to equip the students in a way that would enable them to approach
agriculture in a scientific way. They would learn how to analyze the products and the soil to
improve their products. In addition to this, they would know the scientific facts that explained
how certain methods worked to increase productivity in agriculture. They were expected to use
this background to choose or develop the best combination for matters related to irrigation,
fertilizer, planting schedule and choice of seeds that would survive best in the climate and soil
conditions of the field they were farming on. All these efforts were to increase the productivity
as well as increasing the quality of the harvest. The same approach applied to the other branches
Ayşegül Girgin 54
of agriculture such as horticulture, sericulture, apiculture and fishing (Altunya, 2000; Evren,
1998; Binbaşıoğlu, 1997; Kirby, 1962; Uygun & Kıncal, 2006; Karaömerlioğlu, 1998b).
6.3. On Community Development
Knowledge spillover did not exist only in agriculture, but also in arts and ideologies. Besides
unintentional natural spillovers, the VIs intended to spread knowledge intentionally through the
events they arranged for public.
Firstly, as previously mentioned, the Saturday night events were a great way for the
neighbourhood to socialize while enriching their ideological world through the plays they
watched or widening their musical perspectives by attending the concerts given by VI students
(Aydın, 2007). This way, the rural population, most of whom were illiterate, was now able to at
least grab a small piece from the cake of enlightenment. In addition to this, one would expect
that the graduates of VIs were making an effort to integrate their own students into performing
various types of arts once they become teachers in their home-villages, expanding the influence.
Secondly, the political ideologies were spreading from the VIs. The students were raised by
Kemalist teachers and living in a highly democratic environment which made them strong
defenders of terms like secularism, nationalism, populism, republicanism and democracy (Keleş,
2007). In this case, one might say it would not be wrong to expect such thoughts to be reflected
on the dramas that they wrote and played for public, if not already spreading through their daily
conversations. Moreover, once they became teachers themselves, it would not be absurd to
predict that the graduates of VIs were probably raising their own students in the light of their
ideologies.

Ayşegül Girgin 55
7. METHODOLOGY, DATA AND MEASURES
In this chapter, once the choice of statistical model for the analysis of data is introduced, the
dimensions of the data will be explained. These will be followed by the descriptions of the
sources of data, the definitions of the variables and finally the explanation of the regression
model that will be used in order to investigate the interactions between the Village Institutes
(VIs) and wheat productivity.
7.1. Choice of dimension
As mentioned before, the main focus of this study is quantifying the extent to which the
variations in wheat output per area (denoted by WY) can be explained by the variations in the
number of village school teachers who own a Village Institute diploma (denoted by VIGT), in
the Republic of Turkey, controlling for the variations in rainfall, elevation of the area from sea
level, use of tractors and literacy rates. To answer this question, a set of data will be analyzed
through pooled OLS regression of panel data, which is described as a set of data with both
longitudinal and cross-sectional dimension.
The cross-section of Turkey with 63 cities will enable controlling for the geographical
differences, whereas the longitudinal dimension will account for the changes through time.
Moreover, panel data provides more observations, and is less vulnerable to multicollinearity
problems (Gujarati, 2004, p. 637) compared to a set with one dimension, being cross-sectional or
longitudinal.
Time span
The scale of this study’s data set was highly dependent of the accessibility of data. After
thorough exploration of various statistical records such as censuses and yearbooks that were

Ayşegül Girgin 56
published both comprehensively and individually from 1927 to 2010, it was observed that the
format and the content of a series of statistics could vary through different years of publishing.
For example, the number of tractors and wheat yield are listed in the yearbook at province level
one year, but only at national level another year. Similarly, the rainfall data is listed nominally in
one year and as an average of the past several years in the yearbook of another year. Such non-
uniformity in the availability of data required cropping the span of the data set down to a range
that covers specifically the years 1940, 1941, 1942, 1964, 1965 and 1966.
Spatial dimension
The Republic of Turkey currently consists of 81 provinces. However, back in the 1927 there
were 58 provinces, increasing to 67 in 1955. This was not because the borders of the Republic
expanded, but because some provinces grew to such a great extent in population that they needed
to assign province status to distant regions with enough population to achieve administrative
efficiency. Therefore, for each year, 46 to 66 cities are used in the analysis, depending on which
cities (i.e. provinces) have the data for all the variables in the model. This is achieved by carrying
the analysis with SPSS (statistical analysis software) and choosing the option to omit the data
points which lack a variable or more.
7.2. Data Sources
The data collected for this thesis were retrieved from two government institutions: (1) Turkish
Statistical Institute23
(TurkStat), which is run by the Prime Ministry of Republic of Turkey, and
(2) Turkish State Meteorological Service24
(TSMS), which is run by the Ministry of Environment
23
Official title of the organization in Turkish is “T.C.Başbakanlık Türkiye İstatistik Kurumu” (TÜİK). Official
website: www.tuik.gov.tr.
24 The official title of the organization in Turkish is “T.C.Çevre ve Orman Bakanlığı Devlet Meteoroloji İşleri Genel
Müdürlüğü” (DMİ). Official website: www.dmi.gov.tr.
Ayşegül Girgin 57
and Forestry of the Republic of Turkey. During the life of the republic, TurkStat changed its
name a few times, and therefore appears as State Institute of Statistics25
or General Statistical
Office26
as well as TurkStat in the citations made in this study.
Problems Related to Data
The data retrieved from TurkStat were in the form of scanned images which were difficult to
transfer into the statistical analysis software. As the original hard copies of some of these
documents have been damaged in the archives it has made the transfer process even more
complex. This unfortunately brings together the suspicion that some of the numbers that are used
in the analysis may be slightly different from reality due to readability problems.
The data on rainfall, retrieved from TSMS, has been obtained directly in spreadsheet format.
However, it must be noted that the data belonging to the period before 1975 has not gone through
quality control tests at TSMS, for which reason it is not certain that the data is entirely correct.
7.3. Variable Descriptions
Wheat Yield (WY)
Wheat yield is described as the kilograms of output per hectares of area sown for wheat. The
output and area sown are usually given separately in the original sources, making is possible to
calculate the yield by dividing the former by the latter.
The plausible problem with the variable is that the records were kept according to the forms
collected from individual farm owners. With the average literacy rate of approximately 20
25
The Turkish name of the institution is “Devlet İstatistik Enstitüsü”.
26 The Turkish name of the institution was “İstatistik Umum Müdürlüğü” in the early years of the republic which
was later replaced by “İstatistik Genel Müdürlüğü”.

Ayşegül Girgin 58
percent in the 1940s and 28 percent in the 1960s, one unfortunately cannot expect the farmers to
be adequately precise in their book keeping.
Village Institute Graduate Teachers (VIGT)
This term refers to the number of elementary village school teachers in a province who have a
Village Institute diploma. The numbers have been transferred from the archives of TurkStat that
belong to the category of National Education Statistics and Statistics of Ministry of Education27
.
If the analysis could be carried out to cover the years 1942-1952, then it would have been
possible to use the individual VIGT values that were observed each year. Unfortunately, the
output of wheat per area is not available for these years. Therefore the value of VIGT will be
zero for those years of analysis in the 1940s because the first batch of students graduated in
1942, whereas the value of VIGT in 1952 will be assumed to be constant through the years 1964-
1966. This brings the limitation of accounting for the changes in the number of VI graduate
teachers through time, due to various reasons such as immigration, death or change of career.
However, the spatial variation for this variable, i.e. the variation across provinces, is still likely to
have remained more or less the same.
Literacy Rate (LR)
Literacy rate refers to the number of people above the age of 7 (or 5 or 6 according to the year of
census) who can at least read but not necessarily write in comparison to the total population. The
values are in percentages and the numbers used for calculation have been transferred from the
census records.
27
The terms are called “milli eğitim istatistikleri” and “maarif istatistikleri” in Turkish, respectively.
Ayşegül Girgin 59
Since census data was collected in 5 year periods, there is no individual literacy rate information
for every year. Therefore, the value of LR in 1935 will be used as a literacy proxy for the
observations in 1940-1942, and that in 1960 will be used as a proxy for the observations in 1964-
1966. This makes sense not only because literacy data does not exist for every year, but also
because literacy is expected to have medium and long term effect, thus making a 5 to7 year lag
legitimate for analysis.
Rainfall in Spring (SR)
SR refers to the total rainfall observed during the spring season, i.e. in March, April and May.
The rainfall observed in the spring is vital as several sources refer to the importance of rain
during this period (Smiley, Backhouse, Lucas, & Paulitz, 2009, p. 131; Ünal, Retrieved
15.02.2011).
Elevation (E)
Elevation refers to the location, in terms of the vertical distance from the sea level in meters, of
the meteorology station at which the rainfall data was recorded.
Tractors (T)
The abbreviation T refers to the number of tractors in each province. Although it does not seem
totally unreasonable to normalize this variable by area sown, the nominal figure is still useful as
a proxy for technology. The majority of provinces are of similar size anyway, with the exception
of the four large cities: İstanbul, Ankara, Adana and İzmir.
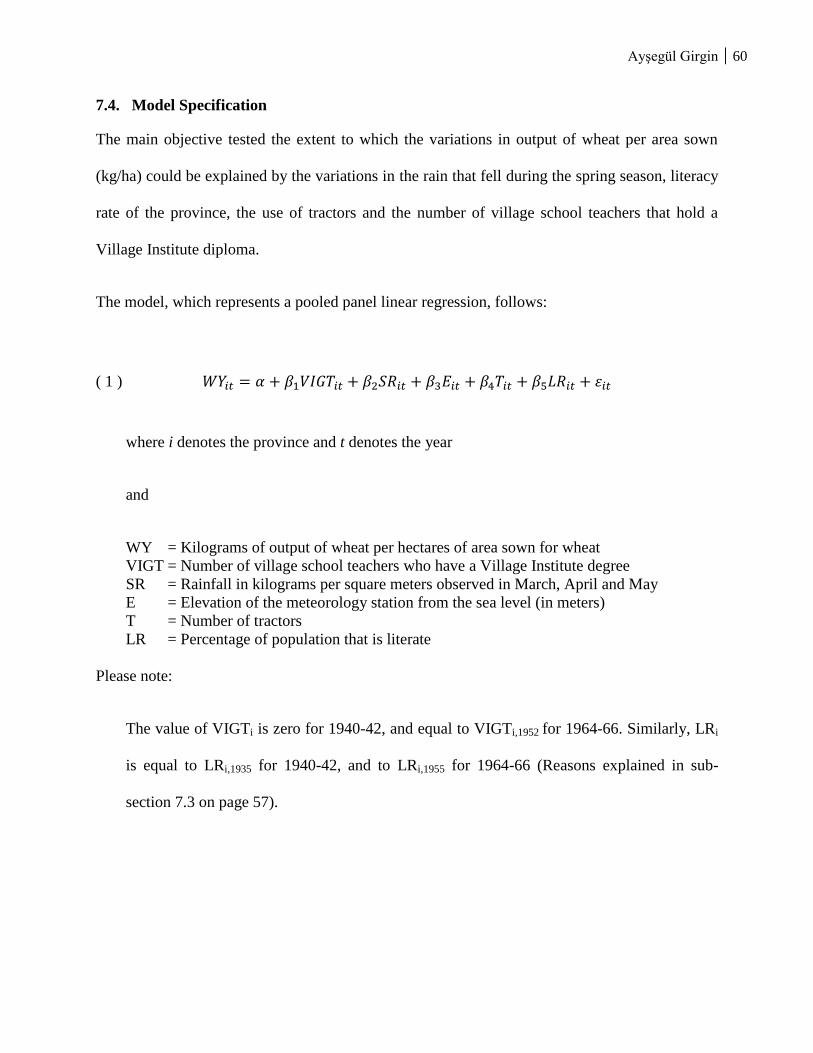
Ayşegül Girgin 60
7.4. Model Specification
The main objective tested the extent to which the variations in output of wheat per area sown
(kg/ha) could be explained by the variations in the rain that fell during the spring season, literacy
rate of the province, the use of tractors and the number of village school teachers that hold a
Village Institute diploma.
The model, which represents a pooled panel linear regression, follows:
( 1 )
where i denotes the province and t denotes the year
and
WY = Kilograms of output of wheat per hectares of area sown for wheat
VIGT = Number of village school teachers who have a Village Institute degree
SR = Rainfall in kilograms per square meters observed in March, April and May
E = Elevation of the meteorology station from the sea level (in meters)
T = Number of tractors
LR = Percentage of population that is literate
Please note:
The value of VIGTi is zero for 1940-42, and equal to VIGTi,1952 for 1964-66. Similarly, LRi
is equal to LRi,1935 for 1940-42, and to LRi,1955 for 1964-66 (Reasons explained in sub-
section 7.3 on page 57).

Ayşegül Girgin 61
8. DATA ANALYSIS AND RESULTS
This chapter is set aside for the results of the regression analyses which aim to investigate the
relationship between the number of village teachers who own a VI diploma (VIGT) and per area
wheat output (WY). Firstly, the adjustments made on the dataset and the treatment of the missing
values will be explained in section 8.1. In section 8.2, the results of the first group of regression
analyses will be presented. A positive coefficient with high statistical significance will be found
for the variable VIGT where WY is the dependent variable. A test for heteroscedasticity will also
be provided. In section 8.3, a reference will be made to Şimşek’s (2006) findings that the VI-
related factors interacted positively with literacy and parallel results will be obtained.
8.1. Modifying the Dataset
Certain adjustments have been made to the data in order to prepare it for analysis. The list of
modifications is as follows:
Treating the missing values:
1. The data sources retrieved from the Turkish Statistical Institute had total number of tractors
for the years of interest (i.e. 1940, -41,-42, -64,-65 and -66) at national level. The province
based distribution of these tractors was not available for the years 1940,-41,-42. Therefore
these values have been estimated by assuming that the growth rate in the total number applies
to the growth rate in individual provinces. The calculations are explained in APPENDIX C.
2. Province level literacy rates for 1940 were not available in the 1940 census. These values
have been estimated as the arithmetic average of the related values in 1935 and 1945.
Combining and eliminating data
The political map of Turkey has changed a number of times since the founding of the republic.
Some districts gained the status of a province, and some provinces went down to district status
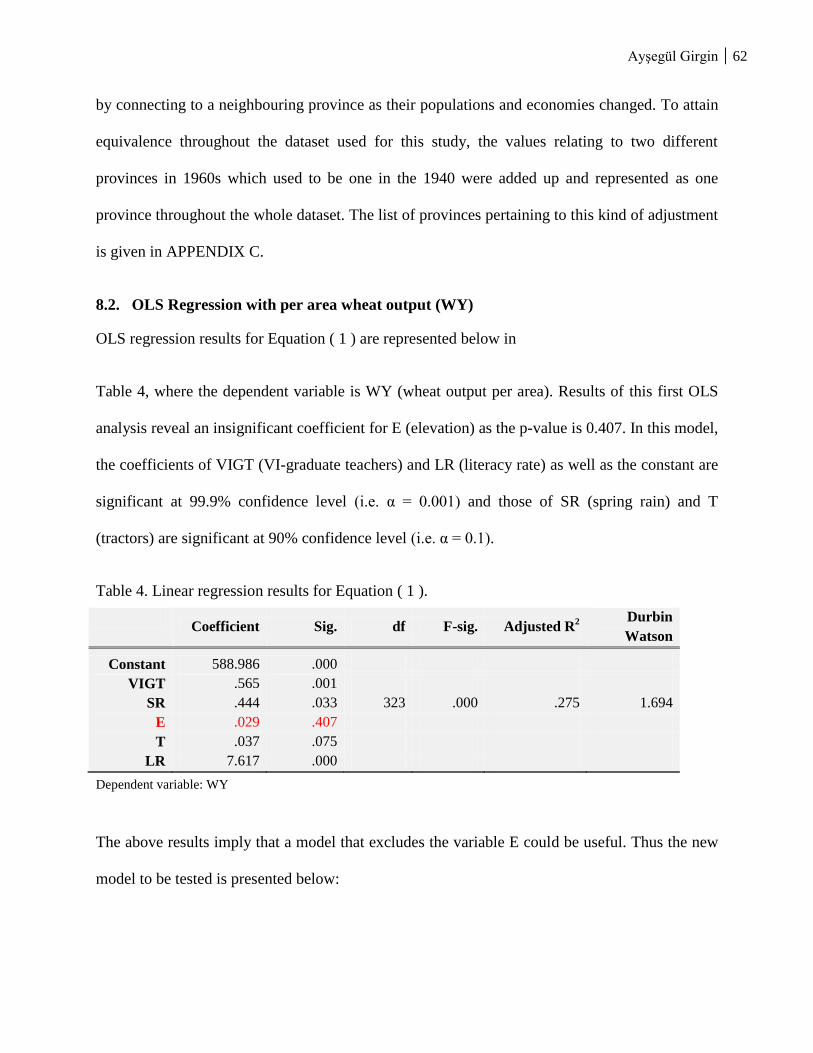
Ayşegül Girgin 62
by connecting to a neighbouring province as their populations and economies changed. To attain
equivalence throughout the dataset used for this study, the values relating to two different
provinces in 1960s which used to be one in the 1940 were added up and represented as one
province throughout the whole dataset. The list of provinces pertaining to this kind of adjustment
is given in APPENDIX C.
8.2. OLS Regression with per area wheat output (WY)
OLS regression results for Equation ( 1 ) are represented below in
Table 4, where the dependent variable is WY (wheat output per area). Results of this first OLS
analysis reveal an insignificant coefficient for E (elevation) as the p-value is 0.407. In this model,
the coefficients of VIGT (VI-graduate teachers) and LR (literacy rate) as well as the constant are
significant at 99.9% confidence level (i.e. α = 0.001) and those of SR (spring rain) and T
(tractors) are significant at 90% confidence level (i.e. α = 0.1).
Table 4. Linear regression results for Equation ( 1 ).
Coefficient Sig. df F-sig. Adjusted R
2
Durbin
Watson
Constant 588.986 .000
VIGT .565 .001
SR .444 .033 323 .000 .275 1.694
E .029 .407
T .037 .075
LR 7.617 .000
Dependent variable: WY
The above results imply that a model that excludes the variable E could be useful. Thus the new
model to be tested is presented below:
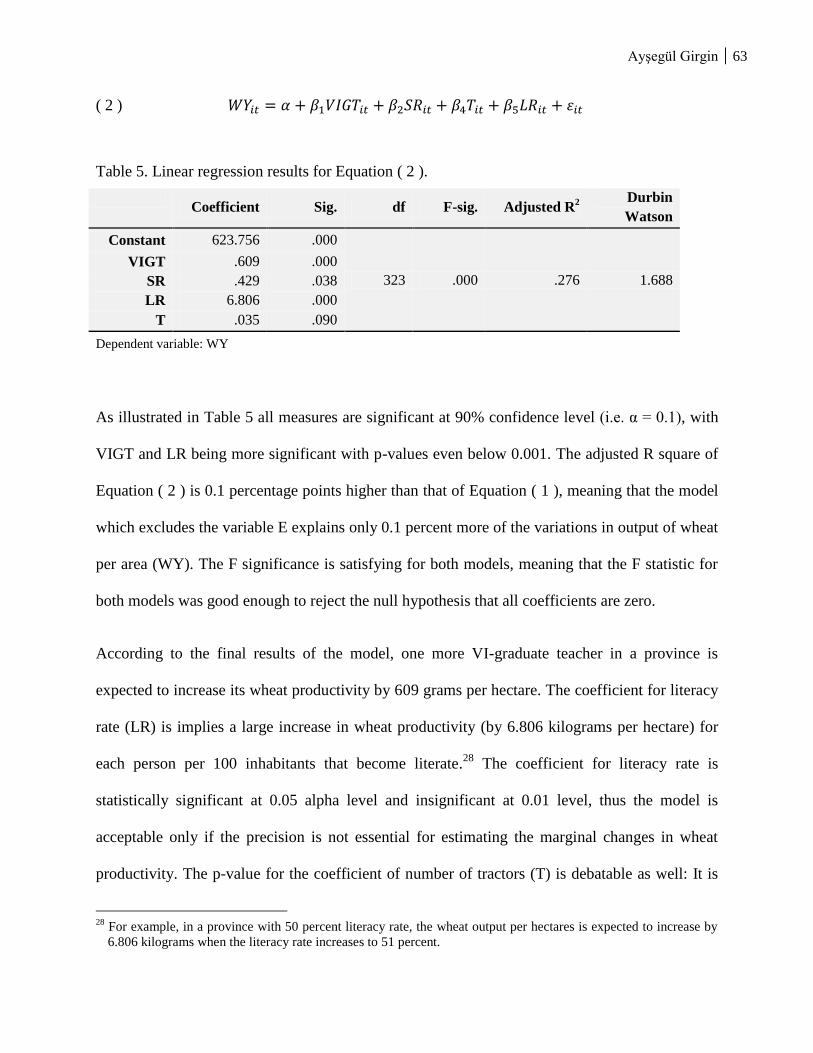
Ayşegül Girgin 63
( 2 )
Table 5. Linear regression results for Equation ( 2 ).
Coefficient Sig. df F-sig. Adjusted R
2
Durbin
Watson
Constant 623.756 .000
323 .000 .276 1.688
VIGT .609 .000
SR .429 .038
LR 6.806 .000
T .035 .090
Dependent variable: WY
As illustrated in Table 5 all measures are significant at 90% confidence level (i.e. α = 0.1), with
VIGT and LR being more significant with p-values even below 0.001. The adjusted R square of
Equation ( 2 ) is 0.1 percentage points higher than that of Equation ( 1 ), meaning that the model
which excludes the variable E explains only 0.1 percent more of the variations in output of wheat
per area (WY). The F significance is satisfying for both models, meaning that the F statistic for
both models was good enough to reject the null hypothesis that all coefficients are zero.
According to the final results of the model, one more VI-graduate teacher in a province is
expected to increase its wheat productivity by 609 grams per hectare. The coefficient for literacy
rate (LR) is implies a large increase in wheat productivity (by 6.806 kilograms per hectare) for
each person per 100 inhabitants that become literate.28
The coefficient for literacy rate is
statistically significant at 0.05 alpha level and insignificant at 0.01 level, thus the model is
acceptable only if the precision is not essential for estimating the marginal changes in wheat
productivity. The p-value for the coefficient of number of tractors (T) is debatable as well: It is
28
For example, in a province with 50 percent literacy rate, the wheat output per hectares is expected to increase by
6.806 kilograms when the literacy rate increases to 51 percent.

Ayşegül Girgin 64
only significant at 0.1 alpha level, which means that there is 9 percent chance that the actual
value of the coefficient is not different from 0. Therefore it might be useful to run the model
again without the machinery variable if precision is essential. Thus the following equation:
( 3 )
Table 6. Linear regression results for Equation ( 3 ).
Coefficient Sig. df F-sig. Adjusted R
2
Durbin
Watson
Constant 620.589 .000
323 .000 .272 1.695 VIGT .704 .000
SR .389 .059
LR 7.454 .000
Dependent variable: WY
As seen in Table 6, omitting the variable T from the equation results in an increase in values of
all the coefficients, an increase in SR’s p-value and a drastic decrease in LR’s p-value, whereas
the adjusted R2
is reduced by only 0.6 percentage points.
8.2.1. Testing for Heteroscedasticity
Heteroscedasticity29
refers to a non-uniform spread of the variance of the error term across
observations, which is a simple violation of the assumptions of the classical linear
regression methods (Feinstein & Thomas, 2002, p. 309). When it occurs, the size of the
error term across observations displays a “clear, systematic pattern of distortion” whereas
the classical linear regression methods assume random differences in the size of the error
term (Feinstein & Thomas, 2002, p. 309). Heteroscedasticity does not affect the regression
coefficients, but the statistical significance of the independent variables. For example, in
29
Also spelled as “heteroskedasticity” in some sources.
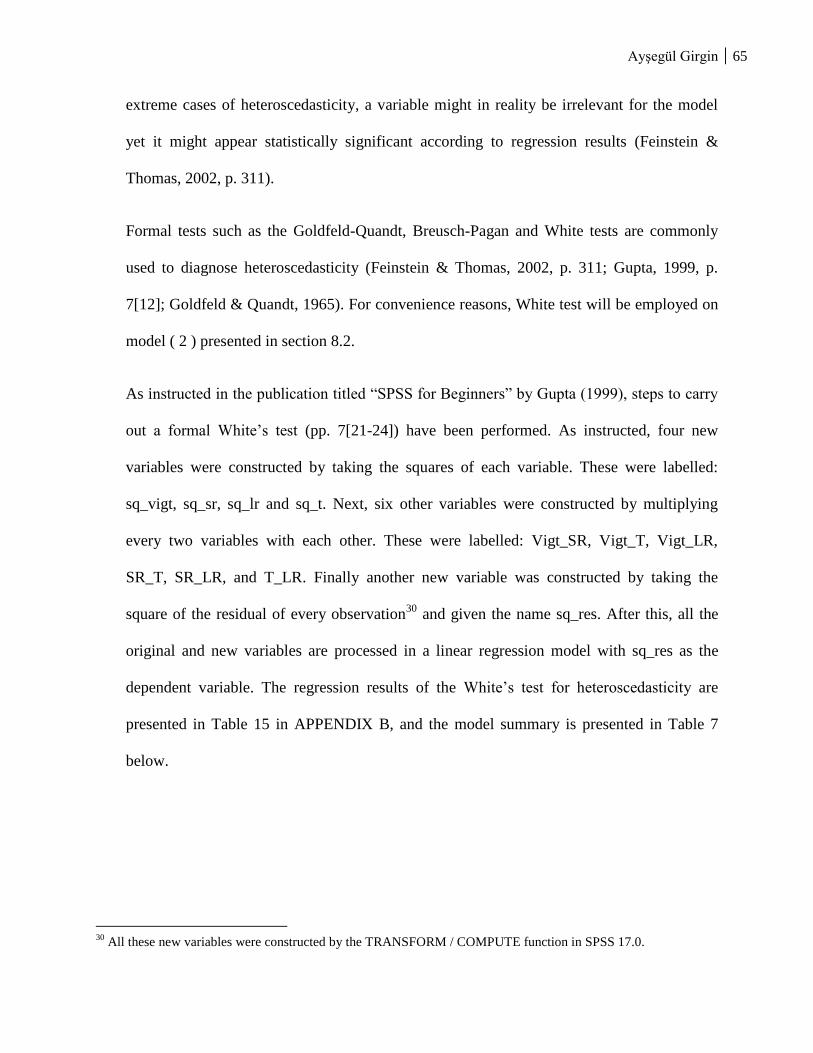
Ayşegül Girgin 65
extreme cases of heteroscedasticity, a variable might in reality be irrelevant for the model
yet it might appear statistically significant according to regression results (Feinstein &
Thomas, 2002, p. 311).
Formal tests such as the Goldfeld-Quandt, Breusch-Pagan and White tests are commonly
used to diagnose heteroscedasticity (Feinstein & Thomas, 2002, p. 311; Gupta, 1999, p.
7[12]; Goldfeld & Quandt, 1965). For convenience reasons, White test will be employed on
model ( 2 ) presented in section 8.2.
As instructed in the publication titled “SPSS for Beginners” by Gupta (1999), steps to carry
out a formal White’s test (pp. 7[21-24]) have been performed. As instructed, four new
variables were constructed by taking the squares of each variable. These were labelled:
sq_vigt, sq_sr, sq_lr and sq_t. Next, six other variables were constructed by multiplying
every two variables with each other. These were labelled: Vigt_SR, Vigt_T, Vigt_LR,
SR_T, SR_LR, and T_LR. Finally another new variable was constructed by taking the
square of the residual of every observation30
and given the name sq_res. After this, all the
original and new variables are processed in a linear regression model with sq_res as the
dependent variable. The regression results of the White’s test for heteroscedasticity are
presented in Table 15 in APPENDIX B, and the model summary is presented in Table 7
below.
30
All these new variables were constructed by the TRANSFORM / COMPUTE function in SPSS 17.0.
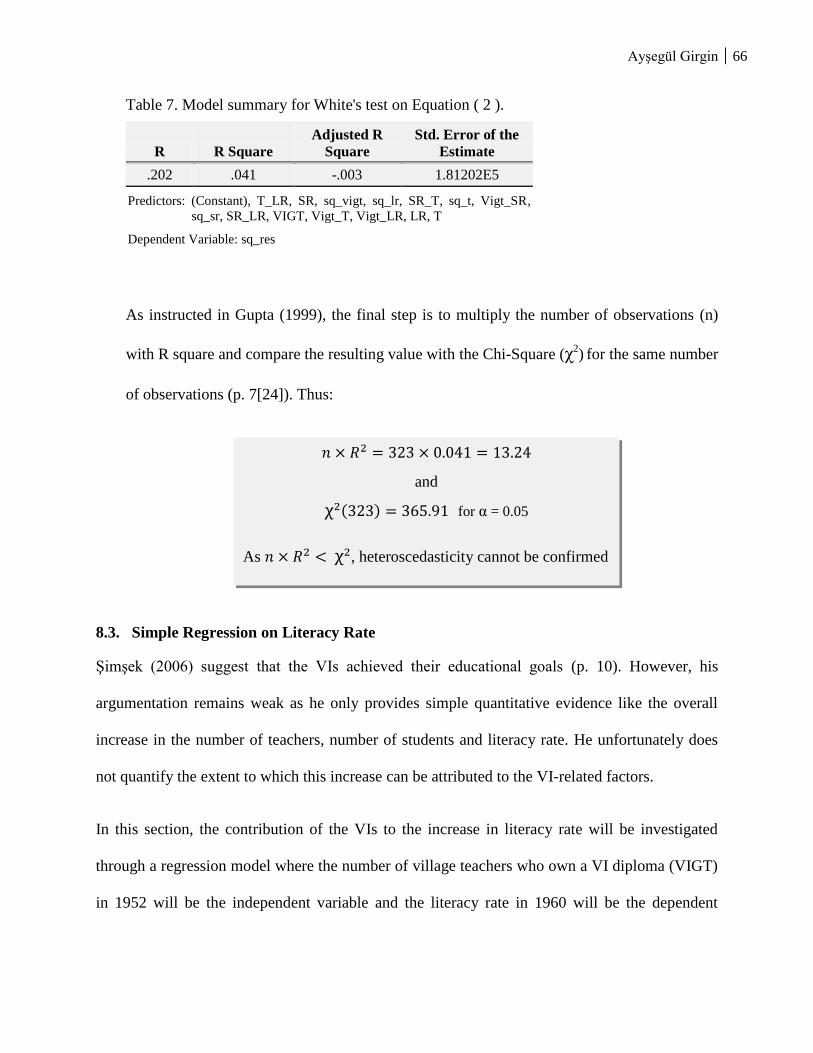
Ayşegül Girgin 66
Table 7. Model summary for White's test on Equation ( 2 ).
R R Square Adjusted R
Square Std. Error of the
Estimate
.202 .041 -.003 1.81202E5
Predictors: (Constant), T_LR, SR, sq_vigt, sq_lr, SR_T, sq_t, Vigt_SR,
sq_sr, SR_LR, VIGT, Vigt_T, Vigt_LR, LR, T
Dependent Variable: sq_res
As instructed in Gupta (1999), the final step is to multiply the number of observations (n)
with R square and compare the resulting value with the Chi-Square (χ2) for the same number
of observations (p. 7[24]). Thus:
8.3. Simple Regression on Literacy Rate
Şimşek (2006) suggest that the VIs achieved their educational goals (p. 10). However, his
argumentation remains weak as he only provides simple quantitative evidence like the overall
increase in the number of teachers, number of students and literacy rate. He unfortunately does
not quantify the extent to which this increase can be attributed to the VI-related factors.
In this section, the contribution of the VIs to the increase in literacy rate will be investigated
through a regression model where the number of village teachers who own a VI diploma (VIGT)
in 1952 will be the independent variable and the literacy rate in 1960 will be the dependent
and
for α = 0.05
As , heteroscedasticity cannot be confirmed
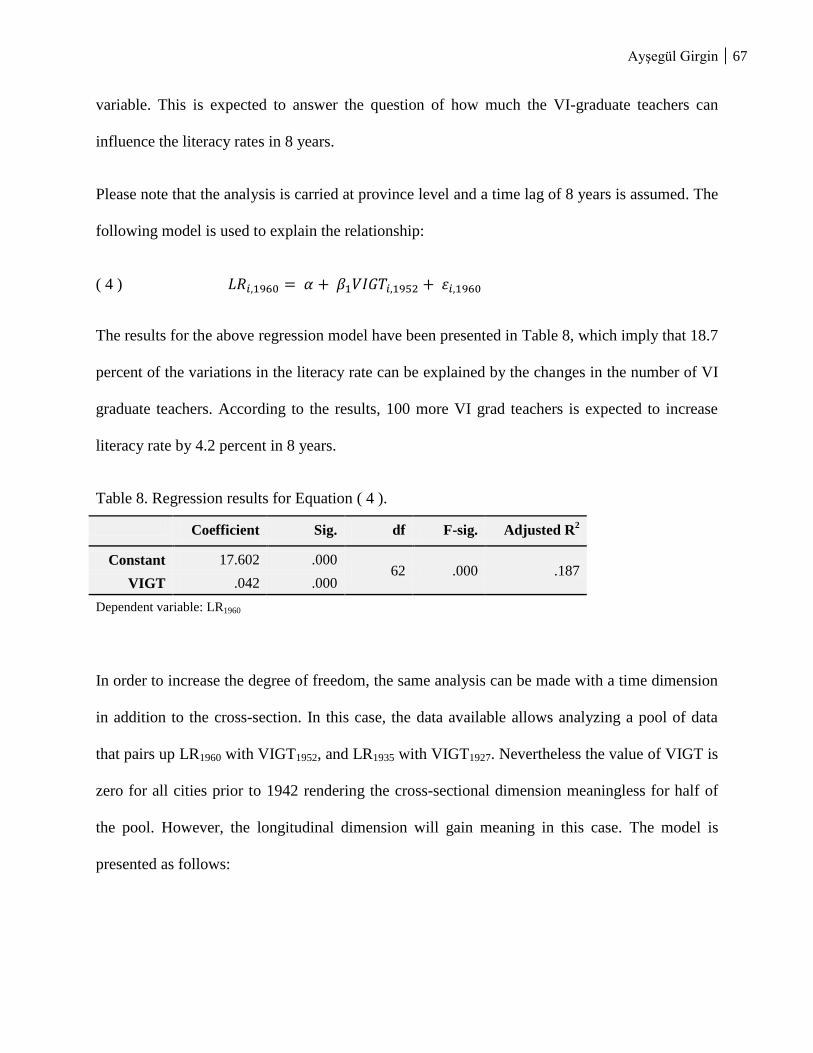
Ayşegül Girgin 67
variable. This is expected to answer the question of how much the VI-graduate teachers can
influence the literacy rates in 8 years.
Please note that the analysis is carried at province level and a time lag of 8 years is assumed. The
following model is used to explain the relationship:
( 4 )
The results for the above regression model have been presented in Table 8, which imply that 18.7
percent of the variations in the literacy rate can be explained by the changes in the number of VI
graduate teachers. According to the results, 100 more VI grad teachers is expected to increase
literacy rate by 4.2 percent in 8 years.
Table 8. Regression results for Equation ( 4 ).
Coefficient Sig. df F-sig. Adjusted R2
Constant 17.602 .000 62 .000 .187
VIGT .042 .000
Dependent variable: LR1960
In order to increase the degree of freedom, the same analysis can be made with a time dimension
in addition to the cross-section. In this case, the data available allows analyzing a pool of data
that pairs up LR1960 with VIGT1952, and LR1935 with VIGT1927. Nevertheless the value of VIGT is
zero for all cities prior to 1942 rendering the cross-sectional dimension meaningless for half of
the pool. However, the longitudinal dimension will gain meaning in this case. The model is
presented as follows:
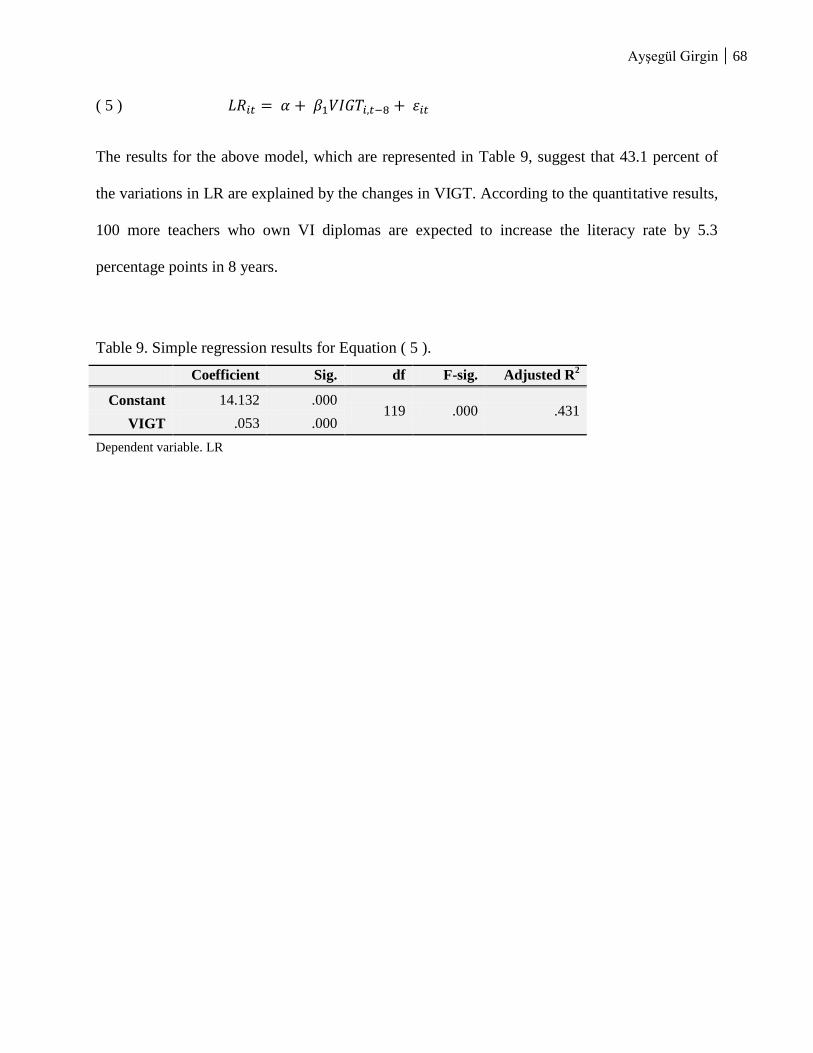
Ayşegül Girgin 68
( 5 )
The results for the above model, which are represented in Table 9, suggest that 43.1 percent of
the variations in LR are explained by the changes in VIGT. According to the quantitative results,
100 more teachers who own VI diplomas are expected to increase the literacy rate by 5.3
percentage points in 8 years.
Table 9. Simple regression results for Equation ( 5 ).
Coefficient Sig. df F-sig. Adjusted R2
Constant 14.132 .000 119 .000 .431
VIGT .053 .000
Dependent variable. LR
Ayşegül Girgin 69
9. CONCLUSION AND EVALUATION
In this concluding chapter, the results of the analyses will be summarized. A discussion on the
weaknesses and certain errors pertaining to the database and the analysis method will be
presented in section 9.3. Finally, the study will be completed with a section on ideas for further
research on the Village Institutes experience of Turkey within the context of their influences on
agricultural productivity.
9.1. Summary of Results
The aim of the study was to investigate the interaction between human capital and agricultural
productivity through the case of the Village Institutes (VI) project of the Republic of Turkey in
the middle of the twentieth century. The results of the quantitative methods employed in this
study showed that a statistically significant positive relationship exists between the VI-graduate
teachers (VIGT) and wheat output per area (WY). A set of pooled panel data with the spatial
dimension covering all 66 provinces in Turkey and the time dimension covering the years 1940,
-41, -42, -64, -65 and -66 has been employed.
Among the control variables, the amount of rain that falls in the spring season and the literacy
rate were found to have the highest statistical significance, both with positive coefficients.
Number of tractors, on the other hand, had debatable statistical significance whereas that of
elevation from sea level was unquestionably low.
The second part of the analysis involved quantifying the relationship between the VI-graduate
teachers (VIGT) and literacy rate (LR) assuming an 8-year time lag. The coefficient for VIGT
was positive and statistically significant. However, the R2 was only 0.187, which alleviates
concerns about a potential multicollinearity between VIGT and LR, when they were used as

Ayşegül Girgin 70
independent variables in the same model when explaining the variations in per area wheat output
in the previous section.
To sum up, the analysis provides evidence that there is a great chance that the VIs contributed
positively to agricultural productivity growth, which was just one of the intended aims of the
VIs. The extent to which the institutes were able to achieve their social, political and intellectual
aims has not been quantitatively tested, yet qualitatively discussed through examples from the
literature.
Nevertheless, it must be taken into account that these analyses are sensitive to choice of
variables, time lags and estimation methods. The set of choices made for this study has revealed
results in the favour of the VIs. However, it is not guaranteed that a different combination of
variables and time dimension or an outlier analysis will not change the results.
9.2. Theory Implications
The results of the analyses presented in this study are in parallel with the general view on the
existence of a positive relationship between education and productivity. However, when further
details into this theory are considered, this study remains weak in terms of meeting the secondary
conditions of the discussion fields. For example, the results of this study are hard to discuss in
terms of Schultz’s (1964) argument that human capital is more important for productivity growth
in modern rather than traditional agriculture. The measurement of modernity in Turkish
agriculture remains highly problematic for the period 1940-1970. The sudden increase in the
number of agricultural tools and machinery by the help of the Marshall aid that was received in
1948 (Republic of Turkey Ministry of Agriculture and Rural Affairs, May 2004, p. 20) might
have contributed to the modernization of agriculture, yet the magnitude of the effect was not

Ayşegül Girgin 71
possible to measure. In order to define the level of modernity in Turkish agriculture, one needs to
thoroughly analyze all the government plans and initiatives as well as the production and imports
of agricultural materials, tools and machinery. Since this was beyond the scope of the project, not
enough can be said about the modernization level of Turkish agriculture for the period
investigated, thus no strong connections can be made to Schultz (1964).
9.3. Limitations / weaknesses of the Analysis
This study, like numerous other economic and social studies, was subject to certain limitations
and weaknesses. Among these, reliability of data, accuracy of the estimates, limitations of the
longitudinal dimension and the assumption of a linear relationship will be discussed in this
section.
9.3.1. Reliability of Data
There is always a risk that the data collection method that had been used by primary data
source was subject to certain faults. Unfortunately, this is usually very hard to detect.
Turkey is infamous for its informal economy, which makes it harder to both the government
and the academics to increase precision in their research. For example, the data on the wheat
production or number of tractors only covers the numbers on which tax was paid, yet one
must keep in mind that book keeping has been a major problem in the Republic of Turkey.
The reliability of the rainfall data, on the other hand, can be discussed through the locations
of the meteorology stations. Some provinces are so large that the weather conditions change
across different parts of the province. For example, the meteorology station might be located
in a relatively dry part of the province and thus present low rainfall figures. It might be that
the fields lie in the wetter parts of the province.

Ayşegül Girgin 72
Besides primary data collection errors, transferring the published data into analysis software
has been problematic. Therefore the data set used in this study was subject to both the
defects of the data collection and to those of presenting it. In a couple of cases, the province
level values did not add up to the total value that was presented in the original source and
certain assumptions had to be made. There were also times when the data source was hard to
read, as it was quite old. Due to the choice of font, a “3” could look like an “8” or a “5”
could look like “6”. The reading errors have been minimized by row and column summation
methods whenever it was possible, yet there might still be some which might have been
overlooked.
9.3.2. Accuracy of the Estimations
The missing values for the literacy rates in 1940 have been estimated as the arithmetic
average of the related values in the previous and next censuses. This assumes a linear
change in a period of 10 years, which may not necessarily be the case.
Similarly, the missing values for province level number of tractors for 1940, -41 and -42
have been estimated by assuming equivalent rate of growth in all provinces as the growth in
the national figures. Although the results presented in this study has employed the
estimations that were based on the data from 1948, the results which uses 1964 based
estimations changed the results by less than 1 percent, which is acceptable.
9.3.3. Limitations with the Time Dimension
The VIs existed between 1937 and 1954, with the first graduates starting their duties in
1942, and the emphasis on the work education being reduced in 1946. Therefore, the
graduates of the years from 1942 to 1946 are expected to be the most effective ones in terms
of agricultural development. Assuming a time lag of 5 years during which these graduates
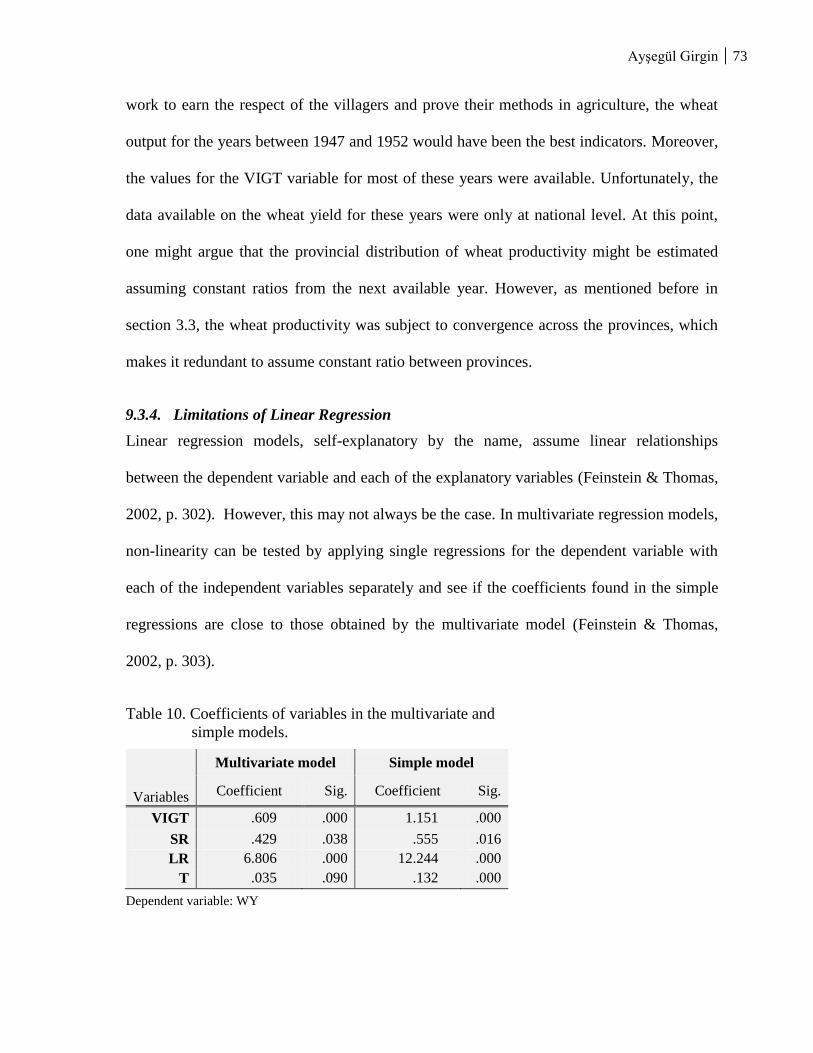
Ayşegül Girgin 73
work to earn the respect of the villagers and prove their methods in agriculture, the wheat
output for the years between 1947 and 1952 would have been the best indicators. Moreover,
the values for the VIGT variable for most of these years were available. Unfortunately, the
data available on the wheat yield for these years were only at national level. At this point,
one might argue that the provincial distribution of wheat productivity might be estimated
assuming constant ratios from the next available year. However, as mentioned before in
section 3.3, the wheat productivity was subject to convergence across the provinces, which
makes it redundant to assume constant ratio between provinces.
9.3.4. Limitations of Linear Regression
Linear regression models, self-explanatory by the name, assume linear relationships
between the dependent variable and each of the explanatory variables (Feinstein & Thomas,
2002, p. 302). However, this may not always be the case. In multivariate regression models,
non-linearity can be tested by applying single regressions for the dependent variable with
each of the independent variables separately and see if the coefficients found in the simple
regressions are close to those obtained by the multivariate model (Feinstein & Thomas,
2002, p. 303).
Table 10. Coefficients of variables in the multivariate and
simple models.
Variables
Multivariate model Simple model
Coefficient Sig. Coefficient Sig.
VIGT .609 .000 1.151 .000
SR .429 .038 .555 .016
LR 6.806 .000 12.244 .000
T .035 .090 .132 .000
Dependent variable: WY
Ayşegül Girgin 74
The second column in Table 10 above, displays the coefficients of the variables in the
multivariate model which was first introduced in section 8.2 on page 63. The fourth column
displays the coefficient of each variable when it is employed as the only explanatory
variable against WY. Comparing the values of the coefficients for each variable, SR is
distinguished as the only variable whose coefficient does not change to any large extent
when used for simple regression. All the other coefficients almost double when switched to
a simple regression model. This might mean that the relationships are not in fact linear,
signalling the necessity to test for a non-linear regression model. Of course, it is a question
of intended precision again: Is a change of 100% for the coefficients from multivariate to
simple models enough to decide that a non-linear regression model must be used, or can one
still hope the best out of a linear model up until differences like 300 or more percent?
However, the theory of statistical methods falls beyond the scope of this thesis.
9.4. Ideas for further research
The first suggestion to improve the analysis presented in this study is to use the same dataset to
carry out a non-linear regression analysis. Besides this, there are a number of adjustments that
can be made in the research question. This can be done by scanning through Section 2.2 of this
study.
Jamison & Moock (1984) suggest that a large number of studies assume that education increases
one’s likeliness of adopting innovations, which is expected to increase productivity (p. 68). For
instance, one can design a study to investigate the extent to which the VIs affected the
population’s approach towards innovation. The frequency of usage of a new type of fertilizer or a
new irrigation technique may be a good indicator of innovation adoption. Next, the effect of the
new innovation on agricultural productivity can be measured.

Ayşegül Girgin 75
The second idea for further research may be inspired by Lockheed, Jamison & Lau (1980),
whose findings show strong correlation between elementary school education and farm
efficiency, with more likeliness of a positive relationship in modernizing agricultural
environments than in traditional ones (p.61). If information can be retrieved on the
modernization levels of different provinces in Turkey, the sample can be grouped according to
this criterion and they could be tested for the strength and sign of the mentioned relationship.
Next, another analysis can be designed to measure the extent to which this difference in farm
efficiencies between modernizing and traditional agricultural environments can be attributed to
the number of VI-graduate teachers in the respective regions.
Third, similar to what Mineo (2010) and Appleton & Balihuta (1996) have done, the relationship
between VIGT on off-farm mobility can be analyzed. For this purpose, the off-farm mobility can
be indicated by change in the ratio of farm families to total population in the province, as the
number of individuals employed in agriculture in Turkey is harder to find than the number of
farm families. Nevertheless, even the latter has not been recorded in all of the censuses, but only
a few.
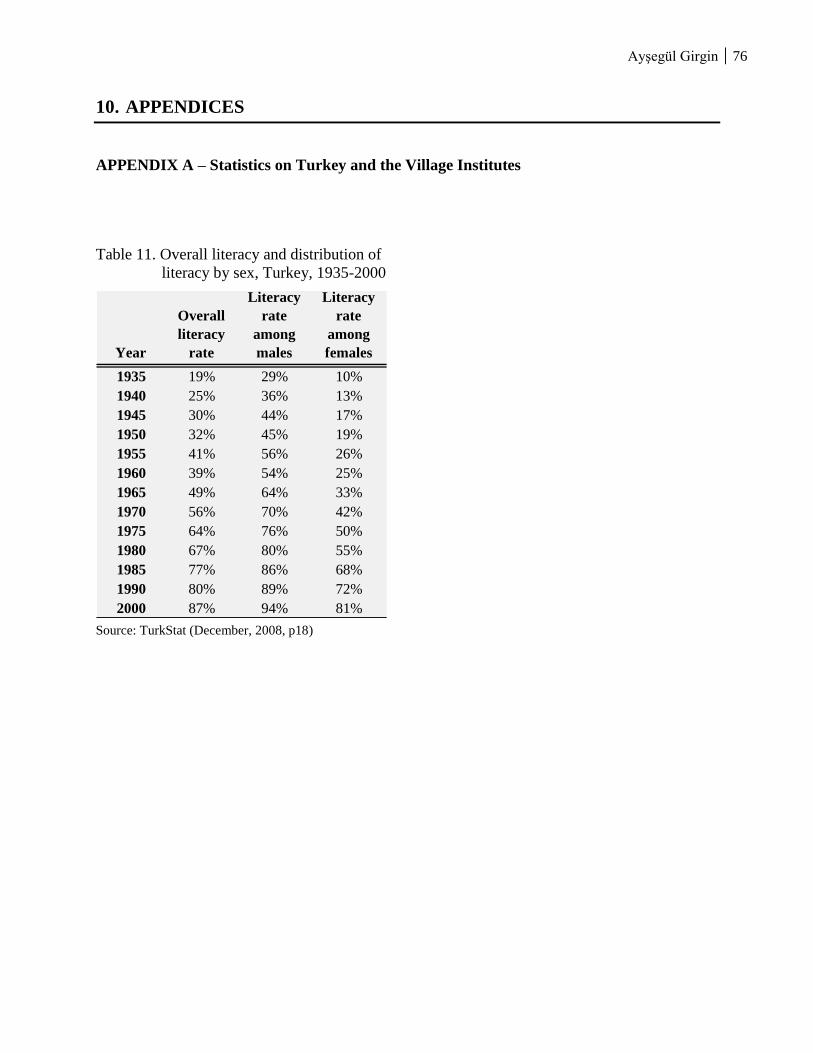
Ayşegül Girgin 76
10. APPENDICES
APPENDIX A – Statistics on Turkey and the Village Institutes
Table 11. Overall literacy and distribution of
literacy by sex, Turkey, 1935-2000
Year
Overall
literacy
rate
Literacy
rate
among
males
Literacy
rate
among
females
1935 19% 29% 10%
1940 25% 36% 13%
1945 30% 44% 17%
1950 32% 45% 19%
1955 41% 56% 26%
1960 39% 54% 25%
1965 49% 64% 33%
1970 56% 70% 42%
1975 64% 76% 50%
1980 67% 80% 55%
1985 77% 86% 68%
1990 80% 89% 72%
2000 87% 94% 81% Source: TurkStat (December, 2008, p18)

Ayşegül Girgin 77
Table 12. Evolution of the Village Institutes from 1937 to 1954: Number of
teachers, students and institutes at national level.
Source: Transferred from Altunya, 2000, p.47 which was cited from Gedikoğlu, 1971.
Table 13. Total number of village school teachers and number of
those who have VI diplomas. (1939, 1946 and 1950)
Year Total number of village
school teachers
Number of village teachers
graduated from a VI
1939 6 847 0
1946 11 533 5 225
1950 18 426 13 182
Source: Şimşek (2006, p.11)

Ayşegül Girgin 78
Table 14. The Village Institute Education Program, 1943.
Courses
Year 1
(hr/week)
Year 2
(hr/week)
Year 3
(hr/week)
Year 4
(hr/week)
Year 5
(hr/week)
Total number
of hours for 5
years
A-GENERAL STUDIES
Turkish 4 3 3 3 3 736
History 2 2 1 1 1 322
Geography 2 2 1 1 - 276
Civics - 1 1 - - 92
Mathematics 4 2 2 3 2 598
Physics - 2 2 1 1 276
Chemistry - - 2 2 - 184
Nature and school health 2 2 2 1 1 368
Foreign language 2 2 2 2 1 414
Handwriting 2 - - 92
Arts and crafts 1 1 1 1 1 230
Physical education and national games 1 1 1 1 - 184
Music 2 2 2 2 2 460
Military training - 2 2 2 2 368
Housekeeping and childcare - - - 1 46
Pedagogy * - - - 2 6 368
Agricultural business economics and
cooperatives - - - - 1 46
Totals 22 22 22 22 22 5060
B-AGRICULTURAL STUDIES
Agriculture - 3 4 2 1 580
Horticulture 8 4 3 3 2 1160
Agriculture of industrial crops and rural
crafts - - 1 1 2 232
Zootechnics 1 2 2 1 2 464
Poultry farming 2 2 - - - 232
Apiculture and sericulture - - 1 2 2 290
Fishing and fishery products - - - 2 2 232
Totals 11 11 11 11 11 3190
C- MALE ARTISAN STUDIES
(One of the following)
Ironworking 11 11 11 11 11 3190
Woodworking 11 11 11 11 11 3190
Construction 11 11 11 11 11 3190
C-FEMALE ARTISAN STUDIES
(One of the following)
Needlework 11 11 11 11 11 3190
Weaving and Textile 11 11 11 11 11 3190
Agricultural Studies 11 11 11 11 11 3190
Source: Altunya, 2000 p.43-44; Şimşek, 2006, p.7
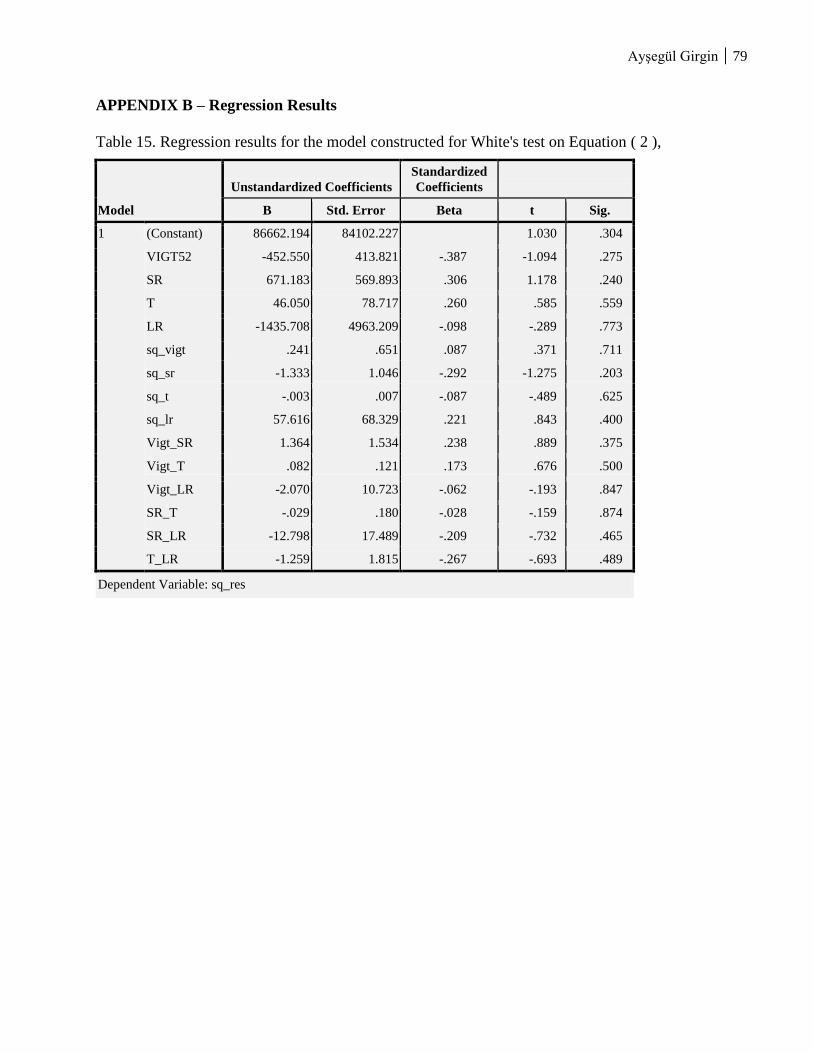
Ayşegül Girgin 79
APPENDIX B – Regression Results
Table 15. Regression results for the model constructed for White's test on Equation ( 2 ),
Model
Unstandardized Coefficients
Standardized
Coefficients
B Std. Error Beta t Sig.
1 (Constant) 86662.194 84102.227 1.030 .304
VIGT52 -452.550 413.821 -.387 -1.094 .275
SR 671.183 569.893 .306 1.178 .240
T 46.050 78.717 .260 .585 .559
LR -1435.708 4963.209 -.098 -.289 .773
sq_vigt .241 .651 .087 .371 .711
sq_sr -1.333 1.046 -.292 -1.275 .203
sq_t -.003 .007 -.087 -.489 .625
sq_lr 57.616 68.329 .221 .843 .400
Vigt_SR 1.364 1.534 .238 .889 .375
Vigt_T .082 .121 .173 .676 .500
Vigt_LR -2.070 10.723 -.062 -.193 .847
SR_T -.029 .180 -.028 -.159 .874
SR_LR -12.798 17.489 -.209 -.732 .465
T_LR -1.259 1.815 -.267 -.693 .489
Dependent Variable: sq_res

Ayşegül Girgin 80
APPENDIX C – Data modification
Table 16. Number of tractors at province level and as national totals,
Turkey, 1940-42, 1948 and 1964-66.
1948a 1940
b 1941
b 1942
b 1964
c 1965
d 1966
e
National Total
(given) 2161 1066 1039 1012 51781 54099 65103
Ratio of the total
figure to that in
1948
0.493 0.481 0.468
Adana 661 326 318 310 5848 4152 6936
Adıyaman 0 0 0 0 57 132 166
Afyon Karahisar 8 4 4 4 748 801 878
Ağrı 0 0 0 0 53 82 185
Amasya 10 5 5 5 785 841 913
Ankara 85 42 41 40 3750 4530 5297
Antalya 208 103 100 97 1354 1434 1696
Artvin 0 0 0 0 3 3 2
Aydın 118 58 57 55 4174 3997 4007
Balıkesir 15 7 7 7 1282 1459 1652
Bilecik 2 1 1 1 54 74 113
Bingöl 1 0 0 0 9 7 10
Bitlis 0 0 0 0 60 76 77
Bolu 6 3 3 3 359 410 451
Burdur 5 2 2 2 250 297 382
Bursa 8 4 4 4 1463 1548 1751
Çanakkale 8 4 4 4 495 507 736
Çankırı 2 1 1 1 175 164 234
Çorum 9 4 4 4 611 3 749
Denizli 17 8 8 8 689 624 930
Diyarbakır 9 4 4 4 137 789 580
Edirne 17 8 8 8 1291 263 1900
Elazığ 4 2 2 2 268 1278 321
Erzincan 2 1 1 1 166 303 271
Erzurum 2 1 1 1 137 176 166
Eskişehir 158 78 76 74 1381 160 1722
Gaziantep 9 4 4 4 475 1565 534
Giresun 0 0 0 0 18 457 47
Gümüşhane 0 0 0 0 47 30 107
Hakkari 0 0 0 0 0 93 3
Hatay 37 18 18 17 814 0 1200
Isparta 1 0 0 0 174 774 218
İçel 147 73 71 69 1446 174 1685
İstanbul 46 23 22 22 692 1664 851
İzmir 87 43 42 41 3120 761 3718
Kars 12 6 6 6 200 3704 437
Kastamonu 9 4 4 4 236 314 379
Kayseri 9 4 4 4 308 321 679
Table 16 continues on
the next page

Ayşegül Girgin 81
Kırklareli 20 10 10 9 743 628 780
Kırşehir 8 4 4 4 422 830 522
Kocaeli 18 9 9 8 1121 1206 1387
Konya 124 61 60 58 3793 4346 4508
Kütahya 5 2 2 2 234 243 255
Malatya 2 1 1 1 309 370 367
Manisa 47 23 23 22 2852 2638 3311
Maraş 9 4 4 4 596 633 695
Mardin 6 3 3 3 247 251 313
Muğla 12 6 6 6 629 765 1002
Muş 1 0 0 0 180 200 192
Nevşehir . 811 838 689
Niğde 6 3 3 3 569 421 546
Ordu 0 0 0 0 6 8 11
Rize 0 0 0 0 0 0 0
Samsun 36 18 17 17 1141 1249 1281
Siirt 2 1 1 1 47 53 134
Sinop 0 0 0 0 54 60 109
Sivas 3 1 1 1 609 649 847
Tekirdağ 51 25 25 24 1888 2277 2465
Tokat 11 5 5 5 795 884 1137
Trabzon 0 0 0 0 12 5 6
Tunceli 0 0 0 0 57 81 103
Urfa 67 33 32 31 722 622 1285
Uşak 73 97 132
Van 1 0 0 0 43 47 93
Yozgat 20 10 10 9 656 675 835
Zonguldak 0 0 0 0 43 56 115
The blue cells present the estimated values whereas the yellow ones are the given in
the statistical records of TurkStat.
Sources: a General Statistical Office (1952, pp. 8-43)
b The total figures are published in General Statistical Office (1957, p. 1)
c State Institute of Statistics (1965, p. 16)
d State Institute of Statistics (1966, p. 16)
e State Institute of Statistics (1967, p. 16)
Number of Tractors
The national totals for the number of tractors were given for all of the years presented above in
Table 16. To estimate the province level figures, each number in the column for 1948 have been
multiplied by the ratio given in the third row that related to the year of interest and rounded to

Ayşegül Girgin 82
the nearest integer. For example, the ratio of the totals in 1940 to 1948 is 0.493. For one random
city, be it Adana, the estimated number of tractors is 661 x 0.493 = 326
Province modifications:
1. Adana was called Seyhan in the 1940s, therefore the data for Seyhan has been transferred
directly to Adana. The same applies to Artvin, which was called Çoruh before.
2. Sakarya was a district of Kocaeli in the 1940s, therefore the values for Sakarya has been
added to those of Kocaeli for all variables.

Ayşegül Girgin 83
11. BIBLIOGRAPHY
Abramowitz, M. (1956). Resource and Output Trends in the U.S. since 1870. American
Economic Review , 46, 5-23.
Ahmad, F. (1993). The Making of Modern Turkey. New York: Routledge.
Akyüz, N. (1999). Türk Eğitim Tarihi [Turkish Education Hsitory] (7th ed.). İstanbul, Turkey:
Alfa Basım Yayım Dağıtım.
Alene, A. D., & Manyong, V. M. (2007). The Effects of Education on Agricultural Productivity
under Traditional and Improved Technology in Northern Nigeria: An Endogenous
Switching Regression Analysis. Empirical Economics , 32, 141-159.
Altunya, N. D. (2000). Köy Enstitüsü Sisteminin Düşünsel Temelleri [Ideological Bases of the
Village Institute System]. Ankara.
Amin, A. A., & Awung, W. J. (2005, November 25-26). Economic Analysis of Private Returns
to Investment in Education in Cameroon. Regional Conference on Education in West
Africa: Constraints and Opportunities. Dakar Senegal: African Institute for Economic
Development and Planning (IDEP).
Appleton, S., & Balihuta, A. (1996). Education and Agricultural Productivity: Evidence from
Uganda. Journal of International Development , 8 (3), 415-444.
Arayıcı, A. (1999b). Kemalist Dönem Türkiyesi’nde Eğitim Politikaları ve Köy Enstitüleri
[Education Policy and Village Institutes in Kemalist Turkey]. İstanbul: Ceylan Yayınları.
Arayıcı, A. (1999a). Village Institutes in Turkey. Prospects , 29 (2), 267-280.
Arrow, K. J. (1973). Higher Education as a Filter. Journal of Public Economics , 2 (3), 193-216.
Aydın, B. M. (2007). Köy Enstitüleri ve Toplum Kalkınması [Village institutes and community
development]. Ankara: Anı Yayıncılık.
Ayşegül Girgin 84
Azariadis, C., & Drazen, A. (1990). Threshold Externalities in Economic Development.
Quarterly Journal of Economics , 105 (2), 501-526.
Baran, E., & Şahin, M. (n.d.). In the work, by the work and for the work: Village Institutes as a
revolutionary practice of Dewey's Philosophy. Paper submitted to Iowa State University
as part of the requirements for doctoral degree .
Barro, R. J. (1997). Determinants of economic growth. A cross-country empirical study.
Cambridge: MIT Press.
Barro, R. J. (1991). International data on educational attainment, updates and implications.
NBER working paper (no. 7911).
Barro, R. J., & Sala-i-Martin, X. (1995). Economic Growth. New York: McGraw-Hill.
Barro, R., Mankiw, G., & Sala-i-Martin, X. (1995). Capital Mobility in Neoclassical Models of
Growth. American Economic Review , 85 (1), 103-115.
Başaran, M. (2003). Özgürleşme Eylemi: Köy Enstitüleri [Freedom Movement: Village
institutes]. İstanbul: Cumhuriyet Kitapları.
Becker, G. S. (1963). Human Capital: A Theoretical and Empirical Analysis with Special
Reference to Education. New York: National Bureau of Economic Research.
Becker, G. S. (1962). Investment in Human Capital: A Theoretical Analysis. The Journal of
Political Economy , 70 (5), 9-49.
Benhabib, J., & Spiegel, M. M. (2002). Human capital and technology diffusion. Federal
Reserve Bank of San Fransisco working paper (no. 2003-2).
Benhabib, J., & Spiegel, M. M. (1994). The role of human capital in economic development:
evidence from aggregate cross-country data. Journal of Monetary Economics , 34 (2),
143-173.
Ayşegül Girgin 85
Binbaşıoğlu, C. (1997). Çağdaş Eğitim ve Köy Enstitüleri: Tarihsel Bir Çerçeve. [Modern
Education and Village Institutes: A Historical Framework]. İzmir: Dikili Belediyesi
Kültür Yayınları.
Çezik, G. (2010, April 20). Köy Enstitüleri'ni Kapatanlar Lanetlendi! Retrieved March 3, 2011,
from Mücadele (Daily Independent Political Newspaper):
http://www.mucadele.com.tr/haber/ozel-haber/koy-enstitulerini-kapatanlar-
lanetlendi/20184
CIHEAM. (1971). Agricultural Groups and Cooperatives in Turkey. Options Méditerranéennes ,
6, 104-105.
Diebolt, C., & Monteils, M. (2000). Knowledge and economic growth in Germany, 1872-1989.
Technical Change, Economic Growth, and Convergence in Europe. Lund.
Evren, N. (1998). Köy Enstitüleri Neydi Ne Değildi? [What were Village Institutes and What
Were They not?]. Ankara: Güldikeni Yayınları.
Fabricant, S. (1954). Economic Progress and Economic Change. Cambridge, MA: National
Bureau of Economic Research.
Feinstein, C. H., & Thomas, M. (2002). Making History Count: A Primer in Quantitative
Methods for Historians. Cambridge University Press.
Friedman, M., & Kuznets, S. (1945). Income from Independent Professional Practice. New
York: National Bureau of Economic Research.
General Satistical Office. (1942). Statistical Yearbook 1940-1941 [İstatistik Yıllığı 1940-1941].
Ankara: Republic of Turkey Prime Ministry General Statistical Office [Türkiye
Cumhuriyeti Başbakanlık İstatistik Genel Müdürlüğü].
General Statistical Office. (1950). Census of Population 1945 [Genel Nüfus Sayımı 1945].
Ankara: Republic of Turkey Prime Ministry General Statistical Office [T.C. Başbakanlık
İstatistik Genel Müdürlüğü].

Ayşegül Girgin 86
General Statistical Office. (1961). Census of Population 23 October 1955 [Genel Nüfus Sayımı
23 Ekim 1955]. İstanbul: Republic of Turkey Prime Ministry General Statistical Office
[T.C. Başbakanlık İstatistik Genel Müdürlüğü].
General Statistical Office. (1957). The Summary of Agricultural Statistics, 1936-1956 [Zirai
İstatistik Özetleri, 1936-1956]. Ankara: State Statistical Institute [Devlet İstatistik
Enstitüsü].
General Statistical Office. (1952). Village Census Summary Results, 1948 [Köy Sayımı Hülasa
Sonuçları, 1948]. Ankara: Republic of Turkey Prime Ministry General Statistical Office
[Türkiye Cumhuriyeti Başbakanlık İstatistik Genel Müdürlüğü].
Goldfeld, S. M., & Quandt, R. E. (1965). Some Tests for Homoscedasticity. Journal of Americal
Statistical Association , 60 (310), 539-547.
Griliches, Z. (1997). Education, Human Capital, and Growth: A Personal Perspective. Journal of
Labor Economics , 15 (1), S330-S344.
Günaydın, G. (2006). Türkiye Tarım Sektörü [Agricultural Sector in Turkey]. Tarım ve
Mühendislik [Agriculture and Engineering] , 76-77, 12-27.
Gujarati, D. N. (2004). Basic Econometrics. New York: The McGraw-Hill Companies.
Gupta, V. (1999). SPSS for Beginners. VJBooks Inc.
Hansen, P., & Knowles, S. (1998). Human Capital and Return to Scale. Journal of Economic
Studies , 25 (2), 118-123.
Houthakker, H. S. (1959). Education and Income. Review of Economics and Statistics , 41, 24-
28.
Huffman, W. E. (1977). Allocative Efficiency: The Role of Human Capital. The Quarterly
Journal of Economics , 91 (1), 59-79.
Islam, N. (1995). Growth Empirics: A panel data approach. Quarterly Journal of Economics ,
110 (4), 1127-1170.

Ayşegül Girgin 87
Jamison, D. T., & Moock, P. R. (1984). Farmer Education and Farm Efficiency in Nepal: The
Role of Schooling, Extension Services and Cognitive Skills. World Development , 12, 67-
86.
Judson, R. (2002). Measuring Human Capital like Physical Capital: What does it tell us? Bulletin
of Economic Research , 54 (3), 209-231.
Karaömerlioğlu, M. A. (1999). The Cult of the Peasant: Ideology and Practice, Turkey 1930-
1946. Presented in partial fulfillment of the requirements for the degree Doctor of
Philosophy in the Graduate School of the Ohio State University , The Ohio State
University.
Karaömerlioğlu, M. A. (1998b). The People's Houses and the Cult of the Peasant in Turkey.
Middle Eastern Studies , 34 (4), 67-91.
Karaömerlioğlu, M. A. (1998a). The Village Institutes Experience in Turkey. British Journal of
Middle Eastern Studies , 25 (1), 47-73.
Keleş, F. (2007). Modernization as State-led Social Transformation - Reflections on the Turkish
Case. Journal of Development and Social Transformation , 3, 5-11.
Kendrick, J. W. (1956). Productivity Tends: Capital and Labor. New york: National Bureau of
Economic Research.
Keseroğlu, H. (2005). Köy Enstitülerinde Okuma ve Kütüphane [Reading and Libraries in
Village Institutes]. Türk Kütüphaneciliği [Turkish Librarianship] , 19 (1), 25-40.
Khaldi, N. (1975). Education and Allocative Efficiency in U.S. Agriculture. American Journal of
Agricultural Economics , 57 (4), 650-657.
Kirby, F. (. (1962). Türkiye'de Köy Enstitüleri [Village Institutes in Turkey]. Ankara: Güldikeni
Yayınları.
Köy Enstitüleri [Village Institutes]. (2010, February 22). Retrieved January 12, 2011, from
Kemalistgencler.com: http://www.kemalistgencler.com/koy-enstituleri
Ayşegül Girgin 88
Krueger, A. B., & Lindahl, M. (2000). Education for Growth: Why and for whom? NBER
Working Paper .
Lipton, M. (1985). Education and Farm Efficiency: Comment. Economic Development and
Cultural Change , 34 (1), 167-168.
Ljungberg, J., & Nilsson, A. (2009). Human Capital and Economic Growth: Sweden 1870-2000.
Cliometrica , 3 (1), 71-95.
Lucas, R. E. (1988). On the Mechanics of Economic Development. Journal of Monetary
Economics , 22 (1), 3-42.
Mankiw, G., Romer, D., & Weil, D. (1992). A Contribution to the Empirics of Economic
Growth. Quarterly Journal of Economics , 107, 225-251.
Miller, H. P. (1960). Annual and Lifetime Income in Relation to Education. American Economic
Review , 50, 962-986.
Mincer, J. (1958). Investment on Human Capital and Personal Income Distribution. Journal of
Political Economy , 66, 281-302.
Mineo, J. (2010, June). The Role of Formalized Education in Agricultural Production: An
Analysis of Heartland Region Corn Yield, Farm Earnings, and Off-farm Labor Mobility,
1970-2000. Master Thesis submitted to Lund University Department of Economic History
.
Moock, P. R. (1981). Education and technical efficiency in small-farm production. Economic
Development and Cultural Change , 723-739.
Morvaridi, B. (1990). Agrarian Reform and Land Use Policy in Turkey: Implications for the
Southeast Anatolia Project. Land Use Policy , 7 (4), 303-313.
Öztürk, İ. (1961). Köy Enstitülerinin Verimi [Efficiency of the Village Institutes]. In Tonguç'a
Kitap [A Book for Tonguç]. İstanbul: Ekin Basımevi.

Ayşegül Girgin 89
Parvin, M., & Hiç, M. (1990). Land Reform versus Agricultural Reform: Turkish Miracle or
Catastrophe Delayed? International Journal of Middle East Studies , 16 (2), 207-232.
Republic of Turkey Ministry of Agriculture and Rural Affairs. (May 2004). Agriculture from the
Ottoman Empire Until Present and the Organization Processes of the Agricultural
Enterprises [Osmanlı'dan günümüze tarım ve tarıma hizmet veren kurumların
teşkilatlanma süreçleri]. Ankara: Republic of Turkey Ministry of Agriculture and Rural
Affairs [T.C. Tarım ve Köyişleri Bakanlığı].
Romer, P. M. (1987). Growth Based on Increasing Returns Due to Specialization. The American
Economic Review , 77 (2), 56-62.
Romer, P. M. (1990). Human Capital and Growth: Theory and Evidence. Carnegie-Rochester
Conference Series on Public Policy , 32, 251-286.
Sakaoğlu, N. (2003). Osmanlı'dan Günümüze Eğitim Tarihi [History of Education from the
Ottomans to Present]. İstanbul, Turkey: İstanbul Bilgi University Press.
Schultz, T. W. (1960). Capital Formation by Education. Journal of Political Economy , 68, 571-
583.
Schultz, T. W. (1975). The value of the ability to deal with disequilibria. Journal of Economic
Literature , 13 (3), 827-846.
Schultz, T. W. (1964). Transforming Traditional Agriculture. New Haven, Connecticut: The
Yale University Press.
Schumpeter, J. (1942). Capitalism, Socialism and Democracy. New York: Harper.
Şeren, M. (2008). Köye Öğretmen Yetiştirme Yönüyle Köy Enstitüleri [Village Institutes in
Terms of Teacher Training]. Gazi Eğitim Fakültesi Dergisi [Journal of Gazi's Faculty of
Education] , 28 (1), 203-226.
Şimşek, A. (2006, February 3). An economic look at the village institutes. Term paperfor
"Economics of History" course in Massachusetts Institute of Technology .
Ayşegül Girgin 90
Smiley, R. W., Backhouse, D., Lucas, P., & Paulitz, T. C. (2009). Diseases which Challenge
Global Wheat Production - Root, Crown, and Culm Rots. In B. F. Carver, Wheat Science
and Trade (pp. 125-144). Ames, Iowa, USA: Wiley-Blackwell.
Solow, R. M. (1957). Technical Change and the Aggregate Production Function. Review of
Economics and Statistics , 39, 312-320.
State Institute of Statistics. (1968). Agricultural Structure and Production 1967 [Tarımsal Yapı
ve Üretim1967]. Ankara: State Institute of Statistics Printing Division [Devlet İstatistik
Enstitüsü Matbaası].
State Institute of Statistics. (1950b). Census - Population of Turkey [Genel Nüfus Sayımı -
Türkiye Nüfusu]. İstanbul, Turkey.
State Institute of Statistics. (1950a). Census - Province, District, Subdistrict and Village Level
Population [Umumi Nüfus Sayımı - Vilayet, Kaza, Nahiye ve Köyler İtibariyle Nüfus].
Turkey.
State Institute of Statistics. (1940). Census - Province, District, Subdistrict and Village level
population and area [Genel Nüfus Sayımı - Vilayetler, Kazalar, Nahiyeler ve Köyler
İtibariyle Nüfus ve Yüzey Ölçü]. Ankara, Turkey.
State Institute of Statistics. (1935a). Census - Turkish Population [Genel Nüfus Sayımı - Türkiye
Nüfusu]. Ankara, Turkey: Ulus Basımevi.
State Institute of Statistics. (1935b). Census - Village Population [Genel Nüfus Sayımı - Köyler
Nüfusu]. İstanbul, Turkey: Hüsnütabiat Basımevi.
State Institute of Statistics. (1969). Census of Population - Social and Economic Characteristics
of Population 24.10.1965 [Genel Nüfus Sayımı - Nüfusun Sosyal ve Ekonomik
Nitelikleri 24.10.1965]. Ankara: State Institute of Statistics Printing Division.
State Institute of Statistics. (1961). Census of Population 23 October 1960 [Genel Nüfus Sayımı
23 Ekim 1960].
Ayşegül Girgin 91
State Institute of Statistics. (1931). Statistical Yearbook 1930 [İstatistik Yıllığı 1930]. Ankara:
Republic of Turkey Prime Ministry State Institute of Statistics [Türkiye Cumhuriyeti
Başbakanlık Devlet İstatistik Enstitüsü].
State Institute of Statistics. (1943). Statistics of Agricultural Products 1940-42 [Tarla Mahsulleri
İstatistiği 1940-42]. Ankara, Turkey.
State Institute of Statistics. (1965). The summary of agricultural statistics, 1943-1964 [Tarım
istatistikleri özeti, 1943-1964]. Ankara: State Institute of Statistics [Devlet Istatistik
Enstitüsü].
State Institute of Statistics. (1966). The Summary of Agricultural Statistics, 1944-1965 [Tarım
İstatistikleri Özeti, 1944-1965]. Ankara: State Institute of Statistics [Devlet İstatistik
Enstitüsü].
State Institute of Statistics. (1967). The Summary of Agricultural Statistics, 1966 [Tarım
İstatistikleri Özeti, 1966]. Ankara: State Institute of Statistics [Devlet İstatistik
Enstitüsü].
Stirling, A. P. (1965). The Village and the World. In A. P. Stirling, Turkish Village (pp. 266-
294). London: Centre for Social Anthropology and Computing.
Stone, F. A. (1974). Rural Revitalization and the Village Institutes in Turkey: Sponsors and
Critics. Comparative Education Review , 18 (3), 419-429.
Tekeli, İ. (1983). Osmanlı İmparatorluğu'ndan Günümüze Eğitim Kurumlarının Gelişimi [The
Evolution of Education Institutions from the Ottoman Empire to present]. In M. Belge,
M. Tunçay, & B. Özükan, Cumhuriyet Dönemi Türkiye Ansiklopedisi [Encyclopedia of
Republic Era Turkey] (pp. 650-675). İstanbul: İletişim Yayınları.
TMMOB Ziraat Mühendisleri Odası İzmir Şubesi. (1995). Köy enstitüleri ve tarım [Village
institutes and agriculture]. İzmir: The Union of the Chambers of Turkish Engineers and
Architects, The Chamber of Agricultural Engineers İzmir Branch[TMMOB Ziraat
Mühendisleri Odası İzmir Şubesi].
Ayşegül Girgin 92
Tonguç, İ. H. (1998). Eğitim Yolu ile Canlandırılacak Köy (First Regulation: 1939) [The Village
to Be Revived Through Education]. Ankara: Köy Enstitüleri ve Çağdaş Eğitim Vakfı
Yayınları.
Türkmen, L. (2007). The History of Development of Turkish Elementary Teacher Education and
the Place of Science Courses in the Curriculum. Eurasia Journal of Mathematics, Science
& Technology Education , 3 (4), 327-341.
Türkoğlu, P. (1997). Tonguç ve Enstitüleri [Tonguç and His Institutes]. İstanbul: Yapı Kredi
Yayınları.
Turan, O. (1979). Türkiye'de Siyasi Buhranın Kaynakları [Sources of Political Depression in
Turkey] (2nd ed.). İstanbul.
Turhan, M. (1967). Garplılaşmanın Neresindeyiz? [Where are we in Hesperianization?] (4th
Edition ed.). İstanbul: Yağmur Yayınevi.
TurkStat. (2011). Home page. Retrieved May 10, 2011, from Turkish Statistical Institue Web
site: http://www.turkstat.gov.tr/Start.do
TurkStat. (December 2008). Statistical Indicators 1927-2007. Ankara, Turkey: Turkish
Statistical Institute.
UCTEA Chamber of Agricultural Engineers Izmir Branch [TMMOB Ziraat Mühendisleri Odası
İzmir Şubesi]. (1995). Köy Enstitüleri ve Tarım [Village Institutes and Agriculture].
İzmir.
Ünal, S. (Retrieved 15.02.2011). Wheat [Buğday]. Retrieved February 15, 2011, from Bahce.biz:
http://www.bahce.biz/bitki/tarla/tahil/bugday.htm
Ulus. (1938, October 29). State Agricultural Enterprises [Devlet Ziraat İşletmeleri Kurumu].
Ulus Newspaper 15th Anniversary Special Supplement .
Uygun, S. (2008). The Impact of John Dewey on the Teacher Education System in Turkey. Asia-
Pacific Journal of Teacher Education , 36 (4), 291-306.

Ayşegül Girgin 93
Uygun, S., & Kıncal, R. Y. (2006). Köy Enstitülerinin Canlı Tanıkları [Eye Witnesses of Village
Institutes]. Çanakkale: Onsekiz Mart University Institute for Education Sciences.
Vandenbussche, J., Aghion, O., & Meghir, C. (2006). Growth, distance to frontier and
composition of human processes. Journal of Economic Growth , 11 (2), 97-127.
Vexliard, A., & Aytaç, K. (1964). The "Village Institutes" in Turkey. Comparative Education
Review , 8 (1), 41-47.
Welch, F. (1970). Education in Production. The Journal of Political Economy , 78 (1), 35-59.
Yasa, İ. (1955). Hasanoğlan Village [Hasanoğlan Köyü]. Ankara.
Yavuz, F. (2005). Tarım Politikası [Agricultural Policy]. In F. Yavuz (Ed.), Türkiye'de Tarım
[Agriculture in Turkey] (pp. 43-66). Turkey: Atatürk Üniversitesi Ziraat Fakültesi Tarım
Ekonomisi Bölümü [Atatürk University Faculty of Agriculture Department of
Agricultural Economics].
Yener, A. (1999). Bir Dönemin Aynası: Köy Enstitüleri [The Mirror of an Era: Village
Institutes]. Köprü - Üç Aylık Fikir Dergisi , 68.