
The role of credit default swaps and other alternative ... · The role of credit default swaps and...
22
Original Article The role of credit default swaps and other alternative betas in hedge fund factor analysis Received (in revised form): 18th May 2012 Keith H. Black PhD, CFA, CAIA, currently serves as an Associate Director of Curriculum for the CAIA Association. Previously, he advised institutional investors on asset allocation and manager selection strategies in hedge funds, commodities and managed futures. He has taught at the Illinois Institute of Technology, and is author of the book ‘Managing a Hedge Fund’. He earned a BA from Whittier College, an MBA from Carnegie Mellon University, and a PhD from the Illinois Institute of Technology. Correspondence: Keith H. Black, CAIA Association, 100 University Drive, Amherst, MA 01002, USA E-mail: [email protected] ABSTRACT Hedge fund factor analysis is growing in popularity. While some investors simply use traditional factor bs from the stock and bond markets, these factors do not fully explain hedge fund returns. Explanatory power of hedge fund factor analysis improves when illiquidity and non-linear exposures are explored. Alternative bs, such as commodity, currency and credit default swaps, also lead to more accurate estimates of a and b. Journal of Derivatives & Hedge Funds (2012) 18, 201–222. doi:10.1057/jdhf.2012.9; published online 21 June 2012 Keywords: hedge funds; factor analysis; a–b separation; performance attribution; leverage INTRODUCTION Fung and Hsieh (2004), among many others, perform factor analysis for the broad hedge fund universe as well as funds of hedge funds. These studies have found that various hedge fund styles have statistically significant exposures to a number of market variables, including the large and small stocks, high yield bonds, the S&P 500 Volatility Index (VIX), the 10 Year Treasury yield and look-back straddles on a number of assets. Many studies consider the role of illiquidity or traditional market bs in isolation. This article broadens the hedge fund factor analysis literature by using updated data set through June 2009. This time period includes the market crises of 2007 and 2008, which may have changed many of the hedge fund b relationships. In addition to studying the exposure of hedge fund styles to traditional market factors, we also include alternative market factors, such as commodity, currency and volatility indices. Next, we add measures of illiquidity and market timing to the market b sources. Finally, we calculate a unique data series based on the credit default swap prices of commercial and investment banks, which proves to be a significant risk factor in a number of hedge fund strategies. Hedge funds may prefer to trade credit default swaps, as these instruments allow managers to quickly take credit positions & 2012 Macmillan Publishers Ltd. 1753-9641 Journal of Derivatives & Hedge Funds Vol. 18, 3, 201–222 www.palgrave-journals.com/jdhf/
Transcript of The role of credit default swaps and other alternative ... · The role of credit default swaps and...
Original Article
The role of credit default swaps and otheralternative betas in hedge fund factor analysisReceived (in revised form): 18th May 2012
Keith H. BlackPhD, CFA, CAIA, currently serves as an Associate Director of Curriculum for the CAIA Association. Previously,
he advised institutional investors on asset allocation and manager selection strategies in hedge funds,
commodities and managed futures. He has taught at the Illinois Institute of Technology, and is author of the
book ‘Managing a Hedge Fund’. He earned a BA from Whittier College, an MBA from Carnegie Mellon
University, and a PhD from the Illinois Institute of Technology.
Correspondence: Keith H. Black, CAIA Association, 100 University Drive, Amherst, MA 01002, USA
E-mail: [email protected]
ABSTRACT Hedge fund factor analysis is growing in popularity. While some investors
simply use traditional factor bs from the stock and bond markets, these factors do not fully
explain hedge fund returns. Explanatory power of hedge fund factor analysis improves
when illiquidity and non-linear exposures are explored. Alternative bs, such as commodity,
currency and credit default swaps, also lead to more accurate estimates of a and b.
Journal of Derivatives & Hedge Funds (2012) 18, 201–222. doi:10.1057/jdhf.2012.9;
published online 21 June 2012
Keywords: hedge funds; factor analysis; a–b separation; performance attribution; leverage
INTRODUCTIONFung and Hsieh (2004), among many others,
perform factor analysis for the broad hedge fund
universe as well as funds of hedge funds. These
studies have found that various hedge fund styles
have statistically significant exposures to a
number of market variables, including the large
and small stocks, high yield bonds, the S&P 500
Volatility Index (VIX), the 10 Year Treasury
yield and look-back straddles on a number of
assets. Many studies consider the role of
illiquidity or traditional market bs in isolation.
This article broadens the hedge fund factor
analysis literature by using updated data set
through June 2009. This time period includes
the market crises of 2007 and 2008, which may
have changed many of the hedge fund brelationships. In addition to studying the
exposure of hedge fund styles to traditional
market factors, we also include alternative
market factors, such as commodity, currency and
volatility indices. Next, we add measures of
illiquidity and market timing to the market bsources. Finally, we calculate a unique data series
based on the credit default swap prices of
commercial and investment banks, which proves
to be a significant risk factor in a number of
hedge fund strategies. Hedge funds may prefer to
trade credit default swaps, as these instruments
allow managers to quickly take credit positions
& 2012 Macmillan Publishers Ltd. 1753-9641 Journal of Derivatives & Hedge Funds Vol. 18, 3, 201–222www.palgrave-journals.com/jdhf/
in instruments that are often more liquid than
the underlying bonds.
LITERATURE REVIEWHedge fund factor analysis has been studied from
a number of angles across the literature. Fung
and Hsieh (2004) model hedge fund returns
using an arbitrage pricing model methodology
and include dynamic risk factor analysis. They
suggest that, rather than using peer universes
(such as those calculated by Hedge Fund
Research, HFR), more accurate hedge fund
benchmarks can be calculated through the use of
returns-based style analysis. Their seven-factor
model includes the S&P 500, small-large stocks,
change in the 10 Year Treasury yield, change in
credit spreads, and look-back straddles on bonds,
currencies and commodities. Beckers et al (2007)
conclude that funds of funds have less factor
exposure than funds tracked by hedge fund style
indices. Funds of funds also exhibit negative
market timing skill, as measured by the returns
to traditional b factor exposures. Unique
factors covered in this study include emerging
markets stock and bond indices, non-US stocks,
growth-value equity spreads and commodity
futures. Similar factors are used by Ennis and
Sebastian (2003).
Illiquidity is discussed by Till (2004),
Getmansky et al (2004) and Kazemi and
Schneeweis (2004). Till describes the costs of
illiquidity, including difficulties in rebalancing,
valuation risk, stale pricing and understated
volatility, as well as observing that investors who
purchase illiquid assets have the return profile
of short put option strategies. Kazemi and
Schneeweis test lagged returns to the S&P 500
as a measure of illiquidity and suggest that the
proper risk measurement of factor risk is the sum
of the current month coefficient and all
statistically significant lagged coefficients. Hamza
et al (2006) include squared factor bs to
understand non-linearities and lagged hedge
fund index data to measure illiquidity.
Getmansky et al (2004) used serial correlation
analysis to determine the illiquidity of hedge
fund strategies.
Dopfel (2005) demonstrates the inclusion of
hedge funds in the analysis of portfolio risk
exposures. Rather than including hedge funds in
a mean-variance portfolio optimization, the bexposures of hedge funds should be determined
and included in the portfolio level target of brisk exposures. However, hedge fund bexposures are subject to change over time.
Finally, Kat (2004) suggests that, as of that
time, no study on hedge fund performance has
correctly explained the role of liquidity and
credit risk as return sources. The higher
moments of hedge funds must be constrained
before hedge funds are added to a mean-variance
analysis that is intended to justify the weights
of hedge funds in an investor’s portfolio.
DATA SET AND METHODOLOGYFor the time period of January 1990–June 2009,
we seek to predict the return to 19 indices
calculated by HFR. Sharma (2004) describes
HFR indices as having minimal survivor bias,
as the returns to defunct funds are not dropped
from the time series of hedge fund style returns.
HFR indices are equally weighted, so give a
broad representation to both small and large
hedge funds. Traditional b sources include the
S&P 500, EAFE, Emerging Markets Stocks,
Barclays Aggregate Bond Index and the Merrill
Lynch High Yield Index. These risk exposures
are commonly found in investor portfolios.
Black
202 & 2012 Macmillan Publishers Ltd. 1753-9641 Journal of Derivatives & Hedge Funds Vol. 18, 3, 201–222
Those who have some understanding of hedge
fund factor analysis typically include these
traditional b exposures in their data set.
However, several of the authors referenced
above state that a estimates of hedge funds are
likely overstated when only traditional b sources
are included in factor analyses, as omitted
variables are counted as a, even though the
returns may come from alternative b sources.
Alternative, or non-traditional, b sources in
this study include the GSCI Commodity Index,
the small stock premium as measured by the
difference between the return to the S&P 500
and the Russell 2000 stock indices, the value
premium as determined by the difference
between the Russell 1000 value and growth
indices, the monthly percentage change in the
VIX and the US Dollar Index, which measures
the currency market risk of hedge fund
portfolios.
Negative coefficients on the Treasury market
return (7–10 year maturity) show the cash
leverage inherent in a hedge fund portfolio.
Lagged returns to the S&P 500 Index and the
High Yield Index show the illiquidity risk of
varying hedge fund styles. Squared terms of the
same indices demonstrate the lack of market
timing skill by hedge fund managers.
Finally, and possibly new to the literature, this
study contributes an analysis of credit default
swaps. From August 2001 to June 2009, credit
default swap data is analyzed. Daily credit default
swap prices, in basis points, are reported on
underlying financial institution credits, including
Merrill Lynch, Wells Fargo, Wachovia, Bank
America, Barclays, Credit Suisse, Deutsche
Bank, HSBC, RBS, UBS, JP Morgan, Morgan
Stanley, Goldman Sachs, and most interesting,
Lehman Brothers and Bear Stearns. Given that
hedge fund returns are reported monthly, our
monthly observation for credit default swaps is
simply the average of the daily CDS prices
during that month, which overcomes the
infrequent reporting issues of some underlying
financial institution CDS prices. While data is
sparse in 2001 and 2002, later data shows
between 264 and 368 observations each month.
Clearly, credit default swap prices on underlying
financial credits demonstrate changes in systemic
risk, especially during the tumultuous period
of 2007–2009. While CDS spreads never
reached 70 basis points between August 2001
and October 2007, they rose quickly during the
recent crisis, trading mostly between 120 and
270 basis points between February 2008 and
June 2009. Spreads narrowed in the fall of 2009
as systemic risk subsided. Surprisingly, this
measure of CDS prices is relatively uncorrelated
to the returns to high yield debt, �0.07, and
equity volatility (VIX), 0.032.
TRADITIONAL b RESULTSThe results of factor analysis regressions using
traditional b factors can be found in Tables 1 and
2, which show the results for the traditional bregressions over the time periods starting January
1990 and August 2001, respectively, while both
data sets end in June 2009.
HFR Index¼ aþ b1�S&P 500þ b2�EAFE
þb3�Emerging Markets
þb4�Barclays Aggregate Bond Index
þb5�High Yield
It is important to note that all results in this
article have been calculated using stepwise
regression, where all b coefficients are included
in results only when they are statistically
significant at the 1 per cent level. Variables
included each subsequent step of the regression
The role of alternative betas in hedge fund analysis
203& 2012 Macmillan Publishers Ltd. 1753-9641 Journal of Derivatives & Hedge Funds Vol. 18, 3, 201–222
are determined through the use of the Akaike
Information Criterion (AIC), where lower
scores of the AIC are preferred. The AIC
declines as the number of model parameters
declines and the maximum likelihood of the
model increases. While some prior studies
included the bs of all factors tested, this study
uses only variables that are found to be highly
significant. The results show that, while all
factors predict the returns to some hedge fund
styles, the risk drivers vary significantly by hedge
fund trading style.
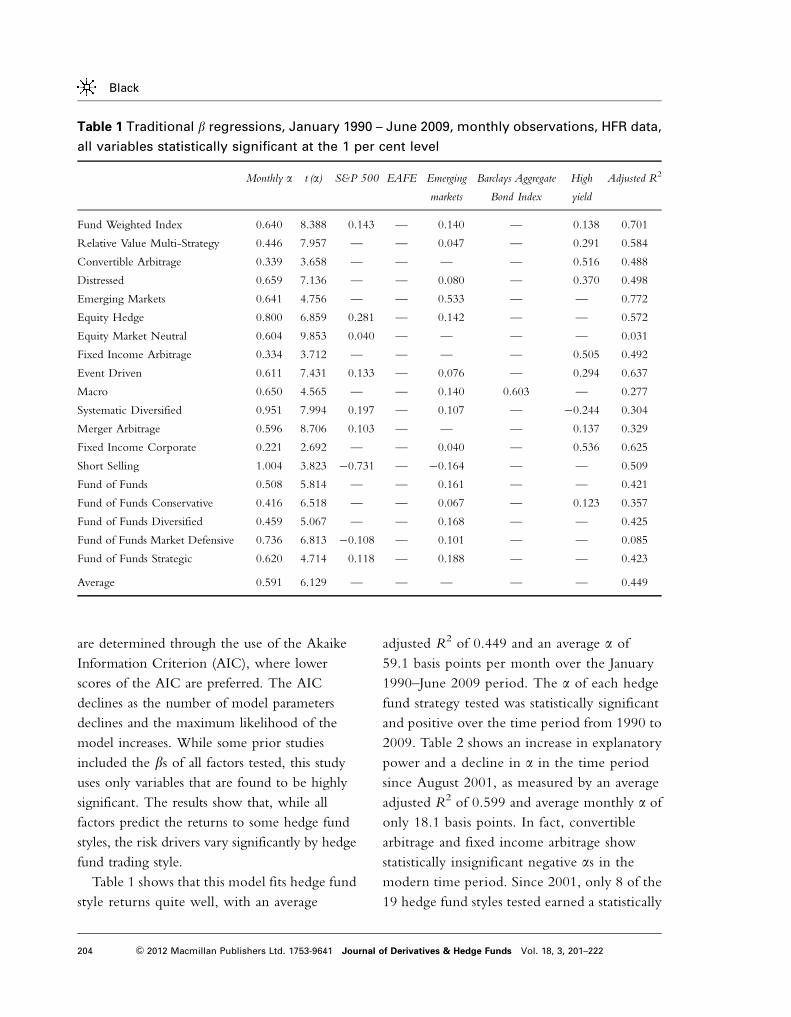
Table 1 shows that this model fits hedge fund
style returns quite well, with an average
adjusted R2 of 0.449 and an average a of
59.1 basis points per month over the January
1990–June 2009 period. The a of each hedge
fund strategy tested was statistically significant
and positive over the time period from 1990 to
2009. Table 2 shows an increase in explanatory
power and a decline in a in the time period
since August 2001, as measured by an average
adjusted R2 of 0.599 and average monthly a of
only 18.1 basis points. In fact, convertible
arbitrage and fixed income arbitrage show
statistically insignificant negative as in the
modern time period. Since 2001, only 8 of the
19 hedge fund styles tested earned a statistically
Table 1 Traditional b regressions, January 1990 – June 2009, monthly observations, HFR data,
all variables statistically significant at the 1 per cent level
Monthly a t (a) S&P 500 EAFE Emerging
markets
Barclays Aggregate
Bond Index
High
yield
Adjusted R2
Fund Weighted Index 0.640 8.388 0.143 — 0.140 — 0.138 0.701
Relative Value Multi-Strategy 0.446 7.957 — — 0.047 — 0.291 0.584
Convertible Arbitrage 0.339 3.658 — — — — 0.516 0.488
Distressed 0.659 7.136 — — 0.080 — 0.370 0.498
Emerging Markets 0.641 4.756 — — 0.533 — — 0.772
Equity Hedge 0.800 6.859 0.281 — 0.142 — — 0.572
Equity Market Neutral 0.604 9.853 0.040 — — — — 0.031
Fixed Income Arbitrage 0.334 3.712 — — — — 0.505 0.492
Event Driven 0.611 7.431 0.133 — 0.076 — 0.294 0.637
Macro 0.650 4.565 — — 0.140 0.603 — 0.277
Systematic Diversified 0.951 7.994 0.197 — 0.107 — �0.244 0.304
Merger Arbitrage 0.596 8.706 0.103 — — — 0.137 0.329
Fixed Income Corporate 0.221 2.692 — — 0.040 — 0.536 0.625
Short Selling 1.004 3.823 �0.731 — �0.164 — — 0.509
Fund of Funds 0.508 5.814 — — 0.161 — — 0.421
Fund of Funds Conservative 0.416 6.518 — — 0.067 — 0.123 0.357
Fund of Funds Diversified 0.459 5.067 — — 0.168 — — 0.425
Fund of Funds Market Defensive 0.736 6.813 �0.108 — 0.101 — — 0.085
Fund of Funds Strategic 0.620 4.714 0.118 — 0.188 — — 0.423
Average 0.591 6.129 — — — — — 0.449
Black
204 & 2012 Macmillan Publishers Ltd. 1753-9641 Journal of Derivatives & Hedge Funds Vol. 18, 3, 201–222
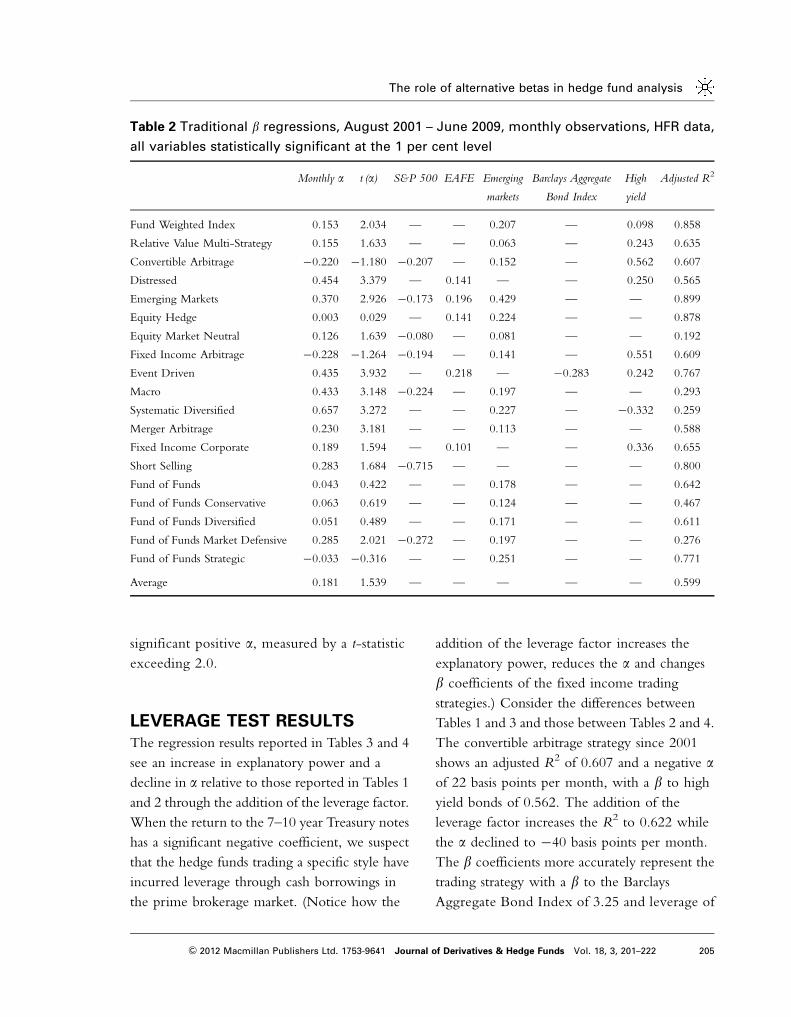
significant positive a, measured by a t-statistic
exceeding 2.0.
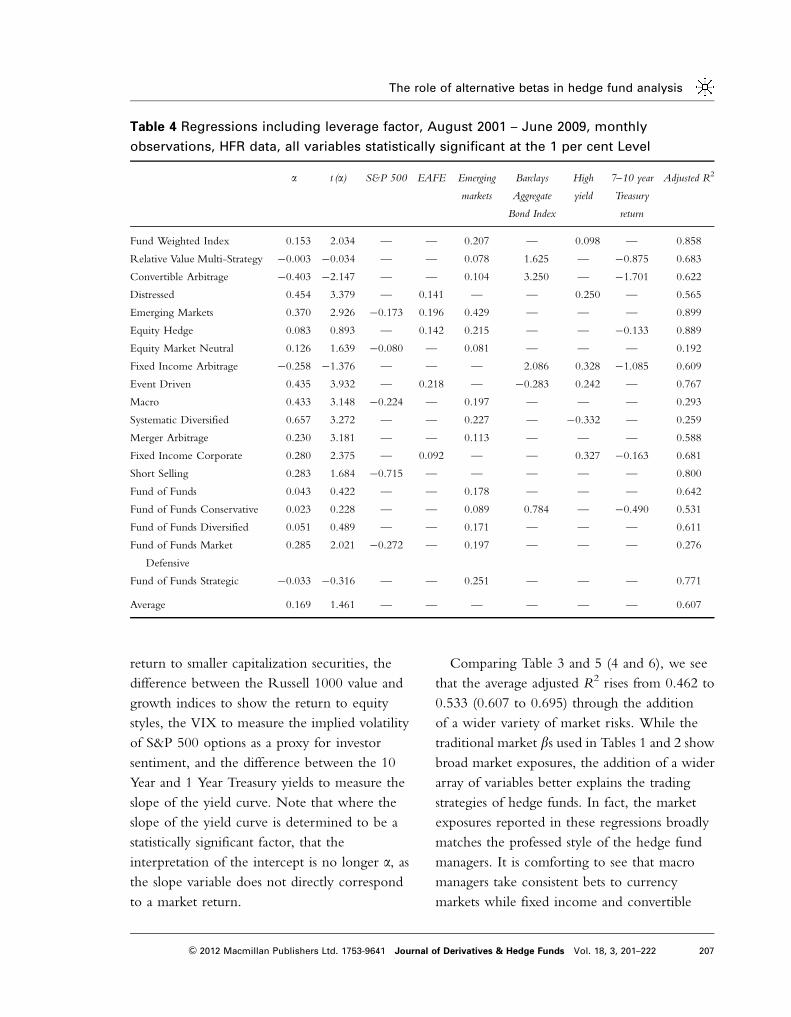
LEVERAGE TEST RESULTSThe regression results reported in Tables 3 and 4
see an increase in explanatory power and a
decline in a relative to those reported in Tables 1
and 2 through the addition of the leverage factor.
When the return to the 7–10 year Treasury notes
has a significant negative coefficient, we suspect
that the hedge funds trading a specific style have
incurred leverage through cash borrowings in
the prime brokerage market. (Notice how the
addition of the leverage factor increases the
explanatory power, reduces the a and changes
b coefficients of the fixed income trading
strategies.) Consider the differences between
Tables 1 and 3 and those between Tables 2 and 4.
The convertible arbitrage strategy since 2001
shows an adjusted R2 of 0.607 and a negative aof 22 basis points per month, with a b to high
yield bonds of 0.562. The addition of the
leverage factor increases the R2 to 0.622 while
the a declined to �40 basis points per month.
The b coefficients more accurately represent the
trading strategy with a b to the Barclays
Aggregate Bond Index of 3.25 and leverage of
Table 2 Traditional b regressions, August 2001 – June 2009, monthly observations, HFR data,
all variables statistically significant at the 1 per cent level
Monthly a t (a) S&P 500 EAFE Emerging
markets
Barclays Aggregate
Bond Index
High
yield
Adjusted R2
Fund Weighted Index 0.153 2.034 — — 0.207 — 0.098 0.858
Relative Value Multi-Strategy 0.155 1.633 — — 0.063 — 0.243 0.635
Convertible Arbitrage �0.220 �1.180 �0.207 — 0.152 — 0.562 0.607
Distressed 0.454 3.379 — 0.141 — — 0.250 0.565
Emerging Markets 0.370 2.926 �0.173 0.196 0.429 — — 0.899
Equity Hedge 0.003 0.029 — 0.141 0.224 — — 0.878
Equity Market Neutral 0.126 1.639 �0.080 — 0.081 — — 0.192
Fixed Income Arbitrage �0.228 �1.264 �0.194 — 0.141 — 0.551 0.609
Event Driven 0.435 3.932 — 0.218 — �0.283 0.242 0.767
Macro 0.433 3.148 �0.224 — 0.197 — — 0.293
Systematic Diversified 0.657 3.272 — — 0.227 — �0.332 0.259
Merger Arbitrage 0.230 3.181 — — 0.113 — — 0.588
Fixed Income Corporate 0.189 1.594 — 0.101 — — 0.336 0.655
Short Selling 0.283 1.684 �0.715 — — — — 0.800
Fund of Funds 0.043 0.422 — — 0.178 — — 0.642
Fund of Funds Conservative 0.063 0.619 — — 0.124 — — 0.467
Fund of Funds Diversified 0.051 0.489 — — 0.171 — — 0.611
Fund of Funds Market Defensive 0.285 2.021 �0.272 — 0.197 — — 0.276
Fund of Funds Strategic �0.033 �0.316 — — 0.251 — — 0.771
Average 0.181 1.539 — — — — — 0.599
The role of alternative betas in hedge fund analysis
205& 2012 Macmillan Publishers Ltd. 1753-9641 Journal of Derivatives & Hedge Funds Vol. 18, 3, 201–222
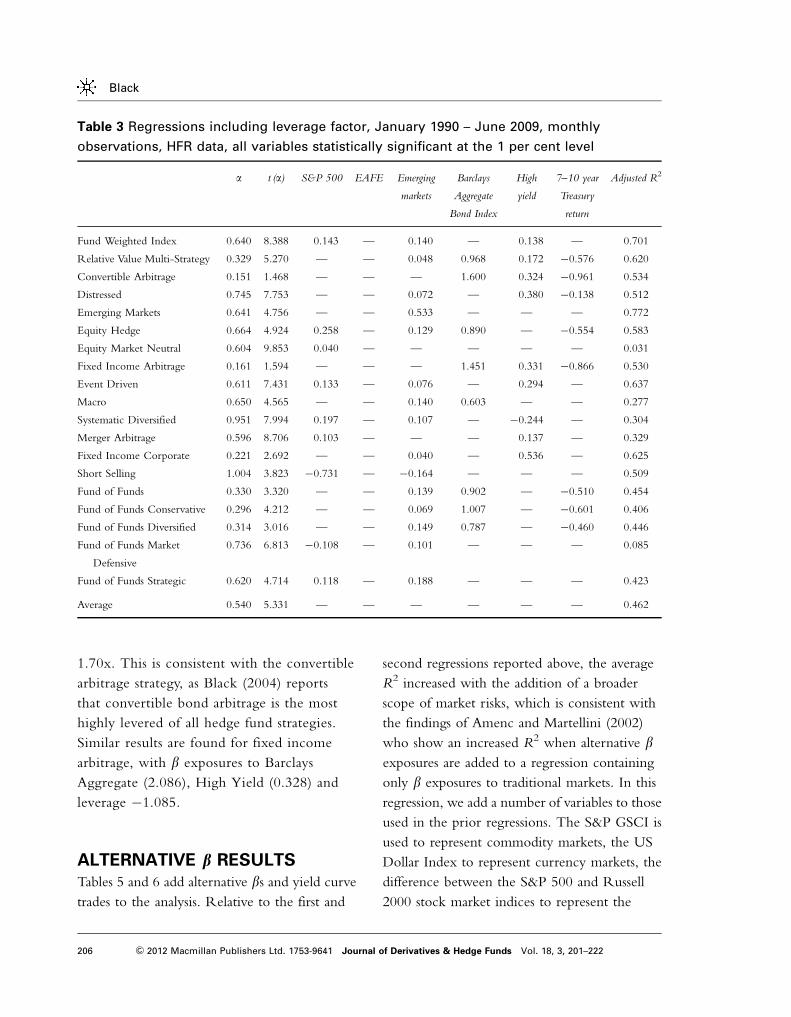
1.70x. This is consistent with the convertible
arbitrage strategy, as Black (2004) reports
that convertible bond arbitrage is the most
highly levered of all hedge fund strategies.
Similar results are found for fixed income
arbitrage, with b exposures to Barclays
Aggregate (2.086), High Yield (0.328) and
leverage �1.085.
ALTERNATIVE b RESULTSTables 5 and 6 add alternative bs and yield curve
trades to the analysis. Relative to the first and
second regressions reported above, the average
R2 increased with the addition of a broader
scope of market risks, which is consistent with
the findings of Amenc and Martellini (2002)
who show an increased R2 when alternative bexposures are added to a regression containing
only b exposures to traditional markets. In this
regression, we add a number of variables to those
used in the prior regressions. The S&P GSCI is
used to represent commodity markets, the US
Dollar Index to represent currency markets, the
difference between the S&P 500 and Russell
2000 stock market indices to represent the
Table 3 Regressions including leverage factor, January 1990 – June 2009, monthly
observations, HFR data, all variables statistically significant at the 1 per cent level
a t (a) S&P 500 EAFE Emerging
markets
Barclays
Aggregate
Bond Index
High
yield
7–10 year
Treasury
return
Adjusted R2
Fund Weighted Index 0.640 8.388 0.143 — 0.140 — 0.138 — 0.701
Relative Value Multi-Strategy 0.329 5.270 — — 0.048 0.968 0.172 �0.576 0.620
Convertible Arbitrage 0.151 1.468 — — — 1.600 0.324 �0.961 0.534
Distressed 0.745 7.753 — — 0.072 — 0.380 �0.138 0.512
Emerging Markets 0.641 4.756 — — 0.533 — — — 0.772
Equity Hedge 0.664 4.924 0.258 — 0.129 0.890 — �0.554 0.583
Equity Market Neutral 0.604 9.853 0.040 — — — — — 0.031
Fixed Income Arbitrage 0.161 1.594 — — — 1.451 0.331 �0.866 0.530
Event Driven 0.611 7.431 0.133 — 0.076 — 0.294 — 0.637
Macro 0.650 4.565 — — 0.140 0.603 — — 0.277
Systematic Diversified 0.951 7.994 0.197 — 0.107 — �0.244 — 0.304
Merger Arbitrage 0.596 8.706 0.103 — — — 0.137 — 0.329
Fixed Income Corporate 0.221 2.692 — — 0.040 — 0.536 — 0.625
Short Selling 1.004 3.823 �0.731 — �0.164 — — — 0.509
Fund of Funds 0.330 3.320 — — 0.139 0.902 — �0.510 0.454
Fund of Funds Conservative 0.296 4.212 — — 0.069 1.007 — �0.601 0.406
Fund of Funds Diversified 0.314 3.016 — — 0.149 0.787 — �0.460 0.446
Fund of Funds Market
Defensive
0.736 6.813 �0.108 — 0.101 — — — 0.085
Fund of Funds Strategic 0.620 4.714 0.118 — 0.188 — — — 0.423
Average 0.540 5.331 — — — — — — 0.462
Black
206 & 2012 Macmillan Publishers Ltd. 1753-9641 Journal of Derivatives & Hedge Funds Vol. 18, 3, 201–222
return to smaller capitalization securities, the
difference between the Russell 1000 value and
growth indices to show the return to equity
styles, the VIX to measure the implied volatility
of S&P 500 options as a proxy for investor
sentiment, and the difference between the 10
Year and 1 Year Treasury yields to measure the
slope of the yield curve. Note that where the
slope of the yield curve is determined to be a
statistically significant factor, that the
interpretation of the intercept is no longer a, as
the slope variable does not directly correspond
to a market return.
Comparing Table 3 and 5 (4 and 6), we see
that the average adjusted R2 rises from 0.462 to
0.533 (0.607 to 0.695) through the addition
of a wider variety of market risks. While the
traditional market bs used in Tables 1 and 2 show
broad market exposures, the addition of a wider
array of variables better explains the trading
strategies of hedge funds. In fact, the market
exposures reported in these regressions broadly
matches the professed style of the hedge fund
managers. It is comforting to see that macro
managers take consistent bets to currency
markets while fixed income and convertible
Table 4 Regressions including leverage factor, August 2001 – June 2009, monthly
observations, HFR data, all variables statistically significant at the 1 per cent Level
a t (a) S&P 500 EAFE Emerging
markets
Barclays
Aggregate
Bond Index
High
yield
7–10 year
Treasury
return
Adjusted R2
Fund Weighted Index 0.153 2.034 — — 0.207 — 0.098 — 0.858
Relative Value Multi-Strategy �0.003 �0.034 — — 0.078 1.625 — �0.875 0.683
Convertible Arbitrage �0.403 �2.147 — — 0.104 3.250 — �1.701 0.622
Distressed 0.454 3.379 — 0.141 — — 0.250 — 0.565
Emerging Markets 0.370 2.926 �0.173 0.196 0.429 — — — 0.899
Equity Hedge 0.083 0.893 — 0.142 0.215 — — �0.133 0.889
Equity Market Neutral 0.126 1.639 �0.080 — 0.081 — — — 0.192
Fixed Income Arbitrage �0.258 �1.376 — — — 2.086 0.328 �1.085 0.609
Event Driven 0.435 3.932 — 0.218 — �0.283 0.242 — 0.767
Macro 0.433 3.148 �0.224 — 0.197 — — — 0.293
Systematic Diversified 0.657 3.272 — — 0.227 — �0.332 — 0.259
Merger Arbitrage 0.230 3.181 — — 0.113 — — — 0.588
Fixed Income Corporate 0.280 2.375 — 0.092 — — 0.327 �0.163 0.681
Short Selling 0.283 1.684 �0.715 — — — — — 0.800
Fund of Funds 0.043 0.422 — — 0.178 — — — 0.642
Fund of Funds Conservative 0.023 0.228 — — 0.089 0.784 — �0.490 0.531
Fund of Funds Diversified 0.051 0.489 — — 0.171 — — — 0.611
Fund of Funds Market
Defensive
0.285 2.021 �0.272 — 0.197 — — — 0.276
Fund of Funds Strategic �0.033 �0.316 — — 0.251 — — — 0.771
Average 0.169 1.461 — — — — — — 0.607
The role of alternative betas in hedge fund analysis
207& 2012 Macmillan Publishers Ltd. 1753-9641 Journal of Derivatives & Hedge Funds Vol. 18, 3, 201–222
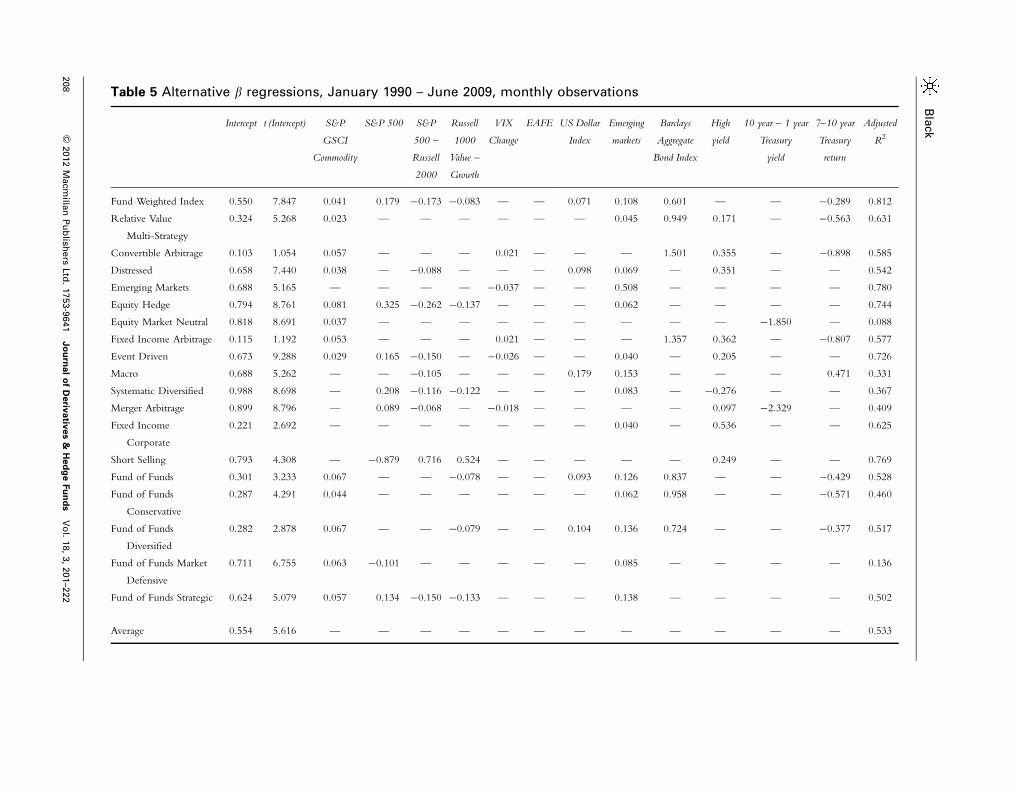
Table 5 Alternative b regressions, January 1990 – June 2009, monthly observations
Intercept t (Intercept) S&P
GSCI
Commodity
S&P 500 S&P
500 –
Russell
2000
Russell
1000
Value –
Growth
VIX
Change
EAFE US Dollar
Index
Emerging
markets
Barclays
Aggregate
Bond Index
High
yield
10 year – 1 year
Treasury
yield
7–10 year
Treasury
return
Adjusted
R2
Fund Weighted Index 0.550 7.847 0.041 0.179 �0.173 �0.083 — — 0.071 0.108 0.601 — — �0.289 0.812
Relative Value
Multi-Strategy
0.324 5.268 0.023 — — — — — — 0.045 0.949 0.171 — �0.563 0.631
Convertible Arbitrage 0.103 1.054 0.057 — — — 0.021 — — — 1.501 0.355 — �0.898 0.585
Distressed 0.658 7.440 0.038 — �0.088 — — — 0.098 0.069 — 0.351 — — 0.542
Emerging Markets 0.688 5.165 — — — — �0.037 — — 0.508 — — — — 0.780
Equity Hedge 0.794 8.761 0.081 0.325 �0.262 �0.137 — — — 0.062 — — — — 0.744
Equity Market Neutral 0.818 8.691 0.037 — — — — — — — — — �1.850 — 0.088
Fixed Income Arbitrage 0.115 1.192 0.053 — — — 0.021 — — — 1.357 0.362 — �0.807 0.577
Event Driven 0.673 9.288 0.029 0.165 �0.150 — �0.026 — — 0.040 — 0.205 — — 0.726
Macro 0.688 5.262 — — �0.105 — — — 0.179 0.153 — — — 0.471 0.331
Systematic Diversified 0.988 8.698 — 0.208 �0.116 �0.122 — — — 0.083 — �0.276 — — 0.367
Merger Arbitrage 0.899 8.796 — 0.089 �0.068 — �0.018 — — — — 0.097 �2.329 — 0.409
Fixed Income
Corporate
0.221 2.692 — — — — — — — 0.040 — 0.536 — — 0.625
Short Selling 0.793 4.308 — �0.879 0.716 0.524 — — — — — 0.249 — — 0.769
Fund of Funds 0.301 3.233 0.067 — — �0.078 — — 0.093 0.126 0.837 — — �0.429 0.528
Fund of Funds
Conservative
0.287 4.291 0.044 — — — — — — 0.062 0.958 — — �0.571 0.460
Fund of Funds
Diversified
0.282 2.878 0.067 — — �0.079 — — 0.104 0.136 0.724 — — �0.377 0.517
Fund of Funds Market
Defensive
0.711 6.755 0.063 �0.101 — — — — — 0.085 — — — — 0.136
Fund of Funds Strategic 0.624 5.079 0.057 0.134 �0.150 �0.133 — — — 0.138 — — — — 0.502
Average 0.554 5.616 — — — — — — — — — — — — 0.533
Bla
ck
208
&2012
Macm
illan
Pu
blish
ers
Ltd
.1753-9
641
Jo
urn
al
of
Deriv
ativ
es
&H
ed
ge
Fu
nd
sV
ol.
18,
3,
201–2
22
bond arbitrage managers employ the greatest
degree of leverage.
THE CREDIT DEFAULT SWAP
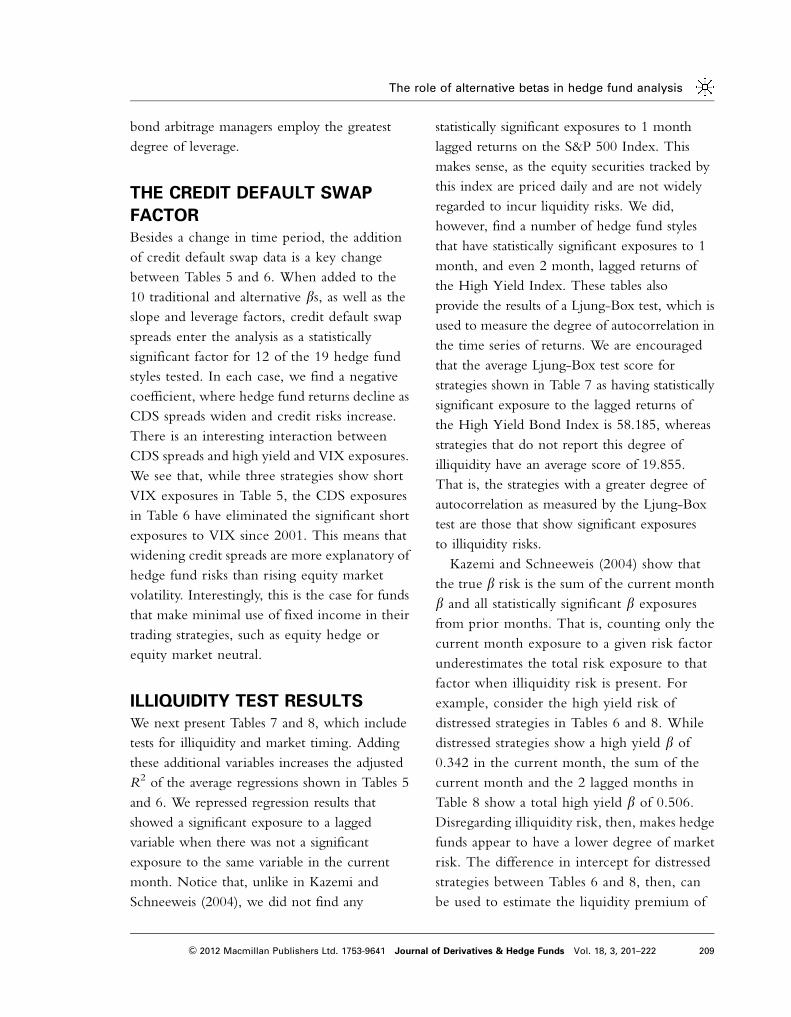
FACTORBesides a change in time period, the addition
of credit default swap data is a key change
between Tables 5 and 6. When added to the
10 traditional and alternative bs, as well as the
slope and leverage factors, credit default swap
spreads enter the analysis as a statistically
significant factor for 12 of the 19 hedge fund
styles tested. In each case, we find a negative
coefficient, where hedge fund returns decline as
CDS spreads widen and credit risks increase.
There is an interesting interaction between
CDS spreads and high yield and VIX exposures.
We see that, while three strategies show short
VIX exposures in Table 5, the CDS exposures
in Table 6 have eliminated the significant short
exposures to VIX since 2001. This means that
widening credit spreads are more explanatory of
hedge fund risks than rising equity market
volatility. Interestingly, this is the case for funds
that make minimal use of fixed income in their
trading strategies, such as equity hedge or
equity market neutral.
ILLIQUIDITY TEST RESULTSWe next present Tables 7 and 8, which include
tests for illiquidity and market timing. Adding
these additional variables increases the adjusted
R2 of the average regressions shown in Tables 5
and 6. We repressed regression results that
showed a significant exposure to a lagged
variable when there was not a significant
exposure to the same variable in the current
month. Notice that, unlike in Kazemi and
Schneeweis (2004), we did not find any
statistically significant exposures to 1 month
lagged returns on the S&P 500 Index. This
makes sense, as the equity securities tracked by
this index are priced daily and are not widely
regarded to incur liquidity risks. We did,
however, find a number of hedge fund styles
that have statistically significant exposures to 1
month, and even 2 month, lagged returns of
the High Yield Index. These tables also
provide the results of a Ljung-Box test, which is
used to measure the degree of autocorrelation in
the time series of returns. We are encouraged
that the average Ljung-Box test score for
strategies shown in Table 7 as having statistically
significant exposure to the lagged returns of
the High Yield Bond Index is 58.185, whereas
strategies that do not report this degree of
illiquidity have an average score of 19.855.
That is, the strategies with a greater degree of
autocorrelation as measured by the Ljung-Box
test are those that show significant exposures
to illiquidity risks.
Kazemi and Schneeweis (2004) show that
the true b risk is the sum of the current month
b and all statistically significant b exposures
from prior months. That is, counting only the
current month exposure to a given risk factor
underestimates the total risk exposure to that
factor when illiquidity risk is present. For
example, consider the high yield risk of
distressed strategies in Tables 6 and 8. While
distressed strategies show a high yield b of
0.342 in the current month, the sum of the
current month and the 2 lagged months in
Table 8 show a total high yield b of 0.506.
Disregarding illiquidity risk, then, makes hedge
funds appear to have a lower degree of market
risk. The difference in intercept for distressed
strategies between Tables 6 and 8, then, can
be used to estimate the liquidity premium of
The role of alternative betas in hedge fund analysis
209& 2012 Macmillan Publishers Ltd. 1753-9641 Journal of Derivatives & Hedge Funds Vol. 18, 3, 201–222
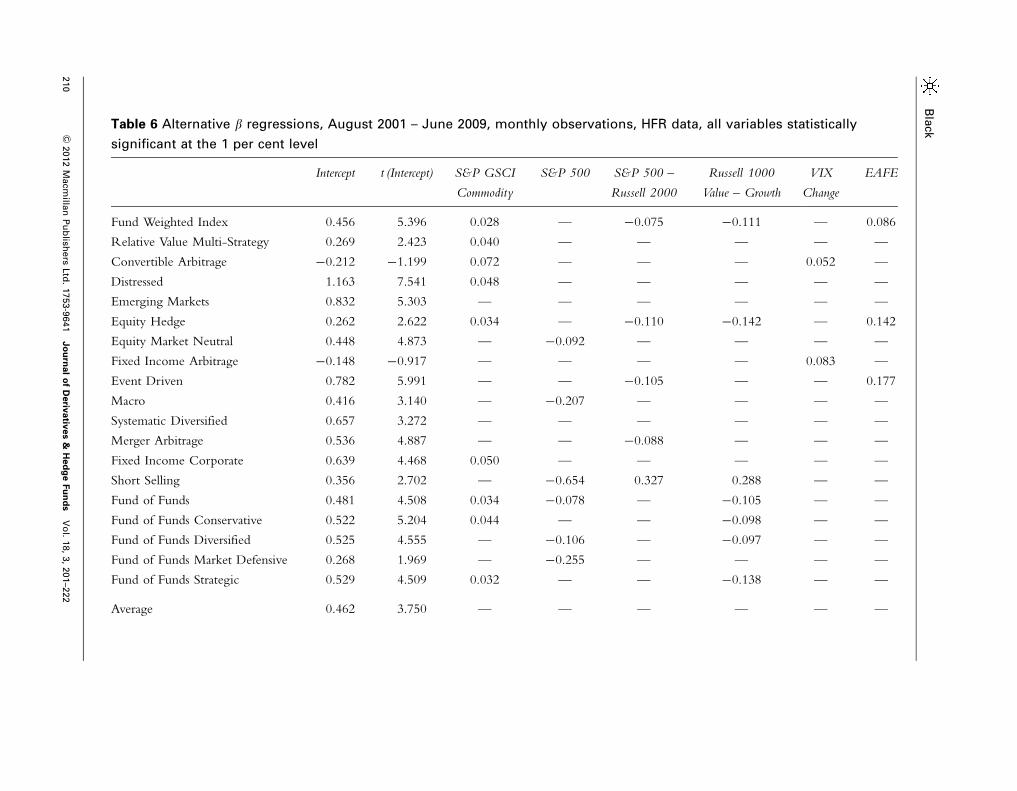
Table 6 Alternative b regressions, August 2001 – June 2009, monthly observations, HFR data, all variables statistically
significant at the 1 per cent level
Intercept t (Intercept) S&P GSCI
Commodity
S&P 500 S&P 500 –
Russell 2000
Russell 1000
Value – Growth
VIX
Change
EAFE
Fund Weighted Index 0.456 5.396 0.028 — �0.075 �0.111 — 0.086
Relative Value Multi-Strategy 0.269 2.423 0.040 — — — — —
Convertible Arbitrage �0.212 �1.199 0.072 — — — 0.052 —
Distressed 1.163 7.541 0.048 — — — — —
Emerging Markets 0.832 5.303 — — — — — —
Equity Hedge 0.262 2.622 0.034 — �0.110 �0.142 — 0.142
Equity Market Neutral 0.448 4.873 — �0.092 — — — —
Fixed Income Arbitrage �0.148 �0.917 — — — — 0.083 —
Event Driven 0.782 5.991 — — �0.105 — — 0.177
Macro 0.416 3.140 — �0.207 — — — —
Systematic Diversified 0.657 3.272 — — — — — —
Merger Arbitrage 0.536 4.887 — — �0.088 — — —
Fixed Income Corporate 0.639 4.468 0.050 — — — — —
Short Selling 0.356 2.702 — �0.654 0.327 0.288 — —
Fund of Funds 0.481 4.508 0.034 �0.078 — �0.105 — —
Fund of Funds Conservative 0.522 5.204 0.044 — — �0.098 — —
Fund of Funds Diversified 0.525 4.555 — �0.106 — �0.097 — —
Fund of Funds Market Defensive 0.268 1.969 — �0.255 — — — —
Fund of Funds Strategic 0.529 4.509 0.032 — — �0.138 — —
Average 0.462 3.750 — — — — — —
Bla
ck
210
&2012
Macm
illan
Pu
blish
ers
Ltd
.1753-9
641
Jo
urn
al
of
Deriv
ativ
es
&H
ed
ge
Fu
nd
sV
ol.
18,
3,
201–2
22
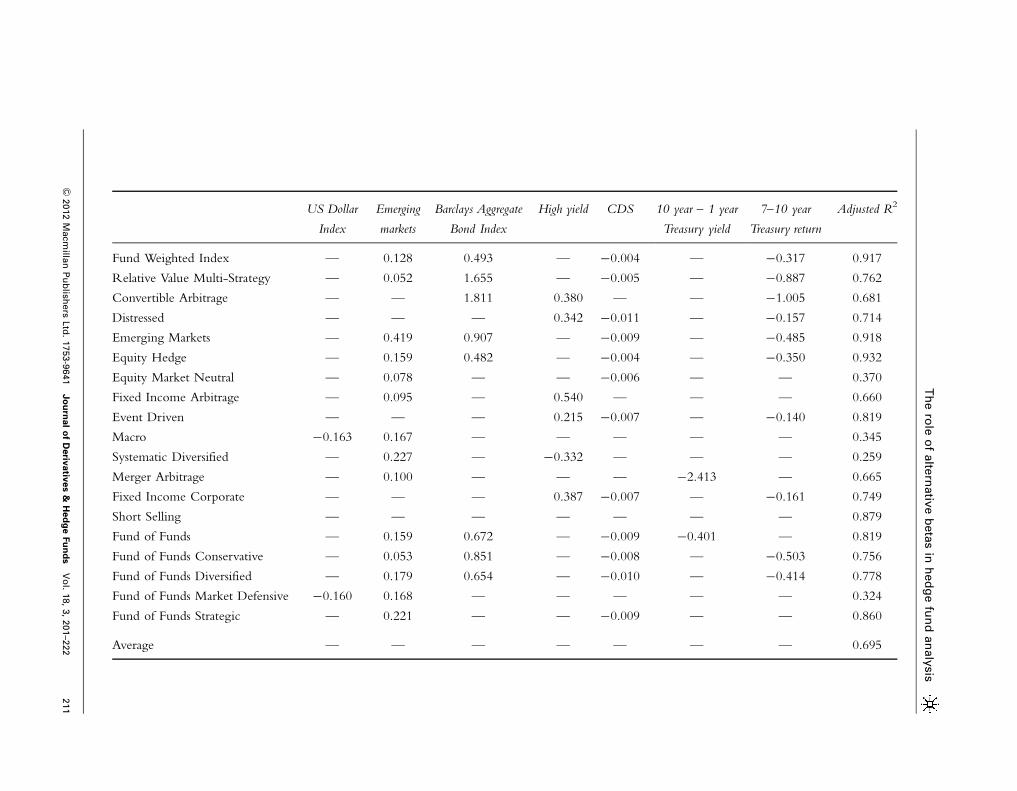
Table 6
US Dollar
Index
Emerging
markets
Barclays Aggregate
Bond Index
High yield CDS 10 year – 1 year
Treasury yield
7–10 year
Treasury return
Adjusted R2
Fund Weighted Index — 0.128 0.493 — �0.004 — �0.317 0.917
Relative Value Multi-Strategy — 0.052 1.655 — �0.005 — �0.887 0.762
Convertible Arbitrage — — 1.811 0.380 — — �1.005 0.681
Distressed — — — 0.342 �0.011 — �0.157 0.714
Emerging Markets — 0.419 0.907 — �0.009 — �0.485 0.918
Equity Hedge — 0.159 0.482 — �0.004 — �0.350 0.932
Equity Market Neutral — 0.078 — — �0.006 — — 0.370
Fixed Income Arbitrage — 0.095 — 0.540 — — — 0.660
Event Driven — — — 0.215 �0.007 — �0.140 0.819
Macro �0.163 0.167 — — — — — 0.345
Systematic Diversified — 0.227 — �0.332 — — — 0.259
Merger Arbitrage — 0.100 — — — �2.413 — 0.665
Fixed Income Corporate — — — 0.387 �0.007 — �0.161 0.749
Short Selling — — — — — — — 0.879
Fund of Funds — 0.159 0.672 — �0.009 �0.401 — 0.819
Fund of Funds Conservative — 0.053 0.851 — �0.008 — �0.503 0.756
Fund of Funds Diversified — 0.179 0.654 — �0.010 — �0.414 0.778
Fund of Funds Market Defensive �0.160 0.168 — — — — — 0.324
Fund of Funds Strategic — 0.221 — — �0.009 — — 0.860
Average — — — — — — — 0.695
Th
ero
leo
falte
rnativ
eb
eta
sin
hed
ge
fun
dan
aly
sis
211
&2012
Macm
illan
Pu
blish
ers
Ltd
.1753-9
641
Jo
urn
al
of
Deriv
ativ
es
&H
ed
ge
Fu
nd
sV
ol.
18,
3,
201–2
22
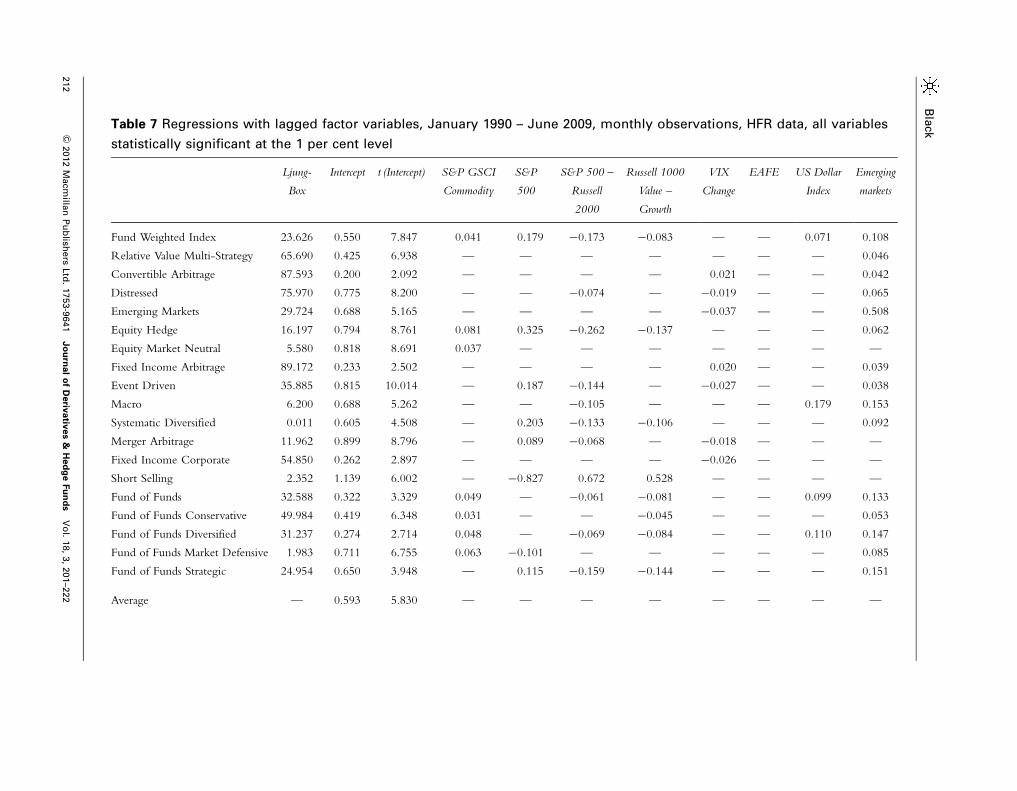
Table 7 Regressions with lagged factor variables, January 1990 – June 2009, monthly observations, HFR data, all variables
statistically significant at the 1 per cent level
Ljung-
Box
Intercept t (Intercept) S&P GSCI
Commodity
S&P
500
S&P 500 –
Russell
2000
Russell 1000
Value –
Growth
VIX
Change
EAFE US Dollar
Index
Emerging
markets
Fund Weighted Index 23.626 0.550 7.847 0.041 0.179 �0.173 �0.083 — — 0.071 0.108
Relative Value Multi-Strategy 65.690 0.425 6.938 — — — — — — — 0.046
Convertible Arbitrage 87.593 0.200 2.092 — — — — 0.021 — — 0.042
Distressed 75.970 0.775 8.200 — — �0.074 — �0.019 — — 0.065
Emerging Markets 29.724 0.688 5.165 — — — — �0.037 — — 0.508
Equity Hedge 16.197 0.794 8.761 0.081 0.325 �0.262 �0.137 — — — 0.062
Equity Market Neutral 5.580 0.818 8.691 0.037 — — — — — — —
Fixed Income Arbitrage 89.172 0.233 2.502 — — — — 0.020 — — 0.039
Event Driven 35.885 0.815 10.014 — 0.187 �0.144 — �0.027 — — 0.038
Macro 6.200 0.688 5.262 — — �0.105 — — — 0.179 0.153
Systematic Diversified 0.011 0.605 4.508 — 0.203 �0.133 �0.106 — — — 0.092
Merger Arbitrage 11.962 0.899 8.796 — 0.089 �0.068 — �0.018 — — —
Fixed Income Corporate 54.850 0.262 2.897 — — — — �0.026 — — —
Short Selling 2.352 1.139 6.002 — �0.827 0.672 0.528 — — — —
Fund of Funds 32.588 0.322 3.329 0.049 — �0.061 �0.081 — — 0.099 0.133
Fund of Funds Conservative 49.984 0.419 6.348 0.031 — — �0.045 — — — 0.053
Fund of Funds Diversified 31.237 0.274 2.714 0.048 — �0.069 �0.084 — — 0.110 0.147
Fund of Funds Market Defensive 1.983 0.711 6.755 0.063 �0.101 — — — — — 0.085
Fund of Funds Strategic 24.954 0.650 3.948 — 0.115 �0.159 �0.144 — — — 0.151
Average — 0.593 5.830 — — — — — — — —
Bla
ck
212
&2012
Macm
illan
Pu
blish
ers
Ltd
.1753-9
641
Jo
urn
al
of
Deriv
ativ
es
&H
ed
ge
Fu
nd
sV
ol.
18,
3,
201–2
22
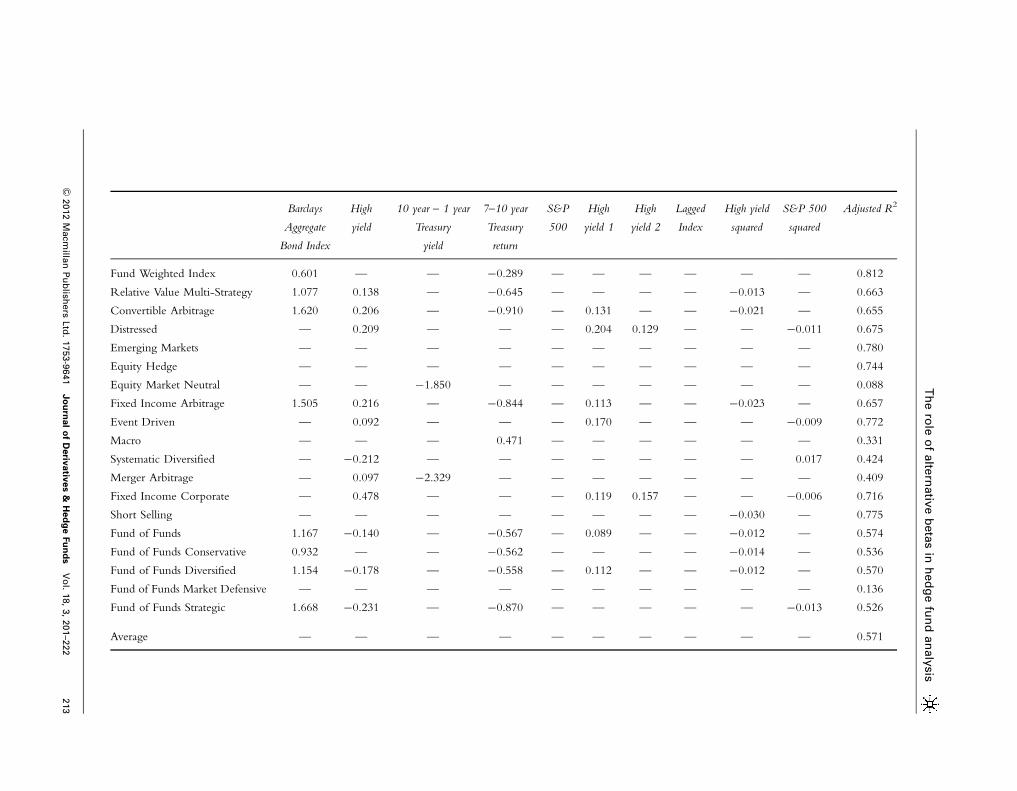
Table 7 continued
Barclays
Aggregate
Bond Index
High
yield
10 year – 1 year
Treasury
yield
7–10 year
Treasury
return
S&P
500
High
yield 1
High
yield 2
Lagged
Index
High yield
squared
S&P 500
squared
Adjusted R2
Fund Weighted Index 0.601 — — �0.289 — — — — — — 0.812
Relative Value Multi-Strategy 1.077 0.138 — �0.645 — — — — �0.013 — 0.663
Convertible Arbitrage 1.620 0.206 — �0.910 — 0.131 — — �0.021 — 0.655
Distressed — 0.209 — — — 0.204 0.129 — — �0.011 0.675
Emerging Markets — — — — — — — — — — 0.780
Equity Hedge — — — — — — — — — — 0.744
Equity Market Neutral — — �1.850 — — — — — — — 0.088
Fixed Income Arbitrage 1.505 0.216 — �0.844 — 0.113 — — �0.023 — 0.657
Event Driven — 0.092 — — — 0.170 — — — �0.009 0.772
Macro — — — 0.471 — — — — — — 0.331
Systematic Diversified — �0.212 — — — — — — — 0.017 0.424
Merger Arbitrage — 0.097 �2.329 — — — — — — — 0.409
Fixed Income Corporate — 0.478 — — — 0.119 0.157 — — �0.006 0.716
Short Selling — — — — — — — — �0.030 — 0.775
Fund of Funds 1.167 �0.140 — �0.567 — 0.089 — — �0.012 — 0.574
Fund of Funds Conservative 0.932 — — �0.562 — — — — �0.014 — 0.536
Fund of Funds Diversified 1.154 �0.178 — �0.558 — 0.112 — — �0.012 — 0.570
Fund of Funds Market Defensive — — — — — — — — — — 0.136
Fund of Funds Strategic 1.668 �0.231 — �0.870 — — — — — �0.013 0.526
Average — — — — — — — — — — 0.571
Th
ero
leo
falte
rnativ
eb
eta
sin
hed
ge
fun
dan
aly
sis
213
&2012
Macm
illan
Pu
blish
ers
Ltd
.1753-9
641
Jo
urn
al
of
Deriv
ativ
es
&H
ed
ge
Fu
nd
sV
ol.
18,
3,
201–2
22
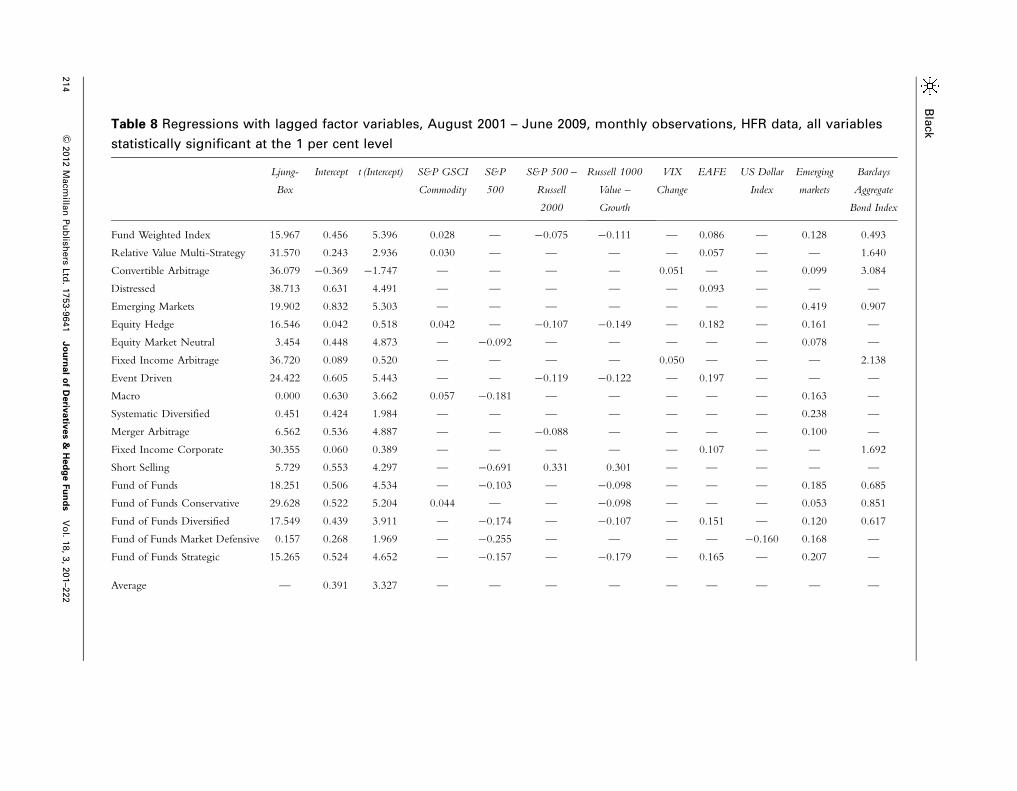
Table 8 Regressions with lagged factor variables, August 2001 – June 2009, monthly observations, HFR data, all variables
statistically significant at the 1 per cent level
Ljung-
Box
Intercept t (Intercept) S&P GSCI
Commodity
S&P
500
S&P 500 –
Russell
2000
Russell 1000
Value –
Growth
VIX
Change
EAFE US Dollar
Index
Emerging
markets
Barclays
Aggregate
Bond Index
Fund Weighted Index 15.967 0.456 5.396 0.028 — �0.075 �0.111 — 0.086 — 0.128 0.493
Relative Value Multi-Strategy 31.570 0.243 2.936 0.030 — — — — 0.057 — — 1.640
Convertible Arbitrage 36.079 �0.369 �1.747 — — — — 0.051 — — 0.099 3.084
Distressed 38.713 0.631 4.491 — — — — — 0.093 — — —
Emerging Markets 19.902 0.832 5.303 — — — — — — — 0.419 0.907
Equity Hedge 16.546 0.042 0.518 0.042 — �0.107 �0.149 — 0.182 — 0.161 —
Equity Market Neutral 3.454 0.448 4.873 — �0.092 — — — — — 0.078 —
Fixed Income Arbitrage 36.720 0.089 0.520 — — — — 0.050 — — — 2.138
Event Driven 24.422 0.605 5.443 — — �0.119 �0.122 — 0.197 — — —
Macro 0.000 0.630 3.662 0.057 �0.181 — — — — — 0.163 —
Systematic Diversified 0.451 0.424 1.984 — — — — — — — 0.238 —
Merger Arbitrage 6.562 0.536 4.887 — — �0.088 — — — — 0.100 —
Fixed Income Corporate 30.355 0.060 0.389 — — — — — 0.107 — — 1.692
Short Selling 5.729 0.553 4.297 — �0.691 0.331 0.301 — — — — —
Fund of Funds 18.251 0.506 4.534 — �0.103 — �0.098 — — — 0.185 0.685
Fund of Funds Conservative 29.628 0.522 5.204 0.044 — — �0.098 — — — 0.053 0.851
Fund of Funds Diversified 17.549 0.439 3.911 — �0.174 — �0.107 — 0.151 — 0.120 0.617
Fund of Funds Market Defensive 0.157 0.268 1.969 — �0.255 — — — — �0.160 0.168 —
Fund of Funds Strategic 15.265 0.524 4.652 — �0.157 — �0.179 — 0.165 — 0.207 —
Average — 0.391 3.327 — — — — — — — — —
Bla
ck
214
&2012
Macm
illan
Pu
blish
ers
Ltd
.1753-9
641
Jo
urn
al
of
Deriv
ativ
es
&H
ed
ge
Fu
nd
sV
ol.
18,
3,
201–2
22

Table 8 continued
High yield CDS 10 year – 1 year
Treasury yield
7–10 year
Treasury
return
S&P
500
High
yield 1
High
yield 2
Lagged
Index
High yield
squared
S&P 500
squared
Adjusted R2
Fund Weighted Index — �0.004 — �0.317 — — — — — — 0.917
Relative Value Multi-Strategy — — — �0.914 — — — — �0.013 — 0.797
Convertible Arbitrage — 0.008 — �1.741 — — — — �0.032 — 0.735
Distressed 0.229 �0.010 2.412 — — 0.176 0.101 — — — 0.849
Emerging Markets — �0.009 — �0.485 — — — — — — 0.918
Equity Hedge — — — — — — — — — — 0.913
Equity Market Neutral — �0.006 — — — — — — — — 0.370
Fixed Income Arbitrage 0.288 — — �1.219 — — — — �0.024 — 0.712
Event Driven 0.164 �0.006 — — — 0.106 0.080 — — — 0.874
Macro — �0.007 — — — — — — 0.018 — 0.407
Systematic Diversified �0.291 — — — — — — — 0.017 — 0.305
Merger Arbitrage — — �2.413 — — — — — — — 0.665
Fixed Income Corporate — — 3.049 �1.112 — — — — �0.023 — 0.803
Short Selling — — — — — — — — �0.017 — 0.899
Fund of Funds — �0.010 — �0.414 — — — — — — 0.800
Fund of Funds Conservative — �0.008 — �0.503 — — — — — — 0.756
Fund of Funds Diversified — �0.008 — �0.413 — — — — �0.013 0.009 0.808
Fund of Funds Market Defensive — — — — — — — — — — 0.324
Fund of Funds Strategic — �0.009 — — — — — — — — 0.872
Average — — — — — — — — — — 0.722
Th
ero
leo
falte
rnativ
eb
eta
sin
hed
ge
fun
dan
aly
sis
215
&2012
Macm
illan
Pu
blish
ers
Ltd
.1753-9
641
Jo
urn
al
of
Deriv
ativ
es
&H
ed
ge
Fu
nd
sV
ol.
18,
3,
201–2
22
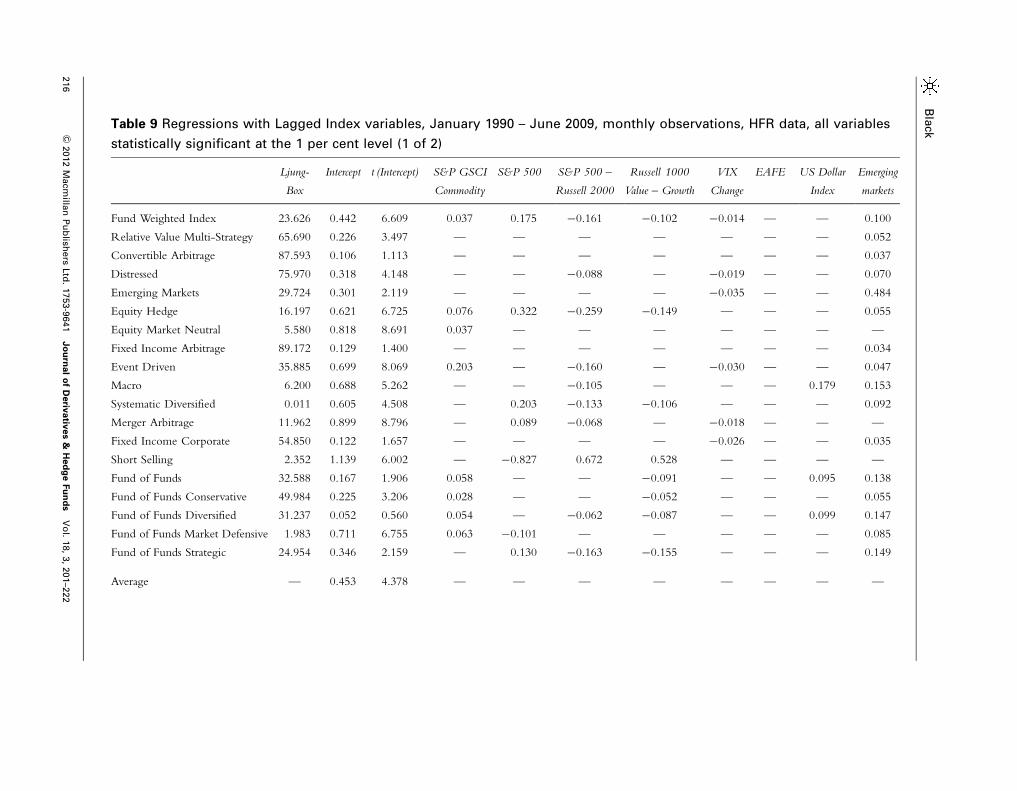
Table 9 Regressions with Lagged Index variables, January 1990 – June 2009, monthly observations, HFR data, all variables
statistically significant at the 1 per cent level (1 of 2)
Ljung-
Box
Intercept t (Intercept) S&P GSCI
Commodity
S&P 500 S&P 500 –
Russell 2000
Russell 1000
Value – Growth
VIX
Change
EAFE US Dollar
Index
Emerging
markets
Fund Weighted Index 23.626 0.442 6.609 0.037 0.175 �0.161 �0.102 �0.014 — — 0.100
Relative Value Multi-Strategy 65.690 0.226 3.497 — — — — — — — 0.052
Convertible Arbitrage 87.593 0.106 1.113 — — — — — — — 0.037
Distressed 75.970 0.318 4.148 — — �0.088 — �0.019 — — 0.070
Emerging Markets 29.724 0.301 2.119 — — — — �0.035 — — 0.484
Equity Hedge 16.197 0.621 6.725 0.076 0.322 �0.259 �0.149 — — — 0.055
Equity Market Neutral 5.580 0.818 8.691 0.037 — — — — — — —
Fixed Income Arbitrage 89.172 0.129 1.400 — — — — — — — 0.034
Event Driven 35.885 0.699 8.069 0.203 — �0.160 — �0.030 — — 0.047
Macro 6.200 0.688 5.262 — — �0.105 — — — 0.179 0.153
Systematic Diversified 0.011 0.605 4.508 — 0.203 �0.133 �0.106 — — — 0.092
Merger Arbitrage 11.962 0.899 8.796 — 0.089 �0.068 — �0.018 — — —
Fixed Income Corporate 54.850 0.122 1.657 — — — — �0.026 — — 0.035
Short Selling 2.352 1.139 6.002 — �0.827 0.672 0.528 — — — —
Fund of Funds 32.588 0.167 1.906 0.058 — — �0.091 — — 0.095 0.138
Fund of Funds Conservative 49.984 0.225 3.206 0.028 — — �0.052 — — — 0.055
Fund of Funds Diversified 31.237 0.052 0.560 0.054 — �0.062 �0.087 — — 0.099 0.147
Fund of Funds Market Defensive 1.983 0.711 6.755 0.063 �0.101 — — — — — 0.085
Fund of Funds Strategic 24.954 0.346 2.159 — 0.130 �0.163 �0.155 — — — 0.149
Average — 0.453 4.378 — — — — — — — —
Bla
ck
216
&2012
Macm
illan
Pu
blish
ers
Ltd
.1753-9
641
Jo
urn
al
of
Deriv
ativ
es
&H
ed
ge
Fu
nd
sV
ol.
18,
3,
201–2
22
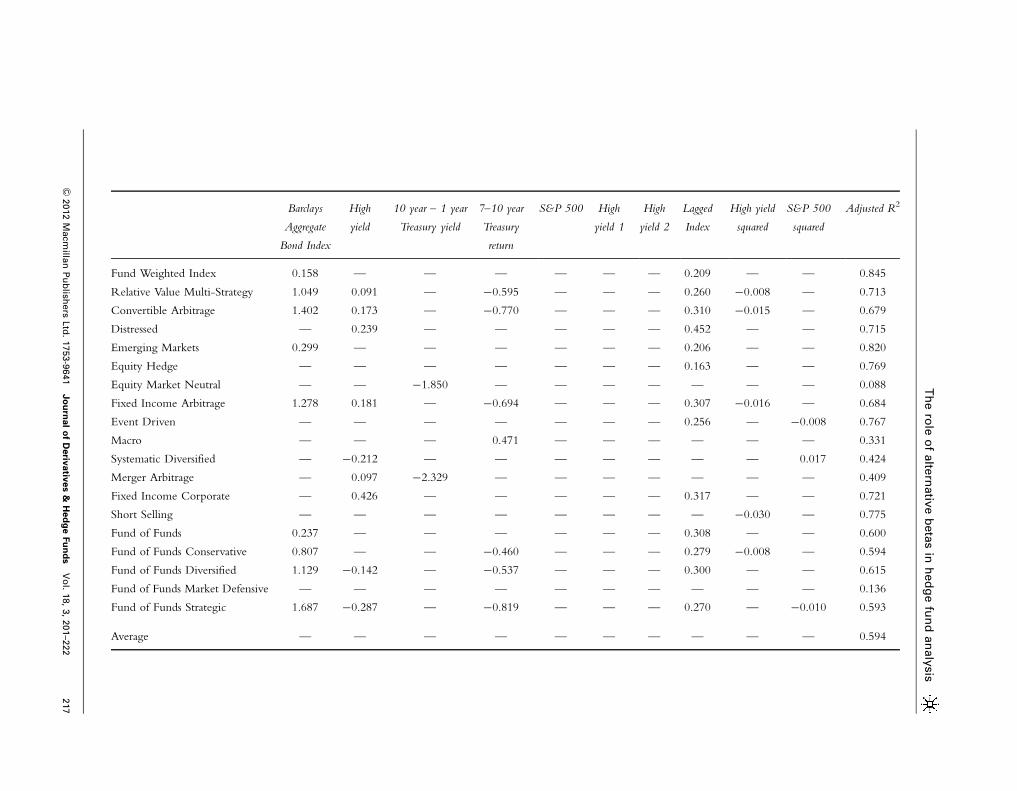
Table 9 continued
Barclays
Aggregate
Bond Index
High
yield
10 year – 1 year
Treasury yield
7–10 year
Treasury
return
S&P 500 High
yield 1
High
yield 2
Lagged
Index
High yield
squared
S&P 500
squared
Adjusted R2
Fund Weighted Index 0.158 — — — — — — 0.209 — — 0.845
Relative Value Multi-Strategy 1.049 0.091 — �0.595 — — — 0.260 �0.008 — 0.713
Convertible Arbitrage 1.402 0.173 — �0.770 — — — 0.310 �0.015 — 0.679
Distressed — 0.239 — — — — — 0.452 — — 0.715
Emerging Markets 0.299 — — — — — — 0.206 — — 0.820
Equity Hedge — — — — — — — 0.163 — — 0.769
Equity Market Neutral — — �1.850 — — — — — — — 0.088
Fixed Income Arbitrage 1.278 0.181 — �0.694 — — — 0.307 �0.016 — 0.684
Event Driven — — — — — — — 0.256 — �0.008 0.767
Macro — — — 0.471 — — — — — — 0.331
Systematic Diversified — �0.212 — — — — — — — 0.017 0.424
Merger Arbitrage — 0.097 �2.329 — — — — — — — 0.409
Fixed Income Corporate — 0.426 — — — — — 0.317 — — 0.721
Short Selling — — — — — — — — �0.030 — 0.775
Fund of Funds 0.237 — — — — — — 0.308 — — 0.600
Fund of Funds Conservative 0.807 — — �0.460 — — — 0.279 �0.008 — 0.594
Fund of Funds Diversified 1.129 �0.142 — �0.537 — — — 0.300 — — 0.615
Fund of Funds Market Defensive — — — — — — — — — — 0.136
Fund of Funds Strategic 1.687 �0.287 — �0.819 — — — 0.270 — �0.010 0.593
Average — — — — — — — — — — 0.594
Th
ero
leo
falte
rnativ
eb
eta
sin
hed
ge
fun
dan
aly
sis
217
&2012
Macm
illan
Pu
blish
ers
Ltd
.1753-9
641
Jo
urn
al
of
Deriv
ativ
es
&H
ed
ge
Fu
nd
sV
ol.
18,
3,
201–2
22
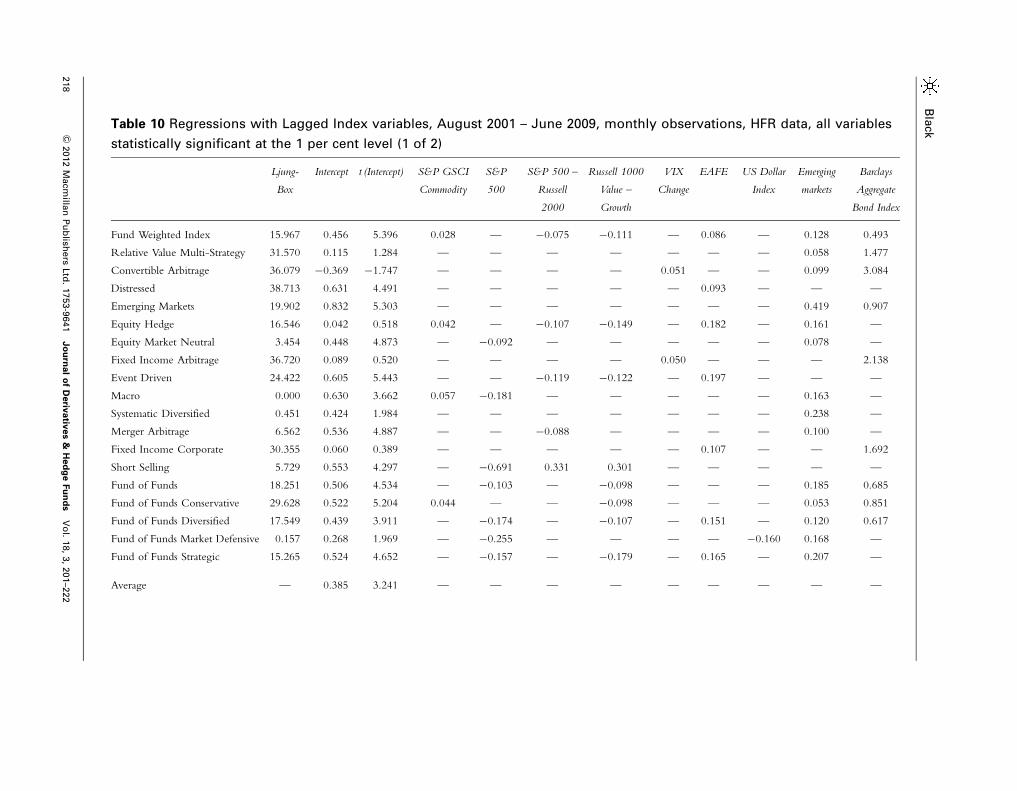
Table 10 Regressions with Lagged Index variables, August 2001 – June 2009, monthly observations, HFR data, all variables
statistically significant at the 1 per cent level (1 of 2)
Ljung-
Box
Intercept t (Intercept) S&P GSCI
Commodity
S&P
500
S&P 500 –
Russell
2000
Russell 1000
Value –
Growth
VIX
Change
EAFE US Dollar
Index
Emerging
markets
Barclays
Aggregate
Bond Index
Fund Weighted Index 15.967 0.456 5.396 0.028 — �0.075 �0.111 — 0.086 — 0.128 0.493
Relative Value Multi-Strategy 31.570 0.115 1.284 — — — — — — — 0.058 1.477
Convertible Arbitrage 36.079 �0.369 �1.747 — — — — 0.051 — — 0.099 3.084
Distressed 38.713 0.631 4.491 — — — — — 0.093 — — —
Emerging Markets 19.902 0.832 5.303 — — — — — — — 0.419 0.907
Equity Hedge 16.546 0.042 0.518 0.042 — �0.107 �0.149 — 0.182 — 0.161 —
Equity Market Neutral 3.454 0.448 4.873 — �0.092 — — — — — 0.078 —
Fixed Income Arbitrage 36.720 0.089 0.520 — — — — 0.050 — — — 2.138
Event Driven 24.422 0.605 5.443 — — �0.119 �0.122 — 0.197 — — —
Macro 0.000 0.630 3.662 0.057 �0.181 — — — — — 0.163 —
Systematic Diversified 0.451 0.424 1.984 — — — — — — — 0.238 —
Merger Arbitrage 6.562 0.536 4.887 — — �0.088 — — — — 0.100 —
Fixed Income Corporate 30.355 0.060 0.389 — — — — — 0.107 — — 1.692
Short Selling 5.729 0.553 4.297 — �0.691 0.331 0.301 — — — — —
Fund of Funds 18.251 0.506 4.534 — �0.103 — �0.098 — — — 0.185 0.685
Fund of Funds Conservative 29.628 0.522 5.204 0.044 — — �0.098 — — — 0.053 0.851
Fund of Funds Diversified 17.549 0.439 3.911 — �0.174 — �0.107 — 0.151 — 0.120 0.617
Fund of Funds Market Defensive 0.157 0.268 1.969 — �0.255 — — — — �0.160 0.168 —
Fund of Funds Strategic 15.265 0.524 4.652 — �0.157 — �0.179 — 0.165 — 0.207 —
Average — 0.385 3.241 — — — — — — — — —
Bla
ck
218
&2012
Macm
illan
Pu
blish
ers
Ltd
.1753-9
641
Jo
urn
al
of
Deriv
ativ
es
&H
ed
ge
Fu
nd
sV
ol.
18,
3,
201–2
22
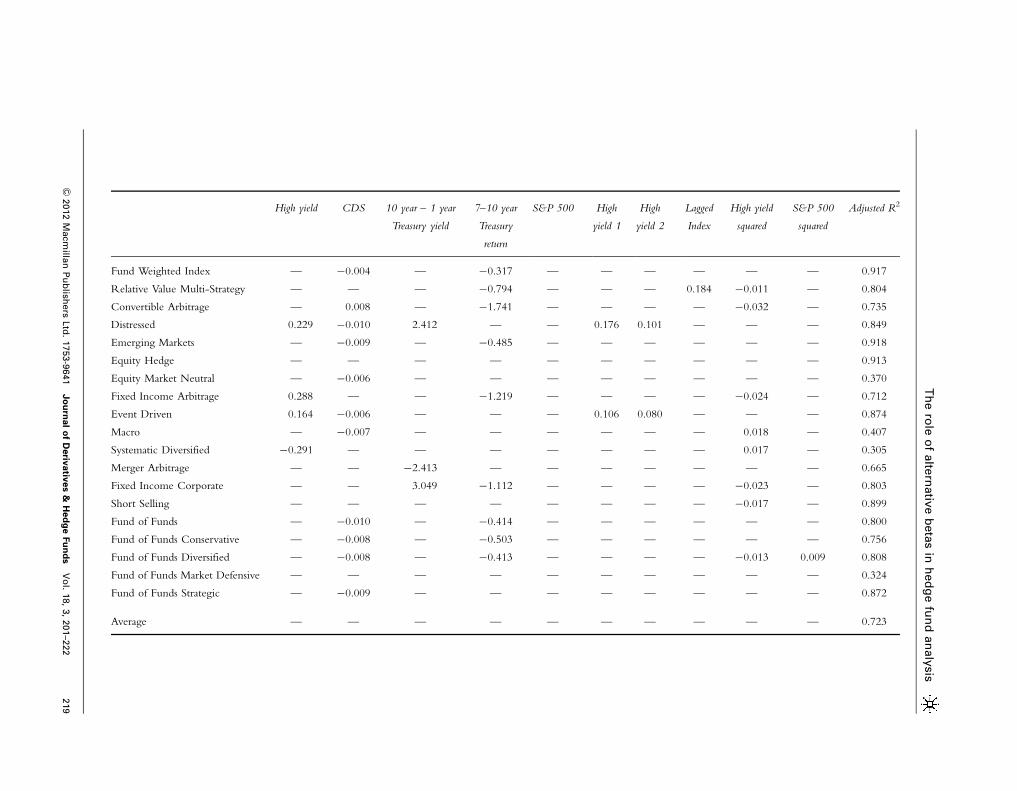
Table 10 continued
High yield CDS 10 year – 1 year
Treasury yield
7–10 year
Treasury
return
S&P 500 High
yield 1
High
yield 2
Lagged
Index
High yield
squared
S&P 500
squared
Adjusted R2
Fund Weighted Index — �0.004 — �0.317 — — — — — — 0.917
Relative Value Multi-Strategy — — — �0.794 — — — 0.184 �0.011 — 0.804
Convertible Arbitrage — 0.008 — �1.741 — — — — �0.032 — 0.735
Distressed 0.229 �0.010 2.412 — — 0.176 0.101 — — — 0.849
Emerging Markets — �0.009 — �0.485 — — — — — — 0.918
Equity Hedge — — — — — — — — — — 0.913
Equity Market Neutral — �0.006 — — — — — — — — 0.370
Fixed Income Arbitrage 0.288 — — �1.219 — — — — �0.024 — 0.712
Event Driven 0.164 �0.006 — — — 0.106 0.080 — — — 0.874
Macro — �0.007 — — — — — — 0.018 — 0.407
Systematic Diversified �0.291 — — — — — — — 0.017 — 0.305
Merger Arbitrage — — �2.413 — — — — — — — 0.665
Fixed Income Corporate — — 3.049 �1.112 — — — — �0.023 — 0.803
Short Selling — — — — — — — — �0.017 — 0.899
Fund of Funds — �0.010 — �0.414 — — — — — — 0.800
Fund of Funds Conservative — �0.008 — �0.503 — — — — — — 0.756
Fund of Funds Diversified — �0.008 — �0.413 — — — — �0.013 0.009 0.808
Fund of Funds Market Defensive — — — — — — — — — — 0.324
Fund of Funds Strategic — �0.009 — — — — — — — — 0.872
Average — — — — — — — — — — 0.723
Th
ero
leo
falte
rnativ
eb
eta
sin
hed
ge
fun
dan
aly
sis
219
&2012
Macm
illan
Pu
blish
ers
Ltd
.1753-9
641
Jo
urn
al
of
Deriv
ativ
es
&H
ed
ge
Fu
nd
sV
ol.
18,
3,
201–2
22
allocating assets to managers with exposure to
distressed securities. Notice that the adjusted
R2 for this strategy rises from 0.714 to 0.849
through the addition of the lagged returns,
which shows that a substantial portion of the
risk of investing in distressed hedge funds is
related to liquidity risk.
The change from Table 7 to Table 8 shows
some interesting results. While the adjusted R2
for the average strategy increases from 0.571 to
0.722 when testing on the same variable set over
two time periods, only event-driven and
distressed strategies maintain a significant
exposure to illiquidity risk since August 2001.
Two possible interpretations for this observation
are that either (i) the CDS factor is correlated to
lagged high yield returns or (ii) that hedge funds
are taking more market risk and less liquidity risk
in the current decade relative to the prior decade.
A different measure of liquidity risk is
described by Getmansky et al (2004). Rather
than including lagged market exposures in the
regression, such as in Kazemi and Schneeweis
(2004), Getmansky et al (2004) include the
lagged returns to the hedge fund index. The
regression model is now
Hedge fund returnt¼ aþHedge Fund Returnt�1
þSbt;i �Traditional Factort;i
þSbt;i �Traditional Factort�1;i
þSbt;i �Alternative Factort;i
þSbt;i �ðTraditional ReturnsÞ2
The results of adding the lagged return to the
hedge fund index are shown in Tables 9 and 10.
Once again, the adjusted R2 increases, from
0.571 to 0.594 for the entire time period, and
from 0.722 to 0.723 since August 2001. This
adds to our observation that hedge funds have
taken less illiquidity risk since 2001 than in the
prior decade. Surprisingly, while 13 of the 19
hedge fund indices show statistically significant
exposures to the Lagged Index over the entire
time period, only relative value multi-strategy
funds show a significant exposure to lagged
returns since August 2001. Perhaps this is due to
the illiquidity risk of CDS, which could absorb
the liquidity risk of the lagged hedge fund
indices.
MARKET TIMING TESTSHamza et al (2006) add squared terms to the
model, where a non-linear regression is used to
test market timing skill. The idea of using
squared terms to detect timing ability was
pioneered in Treynor and Mazuy (1966) and
further explained by Coggin et al (1993).
A manager with perfect market timing ability
will have a long position in rising markets, and
a short position in declining markets. When
plotted against market returns, the fund’s returns
would have a parabolic shape. A positive
coefficient on squared factor returns shows
superior market timing skill, whereas a negative
coefficient shows poor market timing skill.
This return payoff could also be earned
through the purchase of straddles (at-the-money
calls and puts), on the underlying market index.
Over long periods of time, managers regularly
buying straddles would exhibit positive market
timing skill. The a of that manager’s strategy
would be directly related to whether the options
were overpriced or underpriced relative to the
realized volatility experienced in the underlying
market. A manager with market timing skill
would be able to generate a straddle-like payoff
function without paying options premium,
which is quite a valuable skill.
Black
220 & 2012 Macmillan Publishers Ltd. 1753-9641 Journal of Derivatives & Hedge Funds Vol. 18, 3, 201–222
An alternate specification for market timing
skill is presented by Henriksson and Merton
(1981). This article proposes the use of a dummy
variable for down markets. When the market
exposure in down markets is significantly less
than the fund’s exposure in up markets, the
manager is showing market timing skill.
When the squared return to the S&P 500
coefficient is statistically significant and positive,
the manager has positive market timing skill,
as returns rise with larger moves in the stock
market. Conversely, when the squared return to
the High Yield Index is negative and statistically
significant, the manager has negative market
timing skill, taking larger exposures before
market declines and smaller exposures before
market rallies. Tables 7 and 8 show that at least
six hedge fund styles have negative market
timing skill in high yield bonds, while market
timing skill, for better or worse, is less common
in the equity markets. Once again, we are
encouraged that the data back up the trading
styles explained by the managers. Typically, only
macro and systematic diversified (managed
futures or commodity trading advisors) claim to
have positive market timing skill. The data also
makes this case, as both strategies have positive
timing skill to high yield bonds since August
2001, while systematic diversified managers
show positive timing skill to the equity markets
over the entire sample period. Gehin and Vaissie
(2006) estimate that while 23 per cent of the
risk of hedge funds comes from dynamic bexposures, �3 per cent of the total return to
hedge funds is explained by these risks. That is,
hedge funds would offer higher returns and
lower risks by offering static b exposures than
dynamic b exposures. Should hedge funds offer
more static exposures to market bs, the factor-
based benchmarks suggested by Fung and Hsieh
(2004) would be more reliably used. The analysis
of adding hedge funds to traditional portfolios as
explained by Dopfel (2005) would also be more
accurate should hedge funds adopt a more static
exposure to market risk factors. For example, it
is easier for an institutional investor to have a 60
per cent exposure to global equities when they
know the average equity b of their hedge fund
managers is 0.40 rather than when the equity bfluctuates unexpectedly between 0.20 and 0.60.
Static b exposures would also make it easier
to determine the a, or skill, of hedge fund
managers and could give an explicit incentive, or
penalty, for market timing should a manager’s
incentive fee be based on an explicit b exposure.
An example of this fee structure would be a
1 per cent management fee and a 20 per cent
incentive fee on returns in excess of a 0.40
b exposure to the S&P 500 Index.
CONCLUSIONWhile some investors may include traditional
market b exposures in their returns-based style
analysis of hedge fund index returns, we find
that traditional market exposures tell only part of
the story. Because hedge fund managers take
substantial exposures to leverage, alternative
bs and illiquidity risks, it is inappropriate to
measure the complete risk of hedge funds simply
by using traditional factors such as stock and
bond market returns. Through the addition of
leverage and slope terms, lagged returns to
market sectors and hedge fund indices, and
alternative bs, such as currencies or credit
default swaps, the average adjusted R2 of returns-
based style analysis regressions across hedge
fund styles increases by 0.124–0.145. Adding
these additional factors to the regressions not
only increases the explanatory power of the
The role of alternative betas in hedge fund analysis
221& 2012 Macmillan Publishers Ltd. 1753-9641 Journal of Derivatives & Hedge Funds Vol. 18, 3, 201–222

regressions, but also allows hedge fund investors
to more accurately model the true risk exposures
found in their hedge fund portfolios. Once these
true risk exposures are known, it can be easier to
integrate hedge fund allocations into the larger
portfolio, where investors can see the equity risk
of the entire portfolio. Institutional investors,
then, may be better served by aggregating all bs
at the portfolio level. Rather than assuming that
the portfolio is 50 per cent equity, 40 per cent
fixed income and 10 per cent hedge funds,
it is more accurate to state that the portfolio is
54 per cent equity, 43 per cent fixed income
and 3 per cent alternative bs. The logical
conclusion, then, is that equity hedge funds may
someday be included in the equity portion of
investor portfolios, while fixed income hedge
funds may become a part of the fixed income
portfolio.
There are two important implications of
determining the underlying factor risks borne by
their underlying hedge fund. First, investors can
better determine the value added by hedge fund
managers, and may wish to compensate their
managers on a net of all factor exposures than on
the total return of the fund. Second, investors
who understand the factor risks of their hedge
fund portfolio will better equipped to calculate
the factor exposure at the total portfolio level,
including both hedge funds as well as traditional
stock and bond investments.
REFERENCESAmenc, N. and Martellini, L. (2002) Portfolio optimization
and hedge fund style allocation decisions. Journal of
Alternative Investments 5(2): 7–20.
Beckers, S., Curds, R. and Weinberger, S. (2007) Funds of
hedge funds take the wrong risks. Journal of Portfolio
Management 33(3): 108–121.
Black, K. (2004) Managing a Hedge Fund: A Complete Guide
to Trading, Business Strategies, Risk Management and
Regulations. New York: McGraw-Hill.
Coggin, T., Fabozzi, F. and Rahman, S. (1993) The
investment performance of U.S. equity pension fund
managers: An empirical investigation. Journal of Finance
68(3): 1039–1055.
Dopfel, F. (2005) How hedge funds fit. Journal of Portfolio
Management 31(4): 9–20.
Ennis, R. and Sebastian, M. (2003) A critical look at the
case for hedge funds. Journal of Portfolio Management
29(4): 103–112.
Fung, W. and Hsieh, D. (2004) Hedge fund benchmarks:
A risk-based approach. Financial Analysts Journal 60(5):
65–80.
Gehin, W. and Vaissie, M. (2006) The right place for
alternative betas in hedge fund performance: An answer
to the capacity effect fantasy. Journal of Alternative
Investments 9(1): 9–18.
Getmansky, M., Lo, A. and Makarov, I. (2004) An
econometric model of serial correlation and illiquidity in
hedge fund returns. Journal of Financial Economics 74(3):
529–609.
Hamza, O., Kooli, M. and Roberge, M. (2006) Further
evidence on hedge fund return predictability. Journal of
Wealth Management 9(3): 68–79.
Henriksson, R. and Merton, R. (1981) On market timing
and investment performance. II. Statistical procedures
for evaluating forecasting skills. Journal of Business 54(4):
513–533.
Kat, H. (2004) Hedge funds versus common sense: An
illustration of the dangers of mechanical investment
decision making. In: B. Schachter (ed.) Intelligent Hedge
Fund Investing. London: Risk Books, pp. 9–26.
Kazemi, H. and Schneeweis, T. (2004) Hedge Funds: Stale
Prices Revisited. CISDM Working Paper.
Sharma, M. (2004) A.I.R.A.P – Alternative RAPMs on
alternative investments. Journal of Investment Management
2(4): 106–129.
Till, H. (2004) Benefits and costs of illiquidity. In:
B. Schachter (ed.) Intelligent Hedge Fund Investing.
London: Risk Books.
Treynor, J. and Mazuy, K. (1966) Can mutual funds
outguess the market? Harvard Business Review
44(July–August): 132–136.
Black
222 & 2012 Macmillan Publishers Ltd. 1753-9641 Journal of Derivatives & Hedge Funds Vol. 18, 3, 201–222


![[Lehman Brothers] Valuation of Credit Default Swaps](https://static.fdocuments.us/doc/165x107/55cf9895550346d033987d79/lehman-brothers-valuation-of-credit-default-swaps-562533741d6fc.jpg)
![Bloom Berg] Credit Default Swaps](https://static.fdocuments.us/doc/165x107/577d25391a28ab4e1e9e5000/bloom-berg-credit-default-swaps.jpg)


