The Role of China's ETS in Power Sector Decarbonisation
86
The Role of China’s ETS in Power Sector Decarbonisation
Transcript of The Role of China's ETS in Power Sector Decarbonisation

The Role of China’s ETS in Power Sector Decarbonisation

The Role of China’s ETS in Power Sector Decarbonisation Abstract
PAGE | 2
IEA
. All
right
s re
serv
ed.
Abstract
The People’s Republic of China (“China”) officially launched its national emissions trading system (ETS) in 2017, and it will come into operation in 2021. Initially covering the power sector, which accounts for over 40% of China’s energy-related CO2 emissions, the ETS is set to subsequently be expanded to other energy-intensive sectors. China’s national ETS could be an important market-based instrument to help the country meet its recently enhanced climate goals to have CO2 emissions peak before 2030 and achieve carbon neutrality before 2060.
This report explores how China’s ETS can spur emissions reductions from electricity generation and support power sector transformation. It builds on understanding of power sector development and policy trends and relies on in-depth national and provincial scenario modelling of China’s power system from 2020 to 2035. This study also analyses how the ETS’s output- and rate-based design affects overall power sector emissions, technologies and costs, and regional distribution. Finally, it recommends ways China’s ETS can play a stronger role in incentivising cost-effective and structural power sector decarbonisation to support the country’s long-term climate ambitions.

The Role of China’s ETS in Power Sector Decarbonisation Acknowledgements
PAGE | 3
IEA
. All
right
s re
serv
ed.
Acknowledgements, contributors and credits
The Role of China’s ETS in Power Sector Decarbonisation is a joint analysis prepared by the Environment and Climate Change Unit (ECC) in the Energy Environment Division (EED) of the International Energy Agency (IEA) and the Institute of Energy, Environment and Economy (3E) of Tsinghua University.
Cyril Cassisa (IEA), Xiushan Chen (IEA) and Da Zhang (Tsinghua) co-ordinated the project. The main authors of the report are Cyril Cassisa, Xiushan Chen and Insa Handschuch from the IEA, and Da Zhang and Hongyu Zhang from the Tsinghua 3E Institute. Xiliang Zhang, Director of the Tsinghua 3E Institute, provided invaluable guidance to the project and analysis.
Fengquan An, Senior China Advisor; Sara Moarif, Unit Head of ECC; Tom Howes, Division Head of EED; and Mechthild Wörsdörfer, Director for Sustainability, Technology and Outlooks (STO) provided valuable feedback and overall guidance to the project.
Valuable contributions and feedback were also offered by other current and former IEA and Tsinghua colleagues: Luca Lo Re, Laszlo Varro, Brent Wanner, Alan Searl, Rebecca McKimm, Julia Guyon, Francesco Mattion, Chenlu Cheng, Heymi Bahar, Zoe Hungerford, César Alejandro Hernandez, Randi Kristiansen, Peerapat Vithayasrichareon, Niels Berghout, Jihyun Lee, Jean-Baptiste Le Marois, Uwe Remme, Daniel Wetzel, Ermi Miao, Heng Liang and Huilin Luo.
This analysis was carried out with the support of the IEA Clean Energy Transitions Programme. The authors would like to thank the funders of the Clean Energy Transitions Programme, particularly the Agence française de développement (AFD).
The authors are also grateful for valuable comments and feedback from external experts, including: Shengmin Yu (National Center for Climate Change Strategy and International Cooperation, NCSC), Robert Stowe (Harvard University), Rachel Mok (World Bank), Felix Matthes (Oeko Institut), Kristian Wilkening (GIZ), Yan Qin (Refinitiv), Can Wang (Tsinghua University), Jingjie Zhang (China Electricity Council), Yue Dong (EF-China), Alistair Ritchie (ASPI), Hervé Aloncle (AFD), Jérémy Gasc (AFD), Daniel Nachtigall (OECD), David Fischer (PWC), Ernst Kuneman (ICAP), Ying Fan (Beihang University), Yongsheng Feng (CASS), Hao

The Role of China’s ETS in Power Sector Decarbonisation Acknowledgements
PAGE | 4
IEA
. All
right
s re
serv
ed.
Wang (EDF-China), Zhao He (China Electric Power Planning and Engineering Institute), Jiahai Yuan (North China Electric Power University), Jiang Lin (Lawrence Berkeley National Laboratory), Johannes Enzmann (European Commission), Ying Li (China Renewable Energy Engineering Institute), Philip Andrews-Speed (National University of Singapore), Xavier Chen (Beijing Energy Club), Xin Xu (NEA), Dechen Zhu (China Huadian Corporation) and Neil Hirst (Imperial College London).
Kristine Douaud edited the report. The authors would also like to thank the IEA Communications and Digital Office (CDO), particularly Astrid Dumond, Christopher Gully, Clara Vallois and Therese Walsh for providing valuable editorial and publishing support.

The Role of China’s ETS in Power Sector Decarbonisation Table of contents
PAGE | 5
IEA
. All
right
s re
serv
ed.
Table of contents
Executive summary .................................................................................................................... 8 Key findings .............................................................................................................................. 10 Policy recommendations .......................................................................................................... 16
Chapter 1: The ETS in an evolving power sector ................................................................. 21 ETS development in China ...................................................................................................... 21 China’s power sector generates one-quarter of global electricity ............................................ 24 Power market reform ................................................................................................................ 27 Renewables deployment .......................................................................................................... 29 System integration and flexibility sources ................................................................................ 31 CCUS development ................................................................................................................. 33
Chapter 2: China’s ETS supports power sector transformation and the peaking of CO2 emissions .............................................................................................................................. 36
Modelling approach and key assumptions ............................................................................... 36 Scenario design ....................................................................................................................... 38 Overview of power sector development under the No-Carbon-Pricing Scenario .................... 41 The ETS could accelerate national-level power sector decarbonisation ................................. 44 Interregional distributional effects of the ETS .......................................................................... 59
Chapter 3: Allowance auctioning drives deeper power sector decarbonisation .................. 65 References ............................................................................................................................ 72 General annex ....................................................................................................................... 75
Annex A - REPO model and modelling work ........................................................................... 75 Abbreviations and acronyms .................................................................................................... 81 Glossary ................................................................................................................................... 82

The Role of China’s ETS in Power Sector Decarbonisation Table of contents
PAGE | 6
IEA
. All
right
s re
serv
ed.
List of figures Figure 1 CO2 emissions from electricity generation by scenario, 2020-2035 ........................ 10 Figure 2 Factors yielding additional emissions reductions in the ETS Scenario compared with
the No-Carbon-Pricing Scenario, 2025-2035 ........................................................... 11 Figure 3 Factors yielding additional emissions reductions in the ETS Auctioning Scenario
compared with the No-Carbon-Pricing Scenario, 2025-2035 .................................. 15 Figure 1.1 Timeline of ETS development in China .................................................................... 22 Figure 1.2 STEPS global electricity generation outlook by region, 2018-2040 ......................... 24 Figure 1.3 China’s electricity generation and related CO2 emissions, 2018 ............................. 26 Figure 1.4 Annual renewable capacity additions by region, 2010-2019 .................................... 29 Figure 1.5 Key characteristics of the different phases of system integration ............................ 31 Figure 2.1 CO2 emissions intensity by technology in 2015 and benchmark design for 2020 ... 39 Figure 2.2 Electricity generation and related CO2 emissions in the No-Carbon-Pricing
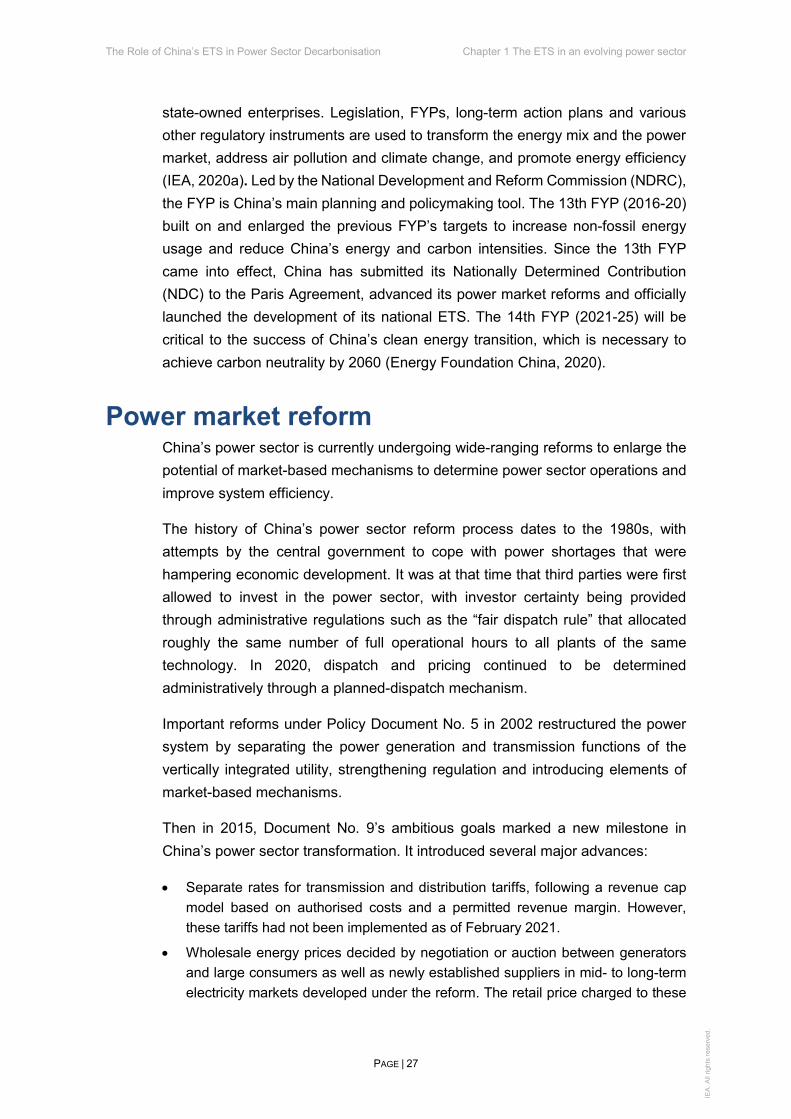
Scenario, 2020-2035 ................................................................................................ 42 Figure 2.3 Capacity changes in coal- and gas-fired power capacity in the
No-Carbon-Pricing Scenario, 2020-2035 ................................................................. 43 Figure 2.4 CO2 emissions from electricity generation and allowance prices in the
No-Carbon-Pricing and ETS scenarios, 2020-2035 ................................................. 44 Figure 2.5 Factors yielding additional emissions reductions in the ETS Scenario
compared with the No-Carbon-Pricing Scenario, 2025-2035 .................................. 46 Figure 2.6 Net allowance balance by coal technology in the ETS Scenario, 2020 and 2025 ... 47 Figure 2.7 Electricity generation by unabated coal-fired power technology in the
No-Carbon-Pricing and ETS scenarios, 2020-2035 ................................................. 48 Figure 2.8 Capacity changes by coal-fired power technology in the No-Carbon-Pricing
and ETS scenarios, 2020-2035 ................................................................................ 49 Figure 2.9 Net allowance balance by coal-fired power technology in the ETS Scenario,
2030 and 2035 ......................................................................................................... 50 Figure 2.10 LCOE of ultra-supercritical and CCS-equipped coal-fired power in provinces
with low coal prices (e.g. Inner Mongolia) in the ETS Scenario, 2020-2035 ........... 51 Figure 2.11 Coal-fired power generation and capacity mixes in the No-Carbon-Pricing
and ETS scenarios, 2025-2035 ................................................................................ 52 Figure 2.12 Generation differences between the ETS and No-Carbon-Pricing scenarios,
2025-2035 ................................................................................................................ 53 Figure 2.13 Average CO2 cost by technology in the ETS Scenario, 2020-2035 ......................... 54 Figure 2.14 Average generation costs by technology in the ETS Scenario, 2035 ...................... 55 Figure 2.15 Unit electricity cost and CO2 emissions from electricity generation in the
No-Carbon-Pricing and ETS scenarios, 2020-2035 ................................................. 56 Figure 2.16 Additional system costs in the ETS Scenario and Intensity Target Case
compared with the No-Carbon-Pricing Scenario, 2025 ............................................ 58 Figure 2.17 Fossil power capacity by grid region in the No-Carbon-Pricing Scenario,
2020 and 2035 ......................................................................................................... 60 Figure 2.18 Coal-fired power capacity by grid region in the No-Carbon-Pricing and ETS
scenarios, 2035 ........................................................................................................ 62 Figure 2.19 CO2 emissions from electricity generation by grid region in the
No-Carbon-Pricing and ETS scenarios, 2020 and 2035 .......................................... 63 Figure 2.20 Net allowance balance by grid region in the ETS Scenario, 2020 and 2035 ........... 64 Figure 3.1 CO2 emissions from electricity generation and allowance price by scenario,
2020-2035 ................................................................................................................ 67 Figure 3.2 Capacity changes by coal-fired power technology in the ETS and ETS
Auctioning scenarios, 2020-2035 ............................................................................. 68

The Role of China’s ETS in Power Sector Decarbonisation Table of contents
PAGE | 7
IEA
. All
right
s re
serv
ed.
Figure 3.3 Electricity generation by technology in the ETS and ETS Auctioning scenarios, 2020-2035 ............................................................................. 69
Figure 3.4 Factors yielding additional emissions reductions in the ETS and ETS Auctioning scenarios compared with the No-Carbon-Pricing Scenario, 2025-2035 .................. 70
Figure 3.5 Revenues and additional system costs from auctioning, 2025-2035 ....................... 70 Figure 3.6 Unit electricity cost by cost component in the ETS Auctioning Scenario
and total unit electricity cost in the ETS Scenario, 2020-2035................................. 71 Figure A.1 REPO model framework ........................................................................................... 76
List of tables Benchmark design assumptions for 2020 ................................................................ 39 Scenario design ........................................................................................................ 40 Design of the Intensity Target Case ......................................................................... 57 Scenario designs for ETS with free allocation and with auctioning.......................... 66
Table A.1 China power sector’s 6 grid regions and REPO model’s 32 provincial areas .......... 76 Table A.2 Cost assumptions by technology ............................................................................. 78 Table A.3 Coal price assumptions by provincial area, 2020 and 2035 .................................... 79 Table A.4 Fuel CO2 factors as per IPCC 2006 ......................................................................... 80 Table A.5 Assumptions of minimum capacity levels for wind and solar PV ............................. 80

The Role of China’s ETS in Power Sector Decarbonisation Executive summary
PAGE | 8
IEA
. All
right
s re
serv
ed.
Executive summary
China recently made major announcements concerning its more ambitious medium- and long-term climate goals. At the United Nations General Assembly in September 2020, President Xi’s declaration of the People’s Republic of China’s (“China”) aims to have CO2 emissions peak before 2030 and achieve carbon neutrality before 2060 set a ground-breaking vision for the country for the next four decades. China also announced in December 2020 that it would enhance its Nationally Determined Contribution (NDC) under the Paris Agreement for 2030, including reducing its CO2 emissions intensity per unit of GDP by more than 65% from the 2005 level, increasing the share of non-fossil fuels in primary energy consumption to around 25% and expanding the total installed capacity of wind and solar power to over 1 200 GW. The 14th Five-Year Plan (FYP) stipulates formulation of an action plan to peak CO2 emissions before 2030 and adoption of stronger policy measures in an effort to reach carbon neutrality before 2060.
In this context, China's emissions trading system (ETS) can be an important market-based tool to help the country achieve its climate goals and energy transition. China’s national ETS was officially launched in 2017 and will come into operation in 2021 in the power sector, before being expanded to cover other energy-intensive sectors. Even in its initial phase, it will be the world’s largest ETS, covering coal- and gas-fired power plants that are responsible for over 40% of China’s CO2 emissions from fossil fuel combustion.
China’s ETS currently employs output- and rate-based allowance allocation, 1 whereas mass-based ETSs, such as the EU-ETS and California’s Cap-and-Trade Program, have a predetermined absolute cap on emissions levels covered. Allowances in China’s ETS are allocated based on a unit’s actual generation during the compliance period (e.g. total MWh of electricity generated in 2019-2020) and predetermined emissions intensity benchmarks for each fuel and technology (e.g. CO2 emissions per MWh set for each type of coal- and gas-fired power plant). Allowances are currently allocated for free, with the introduction of auctions a future possibility (MEE, 2021). At the end of 2020, the Ministry of Ecology and Environment (MEE) released the allowance allocation plan for the power sector, with the first compliance obligations covering 2019 and 2020 emissions (MEE, 2020a).
1 A rate-based ETS is often termed a tradable performance standard.

The Role of China’s ETS in Power Sector Decarbonisation Executive summary
PAGE | 9
IEA
. All
right
s re
serv
ed.
This report explores how China’s ETS can spur emissions reductions from electricity generation and support power sector transformation. It builds on understanding of power sector development and policy trends and relies on in-depth national and provincial scenario modelling of China’s power system from 2020 to 2035.
Analysis is based on a capacity expansion and dispatch model that minimises total power system costs2 under technical, resource and policy constraints. The model assumes economic dispatch for China’s power system from 2025 onwards and expanded interprovincial trade. For wind and solar PV, feed-in tariffs (FITs) for newly installed capacity are assumed to be phased out after 2020, but new policies are assumed to be implemented to support continuous capacity expansion.
The model implements the ETS with an output- and rate-based allocation design, with the number of allowances calculated according to electricity generation and technology-specific benchmarks for four categories of coal- and gas-fired units.3 The allowance price, which is an output of the model, reflects the marginal cost of emissions abatement that minimises total system costs to meet the allocated number of allowances. The allowance price depends strongly on the stringency of the benchmarks.
This study analyses three scenarios to evaluate potential ETS impacts on China’s power sector.
• The No-Carbon-Pricing Scenario is the counterfactual scenario against which the role of the ETS is evaluated.4 The No-Carbon-Pricing Scenario incorporates no specific policies to control CO2 emissions (i.e. neither an ETS nor command-and-control policies such as emissions caps or energy consumption standards), but it assumes economic dispatch from 2025 and policy support for wind and solar PV capacity deployment.
• The ETS Scenario is the main scenario for assessing the role of China’s ETS in the power sector. In addition to the assumptions in the No-Carbon-Pricing Scenario, the ETS Scenario implements a national ETS with free, output-based allowance allocation for electricity generation from 2020 onwards. It also assumes that benchmarks for all coal-fired technologies become more stringent over time.
2 Total system costs include annualised capital costs and operating costs for electricity generation, as well as costs of balancing electricity supply and demand and of transmission. 3 Benchmark trajectory design is explained in Chapter 2. Assumptions for 2020 benchmark values differ from the official benchmarks, as they were defined before China’s ETS 2019-2020 allowance allocation plan for the power sector was published. Analysis in this report is based on scenario modelling, and findings on structural implications of the ETS remain relevant for other initial benchmark values. 4 The No-Carbon-Pricing Scenario serves as the baseline scenario to assess the ETS’s effects and potential. It differs from the World Energy Outlook (WEO) Stated Policies Scenario (STEPS), which reflects the impact of existing policy frameworks and announced policy intentions and includes carbon prices for China’s power, industry and aviation sectors.

The Role of China’s ETS in Power Sector Decarbonisation Executive summary
PAGE | 10
IEA
. All
right
s re
serv
ed.
As in China’s current ETS allowance allocation plan, gas-fired units with an allowance deficit are not required to purchase allowances for compliance.
• The ETS Auctioning Scenario explores the potential effects of gradually introducing emissions allowance auctioning into the ETS. This scenario adopts the same output-based allowance allocation mechanism and benchmark-tightening trajectory as the ETS Scenario. Auctions are assumed to be introduced in 2025, moderately reducing the share of freely allocated allowances in the system first by 10%; then by 30% in 2030; and by 50% in 2035.
Key findings With benchmark-tightening, China’s ETS can cost-effectively make power sector CO2 emissions peak before 2030
With benchmarks that are gradually tightened (i.e. lowered), China’s national ETS can have an important role in reversing the upward trend of CO2 emissions from electricity generation, supporting power sector emissions to peak well before 2030. This would be essential to achieve China’s goal of attaining economy-wide peak CO2 emissions before 2030 and would contribute to the country’s ambition to reach carbon neutrality before 2060.
Figure 1 CO2 emissions from electricity generation by scenario, 2020-2035
IEA. All rights reserved.
Note: Mt CO2 = million tonnes of carbon dioxide.
Under increasingly stringent benchmarks in the ETS Scenario, the allowance price would rise gradually from around CNY 100/t CO2 (USD 15/t CO2) in 2020 to CNY 360/t CO2 (USD 52/t CO2) by 2035. China’s annual CO2 emissions from electricity generation in 2035 would be 12% lower under the ETS than in the No-
0
1 000
2 000
3 000
4 000
5 000
2020 2025 2030 2035
MtC
O2
No-Carbon-Pricing ETS ETS Auctioning

The Role of China’s ETS in Power Sector Decarbonisation Executive summary
PAGE | 11
IEA
. All
right
s re
serv
ed.
Carbon-Pricing Scenario (a drop of around 570 Mt CO2, equivalent to Canada’s total CO2 emissions from fuel combustion in 2018).
The ETS would drive emissions reductions mainly by improving the efficiency of coal-fired power generation, particularly between 2020 and 2030, and by enlarging the deployment of carbon capture, utilisation and storage (CCUS) in the power sector from 2030. With technology-specific benchmarks and free allocation, the impact of the ETS on fuel-switching away from coal is nevertheless limited.
Figure 2 Factors yielding additional emissions reductions in the ETS Scenario compared with the No-Carbon-Pricing Scenario, 2025-2035
IEA. All rights reserved.
In combination with the power sector reform, an ETS with free allowance allocation could achieve these emissions reductions by 2035 while the average electricity cost remains at the 2020 level.5 In addition, the ETS would be more cost-effective than using mandatory energy consumption standards for coal-fired power plants, delivering the same emissions reductions at lower additional system costs.
ETS allocation design encourages efficiency in coal-fired power generation and in the capacity mix
With its installed capacity having increased fourfold since 2000 to reach 1 007 GW in 2018, China’s coal-fired power fleet is today the world’s largest, as well as one of the youngest and most efficient (IEA, 2020a). Nevertheless, less-efficient units such as subcritical units still represent almost half of China’s operational coal-fired
5 The electricity cost reflects the average system cost per unit of electricity generated. Under free allocation, entities receive allowances for free, and total allowance surpluses and deficits among entities balance out at the system level, limiting the increase in system costs.
- 600
- 500
- 400
- 300
- 200
- 100
02025 2030 2035
MtC
O2 Switch from fossil to non-
fossil technologies
Coal-to-gas switch
Switch from unabated coalto coal+CCS
Switch from less- to more-efficient coal technologies
Technology efficiencyimprovements

The Role of China’s ETS in Power Sector Decarbonisation Executive summary
PAGE | 12
IEA
. All
right
s re
serv
ed.
power capacity. Managing its coal-fired fleet will be essential for China to achieve its emissions reduction objectives and clean energy transition.
With its output-based allowance allocation design, the ETS will prompt more efficient unabated coal-fired power generation, 6 as units achieving emissions intensities below the applicable benchmark could sell surplus allowances while those exceeding the benchmark would need to purchase them. The benchmarking approach and the shift to economic dispatch would encourage high-efficiency units to run significantly more than they currently do. In the ETS Scenario, generation from ultra-supercritical units accounts for 66% of the coal-fired power mix in 2025 and 94% of unabated coal-based generation by 2035. Meanwhile, less-efficient and (usually) older units would either serve as back-up capacity with low annual running hours or be retired.
In addition to changing operating patterns, the ETS can accelerate the replacement of less-efficient units by the most high-performing ones. In the ETS Scenario, nearly 150 GW of subcritical, high-pressure and circulating fluidised bed (CFB) units would retire between 2020 and 2030, 43% more than in the No-Carbon-Pricing Scenario. The drive for efficiency under the ETS would increase the capacity factor of more-efficient coal-fired units, but it could also incentivise more construction of new efficient coal-fired power capacity than the No-Carbon-Pricing Scenario by 2030.
The average energy consumption of unabated coal-fired units could fall to 275 grammes of standard coal equivalent per kWh (gce/kWh) by 2035 in the ETS Scenario, which would be an 11% reduction from the 13th FYP target of 310 gce/kWh for coal-fired units in operation in 2020. As a result, the emissions intensity of unabated coal-fired power generation could decrease to 764 g CO2/kWh, 5% below the projected level without ETS implementation.
Current ETS design has the potential to support CCUS technology uptake in the power sector by 2030
The current ETS allowance allocation design has the potential to promote CCUS technology deployment in the power sector from 2030 onwards by allowing units equipped with carbon capture technology to gain revenues by selling surplus allowances. If applying the benchmark for large coal-fired power units to CCUS-
6 Unabated coal power generation refers to coal-fired power generation lacking any technology to substantially reduce its CO2 emissions, such as CCUS.

The Role of China’s ETS in Power Sector Decarbonisation Executive summary
PAGE | 13
IEA
. All
right
s re
serv
ed.
equipped units, the ETS could provide a substantial financial incentive for coal+CCUS technology and make it cost-competitive in certain regions by 2030.
In the ETS Scenario, generation from CCUS-equipped coal-fired units would account for 3% of total coal-fired power generation by 2030 and 8% by 2035. By displacing more than 470 TWh of unabated coal-fired power generation, the deployment of this technology could avoid nearly 300 Mt CO2 of electricity generation emissions in 2035 and reduce the average emissions intensity of coal-fired generation to around 710 g CO2/kWh.
Technical specificities of the ETS, such as allocation design and exemption rules, could drive the introduction of less-carbon-intensive technologies in co-ordination with other support policies.
Multiple benchmarks and free allocation limit incentives to switch to gas and non-fossil sources
While the ETS could provide an incentive for China’s coal-fired power fleet to become more efficient and potentially use CCUS technology, its promotion of gas-fired power and non-fossil alternatives would be limited under the current output-based design with multiple benchmarks and free allocation.
The output-based design grants units allowances in proportion to their production activities, encouraging plants in each technology category to reduce their emissions intensity to below the applicable benchmark so that they gain an allowance surplus rather than a deficit. Under a certain allowance price, the effective carbon cost (e.g. in CNY per kWh of generation produced) applying to a power unit would also depend on its performance relative to the benchmark. While having multiple benchmarks could help address distributional effects among technologies, they actually differentiate the effects of emissions trading for the various technologies even more than using a single benchmark would (Goulder et al., 2020).
As the benchmarks for coal- and gas-fired units are separate and China’s ETS currently does not include non-fossil sources directly, entities covered by the ETS could receive surplus allowances for coal-fired units with relatively low emissions intensities but would not necessarily gain any revenue by switching from coal to gas or nuclear or renewables. Meanwhile, under an output-based design with free allocation, units need to pay for allowances only if they perform below the applicable benchmark and have an allowance deficit, which also limits the effective carbon cost imposed on emitting units and thus reduces the incentive for fuel switching.

The Role of China’s ETS in Power Sector Decarbonisation Executive summary
PAGE | 14
IEA
. All
right
s re
serv
ed.
In the ETS Scenario with free output-based allocation and technology-specific benchmarks, generation from gas and non-fossil sources would be only marginally higher than in the No-Carbon-Pricing Scenario by 2035. As wind- and solar-based generation would not be specifically encouraged, they would remain at roughly the same level in 2035 in both scenarios. Capitalising on the ETS’s untapped potential to encourage fuel switching could further enhance its ability to drive emissions reductions and power sector transformation.
Introducing auctioning in an output-based ETS could lead to even greater power sector decarbonisation
Under an output-based ETS, total emissions are not limited by a fixed cap but depend on production activities and benchmarks applied. With free allowance allocation, the carbon cost imposed by the ETS remains limited, as only entities facing allowance deficits need to purchase allowances for compliance. Conversely, introducing auctions would require most entities to purchase a certain amount of allowances, raising the effective carbon cost faced by emitters and making it less attractive to raise the allowance volume through production choices. Auctioning could thus reduce emissions even further.
In the ETS Auctioning Scenario, with the share of auctioning increasing after 2025 and gradually reaching 50% in 2035, carbon emissions from electricity generation could peak at a lower level than under free allowance allocation, reducing annual electricity generation emissions by an additional 10% (nearly 500 Mt CO2) in 2035. Auctioning could therefore cut electricity system CO2 emissions to below the 2020 level by 2035.
Implementing allowance auctions would strengthen the competitiveness of renewables-, nuclear- and gas-based technologies vis-à-vis coal-fired plants, leading to faster decommissioning of existing coal-fired units and fewer installations of new ones. Moderate auctioning could reduce the share of unabated coal-fired power generation in the mix to below 40% by 2035, compared with nearly 50% in the ETS Scenario. Compared with free allowance allocation, auctioning would double gas-fired generation in 2035 and increase generation from wind (by 10%) and solar (by over 40%). The higher the share of allowance auctioning, the deeper and quicker power sector decarbonisation is likely to be.

The Role of China’s ETS in Power Sector Decarbonisation Executive summary
PAGE | 15
IEA
. All
right
s re
serv
ed.
Figure 3 Factors yielding additional emissions reductions in the ETS Auctioning Scenario compared with the No-Carbon-Pricing Scenario, 2025-2035
IEA. All rights reserved.
Moderately raising the share of allowances auctioned over time would keep total system cost increases in check while creating revenues that could be used towards the clean energy transition and technology development as well as to address electricity affordability and equity. In the ETS Auctioning Scenario, annual revenues generated by allowance auctioning could reach CNY 685 billion (USD 99 billion) in 2035, counterbalancing a substantial portion of the increase in total system costs.
Regional distributional effects could arise under the ETS Equity concerns at the regional level could emerge if allowance surpluses and deficits are distributed unevenly, depending on a region’s generation mix.
In the ETS Scenario, regions with a higher share of ultra-supercritical units could benefit from the ETS in 2020, while those with more subcritical and high-pressure units were likely to face additional costs. With the tightening of benchmarks and greater CCUS deployment, regional distributional effects could change significantly and widen over time. Regions with CCUS-equipped coal-fired units have the potential to gain high allowance surpluses while all unabated coal-fired power technologies would accrue deficits by 2035. Combined with a higher allowance price, the monetised impact could further widen regional disparities. Addressing potential equity issues could be important to strengthen fairness and political acceptance of the ETS.
-1 200
-1 000
- 800
- 600
- 400
- 200
02025 2030 2035
MtC
O2 Switch from fossil to non-
fossil technologies
Coal-to-gas switch
Switch from unabated coalto coal+CCS
Switch from less- to more-efficient coal technologies
Technology efficiencyimprovements

The Role of China’s ETS in Power Sector Decarbonisation Executive summary
PAGE | 16
IEA
. All
right
s re
serv
ed.
Policy recommendations The national ETS becoming operational is an important step in China’s climate policy development and expanded market mechanism use. To help the ETS incentivise more cost-effective and structural power sector decarbonisation, and to further align its short- and medium-term effects with China’s ambitions of reaching peak emissions before 2030 and attaining carbon neutrality before 2060, China could:
1. Tighten its ETS benchmarks and gradually merge them to enhance the effectiveness of the output-based design.
2. Accelerate power market reform to amplify the effects of the ETS.
3. Introduce allowance auctioning to provide stronger signals for fuel switching and to generate revenues.
4. Transition to a mass-based design with a fixed cap to guarantee emissions trajectory certainty and support its emissions-peaking and carbon-neutrality goals.
5. Strengthen policy co-ordination for ETS implementation in the power sector and its expansion to other industrial sectors, e.g. co-ordinate it with renewables deployment, energy efficiency and CCUS support policies.
Tighten and gradually merge benchmarks to enhance the effectiveness of the output-based ETS
Stringent benchmarks will be essential for an output-based ETS to drive power sector decarbonisation, as benchmarks guide the emissions intensity trajectory and determine the total number of allowances for given output levels.
Gradually lowering the benchmark values will be crucial for the ETS to be consistently effective and to support China in meeting its climate goals. As average fleet efficiency improves as older units are retired and a greater share of generation comes from more efficient technologies, the average emissions intensity of thermal power generation will decrease over time. The benchmark trajectory should integrate such improvements and reduce the risk of over-allocation while continuing to provide further incentives to achieve the intended transition objectives. Depending on the stringency of the initial benchmarks and the evolution of the power fleet, the rate of benchmark tightening could be gradually adjusted for a smooth transition, before being accelerated to meet higher policy ambitions.
In parallel, merging benchmarks will reduce the differentiation of carbon price signals for different technologies and guide more cost-effective emissions reductions. Gradually transforming the multi-benchmark design into a single

The Role of China’s ETS in Power Sector Decarbonisation Executive summary
PAGE | 17
IEA
. All
right
s re
serv
ed.
benchmark will optimise emissions abatement options across a larger group of technologies and assets, increasing the economic efficiency of the ETS and its encouragement of fuel switching. This would reduce the risk of providing financial incentives to high-emitting assets whose emissions could be locked in over the long term.
Having a clear benchmark trajectory will provide visibility and certainty for market participants, guide plant management and investment decisions (including for technology innovation) and accelerate power sector decarbonisation.
Co-ordinate power market reform with the ETS to amplify the effects on shared policy goals
Having the similar goal of promoting the use of efficient, low-emissions and least-cost resources, ongoing power market reforms and the ETS should be co-ordinated to be mutually supportive.
Reforms favouring least-cost dispatch will be particularly vital for the ETS to be effective. Power dispatch and pricing in China continue to be determined largely by administrative mechanisms, but wide-ranging reforms aim to enlarge the role of market-based mechanisms and important progress has been made, including in pilot spot markets in several regions. Accelerating the dispatch reform would better enable the ETS and amplify its value, as a merit order dispatch system would take account of the carbon cost imposed by the ETS on less-efficient units and authorise lower-emitting technologies to operate more often. If reform progress is slow, however, and electricity generators are unable to adjust their operations based on ETS price signals, the ETS’s effectiveness in curbing emissions could be considerably constrained.
Meanwhile, the ETS can support power market reforms by integrating carbon costs into dispatch decisions and providing incentives for plants to operate more flexibly depending on their CO2 emissions levels. If externality costs (such as that of carbon) are not taken into consideration and high-emitting sources remain cost-competitive, the power market reform might optimise the cost of electricity production in a manner not necessarily aligned with the transition to a low-carbon electricity mix.

The Role of China’s ETS in Power Sector Decarbonisation Executive summary
PAGE | 18
IEA
. All
right
s re
serv
ed.
Introduce auctioning to incentivise fuel switching, and use revenues to expand climate action and make electricity more affordable
Allowance auctioning in China’s output-based ETS would make it more attractive to switch to non-fossil and gas fuel sources, driving more fuel switching and amplifying the impact of the ETS. As auctioning raises the carbon cost imposed on CO2-emitting technologies, it affects production from high-emitting sources and therefore reduces total associated emissions. By making gas-fired and non-fossil technologies more competitive, allowance auctioning would make the ETS more effective in driving power sector transformation.
Gradually phasing in allowance auctioning according to a clear timeline would accelerate the energy transition while allowing market participants time to adapt to the system and could keep electricity cost increases moderate. Part of the revenues generated by the auctions could be used to address electricity affordability and the distributional effects of the ETS, and they could also be invested in low-carbon technology development to foster more rapid decarbonisation.
Transition to an ETS with a fixed cap to ensure emissions trajectory certainty
As China aims to have its emissions peak before 2030 and to reach carbon neutrality before 2060, limiting its total emissions in addition to reducing emissions intensity will be essential. When it expands the ETS beyond power to other industrial sectors, using the current output-based allowance allocation design would likely be more complicated and challenging than adopting a fixed-cap system.
Transitioning to a mass-based design with an absolute cap would provide significantly more certainty for controlling emissions from sectors covered by the ETS, reduce the risk of encouraging the construction of additional high-carbon assets, and ensure coherence with China’s economy-wide emissions-peaking and carbon neutrality plans. Using a mass-based design would also allow the ETS to send uniform carbon price signals and promote the most cost-effective choices for emissions reductions (Goulder et al., 2020), including by providing further incentives for switching to low-carbon energy sources. The initial phase of ETS implementation will improve emissions monitoring and supply valuable information for setting an absolute ETS cap and mapping out its trajectory.

The Role of China’s ETS in Power Sector Decarbonisation Executive summary
PAGE | 19
IEA
. All
right
s re
serv
ed.
Strengthen policy co-ordination when implementing and expanding the ETS
To achieve the low-carbon energy transformation required for carbon neutrality before 2060, China will need to implement numerous ambitious policies aimed at a variety of objectives.
Figuring within a complex policy landscape, the ETS interacts with various economy-wide and sector-specific mechanisms. Strengthening co-ordination between the ETS and other policy instruments, such as those affecting renewables deployment, energy efficiency and technology innovation (e.g. CCUS), could increase the effectiveness of many policies and achieve a more cost-effective and impactful outcome, whereas a lack of co-ordination might lead to duplicated or counterproductive policy efforts (IEA, 2020a).
Co-ordinating the ETS with other market-based policies, such as the Chinese Certified Emissions Reduction (CCER) offsetting scheme, renewable portfolio standards or green power trading certificates, could enhance mitigation and accelerate the low-carbon energy transition while reducing the overall costs of the transition.
The ETS, through its allocation design and by using market forces, could provide influential price signals to accelerate the deployment of innovative and low-carbon technologies. This analysis demonstrates the potential of an ETS to spur CCUS deployment, but it could also encourage the use of other new low-carbon technologies such as emerging renewables and utility-scale storage with adapted design.
However, ETS price signals would be effective only if accompanied by policies to reduce investment risks for these nascent technologies. In the case of CCUS, an ETS with output-based allocation could provide an important financial incentive, but near-term companion policies would be needed to: create favourable investment conditions by offering direct support for early CCUS projects; co-ordinate the development of CCUS hubs and incentivise the construction of CO2 storage in key regions; and support research and development (R&D) and demonstration projects to further improve CCUS performance and reduce costs.
In addition to supporting power sector decarbonisation, an ETS can serve as an umbrella policy to enable cost-effective emissions reductions in emission-intensive sectors. After a short period of initial application to the power sector, national ETS coverage should be rapidly expanded to key industrial sectors. The ETS could thus provide pricing incentives for energy efficiency measures and

The Role of China’s ETS in Power Sector Decarbonisation Executive summary
PAGE | 20
IEA
. All
right
s re
serv
ed.
encourage demand-side switching to low-carbon sources. Exploring synergies with energy efficiency mechanisms such as energy efficiency obligation schemes could raise the effectiveness of both policies.
With expanded emissions coverage and better co-ordination with other energy and climate policies, the ETS could become a primary policy instrument to deliver cost-effective emissions reductions, accelerate emissions-peaking and foster energy sector decarbonisation to realise China’s long-term goal of carbon neutrality.

The Role of China’s ETS in Power Sector Decarbonisation Chapter 1 The ETS in an evolving power sector
PAGE | 21
IEA
. All
right
s re
serv
ed.
Chapter 1 The ETS in an evolving power sector
The People’s Republic of China’s (“China”) national emissions trading system (ETS) was officially launched in 2017 and will come into operation in 2021. In its initial phase, it will cover coal- and gas-fired power plants, including those for co-generation,7 to improve thermal power plant efficiency and help China peak and thereafter reduce its power sector CO2 emissions.
The effectiveness of China’s ETS will depend on how well it is tailored to and co-ordinated with power market regulations and with energy and technology policies targeting the power sector. This chapter provides a brief overview of China’s ETS development, introduces trends in electricity sector development and describes major areas of policy co-ordination for the power sector.
ETS development in China Since taking office in 2013, President Xi Jinping has called for energy sector reform and pledged sustainable economic development, creating political momentum around China’s climate commitment. Concrete steps have included submission of China’s first Nationally Determined Contribution (NDC), development of a vision of “ecological civilisation” for a collective global future in response to environmental degradation, and climate considerations and emissions reduction goals in its Five-Year Plans (FYPs) and longer-term strategies (IEA, 2020a). In September 2020, President Xi announced at the United Nations General Assembly that “China aims to have CO2 emissions peak before 2030 and achieve carbon neutrality before 2060”. This implies that emissions will peak earlier than previously committed to in China’s first NDC and lays out a clear and ambitious CO2 emissions reductions trajectory for the next four decades for China to reach carbon neutrality.
To reduce emissions – complementary to command-and-control regulations such as energy efficiency standards – China has used market-based instruments since the 11th FYP (2006-10) to provide enhanced cost-effective mitigation options. Building on the experience it gained by participating in the Clean Development
7 Co-generation refers to the combined production of heat and power.

The Role of China’s ETS in Power Sector Decarbonisation Chapter 1 The ETS in an evolving power sector
PAGE | 22
IEA
. All
right
s re
serv
ed.
Mechanism (CDM) under the United Nations Framework Convention on Climate Change (UNFCCC), China launched its first regional pilot ETS in 2013 during the 12th FYP. There are currently eight regional pilot ETSs in force in China. With the 13th FYP promoting the establishment of China’s national ETS, in 2017 the country launched the initial phase with the aim of having it operational around the end of 2020 (Figure 1.1).
Since 2017, implementation of the national ETS has consisted of three phases. The first focused on constructing market infrastructure, while the second involved data collection, training sessions and power sector allowance allocation simulations. The third phase, begun in early 2021, focuses on deepening and expanding the launch of the operational ETS.
Starting with allowance trading for compliance purposes in the power sector, China has reaffirmed its intention to expand the ETS to other energy-intensive sectors during the 14th FYP period. As China’s ETS becomes operational in the power sector, it will be the largest in the world in terms of emissions covered – more than twice the size of the EU-ETS, which has so far been the largest.
Figure 1.1 Timeline of ETS development in China
IEA. All rights reserved.
In September 2019, the Ministry of Ecology and Environment (MEE) released benchmark settings for training purposes for the power sector (including for captive power plants and co-generation) (MEE, 2019). Benchmark categories were defined giving consideration to fuel, technology and unit size. Two options were proposed, differing only by the number of benchmarks for conventional coal-fired power plants. At the end of 2020, the MEE published a draft allocation plan

The Role of China’s ETS in Power Sector Decarbonisation Chapter 1 The ETS in an evolving power sector
PAGE | 23
IEA
. All
right
s re
serv
ed.
for public consultation (MEE, 2020b) and subsequently released the final allowance allocation plan for the power sector, with compliance obligations covering 2019 and 2020 emissions (MEE, 2020a). The plan specifies 2 225 entities to be covered by the first compliance cycle (MEE, 2020c). In January 2021 the MEE also published the adopted Interim Rules for Carbon Emissions Trading Management, which came into effect in February 2021 (MEE, 2021).
Monitoring emissions will be an essential component of the ETS. For those coal-fired power plants that do not measure their emissions (or coal carbon content), a high default emissions factor will be applied to encourage them to enhance their monitoring capacity and thus improve data quality (IEA, 2020a).
China’s ETS currently uses an output- and rate-based approach for allowance allocation, in contrast with the cap-and-trade model used in the European Union and North America. No predetermined absolute cap on the total number of emissions allowances is imposed for the initial stage of China’s ETS; instead, allowances are determined according to actual electricity and heat output over the compliance period and predetermined CO2 emissions intensity benchmarks. Output-based allocation helps control overall emissions intensity while providing flexibility in the context of China’s continuous energy demand growth and industrial capacity expansion at the same time as it addresses distributional concerns for certain technologies.
Coal- and gas-fired plants will receive emissions allowances based on their electricity and heat generation, multiplied by the CO2 emissions intensity benchmarks specific to the plant’s fuel, technology and size. ETS compliance will require that a plant return the number of allowances corresponding to its verified emissions, which are calculated based on its fuel consumption and fuel emissions factor. If a plant’s emissions intensity is higher than its applicable benchmark (typically when the plant is less efficient than the benchmark implies), it will face an allowance deficit and will have to buy allowances to be compliant. Conversely, if its emissions intensity falls below the benchmark, the plant will surrender the number of allowances corresponding to its verified emissions and can sell or potentially bank the surplus.
The 2019-2020 allowance allocation plan defines four benchmark categories for coal- and gas-fired power plants (MEE, 2020a). Allowance allocation also takes load factors into account for all-electricity coal-fired plants, which will allow units running at less than 85% to receive more allowances than defined by the applicable benchmarks. A covered entity with an allowance deficit will be required to not only surrender all the free allowances allocated to it based on its benchmark

The Role of China’s ETS in Power Sector Decarbonisation Chapter 1 The ETS in an evolving power sector
PAGE | 24
IEA
. All
right
s re
serv
ed.
and generation output, but will also have to purchase allowances to make up the deficit, capped at up to 20% of its verified emissions, to meet its compliance obligation.
Gas-fired power plants are currently exempted from the obligation to purchase allowances when they experience an allowance deficit. This exemption aims to limit the constraints the ETS puts on gas-fired power and to encourage coal-to-gas switching (MEE, 2020a). Entities are allowed to use Chinese Certified Emissions Reduction (CCER) offset credits to meet compliance obligations for up to 5% of verified emissions (MEE, 2021). Allowances are currently allocated to power plant operators for free, but it would be possible to introduce allowance auctions in the future (MEE, 2021).
China’s power sector generates one-quarter of global electricity
Global electricity generation, largely dominated by coal (38%) and natural gas (23%) in 2018, is expected to increase 45-60% by 2040 in all IEA scenarios (IEA, 2019a). China accounted for around 27% of global electricity generation at almost 7 170 TWh in 2018, with its electricity production rising nearly 7% annually between 2010 and 2018. Although the Covid-19 crisis temporarily curbed China’s electricity demand growth in 2020, it is still set to increase at a more rapid pace than global demand – 60-75% by 2040 – with the share of coal-based power in the mix falling steadily and renewables increasing.
Figure 1.2 STEPS global electricity generation outlook by region, 2018-2040
IEA. All rights reserved.
Notes: STEPS = Stated Policies Scenario. Based on WEO 2019 data.
0
5 000
10 000
15 000
20 000
25 000
30 000
35 000
40 000
45 000
2018 2025 2030 2035 2040
TWh
Rest ofworld
Europe
NorthAmerica
India
China

The Role of China’s ETS in Power Sector Decarbonisation Chapter 1 The ETS in an evolving power sector
PAGE | 25
IEA
. All
right
s re
serv
ed.
China’s electricity generation alone will make up almost one-third of global growth by 2040 in both the Stated Policies Scenario (STEPS) and the Sustainable Development Scenario (SDS) of the World Energy Outlook (WEO) (IEA, 2019a). A large amount of new installed capacity will therefore be required to satisfy demand (Figure 1.2).
Electricity generation in China relies strongly on coal, which fuelled more than 66% of electricity produced in 2018, followed by hydropower (17%), wind (4%) and nuclear (4%). Natural gas contributed 3% while solar accounted for 2.5% (IEA, 2020b).
China’s coal-fired power capacity more than quadrupled from 222 GW in 2000 to 1 007 GW in 2018, and an additional 200 GW is currently under construction or planned even though the average full-load hours of the coal-fired fleet has been on a declining trajectory since 2004, falling to less than 5 000 hours in 2018. Although the share of more efficient supercritical and ultra-supercritical plants has increased significantly since 2005, subcritical and less-efficient high-pressure and circulating fluidised bed (CFB) plants still represent almost half of China’s operational coal-fired power fleet. Today China has the largest – and one of the youngest and most efficient – coal-fired fleets globally (IEA, 2020a).
China is also the world leader in renewable capacity installations for hydro, wind and solar. For new installed capacity, renewables outpaced coal-fired power by three times in 2018, and the increase in generation from renewables has been higher than from coal-fired units since 2018. Nevertheless, the total increase in coal-based power generation from 2010 to 2018 (1 500 TWh) was 50% higher than the increase from renewables (1 000 TWh) including hydro, wind and solar. China’s clean energy transition will depend heavily on how well it manages its current coal-fired power fleet.
The dominance of coal led to emissions of almost 4.4 Gt CO2 from electricity generation in China in 2018 (Figure 1.3), corresponding to 13% of global CO2 emissions and 46% of China’s emissions from fossil fuel combustion (IEA, 2020a). Of China’s emissions from electricity generation only, 98% (around 4.3 Gt CO2) came from coal-fired power plants. The less-emitting gas-fired fleet is almost 20 times smaller than the coal-fired fleet, mainly because domestic gas supplies are limited while coal resources are abundant and inexpensive. Gas-fired power plants produced 3.1% of China’s electricity in 2018, accounting for 80 Mt CO2 of its power sector emissions (IEA, 2020c).

The Role of China’s ETS in Power Sector Decarbonisation Chapter 1 The ETS in an evolving power sector
PAGE | 26
IEA
. All
right
s re
serv
ed.
Figure 1.3 China’s electricity generation and related CO2 emissions, 2018
IEA. All rights reserved.
China’s average CO2 emissions intensity (emissions per unit of electricity generated) of gas-based power plants is about half that of coal-fired plants. However, due to a lack of domestic gas resources and production, limited gas infrastructure and the higher price of gas, large-scale coal-to-gas switching in the power sector would require strong incentives. Although the share of gas-based generation in China's power mix could rise to 10% by 2040 (according to the WEO’s STEPS), it is likely to help displace coal in a more indirect way by aiding variable renewable energy integration (IEA, 2019b).
During the Covid-19 crisis, electricity generation from coal dropped temporarily for the first time during the first quarter of 2020 while renewable energy generation expanded. Nonetheless, thermal power generation rebounded as economic activities and electricity demand resumed (IEA, 2020f; 2020d). While renewable energy will represent a large majority of new capacity additions by 2040, new coal-fired power plants may still be constructed and the coal-fired fleet will remain significant. To reduce CO2 emissions, China’s power sector transformation could involve not only switching from coal to low-carbon power technologies but managing the remaining coal-fired units better and retrofitting and retiring less-efficient plants. Policies are needed to reform the power sector, increase operational flexibility and strengthen support for low-carbon energy technology innovation and deployment in areas such as emerging renewables, carbon capture, utilisation and storage (CCUS), advanced nuclear, transmission infrastructure and storage (IEA, 2020f).
Developing and implementing China’s energy and climate policies involves multiple national-level ministries and commissions, provincial governments and
0 2 000 4 000 6 000
Other
Oil
Bioenergy
Solar
Gas
Nuclear
Wind
Hydro
Coal
TWh
Electricity generation
0
1 000
2 000
3 000
4 000
5 000
Oil Gas Coal
MtC
O2
CO2 emissions
The Role of China’s ETS in Power Sector Decarbonisation Chapter 1 The ETS in an evolving power sector
PAGE | 27
IEA
. All
right
s re
serv
ed.
state-owned enterprises. Legislation, FYPs, long-term action plans and various other regulatory instruments are used to transform the energy mix and the power market, address air pollution and climate change, and promote energy efficiency (IEA, 2020a). Led by the National Development and Reform Commission (NDRC), the FYP is China’s main planning and policymaking tool. The 13th FYP (2016-20) built on and enlarged the previous FYP’s targets to increase non-fossil energy usage and reduce China’s energy and carbon intensities. Since the 13th FYP came into effect, China has submitted its Nationally Determined Contribution (NDC) to the Paris Agreement, advanced its power market reforms and officially launched the development of its national ETS. The 14th FYP (2021-25) will be critical to the success of China’s clean energy transition, which is necessary to achieve carbon neutrality by 2060 (Energy Foundation China, 2020).
Power market reform China’s power sector is currently undergoing wide-ranging reforms to enlarge the potential of market-based mechanisms to determine power sector operations and improve system efficiency.
The history of China’s power sector reform process dates to the 1980s, with attempts by the central government to cope with power shortages that were hampering economic development. It was at that time that third parties were first allowed to invest in the power sector, with investor certainty being provided through administrative regulations such as the “fair dispatch rule” that allocated roughly the same number of full operational hours to all plants of the same technology. In 2020, dispatch and pricing continued to be determined administratively through a planned-dispatch mechanism.
Important reforms under Policy Document No. 5 in 2002 restructured the power system by separating the power generation and transmission functions of the vertically integrated utility, strengthening regulation and introducing elements of market-based mechanisms.
Then in 2015, Document No. 9’s ambitious goals marked a new milestone in China’s power sector transformation. It introduced several major advances:
• Separate rates for transmission and distribution tariffs, following a revenue cap model based on authorised costs and a permitted revenue margin. However, these tariffs had not been implemented as of February 2021.
• Wholesale energy prices decided by negotiation or auction between generators and large consumers as well as newly established suppliers in mid- to long-term electricity markets developed under the reform. The retail price charged to these

The Role of China’s ETS in Power Sector Decarbonisation Chapter 1 The ETS in an evolving power sector
PAGE | 28
IEA
. All
right
s re
serv
ed.
large customers is the sum of the wholesale price plus transmission and distribution tariffs, taxes and government surcharges.
• Authorisation for retail companies to aggregate smaller customers and represent them in the wholesale market.
Although Document No. 9 implementation is an ongoing process, significant progress has been made, notably through an increase in the share of energy traded through energy trading institutions. For example, 2 300 TWh of electricity were traded in 2019, accounting for nearly 32% of total electricity consumption and representing a 6% year-on-year increase. However, although more than 4 000 retail companies have registered with trading institutions, it is important to note that trading through energy trading institutions is insufficient to enable market efficiency. When trading through energy trading institutions, participants should have the incentive to bid at their marginal cost and all resources should be able to participate equally, meaning no resources should be left out of the market or have guaranteed generation.
At the same time, the geographical coverage of the power ancillary services market has also broadened, with 19 regions having power ancillary services markets by the end of 2019, making 65 GW of peak-regulation flexibility available (Guo et al., 2020).
Spot markets, which enable the energy exchanges on a day-ahead, real-time basis, help minimise short-term system costs through effective resource allocation and dispatch. As spot markets are a key component of China’s power system reform, their construction has advanced considerably since promulgation of Document No. 9. Eight regional pilot spot markets have been established since August 2017 and development accelerated further after the NDRC and the National Energy Administration (NEA) issued the Opinions on Deepening the Pilot Work of Power Spot Market Construction in August 2019 (NDRC and NEA, 2019). Since that time, the eight pilots have carried out successful trial operations, implemented settlement tests and prepared for subsequent continuous settlements. Co-ordination among the regional pilot spot markets will be critical to inform and support the elaboration of future national spot market rules.
China’s power market reform has the potential to significantly raise system efficiency, reduce system costs and foster power sector decarbonisation. The IEA’s China Power System Transformation report of 2019 compares two scenarios: one fixes the planned-dispatch approach at 2017 levels, while the other uses economic dispatch with a moderate carbon price and maintains a modest generation allocation for gas-fired power in 2035 (IEA, 2019c). The analysis finds that a transition from planned to economic dispatch will result in significantly lower

The Role of China’s ETS in Power Sector Decarbonisation Chapter 1 The ETS in an evolving power sector
PAGE | 29
IEA
. All
right
s re
serv
ed.
power system operational costs, better wind and solar power integration, and a considerable drop in power sector emissions.
Because it also aims to expand the use of efficient, low-emissions and least-cost resources, China’s national power market reform could reinforce the effectiveness of the ETS. Notably, the ETS’s price on carbon would be reflected in the merit order arrangement, and it would have a stronger impact on power plant generation in a least-cost dispatch system.
However, despite recent progress in China’s power market reform, its dispatch mechanism still differs from the least-cost approach used in most mature power markets. The timing of its market reform rollout may complicate the application of allocation methodologies and benchmark-setting (IEA, 2020a). Effective policy co-ordination, design flexibility and timely adjustments are thus vital to improve system efficiency and facilitate China’s clean energy transition.
Renewables deployment Thanks to continuous policy support and declining costs, the world’s yearly renewable capacity additions more than doubled in the past decade, reaching almost 200 GW in 2019. China has been the global engine of renewable capacity growth, responsible for 40% of the world’s new installations during 2010-2019 (Figure 1.4). With its great resource potential, China now has the highest total installed hydropower, onshore wind, solar PV and bioenergy capacity globally.
Figure 1.4 Annual renewable capacity additions by region, 2010-2019
IEA. All rights reserved.
Source: IEA (2020), Renewable Energy Market Update.
0
50
100
150
200
2010 2011 2012 2013 2014 2015 2016 2017 2018 2019
GW Rest of world
Brazil
Japan
Europe
United States
India
China

The Role of China’s ETS in Power Sector Decarbonisation Chapter 1 The ETS in an evolving power sector
PAGE | 30
IEA
. All
right
s re
serv
ed.
China’s success in renewable energy expansion was driven by a long-term vision and continuous policy support. Since 2006, the Renewable Energy Law covering the full spectrum of renewable technologies has been the legal and policy foundation for the large-scale development of renewables. The law covers such fundamental elements as capacity targets, planning, incentives, pricing mechanisms and cost sharing, and it has guided the formulation and promulgation of a series of FYPs on renewable development.
The 13th FYP on Renewable Energy Development for 2015-2020 introduced ambitious development targets and policy mechanisms for renewables. For the power sector, it targeted installed renewable capacity of 675 GW by 2020: 340 GW of conventional hydropower, 210 GW of wind power, 110 GW of solar and 15 GW of biomass. Renewable generation is set to account for 27% of total generation.
A feed-in tariff (FIT) set by the government to cover all non-hydro technologies has been the main stimulus to achieve targets. As a result of its relatively high FITs, China had already achieved its non-hydro renewable capacity targets in 2019 and attained around 280 GW of wind and 250 GW of solar PV installed capacity in 2020 (NEA, 2020; 2021).
However, rapid renewable capacity development since 2015 has also introduced two key challenges. First, the FIT schemes created a national subsidy deficit that grew quickly because installed capacity greatly exceeded initial expectations, resulting in payment delays to renewable energy developers. Second, wind, solar PV and hydropower generation had to be curtailed substantially, especially over 2015-2017.
To meet these challenges and create a sustainable renewable energy industry, China’s national energy authorities are accelerating the policy transition from FITs to competitive auctions for wind and solar PV to reduce subsidies and achieve grid parity for renewables. Rapid transmission line construction and renewable portfolio mechanisms have also reduced curtailment rates and facilitated interprovincial renewable electricity trading.
Government action will remain fundamental to renewable energy deployment during this policy transition. The effectiveness of the renewable portfolio standards officially introduced in 2020 to enable continuous renewable energy expansion needs to be tested and co-ordinated with other policies such as the ETS, green certificates and provincial electricity spot markets.

The Role of China’s ETS in Power Sector Decarbonisation Chapter 1 The ETS in an evolving power sector
PAGE | 31
IEA
. All
right
s re
serv
ed.
Following announcement of its ambition to reach carbon neutrality before 2060, China pledged to enhance its NDC commitments such that by 2030, 25% of its total primary energy consumption will be non-fossil energy (including renewables and nuclear) and its installed wind and solar power capacity will rise to more than 1 200 GW (MoFA, 2020).
System integration and flexibility sources Integrating variable renewable energy (VRE) such as wind and solar PV into the power system requires a progressive approach to ensure power system flexibility (Figure 1.5). The IEA has identified six phases that describe the changing impacts of VRE on the power system and resulting integration issues. At the lowest level the VRE share is marginal, while at the higher stages VRE dominates the power mix and long-term system flexibility is essential (IEA, 2020g).
Figure 1.5 Key characteristics of the different phases of system integration
IEA. All rights reserved.
Source: IEA (2020), Introduction to System Integration of Renewables.
In 2019, VRE generation in China accounted for 8.7% of total power production. Together with other integration indicators, this places China in Phase 2 nationally, although some provinces have considerably higher shares (e.g. Qinghai [25.5%] and Gansu [20.9%]), putting these regions in Phase 3. If VRE deployment remains rapid for several more years, China can expect to move to a higher level, which may require better and more flexible grid management, enhanced interprovincial electricity trading and the deployment of emerging power system technologies and flexibility measures.

The Role of China’s ETS in Power Sector Decarbonisation Chapter 1 The ETS in an evolving power sector
PAGE | 32
IEA
. All
right
s re
serv
ed.
Comprehensive power system transformation to achieve high VRE proportions requires that action be taken in: 1) system operations and market rules, to increase the efficiency of plant operations and integrate environmental and climate costs such as the carbon cost; 2) flexible resource planning and investment; and 3) system-friendly VRE deployment. Effective measures would not only promote VRE integration, but boost power system operational efficiency, reduce environmental impacts, promote investment and competition, and increase reliability and resilience.
Coal-fired power plants, as the dominant component in China’s power mix, have enormous potential to provide system flexibility once their operational flexibility has been unlocked. In fact, in its 13th FYP for 2016-2020 China already identified and adopted flexibility-boosting retrofits of thermal power plants as an effective means to enhance overall system flexibility. The 13th FYP on Electric Power Development therefore seeks to retrofit 133 GW of co-generation capacity and 86 GW of pure condensing coal-fired power plants to enhance their operational flexibility by 2020. This represents roughly one-fifth of China’s installed coal-fired power capacity.
However, overall retrofitting progress has been relatively slow, with only 57 GW of coal-fired capacity retrofitted by the end of 2019. This can be ascribed largely to insufficient economic incentives and a lack of means to manage costs. As coal-fired power is expected to hold a major share of China’s power portfolio for a relatively long time and its role in providing both electricity and flexibility remains critical, dedicated policy improvements and market design are required.
Broader regional co-ordination, greater transmission interconnectivity and increased power trading are important flexibility resource options that could yield substantial economic benefits for China’s power system. The 2019 IEA report China Power System Transformation with an outlook to 2035 found that the fully optimised use of interregional transmission lines would cut operational costs substantially and significantly reduce VRE curtailment (IEA, 2019c). In addition, advanced flexibility options such as demand-side energy efficiency and the targeted use of electricity storage are crucial to accelerate China’s power system transformation.
Some of the necessary advanced-flexibility technologies, such as for grids, storage infrastructure and digitalisation, will require further innovation to improve performance and reduce costs before they can be widely deployed. The IEA ETP Clean Energy Technology Guide outlines the pressing technology advances needed to meet net-zero targets, as well as ongoing research, development and

The Role of China’s ETS in Power Sector Decarbonisation Chapter 1 The ETS in an evolving power sector
PAGE | 33
IEA
. All
right
s re
serv
ed.
demonstration (RD&D) activities globally that could support Chinese decision makers’ efforts to guide domestic innovation (IEA, 2020h). To ensure that emerging energy technologies are fully adapted to China’s specific needs, all key components of China’s innovation system (e.g. RD&D investments, market incentives and smooth knowledge-sharing among innovators) could be strengthened in the 14th FYP.
Boosting power system flexibility from the existing power fleet (coal-fired, gas-fired and hydro), creating further transmission interconnections and making storage and demand-response options readily available are therefore important priorities to enable rapid power system transformation in China.
CCUS development Equipping coal- and gas-fired power plants with CCUS technology could cut their CO2 emissions by well over 90%. CCUS could thus be an important element of power sector decarbonisation, supplementing and supporting renewable energy expansion.
• Retrofits: Fitting existing coal-fired power plants with CCUS permits them to continue operating, avoiding the costly early retirement of valuable assets and allowing the continued use of domestic coal resources. As nearly half of the global coal-fired power capacity of 2 100 GW in operation today is in China, where coal-fired plants are less than 13 years old on average, the risk of emissions being locked in for decades is high (IEA, 2020i).
• Integration of renewables: While coal- and gas-fired power plants already provide flexibility and stability to the electricity system, equipping them with CCUS would allow them to continue doing so at a substantially lower emissions intensity. Being able to generate electricity on a continuous basis is a particularly valuable service for electricity systems with strong seasonal variations in renewable energy output.
Although CCUS equipment raises electricity generation costs for plants individually, it could be integrated into an optimised low-carbon portfolio that minimises electricity costs for the system overall. Furthermore, equipping plants with CCUS could facilitate more gradual job transitioning in the coal industry.
In the IEA Sustainable Development Scenario, CCUS is credited with around 15% of the world’s cumulative power sector emissions reductions to 2070. However, attaining this level would require the amount of CO2 captured from coal- and gas-fired power plants worldwide to increase continuously over the coming decades. Coal-fired plants equipped with carbon capture are the main application of CCS to

The Role of China’s ETS in Power Sector Decarbonisation Chapter 1 The ETS in an evolving power sector
PAGE | 34
IEA
. All
right
s re
serv
ed.
2040, mainly in China. They capture around 1 250 Mt CO2 in 2040 and provide over 2% (900 TWh) of the global electricity supply (IEA, 2020i).
CCUS retrofits are particularly relevant for China. According to a 2016 IEA assessment, 310 GW of the 560 GW of coal-fired power plants then operated by members of the China Electricity Council (CEC) met the basic CCUS retrofit suitability criteria pertaining to CO2 storage access, plant age, size, load factor and location. With costs adjusted to representative Chinese levels, the 100 GW of coal-fired power plants with the lowest retrofit costs have a maximum additional levelised cost of electricity (LCOE) of CNY 168/MWh (around USD 24/MWh) (IEA, 2016).
More innovation and deployment are needed to improve performance and decrease the costs of CCUS technologies so that they meet China’s power sector decarbonisation needs (IEA, 2020f). There is evidence that the cost of CCUS for large-scale coal-fired power plants has already fallen owing to the learning-by-doing effect: for instance, the capture cost at the Petra Nova CCUS plant is 35% lower than at the Boundary Dam CCUS project (GCCSI, 2019; IEAGHG, 2018). Further LCOE reductions of up to 30% are expected with CCUS, with the adoption of various emerging capture technologies (IEA, 2020i). Market-based instruments such as China’s national ETS could provide additional incentives for low-carbon energy RD&D, including for CCUS technologies.
The economic viability of CCUS depends on storage availability, project-specific costs, and competitiveness with other low-carbon solutions. Renewable electricity generation is likely to have a cost advantage over CCUS-retrofitted power plants on a per-kWh basis in regions with abundant wind and solar resources. In fact, onshore wind is already more cost-effective than coal + CCUS generation in most of China’s provinces (Fan et al., 2019) and renewable energy consumption is expected to be facilitated by planned high-voltage transmission lines. CCUS in the power sector will most likely be successful only if its value for the entire power system is recognised.
While no large-scale CCUS power generation projects8 are currently operational in China, several are being planned and some demonstration projects have been operated successfully in the past decade. Opportunities for the near-term development of CCUS hubs for power plants and industries include regions with good CO2 enhanced oil recovery opportunities or a high concentration of coal-fired power plants with energy-intensive industrial facilities in close proximity to CO2
8 In this analysis, “large-scale” implies the capture of at least 0.8 Mt CO2/year for a coal-based power plant and 0.4 Mt CO2/year for a natural gas-based plant.

The Role of China’s ETS in Power Sector Decarbonisation Chapter 1 The ETS in an evolving power sector
PAGE | 35
IEA
. All
right
s re
serv
ed.
storage resources, notably in China’s northern provinces (Xinjiang, Inner Mongolia, Heilongjiang, Jilin, Shanxi and Shaanxi) (IEA, 2020i).
Policy support is also vital to develop and deploy CCUS technologies. China has included CCUS in its future national carbon mitigation strategies since the 12th FYP (2011-2015), the National Climate Change Plan (2014-2020) identifies CCUS as a key breakthrough technology, and multiple guidance documents have included support for CCUS. Furthermore, the updated May 2019 “Roadmap for Development of Carbon Capture, Utilisation and Storage Technology in China” provides a strategic vision and sets incremental goals to 2050 for CCUS development in China (ACCA21/MOST, 2019). The roadmap stipulates CCUS readiness for industrial applications by 2030 and aims to reduce CO2 capture costs and energy consumption 10-15% by 2030 and 40-50% by 2040. However, challenges include the lack of a legal and policy framework, limited market stimulus and inadequate subsidies (Jiang et al., 2020).

The Role of China’s ETS in Power Sector Decarbonisation Chapter 2 China’s ETS supports power sector transformation and the peaking of CO2 emissions
PAGE | 36
IEA
. All
right
s re
serv
ed.
Chapter 2 China’s ETS supports power sector transformation and the peaking of CO2 emissions
By assessing the effects of an emissions trading system (ETS) on China’s national and regional power generation mixes and CO2 emissions under free allocation, this chapter explores how China’s national ETS can support the country’s power sector transformation. The analysis, based on in-depth power sector modelling for 2020 to 2035, offers insights to design a benchmark trajectory that would promote the peaking of power generation CO2 emissions before 2030 and make the ETS an important driver of power system transition.
This study assumes full implementation of the national ETS in the power sector during the 14th Five-Year Plan (FYP) period and significant power market reform by 2025, including a transition towards least-cost dispatch that also integrates the cost of carbon, and interprovincial transmission line expansion. Despite declining during the Covid-19 crisis in the first quarter of 2020, electricity demand is expected to resume sustained growth to 2035. Policy support for gas and low-carbon energy technologies (e.g. nuclear, renewables, CCUS and grid equipment) is assumed to continue as China tries to achieve its clean energy transition and meet its emissions-peaking and carbon-neutrality goals.
Modelling approach and key assumptions This report uses a market-based power system model that minimises total power system costs, and that includes both endogenous capacity and transmission line expansion and dispatch modules, to analyse how China’s ETS affects the country’s power sector. The model uses 2015 as the base year and then iterates in five-year increments to assess potential ETS impacts up to 2035. The simulation for 2020 has been strongly calibrated based on 2019 statistics and the 13th FYP targets.9 Initial national and provincial capacity and generation mixes are based on data from the China Electricity Council (CEC).
9 When actual development differs significantly from the initial 13th FYP targets (such as for installed solar PV capacity), results for 2020 are calibrated to reflect actual development.

The Role of China’s ETS in Power Sector Decarbonisation Chapter 2 China’s ETS supports power sector transformation and the peaking of CO2 emissions
PAGE | 37
IEA
. All
right
s re
serv
ed.
The modelling exercise incorporates key assumptions for power sector development, technology costs and policy trends, permitting the simulation of coherent and robust scenarios to assess the ETS’s effects on China’s power system and its potential to support China in achieving its climate and energy objectives (see Annex A for a more detailed description of the model and key inputs):
• Electricity demand data for 2015 are drawn from the CEC. Assumptions for 2020 take into account development to 2019, and a 1.7% growth rate was set for national electricity demand during 2019-2020 to reflect Covid-19 impacts. Assumptions for future electricity demand are aligned with the WEO Stated Policy Scenario (STEPS) (IEA, 2019a).
• The model assumes partly planned dispatch in 202010 and economic dispatch from 2025 onwards, and optimises capacity and generation mixes accordingly. Minimum operating hours (2 500 hours per year) are assumed for gas-fired plants to reflect the political push and incentives for gas-fired power generation.
• Installation and operating cost assumptions for different technologies are based on CEC data (CEC, 2016), Cost of Electric Power Projects (EPPEI and CREEI, 2017), World Energy Outlook 2019 (IEA, 2019a), China Power System Transformation (IEA, 2019c), and a National Renewable Energy Laboratory (NREL) study (Hand et al., 2016).
• Regional coal prices for 2015 and 2020 are based on data from the China Coal Transportation and Distribution Association (CCTD), while regional gas prices for 2015 and 2020 are based on the gate price for gas in China and on the IEA New Policies Scenario (NPS) Full flex case in China Power System Transformation (IEA, 2019c). Average annual fuel price growth follows the WEO STEPS (IEA, 2019a).
• FITs for newly installed wind and solar PV are phased out after 2020. Continuous wind and solar development are assumed to be supported by other technology, energy or fiscal policies. Minimum levels of wind and solar PV capacity expansion are assumed based on 13th FYP trends.
• The model assumes that all units monitor their CO2 fuel factor. This assumption might be optimistic for 2020, but it is expected to be standard by 2025. As bituminous coal is the main type of coal used for electricity generation, this study uses 95 kg CO2/GJ as the average monitored fuel factor for coal, based on IPCC 2006 guidelines for the emission factor of “other bituminous coal” (IPCC, 2006).
The ETS is modelled by an emissions constraint function wherein total verified CO2 emissions cannot be superior to the total CO2 allowances allocated under the ETS. The model implements the ETS with an output- and rate-based allocation
10 A minimum of 1 500 operating hours per year is applied to all coal-fired units.

The Role of China’s ETS in Power Sector Decarbonisation Chapter 2 China’s ETS supports power sector transformation and the peaking of CO2 emissions
PAGE | 38
IEA
. All
right
s re
serv
ed.
design, with the number of allowances based on electricity generation and technology-specific benchmarks. Verified CO2 emissions represent allowances that must be returned for compliance with the ETS, and they are calculated by multiplying fuel consumption by the CO2 fuel factor. The allowance price is an output of the model; it reflects the marginal cost of emissions abatement that minimises total system costs to meet the allocated number of allowances. The allowance price depends strongly on the stringency of the benchmarks.
The electricity cost reflects the average system cost per unit of electricity generated. Total system costs include annualised capital costs and operating costs for electricity generation, as well as the costs of balancing supply and demand, and of transmission. The electricity unit cost is calculated as the total power system cost divided by total electricity generation.
Scenario design This analysis relies on quantitative outputs from scenario simulations designed specifically to compare and evaluate the roles and effects of ETS design in China’s power sector.
China’s ETS is currently designed to encourage greater thermal power plant efficiency, limit power sector CO2 emissions and support the emissions-peaking goal. This analysis assumed a set of benchmark values for the ETS Scenario, which apply to four technology categories: unconventional coal-fired units; conventional coal-fired units at and below 300 MW; conventional coal-fired units above 300 MW; and gas-fired power units. The benchmark design for 2020 (Table 2.1) would reduce the average CO2 emissions intensity 11 of thermal electricity by about 3.5% from the 2015 level.12 Only the ultra-supercritical units have an average CO2 emissions intensity lower than the benchmark applied to them (Figure 2.1).
Coal- and gas-fired power units equipped with CCS are assumed to be subject to the same benchmark as the large conventional coal- and gas-fired units respectively. The average CO2 emissions capture rate by a CCS-equipped unit is set at 85% for this analysis.
11 In this analysis, CO2 emissions intensity refers to CO2 emissions per unit of electricity generated, expressed in gCO2/kWh. 12 Benchmark value assumptions were defined before the publication of China’s ETS 2019-2020 allowance allocation plan for the power sector and are different from the official benchmark values for 2019-2020. This report’s analysis is based on modelling results from the scenarios presented.

The Role of China’s ETS in Power Sector Decarbonisation Chapter 2 China’s ETS supports power sector transformation and the peaking of CO2 emissions
PAGE | 39
IEA
. All
right
s re
serv
ed.
Benchmark design assumptions for 2020
Benchmark category Technology type CO2 emissions benchmark for electricity generation
(g CO2/kWh)
Unconventional coal-fired units Circulating fluidised bed (CFB) 989
Conventional coal-fired units at and below 300 MW
High-pressure Subcritical ≤ 300 MW Supercritical ≤ 300 MW
907
Conventional coal-fired units above 300 MW
Subcritical > 300 MW Supercritical > 300 MW Ultra-supercritical Coal+CCS
829
Gas-fired units Gas Gas+CCS 376
Figure 2.1 CO2 emissions intensity by technology in 2015 and benchmark design for 2020
IEA. All rights reserved.
Note: CFB = circulating fluidised bed.
The average CO2 emissions intensity of coal-fired units will decrease gradually, as new deployment will involve mainly high-efficiency units. Low-efficiency or older ones will be retired upon reaching the end of their lifetime (assumed to be 30 years) or as continued operation becomes uneconomical. This will result in a surplus of total CO2 allowances if the benchmarks remain unchanged, leading to a lack of incentives for coal- and gas-fired units to reduce their CO2 emissions (IEA, 2020a). Thus, the ETS Scenario assumes that benchmarks will gradually be tightened as the power system evolves to ensure the effectiveness of the national ETS. The benchmark values for coal-fired and coal + CCS units are designed to
0
200
400
600
800
1 000
1 200
gCO
2/kW
h
CO₂ emissions intensity
Benchmark forunconventional coal
Benchmark for conventional coal ≤ 300 MW
Benchmark for conventionalcoal > 300 MW
Benchmark for gas

The Role of China’s ETS in Power Sector Decarbonisation Chapter 2 China’s ETS supports power sector transformation and the peaking of CO2 emissions
PAGE | 40
IEA
. All
right
s re
serv
ed.
be lowered by small increments during the initial years of the ETS to reduce shock for market participants and facilitate smooth introduction of the system. The tightening rate increases from 2025 to support the peaking of power sector CO2 emissions before 2030.
Two scenarios have been developed to evaluate the implications of China’s ETS with an output-based design and free allocation (Table 2.2):
• The No-Carbon-Pricing Scenario is the counterfactual scenario against which the role of the ETS is evaluated. 13 The No-Carbon-Pricing Scenario has no specific policies to control CO2 emissions (i.e. neither an ETS nor command-and-control policies such as an emissions cap or energy consumption standards), but it assumes economic dispatch from 2025 and minimum wind and solar PV capacity deployment.
• The ETS Scenario is the main scenario for assessing the role of China’s ETS in its power sector. In addition to the assumptions in the No-Carbon-Pricing Scenario, the ETS Scenario implements a national ETS for electricity generation from 2020 onwards with free output-based allowance allocation. It also assumes that benchmarks for all coal-fired technologies are lowered (i.e. made stricter) over time. As in China’s current ETS allowance allocation plan, gas-fired units with an allowance deficit are not required to purchase allowances for compliance. There is no provision for allowance banking.
• An Intensity Target Case within the No-Carbon-Pricing Scenario simulates the effects of using mandatory energy consumption standards to drive emissions reductions. For comparison purposes, this case follows the same emissions reduction trajectory as the ETS Scenario.
Scenario design
Scenario Emissions-
control instrument
Allowance allocation
Benchmark trajectory
2020-2025
2025-2030
2030-2035
No-Carbon-Pricing
Scenario
No specific emissions controls -/- -/-
ETS Scenario Emissions trading system Free allocation
Benchmark tightening at the same rate for all coal-fired units’ benchmarks.
3% 6% 6%
Constant benchmark for gas-fired units.
Note: Percentage values show reductions over the five-year period.
13 The No-Carbon-Pricing Scenario serves as the baseline scenario to assess the ETS’s effects and potential. It differs from the World Energy Outlook (WEO) Stated Policies Scenario (STEPS), which reflects the impact of existing policy frameworks and announced policy intentions and includes carbon prices for China’s power, industry and aviation sectors.

The Role of China’s ETS in Power Sector Decarbonisation Chapter 2 China’s ETS supports power sector transformation and the peaking of CO2 emissions
PAGE | 41
IEA
. All
right
s re
serv
ed.
Overview of power sector development under the No-Carbon-Pricing Scenario
Fuelling the country’s rapid economic growth, electricity demand in China has increased more than fivefold since 2000. Although the average annual growth rate has fallen gradually from 13% in 2000-2005 to 6.4% in recent years, growth is still significant and remains well above the world average of 3.1% (IEA, 2020b). China’s electricity demand is expected to continue growing at an average annual rate of nearly 3% between 2020 and 2035. Most of the projected increase occurs during 2020-2025, when demand rises 20-25%; thereafter, growth slows to around 10-15% during the periods of 2025-2030 and 2030-2035 (IEA, 2019a).
Without specific policy incentives to reduce emissions, sustained electricity demand growth during 2020-2035 would lead to higher generation from all sources, including from unabated coal-fired technologies. This would cause power sector CO2 emissions to climb despite fleet efficiency improvements and steady renewables deployment.
In our No-Carbon-Pricing Scenario, electricity generation from both fossil and non-fossil fuels expands to meet increasing demand (Figure 2.2). Shares of coal-fired electricity fall to 52% of the generation mix and 32% of capacity by 2035 as other generation sources, particularly wind and solar, expand more rapidly. Nevertheless, coal-based generation still increases 29% in absolute terms. Within coal-fired power, ultra-supercritical units become the dominant source by 2025 as their running hours increase significantly after the transition to economic dispatch and as their share as the most efficient technology in the coal-fired capacity mix grows. By 2035, ultra-supercritical units account for 74% of coal-fired power generation.
Meanwhile, the running hours of CFB and high-pressure units drop by more than 50% by 2035, while those of subcritical and supercritical units stabilise at around 3 200 hours (subcritical) and 4 300 hours (supercritical) during 2025-2035. Average fuel consumption declines from 310 gce/kWh in 2020 to 300 gce/kWh by 2025, then decreases at a slower pace to 289 gce/kWh by 2035. Gas-fired units maintain a stable share of the electricity mix. By 2035, the average emissions intensity of the thermal power fleet decreases to 757 g CO2/kWh in the No-Carbon-Pricing Scenario, an 8% reduction from 2020.

The Role of China’s ETS in Power Sector Decarbonisation Chapter 2 China’s ETS supports power sector transformation and the peaking of CO2 emissions
PAGE | 42
IEA
. All
right
s re
serv
ed.
Figure 2.2 Electricity generation and related CO2 emissions in the No-Carbon-Pricing Scenario, 2020-2035
IEA. All rights reserved.
Total coal-fired power capacity remains relatively stable between 2020 and 2025 at slightly below 1 100 GW, a target set in the 13th FYP and reaffirmed by the NDRC in June 2020 (NDRC, 2020; NDRC and NEA, 2016a, 2016b). It begins to decline slowly before 2030 to fall to around 1 050 GW by 2035. The coal-fired capacity mix continues to shift towards the most efficient units as old and less-inefficient ones are retired at the end of their expected lifetimes or because they have become uncompetitive, while new installations include only the most efficient ultra-supercritical units (Figure 2.3). Nearly 220 GW (44%) of the less-efficient coal-fired power capacity in 2020 (152 GW of subcritical, 53 GW of high-pressure and 12 GW of CFB) could retire by 2035 in the No-Carbon-Pricing Scenario. As the retirement pace accelerates, less-efficient units are retired at a rate of 40 GW during 2020-2025, 65 GW in 2025-2030 and 115 GW in 2030-2035.
Around 50 GW of supercritical and ultra-supercritical units could also be retired before 2035 as their average expected lifetime of 30 years comes to an end or they lose economic competitiveness under least-cost dispatch rules due to high local fuel costs, though this represents less than 20% of expected retirements. Meanwhile, more than 220 GW of ultra-supercritical capacity could be installed between 2020 and 2035 to meet rising electricity demand, resulting in a relatively stable level of total coal-fired power capacity. By 2035, ultra-supercritical units could account for 55% of coal-fired capacity, and the average operational efficiency of the coal-fired fleet could reach 43%. No CCS-equipped units are expected to be installed without policy support.
0
1 000
2 000
3 000
4 000
5 000
6 000
0
2 000
4 000
6 000
8 000
10 000
12 000
2020 2025 2030 2035
TWh
Coal Gas Nuclear Hydro Wind Bioenergy Solar CO₂ emissions
MtC
O₂
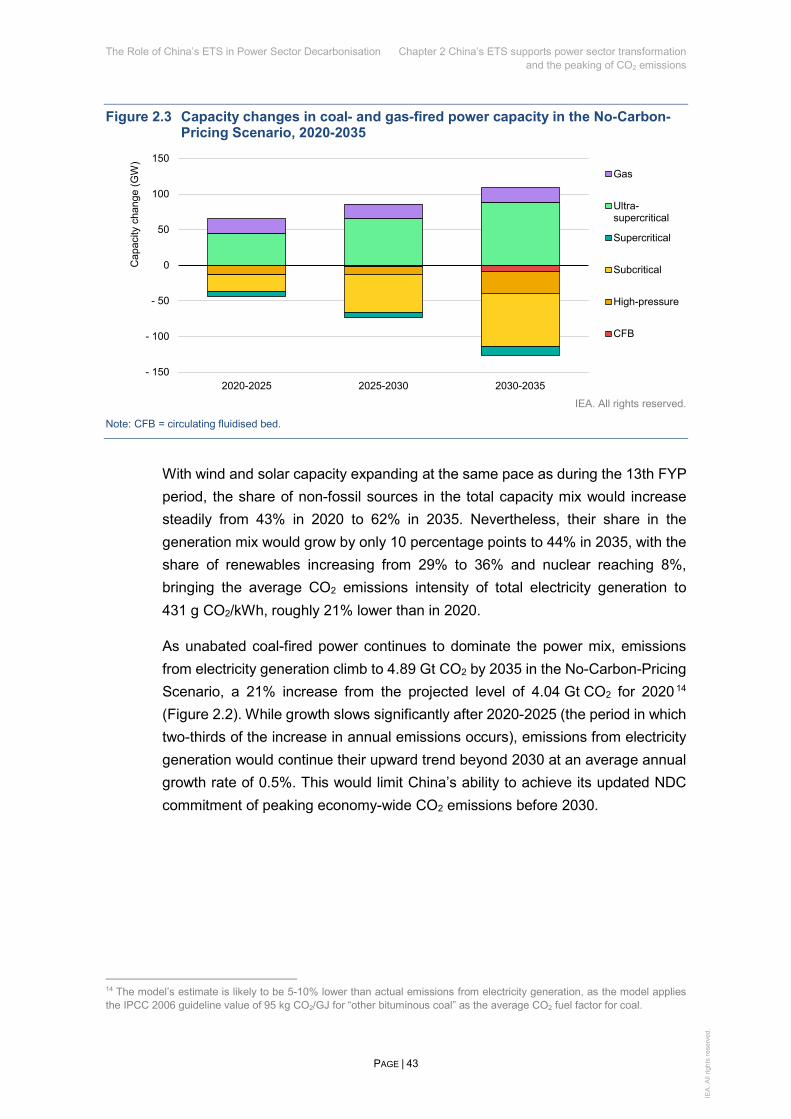
The Role of China’s ETS in Power Sector Decarbonisation Chapter 2 China’s ETS supports power sector transformation and the peaking of CO2 emissions
PAGE | 43
IEA
. All
right
s re
serv
ed.
Figure 2.3 Capacity changes in coal- and gas-fired power capacity in the No-Carbon-Pricing Scenario, 2020-2035
IEA. All rights reserved.
Note: CFB = circulating fluidised bed.
With wind and solar capacity expanding at the same pace as during the 13th FYP period, the share of non-fossil sources in the total capacity mix would increase steadily from 43% in 2020 to 62% in 2035. Nevertheless, their share in the generation mix would grow by only 10 percentage points to 44% in 2035, with the share of renewables increasing from 29% to 36% and nuclear reaching 8%, bringing the average CO2 emissions intensity of total electricity generation to 431 g CO2/kWh, roughly 21% lower than in 2020.
As unabated coal-fired power continues to dominate the power mix, emissions from electricity generation climb to 4.89 Gt CO2 by 2035 in the No-Carbon-Pricing Scenario, a 21% increase from the projected level of 4.04 Gt CO2 for 2020 14 (Figure 2.2). While growth slows significantly after 2020-2025 (the period in which two-thirds of the increase in annual emissions occurs), emissions from electricity generation would continue their upward trend beyond 2030 at an average annual growth rate of 0.5%. This would limit China’s ability to achieve its updated NDC commitment of peaking economy-wide CO2 emissions before 2030.
14 The model’s estimate is likely to be 5-10% lower than actual emissions from electricity generation, as the model applies the IPCC 2006 guideline value of 95 kg CO2/GJ for “other bituminous coal” as the average CO2 fuel factor for coal.
- 150
- 100
- 50
0
50
100
150
2020-2025 2025-2030 2030-2035
Cap
acity
cha
nge
(GW
)
Gas
Ultra-supercritical
Supercritical
Subcritical
High-pressure
CFB

The Role of China’s ETS in Power Sector Decarbonisation Chapter 2 China’s ETS supports power sector transformation and the peaking of CO2 emissions
PAGE | 44
IEA
. All
right
s re
serv
ed.
The ETS could accelerate national-level power sector decarbonisation Overview of ETS impacts on power sector emissions
With benchmarks that become more stringent over time, China’s ETS can have an important role in reducing power sector CO2 emissions by 2035 without raising average electricity costs from 2020.
In the ETS Scenario, technology benchmarks with free allocation produce an allowance price slightly above CNY 100/t CO2 (USD 15/t CO2) in 2020, increasing to around CNY 360/t CO2 (USD 52/t CO2) in 2035.15 The price rise is moderate during the first five years because the benchmark-tightening rate is designed to smoothen ETS implementation; as the benchmarks are lowered (i.e. made more stringent) more rapidly from 2025, the price almost doubles to around CNY 340/t CO2 in 2030. Allowance prices would increase much more slowly in the 2030-2035 period, as CCS deployment would generate significant allowance surpluses at a lower emissions-reduction cost than in 2030.
With an effective and evolving allowance price, emissions from electricity generation could peak well before 2030 and then gradually fall to 4.3 Gt CO2 by 2035 – 12% lower than in the No-Carbon-Pricing Scenario without ETS and about 7% above the 2020 level (Figure 2.4).
Figure 2.4 CO2 emissions from electricity generation and allowance prices in the No-Carbon-Pricing and ETS scenarios, 2020-2035
IEA. All rights reserved.
15 Under an ETS with output-based allocation, the allowance price does not directly translate into an effective carbon cost that applies to a power unit. The effective carbon cost will also depend on the unit’s performance relative to its benchmark and would thus differ from one technology to another.
0
1 000
2 000
3 000
4 000
5 000
2020 2025 2030 2035
MtC
O2
No-Carbon-Pricing ETS
CO₂ emissions from electricity generation
0
100
200
300
400
2020 2025 2030 2035
CNY/
tCO
2
Allowance price

The Role of China’s ETS in Power Sector Decarbonisation Chapter 2 China’s ETS supports power sector transformation and the peaking of CO2 emissions
PAGE | 45
IEA
. All
right
s re
serv
ed.
The ETS incentivises multiple changes that contribute to CO2 emissions reductions. Figure 2.5 illustrates the effects of factors that spur additional CO2 emissions reductions under the ETS Scenario compared with the No-Carbon-Pricing Scenario in 2025, 2030 and 2035. In the ETS Scenario, emissions reductions would mainly result from advances in coal-fired power generation, and the ETS would impact the power mix in two successive phases.
From 2020 to 2030, changes in operational patterns resulting from ETS allocation and the accelerated capacity mix shift from less- to more-efficient unabated coal-fired power technologies are the main sources of additional emissions reductions. They could reduce emissions by more than 180 Mt CO2 in 2035.
From 2030 onwards, the ETS would support CCUS deployment for coal-fired power plants as the allowance price rises and as CCS-equipped coal-fired units begin to benefit most from the tightened coal-fired-power benchmark. More than 50% of the additional emissions reduction in 2035 under the ETS results from a shift from unabated to CCS-equipped coal-fired generation.
In addition, prospective efficiency improvements of all technologies would reduce CO2 emissions by 50 Mt and account for 9% of the additional CO2 emissions reductions in the ETS Scenario in 2035.
Finally, the technology-specific benchmarking approach leaves untapped some of the ETS’s potential to incentivise gas-fired power, renewables and other non-fossil technologies. The ETS Scenario with tightening benchmarks and free allocation would not offer further encouragement for non-fossil electricity generation before 2030 and would provide only a small incentive after 2030, resulting in 5% of the additional CO2 emissions reductions compared to the No-Carbon-Pricing Scenario by 2035. The shift from coal- to gas-fired power generation is marginal due to the high domestic price gap between coal and gas, but also because technology-specific benchmarks encourage emissions intensity improvements within each benchmark category rather than a technology shift.

The Role of China’s ETS in Power Sector Decarbonisation Chapter 2 China’s ETS supports power sector transformation and the peaking of CO2 emissions
PAGE | 46
IEA
. All
right
s re
serv
ed.
Figure 2.5 Factors yielding additional emissions reductions in the ETS Scenario compared with the No-Carbon-Pricing Scenario, 2025-2035
IEA. All rights reserved.
An ETS with tightened benchmarks could trigger changes in the coal-fired power mix
China’s ETS has the potential to significantly alter the coal-fired power mix, as it could lead to the most efficient ultra-supercritical technology becoming dominant, both by influencing coal-fired unit operations and by reshaping the capacity mix.
The ETS’s allocation design encourages higher coal-fired power generation efficiency. In the ETS Scenario, ultra-supercritical units would benefit the most from allowance surpluses, while other coal-fired technologies on average would have allowance deficits from the start of the ETS in 2020; this distributional effect by technology continues to widen slightly in 2025 (Figure 2.6). The ETS thus increases the generation costs of the less-efficient technologies, shifting the generation mix and accelerating the retirement of less-competitive units.
- 600
- 500
- 400
- 300
- 200
- 100
02025 2030 2035
MtC
O2
Switch from fossil to non-fossil technologies
Coal-to-gas switch
Switch from unabatedcoal to coal+CCS
Switch from less- tomore-efficient coaltechnologies
Technology efficiencyimprovements

The Role of China’s ETS in Power Sector Decarbonisation Chapter 2 China’s ETS supports power sector transformation and the peaking of CO2 emissions
PAGE | 47
IEA
. All
right
s re
serv
ed.
Figure 2.6 Net allowance balance by coal technology in the ETS Scenario, 2020 and 2025
IEA. All rights reserved.
Note: CFB = circulating fluidised bed.
In the ETS Scenario, the share of generation from ultra-supercritical units in total coal-fired generation (excluding CCS-equipped units) rises rapidly to 66% in 2025, compared with 58% in the No-Carbon-Pricing Scenario. By 2035, nearly all unabated coal-fired electricity would be generated by ultra-supercritical or supercritical units, with ultra-supercritical accounting for over 90% (Figure 2.7).
The average efficiency of the unabated coal-fired fleet thus improves more rapidly under the ETS. Average energy consumption per unit of electricity produced could fall to 294 gce/kWh by 2025, a 5% improvement from the 310 gce/kWh target set in the 13th FYP for coal-fired power units in operation, and a reduction of 6 gce/kWh more than under the No-Carbon-Pricing Scenario in 2025. The average efficiency of the unabated coal-fired fleet continues to improve to 281 gce/kWh in 2030 and 275 gce/kWh in 2035 – 15 gce/kWh lower than without an ETS. The emissions intensity of unabated coal-fired generation thus decreases to 764 g CO2/kWh by 2035, which is an 11% reduction from 2020 and is significantly below the 803 g CO2/kWh modelled in the No-Carbon-Pricing Scenario.
- 150
- 100
- 50
0
50
100
150
2020 2025 2020 2025 2020 2025 2020 2025 2020 2025CFB High-pressure Subcritical Supercritical Ultra-supercritical
Allo
wan
ces
(in m
illion
s)
Def
icit
Surp
lus

The Role of China’s ETS in Power Sector Decarbonisation Chapter 2 China’s ETS supports power sector transformation and the peaking of CO2 emissions
PAGE | 48
IEA
. All
right
s re
serv
ed.
Figure 2.7 Electricity generation by unabated coal-fired power technology in the No-Carbon-Pricing and ETS scenarios, 2020-2035
IEA. All rights reserved.
Notes: No-CP = No-Carbon-Pricing. CFB = circulating fluidised bed.
The ETS stimulates this change in the coal-fired power generation mix both by influencing the short-term operational patterns of coal-fired units and by guiding longer-term plant retirements and investment decisions.
With the power system transitioning to economic dispatch, the incentives created by the ETS would directly affect generator operations and running hours. In 2025, subcritical units run 17% less in the ETS Scenario than in the No-Carbon-Pricing Scenario. By 2035, units with relatively low efficiency (CFB, high-pressure and subcritical) would serve as backup capacity only, with average running hours kept below 500. Meanwhile, for ultra-supercritical units that benefit from competitive electricity production costs and ETS allowance surpluses, operating hours rise further and are roughly 5% higher in the ETS Scenario than in the No-Carbon-Pricing Scenario.
In addition to important operational pattern changes, the ETS Scenario would also lead to more ultra-supercritical installations and the accelerated early retirement of less-efficient units before 2030 (Figure 2.8). 146 GW of subcritical, high-pressure and CFB units could be retired between 2020 and 2030 – 43% more than in the No-Carbon-Pricing Scenario. The additional retirements of less-efficient units concern mainly 25 GW of subcritical and 17 GW of CFB capacity.
Meanwhile, despite their higher efficiency, supercritical units subject to the benchmark for large conventional coal-fired power units (and thus facing the same stringency as ultra-supercritical units) would also be retired more under the ETS. Around 50 GW of supercritical units could be retired by 2030 in the ETS Scenario, more than three times the 15 GW under the No-Carbon-Pricing Scenario.
0%
20%
40%
60%
80%
100%
No-CP ETS No-CP ETS No-CP ETS No-CP ETS
2020 2025 2030 2035
Ultra-supercritical
Supercritical
Subcritical
High-pressure
CFB

The Role of China’s ETS in Power Sector Decarbonisation Chapter 2 China’s ETS supports power sector transformation and the peaking of CO2 emissions
PAGE | 49
IEA
. All
right
s re
serv
ed.
In contrast, the ETS Scenario could add 110 GW more ultra-supercritical capacity than the No-Carbon-Pricing Scenario would, particularly during 2025-2030. This demonstrates the effects of a widening allowance surplus for ultra-supercritical units and deficits for other technologies between 2025 and 2030 as the benchmarks tighten more sharply than during the first five-year period.
Figure 2.8 Capacity changes by coal-fired power technology in the No-Carbon-Pricing and ETS scenarios, 2020-2035
IEA. All rights reserved.
Notes: No-CP = No-Carbon-Pricing. CFB = circulating fluidised bed.
From 2030, however, as the emissions intensity benchmarks become increasingly stringent and create pressure even for ultra-supercritical units, the ETS shifts to encourage CCS technology uptake while spurring more retirements and fewer installations of all unabated coal-fired power technologies.
China’s ETS could be a key mechanism to incentivise CCUS uptake and prompt the peaking of unabated coal-fired power generation
With the complementary effects of allowance prices rising as benchmarks tighten and CCUS technology costs falling thanks to greater innovation and deployment measures, the ETS could evolve to limit generation from all non-CCS coal-fired technologies to an even greater extent. Together with other policy tools, China’s ETS could support coal + CCS deployment in the power sector as early as 2030. This would help China’s power sector emissions fall by 2030 and lead total electricity generation from unabated coal-fired units to peak before 2035.
- 200
- 150
- 100
- 50
0
50
100
150
200
No-CP ETS No-CP ETS No-CP ETS2020-2025 2025-2030 2030-2035
Cap
acity
cha
nge
(GW
)
Coal+CCS
Ultra-supercritical
Supercritical
Subcritical
High-pressure
CFB

The Role of China’s ETS in Power Sector Decarbonisation Chapter 2 China’s ETS supports power sector transformation and the peaking of CO2 emissions
PAGE | 50
IEA
. All
right
s re
serv
ed.
All unabated coal-fired power technologies, including ultra-supercritical units, will on average have an allowance deficit by 2030. Meanwhile, CCS-equipped coal-fired units, which we assume to be covered by the same benchmark as other conventional coal-fired units above 300 MW but that emit significantly less CO2, will benefit from an allowance surplus to become competitive earlier despite their higher capital costs16 (Figure 2.9).
Figure 2.9 Net allowance balance by coal-fired power technology in the ETS Scenario, 2030 and 2035
IEA. All rights reserved.
Note: CFB = circulating fluidised bed.
As CCS-equipped coal-fired units can gain revenues by selling surplus allowances (estimated to be worth CNY 340/t CO2 in 2030), the ETS could act as a subsidy of approximately CNY 0.2/kWh17 for coal + CCS technology under the allowance allocation rules analysed. This would help reduce the overall coal + CCS generation cost to CNY 0.2/kWh in regions such as Inner Mongolia where coal prices are low, while the cost for the most efficient new ultra-supercritical units would be slightly higher at CNY 0.21/kWh (Figure 2.10).
It is nevertheless important to note that the ETS does not operate as a unified carbon cost for all the technologies it applies to. Instead, costs and revenues depend on benchmark stringency relative to the emissions intensity of each technology. Consequently, while coal + CCS could benefit considerably from the ETS rules, the effective carbon cost for unabated coal-fired power would be much
16 See Annex, Table A.2, for technology cost assumptions. 17 The ETS incentive level is calculated by multiplying allowance surpluses received by coal+CCS units by the allowance price, divided by total generation from coal+CCS units.
- 300
- 200
- 100
0
100
200
300
2030 2035 2030 2035 2030 2035 2030 2035 2030 2035CFB and high-
pressureSubcritical Supercritical Ultra-supercritical Coal+CCS
Allo
wan
ces
(in m
illion
s)D
efic
itSu
rplu
s

The Role of China’s ETS in Power Sector Decarbonisation Chapter 2 China’s ETS supports power sector transformation and the peaking of CO2 emissions
PAGE | 51
IEA
. All
right
s re
serv
ed.
lower on average, at around CNY 0.02/kWh in 2035 (the next section further analyses effective carbon costs by technology; see Figure 2.13).
Figure 2.10 LCOE of ultra-supercritical and CCS-equipped coal-fired power in provinces with low coal prices (e.g. Inner Mongolia) in the ETS Scenario, 2020-2035
IEA. All rights reserved.
Notes: USC = Ultra-supercritical. O&M = operation and maintenance. LCOE = levelised cost of electricity.
With the support of its allowance allocation design, the ETS could act as a subsidy to help CCS-equipped coal-fired units enter the power mix. Sustained support for innovation in the near term and clear deployment policies in the medium term are critical to improve performance and reduce the costs of applying CCS to coal-fired generation. In 2030, new coal + CCS units are expected to make up 1.5% of coal-fired power capacity and contribute 3% of output in the ETS Scenario. By 2035, the share rises to 5% of coal-fired capacity (57 GW) and 8% of generation (473 TWh).
As CCS technology comes online and the costs of unabated coal-fired generation increase under the ETS, unabated coal-fired units generate approximately 5 480 TWh in 2030 in the ETS Scenario – 3% (150 TWh) less than in the No-Carbon-Pricing Scenario. And contrary to the continuous growth trend of the No-Carbon-Pricing Scenario, unabated coal-fired power generation falls to 5 340 TWh in 2035 in the ETS Scenario, a reduction of 9% or nearly 540 TWh compared with no ETS (Figure 2.11).
-0.6
-0.4
-0.2
0.0
0.2
0.4
0.6
USC Coal+CCS USC Coal+CCS USC Coal+CCS USC Coal+CCS2020 2025 2030 2035
CN
Y/kW
h
CO₂ cost
Costs (capital,O&M and fuel)
LCOE

The Role of China’s ETS in Power Sector Decarbonisation Chapter 2 China’s ETS supports power sector transformation and the peaking of CO2 emissions
PAGE | 52
IEA
. All
right
s re
serv
ed.
Figure 2.11 Coal-fired power generation and capacity mixes in the No-Carbon-Pricing and ETS scenarios, 2025-2035
IEA. All rights reserved.
Notes: No-CP = No-Carbon-Pricing. CFB = circulating fluidised bed.
By incentivising coal + CCS uptake and rapidly putting unabated coal-fired generation – the power sector’s largest emissions source – on a downward trajectory, the ETS delivers emissions reduction benefits. With CCS technology capturing 85% of plant emissions, the switch to coal + CCS could help avoid around 100 Mt CO2 of emissions in 2030 and 290 Mt CO2 in 2035. The average emissions intensity of the coal-fired fleet in the ETS Scenario falls to 713 g CO2/kWh by 2035 with CCS deployment, 7% lower than the 764 g CO2/kWh of the unabated coal-fired fleet and 11% below the 803 g CO2/kWh in the No-Carbon-Pricing Scenario.
With technology benchmarks and free allocation, the ETS would provide limited incentives for gas-fired and non-fossil generation
While the ETS’s allocation design can have a strong impact on China’s coal-fired power production, its role in incentivising non-fossil alternatives or gas-fired generation is limited by technology-specific benchmarks and free allowance allocation.
While generation from unabated coal-fired technologies is notably lower under the ETS than in the No-Carbon-Pricing Scenario from 2030 onwards, the generation gap is mostly filled by CCS-equipped coal-fired units. In 2035, coal + CCS generation reaches 473 TWh (4% of total generation) under the ETS compared with being absent from the No-Carbon-Pricing Scenario mix. In contrast, generation from gas-fired units is only 22 TWh more under the ETS; the output
0
1 000
2 000
3 000
4 000
5 000
6 000
No-CP ETS No-CP ETS No-CP ETS2025 2030 2035
TWh
Power generation
CFB High-pressure Subcritical Supercritical Ultra-supercritical Coal+CCS
0
200
400
600
800
1 000
1 200
No-CP ETS No-CP ETS No-CP ETS2025 2030 2035
Installed capacity
GW

The Role of China’s ETS in Power Sector Decarbonisation Chapter 2 China’s ETS supports power sector transformation and the peaking of CO2 emissions
PAGE | 53
IEA
. All
right
s re
serv
ed.
increase from non-fossil sources is equally small at 66 TWh and comes mainly from biomass and hydropower (Figure 2.12).
Similarly, in terms of capacity, the ETS Scenario would not provide sufficient incentives to encourage installation of gas-fired or variable renewable energy capacity beyond what would be installed in the No-Carbon-Pricing Scenario. Instead, new coal-fired power capacity continues to be installed under the ETS, which could increase the risk of emissions lock-in and the need for future CCS retrofits or early retirements.
Figure 2.12 Generation differences between the ETS and No-Carbon-Pricing scenarios, 2025-2035
IEA. All rights reserved.
Note: No-CP = No-Carbon-Pricing.
Under free allocation, an ETS with an output-based design and technology-specific benchmarks would have limited effect on promoting cross-technology switching. The output-based design and free allocation grant generators allowances in proportion to their production activities for free. Units generating electricity at an emissions intensity exceeding their applicable benchmark face allowance deficits, while those performing better than the benchmark (i.e. at a lower emissions intensity) receive allowance surpluses as they produce. The effective carbon cost (in CNY per kWh of generation produced) applied to a unit thus depends not only on the allowance price but also on the unit’s performance relative to its applicable benchmark, instead of on its absolute emissions intensity (Figure 2.13). The price of the allowances traded under the ETS therefore does not act as a uniform carbon tax on all technologies.
0
2 000
4 000
6 000
8 000
10 000
12 000
No-CP ETS No-CP ETS No-CP ETS2025 2030 2035
TWh
Power generation
Solar
Wind
Hydro
Biomass
Nuclear
Gas
Coal+CCS
Coal- 800
- 600
- 400
- 200
0
200
400
600
800
2025 2030 2035
Generation differences between ETS and No-CP scenarios
TWh

The Role of China’s ETS in Power Sector Decarbonisation Chapter 2 China’s ETS supports power sector transformation and the peaking of CO2 emissions
PAGE | 54
IEA
. All
right
s re
serv
ed.
Under the ETS benchmark trajectory analysed, the effective carbon cost would be around CNY 0.01/kWh or lower for most unabated coal-fired power technologies in 2020-2025. Meanwhile, ultra-supercritical units would likely receive a monetary incentive, as they typically perform better than the benchmark for conventional coal-fired units above 300 MW. As benchmarks gradually tighten, the allowance balance shifts (Figure 2.6 and Figure 2.9) and the allowance price increases. The effective carbon cost could rise to more than CNY 0.12/kWh for the least-efficient coal-fired units by 2035, but on average it remains below CNY 0.02/kWh for ultra-supercritical units, which account for the majority of unabated coal-fired power generation.
Figure 2.13 Average CO2 cost by technology in the ETS Scenario, 2020-2035
IEA. All rights reserved.
Note: CFB = circulating fluidised bed.
Gas-fired power units have no obligation to purchase allowances and thus do not face an additional CO2 cost under the ETS, but they also would not be able to benefit from strong revenues the way coal + CCS units could. As the gas benchmark is set according to the emissions intensity of gas-fired units and is thus much lower than coal benchmarks, gas-fired units would receive an allowance surplus of less than 10 million annually between 2020 and 2035 under the benchmark trajectory analysed. In 2035, under an allowance price of around CNY 360/t CO2, the 7-million allowance surplus for gas-fired units would have a monetised value of CNY 2.6 billion; in comparison, coal + CCS would receive a 270-million allowance surplus worth more than CNY 96 billion. While coal + CCS would benefit from an emissions abatement ‘subsidy’ of CNY 0.2/kWh, gas-fired units would receive only CNY 0.01/kWh through the ETS. As unabated coal-fired generation on average faces a limited CO2 cost of CNY 0.02/kWh under the coal
-0.05
0.00
0.05
0.10
0.15
2020 2025 2030 2035
CN
Y/kW
h
CFB High-pressure Subcritical Supercritical Ultra-supercritical Gas
-0.25
-0.20
-0.15
-0.10
-0.05
0.00
2030 2035
Coal+CCS
CN
Y/kW
h

The Role of China’s ETS in Power Sector Decarbonisation Chapter 2 China’s ETS supports power sector transformation and the peaking of CO2 emissions
PAGE | 55
IEA
. All
right
s re
serv
ed.
benchmarks, the cumulative cost benefit for gas-fired units would not be sufficient to make up for the high fuel cost differential (Figure 2.14).
Figure 2.14 Average generation costs by technology in the ETS Scenario, 2035
IEA. All rights reserved.
Notes: O&M = operation and maintenance. Subsidies are included in the fuel costs for gas-fired power plants. Generation costs for coal-fired power are relatively low because much generation is concentrated in regions with low coal prices. Electricity from coal + CCS is generated only in Inner Mongolia and Xinjiang provinces. See Annex Table A.2 for technology cost assumptions and Table A.3 for coal price assumptions used in this analysis.
As for renewables, since the ETS allowance allocation for the power sector covers only coal- and gas-fired power units, renewables-based units do not receive allowances and therefore cannot gain revenues by selling their surplus. The ETS thus reduces the competitiveness of coal- against renewables-based generation only through the carbon cost imposed on coal-fired power technologies, which is too low to encourage a strong additional shift from coal to renewables.
The ETS could be a stronger stimulant of fuel and technology switching if relative benchmark stringency were adjusted or auctions were slowly introduced to raise the costs of the most carbon-intensive energy sources (see Chapter 3 for more on auctions). The ETS could also incentivise fuel switching by gradually including non-fossil technologies and merging benchmarks into fewer technology categories, ideally creating one single power sector benchmark. Having only one power sector benchmark covering both fossil-based and low-carbon technologies would change the allowance balance, offering fewer incentives for fossil fuel-based power technologies such as ultra-supercritical unabated coal and coal+CCS, allowing lower-carbon solutions to benefit more from allowance surpluses and making the ETS more cost-effective (IEA, 2020a). It would also motivate power sector innovators to develop new low-carbon energy technologies beyond CCUS. Further research and modelling are necessary to explore the effects of the various options and optimise the ETS’s design.
-0.6
-0.4
-0.2
0
0.2
0.4
0.6
Coal Coal+CCS Gas Nuclear Hydro Wind Solar
CN
Y/kW
h
Fuel costs
CO₂ costs
O&M costs
Capital costs
Total costs

The Role of China’s ETS in Power Sector Decarbonisation Chapter 2 China’s ETS supports power sector transformation and the peaking of CO2 emissions
PAGE | 56
IEA
. All
right
s re
serv
ed.
The ETS could deliver significantly higher efficiency and lower emissions with limited impact on electricity costs
By allowing the market to be more involved in guiding resource allocation and emissions abatement, an ETS can achieve significant CO2 emissions reductions and encourage power sector transition with only a slight increase in electricity costs. While similar emissions reductions could be realised through a command-and-control approach, an ETS can be more cost-effective and can better shape the long-term decarbonisation pathway.
In the No-Carbon-Pricing Scenario, the unit cost of electricity supply is set to fall more than 3% between 2020 and 2035 thanks to least-cost dispatch reform, improved fleet efficiency and cost savings as technologies mature. However, CO2 emissions are still on a rising trend.
In the ETS Scenario, as the ETS helps make power sector emissions peak before 2030, it results in higher electricity costs than in the No-Carbon-Pricing Scenario, but the impact is limited under free allowance allocation. Compared with 2020, the per-unit electricity cost under the ETS with free allocation still decreases 0.8% by 2035. Although the electricity cost is 0.25% higher than under the No-Carbon-Pricing Scenario in 2025 and 1.5% higher in 2030, the ETS achieves CO2 emissions reductions of 2% in 2025 and 7% in 2030. By 2035, a 12% (571 Mt CO2) emissions reduction can be reached under the ETS, while the electricity cost is only 2.7% higher than in the No-Carbon-Pricing Scenario (Figure 2.15).
Figure 2.15 Unit electricity cost and CO2 emissions from electricity generation in the No-Carbon-Pricing and ETS scenarios, 2020-2035
IEA. All rights reserved.
0
1 000
2 000
3 000
4 000
5 000
94%
96%
98%
100%
2020 2025 2030 2035
Mt C
O2
No-Carbon-Pricing
Unit electricty cost (normalised to 2020 level) CO₂ emissions
0
1 000
2 000
3 000
4 000
5 000
94%
96%
98%
100%
2020 2025 2030 2035
Mt C
O2
ETS
Uni
tele
ctric
ity c
ost
Uni
tele
ctric
ity c
ost

The Role of China’s ETS in Power Sector Decarbonisation Chapter 2 China’s ETS supports power sector transformation and the peaking of CO2 emissions
PAGE | 57
IEA
. All
right
s re
serv
ed.
An Intensity Target Case has been developed to simulate the effects of using mandatory energy consumption standards to drive CO2 emissions reductions. It follows the command-and-control approach used in the 13th FYP with the target of average coal consumption of operating coal-fired power units (in gce/kWh). For coherence and comparison with the ETS Scenario, the Intensity Target Case is designed to achieve the same CO2 emissions reductions for each five-year period to 2030. CCS technology deployment is assumed to take place exogenously to reach the same level as under the ETS.
Design of the Intensity Target Case
Case Emissions-
control instrument
Instrument adjustments over time
Intensity Target Case
Mandatory energy consumption
standards
Average energy consumption of operating coal-fired power units
2020-2025 2025-2030
4.5% 2.7%
Average energy consumption of operating gas-fired power units
2020-2025 2025-2030
3% 2.7%
Notes: Percentage values show reductions over the five-year periods. In the Intensity Target Case, the reduction required for 2025-2030 is lower than for 2020-2025 due to the assumed development of CCS-equipped units.
Similar CO2 emissions reductions can be achieved through an ETS as with a command-and-control approach, but with different implications for electricity costs and the power sector mix. In the Intensity Target Case, the operating coal-fired fleet is required to improve its efficiency to meet the energy consumption standards of 308 gce/kWh by 2020, 294 gce/kWh by 2025 and 286 gce/kWh by 2030. Combined with efficiency requirements for gas-fired power and a similar level of coal + CCS development as under the ETS, the Intensity Target Case reaches the same level of emissions reductions as the ETS Scenario. In contrast, in the No-Carbon-Pricing Scenario (in which power sector CO2 emissions do not peak), the operating coal-fired fleet would have an energy consumption level of 310 gce/kWh by 2020, 300 gce/kWh by 2025 and 295 gce/kWh by 2030.
When comparing the ETS Scenario and the Intensity Target Case, the ETS reduces emissions at less additional cost to the system than the intensity target approach (Figure 2.16). To achieve an 86 Mt CO2 emissions reduction in 2025, which equates to about 2% of total CO2 emissions from electricity generation, the system cost increases CNY 30 billion under the Intensity Target Case, compared with CNY 8 billion under the ETS. As a result, the unit cost of electricity supply is 0.7% higher in the Intensity Target Case than under the ETS Scenario in 2025.

The Role of China’s ETS in Power Sector Decarbonisation Chapter 2 China’s ETS supports power sector transformation and the peaking of CO2 emissions
PAGE | 58
IEA
. All
right
s re
serv
ed.
Figure 2.16 Additional system costs in the ETS Scenario and Intensity Target Case compared with the No-Carbon-Pricing Scenario, 2025
IEA. All rights reserved.
The ETS could achieve more cost-effective emissions reductions than mandatory consumption standards do, as allowance trading allows the most affordable emissions abatement measures in the system to be deployed first. In contrast, under mandatory energy consumption targets, technologies need to reduce their respective energy consumption by a similar scale regardless of the relative cost.
Moreover, in addition to achieving immediate emissions reductions, the ETS can reshape the electricity generation mix and has strong potential to optimise decarbonisation efforts in the long term. With emissions trading, the ETS encourages a generation switch from low- to high-efficiency units and allows CCS technology to be competitive through revenues from allowance sales. Conversely, energy consumption intensity targets would have little impact on the coal-fired power generation mix, as they drive emissions reductions through efficiency improvements in each technology. At the same time, given the technical limits on efficiency levels achievable for each technology, it will be increasingly difficult and expensive for the intensity target approach to continuously produce strong emissions reductions beyond 2030.
Moreover, unlike the ETS, which allows CCS technology to develop by gaining from allowance trading, the intensity target approach cannot provide sufficient incentives for CCS deployment. Without the introduction of a market mechanism, reaching the same level of coal + CCS development as under the ETS would require additional policy support of more than CNY 30 billion in 2030.
0.31
0.32
0.33
0.34
0.35
0
5
10
15
20
25
30
35
ETSScenario
Intensity TargetCase
Addi
tiona
l sys
tem
cos
ts (b
illion
CN
Y)
Increase in systemcosts compared withNo-CP Scenario
Unit electricty cost
Uni
tele
ctric
ity c
ost (
CN
Y/kW
h)

The Role of China’s ETS in Power Sector Decarbonisation Chapter 2 China’s ETS supports power sector transformation and the peaking of CO2 emissions
PAGE | 59
IEA
. All
right
s re
serv
ed.
Interregional distributional effects of the ETS Overview of regional power development and interprovincial power flows in the No-Carbon-Pricing Scenario
China’s provincial administrative areas can be aggregated into six grid regions: the north grid (NG), the northwest grid (NWG), the northeast grid (NEG), the east grid (EG), the south grid (SG) and the central grid (CG). Details on the geographical division of grid regions are available in Annex A.1.
Coal-fired power capacity has expanded in all regions since 2015. The north grid experienced the largest capacity increment of 53 GW during 2015-2020, followed by 44 GW in the northwest region, which had the highest growth rate in coal-fired power capacity (42%) during this five-year period. With nearly 300 GW of capacity in the north grid and 235 GW in the east in 2020, these two regions together represent half of China’s installed coal-fired power capacity and CO2 emissions.
Under the No-Carbon-Pricing Scenario, coal-fired capacity increases in the three northern grid regions during 2020-2035 while decreasing in the east and south (Figure 2.17). In the northeast and northwest grids, it expands by one-fifth, and in the north grid by 10% as new coal-fired units are built mainly in major coal-producing provinces such as Shanxi, Inner Mongolia, Xinjiang and Ningxia, where local resources are abundant and affordable. At the same time, coal-fired capacity in the east, central and south grids is set to contract by more than one-fifth in each region as the retirement of old units outpaces new installations. Further, the capacity and generation shares of highly efficient coal-fired plants will increase in each grid region owing to changes in dispatch patterns, the retirement of old, less-efficient units, and the installation of new, more-efficient plants.
New gas-fired plants will be built mainly in Qinghai and Chongqing, where moderate gas and relatively high coal prices make gas-fuelled generation more competitive.

The Role of China’s ETS in Power Sector Decarbonisation Chapter 2 China’s ETS supports power sector transformation and the peaking of CO2 emissions
PAGE | 60
IEA
. All
right
s re
serv
ed.
Figure 2.17 Fossil power capacity by grid region in the No-Carbon-Pricing Scenario, 2020 and 2035
IEA. All rights reserved.
Notes: NG = north grid. NWG = northwest grid. NEG = northeast grid. EG = east grid. SG = south grid. CG = central grid. CFB = circulating fluidised bed.
Capacity additions of low-carbon technologies also differ across grid regions in the No-Carbon-Pricing Scenario. While the east grid has the greatest increase in nuclear capacity (48 GW) to accommodate its densely populated coastal areas, new hydropower stations would be built in the central and south regions due to increasing water scarcity in other parts of the country. In the north and northwest, low regional coal prices and the phase-out of FITs may limit the speed of wind capacity deployment between 2020 and 2035. New wind capacity is expected to be scaled up mostly in the central, east and south grid regions, where relatively high coal prices make wind power more competitive. Solar capacity expands in all regions during 2020-2035, especially the south, where it increases more than eightfold. By 2035, the north, northwest and south grid regions have solar power capacity of more than 100 GW each and together account for nearly three-quarters of national solar capacity.
As regional electricity supply and demand differences are expected to widen, enhanced interconnectivity and grid balancing across larger areas will facilitate electricity exchanges among the grid regions. In fact, total interprovincial electricity exports are likely to increase by more than 200 TWh to about 1 120 TWh during 2020-2035, with the three northern regions (which have relatively high shares of coal-fired power in their generation mixes) exporting electricity to other grid regions. The northeast grid especially could more than double its share of electricity exports to 18%. With the greater need for electricity transmission between regions, transmission capacity is expected to grow 36% by 2035 (starting from 200 GW in 2020). The greatest increases occur between the northwest and
0
50
100
150
200
250
300
350
400
2020 2035 2020 2035 2020 2035 2020 2035 2020 2035 2020 2035NG NWG NEG EG SG CG
GW Gas
Ultra-supercritical
Supercritical
Subcritical
High-pressure
CFB

The Role of China’s ETS in Power Sector Decarbonisation Chapter 2 China’s ETS supports power sector transformation and the peaking of CO2 emissions
PAGE | 61
IEA
. All
right
s re
serv
ed.
central regions (+25 GW), the northwest and the north (+13 GW), and the northeast and north (+13 GW).
Under the No-Carbon-Pricing Scenario, CO2 emissions rise in all regions between 2020 and 2035, but total emissions and growth levels vary widely. Even though emissions increase by only 13% over the period, the north grid remains the largest emitter at more than 1.7 Gt CO2 in 2035. And although the central grid region has the highest rate of emissions growth, its emissions remain the lowest of the six regions. Only in the east grid are emissions expected to peak before 2035.
ETS impact on the power sector across regions ETS implementation will accelerate early retirement of low-efficiency coal-fired power units and encourage the development of plants with lower CO2 emissions intensity, but at varying degrees depending on the region (Figure 2.18). Compared with the No-Carbon-Pricing Scenario, the largest additional retirements of coal-fired plants by 2035 under the ETS would be in the northwest region (31 GW), followed by more than 20 GW in the central and south grids each. For additional new coal-fired capacity development under the ETS, the north grid would lead, with 80 GW deployed by 2035. In the three northern regions, the increase in new highly efficient coal-fired units (ultra-supercritical and coal + CCS) would outpace additional retirements of old capacity, resulting in a higher coal-fired plant capacity in these regions under an ETS than in a No-Carbon-Pricing Scenario. Coal + CCS capacity development will be strongly concentrated in the provinces of Xinjiang, Eastern Inner Mongolia and Western Inner Mongolia. Despite significant gains through the ETS, the capital costs of CCS-equipped units continue to be very high, so they are cost-competitive only in regions with low coal prices.

The Role of China’s ETS in Power Sector Decarbonisation Chapter 2 China’s ETS supports power sector transformation and the peaking of CO2 emissions
PAGE | 62
IEA
. All
right
s re
serv
ed.
Figure 2.18 Coal-fired power capacity by grid region in the No-Carbon-Pricing and ETS scenarios, 2035
IEA. All rights reserved.
Notes: No-CP = No-Carbon-Pricing. NG = north grid. NWG = northwest grid. NEG = northeast grid. EG = east grid. SG = south grid. CG = central grid. CFB = circulating fluidised bed.
Under an ETS, CO2 emissions from electricity generation would peak at the national level before 2030, and in 2035 could be 12% lower than in a No-Carbon-Pricing Scenario. However, emissions trends are not the same at the regional level, as the ETS encourages the most cost-effective reduction measures (Figure 2.19). In contrast to the No-Carbon-Pricing Scenario, CO2 emissions are lower in 2035 in all but the central grid region. The north region would achieve the highest total emissions reduction (more than 230 Mt), while the northwest grid would have the highest reduction rate of 16%. Emissions peak in four regions before 2035 under an ETS, compared with only one in the No-Carbon-Pricing Scenario. Only emissions in the south and central grid regions would continue increasing through 2035 despite being subject to a carbon price.
0
50
100
150
200
250
300
350
400
450
No-CP ETS No-CP ETS No-CP ETS No-CP ETS No-CP ETS No-CP ETSNG NWG NEG EG SG CG
GW Coal+CCS
Ultra-supercritical
Supercritical
Subcritical
High-pressure
CFB
The Role of China’s ETS in Power Sector Decarbonisation Chapter 2 China’s ETS supports power sector transformation and the peaking of CO2 emissions
PAGE | 63
IEA
. All
right
s re
serv
ed.
Figure 2.19 CO2 emissions from electricity generation by grid region in the No-Carbon-Pricing and ETS scenarios, 2020 and 2035
IEA. All rights reserved.
Notes: No-CP = No-Carbon-Pricing. NG = north grid. NWG = northwest grid. NEG = northeast grid. EG = east grid. SG = south grid. CG = central grid.
Growth in interregional electricity exchanges and in transmission capacity under the ETS are expected to be similar in scale to the No-Carbon-Pricing Scenario, with variations among certain regional electricity flows. The northwest, north and northeast grids remain exporting regions in the ETS Scenario, with electricity exports totalling about 1 250 TWh in 2035, slightly less than in the No-Carbon-Pricing Scenario. However, the northwest grid region exports 6% less electricity under the ETS, while amounts increase in the north (+6%) and northeast (+5%). Under the ETS, the transmission capacity increments for 2020-2035 are higher between the northwest and north (+3.6 GW), the central and south (+3.5 GW) and the northeast and north grid regions (+1.4 GW). The highest transmission capacity increment remains between the northwest and central grids, at 24 GW by 2035.
ETS distributional effects and fairness As an intensity-based allowance allocation design generates surpluses and deficits for different technologies, the introduction of an ETS is likely to lead to distributional effects across regions. While regions with a high share of electricity from ultra-supercritical units can benefit from an ETS, those with a larger share of less-efficient coal-fired plants will need to buy further allowances. China’s east grid region, having the highest share of ultra-supercritical units, will receive the highest allowance surplus (9.3 million) of the six grid regions for 2020, while the high-pressure and subcritical units of the central grid will have the largest allowance shortage of 8.4 million. Nonetheless, allowance distribution remains relatively balanced and, combined with a moderate allowance price of CNY 103/t CO2, the monetised value of each region’s allowance surplus or deficit does not exceed
0
200
400
600
800
1 000
1 200
1 400
1 600
1 800
2 000
No-CP ETS No-CP ETS No-CP ETS No-CP ETS No-CP ETS No-CP ETSNG NWG NEG EG SG CG
Mt C
O2
2020
2035

The Role of China’s ETS in Power Sector Decarbonisation Chapter 2 China’s ETS supports power sector transformation and the peaking of CO2 emissions
PAGE | 64
IEA
. All
right
s re
serv
ed.
CNY 1 billion. All together, the three regions benefiting from the ETS could gain CNY 1.6 billion for 2020. In addition to the heterogeneity of the installed coal-fired power fleet from one province to the next, the regional distributional effects will be directly related to the stringency of allocation benchmarks according to fuel and technology.
As ETS benchmarks tighten and CCS deployment scales up, the distributional effects linked to allowance allocation would create significant disparities by 2035 (Figure 2.20); the north grid could swing to an allowance surplus while the east region faces allowance shortages. As CCS-equipped plants could have a huge allowance surplus under the assumed benchmark design, regions with such plants potentially accumulate substantial revenues. The three northern grid regions, which include Eastern Inner Mongolia, Western Inner Mongolia and Xinjiang, could benefit significantly from the ETS through CCS deployment. The north region would be the largest beneficiary with a surplus of over 70 million in 2035, which could be worth approximately CNY 26 billion if the allowance price rises to nearly CNY 360/t CO2. Gas-fired units could also receive some allowance surpluses, but their contribution remains limited because they are subject to a separate benchmark.
Figure 2.20 Net allowance balance by grid region in the ETS Scenario, 2020 and 2035
IEA. All rights reserved.
Notes: NG = north grid. NWG = northwest grid. NEG = northeast grid. EG = east grid. SG = south grid. CG = central grid. CFB = circulating fluidised bed.
- 180
- 120
- 60
0
60
120
180
2020 2035 2020 2035 2020 2035 2020 2035 2020 2035 2020 2035NG NWG NEG EG SG CG
Allo
wan
ces
(in m
illion
s) Coal+CCS
Gas
Ultra-supercritical
Supercritical
Subcritical
High-pressure
CFB
Total
Surp
lus
Def
icit

The Role of China’s ETS in Power Sector Decarbonisation Chapter 3 Allowance auctioning drives deeper power sector decarbonisation
PAGE | 65
IEA
. All
right
s re
serv
ed.
Chapter 3 Allowance auctioning drives deeper power sector decarbonisation
While Chapter 2 discussed the implementation of an emissions trading system (ETS) in which emissions allowances are allocated for free to power plants, this chapter explores the potential effects of auctioning emissions allowances. Analysis continues to rely on the design and assumptions of the in-depth modelling described in Chapter 2.
China has gained experience with moderate allowance auctioning through regional ETS pilots since 2013, and its national ETS offers the possibility of allowance auctioning in the future (MEE, 2021).
Traditionally, ETSs are introduced with the free allocation of emissions allowances as a transitional assistance measure to address competitiveness and carbon leakage concerns. Nonetheless, gradually phasing out free allocation in favour of allowance auctioning has two main advantages that will often eventually outweigh these concerns. First, auctions make the trading system more effective. They increase the incentive for participants to mitigate their emissions by requiring them to purchase their right to emit, truly applying the “polluter pays” principle relative to their contribution to climate change. Second, auctions create new revenues that can be invested in further climate change mitigation actions or used to address distributional impacts, for instance to compensate low-income households for higher electricity costs (IEA, 2020j).
Scenario design For this preliminary assessment, an additional ETS Auctioning Scenario was developed using the same output-based allowance allocation mechanism and benchmark tightening trajectory as the ETS Scenario (Table 3.1). It introduces auctions in 2025, moderately reducing the share of freely allocated allowances in the system by 10% in 2025, 30% in 2030 and 50% in 2035.

The Role of China’s ETS in Power Sector Decarbonisation Chapter 3 Allowance auctioning drives deeper power sector decarbonisation
PAGE | 66
IEA
. All
right
s re
serv
ed.
Scenario designs for ETS with free allocation and with auctioning
Scenario Emissions
control instrument
Instrument adjustments over time
Share of total allowances auctioned Benchmark trajectory
ETS Emissions
trading system
0% Same benchmark tightening in both ETS scenarios ETS
Auctioning
2020 2025 2030 2035
0% 10% 30% 50%
Auctioning prompts stronger emissions reductions under a comparable allowance price
As China’s ETS is designed as an output-based instrument, the total number of allowances in the system depends on the actual output of entities and on the ETS’s benchmark values. Thus, emissions are subject not to a fixed but flexible allowance cap (Goulder et al., 2020). Under this design, introducing allowance auctioning into the ETS would significantly reduce future emissions levels. Contrary to free allocation, which requires only entities with an allowance deficit to make costly allowance purchases, auctioning requires more allowances in the system to be bought, raising the effective carbon cost for ETS participants and further discouraging high-emitting generation. Substantial emissions cuts could be achieved as a result, even if the allowance price remains the same as under free allocation.
Phasing in allowance auctioning in increments beginning in 2025 could cause carbon emissions from electricity generation to peak well before 2030 and at a slightly lower level than under free allowance allocation. As the share of auctioned allowances increases from 10% to 30% by 2030 and to 50% by 2035, annual emissions reductions under auctioning surpass achievements under free allocation by about 180 Mt CO2 in 2030 and 500 Mt CO2 from 2035, nearly doubling the total reductions attained under the No-Carbon-Pricing Scenario. As a result, CO2 emissions from electricity generation fall below the 2020 level by 2035, which is not the case under free allocation. At the same time, the allowance price stays at around CNY 180/t CO2 in 2025 and CNY 340-360/t CO2 between 2030 and 2035, the same as under an ETS with free allowance allocation (Figure 3.1).

The Role of China’s ETS in Power Sector Decarbonisation Chapter 3 Allowance auctioning drives deeper power sector decarbonisation
PAGE | 67
IEA
. All
right
s re
serv
ed.
Figure 3.1 CO2 emissions from electricity generation and allowance price by scenario, 2020-2035
IEA. All rights reserved.
Auctioning could accelerate the switch from coal to gas and renewables
Implementing allowance auctions would make renewables-, nuclear- and gas-based technologies considerably more competitive with coal-fired power plants. As a result, coal-fired power shares in electricity capacity and the generation mix would drop while non-fossil sources and gas-fired power take over.
Auctioning would limit the construction of new coal-fired plants and accelerate the retirement of less-efficient ones, reducing net additions of coal-fired capacity between 2025 and 2030 to less than 30 GW, compared with 50 GW under free allowance allocation. As a result, coal-fired capacity would peak between 2030 and 2035 at a lower level than under free allocation. With auctioning, new ultra-supercritical plants could still be built, but installations during 2030-2035 are reduced to about 25% of the capacity constructed under free allocation, and slightly more sub- and supercritical power plants would be decommissioned.
Auctioning would also impact CCUS uptake. Up to 2030, moderate auctioning and free allowance allocation yield a similar number of CCUS-equipped installations. However, the introduction of auctioning would reduce the number of allowances allocated for free, and thus reduce their surplus. Between 2030 and 2035, as the share of allowance auctioning increases, CCUS-equipped capacity installations continue, but would be 23% lower than under free allocation (Figure 3.2). This capacity development is mirrored in electricity generation: with the gradual phasing in of auctioning, the share of unabated coal-
0
1 000
2 000
3 000
4 000
5 000
2020 2025 2030 2035
Mt C
O2
CO₂ emissions from electricity generation
No-Carbon-Pricing ETS ETS Auctioning
0
100
200
300
400
2020 2025 2030 2035
CN
Y/tC
O2
Allowance price

The Role of China’s ETS in Power Sector Decarbonisation Chapter 3 Allowance auctioning drives deeper power sector decarbonisation
PAGE | 68
IEA
. All
right
s re
serv
ed.
fired power in the electricity mix drops from 62% in 2020 to 38% in 2035, compared with 47% under free allowance allocation.
Figure 3.2 Capacity changes by coal-fired power technology in the ETS and ETS Auctioning scenarios, 2020-2035
IEA. All rights reserved.
Note: CFB = circulating fluidised bed.
While auctioning accelerates the decommissioning of coal-based plants, gas-fired and non-fossil capacities increase. In the ETS Scenario with free allowance allocation, 4 GW of additional gas-fired power capacity are installed on average annually between 2020 and 2035. Allowance auctioning from 2025 onwards almost triples gas-fired capacity additions between 2030 and 2035, such that the gas-fired generation share more than doubles to 9% between 2025 and 2035 in the ETS Auctioning Scenario and remains at 4% in the ETS Scenario.
The role of non-fossil technologies, particularly variable renewable energy (VRE) such as wind and solar power, becomes more important as the share of auctioned allowances increases. At a moderate share, about 4% more capacity is installed by 2035 than under free allowances. In both scenarios, the share of non-fossil technologies in the capacity mix exceeds 60% by 2035, while VRE capacity expands to about 40%. Auctioning also has a stronger impact on electricity generation from VRE sources. While both ETS scenarios lead to a VRE generation share of about 17% in 2030, auctioning 50% of the allowances by 2035 increases VRE generation to 23% in 2035, compared with 19% under free allocation (Figure 3.3). This rise in VRE shares would likely move China from Phase 2 to a higher level of system integration of renewables, implying that better and more flexible grid management, enhanced interprovincial electricity trading and the deployment of emerging power system technologies will be needed.
- 200
- 100
0
100
200
2020-2025 2025-2030 2030-2035 2020-2025 2025-2030 2030-2035ETS ETS Auctioning
Cap
acity
cha
nge
(GW
)
Coal+CCS
Ultra-supercritical
Supercritical
Subcritical
High-pressure
CFB

The Role of China’s ETS in Power Sector Decarbonisation Chapter 3 Allowance auctioning drives deeper power sector decarbonisation
PAGE | 69
IEA
. All
right
s re
serv
ed.
Figure 3.3 Electricity generation by technology in the ETS and ETS Auctioning scenarios, 2020-2035
IEA. All rights reserved.
Further, the increased influence of non-fossil technologies can significantly reduce the power sector’s carbon intensity: moderate auction shares can cut it by 38% from 2020 to 2035, i.e. to less than 340 g CO2/kWh or about 10% below the level obtained under the ETS Scenario with free allocation. Overall, allowance auctioning can further decarbonise electricity production by accelerating the shift from coal- to gas-fired and non-fossil generation. Nonetheless, the pace of power sector transition depends crucially on the share of allowances auctioned: the higher the share, the faster the pace.
Figure 3.4 illustrates how different factors can contribute additional emissions reductions in the ETS and ETS Auctioning Scenarios compared with the No-Carbon-Pricing Scenario. Passing from free allocation to auctioning does not further increase the potential for additional CO2 savings through technology efficiency improvements or switching to more efficient coal-fired power plants, and it slightly reduces the future role of coal + CCS. However, auctioning reduces emissions significantly through fuel switching: it triggers an additional 300 Mt CO2 of emissions reductions by prompting a move to non-fossil technologies and strongly curbs emissions through coal-to-gas switching. By 2035, the switch to non-fossil technologies and to gas-fired power are the two most important factors for additional emissions savings in the ETS Auctioning Scenario.
0%
20%
40%
60%
80%
100%
2020 2025 2030 2035 2025 2030 2035
ETS ETS Auctioning
Solar
Wind
Hydro
Biomass
Nuclear
Gas
Coal+CCS
Coal

The Role of China’s ETS in Power Sector Decarbonisation Chapter 3 Allowance auctioning drives deeper power sector decarbonisation
PAGE | 70
IEA
. All
right
s re
serv
ed.
Figure 3.4 Factors yielding additional emissions reductions in the ETS and ETS Auctioning scenarios compared with the No-Carbon-Pricing Scenario, 2025-2035
IEA. All rights reserved.
Balancing costs and revenues of allowance auctions An important argument for using auctioning as an allowance allocation mechanism is that it creates new revenue streams. However, auctioning could also result in higher total system costs if carbon costs and investment requirements increase. Gradually raising the share of auctioned allowances from 2025 onwards would generate new annual revenues of CNY 435 billion by 2030 and CNY 685 billion by 2035, which would counterbalance a considerable portion of the increase in total system costs (Figure 3.5).
Figure 3.5 Revenues and additional system costs from auctioning, 2025-2035
IEA. All rights reserved.
Note: Additional system costs reflect the difference between the ETS Auctioning Scenario and the No-Carbon-Pricing Scenario.
-1 200
-1 000
- 800
- 600
- 400
- 200
02025 2030 2035 2025 2030 2035
ETS ETS Auctioning
Mt C
O2
Switch from fossil to non-fossiltechnologies
Coal-to-gas switch
Switch from unabated coal tocoal+CCS
Switch from less- to more-efficient coal technologies
Technology efficiencyimprovements
0 100 200 300 400 500 600 700 800 900
2035
2030
2025
Billion CNY
Revenues fromauctioning
Additionalsystem costs

The Role of China’s ETS in Power Sector Decarbonisation Chapter 3 Allowance auctioning drives deeper power sector decarbonisation
PAGE | 71
IEA
. All
right
s re
serv
ed.
Additional system costs are reflected in the average electricity cost, which could affect electricity tariffs. While the unit electricity cost is remarkably stable at CNY 0.33/kWh under an ETS with free allocation, it increases by 20% to CNY 0.39/kWh in 2035 with partial allowance auctioning. In both ETS scenarios, fuel costs including subsidies make up the largest component (38%) of the unit electricity cost until 2025 and are thereafter surpassed by capital costs due to higher investment requirements to transition to a lower-carbon capacity mix. Under free allocation, participants’ total allowance surpluses and deficits balance out, but the ETS drives CO2 emissions reductions through the allowance price, and system costs rise slightly. With auctioning, the CO2 cost contribution increases with the share of allowances auctioned, from only 3% of the unit electricity cost (CNY 0.009/kWh) in 2025 to 15% (CNY 0.06/kWh) in 2035 (Figure 3.6).
Figure 3.6 Unit electricity cost by cost component in the ETS Auctioning Scenario and total unit electricity cost in the ETS Scenario, 2020-2035
IEA. All rights reserved.
Note: O&M = operation and maintenance.
Overall, implementing allowance auctioning by introducing moderate auction shares of 10% in 2025, 30% in 2030 and 50% in 2035 can achieve greater emission reductions more rapidly. Gradually introducing auctions accelerates power system decarbonisation slightly while balancing additional system costs and new revenues as well as controlling unit electricity cost increases.
The power sector is sensitive to the pace and extent of allowance auctioning. While introducing higher allowance auction shares could expedite the shift to lower-carbon sources, it may trigger additional cost increases. Further assessment will therefore be needed to optimise the implementation pace of auctioning to balance cost increases with climate change mitigation gains.
0.0
0.1
0.2
0.3
0.4
2020 2025 2030 2035
CN
Y/kW
h
CO₂ costs
Other costs
O&M costs
Fuel costs
Capital costs
Total unitelectricity cost,ETS Scenario

The Role of China’s ETS in Power Sector Decarbonisation References
PAGE | 72
IEA
. All
right
s re
serv
ed.
References
ACCA21 (Administrative Center for China's Agenda 21)/MOST (Ministry of Science and Technology) (2019), Roadmap for Carbon Capture, Utilisation and Storage Technology in China.
CCCPC (Central Committee of the Communist Party of China) and State Council (2015), 关于
进一步深化电力体制改革的若干意见(中发 9 号)[Opinions on Further Deepening the Reform of Power System (Document No. 9)], https://shupeidian.bjx.com.cn/html/20150410/606700.shtml.
CEC (China Electricity Council) (2016), China Electricity Industry Development Annual Report 2016.
CMA (China Meteorological Administration) (2016), 中国太阳能资源辐射总量空间分布 [Spatial distribution of total solar energy radiation in China], http://data.cma.cn/.
Energy Foundation China (2020), China’s New Growth Pathway: From the 14th Five-Year Plan to Carbon Neutrality, https://www.efchina.org/Reports-en/report-lceg-20201210-en.
EPPEI (Electric Power Planning and Engineering Institute) and CREEI (China Renewable Energy Engineering Institute) (2017), Cost of Electric Power Projects during 12th Five Year Period, http://news.bjx.com.cn/html/20171024/857253.shtml.
Fan, J. et al. (2019), Comparison of the LCOE between coal-fired power plants with CCS and main low-carbon generation technologies: Evidence from China, Energy, Vol. 176, Elsevier Ltd, https://doi.org/10.1016/j.energy.2019.04.003.
GCCSI (Global Carbon Capture and Storage Institute) (2019), Global Status Report 2019, https://www.globalccsinstitute.com/resources/global-status-report/.
Goulder, L. et al. (2020), China’s Unconventional Nationwide CO2 Emissions Trading System: The Wide-Ranging Impacts of an Implicit Output Subsidy, https://www.rff.org/documents/2331/RFF_WP_20-02.pdf.
Guo, H. et al. (2020), Power market reform in China: Motivations, progress, and recommendations, Energy Policy, Vol. 145, Elsevier Ltd, https://doi.org/10.1016/j.enpol.2020.111717.
Hand, M. et al. (2016), 2016 Annual Technology Baseline, National Renewable Energy Laboratory, https://data.nrel.gov/submissions/52.
IEA (International Energy Agency) (2020a), China’s Emissions Trading Scheme: Designing Efficient Allowance Allocation, https://webstore.iea.org/china-emissions-trading-scheme.
IEA (2020b), World Energy Balances and Statistics, https://www.iea.org/subscribe-to-data-services/world-energy-balances-and-statistics.
IEA (2020c), CO2 emissions statistics (database), https://www.iea.org/subscribe-to-data-services/co2-emissions-statistics.
IEA (2020d), Global Energy Review 2020, https://webstore.iea.org/global-energy-review-2020.

The Role of China’s ETS in Power Sector Decarbonisation References
PAGE | 73
IEA
. All
right
s re
serv
ed.
IEA (2020e), Covid-19 impact on electricity, https://www.iea.org/reports/covid-19-impact-on-electricity.
IEA (2020f), Energy Technology Perspectives 2020: Special Report on Clean Energy Innovation, https://webstore.iea.org/energy-technology-perspectives-2020-special-report-on-clean-energy-innovation.
IEA (2020g), Introduction to System Integration of Renewables, https://www.iea.org/reports/introduction-to-system-integration-of-renewables.
IEA (2020h), ETP Clean Energy Technology Guide, https://www.iea.org/articles/etp-clean-energy-technology-guide.
IEA (2020i), CCUS in Clean Energy Transitions, https://www.iea.org/reports/ccus-in-clean-energy-transitions.
IEA (2020j), Implementing Effective Emissions Trading Systems: Lessons from international experiences, https://www.iea.org/reports/implementing-effective-emissions-trading-systems.
IEA (2019a), World Energy Outlook 2019, https://www.iea.org/reports/world-energy-outlook-2019.
IEA (2019b), The Role of Gas in Today’s Energy Transitions, https://webstore.iea.org/the-role-of-gas-in-todays-energy-transitions.
IEA (2019c), China Power System Transformation, https://webstore.iea.org/china-power-system-transformation.
IEA (2016), Ready for CCS Retrofit, https://www.iea.org/reports/ready-for-ccs-retrofit.
IEAGHG (IEA Greenhouse Gas R&D Programme) (2018), Information paper 2018-36: Update on the Shand Power Station CCS Feasibility Study by the International CCS Knowledge Centre, https://ieaghg.org/ccs-resources/information-papers.
IPCC (Intergovernmental Panel on Climate Change) (2006), Guidelines for National Greenhouse Gas Inventories, IGES, https://www.ipcc.ch/report/2006-ipcc-guidelines-for-national-greenhouse-gas-inventories/.
Jiang, K. et al. (2020), China’s carbon capture, utilization and storage (CCUS) policy: A critical review, Renewable and Sustainable Energy Reviews, Vol. 119, Elsevier Ltd, https://doi.org/10.1016/j.rser.2019.109601.
MEE (Ministry of Ecology and Environment) (2021), 碳排放权交易管理办法(试行)[Interim Rules for Carbon Emissions Trading Management], http://www.mee.gov.cn/xxgk2018/xxgk/xxgk02/202101/t20210105_816131.html.
MEE (2020a), 2019-2020 年全国碳排放权交易配额总量设定与分配实施方案(发电行业) [2019-2020 Implementation Plan for National Carbon Emissions Trading Total Allowances Setting and Allocation (Power Sector)], http://www.mee.gov.cn/xxgk2018/xxgk/xxgk03/202012/W020201230736907121045.pdf
MEE (2020b), 2019-2020 年全国碳排放权交易配额总量设定与分配实施方案(发电行业)(征
求意见稿) [2019-2020 Implementation Plan for National Carbon Emissions Trading Total Allowances Setting and Allocation (Power Sector) (draft for consultation)], http://www.mee.gov.cn/xxgk2018/xxgk/xxgk06/202011/W020201120747768825771.pdf

The Role of China’s ETS in Power Sector Decarbonisation References
PAGE | 74
IEA
. All
right
s re
serv
ed.
MEE (2020c), 纳入 2019-2020 年全国碳排放权交易配额管理的重点排放单位名单 [List of entities covered by 2019-2020 National Carbon Emissions Trading Allowance Management], http://www.mee.gov.cn/xxgk2018/xxgk/xxgk03/202012/W020201230736907682380.pdf
MEE (2019), 2019 年发电行业重点排放单位(含自备电厂、热电联产)二氧化碳排放配额分配
实施方案(试算版) [2019 Implementation Plan of Carbon Dioxide Emission Allowance Allocation for Key Emission Units of Power Generation Sector (Trial)], http://www.mee.gov.cn/xxgk2018/xxgk/xxgk06/201909/W020190930789281533906.pdf
MoFA (Ministry of Foreign Affairs) (2020), Xi Jinping addresses Climate Ambition Summit, https://www.fmprc.gov.cn/mfa_eng/zxxx_662805/t1840220.shtml.
NBS (National Bureau of Statistics) (2020), National Monthly Data, https://data.stats.gov.cn/english/easyquery.htm?cn=A01 (accessed 1 October 2020).
NDRC (National Development and Reform Commission) (2020), 2020 年煤电化解过剩产能工
作要点 [Key tasks for resolving coal-fired power overcapacity in 2020], http://www.gov.cn/zhengce/zhengceku/2020-06/19/5520429/files/13fa9f8ba8e24ba6b3626c01419bf1b3.pdf.
NDRC and NEA (National Energy Administartion) (2019), 关于深化电力现货市场建设试点工作
的意见 [Opinions on Deepening the Pilot Work of Power Spot Market Construction], https://www.ndrc.gov.cn/xxgk/zcfb/ghxwj/201908/t20190807_960970.html.
NDRC and NEA (2016a), 能源发展"十三五"规划 [13th Five-Year Plan for Energy Development], http://www.nea.gov.cn/2017-01/17/c_135989417.htm.
NDRC and NEA (2016b), 电力发展“十三五”规划 [13th Five-Year Plan for Electricity Power Development], https://zfxxgk.ndrc.gov.cn/web/iteminfo.jsp?id=398.
NEA (2021), 2020 年全社会用电量同比增长 3.1%---国家能源局 [2020 total electricity consumption increased by 3.1% year-on-year], http://www.nea.gov.cn/2021-01/20/c_139682386.htm.
NEA (2020), 国家能源局 2020 年一季度网上新闻发布会文字实录---国家能源局 [Transcript of the online press conference of the National Energy Administration in the first quarter of 2020], http://www.nea.gov.cn/2020-03/06/c_138850234.htm.
Ravn, H.F. (2001), The Balmorel Model: Theoretical Background, http://www.balmorel.com/images/downloads/the-balmorel-model-theoretical-background.pdf.
Rienecker, M.M. et al. (2011), MERRA: NASA’s modern-era retrospective analysis for research and applications, Journal of Climate, Vol. 24, No. 14, pp. 3624-48, American Meteorological Society, https://doi.org/10.1175/JCLI-D-11-00015.1.
State Council (2002), 电力体制改革方案(国发 5 号)[Power System Reform Scheme (Document No. 5)], http://www.gov.cn/zhengce/content/2017-09/13/content_5223177.htm.
Yang, Y. et al. (2018), Regional power system modeling for evaluating renewable energy development and CO2 emissions reduction in China, Environmental Impact Assessment Review, Vol. 73, pp. 142–151, Elsevier Inc., https://doi.org/10.1016/j.eiar.2018.08.006.

The Role of China’s ETS in Power Sector Decarbonisation General annex
PAGE | 75
IEA
. All
right
s re
serv
ed.
General annex
Annex A - REPO model and modelling work A.1 Introducing the REPO model
The Renewable Electricity Planning and Operation (REPO) model is a capacity expansion and dispatch model for China’s power system. It is disaggregated at the provincial level and extends the open-source Balmorel model (Ravn, 2001) while incorporating important technology and policy characteristics particular to China (Yang et al., 2018).
The model integrates an endogenous capacity expansion module and applies an objective function to minimise the discounted total cost of the power system. The total power system cost comprises capacity investment costs, operations and maintenance costs, fuel expenses, unit commitment costs, transmission costs and taxes and subsidies. The REPO model covers China’s 32 provincial-level administrative divisions (Figure A.1).18 These 32 areas can be grouped into six major grid regions, the northeast grid (NEG), the northwest grid (NWG), the north grid (NG), the central grid (CG), the east grid (EG), and the south grid (SG) (Table A.1). Electricity and heat demand, resource potential, existing power and co-generation 19 installations and existing transmission capacity are all represented at the provincial level.
The model takes 2015 as the base year and then iterates to 2050 in five-year increments. In each iteration, the model optimises capacity expansion and grid operations for one year. Within that year, the model selects 12 out of 52 weeks as representative seasons, and 6 hours of a typical day in each week as representative time slots. These 72 representative hours of a year are simulated for each area and each time period.
The model’s provincial load curve projections to 2035 are generated based on electricity demand changes and the accurate load curves for 2015. The model covers coal-fired, gas-fired, nuclear, hydro, wind, solar and biomass power, and it also includes pumped hydro, compressed air and chemical storage.
18 The special administrative regions of Hong Kong and Macao are not included in this study. Inner Mongolia is disaggregated into Eastern and Western Inner Mongolia. 19 Co-generation refers to the combined production of heat and power.

The Role of China’s ETS in Power Sector Decarbonisation General annex
PAGE | 76
IEA
. All
right
s re
serv
ed.
Figure A.1 REPO model framework
Table A.1 China power sector’s 6 grid regions and REPO model’s 32 provincial areas
Grid region Provinces covered
Northeast grid Heilongjiang, Jilin, Liaoning, Eastern Inner Mongolia
Northwest grid Shaanxi, Gansu, Qinghai, Ningxia, Xinjiang, Tibet
North grid Hebei, Beijing, Tianjin, Shanxi, Shandong, Western Inner Mongolia
Central grid Hubei, Hunan, Jiangxi, Chongqing, Sichuan, Henan
East grid Shanghai, Jiangsu, Anhui, Fujian, Zhejiang
South grid Guangdong, Guangxi, Guizhou, Hainan, Yunnan
The REPO model’s important constraints are: power balance constraints, power generation constraints, renewable energy resource constraints, transmission constraints and storage constraints. The power balance constraints ensure that power generation plus net imports equal power demand and losses, while power generation constraints ensure that the power generation of each technology at each hour does not exceed its capacity. As power generation from variable renewable energy (VRE) resources such as run-of-river hydro, wind (Rienecker et al., 2011) and solar (CMA, 2016) is also limited by resource availability, the renewable energy resource constraints ensure that each VRE technology’s generation does not exceed its resource limit. The resource limit comprises two aspects: full-load hours and the maximum generation profile for each renewable generator in each region. For each VRE technology, generation is limited to the

The Role of China’s ETS in Power Sector Decarbonisation General annex
PAGE | 77
IEA
. All
right
s re
serv
ed.
product of its full-load hours, installed capacity and share of total maximum generation for one time segment. With the model recognising all interprovincial transmission lines of more than 220 V, its transmission constraints ensure that the amount of power transported from one region to another does not exceed the transmission capacity between the two regions. The storage constraints ensure that the charging and discharging rate of each storage technology does not exceed its power capacity and that energy storage does not exceed its energy capacity.
The REPO model computes the future capacity expansion and power generation of each technology in each province, in addition to its CO2 emissions. These data are used to analyse the effects of ETS policies on the power system.
To better represent thermal power technologies in the REPO model, we disaggregated coal-fired and gas-fired power into additional subcategories. Each technology is described by several parameters, including its efficiency, installation costs, fixed operations and maintenance (O&M) costs, variable O&M costs, lifespan, typical size, ramping up/down rate, startup/shut-down costs, and minimum load share. Coal-fired power technologies are disaggregated into seven detailed categories: ultra-supercritical; supercritical 600 MW; supercritical 300 MW; subcritical 600 MW; subcritical 300 MW; high-pressure and ultra-high-pressure; and circulating fluidised bed (CFB). Gas-fired power technologies are divided into two categories: F-class and below F-class.
An ETS module is built into the REPO model to describe the national ETS. The technologies involved in the national ETS and their benchmarks are described in the model, with only coal- and gas-fired power technologies covered by the national ETS from 2020. Benchmark values are defined by technology and year. Some equations and constraints have been integrated into the ETS module to represent the allowance allocation rules.
A.2 Key data inputs and assumptions After classifying coal- and gas-fired power plants into their subcategories, the capacity for each technology for base year 2015 was verified by aggregating unit-level data and matching it with provincial data from the China Electricity Council (CEC). Uncategorised power units for which the technology cannot be identified are defined as follows:
• For gas-fired power units, they are considered as “below F-class”.
• For coal-fired power units below 300 MW, they are classified as “high-pressure and ultra-high-pressure”.

The Role of China’s ETS in Power Sector Decarbonisation General annex
PAGE | 78
IEA
. All
right
s re
serv
ed.
• For coal-fired power units above 300 MW, they are defined as “subcritical 300 MW”.
Total coal-fired power capacity in 2015 was 900 GW, made up of 17% ultra-supercritical; 20% supercritical 600 MW; 4% supercritical 300 MW; 11% subcritical 600 MW; 29% subcritical 300 MW; 13% high-pressure and ultra-high-pressure; and 5% CFB technologies. Total gas-fired power capacity in 2015 was 66 GW, with F-class accounting for 63% and below F-class making up 37%.
The model uses 2015 as the base year and then iterates in five-year increments to assess potential ETS impacts up to 2035. Investments in future power technologies are optimised, and units are assumed to retire upon reaching the end of their operational lifetime for most technologies. For coal-fired plants, early retirement strategies could be activated when the fleet’s average running hours fall below a predefined threshold. Simulations for 2020 have been strongly calibrated based on 2019 statistics and the 13th FYP targets.
Technology cost assumptions are based on several sources, including CEC data (CEC, 2016), Cost of Electric Power Projects (EPPEI and CREEI, 2017), World Energy Outlook 2019 (IEA, 2019a), China Power System Transformation (IEA, 2019c), and an NREL study (Hand et al., 2016). The O&M costs for different technologies are adopted from the NREL report.
Table A.2 Cost assumptions by technology
Capital costs (CNY/W)
Variable O&M costs
(CNY/MWh)
Fixed O&M costs (CNY/kW-yr)
2015 2020 2035
Coal 3.7-4.5 3.3 3.1 31 214
Coal+CCS 23 21 18 58 449
Gas 2.7-3.1 2.6 2.5 23 96
Biomass 12 10.8 9.9 35 712
Nuclear 13.1 18.6 16.9 14 629
Hydro 7.5 10 10 0 203-268
Wind onshore 8.1 7.2 6.8 0 340
Wind offshore 16 13 11 0 881
Solar PV 8.1 6.1 5.3 0 106
CSP - 29.8 22.4 27 438
Notes: CSP = concentrated solar power. Variable O&M costs do not include fuel expenses, which are classified in the model as a separate cost component.

The Role of China’s ETS in Power Sector Decarbonisation General annex
PAGE | 79
IEA
. All
right
s re
serv
ed.
Coal and gas prices vary among China’s regions. Coal prices in Xinjiang, Eastern Inner Mongolia and Western Inner Mongolia are the lowest, followed by Ningxia and Shanxi, while in other regions they are relatively high and can be more than double the Xinjiang price (Table A.3). Gas prices in Xinjiang and Qinghai are relatively low compared with other regions of China.
Table A.3 Coal price assumptions by provincial area, 2020 and 2035
Region Coal price in 2020 (CNY/GJ) Coal price in 2035 (CNY/GJ)
Xinjiang 12 13.3
Eastern Inner Mongolia 12 13.3
Western Inner Mongolia 13 14.3
Ningxia 17 18.3
Shanxi 17 18.3
Others ≥21 >22
The transmission cost contains two components: transmission line installation costs and O&M costs. The cost of installing transmission lines between two regions includes set costs related to capacity (CNY 1.5 million/MW) and to distance (CNY 1 000/[MW*km]). The annual O&M cost is set at 3% of the transmission line installation cost.
The fuel CO2 factor is a key factor for the ETS (Table A.4). This study assumes that all units will be monitoring their fuel factor, which may be optimistic for 2020 but it is expected to be realistic by 2025. As bituminous coal is the main type of coal used for electricity generation, this study uses 95 kg CO2/GJ as the recommended factor for coal, based on IPCC 2006 guidelines for the average monitored fuel factor of “other bituminous coal”. Meanwhile, the analysis takes 56.8 kg CO2/GJ as the fuel factor for gas.

The Role of China’s ETS in Power Sector Decarbonisation General annex
PAGE | 80
IEA
. All
right
s re
serv
ed.
Table A.4 Fuel CO2 factors as per IPCC 2006
Coal type Default carbon content (kg C/GJ)
Default carbon oxidation factor
Fuel CO2 factor (kg CO2/GJ)
Anthracite 26.8 100% 98
Coking coal 25.8 100% 95
Other bituminous coal 25.8 100% 95
Sub-bituminous coal 26.2 100% 96
Lignite 27.6 100% 101
Brown coal briquettes 26.6 100% 98
Coke 29.2 100% 107
Renewables deployment, which is a key priority of China’s energy strategy, has been driven by capacity targets and technology support policies. Capacity growth was approximately 100 GW for wind and 200 GW for solar during the 13th FYP period. Minimum levels of installed capacity are assumed for wind and solar from 2025 to 2035 for all scenarios, based on 13th FYP growth trends (Table A.5).20 The assumptions do not aim to project future capacity targets.
Table A.5 Assumptions of minimum capacity levels for wind and solar PV
2025 2030 2035
Wind 310 GW 410 GW 510 GW
Solar PV 430 GW 630 GW 830 GW
20 The assumptions were made before China announced it would be enhancing its climate ambition and NDC commitments. The assumptions do not aim to project future targets, but set baseline values for evaluating ETS effects and contributions.

The Role of China’s ETS in Power Sector Decarbonisation General annex
PAGE | 81
IEA
. All
right
s re
serv
ed.
Abbreviations and acronyms CCER Chinese Certified Emission Reduction CCTD China Coal Transportation and Distribution Association CCS carbon capture and storage CCUS carbon capture, utilisation and storage CDM Clean Development Mechanism CEC China Electricity Council CFB circulating fluidised bed CG central grid CSP concentrated solar power EG east grid ETS emissions trading system EU European Union FIT feed-in tariff FYP Five-Year Plan IEA International Energy Agency IPCC Intergovernmental Panel on Climate Change LCOE levelised cost of electricity MEE Ministry of Ecology and Environment NDC Nationally Determined Contribution NDRC National Development and Reform Commission NEA National Energy Administration NEG northeast grid NG north grid NPS New Policies Scenario NREL National Renewable Energy Laboratory NWG northwest grid O&M operation and maintenance PV photovoltaic R&D research and development RD&D research, development and demonstration REPO Renewable Electricity Planning and Operation SDS Sustainable Development Scenario SG south grid STEPS Stated Policies Scenario UNFCCC United Nations Framework Convention on Climate Change VRE variable renewable energy WEO World Energy Outlook

The Role of China’s ETS in Power Sector Decarbonisation General annex
PAGE | 82
IEA
. All
right
s re
serv
ed.
Glossary CO2 carbon dioxide g gramme gce/kWh gramme of standard coal equivalent per kilowatt hour GJ gigajoule Gt CO2 gigatonne of carbon dioxide GW gigawatt kg kilogramme kWh kilowatt hour Mt CO2 million tonnes of carbon dioxide MW megawatt MWh megawatt hour t tonne TWh terawatt hour CNY Chinese Yuan renminbi
(This report uses the 2019 annual average exchange rate: USD 1 = CNY 6.91. Source: OECD National Accounts Statistics: purchasing power parities and exchange rates dataset, July 2020.)
USD US dollar

The IEA examines the full spectrum of energy issues including oil, gas and coal supply and demand, renewable energy technologies, electricity markets, energy efficiency, access to energy, demand side management and much more. Through its work, the IEA advocates policies that will enhance the reliability, affordability and sustainability of energy in its 30 member countries, 8 association countries and beyond.
Please note that this publication is subject to specific restrictions that limit its use and distribution. The terms and conditions are available online at www.iea.org/t&c/
This publication and any map included herein are without prejudice to the status of or sovereignty over any territory, to the delimitation of international frontiers and boundaries and to the name of any territory, city or area.
Source: IEA. All rights reserved.International Energy Agency Website: www.iea.org
IEA member countries:
Australia Austria BelgiumCanadaCzech Republic DenmarkEstoniaFinland France Germany Greece HungaryIreland ItalyJapanKorea Luxembourg Mexico Netherlands New Zealand NorwayPoland Portugal Slovak Republic Spain Sweden Switzerland Turkey United Kingdom United States
The European Commission also participates in the work of the IEA
IEA association countries:
BrazilChinaIndiaIndonesiaMoroccoSingaporeSouth AfricaThailand
INTERNATIONAL ENERGYAGENCY

Institute of Energy, Environment and Economy, Tsinghua University
Institute of Energy, Environment and Economy, Tsinghua University (3E), established in 1980, is an interdisciplinary research and education institute at Tsinghua. The institute's mission is to create, develop and disseminate the knowledge, ideas, and methodologies crucial for building sustainable energy systems, mitigating climate change mitigation for China and the world.
Our focus area includes:
Energy and climate change modeling Energy strategy and planning Climate and environmental policy evaluation Mechanisms for international cooperation to mitigate climate change
As an important think tank for energy and climate change research, the institute has been continuously providing policy advisory services to the National Development and Reform Commission (NDRC), the Ministry of Ecology and Environment (MEE), and the National Energy Administration (NEA). The institute has long-time collaborations with prestigious universities and international organizations.

This publication reflects the views of the IEA Secretariat but does not necessarily reflect those of individual IEA member countries. The IEA makes no representation or warranty, express or implied, in respect of the publication’s contents (including its completeness or accuracy) and shall not be responsible for any use of, or reliance on, the publication. Unless otherwise indicated, all material presented in figures and tables is derived from IEA data and analysis.
This publication and any map included herein are without prejudice to the status of or sovereignty over any territory, to the delimitation of international frontiers and boundaries and to the name of any territory, city or area.
IEA. All rights reserved.IEA PublicationsInternational Energy Agency Website: www.iea.orgContact information: www.iea.org/about/contact
Typeset in France by IEA - April 2021Cover design: IEAPhoto credits: © Shutterstock