
The Role of CEO Compensation in the Cost of Debt ...dspace.stir.ac.uk/bitstream/1893/3024/3/The role...
152
The Role of CEO Compensation in the Cost of Debt, Expectations Management, and the Investment Policy of UK Firms Hao Li Division of Accounting and Finance Stirling Management School University of Stirling Scotland United Kindom Thesis submitted for the degree of Doctor of Philosophy in Finance University of Stirling November 2010
-
Upload
vuonghuong -
Category
Documents
-
view
214 -
download
0
Transcript of The Role of CEO Compensation in the Cost of Debt ...dspace.stir.ac.uk/bitstream/1893/3024/3/The role...

The Role of CEO Compensation in the
Cost of Debt, Expectations Management,
and the Investment Policy of UK Firms
Hao Li
Division of Accounting and Finance
Stirling Management School
University of Stirling
Scotland
United Kindom
Thesis submitted for the degree of Doctor of Philosophy in Finance
University of Stirling
November 2010
i
Acknowledgements
This thesis is the outcome of my Ph.D. research with helps from so many kindly people.
First of all, I would like to thank Accounting and Finance Division in University of
Stirling. Its generous scholarship offered me precious financial supports and
opportunities to engage in my interested research and teaching activities. The greatest
thanks are for my three supervisors: Dr. Yulia Veld-Merkoulova, Professor Rezaul
Kabir and Dr. Isaac Tabner. Their constructive guidance, timely feedback and dedicated
supports are main powers I rely on to produce this thesis. I‟m also very grateful to the
external examiner, Professor Martin Conyon and the internal examiner, Dr. Khaled
Hussainey. Their comments and suggestions are very helpful to improve this thesis.
This thesis benefits greatly from presentations in several conferences and seminars.
Chapter 2 is based on a working paper <Executive Compensation and the Cost of Debt>
(SSRN Working Paper ID: 1537318) with co-authors of Professor Rezaul Kabir and
Dr.Yulia-Merkoulova. It was presented in 2010‟ Finance and Corporate Governance
Conference in Melbourne, 2010‟ British Accounting Association (BAA) Scottish Area
Group Annual Conference in Glasgow and 2010‟ Financial Management Association
(FMA) Annual Conference in New York. The study in Chapter 3 <CEO Compensation
and Expectations Management> was presented in British Accounting Association
(BAA) Annual Doctoral Colloquiums in Blackpool (2008‟) and Dundee (2009‟).
This thesis is dedicated to my mother Defen Chen and father Shucai Li. Their love and
continuous encouragement are vital. Very special thanks go to my loved wife, Qing
Zhan. Thanks for her accompany and supports during this period of my study in
Edinburgh and Stirling.

ii
Abstract
In this thesis, I explore the topic of chief executive officer (CEO) compensation in UK
publicly traded firms. My objective is threefold. First of all, I investigate debt-holders‟
reaction to CEO compensation in terms of the cost of debt financing. Secondly, I
examine the possible link between CEO compensation and expectation management.
Thirdly, I examine whether and how the interactive relation between CEO career
horizon and compensation package affects a firm‟s research and development spending.
Multiple regression is employed in this thesis to investigate the causal relationship
between these above mentioned aspects I‟m interested (the cost of debt, expectation
management and research and development spending) and CEO compensation. I
consider all major compensation components for a typical CEO in UK publicly traded
firms: defined benefit pension, bonus, restricted shares, traditional stock options and
performance-vested stock options. The accumulated equity incentives, such as
ownership, are also examined.
My major findings are as follows. First of all, I find that an increase in defined benefit
pension and bonus in CEO compensation are associated with a lower bond yield spread,
while an increase in stock options and ownership intensifies it. Secondly, I document
that CEO equity incentives that will be vested in the following year are positively
associated with the probability of employing expectation management to meet or beat
financial analysts‟ forecasts about a firm‟s reporting earnings. Thirdly, I demonstrate
that older CEOs will not spend less in research and development expenditures in
general. However, older CEOs with more defined benefit pensions and ownership are
reluctant to engage in such an investment.

iii
My results generate several implications for CEO compensation research. First of all, I
show that debt-holders rationally incorporate the information of CEO compensation
about risk-taking and risk-avoiding incentives when pricing a firm‟s publicly traded
debts. Secondly, I provide the evidence that CEO compensation motivates top managers
to manipulate information disclosure by employing expectation management for
personal gains. Thirdly, the joint influence of CEO career horizon and compensation
package on a firm‟s research and development spending is highlighted. CEO
compensation motivates a short-sighed and risk-averse investment policy when top
managers have a short career horizon.
The first novel contribution in this thesis is the coverage of CEO pension, which is
overlooked by the most of previous literature on compensation studies. Secondly, I
provide the evidence that the popularity of expectation management in the UK, which is
well documented in the literature, can be partly explained by CEO compensation.
Finally, the interactive relation between CEO compensation and career horizon on a
firm‟s investment policy is re-examined. It provides further material in the debate of
career horizon problem, which has no consensus in the previous literature. Overall, this
thesis generates some empirical evidence about the influence of CEO compensation on
managerial behaviour. Some adverse effects of CEO compensation highlighted in this
thesis may help remuneration committee to design a better pay package for top
managers in the future.
iv
Table of Contents
Chapter 1 Introduction .................................................................................................... 1
1.1. Motivations ............................................................................................................ 1
1.2. Major findings and contributions ........................................................................... 4
1.3. Thesis organization ................................................................................................ 8
Chapter 2 CEO Compensation and the Cost of Debt ...................................................... 9
2.1. Introduction ............................................................................................................ 9
2.2. Literature review .................................................................................................. 12
2.3. Hypotheses development ..................................................................................... 16
2.3.1. Cash bonus .................................................................................................... 16
2.3.2. Pension .......................................................................................................... 17
2.3.3. Stock options ................................................................................................. 20
2.3.4. Comparison between PVSOs and TSOs ....................................................... 20
2.3.5. Comparison between stock options and ownership ...................................... 22
2.3.6. Restricted shares ........................................................................................... 22
2.4. Methodology ........................................................................................................ 23
2.5. Data ...................................................................................................................... 26
2.6. Empirical results .................................................................................................. 35
2.6.1. Cash bonus .................................................................................................... 35
2.6.2. Pension .......................................................................................................... 37
2.6.3. Stock options ................................................................................................. 42
2.6.4 .Comparison between PVSOs and TSOs ....................................................... 44
2.6.5. Comparison between stock options and ownership ...................................... 45
2.6.6. Restricted shares ........................................................................................... 46
2.6.7. Pension and credit quality ............................................................................. 47
2.7. Conclusions .......................................................................................................... 52
Chapter 3 CEO Compensation and Expectations Management ................................... 54
3.1. Introduction .......................................................................................................... 54
3.2. Literature review .................................................................................................. 57
3.2.1. CEO compensation ....................................................................................... 57
3.2.2. Expectations management ............................................................................ 58
3.2.3. CEO compensation and expectations management ...................................... 60
3.3. Hypotheses development ..................................................................................... 61
3.3.1. Cash bonus .................................................................................................... 62
3.3.2. Stock options and restricted shares ............................................................... 64
3.4. Methodology ........................................................................................................ 66
v
3.4.1. Measurement of CEO compensation ............................................................ 66
3.4.2. Measurement of expectations management .................................................. 67
3.4.3. Testing models .............................................................................................. 71
3.5. Data ...................................................................................................................... 72
3.6. Empirical results .................................................................................................. 79
3.6.1. Cash bonus .................................................................................................... 79
3.6.2. Stock options and restricted shares ............................................................... 84
3.6.3. Sensitivity analysis ....................................................................................... 90
3.7. Conclusions .......................................................................................................... 90
Chapter 4 CEO Compensation, Career Horizon and Research and Development
Spending ......................................................................................................................... 93
4.1. Introduction .......................................................................................................... 93
4.2. Literature review and hypotheses development ................................................... 96
4.2.1. Career horizon ............................................................................................... 96
4.2.2. Pension .......................................................................................................... 98
4.2.3. Equity incentives ........................................................................................... 99
4.3. Methodology ...................................................................................................... 103
4.3.1. Measurement of R&D spending ................................................................. 103
4.3.2. Measurement of career horizon .................................................................. 104
4.3.3. Measurement of CEO compensation .......................................................... 104
4.3.4. Testing Models ........................................................................................... 105
4.4. Data .................................................................................................................... 106
4.5. Empirical results ................................................................................................ 112
4.5.1. Career horizon ............................................................................................. 112
4.5.2. Pension ........................................................................................................ 116
4.5.3. Ownership ................................................................................................... 119
4.5.4. Stock options ............................................................................................... 124
4.5.5. Restricted shares ......................................................................................... 127
4.6. Conclusions ........................................................................................................ 130
Chapter 5 Conclusions .................................................................................................. 133
References ..................................................................................................................... 138
Appendix ....................................................................................................................... 145

vi
List of tables and Figures TABLE 2.1 VARIABLES DEFINITIONS .......................................................................................................... 28 TABLE 2.2 SAMPLE SELECTION AND DISTRIBUTION ................................................................................. 30 TABLE 2.3 DESCRIPTIVE STATISTICS .......................................................................................................... 33 TABLE 2.4 CORRELATION MATRIX ............................................................................................................. 34 TABLE 2.5 ANNUAL COMPENSATION AND THE COST OF DEBT ................................................................ 38 TABLE 2.6 ANNUAL COMPENSATION AND THE COST OF DEBT: ALTERNATIVE MEASURE ....................... 40 TABLE 2.7 ACCUMULATED EQUITY INCENTIVES, OWNERSHIP AND THE COST OF DEBT .......................... 49 TABLE 2.8 PENSIONS, CREDIT QUALITY AND THE COST OF DEBT ............................................................. 51 TABLE 3.1 VARIABLES DEFINITIONS .......................................................................................................... 73 TABLE 3.2 SAMPLE SELECTION AND DISTRIBUTION ................................................................................. 75 TABLE 3.3 DESCRIPTIVE STATISTICS .......................................................................................................... 78 TABLE 3.4 CORRELATION MATRIX ............................................................................................................. 81 TABLE 3.5 CEO COMPENSATION AND MEETING OR BEATING THE MARKET EXPECTATIONS................... 82 TABLE 3.6 CEO COMPENSATION AND EARNINGS SURPRISE ..................................................................... 83 TABLE 3.7 CEO COMPENSATION AND EXPECTATIONS MANAGEMENT .................................................... 85 TABLE 3.8 CEO COMPENSATION AND EXPECTATIONS MANAGEMENT UNDER DIFFERENT LEVELS OF
OWNERSHIP ..................................................................................................................................... 89 TABLE 4.1 VARIABLE DEFINITIONS .......................................................................................................... 107 TABLE 4.2 SAMPLE SELECTION AND DISTRIBUTIONS .............................................................................. 109 TABLE 4.3 DESCRIPTIVE STATISTICS ........................................................................................................ 111 TABLE 4.4 CORRELATION MATRIX ........................................................................................................... 113 TABLE 4.5 CEO CAREER HORIZON AND R&D SPENDING ......................................................................... 114 TABLE 4.6 PENSION INCREMENT, CEO CAREER HORIZON, AND R&D SPENDING ................................... 117 TABLE 4.7 PENSION TO EQUITY RATIO, CEO CAREER HORIZON, AND R&D SPENDING .......................... 120 TABLE 4.8 OWNERSHIP, CEO CAREER HORIZON R&D SPENDING ........................................................... 122 TABLE 4.9 STOCK OPTIONS, CEO CAREER HORIZON AND R&D SPENDING ............................................. 125 TABLE 4.10 RESTRICTED SHARES, CEO CAREER HORIZON AND R&D SPENDING .................................... 128 FIGURE 3.1 THEORETICAL LINKS BETWEEN CEO COMPENSATION AND EXPECTATIONS MANAGEMENT . 63 FIGURE 3.2 FREQUENCY DISTRIBUTION OF EARNINGS SURPRISE ............................................................. 76
1
Chapter 1 Introduction
1.1. Motivations
Chief executive officer (CEO) compensation studies have drawn attention from
academics for several decades. As reviewed by Devers, Cannella, Reilly and Yoder
(2007), research on the topic of CEO compensation can be classified into two main
categories. The first group of studies looks at the pay-performance relationship (e.g.
Jensen and Murphy, 1990; Conyon and Peck, 1998; Aggarwal and Samwick, 1999;
Conyon, Peck and Sadler, 2001; Leone, Wu and Zimmerman, 2006; Duffhues and
Kabir, 2008; Ozkan, 2011). These studies mainly investigate the sensitivity between
firm performance and CEO compensation. The basic idea behind them is that CEO
compensation is expected to align interests of shareholders and managers, thus
mitigating agency problems (see the review by Murphy, 1999). The second type of
research on CEO compensation focuses on the issue of how compensation will affect
managerial behaviour. These studies examine how pay will affect top managers‟
information disclosure strategies (e.g. Nagar, Nanda and Wysocki, 2003), risk
preference (e.g. Low, 2009), earnings manipulation (e.g. Bergstresse and Philippon,
2006), information manipulation (e.g. Aboody and Kasznik, 2000) and shares
repurchasing (e.g. Sanders and Carpenter, 2003). These studies often suggest that the
effect of CEO compensation in managerial behaviour is not always in line with what
shareholders expect. CEO compensation may provide incentives for goal misalignment
between the agent and the principal.
The development of corporate governance mechanisms in the UK has had a great
impact on CEO compensation. The publication of the Greenbury Report and the
2
Combined Codes (1998, 2003, 2006, and 2010) provide extensive guidance for good
practices in remuneration design and disclosure. Furthermore, the introduction of the
Directors‟ Remuneration Report Regulation (2002) requires more transparent
information disclosure and a greater auditors‟ responsibility for directors‟ remuneration
report. The Companies Act 2006 (section 439) mandates shareholders a power of vote
for directors‟ remuneration in the annual general meeting (AGM). Hence shareholders
are entitled to have a critical say on CEO compensation. In short, all these settings
mentioned above intend to strengthen the relationship between firm performance and
CEO compensation, thus limiting windfall pay for top managers.
The improved information disclosures for CEO compensation and different corporate
governance settings (e.g. more detailed information disclosure for executive stock
options exercise is required in the UK than the US) have inspired more and more
researchers to examine CEO compensation in Britain. These studies focus on issues
including the comparison between UK CEO pay and overseas CEO pay (e.g. Conyon
and Schwalback, 2000; Conyon, Core and Guay, 2011), managerial opportunistic
behaviour (Kuang, 2008) and pay-performance relation (e.g. Ozkan, 2011). Their work
contributes to the existing literature by successfully exploring distinctive features of UK
CEO compensation.
In this thesis, I intend to fill three gaps in the literature by analysing UK CEO
compensation data. First of all, I would like to examine the relationship between CEO
compensation and the cost of debt. Early literature mainly investigates CEO
compensation from the point of view of shareholders (e.g. Jensen and Meckling, 1976),
focusing on principal-agent conflicts. Recent studies begin to shed light in the conflict

3
between shareholders and debt-holders. One of interesting questions is whether and
how shareholders and debt-holders react differently to CEO compensation (e.g. Billett,
Mauer, and Zhang, 2010). A few studies have also examined the costs of debt on a
single pay component (e.g. Duru, Mansi and Reeb, 2005).To the best of my knowledge,
there is no study in the existing literature explores the cost of debt financing by
considering all major CEO pay components and overall pay structure. In Chapter 2, I
seek to provide empirical evidence to fill this gap by examining comprehensive pay
components received by UK CEOs.
Secondly, I explore the possible link between CEO compensation and expectations
management. Expectations management refers to information manipulation in order to
lower market expectations about a firm‟s profitability. The literature suggests that
meeting or beating financial analysts‟ earnings forecasts is a major concern for top
managers (e.g. Graham, Harvey and Rajgopal, 2005). Earnings management by
inflating accounting numbers (e.g. Cheng and Warfield, 2005) and expectations
management by dampening market expectations (e.g. Bartov, Givoly and Hayn, 2002)
are two tools to help CEOs to achieve market expectations. Compared with earnings
management, few studies focus on expectations management. Athanasakou, Strong and
Walker (2009) document that expectations management is wide spread in the UK. In
Chapter 3, I seek to link expectations management with CEO compensation. I argue
that CEO compensation may provide top managers with incentives to manipulate
information disclosure for personal gains.
Thirdly, I re-examine the so-called career horizon problem by considering the influence
of CEO compensation on research and development spending. There is a debate about
4
whether career horizon affects managers‟ investment decisions. The career horizon
problem hypothesizes that older CEOs are likely to cut long-term investment because
their short career horizon limits the benefits from that spending. The empirical results
are mixed. Some studies find that older CEOs are less likely to spend in risky and long-
term investments (e.g. Barker and Mueller, 2002), while other research documents no
evidence to support investment cuts by retiring CEOs (e.g. Conyon and Florou, 2006).
My re-examination adds additional material in this debate by analysing more recent UK
data. In addition, few studies investigate the career horizon problem by considering all
major CEO compensation components. In Chapter 4, I investigate whether and how
different CEO compensation components affect top managers‟ investment decisions
across various career horizon lengths.
1.2. Major findings and contributions
As mentioned in Section 1.1, studies on CEO compensation can be classified into two
general categories (Devers, Cannella, Reilly and Yoder, 2007): (1) pay and performance
relationship; and (2) pay and managerial behaviour. In this thesis, the first issue I
investigate, the cost of debt, can be viewed as a special pay-performance relationship.
That is how debt-holders will react to CEO compensation in terms of bond yield spread.
The rest of the two issues, including expectations management and the investment
decision, can be classified in the second type of studies on CEO compensation. That is
how top manager pay will affect managerial behaviour. My empirical study provides
some interesting results on the role of CEO compensation in the UK.
First of all, I highlight a significant CEO compensation component which has been
overlooked by the most of previous studies: pensions. The role of pensions on
5
managerial behaviour still remains largely unknown, partly due to the poor data
availability in the early period (before 2003 in the case of UK). The recent improved
disclosure of CEO compensation (e.g. Directors‟ Remuneration Report Regulation,
2002) makes it possible to test the relationship between CEO pension and observable
managerial behaviour directly. Sundaram and Yermack (2007) argue that CEO pension
can be considered as inside debt, because firms are liable to pay any deficit in their
pension funds, and CEOs with pensions are potential debt-holders. Therefore, pension
may generate unique risk-aversion incentives for CEOs. Such a view gets supports from
some recent US studies (e.g. Edmans and Liu, 2011). In a UK study, Minhat (2009) also
provides some evidence that a high level of CEO pension will lead to lower firm risks,
which is measured as stock return volatility. In this thesis, I generate further evidence to
echo the role of CEO pension in providing risk-aversion incentives. In Chapter 2, I find
that the cost of debt, which is measured as the bond yield spread, is negatively related
with CEO pension compensation. This suggests that pensions‟ unique risk-aversion
incentives may align interests of CEOs and debt-holders. Hence debt-holders will
charge less for borrowing to a firm which provides more pensions to its CEOs. In
Chapter 4, I document that older CEOs with more pensions are less likely to spend in
research and development expenditures. This indicates that as pension vesting date
approaches, CEOs with more pensions are concerned about the safety of their post-
retirement funds. Consequently, they are less likely to engage in risky investments in
such circumstance. Overall, my study highlights the unique incentives for risk-aversion
provided by CEO pension. This indicates the potential benefits in terms of debt
financing and the potential cost in the issue of investment decision if a CEO receives
more pensions.
6
Secondly, I examine the impact on the cost of debt from CEO compensation by
considering all major pay components in Chapter 2. I predict that the cost of debt will
increase if pay components are able to generate risk-seeking incentives, while the cost
of borrowing will decline if pay components can provide risk-aversion incentives.
Consistent with my hypotheses, I find that a CEO with more stock options and
ownership will face a higher cost of debt. On the other hand, firms which provide more
pensions and bonuses to their CEOs will be better off in terms of their costs of
borrowing. In addition, I find that debt-holders dislike stock options more than
ownership. Among stock options, performance-vested stock options (PVSOs) outweigh
traditional stock options (TSOs) as far as increasing the cost of debt is concerned. The
distinctive features of those equity incentives are able to explain these different
reactions from debt-holders. Overall, my study shows that debt-holders can rationally
consider the impacts of various CEO pay components on managerial risk-taking
incentives and price bonds accordingly. Compared with previous studies (e.g. Ertugrul
and Hegde, 2008; Brockman, Martin and Unlu, 2010), my study considers a more
comprehensive range of CEO pay components. By splitting stock options into PVSOs
and TSOs, I provide a further insight into the distinctive features of different types of
stock options.
Thirdly, I investigate the possible link between CEO compensation and expectations
management in Chapter 3. Expectations management refers to an idea that managers
purposefully dampen market expectations, so that final reported earnings are more
likely to achieve market expectations. The literature documents that the stock market
tends to reward firms which achieve market expectations (e.g. Bartov, Givoly and
Hayn, 2002), and this achievement will benefit CEO bonuses and following insider
7
trading (e.g. Matsunaga and Park, 2001; Richardson, Teoh and Wysocki, 2004). Hence
I expect that bonuses and equity incentives (stock options and restricted shares) which
will be vested in the following year (after current year‟s earnings announcement) are
likely to provide incentives for expectations management. I find that both bonuses and
equity incentives which will be vested in the following year are positively related to the
probability of achieving market expectations, as predicted. However, only equity
incentives may lead to a higher probability of expectations management, while bonuses
do not. My results demonstrate that although bonuses and equity incentives motivate
CEOs to care about market expectations, top managers may choose different tools to
achieve such a goal. Equity incentives are more likely to motivate expectations
management, while bonuses may provide incentives for employing other tools (e.g.
earnings manipulation) to achieve market expectations. My study echoes Athanasakou,
Strong and Walker (2009; 2011) that expectations management is wide spread in the
UK. My results show that the prevalence of expectations management in Britain can be
partly explained by CEO compensation. This highlights the incentives for information
manipulation which are provided by CEO compensation.
Fourthly, I show how CEO compensation is related to investment decisions in different
lengths of CEO career horizon. I document that there is no evidence to indicate that
CEOs will curtail research and development spending when their career horizons
become short, which is inconsistent with early literature (e.g. Barker and Mueller,
2002), while consistent with more recent studies (e.g. Conyon and Florou, 2006). In
addition, I find that pensions discourage research and development spending among
older CEOs. As far as ownership is concerned, research and development spending
generally increases with the level of ownership. However, older CEOs with more
8
ownership seem to spend less on research and development expenditure, compared with
counterparts with less ownership. Overall, my results show some significant impacts on
investment decisions from the interactive relationship between CEO career horizon and
compensation. The role of CEO compensation in investment decisions may vary
according to different lengths of career horizon. In short, this study provides further
material for the debate on the career horizon problem. It is consistent with the view that
CEOs‟ career horizon lengths should be considered vital when designing CEO
remuneration packages (e.g. Cheng, 2004; Cazier, 2011).
In summary, these results in this thesis provide some evidence to explain managerial
behaviour and debt-holders‟ reactions from the aspect of CEO compensation. The role
of CEO compensation in the costs of debt, expectations management and investment
decisions are significant, but not always in line with shareholders‟ interests. The
remuneration committee should consider these “side-effects” of various pay
components when structuring compensation packages for CEOs.
1.3. Thesis organization
I investigate three issues in this thesis and organize them into separate chapters. Chapter
2 examines the relationship between CEO compensation and the cost of debt. Chapter 3
presents the link between CEO compensation and expectations management. The roles
of the interactive relationship between CEO pay and career horizon on investment
decisions are demonstrated in Chapter 4. The conclusions, limitations and suggestions
for future research are presented in the final chapter.
9
Chapter 2 CEO Compensation and the Cost of Debt
2.1. Introduction
Are creditors concerned with CEO compensation? In their seminal paper, Jensen and
Meckling (1976) argue that if CEO compensation only aligns interests of shareholders
and managers, there is a strong incentive for top managers to expropriate creditors‟
wealth by undertaking risky investments. Shareholders can award some specific forms
of compensation to motivate CEOs towards accepting high risk investment projects.
This happens primarily due to the convex payoff structure of equity incentives (e.g.
stock options). Creditors can benefit from higher CEO compensation as long as
increased managerial effort reduces the probability of firm default. But they are also
more likely to suffer when additional risky investments amplify the firm‟s default
probability.
John and John (1993) argue that creditors rationally anticipate the risk-shifting
incentive coming from CEO compensation and therefore require a corresponding
increase in risk premium. Hence, firms that use CEO compensation to closely align
interests of top managers and shareholders are more likely to face a higher borrowing
cost. Since a higher cost of borrowing is damaging for firms, especially those requiring
additional debt financing, there is a pressure for a reduction in CEO compensation. This
means that CEO compensation should be designed to optimize the trade-off between
these benefits from risk-shifting and these losses from increased borrowing cost. Ortiz-
Molina (2007) argues that less incentive compensation (e.g. stock options) for top
managers is deliberately introduced in order to lower the borrowing cost when the
conflict between shareholders and debt-holders is more severe (e.g. highly levered
firms).
10
In this chapter, I investigate the impact of CEO compensation on a firm‟s borrowing
cost. A few studies have previously examined various aspects of the relationship
between CEO pay and the cost of debt. Duru, Mansi and Reeb (2005) analyse the
impact of cash bonuses, while Shaw (2007), Ertugrul and Hegde (2008), Devos, Prevost
and Rao (2008) and Brockman, Martin and Unlu (2010) examine equity compensation.
These studies focus on a single pay component and relate it to a firm‟s cost of debt.
However, if lenders rationally use CEO compensation to assess the impact of agency
problems on a firm‟s credit risk, they should consider not only the size of each pay
component separately, but also the overall structure of a CEO‟s compensation package.
The relative proportions of various compensation elements may convey additional
information about the direction and magnitude of risk-taking incentives. Therefore, I
examine the effect of all main components of CEO pay on the cost of debt.
I make three key contributions to the existing literature. First of all, I investigate
whether a firm‟s cost of debt is affected by not only cash-based performance-related
pay (bonus) and equity-based incentives (share and option grants), but also by debt-like
pay (defined benefit pensions). Although the latter form of CEO compensation is
ubiquitous and has the potential to align interests of CEOs and debt-holders, empirical
studies rarely consider it. Because the detailed CEO pension data is only required to be
disclosed from 2003 in the UK. To the best of my knowledge, this study is the first
empirical test to investigate the impact of CEO pensions on the cost of debt1.
1 Wei and Yermack (2011) study the reaction of bondholders and shareholders to the disclosure of CEOs‟
pensions and deferred compensation in the US. While they provide interesting evidence using the event
study methodology for a limited sample of firms that disclosed their detailed compensation data, I focus
on the market-wide cross-sectional effects of pension compensation on the cost of debt in the UK.
Therefore, my methodology does not depend on the assumption that the capital market is unaware of the
existence and extent of inside debt prior to the disclosure.

11
Secondly, by splitting CEO stock options into two categories (traditional and
performance-vested stock options), I for the first time empirically examine whether the
credit market takes into account the distinct contractual features and incentives
provided by these two types of stock options. Although most of the literature treats
CEO stock options as a homogeneous variable, there are two distinct categories of stock
options: traditional stock options and performance-vested stock options (e.g. Johnson
and Tian, 2000).The former has no specific performance target attached, while the latter
requires managers to achieve a performance target prior to vesting. Johnson and Tian
(2000) find that performance-vested stock options (hereafter called PVSOs) provide
stronger incentives to increase risk as well as stock price than traditional stock options
(hereafter called TSOs). I study whether creditors consider the award of TSOs and
PVSOs compensation differently and charge a differential risk premium accordingly.
Finally, my analysis is the first study that examines the link between CEO pay and the
cost of debt financing for UK firms. This provides out-of-sample evidence in addition
to the very few existing studies that focus only on the US, and enables us to test
whether the existing evidence holds for a market with a historically different managerial
pay levels and structure. Conyon, Core and Guay (2011) document that US CEOs
receive much higher pay as well as equity incentives compared with their counterparts
in Britain. And such pay differences across the Atlantic can be partly explained as the
risk premium: US CEOs bear higher risks.
My results show that firms awarding their CEOs with higher proportions of defined
benefit pensions, a potential liability of a firm that can be viewed as debt-like
compensation, experience a significant reduction in the cost of debt. On the other hand,

12
I observe that equity-based compensations, such as stock options, are positively related
to the corporate bond yield spread. Further analysis shows that holdings of
performance-vested stock options outweigh traditional stock options in terms of
increasing the cost of debt. Such finding indicates that bondholders see performance-
vested stock options awarded to CEOs as a stronger incentive to expropriate their
wealth by means of risk-shifting. I also find that cash bonus payments to CEOs are
associated with lower borrowing costs. However, I find no relationship between
restricted shares grants and the cost of debt. Overall, my results show that bondholders
rationally anticipate risk-taking or risk-avoiding incentives of CEOs by observing
different types of compensation awards. Hence, a proper adjustment in the structure of
CEO compensation is an effective way to reduce a firm‟s cost of borrowing, especially
when it relies heavily on external debt financing.
The remainder of this chapter is organized as follows. Section 2.2 briefly reviews the
relevant literature. The hypotheses of this chapter are developed in Section 2.3. The
methodology and data are described in Sections 2.4 and 2.5, respectively. The empirical
results are presented in Section 2.6. Section 2.7 provides a summary and the
conclusions of this chapter.
2.2. Literature review
CEO compensation has mostly been investigated from the point of view of a firm‟s
shareholders. The idea originates from the agency theory whereby managers are
provided with incentives to work for the creation of more shareholder wealth. As
suggested by Jensen and Meckling (1976), the separation of ownership and controlling
power of a firm may cause conflicts interests between shareholders (principal) and
13
managers (agent). In this regard, risk-averse managers, who are also interested in job
security and their own reputations, will be reluctant to take on value-increasing but
risky investment projects. By providing appropriate equity incentives to managers,
executives also become shareholders of their firms. Therefore, managers are motivated
to undertake risky but value-added investment projects. The interests of shareholders
and managers on investment decisions are expected to be aligned.
Several studies provide empirical supports for this theory. Coles, Daniel and Naveen
(2006) find that CEO equity-based pay is linked with several observable risk-taking
activities, such as a higher leverage and less corporate diversification. Chen, Steiner and
Whyte (2006) show that the increased use of option-based compensation in the banking
industry induces managerial risk-taking. Wu and Tu (2007) provide evidence that stock
option compensation encourages a higher level of research and development
investments by firms. Similarly, Sanders and Hambrick (2007) find that the more option
compensation CEOs receive the more aggressive investments they undertake. In a
recent paper, Low (2009) further confirms that a higher sensitivity of CEO portfolio
value to stock return volatility, which is associated with equity-based compensation,
directly contributes to managerial risk-taking behavior.
While shareholders‟ interests are being served and agency costs of equity decline
because of incentive compensation, there can be a corresponding increase in the agency
costs of debt (John and John, 1993). The reason is that managers might be inclined to
choose risky investments that will be beneficial to shareholders at the expense of
creditors. This phenomenon is widely known as the shareholder–debt-holder conflict.
As explained by Jensen and Meckling (1976), the conflict between shareholders and

14
debt-holders exists because of the convex payoff structure of equity when risky debt is
outstanding. The limited liability of shareholders will benefit shareholders in shifting in
risky investment, while debt-holders may suffer severely. Obviously, rational debt-
holders will anticipate this increased risk-taking tendency of CEOs arising out of
incentive pay, and therefore charge a higher borrowing rate to compensate for any
possible future loss.
While incentive compensation can hurt debt-holders, there exist other types of CEO
compensation that can bring managerial interests in line with those of a firm‟s creditors.
A common but less investigated form of such compensation is pension. Edmans and Liu
(2011) argue that pension payments to CEOs can discourage risk-taking activities. By
aligning managerial interests with those of debt-holders, pensions can mitigate
shareholder–bondholder conflict.
The empirical examination covering the effect of CEO compensation on the cost of debt
is limited. Daniel, Martin and Naveen (2004) observe that the credit spreads of
corporate bonds increase with both the sensitivity of CEO wealth to stock volatility and
the sensitivity of CEO wealth to stock prices. This suggests a negative reaction to
equity incentives from debt-holders. However, Ertugrul and Hegde (2008) analyse the
effect of stock options granted to directors of US firms and find that an increase in
option compensation decreases yield spreads. Duru, Mansi and Reeb (2005) argue that
earnings-based bonuses can reduce the cost of debt because they motivate top managers
to seek stable cash flows to achieve the earnings target and thereby lower the risk of
default. Their results show that the level of CEO cash bonuses is indeed negatively
related with the bond yield spread. In addition, Gerakos (2007) documents a positive
15
relationship between bond ratings and CEO pensions. This suggests the positive effect
of pension on firm‟s default risks.
A few studies provide indirect evidence. Ortiz-Molina (2007) finds that the pay–
performance sensitivity, defined as the relationship between changes in a CEO‟s firm-
specific wealth and the shareholder return, is lower for firms that issue straight debt and
higher for those issuing convertible debts. Such a finding indicates that firms adopt
incentive compensation toward mitigating shareholder–bondholder conflict. He also
finds that option-based compensation is less attractive for firms suffering from severe
shareholder–bondholder conflict. Similarly, Bryan, Nash and Patel (2006) show that
firms with higher amounts of convertible debt offer more options-based compensation
to their CEOs.
If a higher incentive compensation aligning shareholders‟ interests with those of top
managers can be detrimental to debt-holders, this should also be reflected in lower bond
prices. Therefore, instead of directly examining the effect on the cost of debt, several
studies investigate how bond values are affected by equity-based compensation.
Empirical evidence is first provided by DeFusco, Johnston and Zorn (1990) who
analyse the effect on bond returns when firms announce CEO stock option plans. They
find that stock returns increase while bond returns decline after these announcements.
Billett, Mauer and Zhang (2010) also document an adverse bond price reaction when
CEOs receive new equity-based compensation. Wei and Yermack (2011) examine how
bondholders and shareholders react to the disclosure of CEO pension and deferred
compensation. They find that bond prices rise, while equity prices decline for firms
whose CEOs have relatively more pensions. All these studies analyse US data and
16
indicate that the announcement or disclosure of equity-based pay and pension to CEOs
is associated with a wealth transfer between shareholders and bondholders.
2.3. Hypotheses development
The literature review in the previous section illustrates that CEO compensation can
affect the risk-taking behavior of managers and subsequently a firm‟s cost of debt
financing. Since each compensation component has its own distinctive features, their
effects on the cost of debt can be unique. Therefore, I develop hypotheses on the impact
of each pay component separately.
2.3.1. Cash bonus
Cash bonus is the first compensation element I consider. It is usually related to an
accounting performance target. As reviewed by Murphy (1999), CEO cash bonus may
generate tow fundamental problems with risk implications. First of all, accounting
performance upon cash bonus is backward-looking and short-sighted. An outcome of
such a target is that managers are inclined to decrease certain long-term and risky
investments (e.g. research and development spending) in order to lower short-term
expenditures and thereby increase the reported profit (e.g. Dechow and Sloan, 1991).
Therefore, it is argued that a relatively higher proportion of cash bonuses compensation
would provide more risk-avoiding incentives to CEOs. The second problem of cash
bonus is that it may provide incentives to manipulate reporting earnings (e.g. accrual
management) since the performance targets on cash bonus are often explicit (e.g.
Holthausen, Larcker and Sloan, 1995). Therefore, cash bonus may also possibly
increase certain risks, such as financial restatement and misreporting. Duru, Mansi and
Reeb (2005) empirically examine debt-holders‟ reaction on CEO cash bonus. They find
17
that CEOs with high bonuses face a lower cost of borrowing. They argue that debt-
holders do reward the risk-avoiding incentives of cash bonus when pricing a firm‟s
debt. Following Durn, Mansi and Reeb (2005), I also expect a negative relation between
cash bonus and the cost of debt. My first hypothesis is:
H1: Firms providing more cash bonus to their CEOs face a lower cost of debt.
2.3.2. Pension
Pension is a special form of compensation because it is deferred and can only be
accessed upon retirement. In the UK, there are three basic types of pension
arrangements: the public social security system, occupational pension and private
pension plans. Defined benefit pension scheme and defined contribution pension
scheme are the two basic forms of the occupational pension plan.
The defined contribution (DC) pension is also known as money purchase scheme. The
firm is required to pay a prescribed fee (contributions) into the pension fund regularly.
However, the firm is only liable to pay the annual contribution, but will not be
responsible for the final income of the employee when he or she retires. In another
word, the final income of a retired staff with DC pension scheme is not guaranteed. In
the defined benefit (DB) pension scheme, the amount of money an employee is
expected to receive upon retirement is often defined in advance. The firm is not only
liable to pay the annual contribution, but also be responsible for the final income of its
retired staff. Any deficit in DB pension fund is the liability of the firm. In this thesis,
my focus is on the defined benefit pension scheme for CEOs only. Because this is the
only form of pension that represents potential debts of a firm to its CEO.
18
The asset in defined benefit (DB) pension scheme is well protected in the UK. The
pension trust is separate from the firm‟s (sponsor‟s) assets. Hence the assets already in
the pension trust are independent and will not be affected in the event of the sponsor‟s
bankruptcy. The Pensions Act of 2004 introduced further protection for the UK pension
scheme. Under this Act, a statutory fund, the Pension Protection Fund (PPF), was
established by the UK government. The PPF is set to pay compensation to employees if
the employer (scheme sponsor) becomes insolvent and the pension trust is unfunded
(has a deficit). In such a case, 100% (90%) of pension compensation, up to a certain
limit, is guaranteed for members who are above (under) the normal retirement age.2
However, the defined benefit pension plan still presents considerable risk-avoiding
incentives for CEOs. As a consequence of the falling equity market, lower interest rates
and improvements in life expectancy, the defined benefit pension deficit has become
increasingly severe among UK blue chip companies. According to the Watson Wyatt
pension risk indicators database, the average UK FTSE 350 firm had a defined benefit
pension deficit of £254 million and a funding ratio of only 79% in 2004 (Gupta, 2006).
In a recent report by Pension Capital Strategies in association with JP Morgan, only five
FTSE 100 firms had a defined benefit pension surplus during the period of 2007-2009
(The Guardian, 19 May 2010). In short, demands from the pension regulator, along with
pressure from the huge defined benefit pension deficits, may discourage firms from
pumping “excess” cash flows into risky investments.
Secondly, CEOs with a defined benefit pension scheme are still the victims in the event
of bankruptcy. As mentioned earlier, the Pension Protection Fund guarantees 100%
2
Source: www.pensionprotectionfund.org.uk

19
(90%) of pension for a member who is above (under) the normal retirement age in the
event of insolvency. CEOs with a defined benefit pension plan are not the exception.
However, there is a cap for such compensation. Based on the latest figures from the
Pension Protection Fund, the maximum compensation is £29,748.68 per year in 2010,3
which is negligible compared to the average defined benefit pension plan for top
managers in UK publicly traded firms. In other words, only a tiny fraction of a CEO‟s
defined benefit pension loss can be sheltered by the Pension Protection Fund in the
event of insolvency. Compared with normal employees, top managers will suffer much
more from defined benefit pension loss in the event of bankruptcy. Therefore, CEOs
with a large amount of defined benefit pension have strong incentives to avoid
bankruptcy, even in the presence of a pension protection scheme.
As a result, a CEO with a defined benefit pension scheme effectively becomes a firm‟s
potential debt-holder. Sundaram and Yermack (2007), along with Edmans and Liu
(2011), argue that by aligning interests of top managers with other debt-holders,
pensions can reduce CEOs‟ incentives for risk-shifting and lead to a reduction of
overall riskiness of a firm and subsequently its cost of debt. Therefore, CEOs will be
discouraged from taking risky actions that may increase the probability of bankruptcy
and lower the recovery value. Consequently, I formulate the next hypothesis as follows:
H2: Firms providing more pensions to their CEOs face a lower cost of debt.
3 Source: www.pensionprotectionfund.org.uk

20
2.3.3. Stock options
A well-established view is that compensation by means of stock options will generate
strong incentives for risk-increasing investments (e.g. Jensen and Meckling, 1976;
Guay, 1999). This view relies on the fact that stock options have a convex payoff
structure: the expected payoff will be zero as long as the share price is below the
exercise price, but it can be quite high if the options are in-the-money. In addition, the
value of stock options increases when stock return volatility goes up. By undertaking
risky investment projects, the expected payoff from option holdings increases. At the
same time, increase in the firm‟s risk level will lead to a higher probability of
bankruptcy, and therefore a lower value of the firm‟s debt. Ertugrul and Hedge (2008)
provide evidence that the level of directors‟ stock option holdings is positively related
with a firms‟ bond yield spread. Therefore, my hypothesis is that by providing a
stronger incentive for managers to take more risks, stock option awards will lead to a
higher cost of borrowing.
H3: Firms providing more stock options to their CEOs face a higher cost of
debt.
2.3.4. Comparison between PVSOs and TSOs
Two types of CEO stock options are frequently used as compensation for top managers:
performance-vested stock options (PVSOs) and traditional stock options (TSOs) (e.g.
Johnson and Tian, 2000). These two categories have distinctive features: PVSOs have
performance targets as vesting conditions, while TSOs have no such targets. This
difference in vesting conditions may provide different incentives for CEOs.

21
First of all, PVSOs may generate stronger incentives for interest alignment of CEOs and
shareholders than TSOs. Because of the performance target attached on PVSOs, CEOs
are expected to engage in value-added investments to maximize shareholders‟ value.
Kuang and Qin (2009) document that PVSOs outperform TSOs to increase the pay for
performance sensitivity. If PVSOs are more likely to align interests of shareholders and
top managers, CEOs with more PVSOs are more likely to choose an investment
strategy which will benefit shareholders as the priority. Anticipating such an investment
tendency, bondholders will require a higher risk premium.
Secondly, PVSOs may generate incentives for managerial opportunistic behaviors
which damage debt-holders‟ interests. For example, earnings are usually used as the
main performance benchmarks for PVSOs. Kuang (2008) documents that firms
providing more PVSOs to CEOs exhibit a stronger incentive for earnings management
compared with TSOs. Prevost, Rao and Skousen (2008) link earnings management to
the cost of debt and find that earnings management distorts the quality of earnings,
which is vital for creditors to assess a firm‟s default risk. Therefore, by observing a
higher level of PVSOs awards to top managers, creditors already anticipate a stronger
incentive for earnings management and will therefore charge a higher borrowing rate. I
therefore formulate my next hypothesis as follows:
H4: Firms providing their CEOs more PVSOs relative to TSOs face a higher
cost of debt.
22
2.3.5. Comparison between stock options and ownership
Ownership directly links CEO‟s personal wealth to stock price. Compared to stock
options, the relationship between CEO‟s wealth invested in shares is a linear function of
stock price rather than a convex one. Hence, the wealth of a CEO with more ownership
might be more sensitive to a decrease in share price compared to the wealth of a CEO
with large stock options holdings. As high risk investment may lead to higher return
volatility, a CEO with a high level of ownership may reduce risk-taking behavior as his
or her wealth exposure increases. Analysing US data, Ortiz-Molina (2006) provides
empirical evidence that the cost of debt soars when ownership increases, while such a
relationship disappears when ownership reaches a very high level. Because of the
differences in payoff structures between stock options and ownership, I expect that
stock options will create stronger incentives for risk-taking compared to ownership. If
rational debt-holders perceive the difference between ownership and stock options in
terms of risk-taking, they will require a higher risk premium for firms granting their
CEOs a large number of stock options than for firms providing high managerial
ownership. This leads to my fifth hypothesis:
H5: Stock options held by CEOs increase the cost of debt more than ownership.
2.3.6. Restricted shares
The last compensation component I consider is restricted shares. In the UK, most CEOs
in publicly traded firms must meet certain prescribed performance targets (e.g. total
shareholders return, TSR) before vesting restricted shares (PWC, 2008). Hence, CEOs
are expected to be motivated to increase the stock return in order to guarantee the
vesting of restricted shares. The anticipation of subsequent alignment of interests of

23
shareholders and top managers will lead rational debt-holders to require a
corresponding higher risk premium. Therefore, my hypothesis is:
H6: Firms providing more restricted shares to their CEOs face a higher cost of
debt.
2.4. Methodology
I consider both annual compensation and cumulative compensation of CEOs. CEOs
receive their compensation in a variety of forms. Each pay component received by the
CEO during a particular year will be taken into account. I construct pay variables as a
proportion of total CEO compensation, which is the sum of annual salary, bonuses, the
estimated values of stock options and restricted shares, and the pension increment. In
addition, as a robustness check, I also employ an alternative proxy for annual
compensation, which is the value of each pay component scaled by the firm‟s total
sales. Previous studies on CEO compensation did not consider pension element of pay
because that information was not easily available in the early period. However, the
disclosure of pension data is now mandatory following the introduction of the
Directors‟ Remuneration Report Regulations (2002), which allows us to collect full
compensation data to accurately estimate each pay component and analyse the impact
of pensions. I focus on the defined benefit (DB) pension, as only DB pensions are a
potential liability for a firm and therefore represent inside debts. I hand collect the
actuarial value of the defined benefit pensions as reported in firm annual reports. Since
defined benefit pension value is reported as cumulative number, I estimate the amount
of new pension awarded in a particular year as a year-to-year change in accumulated
pension.

24
In addition to the annual monetary amounts of compensation, I look at the total amount
of equity-like (stock options and shares) and debt-like pay (pension) accumulated by a
CEO during his or her tenures. This has potentially even stronger implications for firm
policies, since CEOs are much more likely to be motivated by changes in their total
wealth rather than changes in the value of their annual compensation. For stocks and
options, I conduct this analysis by using the number of shares grants because monetary
values can vary based on valuation assumptions. I therefore define new compensation
variables by considering the number of stock options, unrestricted shares (ownership)
and restricted shares held by a CEO as a proportion of total number of shares
outstanding. These new definitions are also useful to check the robustness of my
findings.
The yield spread of a corporate bond is used to measure the cost of debt. Following
prior literature (e.g. Anderson, Mansi and Reeb, 2003; Ertugrul and Hegde, 2008), it is
estimated as the difference in yield to maturity between a firm‟s bond and a UK
government bond with a comparable maturity. The spread is expressed in basis points.4
When a firm has multiple bonds outstanding in a year, I use the market value weighted
average yield spread. This procedure allows me to use a single representative bond
yield per firm year.
I perform ordinary least square (OLS) regression to measure the effect of CEO
compensation on the cost of debt. The yield spread of corporate bonds is used as the
dependent variable, and the CEO compensation components are used as the explanatory
variables. Following prior studies examining yield spread (e.g. Ortiz-Molina, 2006;
4 For a few corporate bonds with a maturity longer the longest maturity of government bonds, the yield
spread is compared with the longest available maturity of the latter.
25
Ertugrul and Hegde, 2008; Devos, Prevost and Rao, 2008), the estimated regression
model is written as follows:
Spread i,t = α0 + β Compensation i,t-1 + ∑ λ Bond Characteristics i,t
+∑ δ Firm Characteristics i,t + ∑ ζ Industry dummies i,t
+ ∑ υ Year dummies i,t +εi,t. (1)
The regression specification considers a lagged relationship because bondholders adjust
the bond price once information on compensation becomes publicly available. All
bond-specific information is therefore collected three months after the end of a fiscal
year.5 We can see how bondholders react to the latest CEO compensation information.
Although OLS regression is popular and widely used, it is not short of limitations. OLS
is sensitive to outlier. OLS estimator is biased and inconsistent if multicollinearity and
individual effects exist among independent variables (e.g. Greene, 2007). In this study,
the possible individual effects are that different firms may apply unique remuneration
packages for their CEOs. Hence the variation among CEO compensations may be
contaminated by unmeasured individual firm characteristics (unobserved firm
heterogeneity). To address such a concern, I also use fixed effect regression, focusing
on within variation of CEO compensation for individual firms.
Prior literature suggests several bond and firm characteristics that can also influence the
yield spread of bonds (e.g. Ortiz-Molina, 2006; Ertugrul and Hegde, 2008). These
factors are included as control variables in regression. The bond characteristics are bond
5 UK Publicly traded firms are required to publish their annual reports within four months after the end of
the fiscal year. I also randomly check the date of annual report release in Thomson Banker.
26
rating, duration and bond size. For the bond rating variable, I convert each rating
category into a numerical scale. Following Klock, Mansi and Maxwell (2005), I assign
the lowest Moody‟s rating D a value of 1, and then, as the bond rating increases, the
numerical rating changes by an increment of 1, up to a value of 22 for the highest
Moody‟s rating, Aaa. I further convert this rating into a rating residual to control for all
information other than compensation that can affect bond rating (spread) and that is not
captured by other control variables used in the regression. The residual is estimated
from the regression, where the dependent variable is bond rating and the independent
variables are the various compensation components. The duration of the bond is used to
control for differences in bond maturity and coupon rate. The bond size is used to
control the impact of liquidity on yield spread. A large bond size suggests higher
liquidity and therefore a lower cost of debt. Similar to Ortiz-Molina (2007), I use the
relative bond size (as the fraction of a firm‟s total assets) instead of the absolute bond
size. The firm characteristics that can affect yield spread include firm size, debt ratio,
profitability, market-to-book ratio and firm risk. These firm characteristics are found to
be informative in explaining the cost of debt (e.g. Ortiz-Molina, 2007; Ertugrul and
Hegde, 2008). The exact definitions of all these variables are presented in Table 2.1.
The regression model also incorporates industry and time factors.
2.5. Data
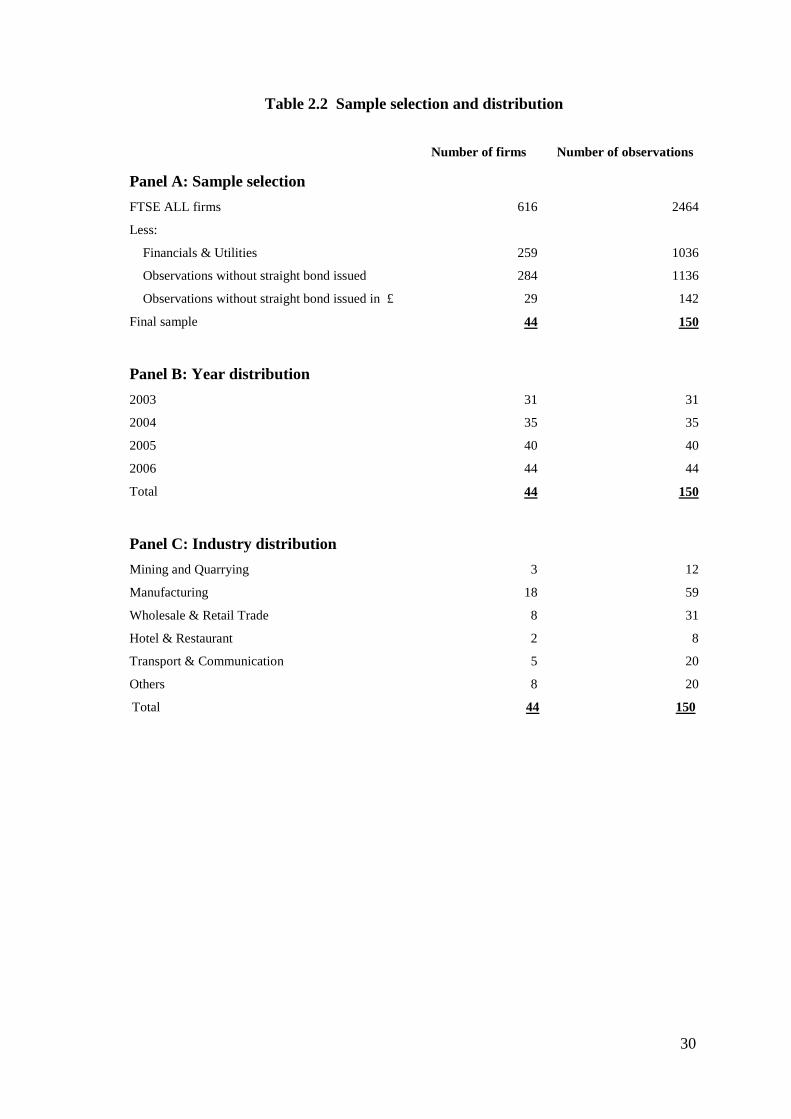
The sample is selected from non-financial and non-utility UK firms in FTSE All Share
Index. To be included in the sample, a firm must have a straight bond outstanding.
Since the benchmark for calculating corporate bond yield spread is the corresponding
UK government bond yield, I exclude firms with bond issued in currencies other than
pound sterling.
27
Information on yield spread, bond and firm characteristics is collected from
DataStream. CEO compensation data is mainly collected from BoardEx. It is a database
which is specialized for analysing profile and relationship of organization leaders in
Europe and North America. It captures extensive personal information about 380,000
leaders (all directors in UK publicly traded firms are covered), including date of birth,
nationality, education background, working experiences, board and non-board
positions, and compensation. As far as the data of compensation is concerned, BoardEx
provides detailed information on the actual monetary value of cash compensation and
number of shares for stock options and restricted shares. The estimated monetary values
of equity incentives are also reported. In addition, stock options are classified into
traditional stock options (TSOs) and performance-vested stock options (PVSOs) in
BoardEx. The exercise (vesting) dates for stock options (restricted shares) are also
available. 6 Firm annual reports are used to collect data on CEO defined benefit
pensions. The sample period of the study is 2003-2006. It starts with 2003 because this
is the year when firms were first required to publish detailed information about CEO
pensions in their annual reports, according to the Directors‟ Remuneration Report
Regulations (2002). It stops in 2006 to eliminate the potential influence of later
financial crisis.
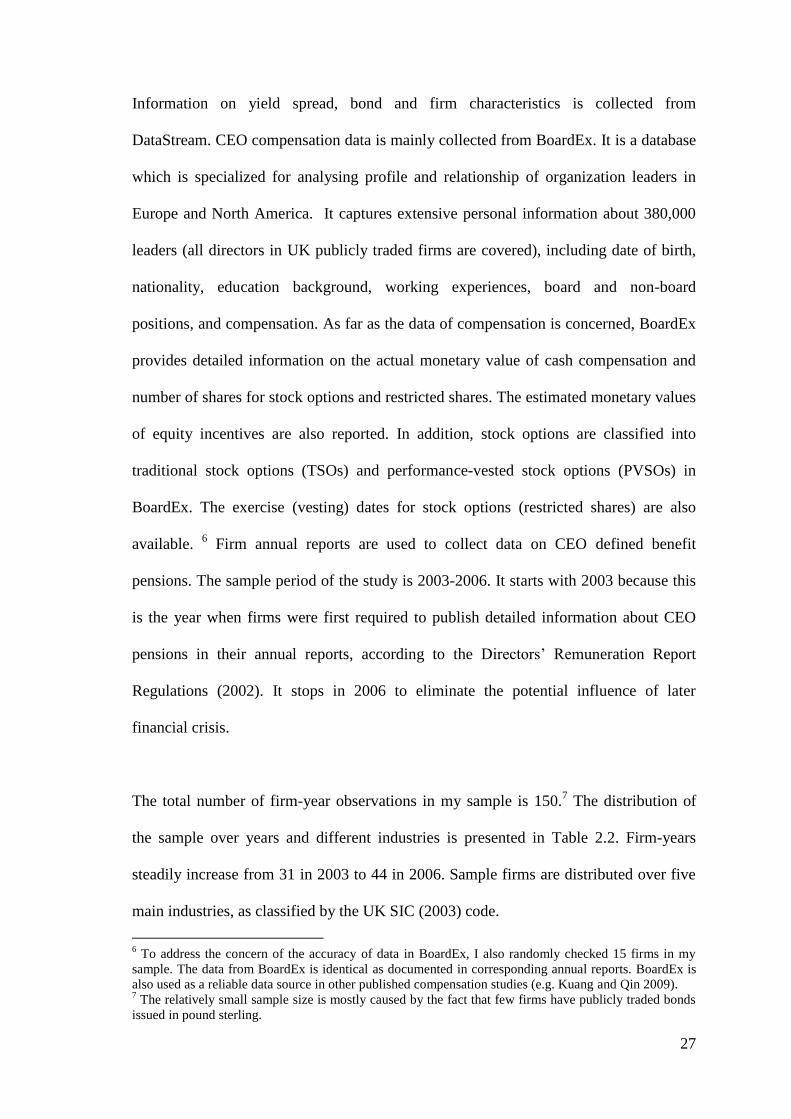
The total number of firm-year observations in my sample is 150.7 The distribution of
the sample over years and different industries is presented in Table 2.2. Firm-years
steadily increase from 31 in 2003 to 44 in 2006. Sample firms are distributed over five
main industries, as classified by the UK SIC (2003) code.
6 To address the concern of the accuracy of data in BoardEx, I also randomly checked 15 firms in my
sample. The data from BoardEx is identical as documented in corresponding annual reports. BoardEx is
also used as a reliable data source in other published compensation studies (e.g. Kuang and Qin 2009). 7 The relatively small sample size is mostly caused by the fact that few firms have publicly traded bonds
issued in pound sterling.

28
Table 2.1 Variables definitions
Panel A: Bond characteristics
Variable Name Definition
Spread Bond yield spread expressed in basis points over UK government securities (DS8: SP). For
multiple bonds, market value-weighted average is used.
Rating Bond rating of Moody‟s (DS: MRT) converted to a numerical scale, in which the lowest
rating (D) is 1 and the highest (Aaa) is 22.
Low Rating Dummy variable equals 1 if Rating is no more than 14 (Moody‟s Rating Baa2), the
benchmark for “investment grade bond”, otherwise 0.
Rating Residual Residual from the regression where the dependent variable is Rating and the independent
variables are the relevant compensation components.
Bond Size Relative size of bonds calculated as the market value of bonds (DS: MV) scaled by book
value of total assets (WC 02999).
Duration Duration of bonds (DS: DM). For multiple bonds, market value-weighted average is used.
Panel B: Firm characteristics
Variable Name Definition
Firm Size The natural logarithm of book value of total assets (WC9 02999).
Debt Ratio Book value of long-term debt (WC 03251) scaled by book value of total assets (WC
02999).
Profitability Operating income (WC 01250) before depreciation (WC 01151) scaled by book value of
total assets (WC 02999).
Market-to-Book ratio Market-to-book value ratio calculated as the book value of total debt (WC 03255) plus the
market value of equity (DS: MV), scaled by the book value of total assets (WC 02999).
Risk Standard deviation of Profitability calculated using data of year t-6 to t-1.
8 DS is the abbreviation for DataStream.
9 WC is the abbreviation for WorldScope.

29
Table 2.1 (Continued)
Panel C: CEO compensation
Variable Name Definition
Total Compensation
Total compensation to Sales
Salary
Salary to Sales
The Sum of salary, bonuses, the estimated values of stock options and restricted shares
grants10, and the pension increment in a particular year.
Total compensation scaled by total sales (WC 01001).
Annual salary scaled by total compensation.
Annual salary scaled by total sales (WC 01001).
Bonus Cash bonus scaled by total compensation.
Bonus to Sales Cash bonus scaled by total sales (WC 01001).
Incremental Pension Year-to-year change in the actuarial value of defined benefit pension scaled by total
compensation.
Incremental Pension to Sales Year-to-year change in the actuarial value of defined benefit pension scaled by total
sales (WC 01001).
Pension to Equity The total transfer value of defined benefit pension scaled by the estimated value of
equity holdings (including ownership, restricted shares and options).
TSO Grants The estimated value of traditional stock option grants scaled by total compensation.
TSO Grants to Sales The estimated value of traditional stock option grants scaled by total sales
(WC 01001).
PVSO Grants
PVSO Grants to Sales
The estimated value of performance-vested stock option grants scaled by total
compensation.
The estimated value of performance-vested stock option grants scaled by total sales
(WC 01001).
Option Grants
Option Grants to Sales
The sum of TSO grants and PVSO grants.
The sum of TSO grants to sales and PVSO grants to sales.
Share Grants
Share Grants to Sales
The estimated value for restricted share grants scaled by total compensation.
The estimated value for restricted share grants scaled by total sales
(WC 01001).
TSO Holding The number of traditional stock options scaled by total number of shares outstanding
(DS: NOSH).
PVSO Holding The number of performance-vested stock options scaled by total number of shares
outstanding (DS: NOSH).
Option Holding The sum of TSO holding and PVSO holding.
Restricted Shareholding The number of restricted shares held by the CEO scaled by total number of shares
outstanding (DS: NOSH).
Ownership The number of shares owned by the CEO scaled by total number of shares
outstanding (DS: NOSH).
10
Please see the Appendix for the estimated value of stock options and restricted shares.
30
Table 2.2 Sample selection and distribution
Number of firms Number of observations
Panel A: Sample selection
FTSE ALL firms 616 2464
Less:
Financials & Utilities
259
1036
Observations without straight bond issued 284 1136
Observations without straight bond issued in £ 29 142
Final sample 44 150
Panel B: Year distribution
2003 31 31
2004 35 35
2005 40 40
2006 44 44
Total 44 150
Panel C: Industry distribution
Mining and Quarrying 3 12
Manufacturing 18 59
Wholesale & Retail Trade 8 31
Hotel & Restaurant 2 8
Transport & Communication 5 20
Others 8 20
Total 44 150

31
Table 2.3 presents descriptive statistics of major variables used in my empirical
analysis. All data is winsorized at 5% level to limit the impact of extreme values. Panel
A provides information on bond characteristics. The average (median) spread for traded
bonds is 148.37 (109.56) basis points with a standard deviation of 134.65 basis points.
This means that the corporate bond yield has a premium of 1.48% compared with the
benchmark government bonds yield on average. Debt-holders require a higher return for
holding a corporate bond compared with a government bond. The mean (median) bond
rating is 13.82 (14), which means about half of the bonds in my sample belongs to the
investment grade category (above Moody‟s rating Baa2). On average, the market value
of bonds is only 1.35% of a firm‟s total asset in our sample. Compared with Oriz-
Molina (2006), the relative size of bonds in my study is much smaller than US sample.
The average bond in my sample has a duration of about 6.15 years.
Descriptive statistics on annual compensation are provided in Panel B of Table 2.3.
Each type of compensation is expressed as a fraction of total CEO compensation and
total sales. The mean (median) of total compensation is about £3.29 million (£2.45
million). On average, the total amount of annual pay received by a CEO is about 0.13%
of a firm‟s total annual sales. The CEO of the median firm receives 25.43% of total
compensation (about £623,000) as salary and 13.44% (about £329,000) as cash
bonuses. I observe that performance-vested stock options (PVSOs) dominate option
compensation compared with traditional stock options (TSOs). Share grants also
constitute a significant fraction of CEO compensation, accounting for 28.02% of annual
compensation on average. Finally, an interesting new finding is the amount of defined
benefit pension received by CEOs. The annual pension increment is on average 12.43%
of total compensation, which equals to about £397,000.
32
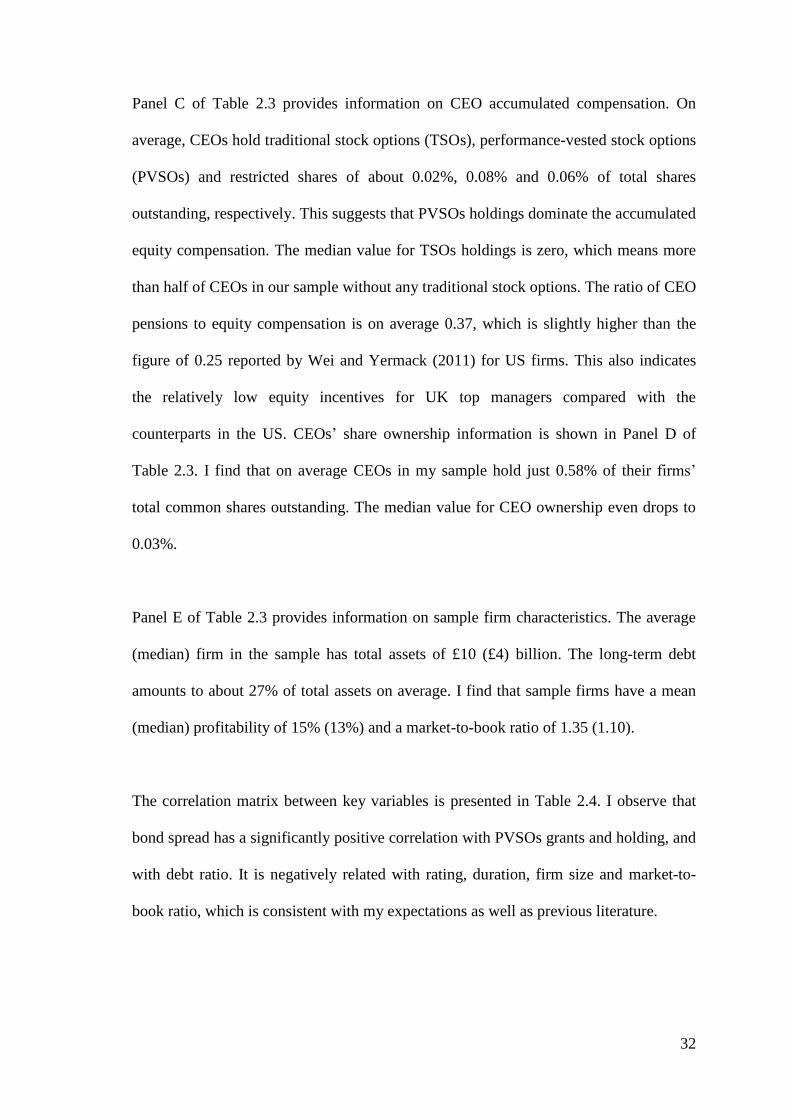
Panel C of Table 2.3 provides information on CEO accumulated compensation. On
average, CEOs hold traditional stock options (TSOs), performance-vested stock options
(PVSOs) and restricted shares of about 0.02%, 0.08% and 0.06% of total shares
outstanding, respectively. This suggests that PVSOs holdings dominate the accumulated
equity compensation. The median value for TSOs holdings is zero, which means more
than half of CEOs in our sample without any traditional stock options. The ratio of CEO
pensions to equity compensation is on average 0.37, which is slightly higher than the
figure of 0.25 reported by Wei and Yermack (2011) for US firms. This also indicates
the relatively low equity incentives for UK top managers compared with the
counterparts in the US. CEOs‟ share ownership information is shown in Panel D of
Table 2.3. I find that on average CEOs in my sample hold just 0.58% of their firms‟
total common shares outstanding. The median value for CEO ownership even drops to
0.03%.
Panel E of Table 2.3 provides information on sample firm characteristics. The average
(median) firm in the sample has total assets of £10 (£4) billion. The long-term debt
amounts to about 27% of total assets on average. I find that sample firms have a mean
(median) profitability of 15% (13%) and a market-to-book ratio of 1.35 (1.10).
The correlation matrix between key variables is presented in Table 2.4. I observe that
bond spread has a significantly positive correlation with PVSOs grants and holding, and
with debt ratio. It is negatively related with rating, duration, firm size and market-to-
book ratio, which is consistent with my expectations as well as previous literature.
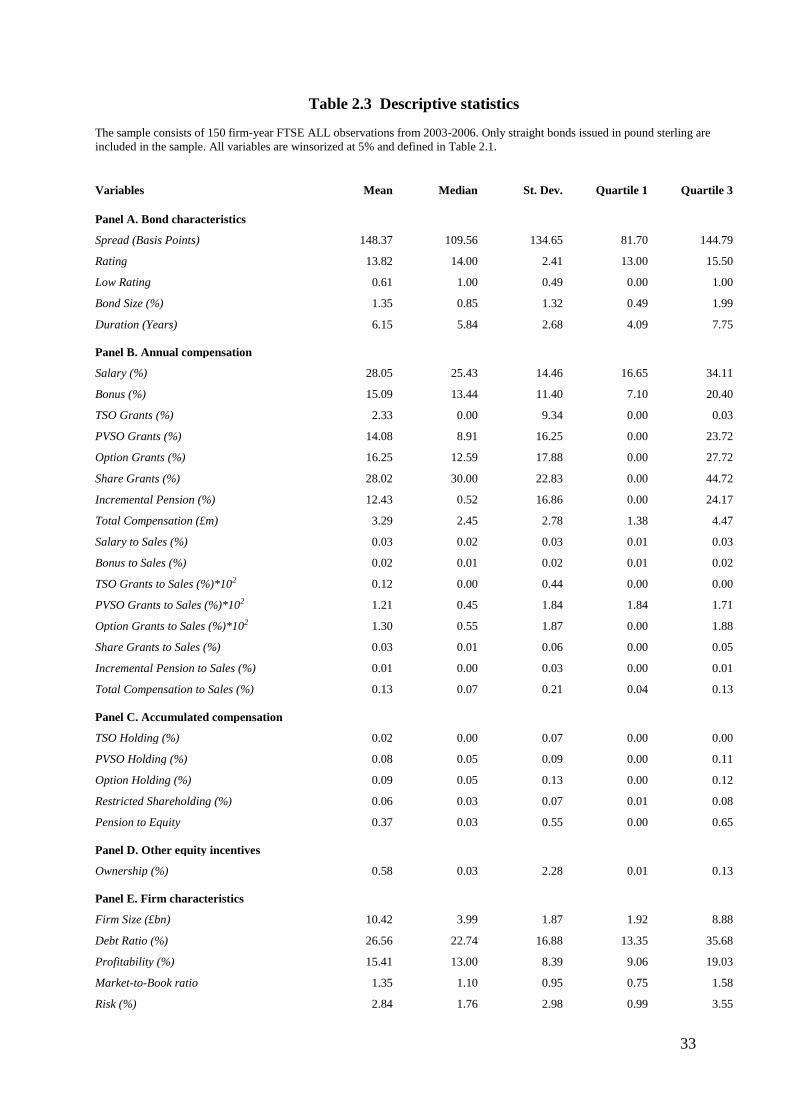
33
Table 2.3 Descriptive statistics
The sample consists of 150 firm-year FTSE ALL observations from 2003-2006. Only straight bonds issued in pound sterling are
included in the sample. All variables are winsorized at 5% and defined in Table 2.1.
Variables Mean Median St. Dev. Quartile 1 Quartile 3
Panel A. Bond characteristics
Spread (Basis Points) 148.37 109.56 134.65 81.70 144.79
Rating 13.82 14.00 2.41 13.00 15.50
Low Rating 0.61 1.00 0.49 0.00 1.00
Bond Size (%) 1.35 0.85 1.32 0.49 1.99
Duration (Years) 6.15 5.84 2.68 4.09 7.75
Panel B. Annual compensation
Salary (%) 28.05 25.43 14.46 16.65 34.11
Bonus (%) 15.09 13.44 11.40 7.10 20.40
TSO Grants (%) 2.33 0.00 9.34 0.00 0.03
PVSO Grants (%) 14.08 8.91 16.25 0.00 23.72
Option Grants (%) 16.25 12.59 17.88 0.00 27.72
Share Grants (%) 28.02 30.00 22.83 0.00 44.72
Incremental Pension (%) 12.43 0.52 16.86 0.00 24.17
Total Compensation (£m) 3.29 2.45 2.78 1.38 4.47
Salary to Sales (%) 0.03 0.02 0.03 0.01 0.03
Bonus to Sales (%) 0.02 0.01 0.02 0.01 0.02
TSO Grants to Sales (%)*102 0.12 0.00 0.44 0.00 0.00
PVSO Grants to Sales (%)*102 1.21 0.45 1.84 1.84 1.71
Option Grants to Sales (%)*102 1.30 0.55 1.87 0.00 1.88
Share Grants to Sales (%) 0.03 0.01 0.06 0.00 0.05
Incremental Pension to Sales (%) 0.01 0.00 0.03 0.00 0.01
Total Compensation to Sales (%) 0.13 0.07 0.21 0.04 0.13
Panel C. Accumulated compensation
TSO Holding (%) 0.02 0.00 0.07 0.00 0.00
PVSO Holding (%) 0.08 0.05 0.09 0.00 0.11
Option Holding (%) 0.09 0.05 0.13 0.00 0.12
Restricted Shareholding (%) 0.06 0.03 0.07 0.01 0.08
Pension to Equity 0.37 0.03 0.55 0.00 0.65
Panel D. Other equity incentives
Ownership (%) 0.58 0.03 2.28 0.01 0.13
Panel E. Firm characteristics
Firm Size (£bn) 10.42 3.99 1.87 1.92 8.88
Debt Ratio (%) 26.56 22.74 16.88 13.35 35.68
Profitability (%) 15.41 13.00 8.39 9.06 19.03
Market-to-Book ratio 1.35 1.10 0.95 0.75 1.58
Risk (%) 2.84 1.76 2.98 0.99 3.55
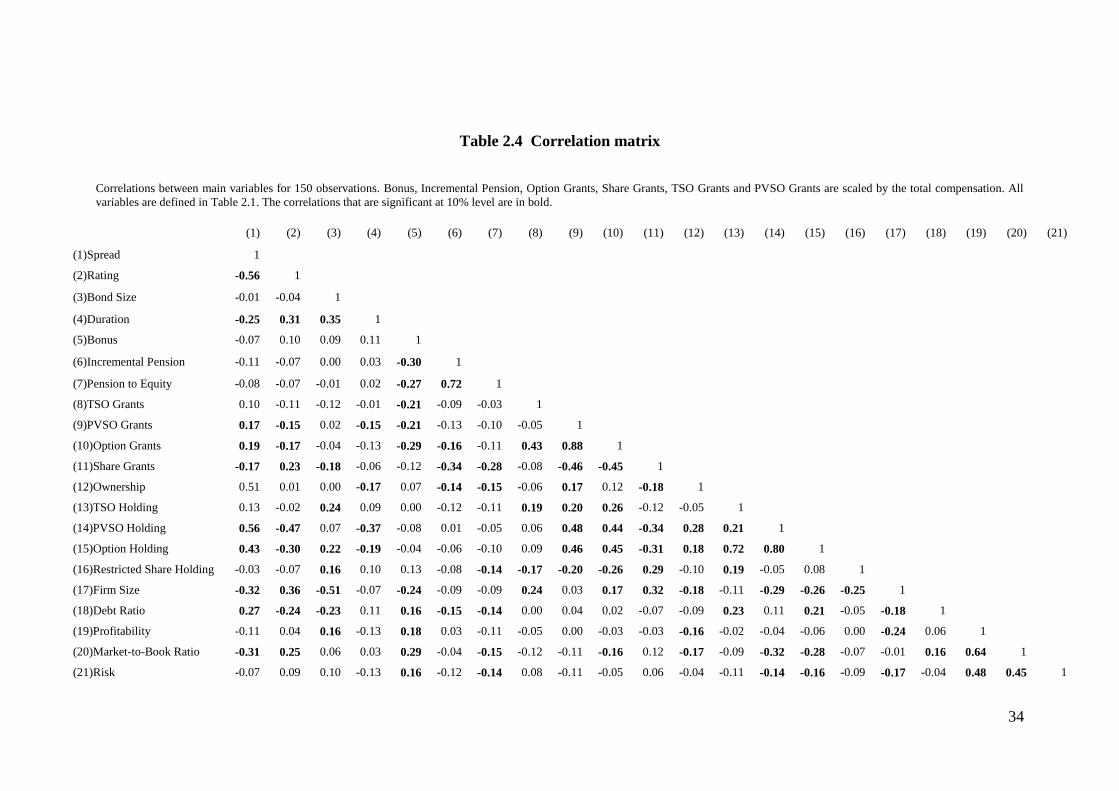
34
Table 2.4 Correlation matrix
Correlations between main variables for 150 observations. Bonus, Incremental Pension, Option Grants, Share Grants, TSO Grants and PVSO Grants are scaled by the total compensation. All
variables are defined in Table 2.1. The correlations that are significant at 10% level are in bold.
(1) (2) (3) (4) (5) (6) (7) (8) (9) (10) (11) (12) (13) (14) (15) (16) (17) (18) (19) (20) (21)
(1)Spread 1
(2)Rating -0.56 1
(3)Bond Size -0.01 -0.04 1
(4)Duration -0.25 0.31 0.35 1
(5)Bonus -0.07 0.10 0.09 0.11 1
(6)Incremental Pension -0.11 -0.07 0.00 0.03 -0.30 1
(7)Pension to Equity -0.08 -0.07 -0.01 0.02 -0.27 0.72 1
(8)TSO Grants 0.10 -0.11 -0.12 -0.01 -0.21 -0.09 -0.03 1
(9)PVSO Grants 0.17 -0.15 0.02 -0.15 -0.21 -0.13 -0.10 -0.05 1
(10)Option Grants 0.19 -0.17 -0.04 -0.13 -0.29 -0.16 -0.11 0.43 0.88 1
(11)Share Grants -0.17 0.23 -0.18 -0.06 -0.12 -0.34 -0.28 -0.08 -0.46 -0.45 1
(12)Ownership 0.51 0.01 0.00 -0.17 0.07 -0.14 -0.15 -0.06 0.17 0.12 -0.18 1
(13)TSO Holding 0.13 -0.02 0.24 0.09 0.00 -0.12 -0.11 0.19 0.20 0.26 -0.12 -0.05 1
(14)PVSO Holding 0.56 -0.47 0.07 -0.37 -0.08 0.01 -0.05 0.06 0.48 0.44 -0.34 0.28 0.21 1
(15)Option Holding 0.43 -0.30 0.22 -0.19 -0.04 -0.06 -0.10 0.09 0.46 0.45 -0.31 0.18 0.72 0.80 1
(16)Restricted Share Holding -0.03 -0.07 0.16 0.10 0.13 -0.08 -0.14 -0.17 -0.20 -0.26 0.29 -0.10 0.19 -0.05 0.08 1
(17)Firm Size -0.32 0.36 -0.51 -0.07 -0.24 -0.09 -0.09 0.24 0.03 0.17 0.32 -0.18 -0.11 -0.29 -0.26 -0.25 1
(18)Debt Ratio 0.27 -0.24 -0.23 0.11 0.16 -0.15 -0.14 0.00 0.04 0.02 -0.07 -0.09 0.23 0.11 0.21 -0.05 -0.18 1
(19)Profitability -0.11 0.04 0.16 -0.13 0.18 0.03 -0.11 -0.05 0.00 -0.03 -0.03 -0.16 -0.02 -0.04 -0.06 0.00 -0.24 0.06 1
(20)Market-to-Book Ratio -0.31 0.25 0.06 0.03 0.29 -0.04 -0.15 -0.12 -0.11 -0.16 0.12 -0.17 -0.09 -0.32 -0.28 -0.07 -0.01 0.16 0.64 1
(21)Risk -0.07 0.09 0.10 -0.13 0.16 -0.12 -0.14 0.08 -0.11 -0.05 0.06 -0.04 -0.11 -0.14 -0.16 -0.09 -0.17 -0.04 0.48 0.45 1

35
2.6. Empirical results
As discussed in Section 2.4, multivariate regressions are estimated to investigate the
impact of CEO compensation on the yield spread of firms. Firstly, I estimate the full
regression model with all pay components included (except for salary). Since each
compensation component is scaled by the total compensation, and all the compensation
components must add up to 1 by definition, I also investigate the robustness of my
results by estimating a number of regressions, dropping out different compensation
components sequentially. Finally, I estimate regressions for each individual pay
component separately. OLS results using different components of CEO pay are
presented in Panels A of Tables 2.5, 2.6 and 2.7. Fixed effects regression is also used
and presented in Panels B of Tables 2.5, 2.6 and 2.7. Fixed effects regression is
employed to control for the heterogeneity of unobserved firms. In each table, the
column beside the variable names shows the predicted sign for each of the coefficient
estimates. Table 2.5 presents results of my main regressions, estimating the relationship
between annual compensation components (measured as a percentage of total
compensation) and the cost of debt. Table 2.6 presents the same regressions, employing
an alternative measure for the compensation variables (compensation as a fraction of
total sales). Finally, I analyse the impact of the cumulative compensation (accumulated
holdings of stock options, restricted shares and ownership) on the cost of debt in Table
2.7. The results of these estimations, grouped by the compensation component, are
discussed below.
2.6.1. Cash bonus
In Panel A of Table 2.5 (columns 1 to 4), bonus is measured as a fraction of annual
compensation. I find that the coefficients of bonus remain negative in all of these
36
pooled regressions. When I include all CEO pay components in a regression (column
1), the coefficient for bonus is -1.96 at the significance level of 10%. Sequentially
dropping option grants and share grants variables from the regression (columns 2 and 3)
does not affect this result, with coefficients for bonus becoming -1.48 and -1.63
respectively and remaining statistically significant. When I test the cash bonus
component separately (column 4), the coefficient is still negative, at -1.23, with the t-
statistic of -1.55. When I use fixed effects regression in Panel B of Table 2.5, the
coefficients of bonus are -3.42 and -2.04 in columns 1 and 2, respectively. The
significance level even reaches 1%. The test for the cross-effect is also found
significant, with a cross-section Chi-square of 357 at 1% significance level. The cross-
section effect (firms specific) does exist. In Table 2.6, I employ the fraction of bonus in
total sales as an alternative proxy. The regression coefficients for cash bonus (columns
1, 2 and 4 in Panel A) are still negative, -751.08, -461.06 and -498.13, respectively,
although none of them are now statistically significant. The similar results can be found
in Panel B of Table 2.6 (Columns 1 and 2) when I employ fixed effects regression. This
difference could be caused by the fact that scaling some pay components (such as
bonus) by sales does not explicitly takes into account their relative importance for CEO
total pay, and therefore provides a weaker proxy for my analysis.
Overall, this analysis provides some evidence for my first hypothesis (H1), that more
cash bonus will lower the cost of debt. With more bonus compensation, risk-taking
incentive for CEOs is reduced to a certain extent. As bondholders price the risk-
avoiding incentives, I find a negative relationship between bonus and yield spread.
37
Regarding the control variables, I observe that most of the variables are related to yield
spread in the expected direction in both Tables 2.5 and 2.6. The regression coefficients
of rating residual and firm size in all four regressions are negative and statistically
significant at 1% level, which means that higher-rated bonds are traded at lower credit
spreads. Also as expected, bond size is negatively related to spread, indicating a
possible liquidity effect. Larger firms and companies with lower debt ratio have a lower
cost of debt. Finally, duration, profitability, market-to-book ratio and risk (as measured
by the standard deviation of profitability) have little impact on the credit spread.
2.6.2. Pension
The results of regressions analysis of the effects of annual increases to CEO pension
benefit on the cost of debt are presented in Tables 2.5 and 2.6. In Table 2.5, pension is
measured as a fraction of total compensation. The coefficients for pension pay range
from -1.52 (column 2) to -1.90 (column 1) in Panel A when OLS regression is
employed, all highly statistically significant. In column 5 of Panel A, I examine
pensions exclusively. The coefficient is -1.38 at 1% significance level. In another word,
if CEO defined benefit pension increases by 1% as a percentage of annual pay, it would
lead to a decrease in the cost of debt by 1.38 basis points. In Panel B, I use fixed effects
regression instead of OLS model. The coefficient of pension increment (column 1)
remains significantly negative. The coefficient of pension increment (column 3) is
however positive, but fails to reach the significance level.
In Table 2.6, I scale pension increment by total sales instead of total compensation.
OLS model and fixed effects model are employed in Panels A and B individually.

38
Table 2.5 Annual compensation and the cost of debt
Panel A OLS regression
Results of ordinary least squares regression of the bond yield spread on annual compensation components for 150 observations. Bonus, Incremental Pension, Option Grants, Share Grants, TSO
Grants and PVSO Grants are scaled by the total compensation. All variables are defined in Table 2.1. Coefficients for industry and year dummies are included but not reported. The t-statistics
are reported in parentheses. The asterisks *, **, *** denote statistical significance at 10%, 5%, and 1% level, respectively.
Variables Exp. Sign (1) (2) (3) (4) (5) (6) (7) (8)
Intercept 509.03*** 500.04*** 500.07*** 389.08*** 384.18*** 365.28*** 358.30*** 369.21***
(5.19) (5.14) (5.16) (4.45) (4.79) (4.33) (4.47) (4.40) Bonus (-) -1.96* -1.48* -1.63* -1.23
(-1.79) (-1.67) (-1.98) (-1.55)
Incremental Pension (-) -1.90** -1.52*** -1.60*** -1.38*** (-2.49) (-2.70) (-3.01) (-2.74)
Option Grants (+) -0.13 0.29 1.12** (-0.15) (0.48) (2.04)
Share Grants (+) -0.51 0.21
(-0.74) (0.46) TSO Grants (+) 1.34
(1.34)
PVSO Grants (+) 1.12* (1.91)
Rating Residual (-) -17.55*** -16.47*** -16.41*** -22.30*** -24.72*** -21.59*** -24.02*** -21.35***
(-3.32) (-3.24) (-3.25) (-4.75) (-5.49) (-4.59) (-5.29) (-4.52) Bond Size (-) -16.07* -16.03* -15.76* -19.48** -19.12** -20.04** -18.45** -20.04**
(-1.94) (-1.94) (-1.92) (-2.40) (-2.42) (-2.46) (-2.29) (-2.45)
Duration (-) -5.08 -5.36 -5.63 (-1.30) (-1.38) (-1.47)
Firm Size (-) -38.62*** -41.48*** -41.00*** -36.44*** -37.51*** -36.89*** -38.50*** -37.37***
(-3.91) (-4.56) (-4.55) (-4.14) (-4.49) (-4.18) (-4.37) (-4.14) Debt Ratio (+) 1.81*** 1.89*** 1.90*** 1.76*** 1.48*** 1.70*** 1.73*** 1.69***
(3.06) (3.25) (3.27) (3.05) (2.63) (2.97) (3.04) (2.93)
Profitability (-) 0.09 -0.04 0.13 (0.06) (-0.02) (0.09)
Market-to-Book Ratio (-) -17.53 -18.34 -18.81
(-1.27) (-1.34) (-1.38) Risk (+) -0.03 -0.06 -0.26
(-0.01) (-0.02) (-0.07)
Adjusted R2
0.47
0.47
0.48
0.43
0.46
0.43
0.44
0.42
Wald Tests
H0: βBonus=βIncremental Pension
H0: βTSO Grants=βPVSO Grants Chi Square (p-value) 0.00 (0.97) 0.04 (0.84)
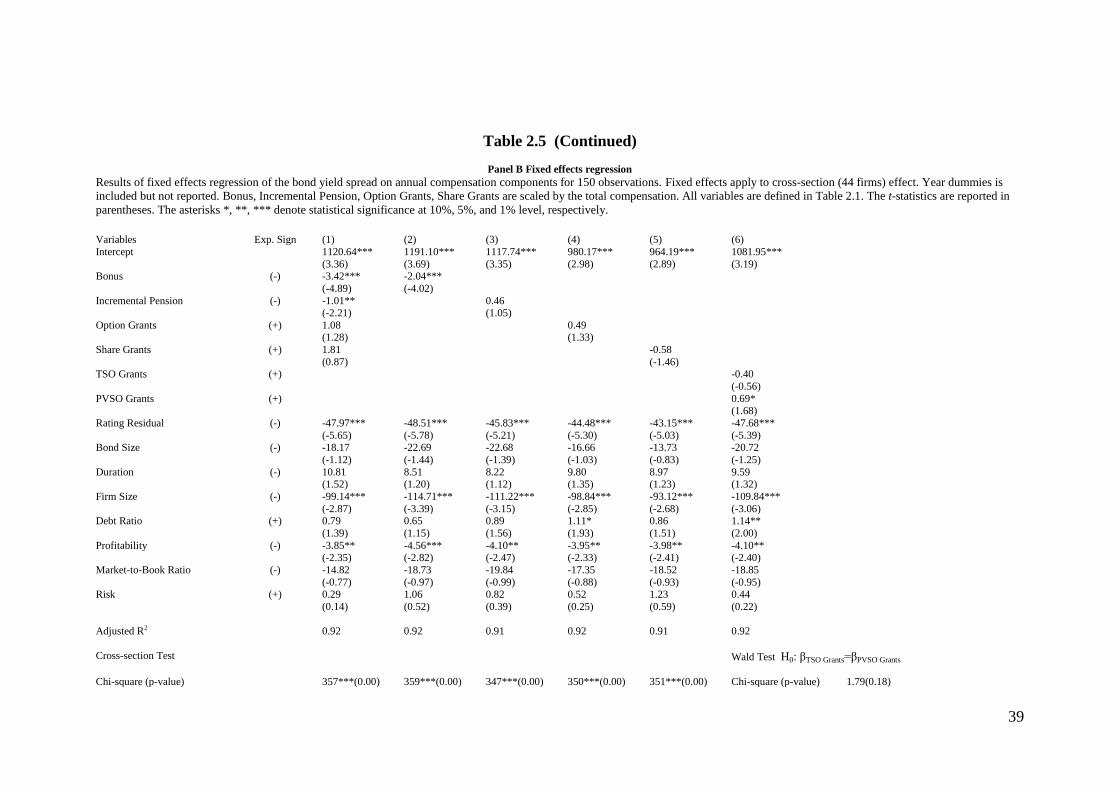
39
Table 2.5 (Continued)
Panel B Fixed effects regression
Results of fixed effects regression of the bond yield spread on annual compensation components for 150 observations. Fixed effects apply to cross-section (44 firms) effect. Year dummies is
included but not reported. Bonus, Incremental Pension, Option Grants, Share Grants are scaled by the total compensation. All variables are defined in Table 2.1. The t-statistics are reported in
parentheses. The asterisks *, **, *** denote statistical significance at 10%, 5%, and 1% level, respectively.
Variables Exp. Sign (1) (2) (3) (4) (5) (6)
Intercept 1120.64*** 1191.10*** 1117.74*** 980.17*** 964.19*** 1081.95***
(3.36) (3.69) (3.35) (2.98) (2.89) (3.19) Bonus (-) -3.42*** -2.04***
(-4.89) (-4.02)
Incremental Pension (-) -1.01** 0.46 (-2.21) (1.05)
Option Grants (+) 1.08 0.49 (1.28) (1.33)
Share Grants (+) 1.81 -0.58
(0.87) (-1.46) TSO Grants (+) -0.40
(-0.56)
PVSO Grants (+) 0.69* (1.68)
Rating Residual (-) -47.97*** -48.51*** -45.83*** -44.48*** -43.15*** -47.68***
(-5.65) (-5.78) (-5.21) (-5.30) (-5.03) (-5.39) Bond Size (-) -18.17 -22.69 -22.68 -16.66 -13.73 -20.72
(-1.12) (-1.44) (-1.39) (-1.03) (-0.83) (-1.25)
Duration (-) 10.81 8.51 8.22 9.80 8.97 9.59 (1.52) (1.20) (1.12) (1.35) (1.23) (1.32)
Firm Size (-) -99.14*** -114.71*** -111.22*** -98.84*** -93.12*** -109.84***
(-2.87) (-3.39) (-3.15) (-2.85) (-2.68) (-3.06) Debt Ratio (+) 0.79 0.65 0.89 1.11* 0.86 1.14**
(1.39) (1.15) (1.56) (1.93) (1.51) (2.00)
Profitability (-) -3.85** -4.56*** -4.10** -3.95** -3.98** -4.10** (-2.35) (-2.82) (-2.47) (-2.33) (-2.41) (-2.40)
Market-to-Book Ratio (-) -14.82 -18.73 -19.84 -17.35 -18.52 -18.85
(-0.77) (-0.97) (-0.99) (-0.88) (-0.93) (-0.95) Risk (+) 0.29 1.06 0.82 0.52 1.23 0.44
(0.14) (0.52) (0.39) (0.25) (0.59) (0.22)
Adjusted R2
0.92
0.92
0.91
0.92
0.91
0.92
Cross-section Test
Wald Test H0: βTSO Grants=βPVSO Grants
Chi-square (p-value)
357***(0.00)
359***(0.00)
347***(0.00)
350***(0.00)
351***(0.00)
Chi-square (p-value) 1.79(0.18)

40
Table 2.6 Annual compensation and the cost of debt: alternative measure
Panel A OLS regression
Results of ordinary least squares regression of the bond yield spread on annual compensation components for 150 observations. Bonus, Incremental Pension, Option Grants, Share Grants, TSO Grants and PVSO Grants
are scaled by total sales. All variables are defined in Table2.1. Coefficients for industry and year dummies are included but not reported. The t-statistics are reported in parentheses. The asterisks *, **, *** denote statistical significance at 10%, 5%, and 1% level, respectively.
Variables Exp. Sign (1) (2) (3) (4) (5) (6) (7) (8)
Intercept 486.18*** 504.77*** 460.00*** 410.07*** 411.50*** 339.60*** 321.87*** 338.80***
(4.27) (4.43) (4.07) (3.93) (4.72) (4.21) (3.70) (4.16)
Bonus to Sales (-) -751.08 -461.06 -498.13 (-1.20) (-0.77) (-0.88)
Incremental Pension to Sales (-) -625.76* -663.66* -687.25** -634.64*
(-1.81) (-1.92) (-2.00) (-1.86) Option Grants to Sales (+) 1208.33** 1128.43** 1104.47** 1229.42**
(2.43) (2.27) (2.23) (2.60)
Share Grants to Sales (+) 306.33 201.82 (1.51) (1.09)
TSO Grants to Sales (+) 1272.93
(0.64)
PVSO Grants to Sales (+) 1243.06**
(2.52)
Rating Residual (-) -16.83*** -16.58*** -17.20*** -22.22*** -22.77*** -23.35*** -23.92*** -23.16*** (-3.13) (-3.07) (-3.22) (-4.55) (-4.87) (-5.07) (-5.06) (-5.02)
Bond Size (-) -22.88** -19.24** -18.53** -18.84** -20.33** -19.61** -21.19** -19.39**
(-2.61) (-2.27) (-2.20) (-2.30) (-2.49) (-2.44) (-2.49) (-2.42) Duration (-) -3.38 -2.83 -3.79
(-0.80) (-0.27) (-0.94)
Firm Size (-) -44.16*** -43.49*** -39.47*** -40.45*** -41.46*** -34.20*** -34.64*** -34.08*** (-4.15) (-4.07) (-4.23) (-4.03) (-4.61) (-4.08) (-4.04) (-4.01)
Debt Ratio (+) 1.93*** 1.85*** 1.83*** 1.80*** 1.73*** 1.53*** 1.89*** 1.50***
(3.28) (3.13) (3.09) (3.15) (3.05) (2.70) (3.27) (2.62) Profitability (-) -0.25 -0.50 -0.38
(-0.16) (-0.33) (-0.25)
Market-to-Book Ratio (-) -20.65 -23.28* -22.02 (-1.50) (-1.69) (-1.61)
Risk (+) 0.56 1.57 0.85
(0.15) (0.42) (0.23)
Adjusted R2
0.47
0.46
0.47
0.42
0.43
0.45
0.42
0.45
Wald Tests
H0: βOption Grants= - βIncremental Pension
H0: βTSO grants=βPVSO grants Chi Square (p-value) 0.55 (0.46) 0.00 (0.99)
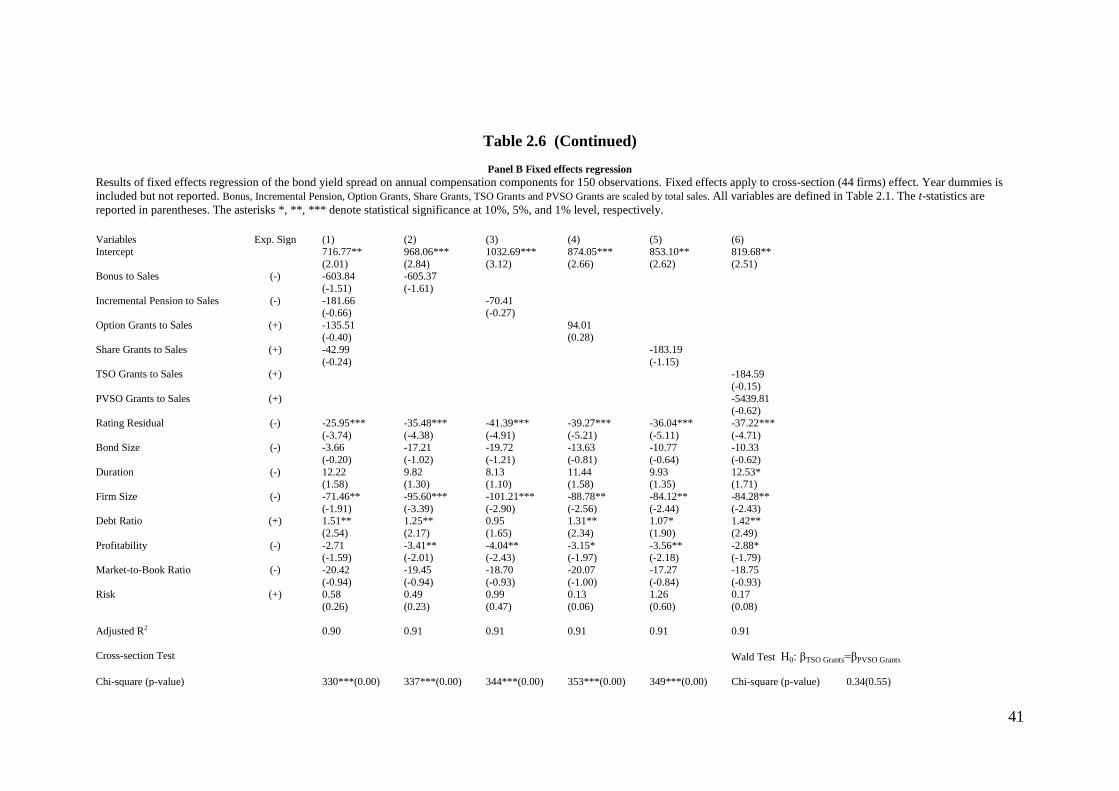
41
Table 2.6 (Continued)
Panel B Fixed effects regression
Results of fixed effects regression of the bond yield spread on annual compensation components for 150 observations. Fixed effects apply to cross-section (44 firms) effect. Year dummies is
included but not reported. Bonus, Incremental Pension, Option Grants, Share Grants, TSO Grants and PVSO Grants are scaled by total sales. All variables are defined in Table 2.1. The t-statistics are
reported in parentheses. The asterisks *, **, *** denote statistical significance at 10%, 5%, and 1% level, respectively.
Variables Exp. Sign (1) (2) (3) (4) (5) (6)
Intercept 716.77** 968.06*** 1032.69*** 874.05*** 853.10** 819.68**
(2.01) (2.84) (3.12) (2.66) (2.62) (2.51) Bonus to Sales (-) -603.84 -605.37
(-1.51) (-1.61)
Incremental Pension to Sales (-) -181.66 -70.41 (-0.66) (-0.27)
Option Grants to Sales (+) -135.51 94.01 (-0.40) (0.28)
Share Grants to Sales (+) -42.99 -183.19
(-0.24) (-1.15) TSO Grants to Sales (+) -184.59
(-0.15)
PVSO Grants to Sales (+) -5439.81 (-0.62)
Rating Residual (-) -25.95*** -35.48*** -41.39*** -39.27*** -36.04*** -37.22***
(-3.74) (-4.38) (-4.91) (-5.21) (-5.11) (-4.71) Bond Size (-) -3.66 -17.21 -19.72 -13.63 -10.77 -10.33
(-0.20) (-1.02) (-1.21) (-0.81) (-0.64) (-0.62)
Duration (-) 12.22 9.82 8.13 11.44 9.93 12.53* (1.58) (1.30) (1.10) (1.58) (1.35) (1.71)
Firm Size (-) -71.46** -95.60*** -101.21*** -88.78** -84.12** -84.28**
(-1.91) (-3.39) (-2.90) (-2.56) (-2.44) (-2.43) Debt Ratio (+) 1.51** 1.25** 0.95 1.31** 1.07* 1.42**
(2.54) (2.17) (1.65) (2.34) (1.90) (2.49)
Profitability (-) -2.71 -3.41** -4.04** -3.15* -3.56** -2.88* (-1.59) (-2.01) (-2.43) (-1.97) (-2.18) (-1.79)
Market-to-Book Ratio (-) -20.42 -19.45 -18.70 -20.07 -17.27 -18.75
(-0.94) (-0.94) (-0.93) (-1.00) (-0.84) (-0.93) Risk (+) 0.58 0.49 0.99 0.13 1.26 0.17
(0.26) (0.23) (0.47) (0.06) (0.60) (0.08)
Adjusted R2
0.90
0.91
0.91
0.91
0.91
0.91
Cross-section Test
Wald Test H0: βTSO Grants=βPVSO Grants
Chi-square (p-value)
330***(0.00)
337***(0.00)
344***(0.00)
353***(0.00)
349***(0.00)
Chi-square (p-value) 0.34(0.55)

42
Similar to the results in Table 2.5, the coefficients for pension in Panel A (from column
1 to 3) remain negative and significant in all regressions. In a separate test (column 5),
the coefficient is -634.64 at 10% significance level. This indicates that if CEO defined
benefit pension increment as a percentage of total sales increases by 1%, the bond yield
will decrease by 634.64 basis points. However, the coefficients of pension fail to reach
the significance level in Panel B when fixed effects model is employed (columns 1 and
3). The possible explanation is that the fixed effects model focuses on within variation.
The variation of pension increment is very limited for a particular CEO over period.
In summary, the evidence provided above supports my second hypothesis (H2) in
general. That is deferred CEO compensation in the form of company defined benefit
pension is effective in aligning interests of CEOs and debt-holders. Debt-holders
appreciate the unique risk-avoiding incentives provided by CEO pensions. Hence debt-
holders do take into account CEO pensions when pricing the debt. Debt-holders will
require a lower risk premium if CEOs have more pensions.
2.6.3. Stock options
Both annual option grants (Table 2.5 and 2.6) and total CEO option holdings (Table
2.7) are considered in my study. In Table 2.5, I measure option grants as a percentage of
total compensation. In panel A of Table 2.5, the OLS regression model is employed.
When other compensation components are present in the same regression, coefficients
for option grants are not significantly different from zero (columns 1 and 2). However,
when I exclude all other pay components and conduct a separate test including option
grants only (column 6), the coefficient estimate increases to 1.12, significant at 5%
level. This suggests that when option grants as a percentage of total pay increase by 1%,
43
the bond yield will increase by 1.12 basis points. In Panel B of Table 2.5, I use fixed
effects regression instead of OLS model. The coefficients of option grants (columns 1
and 4) remain positive, while fail to reach significance level.
My results from Table 2.5 are further corroborated by these estimates presented in
Table 2.6, where I employ an alternative proxy for option grants. The option grants here
are measured as a fraction of total sales, and are therefore less likely to be affected by
other compensation components. In all pooled regressions (from column 1 to 3) of
Panel A, the coefficients for option grants remain positive and highly significant. In a
separate test (column 6), I further confirm that more option grants lead to a higher cost
of debt. The coefficient is 1,229.42 at 5% significance level. This suggests that if option
grants as a percentage of total sales increase by 1%, bond yield goes up by 1,229.42
basis points. When fixed effects regression is employed in Panel B of Table 2.6
(columns 1 and 4), the coefficients of option grants fail to reach any significance level.
In Table 2.7, I use cumulative equity-based compensation as the proxy. The coefficients
of option holding are all positive and highly significant in pooled regression when OLS
model is employed (columns1, 2 and 4 of Panel A). In a separate test (column 4), the
coefficient of option holding is 346.28 at 1% significance level. This indicates that if
CEO option holding as a percentage of a firm‟s total shares outstanding increases by
1%, the bond yield spread will soar by 346.28 basis points. In Panel B, I use fixed
effects regression as the alternative model. The coefficient of option holding (column 4)
is 107, at 5% significance level. Such a result also indicates the positive relationship
between CEO option holding and the cost of debt.
44
In short, the above mentioned results provide strong evidence to support my third
hypothesis (H3), that stock options will lead to a higher cost of debt. Such results will
not be affected by different measurements of stock options and regression models
employed.
2.6.4 .Comparison between PVSOs and TSOs
As described in Section 2.3.4, I am interested to see whether debt-holders are aware of
the distinctive features of performance-vested stock options (PVSOs) and traditional
stock options (TSOs). I argue that PVSOs will increase the cost of borrowing more than
TSOs. One reason for this is that the performance-vested conditions provide incentives
for CEOs to manipulate performance targets (e.g. earnings management), which will
lower the quality of earnings and make it more difficult for bondholders to assess a
firm‟s default risks. Hence, I expect that bondholders may react differently to PVSOs
and TSOs.
In column 8 of Panel A of Table 2.5, I test the difference between PVSO grants and
TSO grants by using OLS model. The coefficients of both PVSO and TSO grants are
positive and similar in magnitude, while only that of PVSO grants reaches the
statistically significant level. However, the Wald test fails to support the hypothesis that
the difference between these coefficients is statistically significant. I conduct the same
test by using an alternative definition of PVSO and TSO grants in Panel A of Table 2.6
(column 8). I also consider fixed effects regression in Panels B of Table 2.5 and 2.6
(column 6). The results are very similar.

45
In Table 2.7, once again, I disaggregate options holdings into PVSO holdings and TSO
holdings. In panel A, OLS regression is employed. Similar to the results in columns 8 of
Panel A of Table 2.5 and Table2.6, the coefficients of PVSO and TSO holdings
(column 6) are positive, but only that of PVSO holdings is statistically significant. The
Wald test confirms that the difference is meaningful. The p-value for the Wald test is
0.08. This suggests that the difference between the coefficients of PVSOs holdings
(460.57) and that for TSOs holding (153.20) is reliable. When fixed effects regression is
adopted in Panel B of Table 2.7, the coefficients of PVSO and TSO holdings are 130.01
and 103.50, respectively (Column 6). However, the following Wald test fails to confirm
that the difference between PVSO and TSO holding is significant. Overall, I find weak
evidence that debt-holders are more sensitive to CEO holdings of performance vested
stock options (PVSOs) than traditional stock options (TSOs), and thereby require a
higher rate of return if a firm uses more PVSOs to compensate its CEOs. These results
support my fourth hypothesis (H4): PVSOs outweigh TSOs in terms of increasing the
cost of borrowing.
2.6.5. Comparison between stock options and ownership
As described in Section 2.3.5, I would like to see whether debt-holders will consider
CEO stock options and ownership differently. Because of the different pay-off
structures between stock options and ownership, the downside risk of share price is
relatively low for stock options compared with ownership. Hence I predict that stock
options will create a stronger incentive for risk-taking compared with ownership. And
creditors may consequently charge a higher price for stock options than ownership.

46
The results are shown in Table 2.7. As expected, and in line with previous research (e.g.
Ortiz-Molina, 2006), the coefficients for option holdings and ownership are both
positive and highly statistically significant in pooled regressions (columns 1 and 2 of
Panel A) and separate regressions (columns 3 and 4 of Panel A). This further confirms
that both option holdings and ownership lead to a higher cost of debt, likely by aligning
interests of shareholders and CEOs. In column 2, I examine whether the increase in the
cost of debt is similar between option holdings and ownership. The coefficient of option
holdings is 293.65, while that of ownership is only 25.97. The Wald test confirms that
the difference between these coefficients is statistically significant (p value is less than
0.00). In Panel B of Table 2.7, fixed effects regression is employed as the alternative
model. In column 2, the coefficients of ownership and option holding are 5.13 and
35.47, respectively. However, the Wald test fails to confirm such a difference is
statistically reliable. In short, the results mentioned above provide some supports for my
fifth hypothesis (H5): although both ownership and option holdings have the same
qualitative effects of increasing the cost of debt, higher CEO option holdings are seen
by the market as a much stronger signal that a CEO will act in the interests of
shareholders, to the detriment of debt-holders.
2.6.6. Restricted shares
The last pay component I analyse is restricted shares. The results are presented in
Tables 2.5, 2.6 and 2.7. In hypothesis (H6), I argue that restricted shares may increase
borrowing costs. However, the relationship between restricted shares and the cost of
debt is not confirmed by my results. In all the regressions for equity-like compensation,
including forms of annual and accumulated compensation, restricted share grants or
holdings seem to have no effect on bond yield spread. This result is consistent across

47
different measures of compensation (Tables 2.5 and 2.6) and is supported by the
estimates for restricted share holdings in Table 2.7. It seems that debt-holders are
indifferent with restricted shares. The incentives for risk-seeking or risk-avoiding from
restricted shares are still unclear.
2.6.7. Pension and credit quality
One of the main findings of my study so far is that, while equity-based compensation
can lead to a higher cost of debt by exacerbating the conflict between shareholders and
debt-holders, pension appears to have the opposite effect in mitigating this conflict.
I further investigate the relationship between CEO pensions and the cost of debt by
taking into account the riskiness of corporate bond. An incentive to reduce the riskiness
of the debt, provided to a CEO, is most likely to be effective when this risk is sizable
enough. For firms that already have very low credit risk, the additional incentives
provided by CEO compensation are likely to be less important than for companies that
pay a substantial premium to debt-holders to compensate for their credit risk. Therefore,
if the negative relationship that I observe in Tables 2.5 and 2.6 between the amounts of
debt-like CEO compensation (pension) and the yield spread is indeed driven by the
incentive effects of CEO pensions, I should expect that this relationship will be stronger
for poor-rated bonds.
I test this hypothesis in Table 2.8. In columns 1 and 2, I consider the effects of total
accumulated pension by employing the pension-to-equity ratio, similar to the
measurement used by Wei and Yermack (2011). As expected, both coefficients are
negative and statistically significant. The more debt-like wealth (pension) a CEO has
relative to his or her equity holding, the more his or her interests are aligned with those
48
of debt-holders, and the lower the costs of debt financing will be. From columns 3 to 8,
I focus on the effectiveness of pension as a risk-avoiding incentive among lower and
higher rated bonds. If pension provides a CEO with risk-avoiding incentives, such
incentives will be stronger when the default risk is high (low bond rating in this case). I
find that the coefficients for interaction variables of incremental pension and low bond
rating (columns 3 and 4) and pension-to-equity ratio and low bond rating (columns 5
and 6) are negative and highly significant. This suggests that the incentive effect of
pension, found in Tables 2.5 and 2.6, are mostly concentrated among lower-rated,
riskier bonds. To confirm this, I conduct an analysis on the subsample of 91
observations whose bond ratings are below investment grade. The results are reported
in columns 7 and 8 of Table 2.8. I find that both pension increment and pension-to-
equity ratio have a significant negative impact on the costs of debt among lower rated
bonds.
Overall, this analysis strongly supports my second hypothesis (H2), that higher levels of
defined benefit pension lead to a lower cost of debt. This result is likely to be driven by
the fact that pension aligns the interests of outside debt-holders (e.g. bondholders) and
inside debt-holders (CEOs with pension).

49
Table 2.7 Accumulated equity incentives, ownership and the cost of debt
Panel A OLS regression
Results of ordinary least squares regression of the bond yield spread on accumulated equity incentives and ownership for 150 observations. All variables are defined in Table 2.1. Coefficients for industry and year
dummies are included but not reported. The t-statistics are reported in parentheses. The asterisks *, **, *** denote statistical significance at 10%, 5%, and 1% level, respectively.
Variables Exp. Sign (1) (2) (3) (4) (5) (6)
Intercept 123.66 125.97 270.10*** 377.65*** 472.11*** 339.15***
(1.37) (1.47) (3.51) (4.78) (5.33) (4.22)
Ownership (+) 25.99*** 25.97*** 26.18*** (6.96) (7.00) (6.86)
Option Holding (+) 293.17*** 293.65*** 346.28***
(4.23) (4.67) (4.77) Restricted Share Holding (+) 10.47 -40.49
(0.09) (-0.28)
TSO Holding (+) 153.20 (1.24)
PVSO Holding (+) 460.57***
(4.57)
Rating Residual (-) -24.05*** -24.04*** -20.80*** -15.86*** -13.09** -11.05**
(-5.02) (-5.04) (-4.27) (-3.10) (-2.38) (-2.20)
Bond Size (-) -15.60** -15.57** -13.74* -23.51*** -21.28** -20.04** (-2.18) (-2.18) (-1.89) (-3.05) (-2.54) (-2.60)
Duration (-) 0.04 0.07
(0.01) (0.02) Firm Size (-) -9.21 -9.29 -21.94*** -32.26*** -40.93*** -28.89***
(-1.14) (-1.16) (-2.79) (-3.98) (-4.76) (-3.55)
Debt Ratio (+) 2.09*** 2.09*** 2.38*** 1.75*** 2.21*** 1.89*** (4.12) (4.21) (4.56) (3.08) (3.60) (3.41)
Profitability (-) 1.43 1.44
(1.09) (1.11) Market-to-Book Ratio (-) -30.82*** -30.99*** -26.51*** -19.13* -32.12*** -16.36
(-2.63) (-2.70) (-2.94) (-1.92) (-3.99) (-1.63)
Risk (+) 4.95 4.91 (1.57) (1.58)
Adjusted R2
0.62
0.63
0.55
0.48
0.39
0.50
Wald Tests
H0: βownership=βOption Holding
H0: βTSO Holding=βPVSO Holding
Chi Square (p-value) 15.02***(0.00) 3.08*(0.08)
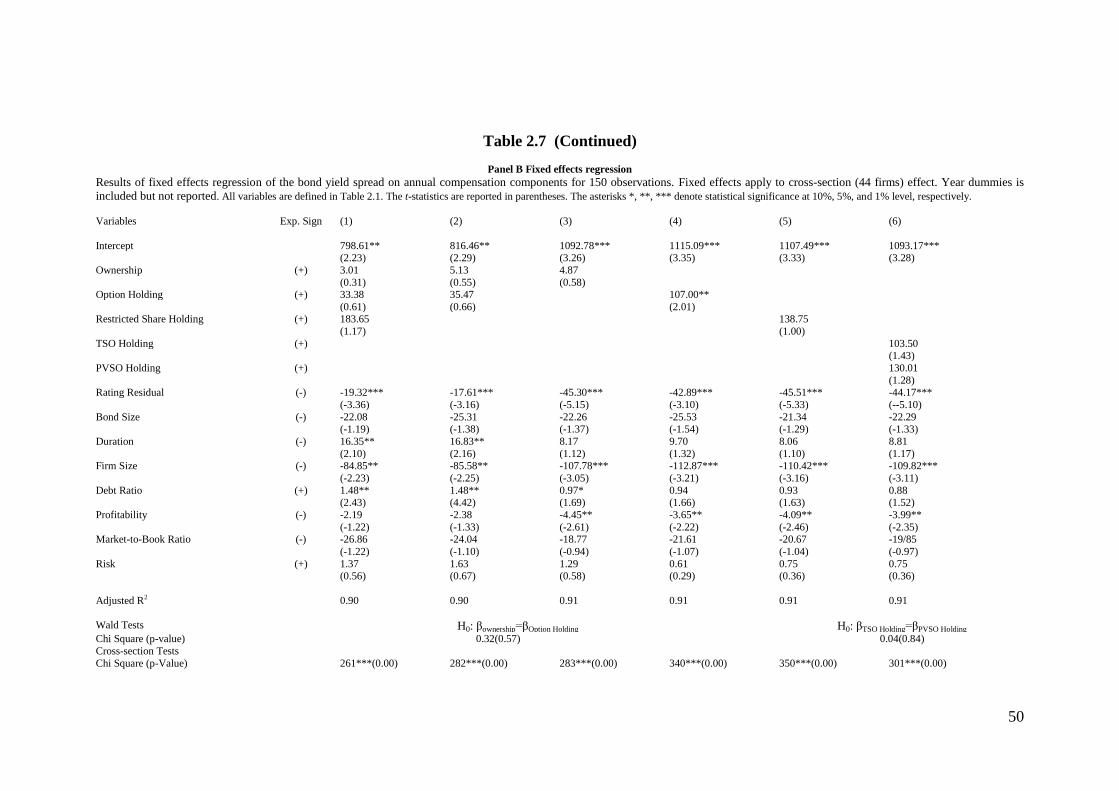
50
Table 2.7 (Continued)
Panel B Fixed effects regression
Results of fixed effects regression of the bond yield spread on annual compensation components for 150 observations. Fixed effects apply to cross-section (44 firms) effect. Year dummies is
included but not reported. All variables are defined in Table 2.1. The t-statistics are reported in parentheses. The asterisks *, **, *** denote statistical significance at 10%, 5%, and 1% level, respectively.
Variables Exp. Sign (1) (2) (3) (4) (5) (6)
Intercept 798.61** 816.46** 1092.78*** 1115.09*** 1107.49*** 1093.17*** (2.23) (2.29) (3.26) (3.35) (3.33) (3.28)
Ownership (+) 3.01 5.13 4.87
(0.31) (0.55) (0.58) Option Holding (+) 33.38 35.47 107.00**
(0.61) (0.66) (2.01) Restricted Share Holding (+) 183.65 138.75
(1.17) (1.00)
TSO Holding (+) 103.50 (1.43)
PVSO Holding (+) 130.01
(1.28)
Rating Residual (-) -19.32*** -17.61*** -45.30*** -42.89*** -45.51*** -44.17***
(-3.36) (-3.16) (-5.15) (-3.10) (-5.33) (--5.10)
Bond Size (-) -22.08 -25.31 -22.26 -25.53 -21.34 -22.29 (-1.19) (-1.38) (-1.37) (-1.54) (-1.29) (-1.33)
Duration (-) 16.35** 16.83** 8.17 9.70 8.06 8.81
(2.10) (2.16) (1.12) (1.32) (1.10) (1.17) Firm Size (-) -84.85** -85.58** -107.78*** -112.87*** -110.42*** -109.82***
(-2.23) (-2.25) (-3.05) (-3.21) (-3.16) (-3.11)
Debt Ratio (+) 1.48** 1.48** 0.97* 0.94 0.93 0.88 (2.43) (4.42) (1.69) (1.66) (1.63) (1.52)
Profitability (-) -2.19 -2.38 -4.45** -3.65** -4.09** -3.99**
(-1.22) (-1.33) (-2.61) (-2.22) (-2.46) (-2.35) Market-to-Book Ratio (-) -26.86 -24.04 -18.77 -21.61 -20.67 -19/85
(-1.22) (-1.10) (-0.94) (-1.07) (-1.04) (-0.97)
Risk (+) 1.37 1.63 1.29 0.61 0.75 0.75 (0.56) (0.67) (0.58) (0.29) (0.36) (0.36)
Adjusted R2
0.90
0.90
0.91
0.91
0.91
0.91
Wald Tests
H0: βownership=βOption Holding
H0: βTSO Holding=βPVSO Holding
Chi Square (p-value) 0.32(0.57) 0.04(0.84)
Cross-section Tests
Chi Square (p-Value) 261***(0.00) 282***(0.00) 283***(0.00) 340***(0.00) 350***(0.00) 301***(0.00)
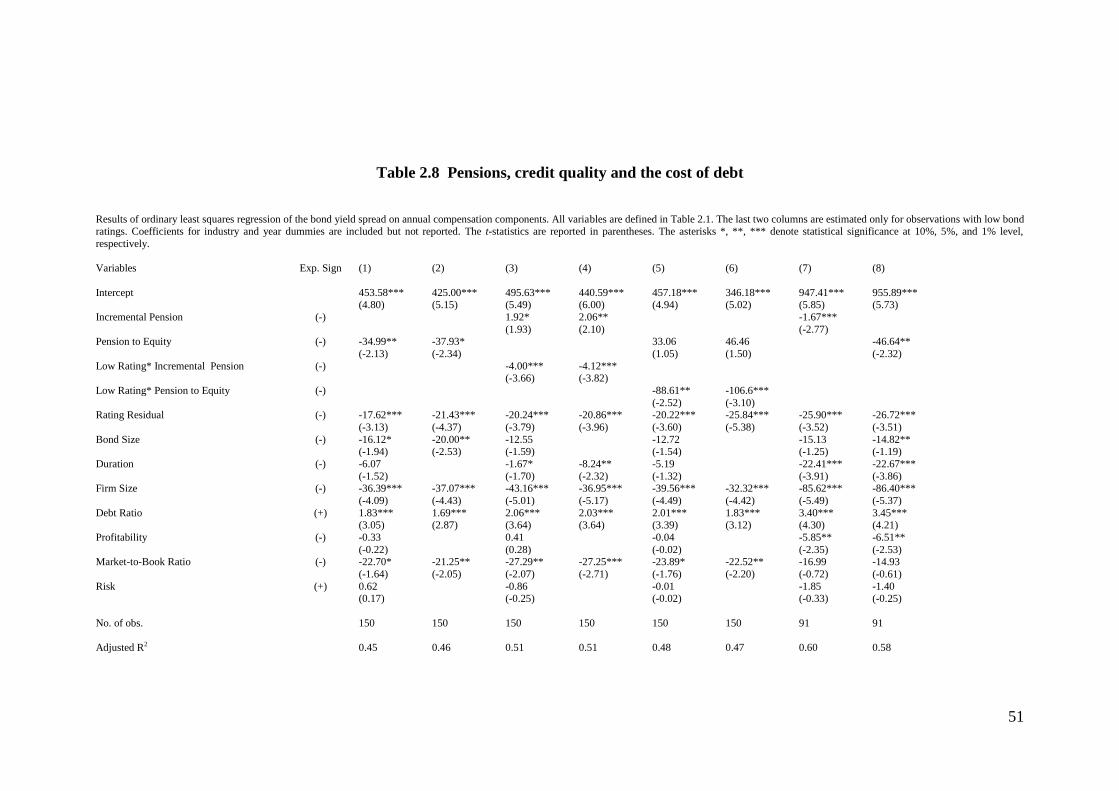
51
Table 2.8 Pensions, credit quality and the cost of debt
Results of ordinary least squares regression of the bond yield spread on annual compensation components. All variables are defined in Table 2.1. The last two columns are estimated only for observations with low bond
ratings. Coefficients for industry and year dummies are included but not reported. The t-statistics are reported in parentheses. The asterisks *, **, *** denote statistical significance at 10%, 5%, and 1% level,
respectively.
Variables Exp. Sign (1) (2) (3) (4) (5) (6) (7) (8)
Intercept 453.58*** 425.00*** 495.63*** 440.59*** 457.18*** 346.18*** 947.41*** 955.89*** (4.80) (5.15) (5.49) (6.00) (4.94) (5.02) (5.85) (5.73)
Incremental Pension (-) 1.92* 2.06** -1.67***
(1.93) (2.10) (-2.77) Pension to Equity (-) -34.99** -37.93* 33.06 46.46 -46.64**
(-2.13) (-2.34) (1.05) (1.50) (-2.32)
Low Rating* Incremental Pension (-) -4.00*** -4.12*** (-3.66) (-3.82)
Low Rating* Pension to Equity (-) -88.61** -106.6***
(-2.52) (-3.10) Rating Residual (-) -17.62*** -21.43*** -20.24*** -20.86*** -20.22*** -25.84*** -25.90*** -26.72***
(-3.13) (-4.37) (-3.79) (-3.96) (-3.60) (-5.38) (-3.52) (-3.51)
Bond Size (-) -16.12* -20.00** -12.55 -12.72 -15.13 -14.82** (-1.94) (-2.53) (-1.59) (-1.54) (-1.25) (-1.19)
Duration (-) -6.07 -1.67* -8.24** -5.19 -22.41*** -22.67***
(-1.52) (-1.70) (-2.32) (-1.32) (-3.91) (-3.86) Firm Size (-) -36.39*** -37.07*** -43.16*** -36.95*** -39.56*** -32.32*** -85.62*** -86.40***
(-4.09) (-4.43) (-5.01) (-5.17) (-4.49) (-4.42) (-5.49) (-5.37)
Debt Ratio (+) 1.83*** 1.69*** 2.06*** 2.03*** 2.01*** 1.83*** 3.40*** 3.45*** (3.05) (2.87) (3.64) (3.64) (3.39) (3.12) (4.30) (4.21)
Profitability (-) -0.33 0.41 -0.04 -5.85** -6.51**
(-0.22) (0.28) (-0.02) (-2.35) (-2.53) Market-to-Book Ratio (-) -22.70* -21.25** -27.29** -27.25*** -23.89* -22.52** -16.99 -14.93
(-1.64) (-2.05) (-2.07) (-2.71) (-1.76) (-2.20) (-0.72) (-0.61)
Risk (+) 0.62 -0.86 -0.01 -1.85 -1.40 (0.17) (-0.25) (-0.02) (-0.33) (-0.25)
No. of obs.
150
150
150
150
150
150
91
91
Adjusted R2
0.45
0.46
0.51
0.51
0.48
0.47
0.60
0.58

52
2.7. Conclusions
In this chapter I examine whether and how different CEO pay components affect firms‟
borrowing costs. I expect to observe a negative relationship between pay components
that generate risk-avoiding incentives and the cost of debt, and a positive relationship
between the borrowing cost and pay components that motivate CEOs to seek more
risks. I consider all four common pay components: bonus, pension, stock options and
restricted shares. I take the advantage of the extensive compensation disclosure
requirements in the UK by using UK data for the period of 2003-2006. My findings are
in general consistent with my expectations.
First of all, I document that debt-like compensation (defined benefit pension) and cash
bonuses reduce borrowing costs. The existence of defined benefit pensions makes
CEOs potential debt-holders of firms. It naturally aligns interests of CEOs and other
debt-holders. Therefore, borrowing costs are lower for firms that provide more defined
benefit pension to CEOs. In addition, most of this effect is concentrated among lower-
rated bonds, where the default risk is high and the risk-reducing incentives are more
desirable. In the case of cash bonuses, their main goal is to motivate CEOs to focus on
short-term profitability (such as annual earnings). Consequently, it may discourage
CEOs from seeking long-term risky investment projects. Hence, cash bonuses provide
certain levels of risk-avoiding incentives, which I show to be favorably priced by debt-
holders. My result is consistent with Duru, Manshaw and Reeb (2005). The main
difference is the proxy for bonus. They adopt the log of cash bonus (the absolute value),
while I use the percentage of cash bonus as total compensation (the relative value). My
result may provide further implication from the view of pay structure.
53
Secondly, I find that firms with a high level of stock options granted to their CEOs are
severely punished by the debt market. Theoretically, stock options and restricted shares
are expected to link CEO wealth with that of shareholders. This may motivate CEOs to
take excessive risks at the expense of debt-holders. As a result, a higher level of stock
options and restricted shares grants are expected to lead to a higher cost of debt. I find a
strong positive relationship between bond yield spread and the level of CEO stock
option holdings and grants. Moreover, the effect of stock options on bond yields is
found to be much stronger than that of CEO ownership. These results are consistent
with US studies (e.g. Ortiz-Molina, 2006; Brockman, Martin and Unlu, 2010). As far as
restricted shares are concerned, I do not find evidence that the cost of debt is positively
related to restricted shares of CEOs
Finally, I split stock options into two categories: performance-vested stock options
(PVSOs) and traditional stock options (TSOs). I argue that the performance-vested
targets on stock options may further motivate CEOs to take excessive risks to meet
these targets, which will further jeopardize bondholders‟ interests. Hence, PVSOs
should outweigh TSOs in terms of increasing the cost of debt. I show that debt-holders
do react differently to performance-vested stock options and traditional stock options.
CEOs with relatively more performance-vested stock options holdings face a higher
cost of borrowing, which confirms my hypothesis.
Overall, my study shows that the capital market rationally considers the impact of
various CEO pay components on managerial risk-taking when pricing publicly traded
debts. Consequently, optimally adjusting CEO compensation structure can be a useful
tool in reducing a firm‟s borrowing cost.

54
Chapter 3 CEO Compensation and Expectations Management
3.1. Introduction
A recent survey by Graham, Harvey and Rajgopal (2005) indicates that top managers
are truly concerned with meeting or beating financial analysts‟ earnings expectations.
This primarily comes from the importance that top managers place on share price
changes after news of reported earnings meeting or beating analysts‟ forecasts, or
failing to do so. CEOs can meet or beat analysts‟ expectations either by inflating
earnings numbers (e.g. Degeorge, Patel and Zeckhauser, 1999) or dampening analysts‟
earnings forecasts (e.g. Burgstahler and Eames, 2006). The former type of activity is
popularly known as earnings management and has been extensively investigated in a
variety of contexts. On the other hand, there is a growing research interest in the second
type of activity, commonly known as expectations management. It follows from the
remarkable discovery that analysts‟ forecasts exhibit an optimistic-pessimistic (also
called walk-down) pattern: beginning-of-period forecasts are predominantly optimistic,
while end-of-period forecasts are mostly pessimistic (e.g. Bernhardt and Campello,
2007).
Little enough is known about the causes of this phenomenon. Studies by Matsumoto
(2002) and Cotter, Tuna and Wysocki (2006) show that managers guide analysts‟
forecasts downwards in order to avoid missing market expectations for earnings.
Researchers are now examining what circumstances may encourage managers to
engage in such an opportunistic activity. Kross, Ro and Suk (2010) find that managers
are more likely to issue “bad news” managerial forecasts if their firms have a record of
meeting or achieving market expectations consistently. Richardson, Teoh and Wysocki
(2004) document that end-of-period forecast pessimism is more likely to occur towards
55
new equity issues and insider sales subsequent to a firm‟s earnings announcements. My
purpose is to explore this optimistic-pessimistic forecast pattern further by examining
CEO compensation. Specifically, I investigate whether a higher compensation creates a
stronger incentive for CEOs to engage in expectations management.
Although CEO compensation may be an interesting context in which to evaluate
whether the pattern of initial optimism and final pessimism has anything to do with
expectations management, studies rarely focus on this issue. Aboody and Kasznick
(2000) were among the first to investigate whether CEOs manage market expectations
by influencing the timing of voluntary disclosures around stock options grants. They
find that CEOs who receive their stock options before earnings announcements are
more likely to issue “bad news” forecasts and less likely to issue “good news” forecasts.
In another study, Cheng and Warfield (2005) document that shares and stock options
grants are positively related to the incidence of meeting or just beating financial
analysts‟ forecasts.
In this study, I focus on expectations management in the UK. An analysis of UK firms
offers an attractive avenue to undertake such research for a variety of reasons. First of
all, Brown and Higgins (2005) observe that expectations management is more prevalent
in countries where a strong investor protection environment puts heavy emphasis on
share prices and limits managers‟ ability to inflate earnings numbers. In their study, UK
is on the top league of the prevalence of expectations management among industrialised
courtesies. Athanakasakou, Strong and Walker (2009) also document that UK firms are
more likely to adopt expectations management rather than earnings management in
order to meet or beat analysts‟ forecasts. The underlying reasons behind the prevalence
56
of expectations management in the UK remain largely unknown. Secondly, most of
equity-based compensation in the UK is conditionally vested. A survey by KPMG
(2007) finds that UK directors‟ restricted shares and stock options are often related to
the accounting profitability (e.g. EPS growth) as well as stock return (e.g. total
shareholders return). Such features may provide strong incentives for UK directors to
avoid missing financial analysts‟ earnings forecasts. Because the literature documents a
strong negative stock price reaction to firms which fail to achieve the market
expectations (e.g. Bhojraj, Hribar, Picconi and McInnis, 2009). If expectations
management is able to help CEOs to achieve market expectations, UK CEOs may have
incentives to do so.
I perform robust cross-sectional regression analysis to investigate whether CEO
compensation encourages expectations management. The literature documents that
CEO bonuses will suffer greatly if firms fail to achieve market expectations (e.g.
Matsunaga and Park, 2001). Stock options exercises and insider sales are also found to
be positively related to the use of expectations management to meet or beat financial
analysts‟ earnings forecast (e.g. Richardson, Teoh and Wysocki, 2004). Therefore, I
focus on three variable pay components that are most likely to prop up expectations
management: bonuses, stock options and restricted shares. As for expectations
management, I use a wide variety of measures commonly used in the literature.
The results of my analysis show that CEOs are more likely to engage in expectations
management when they have a relatively high proportion of equity-based compensation
(stock options and restricted shares that are to be vested soon after earnings
announcements). The relationship is stronger when CEOs already possess a high level

57
of ownership. On the other hand, I document a negative relationship between bonuses
and the incidence of expectations management. A possible explanation is that bonuses
are mainly accounting performance based. CEOs may intend to employ alternative
methods (e.g. earnings management) rather than expectations management, in order to
achieve market expectations.
The rest of this chapter is structured as follows. In Section 3.2, I review the prior
literature. The hypotheses are developed in Section 3.3. Section 3.4 discusses the
methodology of this study. In Section 3.5, I describe the data. The empirical results are
presented in Section 3.6. I conclude this chapter in Section 3.7.
3.2. Literature review
3.2.1. CEO compensation
It is widely acknowledged that appropriate compensation may help to reduce the
principal-agent problem by aligning interests of shareholders and managers (e.g.
Aggarwal and Samwick, 1999). Equity-based compensation (stock options and shares)
is intended to take a leading role in this alignment.
In the UK, most equity-based compensation is conditionally vested. A survey by
KPMG (2007) documents that CEOs‟ restricted shares and stock options are often
related with a vesting condition which is based on prescribed total shareholder return
(TSR). The literature also suggests that both of accounting and stock based performance
targets should be considered in executive compensation package (e.g. Lambert, 1993
and Murphy, 1999). Stock price is forward-looking and a good indicator for
shareholders‟ wealth. Hence by linking CEO compensation with stock price is able to
58
encourage top managers to create values for shareholders. However, stock price is
noised and not only affected by managerial contributions and behaviour (e.g. internet
bubble in 1990s‟ and the financial crisis since 2007). To reduce the noise in stock price,
accounting performance is an alternative benchmark to make managerial actions
accountable. Another important feature of UK CEO pay is the relatively long vesting
period: most restricted shares and stock options can only be vested three years after the
initial grant (KPMG, 2007). These strict vesting conditions and the long vesting period
upon equity-based compensation are expected to strengthen the pay-for-performance
relationship.
3.2.2. Expectations management
Expectations management refers to the practice of managers purposefully dampening
analysts‟ earnings forecasts to produce a positive earnings surprise or avoid a negative
earnings surprise upon the release of earnings announcements (Bartov, Givoly and
Hayn, 2002). From an interview with US CFOs, Graham, Harvey and Rajgopal (2005)
report that several firms use earnings guidance to ease the analyst‟s job in computing
earnings forecasts. Matsumoto (2002) finds that the last consensus earnings forecasts
prior to earnings announcements tend to be pessimistically biased. This suggests that
expectations management may guide the final consensus earnings forecast downward,
making it “beatable”. Bernhardt and Campello (2007) trace the path of analysts‟
forecast revisions and find that forecasts become “pessimistic” step by step, from the
beginning to the end of the period. They describe such a revision path as a revolution
that is possibly caused by expectations management.
59
CEOs can use various channels to disclose information for possible expectations
management. The public channels CEOs can use include managerial forecasts, press
conferences, profit warnings and so on. Cotter, Tuna and Wysocki (2006) find that
analysts react to managerial forecasts quickly and are more likely to issue a final
“beatable” forecast afterwards. CEOs can also use private channels of information
disclosure to affect analyst forecasts. Based on a case study of UK firms, Holland
(2005) observes that CEOs can organize certain private or semi-private meetings with
analysts to explain firm policies, discuss public issues and so on. Ivkovic and Jegadeesh
(2004) find that the value of analyst forecast revision comes more from financial
analysts‟ different channels for collecting private information rather than a better ability
to interpret the public information.
CEOs may find it particularly advantageous to resort to disclosures that can influence
analysts‟ forecasts. Firstly, expectations management is relatively under-regulated
compared with earnings management. It is not against any implicit financial reporting
rules and bears relatively lower costs. Secondly, analysts have their own incentives to
promptly incorporate information from insiders into their forecast revisions. For
example, Hong, Kubik and Solomon (2000) find that forecast accuracy is positively
related to the likelihood of analysts‟ promotion. Therefore, analysts are motivated to
quickly incorporate insiders‟ disclosures into their forecast revisions. Thirdly, Langberg
and Sivaramakrishan (2008) argue that analysts are less suspicious of insiders‟ “bad
news” disclosures than those of “good news”. Considering that expectations
management aims to dampen analysts‟ forecasts via “bad news” disclosures, analysts
are more likely to adjust their forecasts in such circumstances.
60
3.2.3. CEO compensation and expectations management
The nature of expectations management is to opportunistically use information
disclosure to dampen market expectations. To establish such a link, two conditions are
vital: (1) CEO compensation provides incentives for certain types of disclosure; and (2)
CEOs have the opportunity to control the disclosure.
CEOs naturally lack the incentive to disclose information to outsiders, because such
information may be used to monitor and discipline CEOs themselves (e.g. Bushman and
Smith, 2001). CEOs may also prefer to release “good news” rather than “bad news”
because of the natural market reactions to news with different content (e.g. Kasznik and
Lev, 1995). However, recent studies suggest that managerial voluntary disclosure can
be dramatically affected by CEOs‟ equity-based compensation. Nagar, Nanda and
Wysocki (2003) investigate the relationship between managers‟ disclosure activities
and their stock price-based incentives. Using 1,109 US firm observations from 1995 to
1997, they find that both managerial forecast frequency and analysts‟ subjective ratings
of disclosure practice are positively related to CEOs‟ equity incentives. Hence they
argue that stock-based incentives encourage the voluntary disclosures of “good news”
but not hold the “bad news” release. The reason is that, as they explain, equity-based
compensation ties CEOs‟ wealth to stock price. The market reacts negatively to the
“silence” of “bad news”, penalizing share price as well as top managers‟ equity-based
compensation. That is why equity-based compensation may encourage not withholding
the release of “bad news”. Therefore, equity incentives align interests of shareholders
and CEOs on the issue of voluntary disclosure. However, Baik, Kang and Morton
(2010) provide evidence that managerial ownership actually provides an incentive to
create information opacity. Based on 26,000 US firm-years from 1988-2002, they
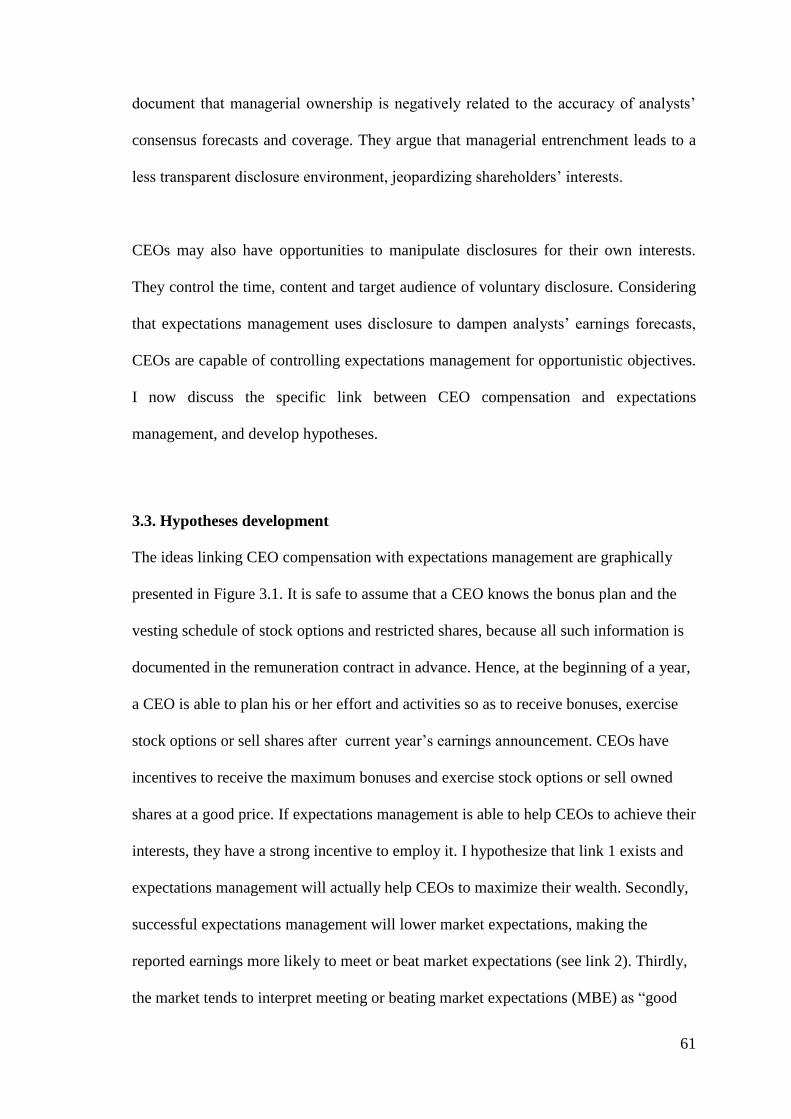
61
document that managerial ownership is negatively related to the accuracy of analysts‟
consensus forecasts and coverage. They argue that managerial entrenchment leads to a
less transparent disclosure environment, jeopardizing shareholders‟ interests.
CEOs may also have opportunities to manipulate disclosures for their own interests.
They control the time, content and target audience of voluntary disclosure. Considering
that expectations management uses disclosure to dampen analysts‟ earnings forecasts,
CEOs are capable of controlling expectations management for opportunistic objectives.
I now discuss the specific link between CEO compensation and expectations
management, and develop hypotheses.
3.3. Hypotheses development
The ideas linking CEO compensation with expectations management are graphically
presented in Figure 3.1. It is safe to assume that a CEO knows the bonus plan and the
vesting schedule of stock options and restricted shares, because all such information is
documented in the remuneration contract in advance. Hence, at the beginning of a year,
a CEO is able to plan his or her effort and activities so as to receive bonuses, exercise
stock options or sell shares after current year‟s earnings announcement. CEOs have
incentives to receive the maximum bonuses and exercise stock options or sell owned
shares at a good price. If expectations management is able to help CEOs to achieve their
interests, they have a strong incentive to employ it. I hypothesize that link 1 exists and
expectations management will actually help CEOs to maximize their wealth. Secondly,
successful expectations management will lower market expectations, making the
reported earnings more likely to meet or beat market expectations (see link 2). Thirdly,
the market tends to interpret meeting or beating market expectations (MBE) as “good

62
news”, and react positively (e.g. Bhojraj, Hribar, Picconi and McInnis, 2009). Such a
positive reaction will justify a CEO‟s bonus, as well as boost the share price, which
makes CEO stock options exercise and shares sale more profitable (see link 3).
Therefore, expectations management is assumed to be an effective way to benefit a
CEO‟s personal wealth. In other words, CEOs may employ expectations management
for personal interests. This justifies the existence of link1.
3.3.1. Cash bonus
Annual cash bonus may provide incentives for expectations management. Matsunaga
and Park (2001) investigate the effects of missing analysts‟ consensus forecast on
CEOs‟ annual bonus. Analysing US data from 1993-1997, they find that the change in a
CEO‟s bonus is lower when a firm misses the quarterly earnings forecast. This suggests
that CEOs‟ bonuses may suffer from an incremental penalty if a firm fails to achieve
market expectations. There are several possible explanations for this phenomenon. First
of all, the compensation committee may view missing market expectations as a signal
of poor managerial efforts, and penalize CEOs in response. Graham, Harvey and
Rajgopal (2005)‟s survey indicates that the capital market interprets missing market
expectations as CEOs having little control over their firm performance. Hence the
subsequent penalties on bonuses may be justified. On the other hand, achieving market
expectations is viewed as a good sign of CEOs‟ credibility and efforts. It helps the
compensation committee to justify their high bonus payment to top managers,
overcoming the political constraints on CEO compensation (e.g. Jensen and Murphy,
1990). Thirdly, the compensation committee may tie the penalty on bonuses to missing
market expectations. By doing so, CEOs are encouraged to voluntarily disclosure more
accurate and detailed information to shareholders, limiting information asymmetry.
63
Figure 3.1 Theoretical links between CEO compensation and expectations management
CEO
Compensation
1. Bonus.
2. Un-exercisable
stock options that will
soon become
exercisable.
3. Restricted shares
that will soon become
vested.
Link
1
Expectations
Management
Guiding analysts‟
expectations to a
beatable level via
managerial
information
disclosure.
Link
2 Link
3
MBE
Reported earnings
meeting or
beating the
analysts‟
expectations.
Compensation
Vesting
1. Receiving bonus.
2. Exercising stock
options.
3. Selling shares.
64
The potential penalty on bonus if a firm fails to achieve market expectations may also
motivate CEOs to “truthfully” communicate with analysts in order to generate more
accurate earnings forecasts. Therefore, I expect that bonuses received by a CEO provide
a strong incentive to avoid missing the market expectations. My hypothesis is:
H7: CEOs with more cash bonus are more likely to meet or beat
market expectations.
Expectations management may lower market expectations through managerial
information disclosure. These empirical studies also find that expectations
management helps CEOs to meet or beat market expectations (e.g. Baik and
Jiang, 2006). Therefore, I also expect a positive relationship between CEO bonus
and the incidence of expectations management. My next hypothesis is developed
as follows:
H8: CEOs with more cash bonus are more likely to conduct
expectations management.
3.3.2. Stock options and restricted shares
Stock options and restricted shares may be also related with the likelihood of
expectations management. First of all, CEOs have the incentive to exercise stock
options or selling shares shortly after earnings announcements. Since an important
condition for exercising stock options and vesting restricted shares is based on
accounting performance, CEOs may have a large amount of exercisable stock options
and increasing ownership from restricted shares vesting shortly after earnings

65
announcements. These increasing equity incentives make CEOs‟ wealth more
concentrated on a single asset: namely their firms‟ stock. It increases CEOs‟ risk
exposure to the stock market. To diversify such a risk, CEOs have incentive to engage
in insider sales, lowering their equity incentives. Based on a large US sample from 1993
to 2000, Cheng and Warfield (2005) find that un-exercisable stock options and
ownership are positively related with insider sales within six months after earnings
announcements. Hence, stock options and restricted shares are sensitive to stock price
movement shortly after earnings announcements.
Secondly, CEOs actively create “good news” prior to insider sales. Bartov and
Mohanram (2004) show that CEOs have private information that can be used to predict
future stock price. Using 17,970 CEO stock option exercise observations from 1992-
2001, they document that CEOs manipulate earnings before large stock options
exercise, so as to increase the cash payout of stock options exercises. Hillier and
Marshall (2002) focus on UK data from 1992 to 1996 and find that CEOs sell
abnormally more after “good earnings news”. They interpret that CEOs have private
information about the infomativeness of earnings and exploit the stock market in the
following insider trading.
Thirdly, expectations management helps to increase the probability of earnings to
achieve market expectations, which is interpreted as “good news” by the market. Baik
and Jiang (2006) examine the role of expectations management on achieving market
expectations. Based on their 5,703 observations in US from 1995 to 2002, they show
that 53.3% of observations meet or exceed market expectations following managerial
forecast. In contrast, the sub-sample without managerial forecast shows only 33.5% of
66
observations were able to beat market expectations. Hence they argue that expectations
management is an effective way to meet or beat financial analysts‟ earnings forecasts.
In short, CEOs‟ stock options exercise and insider sales after earnings announcements
may motivate expectations management (e.g. Richardson, Teoh and Wysocki, 2004).
Such insider sales are more likely to link with two particular equity-based compensation
components: the un-exercisable stock options and restricted shares which will be vested
in the following fiscal year (after current fiscal year‟s earnings announcement). In other
words, these two components may provide strong incentives for expectations
management. I formulate hypotheses as follows:
H9: CEOs with more equity compensation (stock options and restricted
shares) which will be vested in the following year are more likely to
meet or beat market expectations.
H10: CEOs with more equity compensation (stock options and restricted
shares) which will be vested in the following year are more likely to
conduct expectations management.
3.4. Methodology
3.4.1. Measurement of CEO compensation
In this study I focus on three CEO pay components: bonuses, stock options and
restricted shares. Bonus is measured as a fraction of cash bonus in CEO total
compensation, which is the sum of salary, bonuses, and the estimated value of stock
options and shares received during a fiscal year. Such a measurement is to address the
67
relative importance of cash bonus in total annual compensation. A bigger weight of
cash bonus in CEO annual compensation indicates a stronger incentive for top
managers to maximize his or her cash bonus. As far as stock options and restricted
shares are concerned, I use the number of shares of each equity incentives scaled by a
firm‟s total shares outstanding. In addition, dummy variables for bonuses, stock options
and restricted shares are also introduced. All compensation variables are defined in
panel A of Table 3.1
3.4.2. Measurement of expectations management
A. Bartov‟s method
Since managerial voluntary disclosures are not always publicly available, and surely not
ones with the intention to influence market expectations, it is common practice in the
literature to consider analysts‟ forecast revisions to be the main indicator of
expectations management. Following Bartov, Givoly and Hayn (2002) and Brown and
Higgins (2005), I calculate the following method to capture the possible expectations
management. CEOs are more likely to dampen analysts‟ expectations if they observe
“optimism” among analysts. The magnitude of this optimism can be captured by
analysing forecast errors. A dummy variable (Optimism) is calculated as follows:
Optimism i,t = 1 if FE i,t <0; Otherwise = 0. (2)
Where FE is the forecast error defined as the difference between the reported earnings
per share (EPS i,t) and the consensus forecast that prevailed at the beginning of the year
(AFE i,t), deflated by the firm‟s share price 12 months prior to earnings announcement

68
(Price i,t-1). The deflator is used to control any potential spurious relationship resulting
from cross-sectional scale differences in earnings per share.
Managerial disclosure activities to dampen analysts‟ expectations will typically result in
a downward forecast revision from the beginning to the end of the year. A dummy
variable (DOWN) is calculated to capture such downward forecast revisions as follows:
Down i,t = 1 if REV i,t <0; Otherwise = 0. (3)
Where REV i,t is forecast revision defined as the difference between the latest consensus
forecast prior to the earnings announcement (AFL i,t) and the consensus forecast at the
beginning of the year (AFE i,t), deflated by the share price 12 months prior to earnings
announcement (Price i,t-1).
Successful expectations management increases the likelihood of reported earnings
meeting or beating analysts‟ expectations. In other words, the final reported earnings
will exceed the last consensus earnings forecast prior to the earnings announcement.
Therefore, a dummy variable (MBE) is calculated as follows to measure whether the
reported earnings meet or beat the market expectations:
MBE i,t = 1 if ES i,t ≥0; Otherwise =0. (4)
Where ES is the amount of earnings surprise defined as the difference between the
reported earnings per share (EPS i,t) and the latest consensus forecast prior to the
earnings announcement (AFL i,t), deflated by the share price 12 months prior to earnings
69
announcement (Price i,t-1). I also construct a stringent proxy of expectations
management that is a combination of these above mentioned individual constructs:
Optimism, Down and MBE. A dummy variable (EM_Bartov) is defined as follows:
EM_Bartov i,t = 1 if Optimism i,t , Down i,t and MBE i,t = 1 ; Otherwise = 0. (5)
This new proxy variable suggests that CEOs are highly likely to conduct expectations
management when those following conditions are met: (1) there is analysts‟ optimism at
the beginning of a year (reported earnings are less than the first consensus forecast); (2)
there is a downward forecast revision from the beginning of the year to just before the
earnings announcement (the last consensus forecast is less than the first consensus
forecast); and (3) analysts‟ expectations are met or beaten when earnings are announced
(reported earnings are greater than or equal to the last consensus forecast).
The advantage of the above mentioned proxy of expectations management is that it
considers both the incentive (early analysts‟ optimism) and the successful consequence
(meeting or beating market expectations when earnings are announced). However, these
measures can still disregard a group of firms that use expectations management, yet
ultimately fail to meet or beat analysts‟ expectations. Moreover, one can argue that the
identified downward forecast revision may actually be driven by “depressed news”
from the wider market and firm-specific circumstances instead of managerial
opportunistic disclosures. Therefore, I also conduct another proxy to capture the
possible expectations management.
70
B. Matsumoto‟s method
An alternative measurement for expectations management is developed by Matsumoto
(2002) and recently adopted by Athanasakou, Strong and Walker (2009) for UK data.
According to this approach, the earnings surprise component is calculated as the
difference between the last consensus forecast and the expected portion of forecast that
takes into account overall firm-specific and market-wide developments. I model the
change in current earnings (∆EPSt) scaled by lagged price (Pt-1) as a function of two
variables: prior years‟ change in earnings (∆EPSt-1) scaled by lagged price (Pt-2), and the
cumulative excess return (CRETt) over the current year until the latest forecast is made.
The change in prior years‟ earnings captures the trends of earnings growth, while the
cumulative excess return obtains firm-specific news over the period.
∆EPS i,t /P i,t-1 = α1 + α2 * (∆EPS i,t-1 / P i,t-2) + α3 * CRET i,t+ e (6)
The above equation is employed within each industry-year. To estimate the expected
change in earnings E(∆EPSt), I adopt parameters estimated from equation (6) and
employ them in each industry-year. It is assumed that analysts can not know current
year‟s parameters (α in equation 5). They use prior years‟ parameters (β) instead.
E(∆EPS i,t) = [β1 + β2 * (∆EPS i,t-1 / P i,t-2) + β3 * CRET i,t ] * pt-1 (7)
In the next step, I estimate the expected earnings forecast (EF) by using the actual prior
year‟s earnings (EPS t-1) and the expected change in earnings E(∆EPSt).
EF i,t = EPS i,t-1 + E(∆EPS i,t). (8)
71
Finally, I compute the unexpected earnings forecast (UEF) as the difference between
the last consensus‟s forecast (AFL) and the expected earnings forecast (EF). If the UEF
is negative, it suggests that analysts‟ forecasts are lower than what we expected (or
pessimistically biased). In such a case, I suspect that expectations management may
occur. Dummy variable (EM_Matsumoto) is introduced as follows.
UEF i,t = AFL i,t - EF i,t (9)
EM_Matsumoto i,t = 1 UEF <0 ; Otherwise = 0 (10)
3.4.3. Testing models
Prior to establishing the direct link between CEO compensation and expectations
management, I should prove that CEOs do care about market expectations, because
expectations management is only one of several means available for CEOs to reach
market expectations. The following basic regression model is adopted:
MBE i,t = α0 + β Compensation i,t + ∑ λ Controls i,t + ∑ ζ Industry dummies
+ ∑ υ Year dummies +ε (11)
Next, I test the relationship between compensation and expectations management in the
following model:
EM_Bartov i,t / EM_ Matsumoto i,t = b0 + δ Compensation i,t + ∑ ρ Controls i,t
+ ∑ Ѕ Industry dummies + ∑ κ Year dummies + ν (12)

72
Following prior studies, several control variables are included in each regression model.
Earlier studies (e.g. Skinner and Sloan, 2002) find that large firms with high growth
opportunity are more likely to avoid missing market expectations. Richardson, Teoh,
Wysocki (2004) show that firms that report loss and have negative earnings growth
have stronger incentives to reach market expectations. Matsumoto (2002) argues that
several industries (such biotechnology, computers, electronics and retail) may
demonstrate higher concern for market expectations because of the concern of potential
litigation risk. I consider those factors. All variables are defined in Table 3.1.
3.5. Data
The data for CEO compensation is collected from BoardEx. It contains detailed
information on the dates when stock options become exercisable and restricted shares
are to be vested. By comparing the dates of stock option (restricted share) vesting with
fiscal year end and earnings announcement dates, I can compute how many shares of
stock options and restricted shares are to be vested in the following year. Analysts‟
forecast data is collected from International Broker‟s Estimate System (I/B/E/S). It
reports the consensus median forecasts throughout the time horizon as well as actually
earnings per share when earnings are announced. The actual date of the earnings
announcement and dates for each consensus forecast are also available. Other data for
control variables is collected from FAME or DataStream. The sample consists of non-
financial and non-utility FTSE 350 firms from the period 2002-2006. After I match
CEO compensation data from BoardEx and the consensus analysts‟ forecasts data from
I/B/E/S files, the final sample comprises of 719 firm-year observations, representing
194 large UK publicly traded firms. The sample selection and distribution are reported
in Table 3.2.

73
Table 3.1 Variables definitions
Panel A: CEO Compensation
Variable Name Definition
Total Compensation
Bonus
Bonus_Dummy
OptionNY
The sum of salary, bonuses, the estimated values of stock options and restricted shares
grants11 in a particular year.
Cash bonus scaled by total compensation.
Dummy variable equals 1 if Bonus>0, otherwise zero.
The number of shares of stock options which will be vested in the next fiscal year
(after this year‟s earnings announcement), scaled by total number of shares outstanding
(DS: NOSH).
OptionNY_Dummy
ShareNY
Dummy variable equals 1 if OptionNY>0, otherwise zero.
The number of shares of restricted shares which will be vested in the next fiscal year
(after this year‟s earnings announcement), scaled by total number of shares outstanding
(DS: NOSH).
ShareNY_Dummy
EquityNY
Dummy variable equals 1 if ShareNY>0, otherwise zero.
The sum of OptionNY and ShareNY.
EquityNY_Dummy
Ownership
Dummy variable equals 1 if EquityNY>0, otherwise zero.
The number of shares owned by the CEO scaled by total number of shares
outstanding (DS:NOSH).
Panel B: Control Variables
Variable Name Definition
MV
Growth
Profitable
Chearn
The natural log of market capitalization (DS: MV).
The market capitalization (DS: MV) scaled by the book value of equity (DS :307 ).
Dummy variable equals 1 if EPS ≥ 0, otherwise 0.
Dummy variables equals 1 ∆EPS >0, otherwise 0.
Lit
Indicator variables equals 1 if a firm belongs to a high risk industry (Datastream level 6
BIOTC, CMPSV, INTNT, SOFTW, ELETR, DSCST, ERETL, HARDL, MULTI,
SOFTG) including biotechnology, computers, electronics and retails (See Matsumoto
2002). Otherwise Lit equals 0.
11
Please see the Appendix for the estimated value of stock options and restricted shares

74
Table 3.1 (Continued)
Panel C: Expectations management
Variable Name Definition
ES
FE
REV
Earnings surprise is the difference between I/B/E/S/ reported EPS and the last
consensus forecast, scaled by the lag price (12 months prior to earnings
announcement).
Forecast error is the difference between I/B/E/S/ reported EPS and the first consensus
forecast after the last year‟s earning announcement, scaled by the lag price(12 months
prior to earnings announcement).
Forecast revision is the difference between the last consensus forecast (AFL) and the
first consensus forecast after the last year‟s earning announcement(AFE), scaled by
the lag price (12 months prior to earnings announcement).
CRET
The cumulative excess monthly return following the last year‟s earnings announcement
to the month before this year‟s earnings announcement. Excess return is firm return
less market return (FTSE All Shares Index).
UEF
Optimism
The un-expected earnings forecasts are the difference between the last consensus
forecast and the “expected” forecast. The “expected forecast” is calculated by
employing the regression model of change in earnings and CRET.
Dummy variable of market optimism equals 1 if FE<0, otherwise 0.
Down
MBE
Dummy variable of expectations down equals 1 if REV< 0, otherwise 0.
Dummy variable of meeting or beating the market expectations equals 1 if ES ≥0,
otherwise 0.
EM_Bartov
EM_ Matsumoto
Dummy variable of expectations management (using Bartov‟s method) equals 1 if
Optimism=1, Down=1 and MBE=1; otherwise 0.
Indicator variable of expectations management (using Matsumoto‟s method) equals 1
if UEF<0; otherwise 0.

75
Table 3.2 Sample selection and distribution
Number of firms Number of observations
Panel A: Sample selection
FTSE 350 firms 350 1750
Less:
Financials & Utilities
99
495
Observations with incomplete information 52 400
Observations have less than 3 analysts following 5 131
Final sample 194 719
Panel B: Year distribution
2002 98 98
2003 131 131
2004 142 142
2005 170 170
2006 178 178
Panel C: Industry distribution
Mining and Quarrying 15 58
Manufacturing 71 255
Construction 14 55
Wholesale & Retail Trade 26 97
Hotel & Restaurant 8 30
Transport & Communication 16 66
Real Estate 12 45
Others 32 113
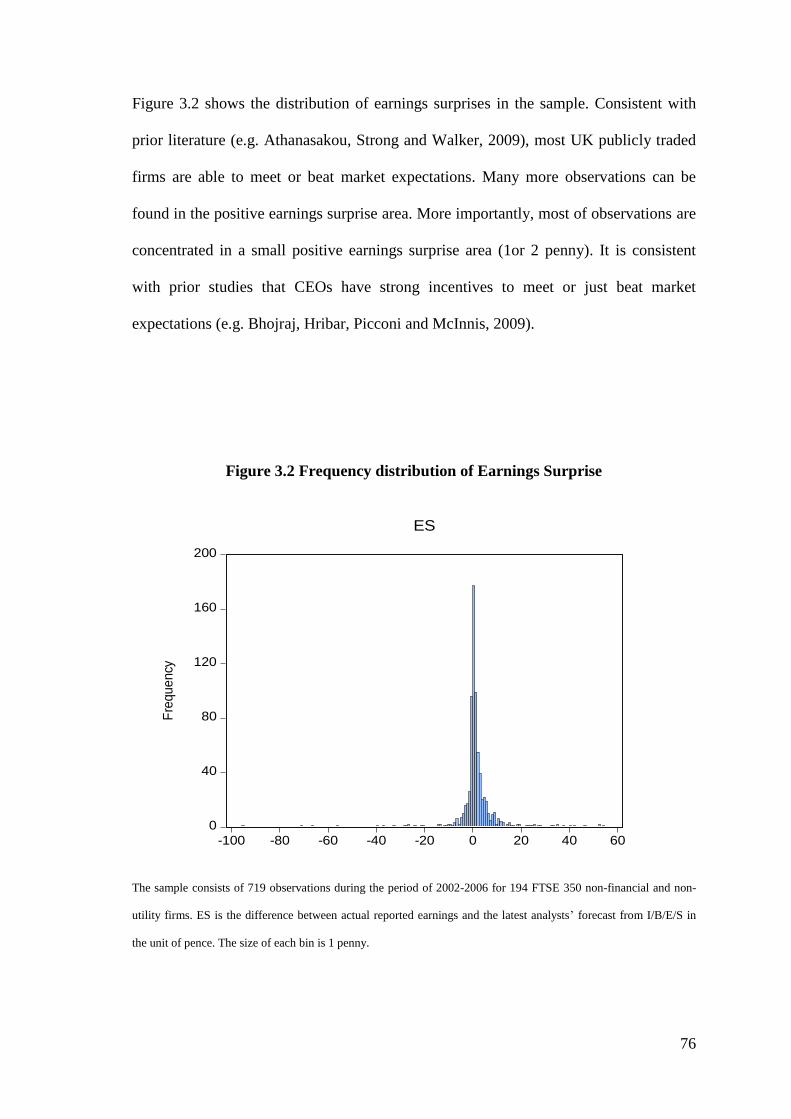
76
Figure 3.2 shows the distribution of earnings surprises in the sample. Consistent with
prior literature (e.g. Athanasakou, Strong and Walker, 2009), most UK publicly traded
firms are able to meet or beat market expectations. Many more observations can be
found in the positive earnings surprise area. More importantly, most of observations are
concentrated in a small positive earnings surprise area (1or 2 penny). It is consistent
with prior studies that CEOs have strong incentives to meet or just beat market
expectations (e.g. Bhojraj, Hribar, Picconi and McInnis, 2009).
Figure 3.2 Frequency distribution of Earnings Surprise
0
40
80
120
160
200
-100 -80 -60 -40 -20 0 20 40 60
Fre
qu
en
cy
ES
The sample consists of 719 observations during the period of 2002-2006 for 194 FTSE 350 non-financial and non-
utility firms. ES is the difference between actual reported earnings and the latest analysts‟ forecast from I/B/E/S in
the unit of pence. The size of each bin is 1 penny.

77
Table 3.3 reports the descriptive statistics for major variables. In Panel A, I can see that
the average (median) total annual compensation is £2.14 (£1.14) million. Bonuses
account for 19% of total annual compensation, with an average (median) package of
£343,000 (£225,000). As far as stock options and restricted shares grants are concerned,
restricted shares are more popular than stock options. The median value for the former
is £278,000, while that for the latter is only £75,000.
Panel B shows great variation among CEO ownership. The mean and median value for
CEO ownership is 1.02% and 0.05%, respectively. The mean (median) value for
variable EquityNY is 0.07(0.02). This means that CEOs have 0.07% equity incentives
(stock options and restricted shares which will be vested in the following year) out of a
firm‟s total share outstanding on average.
Both Panel C and Panel D in Table 3.3 report the descriptive statistics of variables to
capture expectations management. Similar to prior research, it is found that most UK
publicly traded firms can meet market expectations. The median figure for earnings
surprise (ES) is positive, and the proportion of firms meeting or beating market
expectations (MBE) is around 71.07%. Finally, the proportion of observations
documented as expectations management based on Bartov‟s method (EM_Bartov) is
17.25%. Such result is similar to those reported in Brown and Higgins (2005). The
number of observations showing the sign of expectations management based on
Matsumoto‟s method (EM_Matsumoto) is much higher, accounting for 65.79% of total
observations. This suggests that Bartov‟s method employs more strict conditions and
generates fewer suspicious observations.
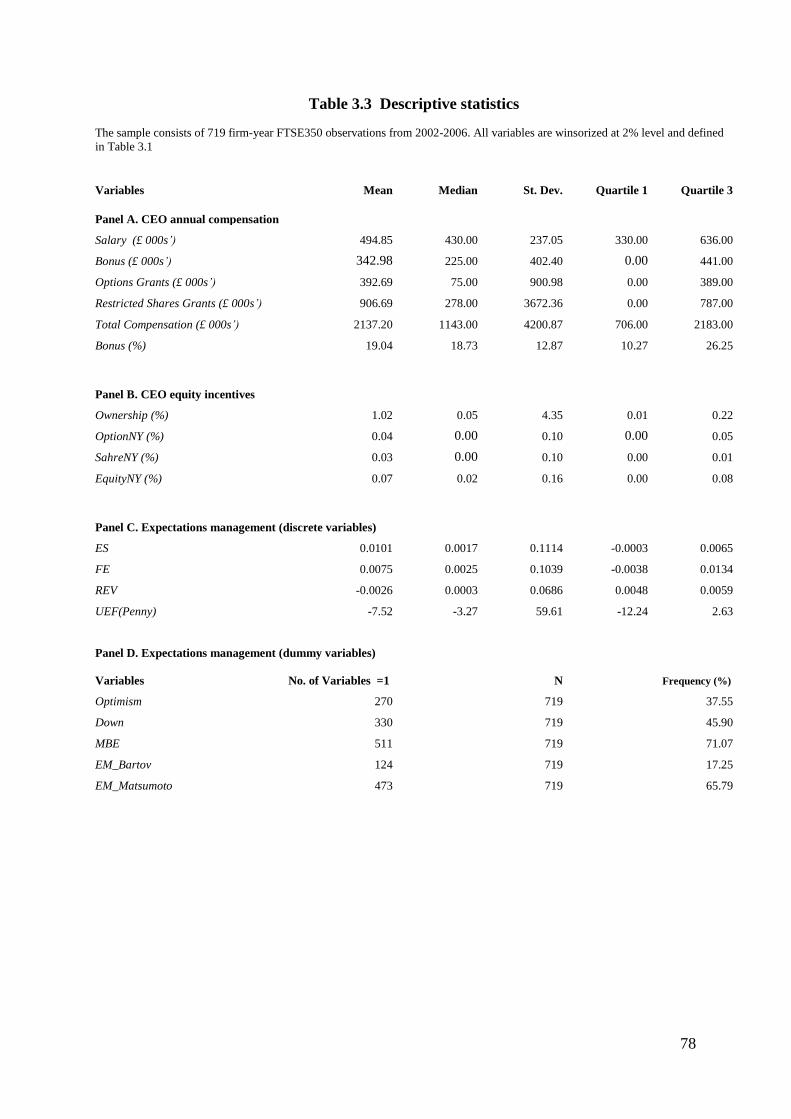
78
Table 3.3 Descriptive statistics
The sample consists of 719 firm-year FTSE350 observations from 2002-2006. All variables are winsorized at 2% level and defined
in Table 3.1
Variables Mean Median St. Dev. Quartile 1 Quartile 3
Panel A. CEO annual compensation
Salary (£ 000s’) 494.85 430.00 237.05 330.00 636.00
Bonus (£ 000s’) 342.98 225.00 402.40 0.00 441.00
Options Grants (£ 000s’) 392.69 75.00 900.98 0.00 389.00
Restricted Shares Grants (£ 000s’) 906.69 278.00 3672.36 0.00 787.00
Total Compensation (£ 000s’) 2137.20 1143.00 4200.87 706.00 2183.00
Bonus (%) 19.04 18.73 12.87 10.27 26.25
Panel B. CEO equity incentives
Ownership (%) 1.02 0.05 4.35 0.01 0.22
OptionNY (%) 0.04 0.00 0.10 0.00 0.05
SahreNY (%) 0.03 0.00 0.10 0.00 0.01
EquityNY (%) 0.07 0.02 0.16 0.00 0.08
Panel C. Expectations management (discrete variables)
ES 0.0101 0.0017 0.1114 -0.0003 0.0065
FE 0.0075 0.0025 0.1039 -0.0038 0.0134
REV -0.0026 0.0003 0.0686 0.0048 0.0059
UEF(Penny) -7.52 -3.27 59.61 -12.24 2.63
Panel D. Expectations management (dummy variables)
Variables No. of Variables =1 N Frequency (%)
Optimism 270 719 37.55
Down 330 719 45.90
MBE 511 719 71.07
EM_Bartov 124 719 17.25
EM_Matsumoto 473 719 65.79

79
The correlation matrix between key variables is reported in Table 3.4. The variable of
bonus demonstrates significantly positive correlations with earnings surprise (ES) and
meeting or beating market expectations (MBE). However, it is negatively related with
one proxy of expectations management, EM_Bartov, which is unexpected. In terms of
equity incentives which will be vested in the following year (EquityNY), it is positively
related to meeting or beating market expectations (MBE) as well as another proxy to
capture expectations management, EM_Matsumoto. This is consistent with my
expectations.
3.6. Empirical results
3.6.1. Cash bonus
First of all, I examine CEO annual cash bonus. As discussed in Section 3.3.1, I have
two hypotheses. The first is (H7): CEOs with more cash bonuses are more likely to
meet or beat market expectations. The second is (H8): Bonus is positively related with
the probability of expectations management.
The results of hypothesis (H7) are reported in the columns1and 2 of Table 3.5. As
expected, both coefficients for variables of Bonus and Bonus_Dummy are positive,
while only that for Bonus_Dummy remains statistically significant. The coefficient of
Bonus_Dummy is 0.75. This indicates that the odds ratio of meeting or beating the
market expectation for a CEO receives cash bonus, over that odds ratio for a CEO
without cash bonus is, 2.12 (e0.75
). For example, If I assume the odds ratio of meeting
or beating market expectation for a CEO without cash bonus is 2.45 (0.71/1-0.71),
based on the mean value of MBE in our sample. The corresponding odds ratio for a
CEO receiving cash bonus will be 5.19(2.12* 2.45). In another word, the probability of
80
meeting or beating the market expectations for a CEO receiving cash bonus is 0.84
(5.19/ (5.19+1). Compared with CEOs without cash bonus, the probability of meeting
or beating the market expectations increases about 13% (0.84-0.71), on the condition
that CEOs receive cash bonus. I also consider the extent of reported earnings meeting or
beating market expectations. Such results are reported in columns 1 and 2 of Table 3.6.
I find that only the variable of Bonus is positively related with earnings surprise at 5%
significance level. This suggests that when CEOs receive more bonuses, the reported
earnings will exceed market expectations by a greater magnitude. Therefore, I find
some evidence to support my hypothesis (H7): CEOs who receives bonuses are more
likely to meet or beat market expectations. Furthermore, a high level of cash bonus will
lead to a greater magnitude to exceed market expectations.
In columns 1 and 2 of Table 3.7, I test my hypothesis (H8): CEOs who receive more
bonuses are more likely to engage in expectations management. As mentioned in
Section 3.4, I use two proxies to capture possible expectations management. Hence I
split Table 3.7 in two panels: Panel A for Bartov‟s method; while panel B for
Matsumoto‟s method. In columns 1 and 2 of Panel A in Table 3.7, I find that these
coefficients for Bonus and Bonus_Dummy are both negative and for Bonus at 1%
significance level. This suggests that if CEOs receive more cash bonuses, they are less
likely to engage in expectations management (based on Bartove‟s method), which is
inconsistent with my hypothesis (H8). Similar results can also be found in columns 1
and 2 of Panel B in Table 3.7, when I use Matsumoto‟s method to define expectations
management. In short, I document that cash bonus is negatively related with the
probability of expectations management.

81
Table 3.4 Correlation Matrix
This table presents correlations among main variables. Correlations that are significant at 10% level or below are in bold. All variables are defined in Table 3.1.
(1) (2) (3) (4) (5) (6) (7) (8) (9) (10) (11) (12) (13) (14) (15) (16) (17) (18) (19)
(1 )Bonus 1
(2) EquityNY 0.11 1
(3) OptionNY 0.08 0.78 1
(4) ShareNY 0.09 0.76 0.19 1
(5) ES 0.07 0.00 -0.01 0.01 1
(6) FE 0.12 0.02 0.01 0.01 0.80 1
(7) REV 0.06 0.02 0.02 0.01 -0.41 0.22 1
(8) OPTIMISM -0.22 -0.04 -0.07 0.01 -0.10 -0.24 -0.20 1
(9) DOWN -0.20 -0.04 -0.05 -0.02 0.05 -0.13 -0.28 0.62 1
(10) MBE 0.10 0.06 0.04 0.05 0.15 0.15 -0.02 -0.43 -0.08 1
(11) EM_BARTOV -0.14 0.02 -0.02 0.05 0.00 -0.12 -0.18 0.59 0.50 0.29 1
(12) CRET 0.03 0.02 0.03 0.01 -0.02 0.03 0.08 -0.07 -0.11 0.01 -0.02 1
(13) UEF -0.02 0.13 0.21 -0.02 0.00 0.01 0.02 -0.07 -0.01 0.07 -0.04 0.09 1
(14) EM_MATSUMOTO -0.06 0.07 0.07 0.05 0.03 -0.06 -0.13 0.20 0.24 -0.12 0.11 -0.05 -0.30 1
(15) MV 0.01 -0.07 -0.12 0.01 0.01 0.03 0.03 0.00 -0.01 -0.02 0.00 -0.10 -0.05 0.00 1
(16) GROWTH -0.01 0.03 0.02 0.02 0.00 0.01 0.01 -0.04 -0.07 0.01 -0.03 -0.06 -0.01 -0.01 0.02 1
(17) PROFITABLE 0.06 0.00 -0.02 0.02 -0.04 -0.04 0.00 -0.12 -0.08 0.01 -0.09 0.08 0.05 -0.04 0.02 -0.04 1
(18) CHEARN 0.16 -0.02 -0.02 -0.02 0.00 0.08 0.13 -0.39 -0.27 0.24 -0.21 0.06 0.09 -0.22 0.07 -0.03 0.09 1
(19) LIT 0.04 -0.05 -0.04 -0.04 -0.06 -0.04 0.03 0.02 -0.03 -0.04 -0.04 -0.02 0.10 -0.03 -0.07 0.00 -0.08 0.03 1
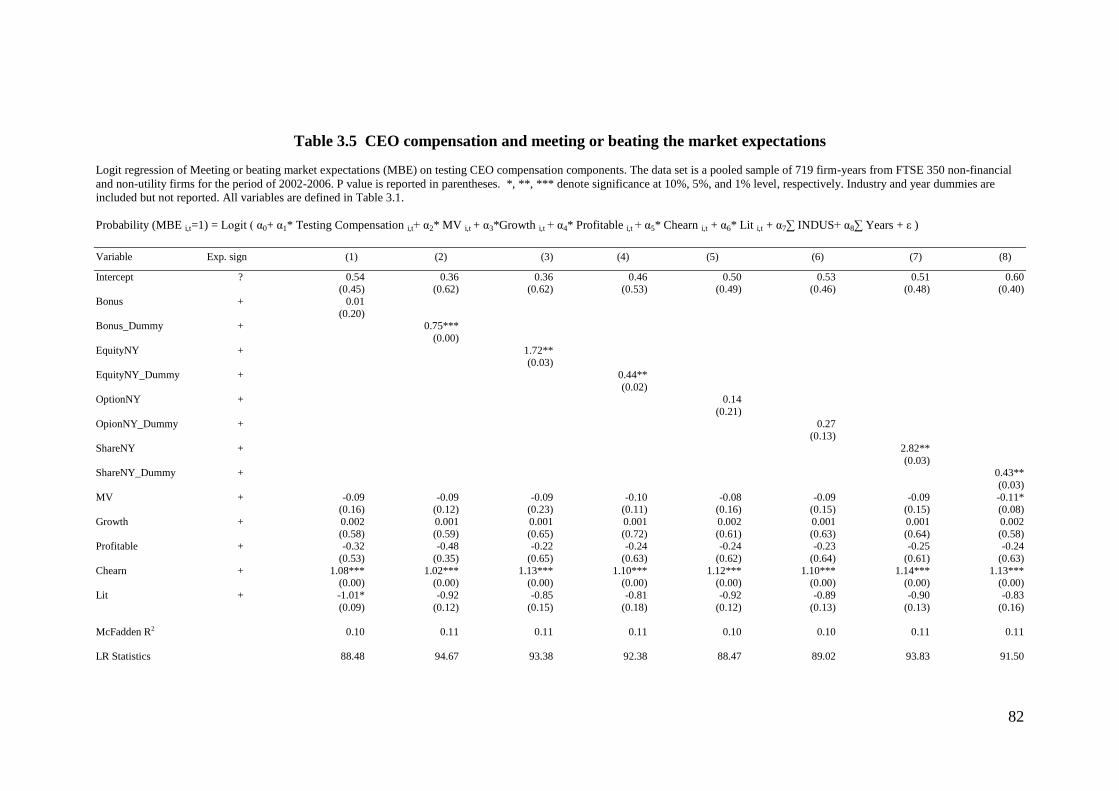
82
Table 3.5 CEO compensation and meeting or beating the market expectations
Logit regression of Meeting or beating market expectations (MBE) on testing CEO compensation components. The data set is a pooled sample of 719 firm-years from FTSE 350 non-financial
and non-utility firms for the period of 2002-2006. P value is reported in parentheses. *, **, *** denote significance at 10%, 5%, and 1% level, respectively. Industry and year dummies are
included but not reported. All variables are defined in Table 3.1.
Probability (MBE i,t=1) = Logit ( α0+ α1* Testing Compensation i,t+ α2* MV i,t + α3*Growth i,t + α4* Profitable i,t + α5* Chearn i,t + α6* Lit i,t + α7∑ INDUS+ α8∑ Years + ε )
Variable Exp. sign (1) (2) (3) (4) (5) (6) (7) (8)
Intercept ? 0.54 0.36 0.36 0.46 0.50 0.53 0.51 0.60
(0.45) (0.62) (0.62) (0.53) (0.49) (0.46) (0.48) (0.40)
Bonus + 0.01
(0.20) Bonus_Dummy + 0.75***
(0.00)
EquityNY + 1.72**
(0.03)
EquityNY_Dummy + 0.44**
(0.02)
OptionNY + 0.14
(0.21)
OpionNY_Dummy + 0.27
(0.13)
ShareNY + 2.82**
(0.03) ShareNY_Dummy + 0.43**
(0.03)
MV + -0.09 -0.09 -0.09 -0.10 -0.08 -0.09 -0.09 -0.11*
(0.16) (0.12) (0.23) (0.11) (0.16) (0.15) (0.15) (0.08)
Growth + 0.002 0.001 0.001 0.001 0.002 0.001 0.001 0.002
(0.58) (0.59) (0.65) (0.72) (0.61) (0.63) (0.64) (0.58)
Profitable + -0.32 -0.48 -0.22 -0.24 -0.24 -0.23 -0.25 -0.24
(0.53) (0.35) (0.65) (0.63) (0.62) (0.64) (0.61) (0.63)
Chearn + 1.08*** 1.02*** 1.13*** 1.10*** 1.12*** 1.10*** 1.14*** 1.13***
(0.00) (0.00) (0.00) (0.00) (0.00) (0.00) (0.00) (0.00)
Lit + -1.01* -0.92 -0.85 -0.81 -0.92 -0.89 -0.90 -0.83
(0.09) (0.12) (0.15) (0.18) (0.12) (0.13) (0.13) (0.16)
McFadden R2 0.10 0.11 0.11 0.11 0.10 0.10 0.11 0.11
LR Statistics 88.48 94.67 93.38 92.38 88.47 89.02 93.83 91.50
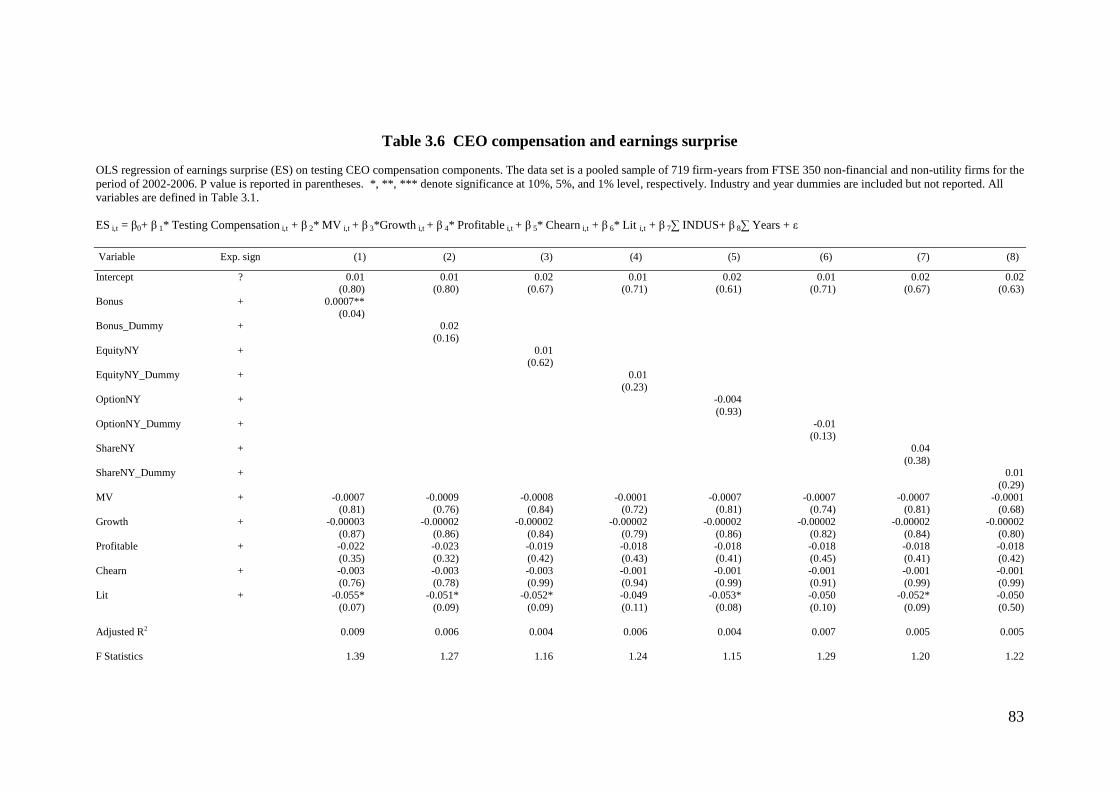
83
Table 3.6 CEO compensation and earnings surprise
OLS regression of earnings surprise (ES) on testing CEO compensation components. The data set is a pooled sample of 719 firm-years from FTSE 350 non-financial and non-utility firms for the
period of 2002-2006. P value is reported in parentheses. *, **, *** denote significance at 10%, 5%, and 1% level, respectively. Industry and year dummies are included but not reported. All
variables are defined in Table 3.1.
ES i,t = β0+ β 1* Testing Compensation i,t + β 2* MV i,t + β 3*Growth i,t + β 4* Profitable i,t + β 5* Chearn i,t + β 6* Lit i,t + β 7∑ INDUS+ β 8∑ Years + ε
Variable Exp. sign (1) (2) (3) (4) (5) (6) (7) (8)
Intercept ? 0.01 0.01 0.02 0.01 0.02 0.01 0.02 0.02
(0.80) (0.80) (0.67) (0.71) (0.61) (0.71) (0.67) (0.63)
Bonus + 0.0007**
(0.04) Bonus_Dummy + 0.02
(0.16)
EquityNY + 0.01
(0.62)
EquityNY_Dummy + 0.01
(0.23)
OptionNY + -0.004
(0.93)
OptionNY_Dummy + -0.01
(0.13)
ShareNY + 0.04
(0.38) ShareNY_Dummy + 0.01
(0.29)
MV + -0.0007 -0.0009 -0.0008 -0.0001 -0.0007 -0.0007 -0.0007 -0.0001
(0.81) (0.76) (0.84) (0.72) (0.81) (0.74) (0.81) (0.68)
Growth + -0.00003 -0.00002 -0.00002 -0.00002 -0.00002 -0.00002 -0.00002 -0.00002
(0.87) (0.86) (0.84) (0.79) (0.86) (0.82) (0.84) (0.80)
Profitable + -0.022 -0.023 -0.019 -0.018 -0.018 -0.018 -0.018 -0.018
(0.35) (0.32) (0.42) (0.43) (0.41) (0.45) (0.41) (0.42)
Chearn + -0.003 -0.003 -0.003 -0.001 -0.001 -0.001 -0.001 -0.001
(0.76) (0.78) (0.99) (0.94) (0.99) (0.91) (0.99) (0.99)
Lit + -0.055* -0.051* -0.052* -0.049 -0.053* -0.050 -0.052* -0.050
(0.07) (0.09) (0.09) (0.11) (0.08) (0.10) (0.09) (0.50)
Adjusted R2 0.009 0.006 0.004 0.006 0.004 0.007 0.005 0.005
F Statistics 1.39 1.27 1.16 1.24 1.15 1.29 1.20 1.22

84
Combining all these results mentioned above, I find that cash bonuses generate strong
incentives for CEOs to meet or beat market expectations. However, cash bonuses will
lead to a lower probability of expectations management. In other words, cash bonuses
may generate incentives for CEOs to use alternative methods of expectations
management (such as earnings management) to achieve market expectations (e.g.
Holthausen, Larcker and Sloan, 1995).
3.6.2. Stock options and restricted shares
The second type of CEO compensation I am interested is equity incentives (stock
options and restricted shares) which will be vested in the following year. My hypothesis
(H9) is that CEOs with more equity incentives which will be vested in the following
year are more likely to meet or beat market expectations. The results for this hypothesis
are reported in columns 3 to 8 in Table 3.5. As expected, the coefficients for the
variables of equity compensation, EquityNY and EquityNY _Dummy (columns 3 and
4), are both positive at 5% significance level. When I split equity incentives into stock
options (columns 5 and 6) and restricted shares (columns 7 and 8), the results remain
similar, while only those for restricted shares are statistically significant. For instance,
the variable of ShareNY (column 7) has a coefficient of 2.82, which is significant at 5%
level. These findings support my hypothesis (H9) that CEOs with more equity
incentives which will be vested in the following year are more likely to achieve market
expectations. And such an effect is mainly from restricted shares rather than stock
options. I also do an additional test on hypothesis (H9) in Table 3.6. Here I look at how
CEO equity incentives will affect the extent of achieving market expectations. The
results are reported in the columns 3 to 8 of Table 3.6. However, I fail to establish a
meaningful interpretation.
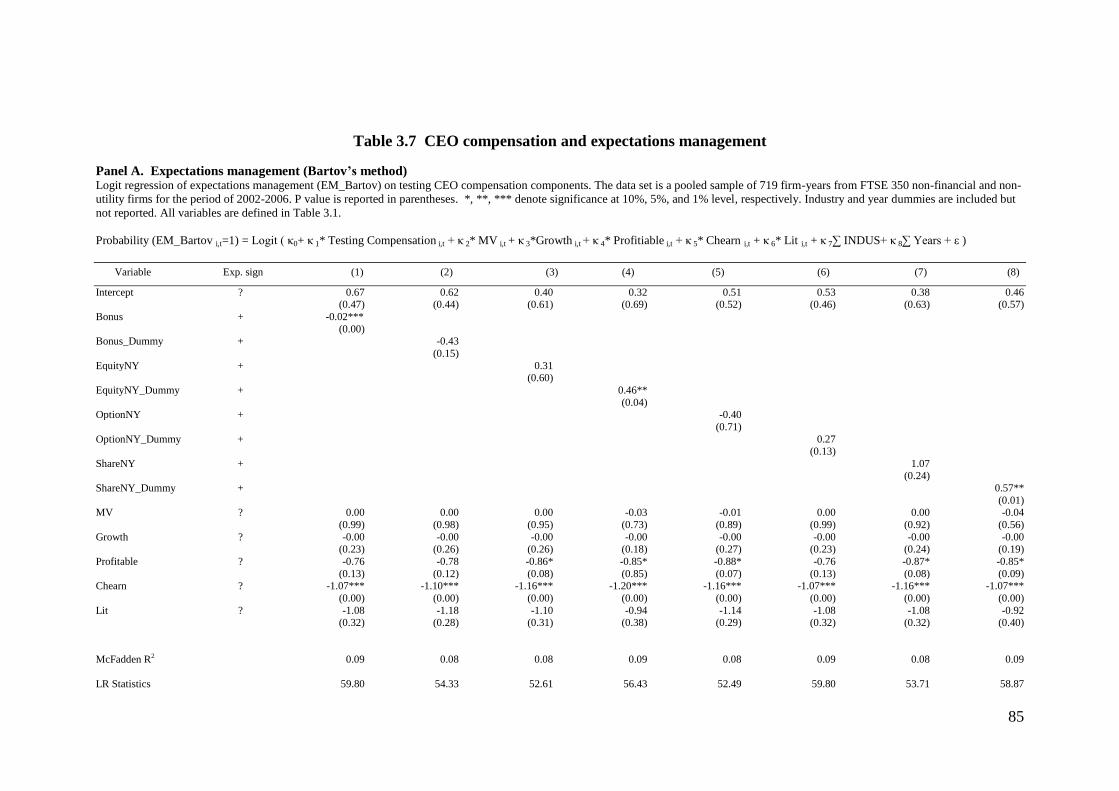
85
Table 3.7 CEO compensation and expectations management
Panel A. Expectations management (Bartov’s method) Logit regression of expectations management (EM_Bartov) on testing CEO compensation components. The data set is a pooled sample of 719 firm-years from FTSE 350 non-financial and non-
utility firms for the period of 2002-2006. P value is reported in parentheses. *, **, *** denote significance at 10%, 5%, and 1% level, respectively. Industry and year dummies are included but
not reported. All variables are defined in Table 3.1.
Probability (EM_Bartov i,t=1) = Logit ( κ0+ κ 1* Testing Compensation i,t + κ 2* MV i,t + κ 3*Growth i,t + κ 4* Profitiable i,t + κ 5* Chearn i,t + κ 6* Lit i,t + κ 7∑ INDUS+ κ 8∑ Years + ε )
Variable Exp. sign (1) (2) (3) (4) (5) (6) (7) (8)
Intercept ? 0.67 0.62 0.40 0.32 0.51 0.53 0.38 0.46 (0.47) (0.44) (0.61) (0.69) (0.52) (0.46) (0.63) (0.57)
Bonus + -0.02***
(0.00) Bonus_Dummy + -0.43
(0.15)
EquityNY + 0.31 (0.60)
EquityNY_Dummy + 0.46**
(0.04) OptionNY + -0.40
(0.71)
OptionNY_Dummy + 0.27 (0.13)
ShareNY + 1.07 (0.24)
ShareNY_Dummy + 0.57**
(0.01) MV ? 0.00 0.00 0.00 -0.03 -0.01 0.00 0.00 -0.04
(0.99) (0.98) (0.95) (0.73) (0.89) (0.99) (0.92) (0.56)
Growth ? -0.00 -0.00 -0.00 -0.00 -0.00 -0.00 -0.00 -0.00
(0.23) (0.26) (0.26) (0.18) (0.27) (0.23) (0.24) (0.19)
Profitable ? -0.76 -0.78 -0.86* -0.85* -0.88* -0.76 -0.87* -0.85*
(0.13) (0.12) (0.08) (0.85) (0.07) (0.13) (0.08) (0.09) Chearn ? -1.07*** -1.10*** -1.16*** -1.20*** -1.16*** -1.07*** -1.16*** -1.07***
(0.00) (0.00) (0.00) (0.00) (0.00) (0.00) (0.00) (0.00)
Lit ? -1.08 -1.18 -1.10 -0.94 -1.14 -1.08 -1.08 -0.92 (0.32) (0.28) (0.31) (0.38) (0.29) (0.32) (0.32) (0.40)
McFadden R2 0.09 0.08 0.08 0.09 0.08 0.09 0.08 0.09
LR Statistics 59.80 54.33 52.61 56.43 52.49 59.80 53.71 58.87

86
Table 3.7 (Continued)
Panel B. Expectations management (Matsumoto’s method) Logit regression of expectations management (EM_Matsumoto) on testing CEO compensation components. The data set is a pooled sample of 719 firm-years from FTSE 350 non-financial and
non-utility firms for the period of 2002-2006. P value is reported in parentheses. *, **, *** denote significance at 10%, 5%, and 1% level, respectively. Industry and year dummies are included
but not reported. All variables are defined in Table 3.1.
Probability (EM_Matsumoto i,t =1) = Logit ( ν0+ ν 1* Testing Compensation i,t + ν 2* MV i,t + ν 3*Growth i,t + ν 4* Profitable i,t + ν 5* Chearn + i,t ν 6* Lit i,t + ν 7∑ INDUS+ ν 8∑ Years + ε )
Variable Exp. sign (1) (2) (3) (4) (5) (6) (7) (8)
Intercept ? 3.33*** 3.56*** 3.01*** 3.06*** 3.03*** 3.10*** 3.16*** 3.20***
(0.00) (0.00) (0.00) (0.00) (0.00) (0.00) (0.00) (0.00)
Bonus + -0.01 (0.27)
Bonus_Dummy + -0.64**
(0.04) EquityNY + 1.17
(0.12)
EquityNY_Dummy + 0.39** (0.04)
OptionNY + 1.57
(0.12) OptionNY_Dummy + 0.32*
(0.07) ShareNY + 0.87
(0.40)
ShareNY_Dummy + 0.07 (0.73)
MV ? -0.04 -0.04 -0.04 -0.06 -0.03 -0.05 -0.05 -0.05
(0.49) (0.57) (0.56) (0.34) (0.62) (0.40) (0.47) (0.45) Growth ? -0.00 -0.00 -0.00 -0.00 -0.00 -0.00 -0.00 -0.00
(0.40) (0.41) (0.39) (0.34) (0.39) (0.38) (0.40) (0.40)
Profitable ? -0.81 -0.72 -0.78 -0.78 -0.78 -0.76 -0.82 -0.81 (0.13) (0.17) (0.14) (0.14) (0.14) (0.15) (0.12) (0.13)
Chearn ? -1.33*** -1.29*** -1.35*** -1.38*** -1.36*** -1.38*** -1.35*** -1.35***
(0.00) (0.00) (0.00) (0.00) (0.00) (0.00) (0.00) (0.00) Lit ? -0.77 -0.86 -0.71 -0.64 -0.72 -0.70 -0.76 -0.77
(0.21) (0.16) (0.25) (0.30) (0.24) (0.25) (0.22) (0.22)
McFadden R2
0.13
0.13
0.13
0.13
0.13
0.13
0.13
0.13
LR Statistics 121.30 124.57 123.04 124.50 122.82 123.32 120.90 120.21

87
As far as hypothesis (H10) is concerned, I intend to see whether CEO equity incentives
which will be vested in the following year will lead to a higher probability of
expectations management. These results are reported in columns 3 to 8 of Panel A
(Bartov‟s method) and Panel B (Matsumoto‟s method) of Table 3.7. In Panel A, I find
that the coefficients of variables EquityNY_Dummy and ShareNY_Dummy (columns 4
and 8) are both positive at 5% significance level, as expected. For instance, the
coefficient of EqutityNY_Dummy is 0.46. I can interpret such a coefficient as follows.
That is the odds ratio to employ expectations management (according to Bartov‟s
method) when CEOs have equity compensation to be vested in the following year, over
that odds ratio for CEOs without equity compensation vesting in the following year is
1.58 (e0.46
). If I assume the odds ratio of using expectations management for a CEO
without equity incentives vesting in the following year is 0.20 (0.17/1-0.17), based on
the mean value of expectations management (according to Bartov‟s method) in our
sample. The corresponding odds ratio for a CEO with equity incentives vesting in the
following year will be 0.32 (1.58* 0.20). In another word, the probability of employing
expectations management for a CEO with equity incentives vesting in the following
year is 0.24(0.32/ (0.32+1). Compared with CEOs without vesting equity incentives, the
probability of employing expectations management increases about 4% (0.24-0.20), if
CEOs have equity incentives to be vested in the following year.
Similar results can be found in columns 3 to 8 of Panel B in Table 3.7 when using
Matsumoto‟s method to capture possible expectations management. The coefficients of
variable EquityNY_Dummy (column 4) and OptionNY_Dummy (column 6) are both
positive at 10% significance level. This suggests that expectations management is more
likely to occur if CEOs have equity incentives (especially stock options) to be vested in

88
the following year. Overall, I find some evidences to support my hypothesis (H10):
equity incentives which will be vested in the following year will lead to a higher
probability of expectations management.
Next, I will test whether the relationship between CEO equity compensation which will
be vested in the following year and the probability of expectations management is
conditional on the level of CEO ownership. Prior studies find that CEOs have stronger
incentives to exercise stock options or engage in insider sales if they have a large
amount of equity incentives (e.g. Cheng and Warfield, 2005). The reason for this is that
CEOs would like to exercise stock options and sell shares in order to diversify the risk
of wealth concentration in their own firms‟ shares.
Therefore I expect that CEOs who have equity compensation which will be vested in
the following year will have a stronger incentive to engage in expectations management
if they have a relatively high level of ownership already. I divide my sample into two
groups: those with high ownership and those with low ownership, based on the median
value in the sample. The results are reported in Table 3.8. Consistent with my
expectations, CEOs have equity compensation which will be vested in the following
year are more likely to engage in expectations management, especially if they have
relatively high level of ownership already. The coefficients of EquityNY_Dummy,
ShareNY and ShareNY_Dummy are all positive at the significant level (at least 10%) in
high ownership group (according to Bartov‟s method). In contrast, only the coefficient
of ShrNY_dummy is positive at 10% significance level in the low ownership group.
Similar results can also be found on the right side of Table 3.8 when Matsumoto‟s
method is employed.
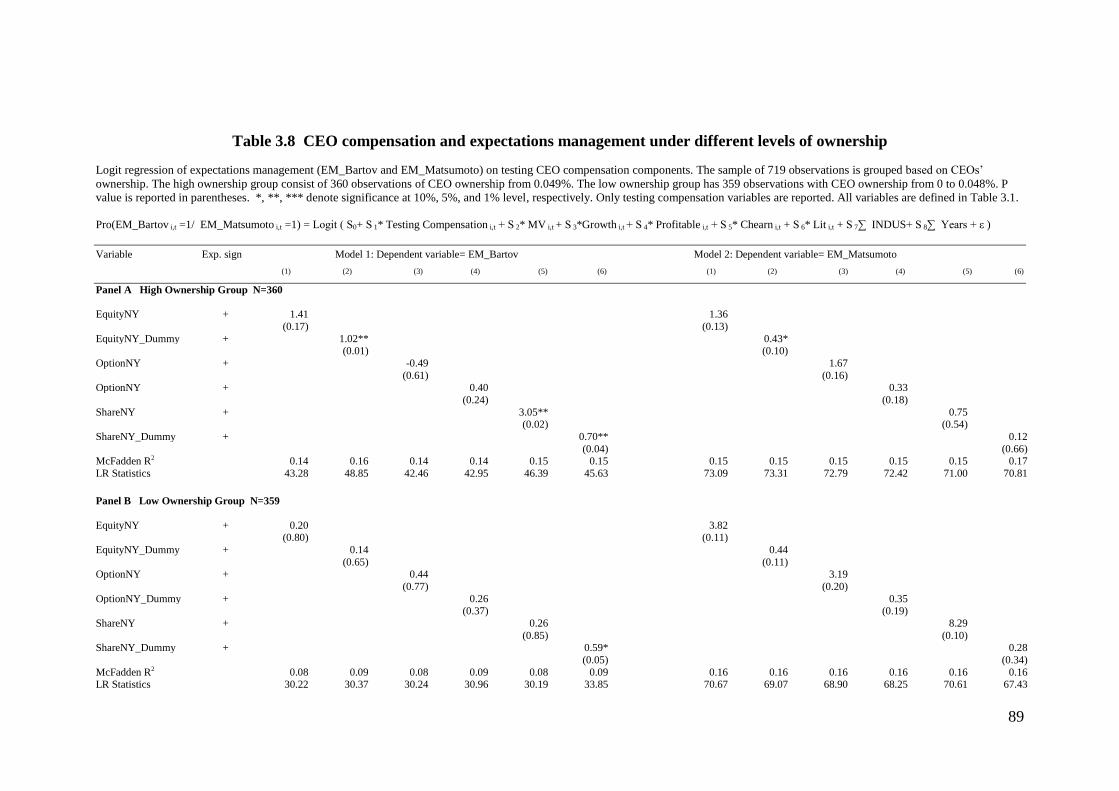
89
Table 3.8 CEO compensation and expectations management under different levels of ownership
Logit regression of expectations management (EM_Bartov and EM_Matsumoto) on testing CEO compensation components. The sample of 719 observations is grouped based on CEOs‟
ownership. The high ownership group consist of 360 observations of CEO ownership from 0.049%. The low ownership group has 359 observations with CEO ownership from 0 to 0.048%. P
value is reported in parentheses. *, **, *** denote significance at 10%, 5%, and 1% level, respectively. Only testing compensation variables are reported. All variables are defined in Table 3.1.
Pro(EM_Bartov i,t =1/ EM_Matsumoto i,t =1) = Logit ( Ѕ0+ Ѕ 1* Testing Compensation i,t + Ѕ 2* MV i,t + Ѕ 3*Growth i,t + Ѕ 4* Profitable i,t + Ѕ 5* Chearn i,t + Ѕ 6* Lit i,t + Ѕ 7∑ INDUS+ Ѕ 8∑ Years + ε )
Variable Exp. sign Model 1: Dependent variable= EM_Bartov Model 2: Dependent variable= EM_Matsumoto
(1) (2) (3) (4) (5) (6) (1) (2) (3) (4) (5) (6)
Panel A High Ownership Group N=360
EquityNY + 1.41 1.36
(0.17) (0.13)
EquityNY_Dummy + 1.02** 0.43* (0.01) (0.10)
OptionNY + -0.49 1.67
(0.61) (0.16) OptionNY + 0.40 0.33
(0.24) (0.18)
ShareNY + 3.05** 0.75 (0.02) (0.54)
ShareNY_Dummy + 0.70** 0.12
(0.04) (0.66) McFadden R2 0.14 0.16 0.14 0.14 0.15 0.15 0.15 0.15 0.15 0.15 0.15 0.17
LR Statistics 43.28 48.85 42.46 42.95 46.39 45.63 73.09 73.31 72.79 72.42 71.00 70.81
Panel B Low Ownership Group N=359
EquityNY + 0.20 3.82 (0.80) (0.11)
EquityNY_Dummy + 0.14 0.44
(0.65) (0.11) OptionNY + 0.44 3.19
(0.77) (0.20)
OptionNY_Dummy + 0.26 0.35 (0.37) (0.19)
ShareNY + 0.26 8.29
(0.85) (0.10) ShareNY_Dummy + 0.59* 0.28
(0.05) (0.34)
McFadden R2 0.08 0.09 0.08 0.09 0.08 0.09 0.16 0.16 0.16 0.16 0.16 0.16 LR Statistics 30.22 30.37 30.24 30.96 30.19 33.85 70.67 69.07 68.90 68.25 70.61 67.43
90
In summary, I find some evidence to support my hypotheses (H9) and (H10) based on
these results mentioned above. Equity incentives which will be vested in the following
year will generate strong incentives to meet or beat market expectations. Further more,
the probability of expectations management is documented to be positively related to
equity incentives which will be vested soon. In other words, partly because of equity
incentives, CEOs do care about the market expectations and have a strong incentive to
employ expectations management to achieve such a goal. This phenomenon is more
prevalent if CEOs have a high level of ownership already.
3.6.3. Sensitivity analysis
I also use alternative variables to measure CEO compensation in my analysis.
Specifically, I use the absolute monetary amount of cash bonus (Log of bonus) to
replace the variable of Bonus in the previous discussion. I also adopt the estimated
value of stock options and restricted shares which will be vested in the following year
as the alternative proxy for the variables of OptionNY and ShareNY mentioned
previously. Different levels of winsorization (1% or 5%) are also employed. These
results are similar to those in Table 3.7(detailed results are not reported in this chapter).
Hence my previous findings are not based on specific measurement methods for
compensation or driven by outliers.
3.7. Conclusions
In this chapter, I examine whether and how CEO compensation is related with
expectations management. Expectations management occurs when managers purposely
dampen market expectations in order to generate a positive earnings surprise when
earnings are announced. The literature suggests that CEO bonus, stock options exercise

91
and insider sales are positively related to the occurrence of meeting or beating market
expectations (e.g. Matsunaga and Park, 2001; Richardson, Teoh and Wysocki, 2004).
Because achieving market expectations conveys positive signals to the stock market,
thus the stock market tends to reward firms which meet or beat market expectations.
Such a market reward will help the board to justify high bonus payments, and benefit
the option exercise or insider sales as well. Therefore, bonuses, option exercise and
insider sales (after earnings announcement) may motivate CEOs to achieve market
expectations when earnings are announced. If successful expectations management will
help to achieve market expectations, CEOs may have strong incentives to employ it.
I link expectations management with three components of CEO pay: bonuses, stock
options and restricted shares that will be vested in the following year, because these pay
components can be more lucrative for CEOs if expectations management will lead to a
higher probability of achieving market expectations. The well documented positive
stock market reaction for firms which meet or beat financial analysts‟ earnings forecast
(e.g. Bhojraj, Hribar, Picconi and McInnis, 2009) justify high bonus payments and
benefit insider trading. I link the possible insider trading after earnings announcement
with two particular CEO equity compensation components: stock options and restricted
shares which will be vested in the following year. In short, I expect that CEO cash
bonus and equity compensation (stock options and restricted shares) which will be
vested in the following year will motivate CEOs to employ expectations management to
reach market expectations. My main findings are listed below.
First of all, I find that CEO bonus and equity compensation (stock options and restricted
shares) which will be vested in the following year are positively related with the

92
incidence of achieving market expectations. Those compensation components do
motivate CEOs to care about market expectations.
Secondly, I document that if CEOs have equity compensation which will be vested in
the following year, they are more likely to engage in expectations management. Such
relationship is stronger when CEOs have a high level of ownership already. This is
consistent with prior studies (e.g. Cheng and Warfield, 2005) showing that CEOs have
strong incentives to diversify the risk in a single asset (own firms‟ shares). They
actively create a favourable trading environment for stock options exercise and insider
sales. Using expectations management to meet market expectations is one such case.
Thirdly, CEO cash bonuses are documented negatively related with the probability of
expectations management. This suggests that although cash bonuses motivate CEOs to
care about market expectations, they are less likely to conduct expectations
management to achieve such an earnings benchmark. One possible explanation is that,
cash bonuses are usually tied to an accounting performance. CEOs may be more
interested in inflating the earnings number than dampening market expectations to
avoid missing market expectations.
In short, the study in this chapter provides some empirical evidence about the link
between CEO compensation and expectations management. CEOs may choose an
information disclosure strategy to favour his or her compensation pays. Such an
information manipulation motivated by CEO compensation may benefit CEOs at the
expenses of shareholders‟ interests.
93
Chapter 4 CEO Compensation, Career Horizon and Research and
Development Spending
4.1. Introduction
There is a debate in the literature about whether career horizon affects managers‟
investment decisions. As proposed by Smith and Watt (1992), the career horizon
problem hypothesizes that managers with a short career horizon are likely to reject
long-term investment projects, because these realized gains of such an investment may
not benefit exiting managers. If different lengths of career horizon lead to different
investment decisions that do not suit shareholders‟ interests, then the career horizon
problem can be viewed as a type of agency cost (e.g. Davidson, Xie, Xu and Ning,
2007). Previous literature also provides some evidence to support the idea that older
CEOs are less likely to spend on research and development (R&D hereafter) expenses
(e.g. Gibbons and Murphy, 1992a; Barker and Mueller, 2002; Lundstrum, 2002).
However, some recent studies find that the so-called career horizon problem regarding
risky investment disappears (e.g. Conyon and Florou, 2006; Cazier, 2011). They argue
that recent developments in corporate governance may limit outgoing CEOs‟ short-
sighted behaviour. Hence it is difficult to observe obvious R&D spending cuts when
CEOs approach retirement. It is interesting to examine whether the career horizon
problem, which is well documented in the literature, still exists in the UK, where the
corporate governance mechanism is well established.
In addition, few studies examine the interactive relationship between CEO
compensation and career horizon on investment decisions. One exceptional paper is
Cheng (2004). He investigates whether compensation committees deliberately adjust
stock options grants to prevent opportunistic reductions in R&D expenditure. His

94
findings indicate that retiring CEOs (aged above 63) who receive more stock option
grants will not reduce R&D spending. In a recent paper, Cazier (2011) criticizes
previous career horizon studies. He argues that CEOs near retirement may have
incentives to curtail R&D spending for personal gains; however, such a view assumes
that compensation committees neither recognize such an agency problem nor are able to
provide optimal incentive contracts to overcome it. His study clearly suggests the
possible explicit role of CEO compensation in the career horizon problem. If CEO
compensation does affect top managers‟ investment decisions, it is also interesting to
ask whether such effects will vary among different career horizon lengths. For instance,
it is widely believed that equity incentives may align interests of shareholders and
managers in terms of investment decisions. Are the incentives for risky investment from
equity incentives the same for younger CEOs, whose career horizons are long enough to
fully benefit from current investment decisions, as for older CEOs who are counting
down their remaining days in office?
This chapter seeks to answer these questions. First of all, I examine whether and how
career horizon will affect R&D spending. Secondly, I seek to find out whether and how
the interactive relationship between career horizon and CEO compensation will
influence investment decisions.
I intend to make three main contributions. First of all, I re-examine the so-called career
horizon problem by using more recent UK data. Compared with the US, both CEO
power and pay incentives in Britain are relatively weak. Such a background may limit
CEOs‟ ability and incentives to manipulate investment decisions for their self-interested
purposes. I may observe some different results compared with US studies. In addition, I

95
examine UK CEOs over a wide range of career horizon. Conyon and Florou (2006)
focus on a sample of CEO departures (especially for retirement) in Britain. The
assumption is that any cuts in R&D spending and capital expenditure are more likely to
occur in the last few years of a CEO‟s career horizon. My study intends to explore this
issue in a larger sample and over a longer career track.
Secondly, I include CEO pension in this study. Pension (defined benefit) is overlooked
in previous studies, partly because of poor data availability. Considering that the nature
of a pension is deferred and debt-like, it may generate unique incentives for risk-taking,
especially when CEOs approach retirement.
Thirdly, there is no consensus about the role of equity incentives in investment
decisions when CEOs have a short career horizon. There are two conflicting theories:
agency theory and prospect theory. Based on agency theory, CEOs with a short career
horizon may not curtail long-term value added R&D spending, if they have a large
amount of equity incentives. Chen (2004) provides evidence (based on stock option
grants) to support such a theory. On the other hand, prospect theory suggests that CEOs
with short career horizons are more likely to preserve gains from equity holdings. In
such a case, equity incentives may accentuate incentives for avoiding risks. Cutting
R&D expenses is one of the possible options. Matta and Beamish (2008) provide
evidence that CEOs with short career horizons are less likely to engage in international
acquisitions, if they have more equity incentives.
The key findings in this study are listed as follows. First of all, I do not observe the
influence of career horizon problem on investment decisions. There is no evidence that
96
CEOs will curtail R&D spending when their career horizons become short. Secondly, I
document that pension effectively discourages R&D spending among older CEOs. This
suggests that a high level of pension makes CEOs more risk-averse when the date of
retirement approaches. Thirdly, ownership will encourage R&D spending in general,
but the opposite effect occurs when CEOs become older. This is consistent with the
prospect theory for CEOs become risk-averse when their career horizon is short but
have a large amount of wealth under stock market exposure. Fourthly, restricted shares
seem to discourage R&D spending, while no such effects are found on stock options.
The remainder of this chapter is structured as follows. Section 4.2 provides the
literature review and hypotheses development. The methodology is described in Section
4.3. Sections 4.4 and 4.5 provide detailed information about the data and empirical
evidence, respectively. Conclusions are made in Section 4.6.
4.2. Literature review and hypotheses development
4.2.1. Career horizon
The career horizon problem has drawn the attention of researchers for more than a
decade (see early studies such as Dechow and Sloan, 1991). The main question is
whether and how investment decisions vary among younger and older top managers
(e.g. Gibbons and Murphy, 1992a; Murphy and Zimmerman, 1993; Conyon and Florou,
2006; Cazier, 2011). As argued by Gibbons and Murphy (1992b), older managers have
little or less career reputation concern compared with their younger counterparts.
Younger managers have stronger incentives to boost their reputation via efforts
involvement and improved performance. The labour market will update its belief on
young managers‟ abilities and reward bright ones with better future employment

97
opportunities. However, such incentives for efforts involvement decline for older CEOs
with well established reputations and shorter career horizons. In such circumstances,
more pay incentives should be introduced for older CEOs (e.g. Gibbons and Murphy,
1992b).
R&D spending may be a typical investment decision which may not fully benefit CEOs
with short career horizons. First of all, R&D spending has a long pay-back period. It
will take away precious cash flows which may be consumed for top managers‟
immediate personal interests. The cash flows pay-back may occur in the long term,
when older CEOs have left the firm already. Furthermore, R&D spending is required to
be expensed in the current period, which will lead to lower reported earnings. The
literature also provides some evidence that retiring CEOs will manipulate reported
earnings for personal gains, such as bonuses and pensions (e.g. Davidson, Xie, Xu and
Ning, 2007; Kalyta, 2009; Demers and Wang, 2010). Considering the direct
relationship between R&D spending and current reported earnings, CEOs with short
career horizons may have the incentive to sacrifice such investment for their own
interests. Previous studies also generate some evidence that older top managers may
curtail R&D spending (e.g. Gibbons and Murphy, 1992a; Barker and Mueller, 2002;
Lundstrum, 2002).
However, some studies provide quite different evidence about the career horizon
problem. Murphy and Zimmerman (1993) document that the decline in R&D
expenditure for outgoing CEOs is more likely to be explained by poor accounting
performance rather than short career horizons. By investigating UK data in the1990s,
Conyon and Florou (2006) document that retiring CEOs will not cut R&D expenditure
98
on the verge of retirement. They explain that the corporate governance mechanisms
(e.g. equity incentives for outside board members and the power of other executive
directors) may mitigate retiring CEOs‟ self-interested cut-backs on R&D spending.
Their findings echo a more recent study by Cazier (2011). He provides US evidence
that CEOs will not cut R&D spending in their final years in office. He argues that the
improved corporate governance mechanism (incentive pay, for instance) can effectively
mitigate short-sighted behaviour for outgoing CEOs. In short, there are mixed empirical
results and no consensus has been reached on the career horizon problem.
I intend to re-examine the career horizon problem in this chapter. Hence my hypothesis
still follows a traditional view of the career horizon on investment decision making (e.g.
Barker and Mueller, 2002). The specific hypothesis is listed as follows:
H11: Older CEOs will spend less on R&D expenses.
4.2.2. Pension
Pension (defined benefit plan) is a type of deferred pay for CEOs. It can also be viewed
as an inside debt, because firms are liable to pay a promised amount of pension after
CEOs retire.12
As CEOs grow older, the impact of a pension may affect CEO
investment decisions dramatically. First of all, CEOs with short career horizons are
more likely to be concerned with the safety of their pension compared with younger
CEOs. The cash out date for pensions is upon retirement. Hence older CEOs are closer
to access their pensions. This may motivate older CEOs to take actions to maximize the
probability of receiving their promised pension after retirement. If a certain type of
12
Please see the detailed explanation of why DB pension is a type of inside debt in Section 2.3.2.

99
investment (R&D spending, for instance) will create a high level of risk and decrease
the probability of pension payment, CEOs with a short career horizon may be reluctant
to invest in such projects.
Secondly, the accumulation of pension increases with CEO tenure. Firms may hold a
large amount of pension liability (defined benefit) for older CEOs, due to their previous
years‟ services. Therefore, older CEOs are more sensitive to the safety of their firms
because a large amount of their personal wealth is held in the form of their firms‟
potential debt. Hence CEOs with more pensions are likely to manage their firms
conservatively. Sundaram and Yermack (2007) document that firms who offer CEOs
more pensions are less likely to become insolvent, which is measured as the expected
distance for a firm to go burst. Their findings clearly suggest the role of pension
provision on CEO risk preference. If R&D spending is risky and may generate long-
term uncertainty in a firm, CEOs may have stronger incentives to cut such expenditure
when they hold a large amount of pension. Hence I expect that pension will accentuate
CEOs‟ incentives to cut R&D spending when they approach retirement. I hypothesize
as follows:
H12: Older CEOs with more pensions will spend less on R&D expenses
4.2.3. Equity incentives
As mentioned in Section 4.1, there is no consensus about the role of equity incentives
on the career horizon problem. There are two conflicting theories which predict
opposite relationships: agency theory and prospect theory. I discuss these theories and
related predictions as follows.

100
A. Agency theory and the “interest alignment” hypothesis
CEOs with different career horizon lengths may have different career concerns.
Gibbons and Murphy (1992b) argue that younger top managers have stronger incentives
to take actions for firm growth. By observing firm performance, the labour market can
update its belief about managers‟ abilities. Talented younger managers are more likely
to be awarded better future employment opportunities. However, career and reputation
concerns become less important as CEOs approach retirement, because older CEOs
have less career mobility options as well as a shorter employment period. At such a
point, additional incentives for risky but value-added investment are expected to be
essential for older CEOs. Without sufficient pay incentives, retiring CEOs may further
lack the motivation to make long-term and risky investments.
The role of equity pay in encouraging risk-seeking activities is well-documented (e.g.
Guay, 1999; Cole, Daniel, and Naveen, 2006). By linking CEOs‟ personal wealth with
firm value, equity incentives may motivate CEOs to make risky but value-added
investments. For instance, the convex payoff structure of stock options largely sheds
downward risks. In addition, CEOs have to take actions to increase stock price above
the strike price of options, otherwise they can not materialize the wealth of stock
options. Hence equity incentives may align interests of shareholders and CEOs in
investment decisions. CEOs with more equity incentives are more likely to spend on
risky but value-added investments (R&D spending in this case). My “interest
alignment” hypothesis expects that equity incentive will still align interest of CEOs and
shareholders on investment decisions, no matter the length of CEOs‟ career horizons.
The specific hypothesis is listed below:

101
H13a: Older CEOs with more equity incentives (ownership, stock options
and restricted shares) will spend more on R&D expenses.
B. Prospect theory and the “wealth preservation” hypothesis
Prospect theory describes how people make decisions between choices which involve
different levels of risk (see Kahneman and Tversky, 1979; Kahneman and Thaler,
1991). It develops the so-called certainty effects: people have a tendency to choose
strategies that obtain gains with certainty. This helps to explain certain risk-avoiding
behaviour (e.g. choices in gambling and insurance purchase). Based on this theory,
people will outweigh sure gains and become risk-averse when they face uncertainty. It
has been widely used in behavioural finance to explain personal finance decisions.
Prospect theory also has possible implications for CEOs‟ investment decisions. CEOs
with a short career horizon may have accumulated a large amount of equity incentives
during their tenures. Such firm-specific wealth increases CEOs‟ risk exposure to the
stock market. CEOs‟ wealth is extremely sensitive to their firms „share price,
considering managerial equity incentives are less diversified than that of ordinary
investors. Such sensitivity becomes more severe when CEOs approach retirement for
two reasons.
First of all, older CEOs have incentives to cash out equity incentives around retirement.
Retiring CEOs intend to maintain their current living standard and the social circle after
they leave office. By cashing out equity incentives, retiring CEOs can raise funds to
supplement their pensions. Carpenter (2000) documents that retiring CEOs reduce their
financial ties with their firms by cashing equity incentives in their final years in office.

102
Therefore, CEOs with a short career horizon are extremely sensitive to their firms‟
share price movement in their final years of employment. If risky investments will
generate uncertain short-term returns, CEOs have incentives to cutback such spending.
Secondly, some firm policies urge retiring CEOs to cash out equity incentives soon
after turnover. Hall and Murphy (2003) suggest that stock options will be forfeited or
subject to shorter vesting periods upon CEO turnover. For example, when Rod
Eddington retired as CEO of British Airways in September 2005, the firm required him
to exercise all stock options within six months after retirement. In a US study, Dahiya
and Yermack (2008) look at firms‟ policies for the treatment of stock options for
retiring CEOs. They document that there is a large discount for the estimated value for
stock options award for CEOs aged above 60, because of the shorter exercise period of
stock options allowed for retiring CEOs. Therefore these strict policies for older CEOs
may strengthen their sensitivity to short-term stock performance. In such circumstances,
older CEOs tend to preserve short-term realized gains by reducing investments which
may create uncertainty in terms of share price.
The above mentioned situation is consistent with prospect theory. When decision
makers perceive a potential loss, they are more likely to preserve what they get instead
of seeking additional gains. In other words, CEOs with a short career horizon intend to
preserve current gains in their equity holding. Matta and Beamish (2008) find that
CEOs are less likely to engage in mergers and acquisitions if they have short career
horizons and a large amount of equity incentives. They explain that CEOs would prefer
to reject risky mergers and acquisitions because such activities may create uncertainty
for their current wealth in equity incentives. If R&D spending is risky and will create
103
uncertainty for top managers‟ gains in equity holdings, older CEOs may be less likely
to invest. I conduct my “wealth preservation” hypothesis as that equity incentive will
motivate older CEOs to preserve their gains in wealth, making them more risk-averse
and less likely to spend on R&D expenditure. The specific hypothesis is demonstrated
as follows:
H13b: Older CEOs with more equity incentives (ownership, stock options
and restricted shares) will spend less on R&D expenses.
4.3. Methodology
4.3.1. Measurement of R&D spending
I intend to adopt several variables to define R&D spending. The first variable I use is
R&D intensity. Following the literature, I scale R&D expenditure by a firm‟s total sales
(e.g. Lundstrum, 2002; Antia, Pantzalis and Park, 2010). It is reasonable to argue that
R&D intensity will be heavily influenced by the industry factors. Hence I also use the
variable Abnormal R&D. This is the difference between actual R&D expenditure and
“expected” R&D expenditure which is estimated by a model (Cazier, 2011). The
detailed procedures are listed below.
R&D i,t = a0+a1 *R&Dindustry median,t +∑a2*Controls i,t (13)
Where R&D is actual R&D expenditure for a particular year. As far as industry is
concerned, I use broad industry classifications due to the relatively small sample size in
my study. I use four industries in total: Chemical and allied products (UK SIC section
D: 24), Electronic products (UK SIC section D: 30-33), Other manufacturing (UK SIC

104
section D: 15-36) and Miscellaneous. The detailed information is available in Table
4.2. Control variables include: Firm Size, Leverage, Profitability, FCF (Free cash
flows), Growth and Firm Age. The main purpose of this model is to estimate the
parameter of a1, a2 and ∑a3. The residual of this regression is the difference between
the actual R&D spending and “expected” R&D spending based on equation (13).
Then, I develop the following two proxies for R&D spending: Abnormal_R&D and
Abnormal_R&D_Cuts, as follows.
Abnormal_R&D i,t = residual of equation (13) (14)
Abnormal_R&D_Cuts i,t = 1 if Abnormal_R&D i,t <0, otherwise 0 (15)
4.3.2. Measurement of career horizon
Following the literature, I use CEO age as the main proxy for career horizon (e.g.
Barker and Muller, 2002; Lundstrum, 2002; Demers and Wang, 2010). Older CEOs
indicate relatively short career horizons. I also adopt two dummy variables to highlight
the short horizon effects. One is CEO Age above 60; the other is CEO Age above 62.
Because the normal retirement age is 65 in the UK, these dummy variables indicate the
last 5 and 3 remaining years in the office.
4.3.3. Measurement of CEO compensation
CEO annual compensation is the sum of salary, bonuses, pension increment and the
estimated value of equity (restricted shares and options) grants. As far CEO pension is
concerned, I measure pension increment as a fraction of annual compensation as well as
the total pension outstanding. CEO equity incentives are the number of shares of stock

105
options and restricted shares, scaled by a firm‟s total number shares outstanding. All
variables are defined in Table 4.1.
4.3.4. Testing Models
As mentioned in Section 4.3.1, I adopt three proxies to represent R&D spending. The
first is R&D intensity, which is measured as R&D spending scaled by a firm‟s total
sales. My main purpose is to estimate the interactive relationship between pay and
career horizon, and their joint impacts on investment decisions. Hence, career horizon
variables, CEO compensation variables and their interactive variables should be
included. The estimation of the dependent variable R&D intensity is listed as follows.
R&D i,t = b0+b1 * Career horizon i,t + b2 * Compensation i,t + b3 * Career horizon i,t *
Compensation i,t + ∑ b4 controls i,t + ∑ b5 Industry+ ∑ b6Years +ε (16)
As far as the second proxy for R&D spending, Abnormal_R&D, is concerned; I use a
similar OLS model to equation (16) but without industry and years dummies. 13
Because the variable of Abnormal_R&D already considers these effects of industry and
year.
The last proxy for R&D spending, Abnormal_R&D_Cuts, is a dummy variable. I use
the following model to test its relationship between career horizon and compensation.
Probability (Abnormal_R&D_Cuts i,t=1 ) = c0+c1 * Career horizon i,t + c2 *
Compensation i,t + c3 * Career horizon i,t * Compensation i,t + ∑ c4 Controls i,t +ε (17)
13
Please see Page 25 (paragraph two) for the discussion of limitations of OLS regression.
106
4.4. Data
I use FTSE 350 non-financial and non-utilities firms in this study. The time period is
between 2003 and 2007. It starts with 2003; because it is the first year UK publicly
traded firms have to disclose the detailed information about their directors‟ pensions to
the public after the introduction of the Director‟s remuneration report regulations
(2002). Further sample restrictions include R&D data availability and R&D intensity.
Previous literature suggests that only industries where R&D is intensive and crucial are
meaningful in the test (e.g. Cheng, 2004). Firms which spend over a quarter of total
sales on R&D expenses are also excluded, following Gibbons and Murphy (1992a).
Because those outliers of R&D intensity are mainly due to firms‟ business models. 14
I
also exclude the data if a CEO is in his or her first year in office, because it is difficult
to judge whether R&D spending decisions in such cases were made by the new CEO or
the previous one. The R&D expenditure and firm characteristics data is collected from
DataStream and FAME. The data of CEO bonus, equity incentives and CEO age come
from BoardEx, while pension data is hand-collected from firms‟ annual reports.
Following the selection procedure described above, I have a sample of 310
observations. About two thirds of the observations (198 in total) come from
manufacturing industries, especially the chemicals and the allied products industry.
R&D spending is also more intensive and crucial for those industries. Detailed
information about the sample selection is available in Table 4.2.
14
Based on the annual reports from 15 observations whose R&D intensity (R&D/Sales) >0.25, their
revenues are mainly from licensing their intellectual property or contracts. It is not comparable with most
my samples which sell own products.

107
Table 4.1 Variable definitions
Panel A: R&D Spending & Firm Characteristics
Variable Name Definition
R&D intensity R&D spending (WC 01201)/Total sales (WC 01001).
Abnormal_R&D Residual from the regression where the dependent variable is actual R&D and the
independent variables are economic determinants of R&D spending over the
industry for a particular year (please see equation 13).
Abnormal_R&D_Cuts Dummy variables equals 1 if Abnormal_R&D<0, otherwise zero.
Size The natural logarithm of the firm‟s total assets (WC 02999).
Leverage Total debt (WC 03255)/Total assets (WC 02999).
Profitability Net operating income (WC 01250) plus Depreciation (WC 04049) and R&D
spending (WC 01201), scaled by Total assets (WC 02999).
FCF Free cash flows is calculated as the Operating cash flows (WC 04860) plus R&D
spending (WC 01201) minus Capital expenditure (WC 0460), scaled by Total
sales (WC 01001).
Growth The market value of equity (DS: MV)/The book value of equity (WC 03501).
Firm Age The natural logarithm of the number of years between year t and the first year the
company is publicly listed (DS: BDATE).
Panel B: CEO Career Horizon
Variable Name Definition
CEO Age CEO age in years.
CEO Tenure Years in the position as CEO.
CEO Age Above 60 Dummy variable equals 1 if CEO age is above 60, otherwise 0.
CEO Age Above 62 Dummy variable equals 1 if CEO age is above 62, otherwise 0.

108
Table 4.1. (Continued)
Panel C: CEO Compensation
Variable Name Definition
Total Compensation The sum of salary, bonuses, the incremental value of pension, the estimated value
of option and restricted shares grants15 for a particular year.
Bonus The amount of bonus scaled by total compensation.
Pension Increment
The gap of total transfer value of defined benefit pension between year t and year
t-1.
Pension to Equity The total transfer value of defined benefit pension scaled by the estimated value
of equity incentives.
Options Grants The estimated value of stock option grants scaled by total compensation.
Shares Grants The estimated value of restricted shares grants scaled by total compensation.
Ownership The number of shares owned by the CEO scaled by total shares outstanding.
Options The number of option shares scaled by total shares outstanding.
Shares The number of restricted shares scaled by total shares outstanding.
15
Please see the Appendix for the estimated valuation for stock options and restricted shares

109
Table 4.2 Sample selection and distributions
Observations All data available for R&D spending, compensation and firm characteristics 384
R&D intensity (R&D/Sales) > 0.25 (Gibbons and Murphy, 1992a) (15)
CEO tenure (years) < 1 (R&D spending may be decided by former CEOs) (59)
Total 310
Industry
1 Manufacturing UK SIC (2003) section D: 15-36 198
1.1 Chemicals and allied products UK SIC (2003) section D: 24 56
1.2 Electronic products UK SIC (2003) section D: 30-33 39
1.3 Other manufacturing 103
2 Miscellaneous 112
Total 310
Year
2003 56
2004 60
2005 62
2006 70
2007 62
Total 310
110
The descriptive statistics are listed in the table 4.3. In Panel A, R&D spending and firm
characteristics information is provided. The average R&D spending in this sample is
£144.77 million, while the median value is just over £14 million. On average, my
sample firm spends about 4% of its annual sales on R&D expenses (R&D intensity).
The median value of the variable Abnormal_R&D is negative, indicating that over half
observations in the sample spend less than my model predicted. The general profile of
sample firms is large, less geared, profitable and mature based on firm characteristics
data. They also have good growth prospects and strong cash flows.
Information about CEO career horizon is available in Panel B of Table 4.3. The average
(median) CEO age in my sample is about 54.04 (54.59). Less than 25% of CEOs in my
sample are over 58, indicating that the general profile of CEOs in my sample is far from
retirement. CEOs in my sample have spent about 5.8 years in the top management
position, on average. The relatively long tenure may suggest that CEOs may be
powerful enough to influence their firms‟ R&D spending decisions.
CEO compensation information is listed in Panel C of Table 4.3. The mean (median)
value for annual compensation is £2.95 million (£1.61million). Within annual
compensation, shares grants constitute the most significant pay component. On average,
it comprises about 25% of total annual pay. The mean (median) value for pension
increment is 11% (2%). This means that just over half the observations in my sample
have defined benefit pension plans for CEOs. There is a large variation of equity
incentives among CEOs. On average, CEOs have ownership, stock option and restricted
shares of 1.25%, 0.24% and 0.09% of their firms‟ total shares outstanding, respectively.
The ratio of accumulative pension value to equity incentive value is 0.44, on average.
111
Table 4.3 Descriptive statistics
The sample consists of 310 firm-years FTSE 350 observations from 2003-2007.All variables are winsorized at 2%
level. All variables are defined in Table 4.1
Panel A. R&D Spending and Firm Characteristics
Variables Mean St.Dev Min. Quartile 1 Median Quartile 3 Max
R&D spending (£M) 144.77 459.01 0.2 4.83 14.17 57 2839
R&D intensity 0.0402 0.0543 0.0001 0.0034 0.0165 0.0485 0.2135
Abnormal R&D -0.0006 0.0221 -0.0549 -0.0125 -0.0002 0.0089 0.0794
Abnormal R&D Cuts 0.51 0.50 0 0 1 1 1
Firm Size (£M) 8425.47 21772 49.37 326.05 1244 4913 132365
Leverage 0.20 0.13 0 0.10 0.20 0.28 0.53
Profitability 0.19 0.09 0.05 0.12 0.17 0.23 0.50
FCF 0.12 0.10 -0.03 0.04 0.10 0.18 0.43
Growth 4.34 4.29 0.90 2.31 3.12 5.08 34.76
Firm Age (years) 27.09 0.83 0.26 12.78 34.88 40.59 43.63
Panel B. CEO Career Horizon
Variables Mean St.Dev Min. Quartile 1 Median Quartile 3 Max
CEO Age (years) 54.04 5.58 40.46 50.14 54.59 58.02 66.27
CEO Tenure (years) 5.80 4.35 1.20 2.80 4.80 7.40 28.40
Panel C. CEO Compensation
Variables Mean St.Dev Min. Quartile 1 Median Quartile 3 Max
Total Pay (£000s) 2954.18 3484.24 220 858 1608.50 3620 17507
Bonus 0.18 0.11 0 0.10 0.17 0.24 0.57
Pension Increment 0.11 0.16 0 0 0.02 0.19 0.56
Options Grants 0.13 0.16 0 0 0.06 0.23 0.59
Shares Grants 0.25 0.21 0 0 0.28 0.41 0.77
Ownership (%) 1.25 5.54 0 0.01 0.04 0.20 36.48
Options (%) 0.24 0.36 0 0.02 0.09 0.29 1.82
Shares (%) 0.09 0.12 0 0 0.04 0.12 0.51
Pension to Equity 0.44 0.81 0 0 0.04 0.49 3.95
112
The correlation matrix among major variables is listed in Table 4.4. I find that R&D
intensity is positively related with CEO tenure and those dummy variables indicating a
short career horizon (e.g. CEO age above 62). Ownership, firm profitability, cash flows
and growth prospect are also positively related with R&D intensity, while restricted
shares, firm size, leverage and firm age are negatively related with R&D intensity.
Abnormal_R&D is also positively related with CEO tenure and ownership. As far as the
third proxy for R&D spending, Abnormal_R&D_Cuts, is concerned; it is negatively
related with CEO age, tenure and ownership. CEO age and tenure are positively related
with ownership and pension value. This demonstrates that the equity incentives have
been accumulated through a CEO‟s career path.
4.5. Empirical results
4.5.1. Career horizon
The results of the effect of career horizon on R&D spending are described in Table 4.5.
As mentioned before, I adopt various career horizon variables and R&D spending
variables. In Panel A, the dependent variable is the observable R&D spending data,
R&D intensity. The coefficients for variables of CEO Age, CEO Age above 60 and
CEO Age above 62 are all positive in eight regressions, while only that for the dummy
variable of CEO Age above 60 (columns 3 and 4) are at 5% significance level. I then
replace R&D intensity with Abnormal R&D and Abnormal R&D Cuts as the dependent
variables, and these results are reported in the Panels B and C, respectively. These
results are similar to those in Panel A. I do not find that R&D spending declines when
CEOs approach retirement. The coefficient for CEO Age in column 2 of Panel C is -
0.04 at 10% significance level. This indicates that CEOs are less likely to cut R&D
spending as they grow older. It is inconsistent with my hypothesis (H11).

113
Table 4.4 Correlation Matrix
Correlations among main variables. All variables are defined in Table 4.1. The correlations, which are significant at 10% level, are in bold.
(1) (2) (3) (4) (5) (6) (7) (8) (9) (10) (11) (12) (13) (14) (15) (16) (17) (18)
(1)RD_INTENSITY 1
(2)ABNORMAL_RD 0.53 1
(3) ABNORMAL_RD_CUTS -0.34 -0.72 1
(4)CEO_AGE -0.06 0.00 -0.10 1
(5)CEO_AGE_ABOVE_60 0.14 0.09 -0.11 0.60 1
(6)CEO_AGE_ABOVE_62 0.12 0.08 -0.08 0.49 0.69 1
(7)CEO_TENURE 0.18 0.09 -0.13 0.32 0.39 0.41 1
(8)PENSION_INCREMENT -0.07 -0.01 0.09 0.23 0.10 -0.03 0.06 1
(9)PENSION_TO_EQUITY_RATIO -0.05 -0.08 0.10 0.26 0.15 0.05 0.08 0.75 1
(10)OWNERSHIP 0.22 0.15 -0.13 0.12 0.22 0.35 0.57 -0.13 -0.11 1
(11)OPTIONS -0.05 -0.08 0.09 0.15 0.11 0.14 -0.05 -0.14 -0.05 -0.12 1
(12)SHARES -0.12 -0.01 -0.09 -0.16 -0.03 -0.05 0.10 -0.09 -0.07 -0.09 -0.03 1
(13)SIZE -0.24 -0.02 0.00 0.15 -0.07 -0.12 -0.23 0.02 -0.03 -0.18 -0.23 -0.27 1
(14)LEVERAGE -0.41 -0.02 -0.04 0.08 -0.10 -0.10 -0.26 0.00 0.02 -0.21 0.00 0.06 0.34 1
(15)PROFITABILITY 0.40 0.00 -0.03 0.09 0.23 0.17 0.20 0.04 0.06 0.18 -0.04 0.01 -0.19 -0.38 1
(16)FCF 0.72 0.06 -0.03 -0.04 0.05 0.05 0.17 -0.07 -0.04 0.11 -0.14 -0.16 0.03 -0.35 0.49 1
(17)GROWTH 0.09 -0.01 -0.05 0.03 -0.01 0.00 0.07 -0.09 -0.10 0.00 -0.01 0.10 -0.12 0.08 0.34 0.18 1
(18)FIRM_AGE -0.28 -0.03 0.00 0.17 0.02 -0.04 0.03 0.27 0.22 -0.19 -0.05 0.01 0.28 0.16 -0.20 -0.24 -0.17 1
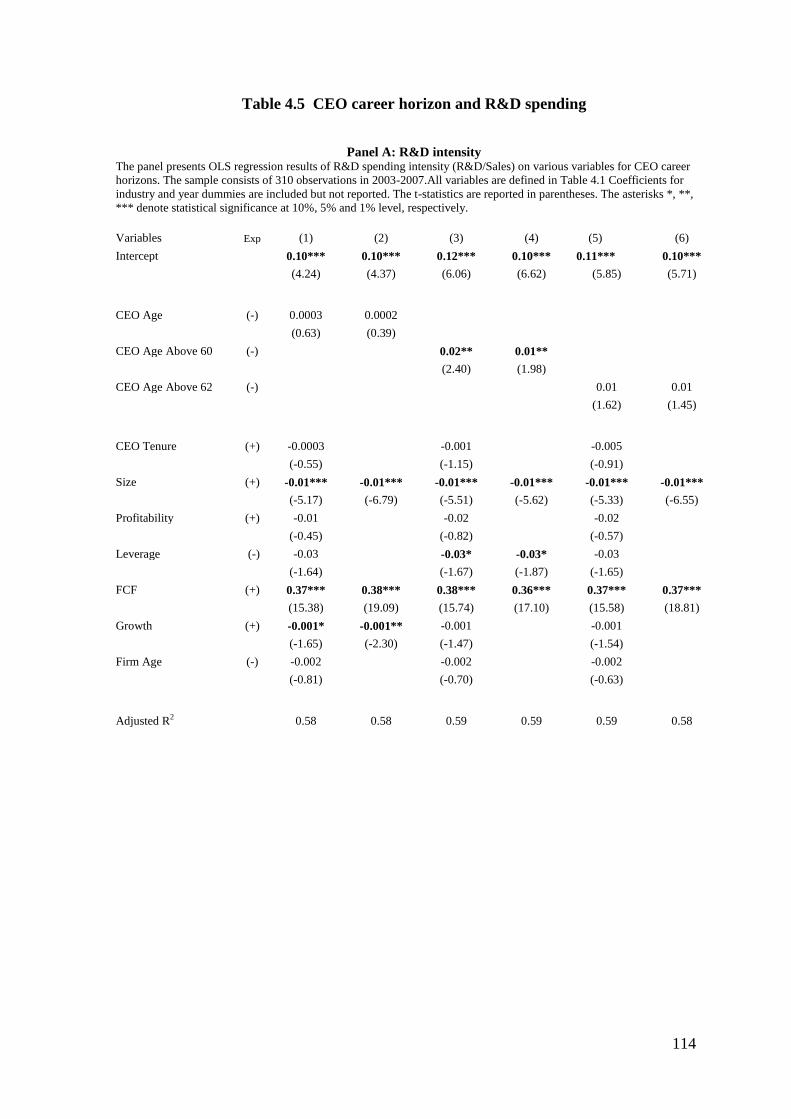
114
Table 4.5 CEO career horizon and R&D spending
Panel A: R&D intensity
The panel presents OLS regression results of R&D spending intensity (R&D/Sales) on various variables for CEO career
horizons. The sample consists of 310 observations in 2003-2007.All variables are defined in Table 4.1 Coefficients for
industry and year dummies are included but not reported. The t-statistics are reported in parentheses. The asterisks *, **,
*** denote statistical significance at 10%, 5% and 1% level, respectively.
Variables Exp (1) (2) (3) (4) (5) (6)
Intercept 0.10*** 0.10*** 0.12*** 0.10*** 0.11*** 0.10***
(4.24) (4.37) (6.06) (6.62) (5.85) (5.71)
CEO Age (-) 0.0003 0.0002
(0.63) (0.39)
CEO Age Above 60 (-) 0.02** 0.01**
(2.40) (1.98)
CEO Age Above 62 (-) 0.01 0.01
(1.62) (1.45)
CEO Tenure (+) -0.0003 -0.001 -0.005
(-0.55) (-1.15) (-0.91)
Size (+) -0.01*** -0.01*** -0.01*** -0.01*** -0.01*** -0.01***
(-5.17) (-6.79) (-5.51) (-5.62) (-5.33) (-6.55)
Profitability (+) -0.01 -0.02 -0.02
(-0.45) (-0.82) (-0.57)
Leverage (-) -0.03 -0.03* -0.03* -0.03
(-1.64) (-1.67) (-1.87) (-1.65)
FCF (+) 0.37*** 0.38*** 0.38*** 0.36*** 0.37*** 0.37***
(15.38) (19.09) (15.74) (17.10) (15.58) (18.81)
Growth (+) -0.001* -0.001** -0.001 -0.001
(-1.65) (-2.30) (-1.47) (-1.54)
Firm Age (-) -0.002 -0.002 -0.002
(-0.81) (-0.70) (-0.63)
Adjusted R2 0.58 0.58 0.59 0.59 0.59 0.58
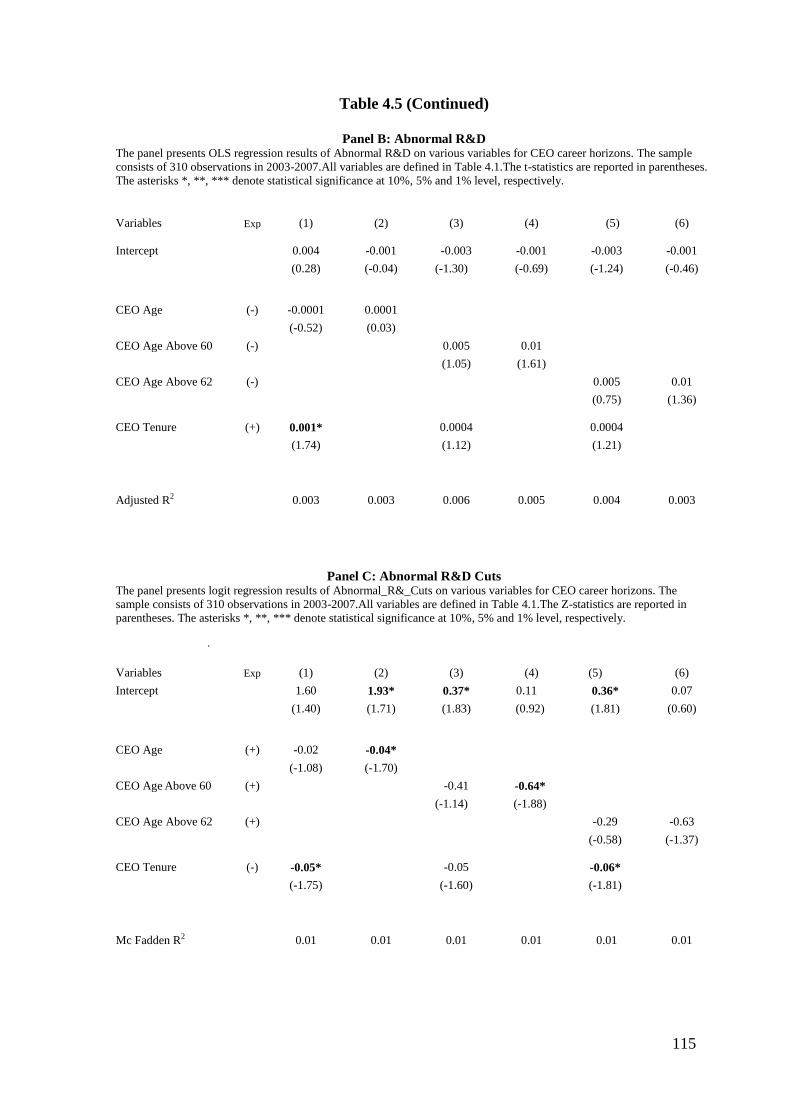
115
Table 4.5 (Continued)
Panel B: Abnormal R&D
The panel presents OLS regression results of Abnormal R&D on various variables for CEO career horizons. The sample
consists of 310 observations in 2003-2007.All variables are defined in Table 4.1.The t-statistics are reported in parentheses.
The asterisks *, **, *** denote statistical significance at 10%, 5% and 1% level, respectively.
Variables Exp (1) (2) (3) (4) (5) (6)
Intercept 0.004 -0.001 -0.003 -0.001 -0.003 -0.001
(0.28) (-0.04) (-1.30) (-0.69) (-1.24) (-0.46)
CEO Age (-) -0.0001 0.0001
(-0.52) (0.03)
CEO Age Above 60 (-) 0.005 0.01
(1.05) (1.61)
CEO Age Above 62 (-) 0.005 0.01
(0.75) (1.36)
CEO Tenure (+) 0.001* 0.0004 0.0004
(1.74) (1.12) (1.21)
Adjusted R2 0.003 0.003 0.006 0.005 0.004 0.003
Panel C: Abnormal R&D Cuts The panel presents logit regression results of Abnormal_R&_Cuts on various variables for CEO career horizons. The
sample consists of 310 observations in 2003-2007.All variables are defined in Table 4.1.The Z-statistics are reported in
parentheses. The asterisks *, **, *** denote statistical significance at 10%, 5% and 1% level, respectively.
.
Variables Exp (1) (2) (3) (4) (5) (6)
Intercept 1.60 1.93* 0.37* 0.11 0.36* 0.07
(1.40) (1.71) (1.83) (0.92) (1.81) (0.60)
CEO Age (+) -0.02 -0.04*
(-1.08) (-1.70)
CEO Age Above 60 (+) -0.41 -0.64*
(-1.14) (-1.88)
CEO Age Above 62 (+) -0.29 -0.63
(-0.58) (-1.37)
CEO Tenure (-) -0.05* -0.05 -0.06*
(-1.75) (-1.60) (-1.81)
Mc Fadden R2 0.01 0.01 0.01 0.01 0.01 0.01
116
As far as control variables are concerned, R&D intensity is high if a firm is less geared
and has strong cash flows. Bigger firms will have a relatively lower R&D intensity. In
short, the above mentioned results are inconsistent with my hypothesis (H11): older
CEOs may spend less on R&D expenditures. It seems that older CEOs may spend even
more on R&D expenditure compared with their younger counterparts. The coefficient
of dummy variable of CEO age above 60 is positive and reaches 5% significance level
in the Panel A. A possible explanation is that I omit corporate governance factors (e.g.
incentive pay) in the above estimations. I will include those factors in following
discussions.
4.5.2. Pension
The first pension variable I examine is pension increment, the fraction of pension value
in annual compensation. The results are reported in Table 4.6. In the column 1 of panel
A, I find that the coefficient for pension increment alone is not significant. Then I add
different career horizon variables and interactive variables of career horizon and
pension increment in columns 3, 5 and 7. Interestingly, I observe that those interactive
variables of pension increment * CEO Age above 60 and Pension increment * CEO
Age above 62 are negative at lest 5% significance levels. This suggests that pension
increment discourages R&D spending if a CEO is above 60. Pension increment seems
has no effect on R&D intensity for other CEO age groups. I find similar results in
Panels B and C when I employ Abnormal R&D and Abnormal R&D Cuts as the
dependent variables. The coefficient for the interactive variable CEO Age above 60 *
pension increment in the column 5 of panel C is 4.43 at 5% significance level. This
indicates that a firm is more likely to cut R&D spending if its CEO is above 60 and has
more defined benefit pensions as a fraction of his or her annual compensation.
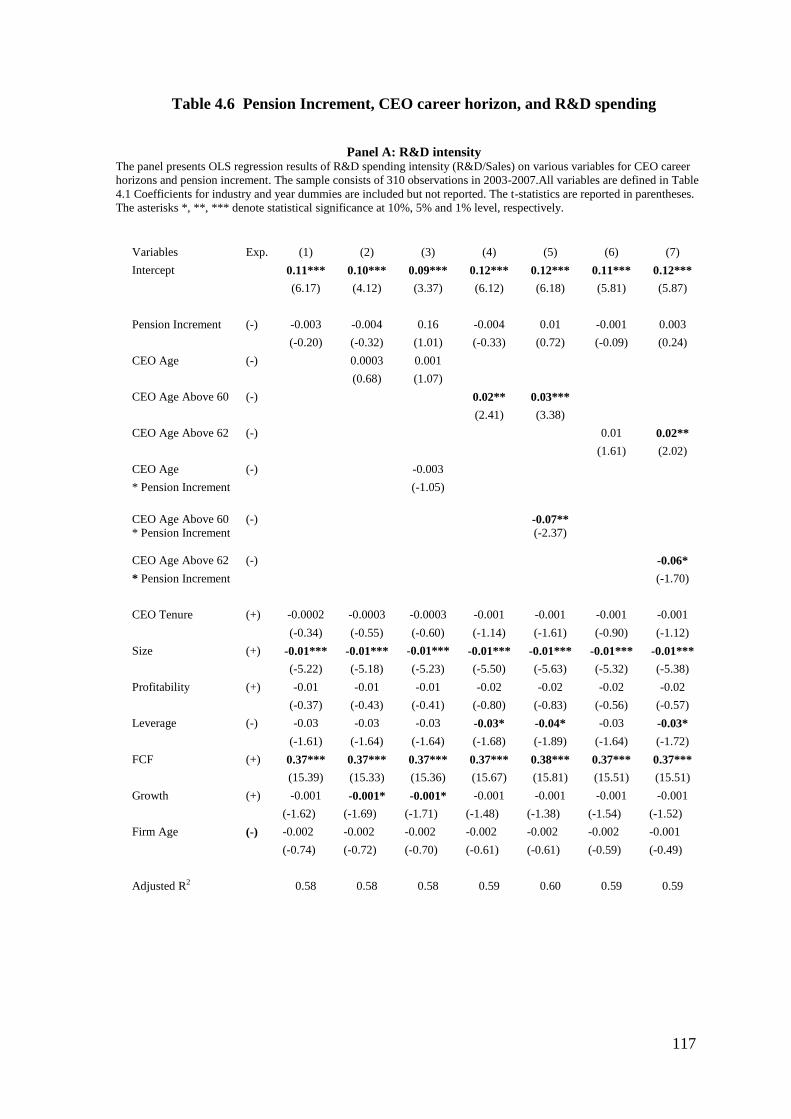
117
Table 4.6 Pension Increment, CEO career horizon, and R&D spending
Panel A: R&D intensity
The panel presents OLS regression results of R&D spending intensity (R&D/Sales) on various variables for CEO career
horizons and pension increment. The sample consists of 310 observations in 2003-2007.All variables are defined in Table
4.1 Coefficients for industry and year dummies are included but not reported. The t-statistics are reported in parentheses.
The asterisks *, **, *** denote statistical significance at 10%, 5% and 1% level, respectively.
Variables Exp. (1) (2) (3) (4) (5) (6) (7)
Intercept 0.11*** 0.10*** 0.09*** 0.12*** 0.12*** 0.11*** 0.12***
(6.17) (4.12) (3.37) (6.12) (6.18) (5.81) (5.87)
Pension Increment (-) -0.003 -0.004 0.16 -0.004 0.01 -0.001 0.003
(-0.20) (-0.32) (1.01) (-0.33) (0.72) (-0.09) (0.24)
CEO Age (-) 0.0003 0.001
(0.68) (1.07)
CEO Age Above 60 (-) 0.02** 0.03***
(2.41) (3.38)
CEO Age Above 62 (-) 0.01 0.02**
(1.61) (2.02)
CEO Age (-) -0.003
* Pension Increment (-1.05)
CEO Age Above 60
(-)
-0.07**
* Pension Increment
(-2.37)
CEO Age Above 62 (-) -0.06*
* Pension Increment (-1.70)
CEO Tenure (+) -0.0002 -0.0003 -0.0003 -0.001 -0.001 -0.001 -0.001
(-0.34) (-0.55) (-0.60) (-1.14) (-1.61) (-0.90) (-1.12)
Size (+) -0.01*** -0.01*** -0.01*** -0.01*** -0.01*** -0.01*** -0.01***
(-5.22) (-5.18) (-5.23) (-5.50) (-5.63) (-5.32) (-5.38)
Profitability (+) -0.01 -0.01 -0.01 -0.02 -0.02 -0.02 -0.02
(-0.37) (-0.43) (-0.41) (-0.80) (-0.83) (-0.56) (-0.57)
Leverage (-) -0.03 -0.03 -0.03 -0.03* -0.04* -0.03 -0.03*
(-1.61) (-1.64) (-1.64) (-1.68) (-1.89) (-1.64) (-1.72)
FCF (+) 0.37*** 0.37*** 0.37*** 0.37*** 0.38*** 0.37*** 0.37***
(15.39) (15.33) (15.36) (15.67) (15.81) (15.51) (15.51)
Growth (+) -0.001 -0.001* -0.001* -0.001 -0.001 -0.001 -0.001
(-1.62) (-1.69) (-1.71) (-1.48) (-1.38) (-1.54) (-1.52)
Firm Age (-) -0.002 -0.002 -0.002 -0.002 -0.002 -0.002 -0.001
(-0.74) (-0.72) (-0.70) (-0.61) (-0.61) (-0.59) (-0.49)
Adjusted R2 0.58 0.58 0.58 0.59 0.60 0.59 0.59

118
Table 4.6. (Continued)
Panel B: Abnormal R&D
The panel presents OLS regression results of Abnormal R&D on various variables for CEO career horizons and pension
increment. The sample consists of 310 observations in 2003-2007.All variables are defined in Table 4.1.The t-statistics are
reported in parentheses. The asterisks *, **, *** denote statistical significance at 10%, 5% and 1% level, respectively.
Variables Exp.
(1) (2) (3) (4) (5) (6) (7)
Intercept -0.003 0.004 0.003 -0.003 -0.003 -0.003 -0.003
(-0.18) (0.25) (0.20) (-1.07) (-1.13) (-1.06) (-1.05)
Pension Increment (-) -0.003 -0.002 0.001 -0.004 0.003 -0.002 0.001
(-0.31) (-0.20) (0.01) (-0.40) (0.35) (-0.27) (0.01)
CEO Age (-) 0.0001 -0.0001
(0.46) (-0.40)
CEO Age Above 60 (-) 0.005 0.01*
(1.07) (1.84)
CEO Age Above 62 (-) 0.004 0.01
(0.73) (1.08)
CEO Age (-) -0.001
* Pension Increment
(-0.03)
CEO Age Above 60 (-) -0.004
* Pension Increment
(-1.58)
CEO AgE Above 62 (-) -0.03
* Pension Increment
(-0.86)
CEO Tenure (+) 0.001* 0.001* 0.001* 0.0004 0.0003 0.0004 0.0004
(1.67) (1.73) (1.73) (1.12) (0.78) (1.22) (1.03)
Adjusted R2 0.003 0.002 0.001 0.003 0.008 0.001 0.001
Panel C: Abnormal R&D Cuts The panel presents logit regression results of Abnormal_R&_Cuts on various variables for career horizons and pension
increment. The sample consists of 310 observations in 2003-2007.All variables are defined in Table 4.1.The Z-statistics are
reported in parentheses. The asterisks *, **, *** denote statistical significance at 10%, 5% and 1% level, respectively.
Variables Exp.
(1) (2) (3) (4) (5) (6) (7)
Intercept 0.27 2.00* 2.13 0.24 0.27 0.26 0.26
(1.26) (1.70) (1.59) (1.14) (1.25) (1.20) (1.20)
Pension Increment (+) 1.21* 1.47* -0.30 1.30* 0.54 1.19 1.00
(1.65) (1.95) (-0.03) (1.76) (0.66) (1.63) (1.32)
CEO Age (+) -0.04 -0.04
(-1.51) (-1.43)
CEO Age Above 60 (+) -0.48 -1.22**
(-1.29) (-2.30)
CEO Age Above 62 (+) -0.26 -0.55
(-0.51) (-0.89)
CEO Age (+) 0.03
* Pension Increment
(0.19)
CEO Age Above 60 * (+) 4.43**
* Pension Increment
(2.05)
CEO Age Above 62* (+) 2.46
* Pension Increment
(0.84)
CEO Tenure (-) -0.07** -0.05* -0.06* -0.05* -0.04 -0.06* -0.06*
(-2.22) (-1.75) (-1.75) (-1.66) (-1.28) (-1.93) (-1.77)
Mc Fadden R2 0.02 0.02 0.02 0.02 0.03 0.03 0.02

119
In Table 4.7, I consider another pension variable, pension to equity ratio, which is
measured as the ratio of pension value to equity incentive value. These results are very
similar to those in Table 4.6. For example, the coefficient for the interactive variable
CEO Age above 60* Pension to equity in column 5 of Panel A is -0.01 at 10%
significance level. This suggests that R&D intensity is falling if a CEO is over 60 and
has more defined benefit pension value relative to the value of his or her equity
incentives. In Panels B and C of Table 4.7, I use the alternative proxies of R&D
spending: Abnormal R&D and Abnormal R&D Cuts. These coefficients of interactive
variables between career horizon and pension to equity value are in the direction of
what I expected (columns 5 and 7 of Panel B and C in Table 4.7), though fail to reach a
significance level.
In short, the above mentioned results in table 4.6 and 4.7 provide some evidence that
pension (defined benefit) may discourage CEOs from getting involved in research and
development expenditures as they approach retirement. This is consistent with my
hypothesis (H12): Older CEOs with more pensions are less likely to spend in R&D
expenditure.
4.5.3. Ownership
Ownership is the first type of equity incentive I consider. The results are reported in
Table 4.8. The coefficients for the variable of ownership are positive at least10%
significance levels in all regression in Panel A, when I use R&D intensity as the
dependent variable. This suggests that ownership encourages CEOs to spend more on
R&D spending.
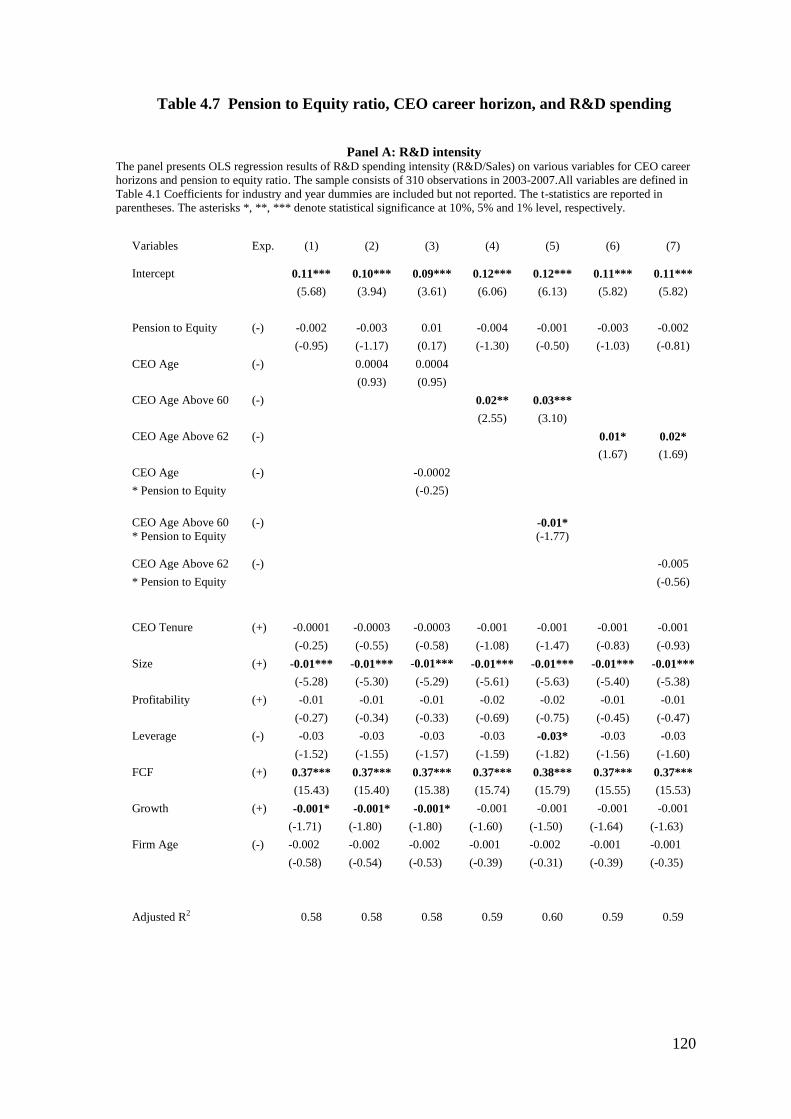
120
Table 4.7 Pension to Equity ratio, CEO career horizon, and R&D spending
Panel A: R&D intensity
The panel presents OLS regression results of R&D spending intensity (R&D/Sales) on various variables for CEO career
horizons and pension to equity ratio. The sample consists of 310 observations in 2003-2007.All variables are defined in
Table 4.1 Coefficients for industry and year dummies are included but not reported. The t-statistics are reported in
parentheses. The asterisks *, **, *** denote statistical significance at 10%, 5% and 1% level, respectively.
Variables Exp.
(1) (2) (3) (4) (5) (6) (7)
Intercept 0.11*** 0.10*** 0.09*** 0.12*** 0.12*** 0.11*** 0.11***
(5.68) (3.94) (3.61) (6.06) (6.13) (5.82) (5.82)
Pension to Equity (-) -0.002 -0.003 0.01 -0.004 -0.001 -0.003 -0.002
(-0.95) (-1.17) (0.17) (-1.30) (-0.50) (-1.03) (-0.81)
CEO Age (-) 0.0004 0.0004
(0.93) (0.95)
CEO Age Above 60 (-) 0.02** 0.03***
(2.55) (3.10)
CEO Age Above 62 (-) 0.01* 0.02*
(1.67) (1.69)
CEO Age (-) -0.0002
* Pension to Equity (-0.25)
CEO Age Above 60
(-)
-0.01*
* Pension to Equity
(-1.77)
CEO Age Above 62 (-) -0.005
* Pension to Equity
(-0.56)
CEO Tenure (+) -0.0001 -0.0003 -0.0003 -0.001 -0.001 -0.001 -0.001
(-0.25) (-0.55) (-0.58) (-1.08) (-1.47) (-0.83) (-0.93)
Size (+) -0.01*** -0.01*** -0.01*** -0.01*** -0.01*** -0.01*** -0.01***
(-5.28) (-5.30) (-5.29) (-5.61) (-5.63) (-5.40) (-5.38)
Profitability (+) -0.01 -0.01 -0.01 -0.02 -0.02 -0.01 -0.01
(-0.27) (-0.34) (-0.33) (-0.69) (-0.75) (-0.45) (-0.47)
Leverage (-) -0.03 -0.03 -0.03 -0.03 -0.03* -0.03 -0.03
(-1.52) (-1.55) (-1.57) (-1.59) (-1.82) (-1.56) (-1.60)
FCF (+) 0.37*** 0.37*** 0.37*** 0.37*** 0.38*** 0.37*** 0.37***
(15.43) (15.40) (15.38) (15.74) (15.79) (15.55) (15.53)
Growth (+) -0.001* -0.001* -0.001* -0.001 -0.001 -0.001 -0.001
(-1.71) (-1.80) (-1.80) (-1.60) (-1.50) (-1.64) (-1.63)
Firm Age (-) -0.002 -0.002 -0.002 -0.001 -0.002 -0.001 -0.001
(-0.58) (-0.54) (-0.53) (-0.39) (-0.31) (-0.39) (-0.35)
Adjusted R2 0.58 0.58 0.58 0.59 0.60 0.59 0.59
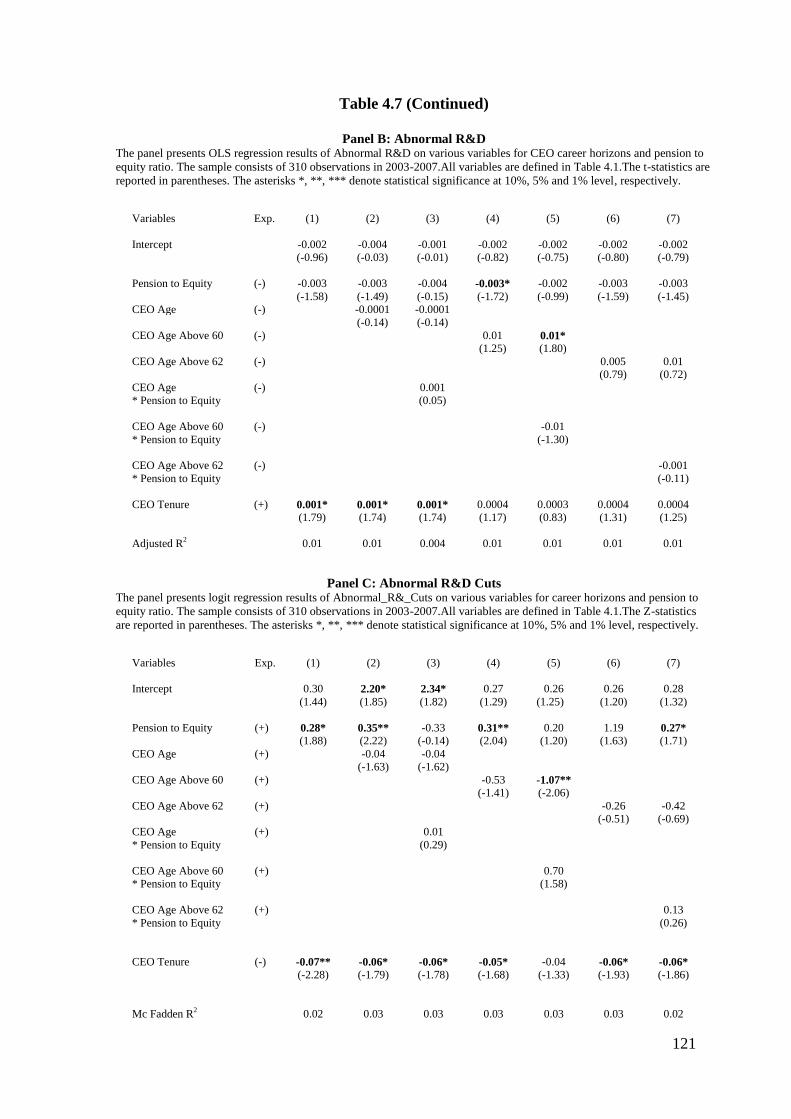
121
Table 4.7 (Continued)
Panel B: Abnormal R&D
The panel presents OLS regression results of Abnormal R&D on various variables for CEO career horizons and pension to
equity ratio. The sample consists of 310 observations in 2003-2007.All variables are defined in Table 4.1.The t-statistics are
reported in parentheses. The asterisks *, **, *** denote statistical significance at 10%, 5% and 1% level, respectively.
Variables Exp.
(1) (2) (3) (4) (5) (6) (7)
Intercept -0.002 -0.004 -0.001 -0.002 -0.002 -0.002 -0.002
(-0.96) (-0.03) (-0.01) (-0.82) (-0.75) (-0.80) (-0.79)
Pension to Equity (-) -0.003 -0.003 -0.004 -0.003* -0.002 -0.003 -0.003
(-1.58) (-1.49) (-0.15) (-1.72) (-0.99) (-1.59) (-1.45)
CEO Age (-) -0.0001 -0.0001
(-0.14) (-0.14)
CEO Age Above 60 (-) 0.01 0.01*
(1.25) (1.80)
CEO Age Above 62 (-) 0.005 0.01
(0.79) (0.72)
CEO Age (-) 0.001
* Pension to Equity
(0.05)
CEO Age Above 60 (-) -0.01
* Pension to Equity
(-1.30)
CEO Age Above 62 (-) -0.001
* Pension to Equity
(-0.11)
CEO Tenure (+) 0.001* 0.001* 0.001* 0.0004 0.0003 0.0004 0.0004
(1.79) (1.74) (1.74) (1.17) (0.83) (1.31) (1.25)
Adjusted R2 0.01 0.01 0.004 0.01 0.01 0.01 0.01
Panel C: Abnormal R&D Cuts The panel presents logit regression results of Abnormal_R&_Cuts on various variables for career horizons and pension to
equity ratio. The sample consists of 310 observations in 2003-2007.All variables are defined in Table 4.1.The Z-statistics
are reported in parentheses. The asterisks *, **, *** denote statistical significance at 10%, 5% and 1% level, respectively.
Variables Exp.
(1) (2) (3) (4) (5) (6) (7)
Intercept 0.30 2.20* 2.34* 0.27 0.26 0.26 0.28
(1.44) (1.85) (1.82) (1.29) (1.25) (1.20) (1.32)
Pension to Equity (+) 0.28* 0.35** -0.33 0.31** 0.20 1.19 0.27*
(1.88) (2.22) (-0.14) (2.04) (1.20) (1.63) (1.71)
CEO Age (+) -0.04 -0.04
(-1.63) (-1.62)
CEO Age Above 60 (+) -0.53 -1.07**
(-1.41) (-2.06)
CEO Age Above 62 (+) -0.26 -0.42
(-0.51) (-0.69)
CEO Age (+) 0.01
* Pension to Equity
(0.29)
CEO Age Above 60 (+) 0.70
* Pension to Equity
(1.58)
CEO Age Above 62 (+) 0.13
* Pension to Equity
(0.26)
CEO Tenure (-) -0.07** -0.06* -0.06* -0.05* -0.04 -0.06* -0.06*
(-2.28) (-1.79) (-1.78) (-1.68) (-1.33) (-1.93) (-1.86)
Mc Fadden R2 0.02 0.03 0.03 0.03 0.03 0.03 0.02
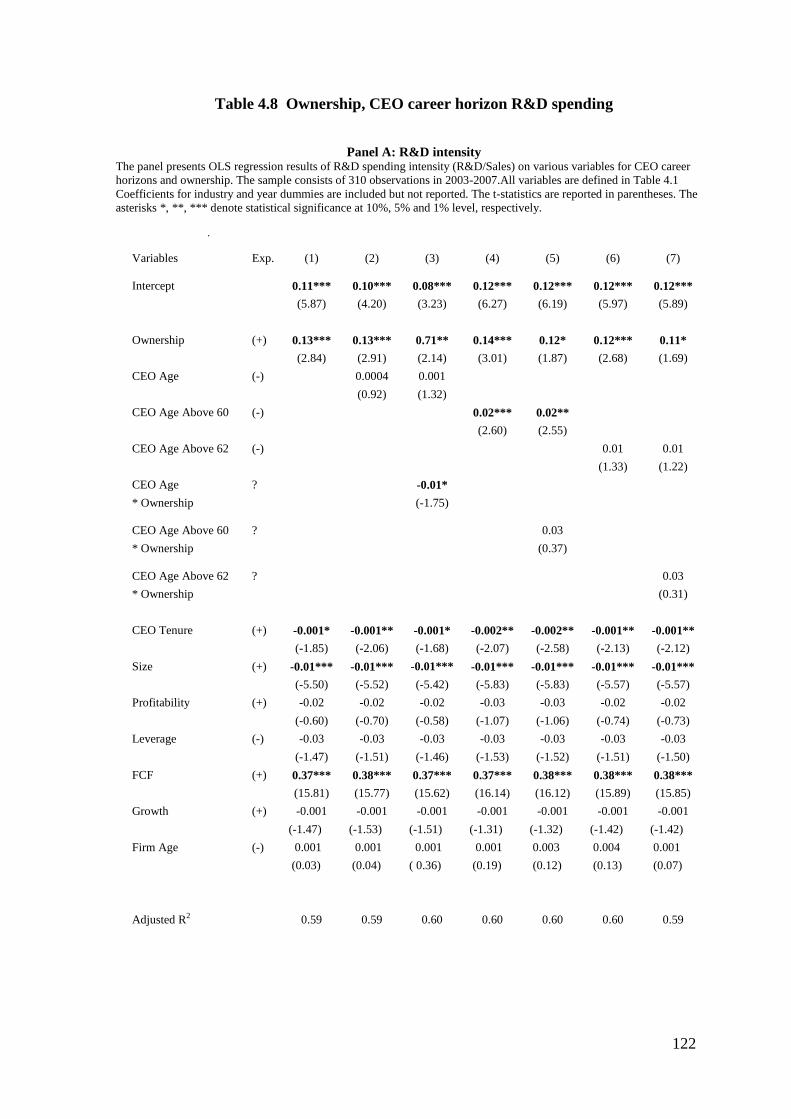
122
Table 4.8 Ownership, CEO career horizon R&D spending
Panel A: R&D intensity
The panel presents OLS regression results of R&D spending intensity (R&D/Sales) on various variables for CEO career
horizons and ownership. The sample consists of 310 observations in 2003-2007.All variables are defined in Table 4.1
Coefficients for industry and year dummies are included but not reported. The t-statistics are reported in parentheses. The
asterisks *, **, *** denote statistical significance at 10%, 5% and 1% level, respectively.
.
Variables Exp.
(1) (2) (3) (4) (5) (6) (7)
Intercept 0.11*** 0.10*** 0.08*** 0.12*** 0.12*** 0.12*** 0.12***
(5.87) (4.20) (3.23) (6.27) (6.19) (5.97) (5.89)
Ownership (+) 0.13*** 0.13*** 0.71** 0.14*** 0.12* 0.12*** 0.11*
(2.84) (2.91) (2.14) (3.01) (1.87) (2.68) (1.69)
CEO Age (-) 0.0004 0.001
(0.92) (1.32)
CEO Age Above 60 (-) 0.02*** 0.02**
(2.60) (2.55)
CEO Age Above 62 (-) 0.01 0.01
(1.33) (1.22)
CEO Age ? -0.01*
* Ownership
(-1.75)
CEO Age Above 60 ? 0.03
* Ownership
(0.37)
CEO Age Above 62 ? 0.03
* Ownership (0.31)
CEO Tenure (+) -0.001* -0.001** -0.001* -0.002** -0.002** -0.001** -0.001**
(-1.85) (-2.06) (-1.68) (-2.07) (-2.58) (-2.13) (-2.12)
Size (+) -0.01*** -0.01*** -0.01*** -0.01*** -0.01*** -0.01*** -0.01***
(-5.50) (-5.52) (-5.42) (-5.83) (-5.83) (-5.57) (-5.57)
Profitability (+) -0.02 -0.02 -0.02 -0.03 -0.03 -0.02 -0.02
(-0.60) (-0.70) (-0.58) (-1.07) (-1.06) (-0.74) (-0.73)
Leverage (-) -0.03 -0.03 -0.03 -0.03 -0.03 -0.03 -0.03
(-1.47) (-1.51) (-1.46) (-1.53) (-1.52) (-1.51) (-1.50)
FCF (+) 0.37*** 0.38*** 0.37*** 0.37*** 0.38*** 0.38*** 0.38***
(15.81) (15.77) (15.62) (16.14) (16.12) (15.89) (15.85)
Growth (+) -0.001 -0.001 -0.001 -0.001 -0.001 -0.001 -0.001
(-1.47) (-1.53) (-1.51) (-1.31) (-1.32) (-1.42) (-1.42)
Firm Age (-) 0.001 0.001 0.001 0.001 0.003 0.004 0.001
(0.03) (0.04) ( 0.36) (0.19) (0.12) (0.13) (0.07)
Adjusted R2 0.59 0.59 0.60 0.60 0.60 0.60 0.59
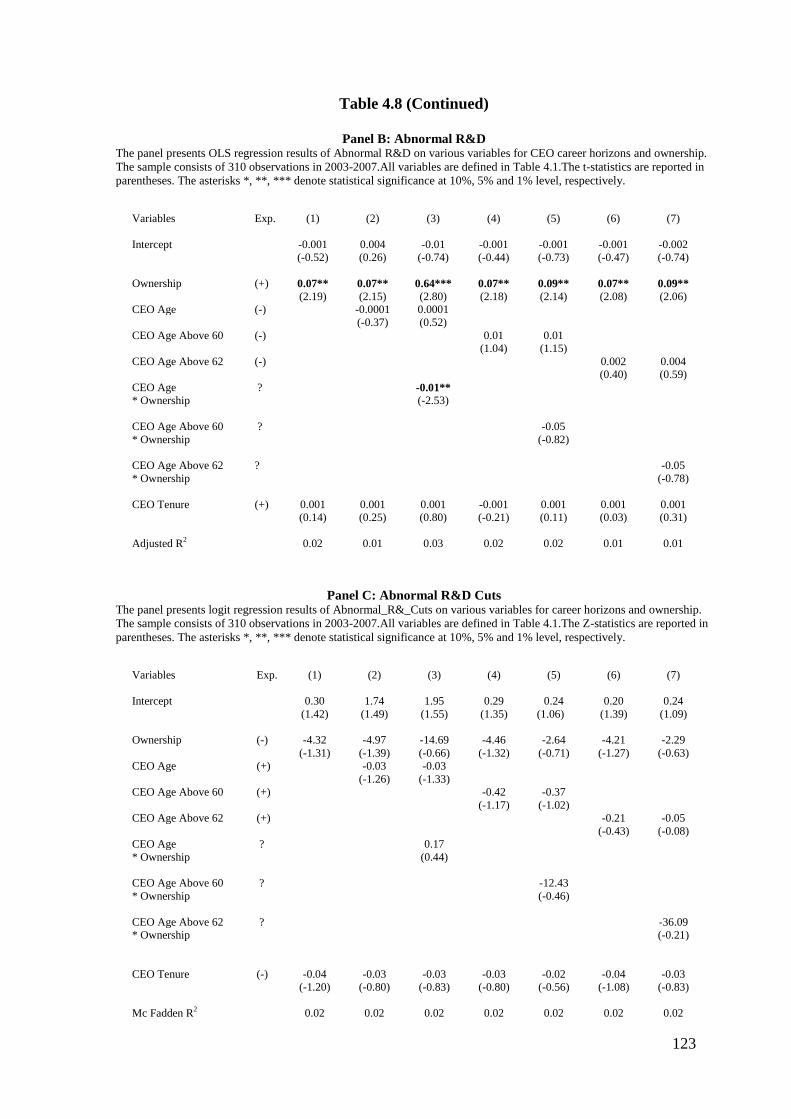
123
Table 4.8 (Continued)
Panel B: Abnormal R&D
The panel presents OLS regression results of Abnormal R&D on various variables for CEO career horizons and ownership.
The sample consists of 310 observations in 2003-2007.All variables are defined in Table 4.1.The t-statistics are reported in
parentheses. The asterisks *, **, *** denote statistical significance at 10%, 5% and 1% level, respectively.
Variables Exp.
(1) (2) (3) (4) (5) (6) (7)
Intercept -0.001 0.004 -0.01 -0.001 -0.001 -0.001 -0.002
(-0.52) (0.26) (-0.74) (-0.44) (-0.73) (-0.47) (-0.74)
Ownership (+) 0.07** 0.07** 0.64*** 0.07** 0.09** 0.07** 0.09**
(2.19) (2.15) (2.80) (2.18) (2.14) (2.08) (2.06)
CEO Age (-) -0.0001 0.0001
(-0.37) (0.52)
CEO Age Above 60 (-) 0.01 0.01
(1.04) (1.15)
CEO Age Above 62 (-) 0.002 0.004
(0.40) (0.59)
CEO Age ? -0.01**
* Ownership
(-2.53)
CEO Age Above 60 ? -0.05
* Ownership
(-0.82)
CEO Age Above 62 ? -0.05
* Ownership
(-0.78)
CEO Tenure (+) 0.001 0.001 0.001 -0.001 0.001 0.001 0.001
(0.14) (0.25) (0.80) (-0.21) (0.11) (0.03) (0.31)
Adjusted R2 0.02 0.01 0.03 0.02 0.02 0.01 0.01
Panel C: Abnormal R&D Cuts The panel presents logit regression results of Abnormal_R&_Cuts on various variables for career horizons and ownership.
The sample consists of 310 observations in 2003-2007.All variables are defined in Table 4.1.The Z-statistics are reported in
parentheses. The asterisks *, **, *** denote statistical significance at 10%, 5% and 1% level, respectively.
Variables Exp.
(1) (2) (3) (4) (5) (6) (7)
Intercept 0.30 1.74 1.95 0.29 0.24 0.20 0.24
(1.42) (1.49) (1.55) (1.35) (1.06) (1.39) (1.09)
Ownership (-) -4.32 -4.97 -14.69 -4.46 -2.64 -4.21 -2.29
(-1.31) (-1.39) (-0.66) (-1.32) (-0.71) (-1.27) (-0.63)
CEO Age (+) -0.03 -0.03
(-1.26) (-1.33)
CEO Age Above 60 (+) -0.42 -0.37
(-1.17) (-1.02)
CEO Age Above 62 (+) -0.21 -0.05
(-0.43) (-0.08)
CEO Age ? 0.17
* Ownership
(0.44)
CEO Age Above 60 ? -12.43
* Ownership
(-0.46)
CEO Age Above 62 ? -36.09
* Ownership
(-0.21)
CEO Tenure (-) -0.04 -0.03 -0.03 -0.03 -0.02 -0.04 -0.03
(-1.20) (-0.80) (-0.83) (-0.80) (-0.56) (-1.08) (-0.83)
Mc Fadden R2 0.02 0.02 0.02 0.02 0.02 0.02 0.02
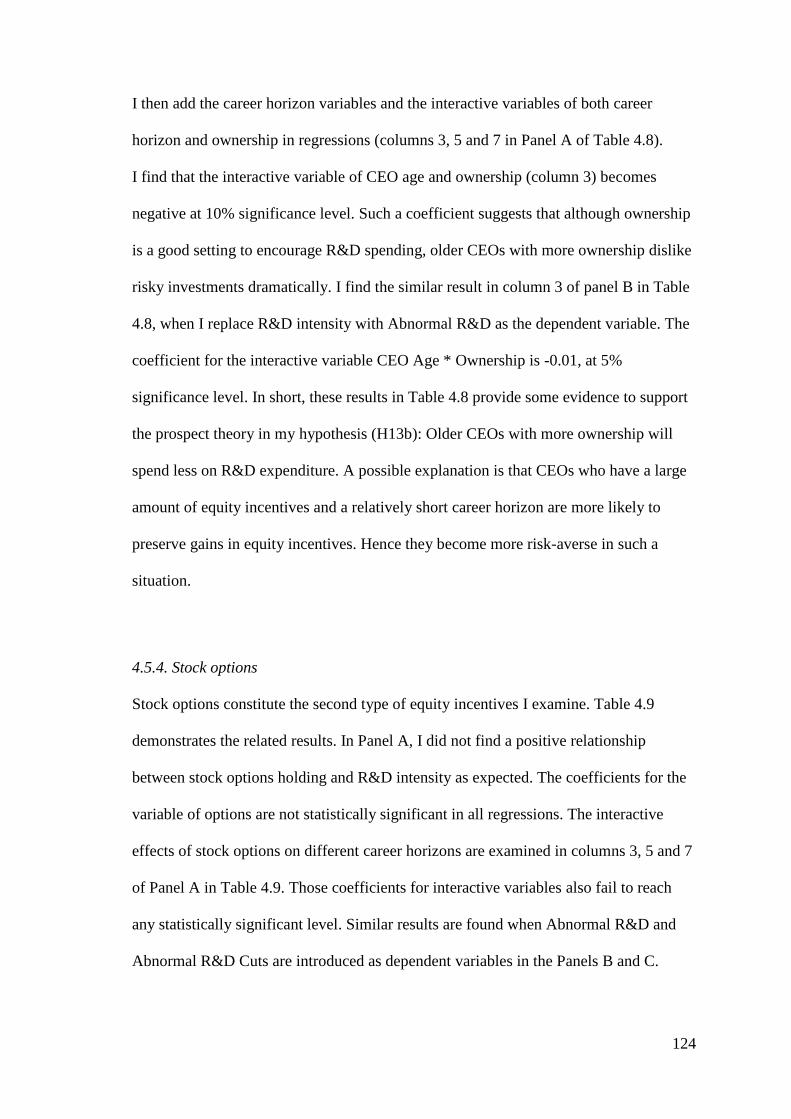
124
I then add the career horizon variables and the interactive variables of both career
horizon and ownership in regressions (columns 3, 5 and 7 in Panel A of Table 4.8).
I find that the interactive variable of CEO age and ownership (column 3) becomes
negative at 10% significance level. Such a coefficient suggests that although ownership
is a good setting to encourage R&D spending, older CEOs with more ownership dislike
risky investments dramatically. I find the similar result in column 3 of panel B in Table
4.8, when I replace R&D intensity with Abnormal R&D as the dependent variable. The
coefficient for the interactive variable CEO Age * Ownership is -0.01, at 5%
significance level. In short, these results in Table 4.8 provide some evidence to support
the prospect theory in my hypothesis (H13b): Older CEOs with more ownership will
spend less on R&D expenditure. A possible explanation is that CEOs who have a large
amount of equity incentives and a relatively short career horizon are more likely to
preserve gains in equity incentives. Hence they become more risk-averse in such a
situation.
4.5.4. Stock options
Stock options constitute the second type of equity incentives I examine. Table 4.9
demonstrates the related results. In Panel A, I did not find a positive relationship
between stock options holding and R&D intensity as expected. The coefficients for the
variable of options are not statistically significant in all regressions. The interactive
effects of stock options on different career horizons are examined in columns 3, 5 and 7
of Panel A in Table 4.9. Those coefficients for interactive variables also fail to reach
any statistically significant level. Similar results are found when Abnormal R&D and
Abnormal R&D Cuts are introduced as dependent variables in the Panels B and C.
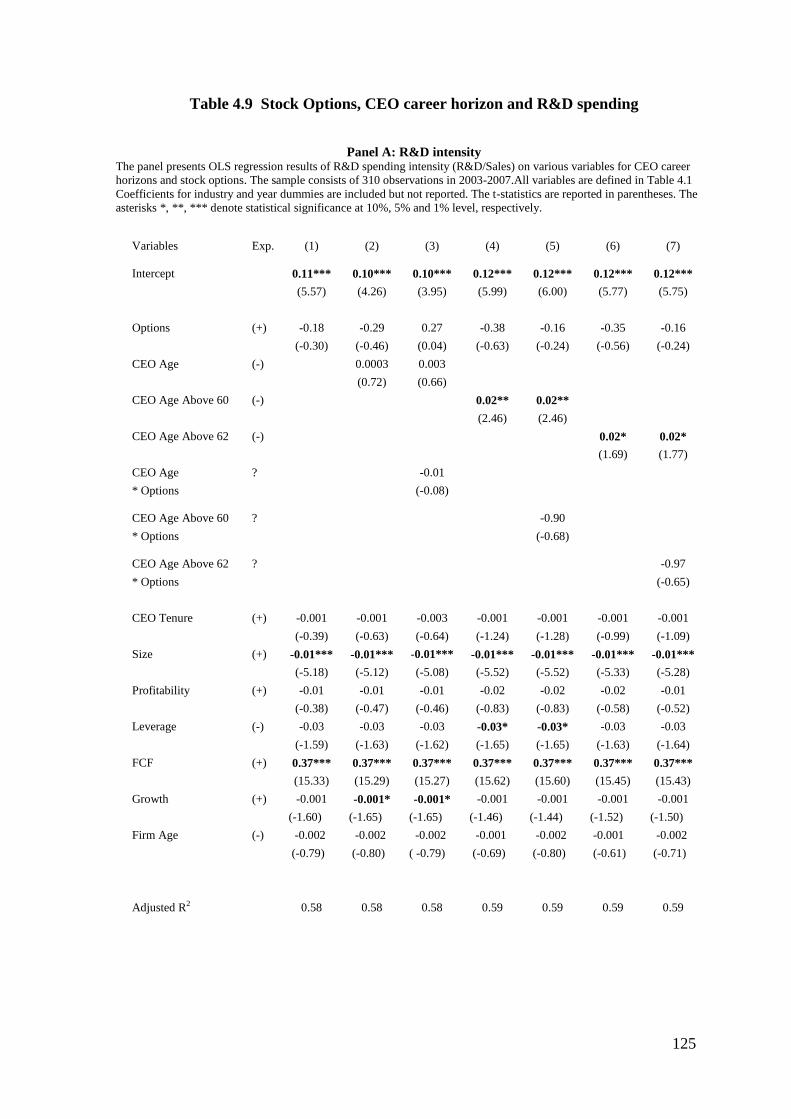
125
Table 4.9 Stock Options, CEO career horizon and R&D spending
Panel A: R&D intensity
The panel presents OLS regression results of R&D spending intensity (R&D/Sales) on various variables for CEO career
horizons and stock options. The sample consists of 310 observations in 2003-2007.All variables are defined in Table 4.1
Coefficients for industry and year dummies are included but not reported. The t-statistics are reported in parentheses. The
asterisks *, **, *** denote statistical significance at 10%, 5% and 1% level, respectively.
Variables Exp.
(1) (2) (3) (4) (5) (6) (7)
Intercept 0.11*** 0.10*** 0.10*** 0.12*** 0.12*** 0.12*** 0.12***
(5.57) (4.26) (3.95) (5.99) (6.00) (5.77) (5.75)
Options (+) -0.18 -0.29 0.27 -0.38 -0.16 -0.35 -0.16
(-0.30) (-0.46) (0.04) (-0.63) (-0.24) (-0.56) (-0.24)
CEO Age (-) 0.0003 0.003
(0.72) (0.66)
CEO Age Above 60 (-) 0.02** 0.02**
(2.46) (2.46)
CEO Age Above 62 (-) 0.02* 0.02*
(1.69) (1.77)
CEO Age ? -0.01
* Options
(-0.08)
CEO Age Above 60 ? -0.90
* Options
(-0.68)
CEO Age Above 62 ? -0.97
* Options (-0.65)
CEO Tenure (+) -0.001 -0.001 -0.003 -0.001 -0.001 -0.001 -0.001
(-0.39) (-0.63) (-0.64) (-1.24) (-1.28) (-0.99) (-1.09)
Size (+) -0.01*** -0.01*** -0.01*** -0.01*** -0.01*** -0.01*** -0.01***
(-5.18) (-5.12) (-5.08) (-5.52) (-5.52) (-5.33) (-5.28)
Profitability (+) -0.01 -0.01 -0.01 -0.02 -0.02 -0.02 -0.01
(-0.38) (-0.47) (-0.46) (-0.83) (-0.83) (-0.58) (-0.52)
Leverage (-) -0.03 -0.03 -0.03 -0.03* -0.03* -0.03 -0.03
(-1.59) (-1.63) (-1.62) (-1.65) (-1.65) (-1.63) (-1.64)
FCF (+) 0.37*** 0.37*** 0.37*** 0.37*** 0.37*** 0.37*** 0.37***
(15.33) (15.29) (15.27) (15.62) (15.60) (15.45) (15.43)
Growth (+) -0.001 -0.001* -0.001* -0.001 -0.001 -0.001 -0.001
(-1.60) (-1.65) (-1.65) (-1.46) (-1.44) (-1.52) (-1.50)
Firm Age (-) -0.002 -0.002 -0.002 -0.001 -0.002 -0.001 -0.002
(-0.79) (-0.80) ( -0.79) (-0.69) (-0.80) (-0.61) (-0.71)
Adjusted R2 0.58 0.58 0.58 0.59 0.59 0.59 0.59
126
Table 4.9 (Continued)
Panel B: Abnormal R&D
The panel presents OLS regression results of Abnormal R&D on various variables for CEO career horizons and stock
options. The sample consists of 310 observations in 2003-2007.All variables are defined in Table 4.1.The t-statistics are
reported in parentheses. The asterisks *, **, *** denote statistical significance at 10%, 5% and 1% level, respectively.
Variables Exp.
(1) (2) (3) (4) (5) (6) (7)
Intercept -0.001 0.002 0.002 -0.001 -0.001 -0.001 -0.001
(-0.70) (0.14) (0.15) (-0.53) (-0.47) (-0.45) (-0.44)
Options (+) -0.55 -0.54 -0.77 -0.62 -0.72 -0.63 -0.66
(-0.40) (-1.32) (-0.16) (-1.56) (-1.54) (-1.56) (-1.46)
CEO Age (-) -0.0001 -0.0001
(-0.27) (-0.27)
CEO Age Above 60 (-) 0.01 0.01
(1.25) (0.84)
CEO Age Above 62 (-) 0.01 0.01
(1.02) (0.75)
CEO Age ? 0.004
* Options
(0.05)
CEO Age Above 60 ? 0.35
* Options
(0.38)
CEO Age Above 62 ? 0.13
* Options
(0.13)
CEO Tenure (+) 0.001 0.001 0.001 0.0003 0.001 0.003 0.003
(1.59) (1.59) (1.58) (0.96) (0.11) (1.02) (1.02)
No. of Obs. 310 310 310 310 310 310 310
Adjusted R2 0.01 0.02 0.01 0.01 0.01 0.01 0.01
Panel C: Abnormal R&D Cuts The panel presents logit regression results of Abnormal_R&_Cuts on various variables for career horizons and stock
options. The sample consists of 310 observations in 2003-2007.All variables are defined in Table 4.1.The Z-statistics are
reported in parentheses. The asterisks *, **, *** denote statistical significance at 10%, 5% and 1% level, respectively.
Variables Exp.
(1) (2) (3) (4) (5) (6) (7)
Intercept 0.25 1.82 1.82 0.22 0.18 0.21 0.21
(1.16) (1.57) (1.36) (0.99) (0.81) (0.96) (0.97)
Options (-) 50.75 59.37 58.13 57.62 74.10 56.43 53.92
(1.52) (1.55) (0.15) (1.60) (1.61) (1.56) (1.43)
CEO Age (+) -0.03 -0.03
(-1.38) (-1.22)
CEO Age Above 60 (+) -0.51 -0.32
(-1.37) (-0.72)
CEO Age Above 62 (+) -0.45 -0.51
(-0.88) (-0.79)
CEO Age ? 0.02
* Options
(0.01)
CEO Age Above 60 ? -59.20
* Options
(-0.77)
CEO Age Above 62 ? 13.20
* Options (0.15)
CEO Tenure (-) -0.06** -0.05 -0.05 -0.05 -0.05 -0.05 -0.05
(-2.07) (-1.58) (-1.58) (-1.44) (-1.46) (-1.62) (-1.60)
No. of Obs. 310 310 310 310 310 310 310
Mc Fadden R2 0.02 0.02 0.02 0.02 0.02 0.02 0.02
127
In short, I do not observe a positive relationship between CEO stock options holding
and R&D spending. There is also no evidence to support that stock option will
encourage or discourage R&D spending among CEOs with short career horizons.
4.5.5. Restricted shares
The last type of equity incentives I consider is restricted shares. The related results are
shown in Table 4.10. In Panel A, there is some evidence suggesting that restricted
shares may discourage R&D spending. The coefficients remain negative for the variable
of shares in all regressions, and most of them reach 10% significance levels. For
instance, the coefficient for the variable of shares in column 1 of Panel A in Table 4.10
is -3.48 at 10% significance level. This suggests that if a CEO has 1% more restricted
shares out of a firm‟s total shares outstanding, the firm will reduce 3.48% R&D
spending in terms of R&D intensity. A Possible explanation for the negative effect of
restricted shares on R&D spending relies on vesting conditions of restricted shares.
Total shareholder return (TSR) is the most common vesting condition for restricted
shares (KPMG, 2007). If risky investments (e.g. R&D spending) create uncertainty of
stock return, it may lower the possibility of vesting restricted shares. Hence restricted
shares may discourage CEOs from getting involved in R&D spending. Ryan and
Wiggins (2002) report similar results for the relationship between R&D spending and
restricted shares grants by analysing US data. They document a negative relationship
between R&D spending and restricted shares grant. As far as the interactive effect of
restricted shares and the career horizon is concerned, I find no evidence in columns 3, 5
and 7 of Panel A. Similar results hold when I use alternative R&D spending variables in
Panels B and C.

128
Table 4.10 Restricted Shares, CEO career horizon and R&D spending
Panel A: R&D intensity
The panel presents OLS regression results of R&D spending intensity (R&D/Sales) on various variables for CEO career
horizons and restricted shares. The sample consists of 310 observations in 2003-2007.All variables are defined in Table 4.1
Coefficients for industry and year dummies are included but not reported. The t-statistics are reported in parentheses. The
asterisks *, **, *** denote statistical significance at 10%, 5% and 1% level, respectively.
Variables Exp.
(1) (2) (3) (4) (5) (6) (7)
Intercept 0.12*** 0.12*** 0.13*** 0.13*** 0.13*** 0.13*** 0.13***
(6.01) (4.61) (4.52) (6.32) (6.34) (6.10) (6.09)
Shares (+) -3.48* -3.37* -21.33 -3.31* -2.81 -3.25* -3.14
(-1.84) (-1.76) (-1.20) (-1.77) (-1.31) (-1.72) (-1.60)
CEO Age (-) 0.0001 -0.0002
(0.32) (-0.36)
CEO Age Above 60 (-) 0.02** 0.02**
(2.33) (2.27)
CEO Age Above 62 (-) 0.01 0.01
(1.48) (1.37)
CEO Age ? 0.34
* Shares
(1.02)
CEO Age Above 60 ? -2.99
* Shares
(-0.62)
CEO Age Above 62 ? -1.31
* Shares (-0.19)
CEO Tenure (+) -0.001 -0.001 -0.001 -0.001 -0.001 -0.001 -0.001
(-0.15) (-0.26) (-0.16) (-0.94) (-0.98) (-0.68) (-0.69)
Size (+) -0.01*** -0.01*** -0.01*** -0.01*** -0.01*** -0.01*** -0.01***
(-5.56) (-5.48) (-5.34) (-5.81) (-5.83) (-5.62) (-5.61)
Profitability (+) -0.01 -0.01 -0.01 -0.02 -0.02 -0.01 -0.01
(-0.28) (-0.32) (-0.16) (-0.71) (-0.79) (-0.46) (-0.48)
Leverage (-) -0.03 -0.02 -0.02 -0.03 -0.03 -0.03 -0.03
(-1.39) (-1.40) (-1.52) (-1.45) (-1.35) (-1.42) (-1.41)
FCF (+) 0.36*** 0.37*** 0.36*** 0.37*** 0.37*** 0.37*** 0.37***
(15.15) (14.98) (14.77) (15.42) (15.39) (15.25) (15.18)
Growth (+) -0.001 -0.001 -0.001 -0.001 -0.001 -0.001 -0.001
(-1.58) (-1.60) (-1.53) (-1.44) (-1.47) (-1.51) (-1.52)
Firm Age (-) -0.001 -0.002 -0.002 -0.001 -0.002 -0.001 -0.002
(-0.67) (-0.68) ( -0.72) (-0.58) (-0.63) (-0.52) (-0.51)
Adjusted R2 0.59 0.59 0.59 0.59 0.59 0.59 0.59
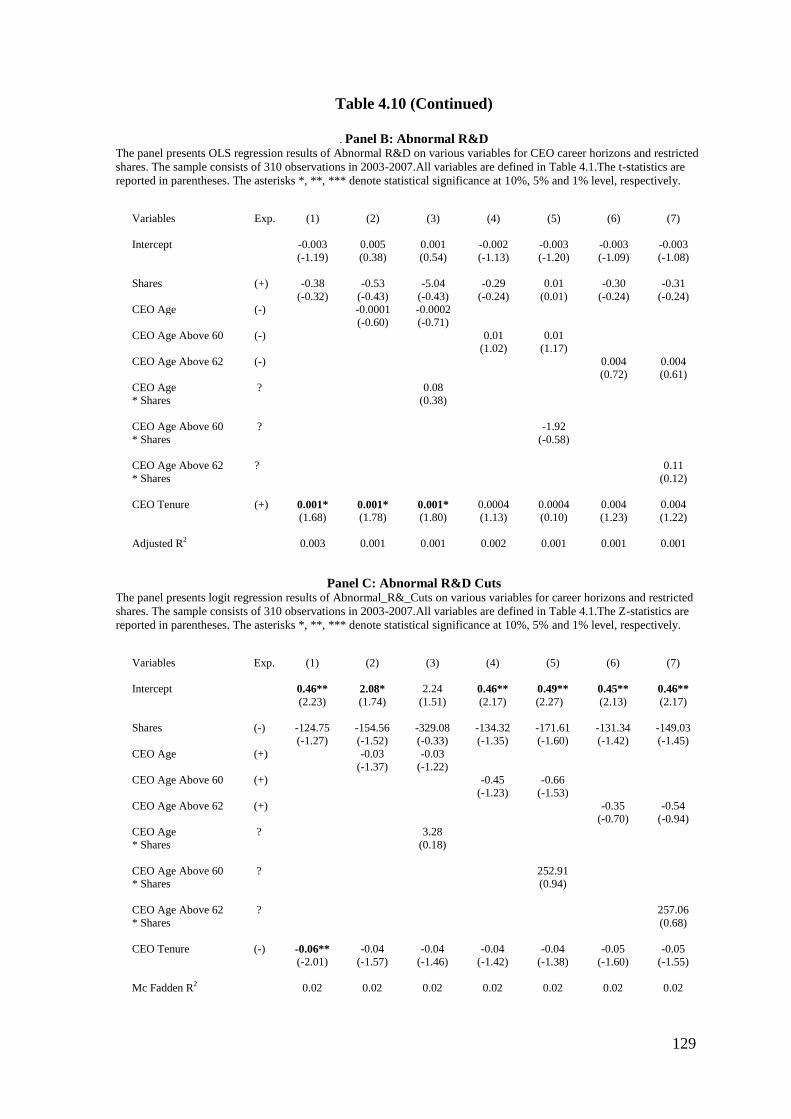
129
Table 4.10 (Continued)
. Panel B: Abnormal R&D
The panel presents OLS regression results of Abnormal R&D on various variables for CEO career horizons and restricted
shares. The sample consists of 310 observations in 2003-2007.All variables are defined in Table 4.1.The t-statistics are
reported in parentheses. The asterisks *, **, *** denote statistical significance at 10%, 5% and 1% level, respectively.
Variables Exp.
(1) (2) (3) (4) (5) (6) (7)
Intercept -0.003 0.005 0.001 -0.002 -0.003 -0.003 -0.003
(-1.19) (0.38) (0.54) (-1.13) (-1.20) (-1.09) (-1.08)
Shares (+) -0.38 -0.53 -5.04 -0.29 0.01 -0.30 -0.31
(-0.32) (-0.43) (-0.43) (-0.24) (0.01) (-0.24) (-0.24)
CEO Age (-) -0.0001 -0.0002
(-0.60) (-0.71)
CEO Age Above 60 (-) 0.01 0.01
(1.02) (1.17)
CEO Age Above 62 (-) 0.004 0.004
(0.72) (0.61)
CEO Age ? 0.08
* Shares
(0.38)
CEO Age Above 60 ? -1.92
* Shares
(-0.58)
CEO Age Above 62 ? 0.11
* Shares
(0.12)
CEO Tenure (+) 0.001* 0.001* 0.001* 0.0004 0.0004 0.004 0.004
(1.68) (1.78) (1.80) (1.13) (0.10) (1.23) (1.22)
Adjusted R2 0.003 0.001 0.001 0.002 0.001 0.001 0.001
Panel C: Abnormal R&D Cuts The panel presents logit regression results of Abnormal_R&_Cuts on various variables for career horizons and restricted
shares. The sample consists of 310 observations in 2003-2007.All variables are defined in Table 4.1.The Z-statistics are
reported in parentheses. The asterisks *, **, *** denote statistical significance at 10%, 5% and 1% level, respectively.
Variables Exp.
(1) (2) (3) (4) (5) (6) (7)
Intercept 0.46** 2.08* 2.24 0.46** 0.49** 0.45** 0.46**
(2.23) (1.74) (1.51) (2.17) (2.27) (2.13) (2.17)
Shares (-) -124.75 -154.56 -329.08 -134.32 -171.61 -131.34 -149.03
(-1.27) (-1.52) (-0.33) (-1.35) (-1.60) (-1.42) (-1.45)
CEO Age (+) -0.03 -0.03
(-1.37) (-1.22)
CEO Age Above 60 (+) -0.45 -0.66
(-1.23) (-1.53)
CEO Age Above 62 (+) -0.35 -0.54
(-0.70) (-0.94)
CEO Age ? 3.28
* Shares
(0.18)
CEO Age Above 60 ? 252.91
* Shares
(0.94)
CEO Age Above 62 ? 257.06
* Shares (0.68)
CEO Tenure (-) -0.06** -0.04 -0.04 -0.04 -0.04 -0.05 -0.05
(-2.01) (-1.57) (-1.46) (-1.42) (-1.38) (-1.60) (-1.55)
Mc Fadden R2 0.02 0.02 0.02 0.02 0.02 0.02 0.02

130
To summarize, I find some evidence to suggest that restricted shares may discourage
R&D spending, in general. However, I do not find the role of restricted shares on R&D
spending when the factors of CEO career horizon are added.
4.6. Conclusions
In this chapter, I intend to examine two questions: (1) whether career horizon will affect
R&D investment decisions, and (2) whether and how the interaction of career horizon
and CEO compensation may change the pattern of R&D spending. Based on previous
literature, I expect to observe a positive relationship between CEO career horizon
lengths and R&D spending, because the uncertainty of return and long pay-back period
of R&D spending may not fully benefit CEOs with short career horizon.
As far as CEO compensation is concerned, I expect that pension will discourage risky
investments as CEOs approach retirement, because pension will make CEOs potential
debt-holders of the firm, and a short career horizon means that the access day to pension
cash out is approaching. I have two opposite hypotheses for equity compensation: the
“interest alignment” hypothesis and the “wealth preservation “hypothesis. The former
suggests that equity incentives are able to align interests of shareholders and CEOs, no
matter how short the career horizon a CEO has. Hence, equity incentives may
encourage R&D spending even as CEOs approach retirement. The latter theory
indicates that a CEO whose career horizon is short is less likely to spend on risky
investments if they have a high level of equity incentives. The reason is that outgoing
CEOs may intend to preserve wealth gains in their equity holdings. If R&D spending
may jeopardize the certainty of their “realized gains”, they will curtail such
investments.

131
By using UK FTSE 350 data from 2003-2007, I document some empirical results for
the above mentioned questions. First of all, I do not find that CEOs will spend less on
R&D when their career horizons become shorter. After control for equity incentives, I
even find that older CEOs (aged above 62) spend more on R&D expenses. Such result
is not consistent with my hypothesis (H11), but similar to some recent empirical
evidence (e.g. Conyon and Florou, 2006; Cazier, 2011). A possible explanation is that
the recent corporate governance system realizes the incentives for R&D cuts when
CEOs approach retirement. The enhanced corporate governance mechanisms (e.g.
increasing monitoring roles of outside directors) may limit CEOs‟ short-sighted
behaviour.
Secondly, I document that pension will discourage R&D spending among older CEOs.
This is consistent with my hypothesis (H12) that the debt-like compensation (defined
benefit pension) makes CEOs more risk-averse when the day to access such assets
approaches (retirement). The unique role of pension in risk aversion is highlighted in
the condition of a short career horizon.
Thirdly, I observe that ownership will encourage R&D spending in general. However,
older CEOs with more ownership become dramatically risk-averse, which is consistent
with my “wealth preservation” hypothesis (H13b). A high level of ownership combined
with a short career horizon makes CEOs more sensitive to share price and generate the
intention to preserve gains when they are still in office. Hence they are less likely to
spend on R&D expenditures in such circumstances.

132
Fourthly, restricted shares demonstrate some negative effects on risky investments. The
vesting conditions of restricted shares and the linear pay-off structure may explain parts
of the “un-expected” risk-averse incentives. Those results are consistent with US
studies (e.g. Ryan and Wiggins, 2002) suggesting that the roles of restricted shares,
stock options and ownership on risky investments are complicated.
Overall, the study in this chapter shows some evidence to support the interactive
relationship between career horizon, CEO compensation and risky investment
decisions. The remuneration committees should consider the combined “side-effects” of
certain pay components and career horizons on value-added investment decisions.
Appropriate adjustment for CEO compensation structure is required as CEOs approach
the end of their career life.

133
Chapter 5 Conclusions
In this thesis, I examine the role of CEO compensation in the cost of debt, expectations
management and the investment policy. This study provides some interesting evidence
explaining managerial behavior and debt-holders‟ reaction from the viewpoint of CEO
compensation. It also echoes and extends a growing number of studies that demonstrate
the link between CEO compensation and managerial opportunistic behavior (e.g. Cheng
and Warfield, 2005; Kalyta, 2009).
Chapter 2 examines the link between CEO compensation and the cost of debt. I expect
that rational debt-holders will consider the impact of CEO compensation on risk-
seeking or risk-avoiding incentives, and incorporate such information when pricing
debts. I argue that CEO pay components that may provide risk-avoiding incentives will
be favoured by debt-holders, while pay components which generate risk-seeking
incentives will lead to a higher cost of borrowing. Consistent with my expectations, I
find that cash bonus and pension reduce the cost of debt, because of their unique roles
in risk-aversion incentive generation. On the other hand, equity- based compensation
results in a soaring cost of borrowing, which is consistent with previous literature (e.g.
Brockman, Martin and Unlu, 2010). Among equity incentives, stock options outweigh
ownership in terms of increasing the cost of debt. In addition, debt-holders are more
sensitive to performance-vested stock options (PVSOs) compared with traditional stock
options (TSOs), due to the different features of these stock options. In short, I provide
some evidence that bondholders do take various types of CEO compensation into
account when pricing publicly traded debt.
134
In Chapter 3, I investigate the possible link between CEO compensation and
expectations management. By dampening the market expectations, expectations
management will help CEOs to achieve financial analysts‟ earnings forecasts,
benefiting subsequent CEO bonuses and insider trading. Hence I expect that the
possibility of expectations management is positively related to bonus and equity-based
compensation which will be vested in the following year. My results confirm part of my
hypotheses. I find that although bonus and equity-based compensation may motivate
CEOs to care about achieving market expectations, only equity incentives lead to a
higher probability of expectations management. This suggests that the wide spread
expectations management in the UK (e.g. Athanasakou, Strong, and Walker, 2009) can
be partly explained by CEO compensation. CEOs are motivated to manipulate
information disclosure for personal gains.
The issue of the career horizon problem is examined in Chapter 4. The career horizon
problem hypothesizes that CEOs with a short career horizon are likely to reject long-
term investment projects. The long pay-back period and the uncertainty of the outcome
from that investment may not fully benefit exiting managers. However, there is no
conclusive view on the career horizon problem (e.g. Conyon and Florou, 2006). My re-
examination provides some additional material in this debate. In addition, I argue that
the role of CEO compensation on investment may be varied in different lengths of CEO
career horizon. Pension may make CEOs more risk-averse, especially as top managers
approach retirement. Equity incentives may also discourage risky investments, because
older CEOs are likely to preserve sure gains from equity incentives based on prospect
theory. In this empirical study, I find no evidence to support the career horizon problem
in the UK, which is similar with Conyon and Florou (2006). Older CEOs do not spend
135
less on research and development expenditures. Furthermore, I document that pensions
effectively discourage research and development spending among older CEOs only.
CEOs with more ownership and a shorter career horizon are also less likely to invest in
research and development expenditure. Overall, these findings suggest that a firm‟s
investment decision will be affected by the joint effects of CEO career horizon and his
or her pay package. CEOs are motivated to adopt an investment strategy that will fit
their own interests.
This thesis contains both merits and limitations in sample and methodology. First of all,
panel data is used in this thesis. The advantages of using panel data compared with
cross section and time series data are significant. Panel data contains a larger sample
size and more sample variability. It helps to control the impact of omitted bias and firm
heterogeneity. For instance, different firms may have different compensation package
design for their CEOs. Panel data allows me to use fixed effect analysis to control such
firm heterogeneity, focusing on the within variation of CEO compensation in individual
firms. Secondly, there are possible limitations of sample selection. In Chapter 2, the
sample selection condition is firms which issue straight bond in pound sterling. It
reduces the sample size from more than 600 firms in FTSE ALL to 44 firms finally.
Such a relatively small sample may not represent the underlying population very well.
More importantly, sample firms may have some particular characteristics (e.g less
popular in New York and Frankfurt), so that they choose to issue straight bonds in
British pound. If that is the case, the sample is not randomly selected. Thirdly, OLS
analysis is used throughout this thesis. OLS analysis can help to ascertain relationship
but not guarantee the underlying casual relationship. For instance, I study the casual
relationship between CEO compensation and the cost of debt in Chapter 2. My
136
explanation is that different CEO compensation structure will lead to high or low costs
of debt. The alternative explanation may be that different costs of debt may force
remuneration committee to adjust CEO compensation structure. Fourthly, there is
possible endogeneity problem in this study. For instance, I investigate the relationship
between R&D spending, CEO compensation and career horizon in Chapter 4. Both
variables of CEO compensation and career horizon are treated as right-hand-side
variables. A sensible question is whether CEO compensation is also decided by CEO
career horizon. If that is the case, the variable of CEO compensation is endogenous as
an independent variable in the analysis. The two-stage instrumental variables procedure
is a possible solution to overcome the suspicious endogeneity problem. In the first step,
variable of CEO compensation is treated as dependent variable, and then regressed on
selected instrumental variables along with CEO career horizon. The appropriate
instrumental variables include corporate governance variables (board size and
independence), CEO education level, lagged value of CEO compensation, stock return
volatility and the number of directorship for CEOs (e.g. Palia, 2001; Ertugrul and
Hegde, 2008). In the second step, the variable of R&D spending is treated as dependent
variables, and regressed on career horizon, control variables and the predicted value of
CEO compensation from the first regression. Therefore, by employing the two-stage
instrumental variables procedure, the suspicious endogenous variable of CEO
compensation becomes exogenous.
This thesis also has several limitations in other aspects with room to grow in future
studies. For the study of the cost of debt in Chapter 2, the data covers the time period
from 2003 to 2006 only. It may be interesting to extend the data after the financial crisis
in 2007. If debt-holders are rational and informed, how will the financial crisis change

137
their attitude to CEO compensation when pricing a firm‟s debt? Will debt-holders
reward firms that provide more risk-avoiding incentives pay to their CEOs, and require
a higher risk premium from firms that grant more risk-seeking incentives pay in the
post-financial crisis period? For the study of expectations management in Chapter 3, I
use methods developed by the literature to capture so-called expectations management
(e.g. Bartov, Givoly and Hayn, 2002; Matsumoto, 2002). Examining observable
managerial information disclosure activities (e.g. earnings warning and managerial
earnings forecasts) may provide additional support for my results. For the study of
career horizon and investment decision in Chapter 4, I focus on one type of investment
activity (R&D spending) only. Other investment decisions (e.g. firm restructuring,
mergers and acquisitions and capital expenditure) may be additional appropriate
proxies. Will the joint effect of CEO career horizon and compensation on R&D
spending remains the same for other types of investment? In addition, some corporate
governance variables (e.g. board structure and outside directors‟ incentives) are omitted
in this study. Those corporate governance variables may provide a better explanation
for the non-existence of the career horizon problem in the UK.
138
References
Aboody, D. and Kasznik, R., 2000. CEO stock option awards and the timing of
corporate voluntary disclosure. Journal of Accounting and Economics, Vol. 29, pp.
73~100.
Aggarwal, R.K. and Samwick, A.A., 1999. Executive compensation, strategic
competition, and relative performance evaluation: theory and evidence, Journal of
Finance, Vol. 54, pp. 1999~2043.
Anderson, R., Mansi, S. and Reeb, D., 2003. Founding family ownership and the
agency cost of debt. Journal of Financial Economics, Vol. 68, pp. 263~285.
Antia, M., Pantzalis, C. and Park, J., 2010. CEO decision horizon and firm
performance: An empirical investigation. The Journal of Corporate Finance, Vol.16,
pp.288~301.
Athanasakou, V., Strong, N. and Walker, M., 2009. Earnings management or forecast
guidance to meet analyst expectations? Accounting and Business Research, Vol. 39,
pp. 3~35.
Athanasakou, V., Strong, N. and Walker, M., 2011. The market reward to achieving
analyst earnings expectations: Does expectations or earnings management fool
investors? Journal of Business Finance & Accounting. Vol.38, pp.58~94.
Baik, B. and Jiang, G., 2006. The use of management forecast to dampen analysts‟
expectations. Journal of Accounting and Public Policy, Vol. 25, pp. 531~553.
Baik, B., Kang, J. and Morton, R., 2010. Why are analysts less likely to follow firms
with high managerial ownership. Journal of Accounting, Auditing and Finance, Vol. 25,
pp. 171~200.
Baker, V. and Mueller, G., 2002. CEO characteristics and firm R&D spending.
Management Science, Vol.48, No.2, PP.782~801.
Bartov, E., Givoly, D. and Hayn, C., 2002. The rewards to meeting or beating earnings
expectations, Journal of Accounting and Economics, Vol. 33, pp. 173~204.
Bartov, E. and Mohanram, P., 2004. Private information, earnings manipulation, and
executive stock-option exercise. The Accounting Review, Vol. 79, pp. 889~920.
Bergstresser, D. and Philippon, T., 2006. CEO incentives and earnings management.
Journal of Financial Economics, Vol. 80, pp. 511~529.
Bernhardt, D. and Campello, M., 2007. The dynamics of earnings forecast management.
Review of Finance, Vol. 11, pp. 287~324.
Bhojraj, S., Hribar, P., Picconi, M. and McInnis, J., 2009. Making sense of cents: An
examination of firms that marginally miss or beat analyst forecasts. Journal of Finance,
Vol.64, pp. 2361~2388.
139
Billett, M., Mauer, D. and Zhang, Y., 2010. Stockholder and bondholder wealth effects
of CEO incentive grants. Financial Management, Vol.39, pp. 463~487.
Brockman, P., Martin, X. and Unlu, M., 2010. Executive compensation and the
maturity structure of corporate debt. Journal of Finance, Vol. 65, pp. 1123~1161.
Brown, L. and Higins, H., 2005. Managers‟ forecast guidance of analysts: International
evidence. Journal of Accounting and Public Policy, Vol.24, pp. 280~299.
Bryan, S., Nash, R. and Patel, A., 2006. Can the agency costs of debt and equity explain
the changes in executive compensation during the 1990s? Journal of Corporate
Finance, Vol. 12, pp. 516~535.
Burgstahler, D. and Eames, M., 2006. Management of earnings and analysts‟ forecast to
achieve zero and small positive earnings surprises. Journal of Business Finance &
Accounting, Vol. 33, pp. 633~652.
Bushman, R.M. and Smith, A.J., 2001. Financial accounting information and corporate
governance. Journal of Accounting and Economics, Vol. 32, pp. 237~333.
Carpenter, J., 2000. Does option compensation increase managerial risk appetites?
Journal of Finance, Vol.LV(5), pp.2311~2331.
Cazier, R., 2011. Measuring R&D curtailment among short-horizon CEOs. Journal of
Corporate Finance, Vol. 17, pp. 584~594
Chen, C., Steiner, T. and Whyte, A., 2006. Does stock option-based executive
compensation induce risk-taking? An analysis of the banking industry. Journal of
Banking and Finance, Vol. 30, pp. 915~945.
Cheng, Q. and Warfield, T., 2005. Equity incentives and earnings management. The
Accounting Review, Vol.80 (2), pp. 441~476.
Cheng, S., 2004. R&D expenditures and CEO compensation. The Accounting Review,
Vol.79, pp.305~328.
Coles, J., Daniel, N. and Naveen, L., 2006. Managerial incentives and risk-taking.
Journal of Financial Economics, Vol. 79, pp. 431~468.
Combined Code, 1998, 2003, 2006, 2010. The combined code on corporate governance.
London: Financial Reporting Council.
Companies Act 2006, The UK Statute Law Database.
Conyon, M.J., Core, J. and Guay, W., 2011. Are US CEOs paid more than UK CEOs?
Inferences from risk adjusted pay. The Review of Financial Studies,Vol.24,pp.402~438.
Conyon, M.J. and Peck, S.I., 1998. Board control, remuneration committees, and top
management compensation. Academy of Management Journal, Vol. 41, pp. 146~157.
140
Conyon, M.J. and Schwalback, J., 2000. Executive compensation: Evidence from the
UK and Germany. Long Range Planning, Vol. 33, pp. 504~526.
Conyon, M.J., Peck, S.I. and Sadler, G.V., 2001. Corporate tournaments and executive
compensation: Evidence from the UK. Strategic Management Journal, Vol. 22, pp.
805~815.
Conyon, M.J. and Florou, A., 2006. The pattern of investment surrounding CEO
retirements: UK evidence. The British Accounting Review, Vol.38, pp.299~319.
Core, J. and Guay, P., 1999. The use of equity grants to manage optimal equity
incentive level. Journal of Accounting and Economics, Vol.28, pp. 151~184.
Cotter, J., Tuna, R. and Wysocki, P., 2006. Expectations management and beatable
targets: How do analysts react to explicit earnings guidance? Contemporary Accounting
Research, Vol.23, pp. 593~624.
Dahiya, S., Yermack, D., 2008.You can‟t take it with you: Sunset provisions for equity
compensations when managers retire resign or die. Journal of Corporate
Finance,Vol.14, pp.499~51 .
Daniel, N., Martin, S. and Naveen, L., 2004. The hidden cost of managerial incentives:
evidence from the bond and stock markets. SSRN Working Paper No. 612921.
Davidson, W., Xie, B., Xu, W. and Ning, Y., 2007. The influence of executive age,
career horizon and incentive on pre-turnover earnings management. Journal of
Management Governance, Vol.11, pp.45~60.
DeFusco, R., Johnson, R. and Zorn, T., 1990. The effect of executive stock options
plans on stockholders and bondholders. Journal of Finance, Vol. 45, pp. 617-627.
Dechow, P. and Sloan, R., 1991. Executive incentives and horizon problem. Journal of
Accounting and Economics, Vol.14, pp.51~89.
Degeorge, F., Patel, J. and Zeckhauser, R., 1999. Earnings management to exceed
thresholds. Journal of Business, Vol.72, pp. 1~33.
Demers, E. and Wang, C., 2010. The impact of career concerns on accruals based and
real earnings management. SSRN Working Paper No. 1562428.
Devers, C., Cannella, A., Reilly, G. and Yoder, M., 2007. Executive compensation: A
multidisciplinary review of recent developments. Journal of Management, Vol. 33, pp.
1016~1072.
Devos, E., Prevost, A. and Rao, R., 2008. The structure of executive stock option
compensation and the cost of debt. SSRN Working Paper No. 1361011.
Directors‟ remuneration report regulations, 2002. The Auditing Practices Board.
141
Duffhues, P. and Kabir, R., 2008. Is the pay-performance relationship always positive:
Evidence from the Netherlands? Journal of Multinational Financial Management, Vol.
18, pp. 45~60.
Duru, A., Manshaw, S. and Reeb, D., 2005. Earnings-based bonus plans and the agency
cost of debt. Journal of Accounting and Public Policy, Vol.24, pp. 431~447.
Edmans, A. and Liu, Q., 2011. Inside debt. Review of Finance, Vol.15, pp.75~102.
Ertugrul, M. and Hegde, S., 2008. Board compensation practices and agency cost of
debt. Journal of Corporate Finance, Vol. 14, pp. 512~531.
Gerakos, J., 2007. CEO pensions: disclosure, managerial power, and optimal
contracting. SSRN Working Paper No. 982180.
Gibbons, R. and Murphy, K., 1992a. Does executive compensation affect investment?
Journal of Applied Corporate Finance, Vol.5, pp.99~109.
Gibbons, R. and Murphy, K., 1992b. Optimal incentive contracts in the presence of
career concerns: theory and evidence. Journal of Political Economics, Vol.100,
pp.468~506.
Graham, J., Harvey, C. and Rajgopal, S., 2005. The economic implication of corporate
financial reporting. Journal of Accounting and Economics, Vol. 40, pp. 3~73.
Greenbury. R., 1995. Directors‟ remuneration: report of a study group chaired by Sir
Richard Greenbury. London: Gee.
Greene, W.H., 2007. Econometric Analysis. Sixth edition, Prentice Hall.
Guay, W., 1999. The sensitivity of CEO wealth to equity risk: an analysis of the
magnitude and determinants. Journal of Financial Economics, Vol. 53, pp. 43~71.
Gupta, V., 2006. Pension risk: do employees care? SSRN Working Paper No. 933028.
Hall, B. and Murphy, K., 2003. The trouble with stock. Journal of Economic
Prospective, Vol.17, pp.49~70.
Hillier, D. and Marshall, A., 2002. Are trading ban effective? Exchange regulation and
corporate insider transaction around earnings announcements. Journal of Corporate
Finance, Vol. 8, pp. 393~410.
Holland, J., 2005. A ground theory of corporate disclosure. Accounting and Business
Research, Vol.35, pp. 249~267.
Holthausen, R., Larcker, D. and Sloan, R., 1995. Annual bonus schemes and the
manipulation of earnings. Journal of Accounting and Economics, Vol. 19, pp. 29~74.
Hone, H., Kubik, J. and Solomon, D., 2000. Security analysts‟ career concerns and
herding of earnings forecast. RAND Journal of Economics, Vol. 31, pp. 121~144.
142
Ivkovic, Z. and Jegadeesh, N., 2004. The timing and value of forecast and
recommendation revision. Journal of Financial Economics, Vol. 73, pp. 433~463.
Jensen, M.C. and Meckling, W., 1976. Theory of the firm: managerial behaviour,
agency costs, and capital structure. Journal of Financial Economics, Vol. 3, pp.
305~360.
Jensen, M.C. and Murphy, K.J., 1990. Performance pay and top-management incentive.
Journal of Political Economy, Vol.98, pp. 225~264.
John, T. and John, W., 1993. Top-management compensation and capital structure.
Journal of Finance, Vol. 48, pp. 949~974.
Johnson, S. and Tian, Y., 2000. The value and incentive effects of non-traditional
executive stock option plans. Journal of Financial Economics, Vol. 57, pp.3~34.
KPMG, 2007. KPMG‟s survey of directors‟ compensation 2007. KPMG LLP (UK).
Kahneman, D. and Thaler, R., 1991. Economic analysis and the psychology of utility:
Applications to compensation policy. American Economic Review, Vol. 81,
pp.341~352.
Kahneman, D. and Tversky, A., 1979. Prospect theory: An analysis of decisions under
risk, Econometrica, Vol. 47, pp. 263~291.
Kalyta, P., 2009. Accounting discretion, horizon problem, and CEO retirement benefits.
The Accounting Review, Vol.84, PP.1553~1573.
Kasznik, R. and Lev, B., 1995. To warn or not to warn: Management disclosures in the
face of an earnings surprise. The Accounting Review, Vol. 70, pp. 113~134.
Klock, M. Mansi, S. and Maxwell, W., 2005. Does corporate governance matter to
bondholders? Journal of Financial and Quantitative Analysis, Vol. 40, pp. 693~719.
Kross, W. Ro, B. and Suk, I., 2010.Consistency in meeting or beating earnings
expectation and management earnings forecast. Journal of Accounting and Economics,
forthcoming.
Kuang, Y., 2008. Performance-vested stock options and earnings management. Journal
of Business Finance & Accounting, Vol. 35, pp. 1049~1078.
Kuang, Y., Qin, B., 2009. Performance-vested stock options and interest alignment. The
British Accounting Review, Vol. 41, pp. 46~61.
Lambert, R.1993. The use of accounting and security price measures of performance in
managerial compensation contract: A discussion. Journal of Accounting and
Economics, Vol. 16, pp. 101~123.
143
Langberg, N. and Sivaramakrishnan, K., 2008. Voluntary disclosures and information
production by analysts. Journal of Accounting and Economics, Vol. 46, pp. 78~100.
Leone, A. J., Wu, J. S. and Zimmerman, J.L., 2006. Asymmetric sensitivity of CEO
cash compensation to stock return. Journal of Accounting and Economics, Vol. 42, pp.
167~192.
Low, A., 2009. Managerial risk-taking behaviour and equity-based compensation.
Journal of Financial Economics, Vol. 92, pp. 470~490.
Lundstrum, L., 2002. Corporate investment myopia: a horserace of the theories. The
Journal of Corporate Finance, Vol.8, p353~371.
Matsumoto, D., 2002. Managements‟ incentives to avoid negative earnings surprises.
The Accounting Review, Vol. 77, pp. 483~514.
Matsunaga, S. and Park, C., 2001. The effect of missing a quarterly earnings benchmark
on the CEO‟s annual bonus. The Accounting Review, Vol. 76, pp. 313~332.
Matta, E. and Beamish, P., 2008. The accentuated CEO career horizon problem:
evidence from international acquisitions. Strategic Management Journal, Vol.29,
pp.683~700.
Minhat, M., 2009. Three essays on CEO compensation in the UK. Unpublished PhD
Thesis, University of Stirling.
Murphy, K.J.1999.Executive Compensation. Handbook of Labour Economics: New
York, PP.2485~2563.
Murphy, K.J. and Zimmerman, J.L., 1993. Financial performance surrounding CEO
turnover. Journal of Accounting and Economics, Vol.16, PP.273~315.
Nagar, V., Nanda, D. and Wysocki, P., 2003. Discretionary disclosure and stock-based
incentives. Journal of Accounting and Economics, Vol.34, pp. 283~309.
Ortiz-Molina, H., 2006. Top management incentives and the pricing of corporate public
debt. Journal of Financial and Quantitative Analysis, Vol.41, pp. 317~340.
Ortiz-Molina, H., 2007. Executive compensation and capital structure: The effects of
convertible debt and straight debt on CEO pay. Journal of Accounting and Finance,
Vol. 43, pp. 69~93.
Ozkan, N., 2011. CEO compensation and firm performance: An empirical investigation
of UK panel data. European Financial Management, Vol. 17, Issue 2, pp. 260~285.
Palia, D., 2001.The endogeneity of managerial compensation in firm value: A solution.
The Review of Financial Studies, Vol. 14, Issue 3, pp. 735~764.
Pensions Act 2004. The UK Statute Law Database.
144
Prevost, A., Rao, R. and Skousen, C., 2008. Earnings management and the cost of debt.
SSRN Working Paper No. 1083808.
PWC, 2008. Out with the old: Creating a sustainable and effective approach to
rewarding executives”, FTSE-100, Review of the year 2008. PriceWaterhouseCoopers
LLP (UK).
Richardson, S., Teoh, S. and Wysocki, P., 2004. The walk-down to beatable analyst
forecast: The role of equity issuance and insider trading incentives. Contemporary
Accounting Research, Vol. 21, pp. 885~924.
Ryan, H. and Wiggins. R., 2002. The interactions between R&D investment decisions
and compensation policy. Financial Management, Spring Edition, pp.5~29.
Sanders, W.G. and Carpenter, M.A., 2003. Strategic satisficing? A behavioural-agency
theory perspective on stock repurchase program announcements. Academic of
Management Journal, Vol.46 (2), pp.160~178.
Sanders, W.G. and Hambrick, D., 2007. Swinging for the fences: the effects of CEO
stock options on company risk taking and performance. Academy of Management
Journal, Vol. 50, pp. 1055~1078.
Shaw, K., 2007. CEO incentives and the cost of debt. Working Paper, University of
Missouri-Columbia.
Skinner, D. and Sloan, R.G., 2002. Earnings surprise, growth expectations, and stock
return for don‟t let an earnings torpedo sink your portfolio. Review of Accounting
Studies, Vol. 7, pp. 289~312.
Smith, C. and Watt. R., 1992. The investment opportunity set and corporate financing,
dividend and compensation policy. Journal of Financial Economy, Vol.31, pp.263~292.
Sundaram, R. and Yermack, D., 2007. Pay me later: Inside debt and its role in
managerial compensation, Journal of Finance, Vol. 52, pp. 1551~1588.
Wei, C. and Yermack, D., 2011. Investor Reactions to CEOs‟ Inside Debt Incentives.
The Review of Financial Studies, Forthcoming.
Wu, J. and Tu, R., 2007. CEO stock option pay and R&D spending: a behavioural
agency explanation. Journal of Business Research, Vol. 60, pp. 482-492.

145
Appendix
Valuation of stock options and restricted shares from BoardEx
1. Black Scholes calculation and assumptions for Stock option
C = SN(d1) – Xe-rt
N(d2)
Where d1 = (ln(S/X) + (r + σ2/2)T) /σ(sqrt(T))
Where d2 = (ln(S/X) + (r - σ2/2)T) /σ(sqrt(T))
Black-Scholes requires a series of data items which are defined below:
• No. of Options = to that entered
• Share Price = to that of the company at the Annual Report date selected
• Time to expiry = Expiry date – annual report date
• Dividend Yield = 0
• Volatility = a 100-day historic moving average
• Risk Free Interest Rate: UK = 6 months Libor rate
• Exercise Price = to that entered or a calculated exercise price (a calculated price
is derived as follows: from information disclosed an Intrinsic Value, the No. Of
Options and the Date of valuation the exercise price
= Share Price - (Intrinsic Value/No. of Options).
2. Calculation and assumptions for Share granted and ownership
• The estimated value of restricted shares = number of restricted shares (Max.)
* Share price (end of year)
• The estimated value of ownership = number of shares owned by executives
* Share price (end of year)