The Role of Balanced Scorecard Indicators in Enhancing the ...
19
European Journal of Business and Management www.iiste.org ISSN 2222-1905 (Paper) ISSN 2222-2839 (Online) Vol.5, No.6, 2013 148 The Role of Balanced Scorecard Indicators in Enhancing the Marketing Performance of dairy industries, in Jordan Dr. Firas Jamil Al-otoum, Isra university, P.O Box 22, code 11622,Amman – Jordan. E-mail: [email protected] Dr.Mahmoud Abdel Muhsen Al-Afeef,, P.O Box 22, code 11622,Amman – Jordan. E-mail: [email protected] Dr. Mohammad Salameh Almahyreh, P.O Box 22, code 11622,Amman – Jordan. E-mail: [email protected] Dr. ISLAM BASSAM ABDEL ABU JAFFER, UNIVERSITY OF CREATIVE SCIENCES, UNITED ARAB EMIRATES, [email protected] Abstract: This study aims to identify the relationship between the four dimension indicators of the balanced scorecard, they are: stakeholders and beneficiaries, internal processes and procedures, education, development and innovation of human resources, and finally the financial dimension, The study recommended a series of recommendations that are believed to be important in the development of the process of using Balanced Scorecard indicators within the dairy industry companies in Jordan, because of their role in promoting the aspects of profitability and market capitalization. 1.Introduction: Measuring performance is considered one of the trends of modern management that is the basis of all the institutions and organizations of different objectives and activities, the fact that it is done according to a set of criteria to be used for this purpose, and the measuring of performance for the pharmaceutical companies and extracting indicators of this performance is considered important to determine the level of productivity and effectiveness of these devices in the performance of their tasks and work, it reflects the effectiveness of this performance and its efficiency in the implementation of plans and programs in these organizations, and its primary objective is reflected in an improved performance and increased productivity so that it can carry out its duties to the fullest. The level of success of performance measurement to businesses is based on the development of standards that are referenced when needed for the development of this performance in the organization, or to find out its course of action, determine the size of the deviation in the actual performance of desired or planned, knowing the strengths and weaknesses, and to extract indicators that reflect the level of this performance, which may vary depending on the activity of the organization and its objectives, as the agricultural organizations vary in performance criteria and in indicators from the industrial organizations, or commercial, or educational, or banking organizations. 2.Problem of the study: Jordan witnessed in the recent years, a remarkable development in all fields, and the food industry, especially in the area of the dairy industry had the largest share of this development, and the information indicates that there are in the Kingdom more than 96 dairy factories that operate on the basis of profitability, and have achieved self-sufficiency in the production of raw milk, and these companies produce approximately 85% of the total production, and the share of their exports reached about 35% in 2008 of total food exports to the Kingdom. (www.dos.gov.jo) Despite the economic importance of the industry in overall economic activity, it suffers weaknesses in many aspects, especially in the marketing and processing aspects: long distance of production areas from the consumption areas
Transcript of The Role of Balanced Scorecard Indicators in Enhancing the ...
European Journal of Business and Management www.iiste.org
ISSN 2222-1905 (Paper) ISSN 2222-2839 (Online)
Vol.5, No.6, 2013
148
The Role of Balanced Scorecard Indicators in Enhancing the
Marketing Performance of dairy industries, in Jordan
Dr. Firas Jamil Al-otoum, Isra university, P.O Box 22, code 11622,Amman – Jordan. E-mail: [email protected]
Dr.Mahmoud Abdel Muhsen Al-Afeef,, P.O Box 22, code 11622,Amman – Jordan. E-mail: [email protected]
Dr. Mohammad Salameh Almahyreh, P.O Box 22, code 11622,Amman – Jordan. E-mail: [email protected]
Dr. ISLAM BASSAM ABDEL ABU JAFFER, UNIVERSITY OF CREATIVE SCIENCES, UNITED ARAB
EMIRATES, [email protected]
Abstract:
This study aims to identify the relationship between the four dimension indicators of the balanced scorecard, they are:
stakeholders and beneficiaries, internal processes and procedures, education, development and innovation of human
resources, and finally the financial dimension, The study recommended a series of recommendations that are
believed to be important in the development of the process of using Balanced Scorecard indicators within the dairy
industry companies in Jordan, because of their role in promoting the aspects of profitability and market
capitalization.
1.Introduction:
Measuring performance is considered one of the trends of modern management that is the basis of all the institutions
and organizations of different objectives and activities, the fact that it is done according to a set of criteria to be used
for this purpose, and the measuring of performance for the pharmaceutical companies and extracting indicators of
this performance is considered important to determine the level of productivity and effectiveness of these devices in
the performance of their tasks and work, it reflects the effectiveness of this performance and its efficiency in the
implementation of plans and programs in these organizations, and its primary objective is reflected in an improved
performance and increased productivity so that it can carry out its duties to the fullest.
The level of success of performance measurement to businesses is based on the development of standards that are
referenced when needed for the development of this performance in the organization, or to find out its course of
action, determine the size of the deviation in the actual performance of desired or planned, knowing the strengths and
weaknesses, and to extract indicators that reflect the level of this performance, which may vary depending on the
activity of the organization and its objectives, as the agricultural organizations vary in performance criteria and in
indicators from the industrial organizations, or commercial, or educational, or banking organizations.
2.Problem of the study:
Jordan witnessed in the recent years, a remarkable development in all fields, and the food industry, especially in the
area of the dairy industry had the largest share of this development, and the information indicates that there are in the
Kingdom more than 96 dairy factories that operate on the basis of profitability, and have achieved self-sufficiency in
the production of raw milk, and these companies produce approximately 85% of the total production, and the share
of their exports reached about 35% in 2008 of total food exports to the Kingdom. (www.dos.gov.jo)
Despite the economic importance of the industry in overall economic activity, it suffers weaknesses in many aspects,
especially in the marketing and processing aspects: long distance of production areas from the consumption areas
European Journal of Business and Management www.iiste.org
ISSN 2222-1905 (Paper) ISSN 2222-2839 (Online)
Vol.5, No.6, 2013
149
and what follows in obstructing the flow of the production of the product to the consumer, as well as increased
marketing costs, and competition from the imported manufactured dairy products towards the local products, and the
concentration of dairy factories in some areas without the others, and the poor coordination between the factories,
and in particular with regard to the quantities of milk produced and the rest of the dairy products, and the lowered
capacity of some factories (Qurmla, 2008).
Therefore, the above input is used to improve the process of merketing differentiation, and the link between the
application of the Balanced Scorecard indicators, and the development of marketing performance for these
companies, and this study tries to find the answer to the problem of the study through the following questions:
• What is the relationship between the application of the standard of stakeholders and beneficiaries, and the
marketing performance of the dairy industry in Jordan?
• What is the relationship between the application of the standard of internal processes and procedures and marketing
performance of the dairy industry in Jordan?
• What is the relationship between the application of the standard of education and development and innovation of
human resources and marketing performance of the dairy industry in Jordan?
• What is the relationship between the application of the standard of investment returns and financial and marketing
performance of the dairy industry in Jordan?
• What are the differences in the marketing performance of the dairy industry companies according to market share
and profit volume differences?
3. Objectives of the study:
This study aims to identify:
• determine the relationship between the application of the standard of stakeholders and beneficiaries, and the
marketing performance of the dairy industry in Jordan?
• determine the relationship between the application of the standard of internal processes and procedures, and the
marketing performance for the dairy industry in Jordan?
• determine the relationship between the application of the standard of education and development, and the standard
of innovation of human resources and marketing performance of the dairy industry in Jordan?
• determine the relationship between the application of the standard of investment and financial returns, and the
marketing performance of the dairy industry in Jordan?
• determine the statistical differences in the marketing performance for the dairy industry in Jordan, according to the
company's size and the size of its profits?
3.1The importance of the study:
This study highlights the importance of:
• Scarcity of studies that tried to link the marketing performance with the Balanced Scorecard Indicators.
• Scarcity of studies that have tried to examine the previous relationship on the dairy sector companies in Jordan.
• Feedback provided by this study to the decision-makers in those companies.
• Feedback provided by this study for all businesses interested in measuring performance.
3.2 Hypotheses:
To achieve the objectives of the study, the following hypotheses have been formulated:
Ho1: There is no statistically significant relationship between the application of the standard of stakeholders and
beneficiaries, and the marketing performance in the dairy industry companies in Jordan.

European Journal of Business and Management www.iiste.org
ISSN 2222-1905 (Paper) ISSN 2222-2839 (Online)
Vol.5, No.6, 2013
150
Ho2: There is no statistically significant relationship between the application of the standard of internal processes
and procedures, and the marketing performance in the dairy industry companies in Jordan.
Ho3: There is no statistically significant relationship between the application of the standard of education and
development, and innovation of human resources, and the marketing performance of the dairy industry companies in
Jordan.
Ho4: There is no statistically significant relationship between the application of the standard of investment and
financial returns, and the marketing performance of the dairy industry companies in Jordan.
Ho5: There are no statistically significant differences in the marketing performance of the dairy industry companies,
depending on the size of the company and the size of its profits.
3.3 Previous studies:
• The study of (Qahtani and Eagles, 2009) entitled Measuring the performance of governmental organizations in
Jordan: An Empirical Study on some government departments in Dhlail province. This study was aimed to
identify the level of performance of governmental departments in Jordan through the application of the criteria used
in the axes of the Balanced Scorecard. The study found that 74.7% of indicators that reflect the interests and needs of
the beneficiaries of government services are not available, and that 68% of the indicators that reflect the processes
and procedures within those departments are not available as well, and the study also found that 43.7% of the
departments involved have indicators that reflect the creativity and development and qualification of human
resources, the study also adds that 30.7% of government departments apply financial indicators that are related to its
strategic objectives. The study recommended a set of recommendations believed to be important in the development
process for measuring government performance and improving it through the use of the Balanced Scorecard in
governmental organizations operating in Jordan.
• The study of (Zureikat, 2008) entitled "Balanced Scorecard in Jordanian industries", which aimed to try to
understand the Balanced Scorecard in the Jordanian Industrial Companies, by identifying the use of this card in these
companies, and studied a range of internal and external factors affecting its use, and among these factors are: the
company's strategy, organizational structure, the external environment, the degree of competition in the markets, and
the size of the company. The results showed that there was considerable support for the application of the Balanced
Scorecard in the Jordanian Industrial Companies, and they also shows that the organization of administrative
procedures, and the size of the company positively affect the use of the Balanced Scorecard, and that the company's
central strategy, external environment and the degree of competition does not positively affect the use of the
Balanced Scorecard. Finally, the study recommended directing researchers to study other areas in the Balanced
Scorecard, and the possibility of expansion in its application and focusing on the benefits of its use.
• The Study of (Shibley, 2005) which has implemented the idea for the balance score panel on the commercial
banking sector in Iraq, and showed the importance of this panel and its various dimensions to provide its strategy
with prior information that it needs, it also organized the flow of information within four integrated dimensions that
depend on each other, and they are: financial dimension, customer dimension, internal processes dimension, learning
and growth dimension, as well as its help for the management of the organization to overcome some of the
conventional problems facing the Organization, namely: the problem of the time spent between planning processes
and the need for information, and the problem of lack of language understanding between business executives and
officials for information systems in the organization. The study found that the management of commercial banks in
Iraq lacks the environmental information analysis, which form an important basis in the organization's strategic

European Journal of Business and Management www.iiste.org
ISSN 2222-1905 (Paper) ISSN 2222-2839 (Online)
Vol.5, No.6, 2013
151
direction, and a strategic module has been developed in accordance with the work of the panel that helps those banks
in the formulation and implementation of an effective strategy that controls the balance between the bank’s strategic
orientations and the development of its operations.
4. Balanced Scorecard:
This card is represented through the different dimensions that create it; strategic direction of the organization towards
future performance, and its operational performance measures, which is not satisfied by only using measures of
financial performance, but adds measures of non-financial performance, and provides a whole and clearer picture
about the organization's performance and the best way to achieve this performance, as it represents the card through a
perspective that combines the important performance indicators or the key success factors of the organization, and
this card represents consecutive chains of goals and measures that are interdependent on each other, supports and
binds it in the light of reason and the subsequent acts and procedures (Kaplan & Norton, 1992, PP 64-65).
Therefore, the Balanced Scorecard is considered as a means to revitalize the performance of business units and its
measuring, as it contributes to improved the performance and measuring its progress and the changes that happen on
it, and as it was defined, the card consists of four dimensions: financial, customer, internal processes, growth and
education; it provides a balanced vision about the operational performance for the company's future direction
(Kaplan & Norton, 1996, p.53).
Both Kaplan & Norton in building the card and determining its implications, adopted two assumptions: the effective
measurement which should be the main part in the management process, and the other part is what should be
measured, as in what can be obtained, therefore, the effective administration depends on the effective measurement
of performance and its results ( Bulter et al, 1997, P.242).
(Bulter et al, 1997) has tried to critique the idea underlying the balanced scorecard which was brought by both
Kapaln & Norton, where in his critique he showed the long-term strategy on one hand, and the principles that realize
the connection status between the measures and the method that the organization use as a basis of its work, The
principles included the following: clients, people, innovation & renewal, operation, performance, suppliers, and the
commlocal unity. He also adopted three major dimensions of the card, and they are: Shareholders, extraordinary
growth, and continuous development.
Therefore, this card provides various real-time information for the managers (Kaplan & Norton, 1992, P.71), and it
was developed to meet the many needs of managers at one time, and provide senior management with a
comprehensive view of the business in a clear and a fast way, and the card through its four dimensions, show the
integration between the financial measures and the non-financial measures, and thus it represents the operational
goals and standards in its various dimensions, and those are considered the movers towards the future financial
performance of the organization, as it embodies the card through its objectives and standards by an interactive and
integrated relationship between the long-term strategic orientations and its operational operations.
The Balanced Scorecard leads the strategy from a general concept to a frame, which guides the organization in
guiding its work, and in the determination of its image that should be in the future, which enable them to take
appropriate decisions in the administrative levels and all regulatory departments. This card is a method or a plan that
consists of integration, and balance between the organization's main goals, its policy, and in a simultaneous way, with
the procedures that it does in its general form (Certo: 1995, P.6).
The card represents a group of homogeneous patterns of decisions taken by the organization (Schroeder, 1989, P.11),

European Journal of Business and Management www.iiste.org
ISSN 2222-1905 (Paper) ISSN 2222-2839 (Online)
Vol.5, No.6, 2013
152
and the meanings of the strategy has been summarized that it includes a Plan, a Pattern, a Poly, a Position, and a
Perspective (Mintzberg: 1987, P.11) and of them individually or jointly may represent the meant strategy in a
particular area.
Finally, this method might erupt a set of problems, mainly: wasted time between planning processes and the need to
supply the information, and the need for a language understanding shared between business executives and officials
about information systems (VanDer Zee & DEJong, 1999, P.199 ). Avoiding these problems requires an immediate
response to the need of the strategy and its information management, which requires the development of a special
information model that feeds the strategy with information that helps it and clears the way for success into the future,
as well as providing measures designed to measure the impact of the multi environmental dimensions on the strategy,
from which it is possible to measure the development or improvement made by the strategy towards the future
through its relationship with these dimensions.
4.1 Balanced Scorecard components:
These balanced goals consist in its original form of four separate cards, each containing targets specialized in one
field, and ultimately all of them realize the materialistic and private goals for the development of physical work, and
these cards are as follows:
4.2.A Financial goals card:
This Card uses Financial indicators because they reflect the profitability objectives of the organizations in general,
and its role is to maximize the share of shareholders and stakeholders, however, it's different in non-profit
organizations, despite their need for adequate resources to perform their activities and maintain continuity in the
market. The financial targets are based on the rate of return, cost reduction, improving productivity, returns on
investment, the growth of sales, income, and market share. And to measure these goals, financial percentages and
numbers of various goals that represent the operational performance in various times are used, and here it is indicated,
for example, that the value of the net profit is large, while the rate of return on investment is less, additionally, the
cash flow is very important in times of financial hardship (Kaplan, 1992 & Norton).
4.2.B Customers Card:
This card consists of goals related with customer and the beneficiaries satisfaction of the organization, which
includes a set of quality standards: customer satisfaction and detention, gaining a new one, customer profitability,
and the market share of the targeted sectors, it is also linked with client markers such as, time, quality, performance,
European Journal of Business and Management www.iiste.org
ISSN 2222-1905 (Paper) ISSN 2222-2839 (Online)
Vol.5, No.6, 2013
153
service, and reduced cost, it also satisfies the needs of the clients through new products, responding to complaints
and questions, improving the service or the sale methods, and increase product knowledge (Kaplan & Norton, 1992).
This card helps to cover the shortcomings of the organizations that do not measure these goals, where it is rare to find
an organization in the developing countries that asks their clients to comment on the services they provide, while the
organizations that work in developed countries send a lot of questionnaires that aim to identify the costumer wishes,
preferences, tendencies and trends.
The organization, which is trying to maximize the financial figures in the short term will find after a period of time
that customer requirements have changed, and its products have become undesirable, and the organization that does
not track customer requests , suggestions and complaints, will be subject to loss of many of its clients and their leak
to other competitors in the market (Shibley .2005 ).
4.3.C Internal processes card:
Many organizations neglect many internal operational performance measures, and this leads to a decline in
performance. Generally, this dimension is based on the operations that are characterized by the organization, and
has a clear value in revitalizing and pushing it towards achieving its strategic objectives, and the executive managers
also identify the processes that give the organization a clear superiority, and provides a high value-added for the
customer in the target market, as it responds to the expectations of stakeholders on improving the rates of return.
This card tries to develop the organization from the inside and maintain a high level of performance, including:
manufacturing quality, the wastage in raw manufactured materials, the time of progress in industrialization, the rapid
change of production from product to product, the quality of design, the relationship with suppliers, the development
of business systems management , the use of information technology, cooperation between various departments, new
design, and the percentage of reduction in the conversion cycle time. (Kaplan, 1992 & Norton).
4.4.D Learning and creativity card:
This card is used to help the organization to monitor the innovative capacity of its employees compared with the
other competitors in the market, and that includes the development of possibilities for working in the
organization in accordance with the requirements of innovation and change in order to ensure the progress of the
organization in achieving its objectives and continuous improvement, as this requires attention to the prevailing
structure which helps in the formation of the long-term growth process, and in improving it. The organizational
learning and growth are dependant on three main elements that include persons, the system, and regulatory actions.
This card is connected with the ability of the organization to achieve multiple objectives that include the application
of administrative policies that are up to date, learning new technology, providing a number of new products, the
number of proposals submitted and implemented by the personnel, and the existence of an incentive in employees for
innovation and development (Kapaln & Norton: 1996: P.64 ). Accordingly, the investment in the development of
the skills of the workers and in strengthening the information systems and the information technology, and in
organizing the relationship between actions and regulatory pathways; contribute to reducing the gap between the
current systems and procedures, with its required goals and performance measures.
5.Study Methodology:
A) the population of the study: The study population consists of all managers of operational units in the dairy
industry companies operating in Jordan in 2012.
B) the study sample: a sample was withdrawn from managers working in the dairy industry companies in Dhlail city,
and they were numbered in about 50 Executive Directors (Finance, Administration, Control, customers and

European Journal of Business and Management www.iiste.org
ISSN 2222-1905 (Paper) ISSN 2222-2839 (Online)
Vol.5, No.6, 2013
154
marketing).
Table 1: Distribution of the sample by educational level and age
Educational
level
Number Percentage Age
level
Number Percentage Years of
experience
Number Percentage
General
Secondary
education
8 16 Less
than
30
years
3 6 Less than 5
years
2 4
Diploma 11 22 30 –
less
than
40
8 16 5 – less
than 10
12 24
University 25 50 40 –
less
than
50
29 58 10 – less
than 15
22 44
Higher
education
6 12 50 –
less
than
60
10 20 15+ 12 24
Total 50 100 Total 189 100 Total 50 100
Table 2: Distribution of the company sample by the size and market share
Market Share Number Percentage
Less than 5% 3 15
5% - less than 10% 6 30
10% - less than 15% 9 45
15% + 2 10
Total 20 100
C) Study Methodology: The study used a descriptive analysis method on that data that has been obtained, and
therefore, it used measures of central tendency like the arithmetic mean, the median, standard deviation, as well as
statistical methods for testing hypotheses such as: chi square test and the correlation coefficients, and Table 3 shows
statistical tests conducted on the study data, which indicate that all previous tests are statistically acceptable.

European Journal of Business and Management www.iiste.org
ISSN 2222-1905 (Paper) ISSN 2222-2839 (Online)
Vol.5, No.6, 2013
155
Table 3: statistical tests and its objective
Axis Half-axis coefficient of
variation
Cronbach alpha
Axis of clients and beneficiaries 0.74 0.91
Internal processes axis 0.95 0.88
Axis of learning, development
and innovation
0.96 0.87
Financial Axis 0.87 0.96
D) sources of data collection: The study relied on two types of data: the secondary data was by reviewing the
literature of the subject in scientific journals, books and studies of Arab and foreign countries, as well as specialized
websites. However, for the raw data, a questionnaire has been developed to collect the necessary data from a study
sample.
E) the validity and reliability of the questionnaire: a correlation coefficient variation has been found for each axis,
ranging between 74% - 96%, which is statistically significant at the 5% level of significance. and it turned out that
the reliability coefficient for the measure as a whole is 90% (alpha Kronbach), noting that the test parameters for
each axis individually ranged between 87% - 96%, which indicates that the scale is characterized by a high factor of
stability that gave the data used a type of validity and reliability.
To judge the degree of acceptance or rejection of the variables (phrases) the following criterion has been used:
- If the value of the arithmetic mean of the variable was less than 2.33 it is considered weak.
- If the value of the arithmetic mean of the variable lies between 2.34 - 3.66 it is considered average.
- If the value of the arithmetic mean of the variable was more than 3.67 then it's considered to be strong.
6. Study sample:
Independent variables (Balanced Scorecard indicators)
Axis of clients and beneficiaries.
Axis of internal processes
.
Axis of learning and development and innovation
Financial Axis.
Intermediate variables
The size of the company, the size of profits
The dependent variable
Market share
6.1 Study hypotheses testing:
Ho1: There is no statistically significant relationship between the application of the standard of stakeholders and

European Journal of Business and Management www.iiste.org
ISSN 2222-1905 (Paper) ISSN 2222-2839 (Online)
Vol.5, No.6, 2013
156
beneficiaries and the marketing performance of the dairy industry companies in Jordan.
Table 4: Distribution of sample's answers and the descriptive statistics of the axis of the beneficiaries
Phrase The
arithmetic
mean
Standard
deviation
Decision
Tools are used to measure the satisfaction of the beneficiaries
and customers about your products.
3.862 0.950 Strong
Tools are used to measure the growth of beneficiaries from your
products.
2.924 1.406 Average
An effective device to examine the complaints of
beneficiaries of your products.
3.937 0.906 Strong
Tools are used to measure public participation in events and
programs organized by your company.
2.331 1.785 Weak
There is a tool to measure the level of satisfaction of other
related sectors with you.
2.458 0.986 Average
There is a guide for the classification of the level of the current
relationship with the beneficiaries of your products.
2.816 0.934 Average
There are tools to measure the quality of the beneficiaries of
your products.
2.572 0.899 Average
There are tools to expand the size of the company's
participation in local community service.
2.741 0.879 Average
There is a public relations device capable of measuring and
improving your image to the outside world.
2.343 0.990 Average
There are tools to measure the rate of growth of new products
relative to the number of new customers.
2.188 0.888 Weak
Availability of tools to monitor changes in the external
environment and take advantage of them in the design of new
products.
2.231 1.765 Weak
The above table shows that the dairy industry companies in Jordan are characterized by a moderate level in the
application of a lot of indicators that relate to the axis of the beneficiaries of its products, and the table shows that
there are two indicators that recorded a strong application level, and they are: the use of tools to measure
beneficiaries and client satisfaction from the company's products, as well as having an effective device to examine
the complaints of beneficiaries of products in most of the dairy industry companies in Jordan. However, the weak
indicators that are not applied by the companies operating in this sector were not using tools to measure public
participation in events and programs organized by the company, and the lack of tools to measure the rate of growth
of new services relative to the number of new customers, and finally the lack of tools to monitor the changes that
occur in the external environment and utilizing it in the design of new products.
The remaining indicators were of average level, and they are arranged according to their importance as follows:
• Use of tools to measure the rate of growth of the beneficiaries of the products.
• Use of a guide to classify the level of the current relationship with the beneficiaries of your products.

European Journal of Business and Management www.iiste.org
ISSN 2222-1905 (Paper) ISSN 2222-2839 (Online)
Vol.5, No.6, 2013
157
• There are tools to measure the quality of the beneficiaries of your products.
• There is a tool to measure the level of satisfaction of other related sectors with you.
• There is a public relations device that is capable of measuring and improving your image to the outside world.
The results of the previous table that were reached by comparing the arithmetic mean of each variable (phrase) with
the arithmetic mean of the measure as a whole (3); show the acceptance of the effect of strong variables only, and
they are the use of tools to measure beneficiaries and client satisfaction of the company's products, as well as having
an effective device to study the complaints of the beneficiaries from the products in most the dairy industry
companies Jordan, and to reassure the validity of the previous results, the Step Wise method was used to determine
the most influential independent variables on the dependent variable, and Table 5 indicates the results of this method.
Table 5: Analysis of variance using the Step Wise method
Model Variable B T Sig. F Siq.
1 (Constant) 3.729 9.725 0.000 18.14 0.000
the use of tools to measure
beneficiaries and client
satisfaction of the company's
products
1.160 5.162 0.002
2 (Constant) 2.941 3.441 0.000 10.989 0.002
the use of tools to measure
beneficiaries and client
satisfaction of the company's
products
4.185 3.306 0.001
having an effective device to
study the complaints of the
beneficiaries from the
products
0.756 4.255 0.057
The Step Wise gradient analysis arrange the most significant independent variables and separates the least influential
variables on the dependent variable, therefore, the initial analysis ruled out the 9 variables (phrases), and then
analysis organize the independent variables that have been accepted according to their impact. Model 2 show the
acceptance of the impact of variables using tools to measure beneficiaries and client satisfaction from the company's
products, and the presence of an effective device to study the complaints of the beneficiaries of the products in most
dairy industry companies in Jordan, which interpreted about 17% of the variance in improving the marketing
performance, and in Model 1, the analysis showed that the variable of tools to measure beneficiaries and client
satisfaction from the company's products, is the most significant variable in influencing the dependent variable, as it
alone, has managed to explain 12% of the variance in the dependent variable. The estimated coefficients also show a
positive statistical relationship between the two used indicators and between improving the marketing performance
of the dairy industry companies in Jordan, and this relationship tended to favor larger companies.
And The W.L (Wilks Lambada) value demonstrate that the deleted independent variables of the model explained
22%; which gives the variables that are statistically acceptable a high explanatory power of the variable in the model.

European Journal of Business and Management www.iiste.org
ISSN 2222-1905 (Paper) ISSN 2222-2839 (Online)
Vol.5, No.6, 2013
158
Depending on the results of the analysis of variance F, it was found that the calculated significance level was 0.003,
which is less than the significance level of the test as a whole 0.005, and this means the rejection of the first text of
hypothesis which sees that there is no statistically significant relationship between the application of the standard of
stakeholders and beneficiaries and the marketing performance of dairy industry companies in Jordan, and therefore
an alternative hypothesis was accepted, which recognizes the existence of such a relationship.
Table 6: Model Summary
Model R Adjusted R
Square
Std. Error of the
Estimate
Durbin-Watson
1 0.425 0.095 1.325
2 0.596 0.136 1.587 1.672
Test of
Function
Wilks' Lambda Chi-square df Sig.
1 0.78 6.409 10 0.002
Ho2: There is no statistically significant relationship between the application of the standard of internal processes
and procedures and the marketing performance of the dairy industry companies in Jordan.
The results of Table 7 show the acceptance of the impact of a single phrase of all phrases contained in the second
hypothesis that crosses the axis of internal operations, namely: a tool to measure processes with high added value,
and that result was reached by comparing the arithmetic mean of these variables with the arithmetic mean of the
scale
As stated previously, the Step Wise method has excluded the effects of variables that are not affecting the dependent
variable, where it was found from the analysis that all phrases contained in Table 7 are not significant from a
statistical point, and cannot be considered effective in improving the marketing performance, therefore the analysis
was repeated using Enter method, which also gave a weak statistical significance for the independent variables in
terms of their impact on the dependent variable (marketing performance), and the results in both methods were
compatible, where they showed that the internal processes in dairy industry companies do not explain more than 1%
of the variance in the dependent variable.

European Journal of Business and Management www.iiste.org
ISSN 2222-1905 (Paper) ISSN 2222-2839 (Online)
Vol.5, No.6, 2013
159
Table 7: Descriptive statistics of the axis of internal processes and procedures
Phrase
Mean
S.D
Decision
B
T
Tool used to measure
processes with high added
value
3.544
0.706
Strong
3.781
3.499
F= 1.465
Siq. = 0.224
r=0.110
R-2
= 0.014
D-W = 1.943
Chi2 = 3.432
W.L= 0.131
The use of a quality system
for procedures and processes
that take place within your
company.
2.454 0.901 Average 9.448E-02 1.575
Use of procedures that
separate you from the rest of
other organizations.
2.112
0.990
Weak
-0.148 -0.781
Tools to measure the
percentage of transactions
that are scheduled for certain
periods of time.
2.455
0.753
Average
9.587E-02 0.829
Measuring the proportion of
time it takes to do certain
procedures.
2.107
0.771
Weak
-0.124 -0.860
Error rate calculation to total
transactions.
1.542
0.998
Weak
1.997E-02 1.826
Tool is used to measure the
quality of procedural steps at
work
2.483 0.957 Average -0.207 -0.863
Tool is used to measure the
quality of operational steps at
work
2.348 0.640 Average 0.240
Tool is used to develop
internal processes in your
company
2.145 0.965 Weak 0.159 0.499
The analysis also suggests that the variables included in the model do not suffer from the problem of Auto
Correlation, and that result is achieved through the value of the coefficient D-W which amounted to about 1.9,
however, the value of W.L found that the other deleted variables from the model explain what accounted for 78%,
which gives the independent variables that are statistically acceptable a weak ability in the marketing performance
for the dairy industry companies in the Kingdom.
The results of the variance analysis F compatible with the above as well, where the calculated value of significance
European Journal of Business and Management www.iiste.org
ISSN 2222-1905 (Paper) ISSN 2222-2839 (Online)
Vol.5, No.6, 2013
160
was 1.465 and thus it's greater than the significance level of the test as a whole of 5%, and therefore, the second
nihilist hypothesis can be accepted, which sees that there is no statistically significant relationship between the
application of the standard of internal processes and procedures and the marketing performance of the dairy industry
companies in Jordan, and the same result can be achieved by the value of chi square test, which amounted to 3.432.
Ho3: There is no statistically significant relationship between the application of the standard of education and
development and innovation of human resources and the marketing performance of the dairy industry companies in
Jordan.
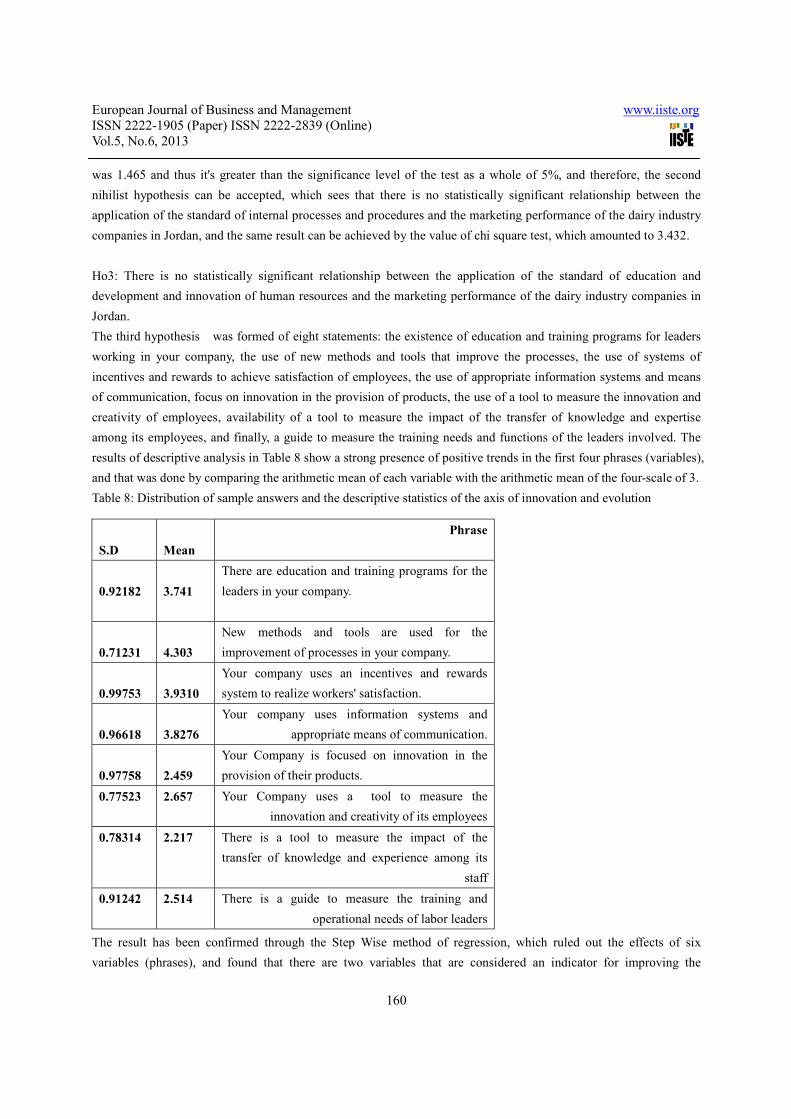
The third hypothesis was formed of eight statements: the existence of education and training programs for leaders
working in your company, the use of new methods and tools that improve the processes, the use of systems of
incentives and rewards to achieve satisfaction of employees, the use of appropriate information systems and means
of communication, focus on innovation in the provision of products, the use of a tool to measure the innovation and
creativity of employees, availability of a tool to measure the impact of the transfer of knowledge and expertise
among its employees, and finally, a guide to measure the training needs and functions of the leaders involved. The
results of descriptive analysis in Table 8 show a strong presence of positive trends in the first four phrases (variables),
and that was done by comparing the arithmetic mean of each variable with the arithmetic mean of the four-scale of 3.
Table 8: Distribution of sample answers and the descriptive statistics of the axis of innovation and evolution
The result has been confirmed through the Step Wise method of regression, which ruled out the effects of six
variables (phrases), and found that there are two variables that are considered an indicator for improving the
Phrase
Mean
S.D
There are education and training programs for the
leaders in your company.
3.741
0.92182
New methods and tools are used for the
improvement of processes in your company.
4.303
0.71231
Your company uses an incentives and rewards
system to realize workers' satisfaction.
3.9310
0.99753
Your company uses information systems and
appropriate means of communication.
3.8276
0.96618
Your Company is focused on innovation in the
provision of their products.
2.459
0.97758
Your Company uses a tool to measure the
innovation and creativity of its employees
2.657 0.77523
There is a tool to measure the impact of the
transfer of knowledge and experience among its
staff
2.217 0.78314
There is a guide to measure the training and
operational needs of labor leaders
2.514 0.91242

European Journal of Business and Management www.iiste.org
ISSN 2222-1905 (Paper) ISSN 2222-2839 (Online)
Vol.5, No.6, 2013
161
marketing performance; namely the existence of education and training programs for leaders working in your
company, and the use of systems of incentives and rewards to achieve satisfaction of employees, and those two
variables were able explain about 14% of the variation that occurs in the dependent variable, and in spite of the
relatively low explanatory power of the two, they are considered an indicator of improving marketing performance.
It was shown that the independent variables included in the model do not suffer from the problem of autocorrelation,
and that result is achieved by the value of the D-W test, and the value of W.L indicates that other variables deleted
from the model explain 56.5%, which is what gives the independent variables a statistically accepted ability for the
explanation of the dependent variable in the model by a percentage of 43.5%.
As it turns out, the results of the analysis of variance by the value of the F-test and by comparing the calculated
significance level of 0.002 with the significance level of the test as a whole 0.005, means rejecting the nihilist
hypothesis, which sees that there is no statistically significant relationship between the application of the standard of
education and development and innovation of human resources and marketing performance of companies dairy
industry calculated in Jordan , and therefore, this means accepting the alternative hypothesis that recognize this
relationship.
Table 9: Analysis of variance and model coefficients and its statistical indicators
B T Sig. Statistical Indicators
(Constant) 6.011 7.047 0.000 F= 9.216 Siq. =0.002
r=0.548 R-2
= 0.267
D-W = 1.841
Chi2 = 9.106
W.L= 0.435
The presence of education
and training programs for
labor leaders
0.404 2.686 0.009
The use of incentives and
reward systems to realize
employee satisfaction
Ho4: There is no statistically significant relationship between the application of the standard of investment and
financial returns and the marketing performance of the dairy industry companies in Jordan.

European Journal of Business and Management www.iiste.org
ISSN 2222-1905 (Paper) ISSN 2222-2839 (Online)
Vol.5, No.6, 2013
162
Table 10: Descriptive statistics for the financial axis
Phrase Mean S.D B
T Sig. Statistical
Indicators
There is a tool to measure the
percentage of financial waste
4.32 0.569 2.661 2.777 0.007 F= 5.732
Siq. = 0.004
r=0.567
R-2
= 0.113
D-W = 1.723
Chi2 = 7.179
W.L= 0.889
There are tools to measure the rate of
returns on investment
3.85 0.645 4.035 -0.157 0.005
There is a tool for measuring the rate of
growth in revenue.
3.6 0.810 7.163 0.338 0.006
There is a tool for setting goals and
financial needs
4.37 0.773 8.986 0.278 0.033
There are financial measures used by
senior management
4.769 0.861 0.359 1.567 0.021
There are short and long term financial
plans
3.37 0.983 0.194 0.628 0.031
There is the process of monitoring the
needs of the new financial year
4.76 0.866 0.156 2.66 0.034
There are modern methods in the use of
financial budgets
3.52 0.678 2.661 2.777 0.007
There are tools to measure the
feasibility of new investments
4.75 0.775 .035 -0.157 0.005
There are criteria to annually review
the financial performance
3.34 0.456 7.03 0.338 0.036
The results in Table 10 show the acceptance of all the independent variables included in the fourth hypothesis, and
that result was achieved by by comparing the arithmetic mean of each variable with the arithmetic mean of the scale
of this trio hypothesis of 3. To confirm the result, all the variables were entered using the Step Wise method, which,
as we said earlier, it precludes all independent variables that have no impact, where it was found, according to the
Step Wise method, that all the variables listed in Table No. 9 are statistically moral, and through this method,
strong statistical indicators were obtained, which show the importance of the financial axis's impact on the marketing
performance of companies in Jordan, and these variables combined have explained more than 88% of the variance
in the dependent variable.
The W.L value indicates that the other deleted variables from the model explain what accounted for 11.1%, which
gives the statistically acceptable independent variables a very strong ability to explain the dependent variable in the
model (marketing performance). The results of the analysis of variance show that the calculated significance level of
the test F is (0.004) which is less than the significance level of the test as a whole (0.05), therefore, it rejects the text
of the fourth nihilist hypothesis, which sees that there is no statistically significant relationship between the
application of the standard of investment and financial returns and the marketing performance of the dairy industry
companies in Jordan.
Ho5: There is no statistically significant differences in the marketing performance of the dairy industry companies in

European Journal of Business and Management www.iiste.org
ISSN 2222-1905 (Paper) ISSN 2222-2839 (Online)
Vol.5, No.6, 2013
163
accordance with the variation of the market share and volume gains.
Table 11: Results of descriptive statistics for demographic variables
Property Arithmetic mean of the
sample
Standard Deviation Arithmetic mean for
the year
Company size 3.73 0.4461 2.5
Size of profits 3.21 0.094 2.5
The results of the descriptive statistics in the previous Table show positive trends (acceptance) from the sample
study's answers on the impact of personal characteristics on the marketing performance of dairy industry companies
in Jordan, where there was acceptance on the impact of marketing performance on company size and profit rate for
companies that have been studied according to the comparison of the Arithmetic mean on each description with the
arithmetic mean of the year.
Table 12: Analysis of the variance of personal variables with the dependent variable (marketing performance).
Property F Test Significance level
Company size 5.658 0.06
Size of profits 4.448 0.013
• The significance level of the test as a whole is 5%
To test the fifth hypothesis, the ANOVA analysis of variance or the so-called F test was used, and the previous Table
shows the results of this test, where it was found that the calculated level of significance for the variables of company
size and the size of profits was less than the significance level of the test 5%, and therefore, the text of the nihilist
hypothesis was rejected, which sees that there is no statistically significant differences in the marketing performance
for the dairy industry companies according to the market share and the volume of the profits; the existence of such a
relationship was accepted.
7. Discussion of results and recommendations:
7.1Results:
A. The most important indicators were found, which relate to the axis of the beneficiaries and stakeholders, which
recorded a strong level of significance, and they were able to explain 7% of the variance in marketing performance
for the dairy industry companies in Jordan:
• Using tools to measure beneficiaries and client satisfaction of the company's products
• An effective device to examine the complaints of beneficiaries from the products in most companies.
B. It was found that there were no variables that are statistically acceptable within the axis of the internal processes
and cannot be considered influential on the marketing performance of the dairy industry companies in Jordan.
Therefore, the nihilist hypothesis was rejected, which sees that there is no statistically significant relationship
between the application of the standard of internal processes and procedures and the marketing performance of the
dairy industry companies in Jordan.
C. It was found that there are two variables that are acceptable from a statistical point of view within the axis of
learning and development and innovation of human resources, and they have a strong influence on the marketing
performance of the dairy industry companies in Jordan, namely: the presence of education and training programs for

European Journal of Business and Management www.iiste.org
ISSN 2222-1905 (Paper) ISSN 2222-2839 (Online)
Vol.5, No.6, 2013
164
leaders working in the companies, the use of incentive and reward systems to achieve satisfaction of employees in
the dairy industry companies in Jordan, and the two were able to explain about 14% of the variation that occurs in
the dependent variable.
D. It was found that all the variables in the financial axis are statistically acceptable and influential on the marketing
performance of dairy industry companies in Jordan, and these variables combined have explained more than 88% of
the variance in the dependent variable, and these variables are arranged according to their relative importance as
follows:
- There are financial measures used by senior management with an arithmetic mean of 4.769.
- There is a monitoring process to the needs of the new fiscal year with an arithmetic mean of 4.76
- There are tools to measure the feasibility of new investments, arithmetic mean = 4.75.
- There is a tool for setting goals and financial needs, arithmetic mean = 4.37.
- There is a tool to measure the proportion of financial waste, arithmetic mean = 4.32.
- There are tools to measure the rate of return on investments, arithmetic mean = 3.85.
- There is a tool to measure the rate of growth in revenues, arithmetic mean = 3.6.
- There are modern methods in the use of financial budgets, arithmetic mean = 3.52.
- There are short and long-term financial plans, arithmetic mean = 3.37.
- There are criteria to review the financial performance annually, arithmetic mean of 3.34.
E. It was found that there were statistically significant differences in the marketing performance of the dairy industry
companies in Jordan (market share), according to the various sizes of the company and the sizes of the profits.
7.2 Recommendations:
In light of the previous findings, a set of recommendations was formulated:
- Activating complaints and suggestions boxes, and use them to identify the needs and desires of customers, based on
the concept of modern marketing.
- Attention to the concept of customer relationship management to build strong and profitable relationships with
customers and beneficiaries and stakeholders in the dairy industry companies in Jordan.
- For quality improvement and cost reduction, work on the introduction of the concept of information technology in
the financial and administrative systems in the dairy industry companies in Jordan is necessary.
- Provide evidence for the classification of the level of the current relationship with the beneficiaries of the services
provided by the dairy industry companies in Jordan.
- Attention to the concept of creativity in the design elements of the marketing mix for the dairy industry companies
in Jordan.
- Work constantly on providing criteria to measure the satisfaction of employees for the business climate, measure
innovation and creativity among employees, and distinctive capabilities and skills among workers in the dairy
industry companies Jordan.
Bibliography:
Arabic references
1.Abu Sheikha Nader Ahmad( 1982) productivity and methods of improve it in public institutions , Arabic countries
university, Arab organization for administrative sciences. Amman
2.Shebli, Muslim (2005) , Utilization of balanced score card in commercial banks strategy direction, A’fak journal
No. 26 . 3, Dubai

European Journal of Business and Management www.iiste.org
ISSN 2222-1905 (Paper) ISSN 2222-2839 (Online)
Vol.5, No.6, 2013
165
3.Zreikat, Majdi Isa( 2008), Balanced Performance card in Jordan industries, Arab organization for administrative
sciences, Kuwait University, No. 15, 3, Kuwait
4.Al Kahtani, Mubarak & Al Nsor Iyad,(2010) Performance Measurement of Governmental organizations in
Jordan, A’fak journal, No. 117, Dubai
5.Al Karni, Ali (2009), Balanced score card measurements
6.Al Najjar, Imad (2008) , Measurement tools and Governmental institutions
7.Youssef, Muhammad,( 2005) , Strategic dimension for balanced score card assessment, Cairo
English References:
1-Bank, John (2000) The Essence of Total Quality Management 2nd. Edition Pearson Education Limited, Edinburgh
Gate, Harlow.
2-Certo, Samuel et al (1995), The Strategic Management Process, 3rd Edition, Austen Press, Irwin, Chicago.
3-David - Fred, R (1993), Concepts of Strategic Management, 4th edition, Macmillan Publishing Company, New
York.
4-Grant. R (1999) Contemporary Strategy Analysis, 4th Edition, Blackwell 2002, Management, J. Naylor, Financial
Times.
5-Harrington, H. James (1995), Total Improvement Management: The next Generation in Performance Improvement.
Mc Grow-Hill, Inc. New York.
6-Loh, Michael. (1997), Rc-Engineering at Works, Second Edition, Gower Publishing Limited, Hampshire, England.
Scientific journals:
1-Bulter, A et al (1997), Linking The Balanced Scorecard To Strategy, Long Range Planning, Vol 30, No.2.
2-Kaplan, R & Norton, AP (1996), The Balanced Scorecard Measures That Drive Performance, HBR. Jan - Feb.
3-Kaplan. R & Norton, D (January - February, 1996), Using the Balanced Scorecard as a Strategic Management
System,, Harvard Business Review.
4-Rousseau, Y & Rousseay, P (2000), Turning Strategy Into Action In Financial Services, CMA, Management
December & January.
5-Vander Zee JTM & DEJong (1999), Alignment is not Enough: Integrating Business & Information Technology
Management With The Balanced Score, Journal of Management Information Systems, Vol. 16, No.2
6-yeh, Carol, & Lin yun (Dec 1998), The Essence of Empowerment: A Conceptual Model and Case Illustration,
"Journal of Applied Management Studies; volume 7, Issue 2; Abingdon
This academic article was published by The International Institute for Science,
Technology and Education (IISTE). The IISTE is a pioneer in the Open Access
Publishing service based in the U.S. and Europe. The aim of the institute is
Accelerating Global Knowledge Sharing.
More information about the publisher can be found in the IISTE’s homepage:
http://www.iiste.org
CALL FOR PAPERS
The IISTE is currently hosting more than 30 peer-reviewed academic journals and
collaborating with academic institutions around the world. There’s no deadline for
submission. Prospective authors of IISTE journals can find the submission
instruction on the following page: http://www.iiste.org/Journals/
The IISTE editorial team promises to the review and publish all the qualified
submissions in a fast manner. All the journals articles are available online to the
readers all over the world without financial, legal, or technical barriers other than
those inseparable from gaining access to the internet itself. Printed version of the
journals is also available upon request of readers and authors.
IISTE Knowledge Sharing Partners
EBSCO, Index Copernicus, Ulrich's Periodicals Directory, JournalTOCS, PKP Open
Archives Harvester, Bielefeld Academic Search Engine, Elektronische
Zeitschriftenbibliothek EZB, Open J-Gate, OCLC WorldCat, Universe Digtial
Library , NewJour, Google Scholar