Accidental Vapor Phase Explosions on Transportation Routes Near Nuclear Power Plants
Upload
truongdangCategory
view
215download
2
Instructions for use
Title The role of atmospheric nuclear explosions on the stagnation of global warming in the mid 20th century
Author(s) Fujii, Yoshiaki
Citation Journal of Atmospheric and Solar-Terrestrial Physics, 73(5-6): 643-652
Issue Date 2011
Doc URL http://hdl.handle.net/2115/44918
Type article (author version)
Additional Information There are other files related to this item in HUSCAP. Check the above URL.
File Information FujiiTexAuthorVersion.pdf (本文)
Hokkaido University Collection of Scholarly and Academic Papers : HUSCAP

1
The Role of Atmospheric Nuclear Explosions on the Stagnation of Global Warming in the
Mid 20th Century
Yoshiaki Fujii (Prof., Ph. D.)
Rock Mechanics Laboratory, Hokkaido University, N13W8, Sapporo, 060-8628, Japan
http://rock.eng.hokudai.ac.jp/fujii/

2
ABSTRACT
This study suggests that the cause of the stagnation in global warming in the mid 20th century
was the atmospheric nuclear explosions detonated between 1945 and 1980. The estimated
GST drop due to fine dust from the actual atmospheric nuclear explosions based on the
published simulation results by other researchers (a single column model and
Atmosphere-Ocean General Circulation Model) has served to explain the stagnation in global
warming. Atmospheric nuclear explosions can be regarded as full-scale in situ tests for
nuclear winter. The non-negligible amount of GST drop from the actual atmospheric
explosions suggests that nuclear winter is not just a theory but has actually occurred, albeit
on a small scale. The accuracy of the simulations of GST by IPCC would also be improved
significantly by introducing the influence of fine dust from the actual atmospheric nuclear
explosions into their climate models; thus, global warming behavior could be more accurately
predicted.
Keywords: Atmospheric nuclear explosions; Global-mean surface temperature, Global
warming

3
1. Introduction
The global mean surface temperature (GST) has been rising for more than one hundred years
(Fig. 1, the black line). This is, of course, the phenomenon known today as global warming.
The rise in GST seems to begin in 1917 although the radiative forcing due to greenhouse
gasses (GHG) continues to increase at least from 1880 (Fig. 5 in Hansen et al., 2007). The
absence of warming prior to 1917 may be explained by the negative radiative forcing of
stratospheric aerosols due to large eruptions as those of Krakatau (1883) (Winchester, 2003),
Santa Maria (1902) and Novarupta (1912), all with a VEI (volcanic explosivity index) rating
of 6, and by the relatively inactive sun around 1900 (Fig. 1).
The rise in GST appears to have stagnated in the mid 20th century (Fig. 1, the black line),
despite the fact that the atmospheric concentration of CO2 (e.g. Fig. 2.3 in Topic 2, IPCC,
2007, p. 4) or, more directly, the radiative forcing by all GHG (Fig. 5 in Hansen et al., 2007)
continued to increase. This stagnation cannot be explained by reduced solar activity because
the sun was very active between 1954 and 1965 (Fig. 1). During the stagnation period, there
were the eruptions of Bezymianny in 1956 and Mt. Agung in 1963, both with VEI ratings of 5
(note that VEI is a logarithmic scale). These may have contributed to the stagnation, however,
they are unlikely to have been the main cause because the both eruptions occurred after the
stagnation began and their VEIs were smaller than the three giant eruptions around 1900.
The stagnation in global warming in the mid 20th century has not been simulated well even
by the most advanced climate models (e.g. Hansen et al., 2007) which considered various
additional effects of radiative forcing beyond insolation and volcanic activities. The objective
of this paper is not to precisely simulate GST while considering new details of radiative
forcing but to suggest the possibility that the atmospheric nuclear explosions known as the
Trinity test, Little Boy, Fat Man and the subsequent nuclear weapons tests caused the
stagnation in global warming.

4
Statistics concerning the atmospheric nuclear explosions and previous research on the effects
of atmospheric nuclear explosions on global climate are described in section 2. The possible
causes of the stagnation in global warming are discussed in section 3. An estimation of the
decline in GST produced due to the actual atmospheric nuclear explosions is attempted in
section 4 based on the simulation results of other researchers. A method to mitigate global
warming by injecting fine limestone powder into the lower stratosphere as an application of
the GST drop caused by atmospheric nuclear explosions is proposed in section 5. Concluding
remarks are given in section 6.
2. Background
Atmospheric nuclear explosions began with the Trinity test in 1945. The explosions of Little
Boy at Hiroshima and Fat Man at Nagasaki followed in the same year. The total yield of the
441 atmospheric nuclear explosions before the PTBT (Partial Test Ban Treaty) in 1963
prohibited atmospheric nuclear weapons tests reached 409 MT (Table 1 in UNSCEAR, 2000,
pp. 195-204). Most nuclear weapons tests were moved underground after the PTBT. However,
China began testing, and France continued testing, after the PTBT. Sixty-three atmospheric
tests with 31 MT total yield were carried out by both countries after the PTBT. The last bomb
being detonated in the atmosphere at Lop Nor by China in 1980. The total yield of the 504
atmospheric nuclear explosions between 1945 and 1980 was 440 MT.
Arakawa (1954) may have been the first who pointed to the possible relationship between
climate change and the nuclear weapons tests. He suggested the possibility that the severely
cold summer in 1954 in northern Japan was due to the hydrogen bomb tests by the United
States over the Bikini Atoll between February and May of that year (p. 132 of Arakawa, 1954).
Arakawa also pointed out the possibility that the haze at a higher altitude may have been
5
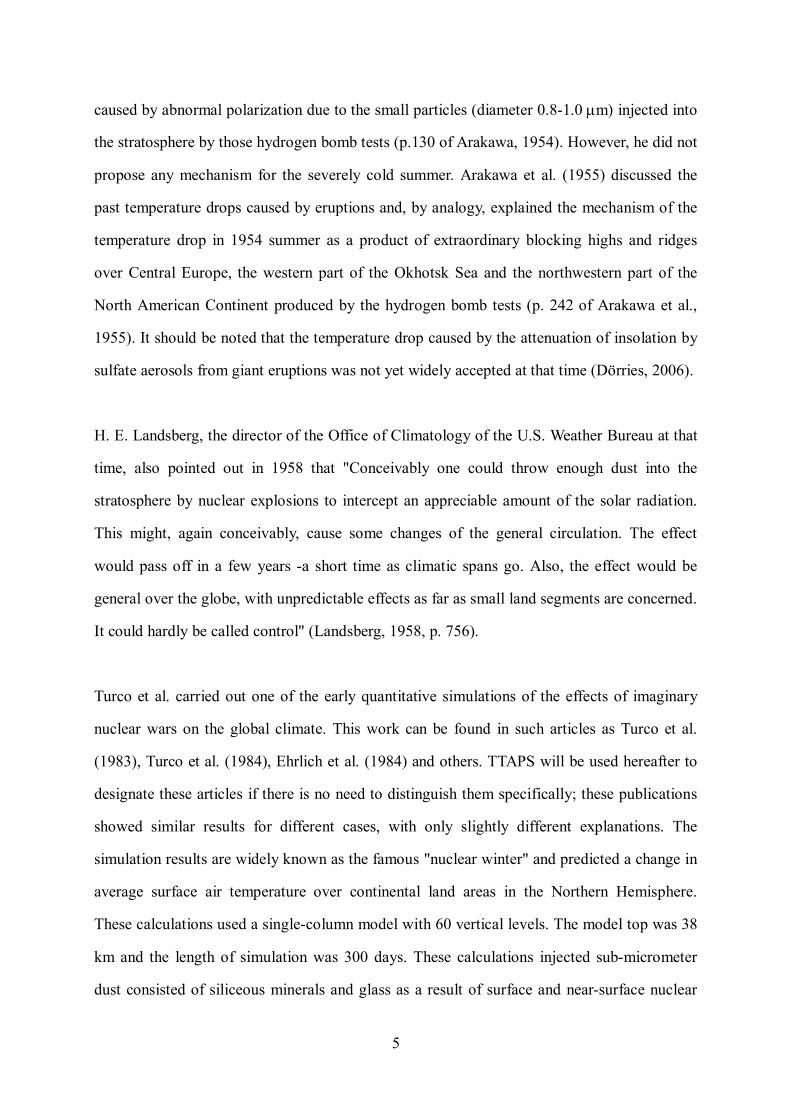
caused by abnormal polarization due to the small particles (diameter 0.8-1.0 m) injected into
the stratosphere by those hydrogen bomb tests (p.130 of Arakawa, 1954). However, he did not
propose any mechanism for the severely cold summer. Arakawa et al. (1955) discussed the
past temperature drops caused by eruptions and, by analogy, explained the mechanism of the
temperature drop in 1954 summer as a product of extraordinary blocking highs and ridges
over Central Europe, the western part of the Okhotsk Sea and the northwestern part of the
North American Continent produced by the hydrogen bomb tests (p. 242 of Arakawa et al.,
1955). It should be noted that the temperature drop caused by the attenuation of insolation by
sulfate aerosols from giant eruptions was not yet widely accepted at that time (Dörries, 2006).
H. E. Landsberg, the director of the Office of Climatology of the U.S. Weather Bureau at that
time, also pointed out in 1958 that "Conceivably one could throw enough dust into the
stratosphere by nuclear explosions to intercept an appreciable amount of the solar radiation.
This might, again conceivably, cause some changes of the general circulation. The effect
would pass off in a few years -a short time as climatic spans go. Also, the effect would be
general over the globe, with unpredictable effects as far as small land segments are concerned.
It could hardly be called control" (Landsberg, 1958, p. 756).
Turco et al. carried out one of the early quantitative simulations of the effects of imaginary
nuclear wars on the global climate. This work can be found in such articles as Turco et al.
(1983), Turco et al. (1984), Ehrlich et al. (1984) and others. TTAPS will be used hereafter to
designate these articles if there is no need to distinguish them specifically; these publications
showed similar results for different cases, with only slightly different explanations. The
simulation results are widely known as the famous "nuclear winter" and predicted a change in
average surface air temperature over continental land areas in the Northern Hemisphere.
These calculations used a single-column model with 60 vertical levels. The model top was 38
km and the length of simulation was 300 days. These calculations injected sub-micrometer
dust consisted of siliceous minerals and glass as a result of surface and near-surface nuclear

6
explosions into the stratosphere and, to a lesser degree, the troposphere. Size of the dust was
assumed to be log-normal distribution with mode radius rm of 0.25 m and = 2 with a
power-law tails at large sizes of r-0.4 where r is the radius. The log-normal and power-law
distributions were connected at a radius of 1 m. Index of refraction at visible wavelengths
was assumed to be 1.50 0.001i. They also injected sub-micrometer smoke into the
troposphere to simulate the city and wild fires that would result from atmospheric nuclear
explosions. Size distribution and index of refraction were assumed to be rm = 0.1 ( m) for
urban fires and 0.05 m for wildfires both with = 2, and 1.75 0.30i, respectively. Details on
explosion altitude was not given in their references but surface burst percentage was assumed
to be between 0 and 100% depending on the scenarios. The simulated temperature drop in
Turco et al. (1983) resulting from the 65 Mt sub-micrometer dust produced by a 3,000-MT
"general counterforce attack", not accounting for the sub-micrometer smoke, was 7K (case 11
in Fig. 1, p. 1286 in Turco et al., 1983) and lasted for more than 300 days (the full length of
the simulation). On the other hand, the temperature drop for just a 100-MT "city attack",
without sub-micrometer dust but with 150 Mt sub-micrometer smoke, was, remarkably, 32K
and lasted for the rather short duration of only 100 days (case 14 in Fig. 1, p. 1286 in Turco et
al., 1983).
The mechanism of the surface air temperature drop from nuclear war, which is not the same
but similar to that activated by giant eruptions, is explained as follows. In atmospheric nuclear
explosions at or near the ground, earth, dust, and other debris from the earth's surface are
taken up into the fireball, then condensed onto particles of appreciable size. These
contaminated particles range in diameter from less than 1 m to several millimeters (section
9.50 in Glasstone & Dalan, 1977). The sub-micrometer dust contained in the contaminated
particles is called "fine dust" in the remainder of this paper. The top and bottom heights HT
and HB (km) of the nuclear cloud produced by the surface explosion from a nuclear bomb
with yield M (MT) are represented by the following equations (Turco et al. 1983), resulting in
the fact that most fine dust is injected to the stratosphere for nuclear bombs whose yield is

7
more than 1 MT (Fig. 2).
2.0T 23MH (1)
2.0B 13MH (2)
The ratio of fine dust amount injected to the stratosphere, of course, also depends on the
height of the tropopause, and also on the altitude of the detonations. Flammable materials are
ignited by the nuclear fireball (Turco et al., 1983, p. 1284). Many of these fires would be
promptly snuffed out by the passage of the spherical blast wave, but a large number of second
fires would be started (Turco et al., 1984, p. 25). The fires generate smoke which contains
sub-micrometer fractions (later called "soot" for convenience). The fine dust and soot reduce
insolation and cause the surface air temperature drop.
The contributions of such surface and near surface bursts on the sea used mainly by France
(Mururoa etc.) and the US (Bikini etc.) for the GST drop would be much less than those of
surface and near-surface bursts on land because the particles entering the atmosphere from sea
water surface consist mainly of sea salts and water drops (section 9.53 in Glasstone & Dalan,
1977). The particles from explosions at such high altitude (> 50 km) for anti-ballistic missiles
and anti-satellite weapons as the US (Johnston Island etc.) and the Soviet Union (Kapustin
Yar) consist only of radioactive residue of the weapon and the deployment rocket, with
particle diameters ranging from 0.01 to 20 m (section 9.48 in Glasstone & Dalan, 1977).
These residues may significantly affect the global circuit (Markson, 2007) but may not cause
large GST drop by reducing insolation. For example, Starfish Prime with 1.4 MT nuclear
yield which exploded at 400 km above the Pacific Ocean in July 9, 1962 was launched by
Thor missile which weighed 49.6 t at launch. The Starfish Prime itself should not be heavier
than several tons. On the other hand, the surface explosion of a nuclear bomb with 1.4 MT
nuclear yield will be assumed to cause fine dust of 26000 t as later described in section 4. The
mass of the missile and the nuclear bomb is not negligible and further investigation is
required but much smaller than the mass of fine dust by surface and near-surface nuclear
explosions.

8
In the case of nuclear weapons tests, fires are not expected to occur, and soot is not usually
generated. The fine dust from atmospheric nuclear weapon tests within the troposphere soon
falls to the ground within a one month half-removal time (UNSCEAR, 2000, p. 162, Fig. III).
On the other hand, the fine dust that reaches a height near the tropopause rapidly spreads with
the jet streams, although mainly in the same hemisphere. The fine dust that reaches the
stratosphere stays there for months to years (UNSCEAR, 2000, p. 162, Fig. III), with a
half-removal time ranging from 3 months (from the lower polar stratosphere to the
troposphere) to 3.5 years (from the upper equatorial stratosphere to the troposphere). For
nuclear wars, the soot is generated and may behave in a similar way to fine dust. The largest
difference between the volcanic eruptions and the atmospheric nuclear explosions in the
global cooling context is that the main attenuation material of insolation for the eruptions is
sulfate aerosol; for atmospheric nuclear explosions, the main materials of attenuation are the
fine dust and soot.
TTAPS ignored the influence of the actual atmospheric nuclear explosions on global climate
and mentioned only imaginary nuclear wars. However, the results for scenarios F and G on p.
28 of Turco et al. (1984) are for fine dust without soot. These results, therefore, can be
regarded as an effective simulation of an atmospheric nuclear weapons test. This is why
scenarios F and G of Turco et al. (1984) were used for scaling as shown below, although these
results could be regarded as tentative conclusions (p. 119 of Dörries, 2006). Many studies of
nuclear winter were carried out after TTAPS, as summarized by Robock et al. (2007), but
none of these mentioned the influence of the actual atmospheric nuclear explosions on the
global climate.
Kondratyev (1988) pointed out the possibility that NO2 produced by nuclear fireballs in the
hydrogen bomb tests in 1958, 1961 and 1962 by the Soviet Union affected the global climate.
This finding should not be ignored; however, it is rather difficult to verify these findings

9
because most of the references in the book by Kondratyev (1988) are inaccessible.
Hishida (2001 in Japanese) has also pointed out the possibility of the influence of atmospheric
nuclear explosions on the global climate. He examined the bombings in World War II in
Europe as well as the atmospheric nuclear explosions afterward and stated that fine dust and
soot from these events may be the main causes of the regime shift in GST and SST (surface
sea temperature) between 1940 and 1975. However, he did not carry out any quantitative
calculation of the temperature change produced by the fine dust and soot from the bombings
or by the atmospheric nuclear explosions.
Robock et al. (2007) represents the most recent study on nuclear winter. These authors used
an AOGCM (Atmosphere-Ocean General Circulation Model) with a horizontal resolution of
4 5 and with 23 vertical levels. The model top was 80 km and the length of simulation
was 10 years with 8 runs. They put 5 Mt, 50 Mt and 150 Mt of black carbon into the upper
troposphere as typical mixture of black soot that would result from nuclear war. A total of 150
Mt of black carbon corresponds to a 5000-MT-yield nuclear war. For 50 Mt and 150 Mt cases,
the black carbon had mass extinction coefficient of 5.5 m2/g, single scattering albedo of 0.64
and mass absorption coefficient of 2.0 m2/g. They injected the black carbon into the upper
troposphere (300-150 mbar) over a one-week period starting on 15 May spread over all grid
boxes over the 48 United States and over Russia. For 5 Mt case, the black carbon had mass
extinction coefficient of 9.0 m2/g, single scattering albedo of 0.31 and mass absorption
coefficient of 6.21 m2/g. They injected the black carbon into one model box at 30 N, 70 E
(Pakistan) in the upper troposphere (300-150 mbar) and the higher layers in lower latitudes
during a 1-day period. The maximum GST drops of the 5 Mt, 50 Mt and 150 Mt cases were
approximately 1.4K, 4.0K and 8.5K, respectively, and lasted more than the 10-year length of
the simulation. The results provided by Robock et al. (2007) will be used for the scaling of
Little Boy and Fat Man because Robock et al. (2007) used the latest AOGCM and their results
are more reliable for the case of an explosion with soot than TTAPS.

10
Thompson (2008, p.647) estimated GST drop by Little Boy and Fat Man to be less than 0.03K
based on Robock et al. (2007). He did not mention on effects by other atmospheric nuclear
explosions. Fujii (2010) suggested that the stagnation in global warming between 1945 and
1976 can be explained by the effects of the actual atmospheric nuclear explosions. He derived
simple equations representing relationship between nuclear yield and GST drop based on
TTAPS and Robock et al. (2007) for soot dominated case and fine dust dominated case. He
assumed that the slopes of the equations for fine dust and soot were the same without any
verification. He estimated GST drop by substituting not each explosions but total yield or
average annual yield without considering type of tests (surface, water, rocket, etc.), nuclear
cloud height or fireball size. The observed stagnation of 0.5K was within the estimated GST
drop range of 0.07K–0.8K. It should be said that his estimation on GST drop was very rough
and more detailed investigation is required.
3. Possible causes of stagnation in global warming in the mid 20th century
Thompson et al. (2008) suggested that changes in the methods used to measure SSTs, a shift
from engine room temperature measurements (US ships) to uninsulated bucket measurements
(UK ships), caused a 0.5-K SST drop and the SST drop resulted in 0.3-K GST drop since
1945. In the present study, an attempt was made to add 0.3K to the temperature data since
1945 as a correction for the changes in the measurement method (Fig. 1, the blue line). The
stagnation in global warming in the mid 20th century can still be observed although with a
smaller GST anomaly of shorter duration than in the original GST (Fig. 1, the black line).
Schlesinger & Ramankutty (1994) noted the rapid rise in GST between about 1908 and 1946,
and the subsequent reversal of this warming until about 1965 which did not appear in their
simulation considering greenhouse gases (GHG) and anthropogenic sulfate aerosols (ASA).

11
They concluded that the oscillation of surface temperature in the North Atlantic (AMO,
Atlantic Multidecadal Oscillation) and North American regions, which had a 65-70 year
period, dominated the GHG+ASA-induced warming, thereby obscuring the latter and
interfering with its detection. The AMO is, however, in this author's opinion, not the cause but
the effect of some radiative forcings. The cause is what should be looked for. Andronova &
Schlesinger (2000, p. 2138) called the stagnation in global warming "1944-1976, a period of
observed global cooling" and also suggested AMO as one of the possible causes.
Hansen et al. (2007) showed their simulation results concerning the GST for 1880–2003 with
the GISS modelE. They considered the radiative forcings of well-mixed greenhouse gases,
stratospheric H2O, ozone, land use, snow albedo, solar irradiance, stratospheric aerosols,
tropospheric aerosol direct effect and aerosol indirect effect. Their 5-run mean simulated GST
(Fig. 6 in their paper), however, does not show the stagnation in global warming in the mid
20th century but continues to increase until the 0.2-K GST drop due to the Mt. Agung
eruption in 1963 (with a VEI rating of 5). This account would indicate that the above radiative
forcings may not be the main cause of the stagnation in global warming. The prediction in
Hansen et al. (2007), however, seems fair for the period after the Mt. Agung eruption in 1963,
as shown in Fig. 6 in their paper, including a 0.2-K GST drop caused by the El Chichón
eruption in 1982 and a 0.3-K GST drop caused by Mt. Pinatubo in 1991, an eruption which
emitted 15–19 Mt SO2 aerosol (Ward, 2009, p. 3190) and induced a negative radiative forcing
of 2.7 W/m2 (Minnis et al., 1993, p. 1412).
Hansen et al. (2007) admitted that the peak warmth near 1940 (it was not "near 1940" but
clearly at 1944 in the original GST or at 1953 in the corrected GST, as shown in Fig. 1) was
not produced by their models. They stated that it might be fruitless to search for an additional
forcing to produce the peak warmth. Instead, they suggested natural oscillations and soot
blown to the Arctic from industrial activity at the outset of World War II as possible causes. It
was already stated above that AMO, one of the natural oscillations, was not the cause but

12
instead a result. For another example of the natural oscillations, ENSO (El Niño-Southern
Oscillation) may not be the main cause of the stagnation in global warming because the
stagnation can still be observed in SST from which the effect of ENSO was removed (Fig. 1
in p. 1959 of Compo & Sardeshmukh, 2010). It should be also pointed out that the effect of
soot from industrial activity at the outset of World War II is negligible because even the such
raids in the end of the World War II in 1945 as Dresden, Nuremberg, Tokyo, Essen, Nagoya,
Dortmund, Osaka, Hiroshima and Nagasaki, which should have generated much more soot
than the outset of World War II, on GST is estimated to be negligible in the next section.
As one of the attempts, the annual yield of the actual atmospheric nuclear explosions was
added to Fig. 1. The period of the atmospheric nuclear explosions almost coincides with the
period of the stagnation in global warming in the mid 20th century. Assuming that a linear
global warming trend from 1880 to 2009 (Fig. 1, the green broken line), the GST anomaly
(the difference between the broken blue and green lines in Fig. 1) is predicted as a function
with a GST drop of 0.2K (Fig. 3). This intuitive prediction may seem exaggerated; however, a
total yield of 440 MT, equivalent to the total yield of all atmospheric nuclear explosions, can
induce nuclear winter in the simulation provided by either TTAPS or Robock et al. (2007).
The actual atmospheric nuclear explosions should have influenced the global climate by a
mechanism similar to nuclear winter even though they were carried out over a period of 36
years and did not produce soot from cities (except for Little Boy and Fat Man, both in 1945).
However, GST anomaly is not simulated with climate models in this paper. Instead, in the
next section, GST drop produced by the fine dust and soot from the actual atmospheric
nuclear explosions is estimated based on the results of the above simulation results of TTAPS
and Robock et al. (2007).
There may be mechanisms for GST drop other than the simple mechanism of insolation
attenuation caused by fine dust and soot from atmospheric nuclear explosions acting as a
blocking highs and ridges suggested by Arakawa et al. (1955). However, the mechanism was

13
suggested to merely explain the local and temporary air temperature drop and there has been
no attempts were made to relate them to the stagnation of global warming. Kondratyev (1988)
has suggested a great contribution of NO2 from hydrogen bombs. The mechanism is not
denied but the mechanism of GST drop by attenuation of insolation by fine dust and soot
seems more widely accepted.
4. Estimation of GST drop by the fine dust and soot from the actual atmospheric nuclear
explosions
The following GST drop-time function (Fig. 4) was assumed to roughly approximate the GST
anomaly plots (Figure 2 in Robock et al., 2007),
t
tAT 2lnexpsinmax (3)
where T, Amax, t and t are GST anomaly (K), maximum GST drop (K), elapsed time (y) and
constant (y), respectively. This function shows a peak of GST drop, Amax, at t = t. GST drop
gradually decreases with time. T becomes Amax/2 at t = 2.59 t or e-folding time is 3.06 t.
The atmospheric nuclear tests did not generate soot from cities. There are no such results in
Robock et al. (2007). Scenarios F and G in the table on p. 28 of Turco et al. (1984) are the
only available models which produced GST drop plots due to the effects of only fine dust.
Scenario F/G is named "General counterforce attack"/"Hard-target counterforce attack" with
total yield of 3000/5000 MT, surface burst percentage of 70/100%, no urban or industrial
targets, yield of each warhead 1-10/5-10 MT, total number of explosions of 2150/700, no soot,
55/650 Mt fine dust with optical depth of 0.8/10.
The GST drop duration was approximately 3 months for soot-dominated cases (in which soot
was injected into the troposphere) and more than 10 months for fine dust-dominated cases (in
which fine dust was injected mainly into the stratosphere) for TTAPS. Soot was injected to the

14
upper troposphere, heated by absorption of shortwave radiation and lofted into the upper
stratosphere in Robock et al. (2007). GST drop duration was more than 10 years with
e-folding time of 4.6 years. One of the reasons for this difference is the climate model. TTAPS
used the single column model, and they showed only the average surface air temperature over
continental land areas in the Northern Hemisphere. This means that the model extent is
limited and the limited extent causes overestimation of peak GST drop and underestimation of
GST duration. On the other hand, Robock et al. (2007) used AOGCM and showed the GST
drop. The duration of the GST drop revealed by TTAPS may have been underestimated; the
duration of GST drop by Robock et al. (2007) seems to be more reliable.
Considering the ambiguity of the peak value and duration of GST drop in the results by
TTAPS, the direct approximation of GST drop plots by Eq. (3) was not carried out but CGD
(cumulative GST drop in Ky, Fig. 4) was defined as the integral of GST drop (K) with respect
to time (y) and was graphically measured for the simulated GST drop plots on p. 17 in Ehrlich
et al. (1984). The simulated GST drop plots were approximated so that the approximated
equation by Eq. (3) had the same CGD. The relationship between the mass of fine dust MD in
Mt and the CGD for GST drop plots in Turco et al. (Fig. 5) can be represented as
777.0D222.0CGD M . (4)
The quantity of data in Fig. 5 is at a minimum for determining Eq. (4) and the accuracy of the
above equation should be investigated in the future. The relationship between the amount of
fine dust and the yield of surface bursts MSurface (MT) in Turco et al. (1984) is
SurfaceD 01858.0 MM , (5)
as shown in Fig. 6 (scenario G was excluded from the derivation of Eq. (5) because the
scenario assumed 100% surface burst mainly for hardened silos with 8 times the fine dust per
surface explosion yield). The relationship between the CGD and MSurface is therefore
777.0Surface0600.0CGD M . (6)
On the other hand, CGD for Eq. (3) is

15
tt
tA d2lnexpsinCGD0
max . (7)
Replacing
xt
t 2lnexp , (8)
xx
xtAx
tt
txA dsin2ln
d2lnexpd
dsinCGD0
max0
max . (9)
The integral is known as sine integral and using the solution
,,,!77!55!33
dsin 753
0
zzzzxx
xz
(10)
CGD is obtained as
tAtAmax
753max 67.2,,,
!77!55!332lnCGD (11)
Nuclear weapons tests on water, in the stratosphere and at high atmosphere were removed
from the calculation because they produced smaller amount of fine dust as already stated in
section 2 and 330 explosions which were categorized into "Surface", "Land surface", "Tower",
"Balloon", "Air", "Air drop", "Air burst" on land with total yield of 265 MT were selected for
calculation from Table 1 in UNSCEAR, 2000, pp. 195-204. Test types are as reported to
UNSCEAR by the country and there are no detailed explanations in UNSCEAR (2000).
Nuclear yield of other test types than "Surface" and "Land surface" should be reduced
according to radius of fireball and altitude of explosions because fine dust is generated by
fireball contacting to the ground. Let's assume a fireball with the maximum radius RM (m) by
a nuclear explosion at height H (m) from the ground surface. Ignoring the interaction between
fireball and the ground surface and taking y-axis downward from the center of explosion (Fig.
7a), the volume VB (m3) of the fireball below ground surface is

16
3
)(3
d33
M2M
32M
22B
MM HRHRRyyRyyRV M
R
H
R
HM . (12)
The ratio of VB to the entire volume of fireball VF (m3) is
33
3
3M
33M2
M
F
B
41
43
21
31
32
43
31
311
43
34
3)(
MMMM
MM
M
V
RH
RH
RH
RH
RH
RH
R
HRHRR
VVR
. (13)
Of course,
MV RHR if ,0 (14)
This function represents decrease in RV with increase in H/RM as shown in Fig. 7b. The
maximum radius of fireball is represented by
4.0M 1060MR (15)
where M is the nuclear yield in (MT) (section 2.127 in Glasstone & Dallan, 1977).
Considering that RV is 0.5 for surface explosions, nuclear yield M was corrected as
MRM V2Surface (16)
for approx. half nuclear weapons tests which were categorized as "Tower", "Balloon", "Air",
"Air drop", "Air burst" on land and whose altitude was given in Table 1 in UNSCEAR (2000).
The average 2RV of 0.106 from the above tests was used for other tests whose altitude was not
given in Table 1 in UNSCEAR (2000).
Scenarios F and G assumed warheads whose yield was more than 1 MT. The bottom of
nuclear cloud reaches the stratosphere in the cases. Nuclear weapons tests however include
explosions less than 1 MT yield and the bottom of nuclear cloud from those small explosions
do not reach the stratosphere. Nuclear yield M was therefore further corrected according to the
nuclear cloud height as
MRRM VStratoSurface 2 (17)
TSStrato if ,0 HHR (18)

17
BSTBT
STStrato if , HHH
HHHHR (19)
SBStrato Hif ,1 HR (20)
where HT and HB (km) are the top and bottom heights of nuclear cloud and given by Eqs. (1)
and (2). HS (km) is the height of the tropopause and was assumed to be 11 km. RStrato begins to
increase from nuclear yield of 0.025 MT and reach 1 at 0.433 MT as shown in Fig. 8. The
dependency of RStrato on tropopause or explosion altitude was ignored in this paper. It should
be noted however that RStrato increases but RV decreases with explosion altitude, namely, they
offset each other. For example, effects of explosions at a higher altitude than fireball radius
were not included in the GST drop calculation because RV is zero. As a result, effects of RStrato
correction are not significant as described later (Fig. 9b).
Only Little Boy and Fat Man generated soot from Hiroshima and Nagasaki. The CGD
produced by the combat use of the two bombs was estimated based on the GST drop plots
(Figure 2 in Robock et al., 2007). The plots were not directly approximated by Eq. (3) but via
CGD as fine dust cases. The relationship between the mass of soot MSoot in Mt and the CGD
that was graphically measured for Fig. 2 in Robock et al. (2007) is
568.0Soot40.3CGD M (21)
(Fig. 5). The amount of soot was assumed in Robock et al. (2007) as
MM 03.0Soot (22)
where M is the nuclear yield in MT. Substituting Eq. (22) into Eq. (21), the following
equation is obtained.
568.0464.0CGD M (23)
Roughly speaking, the CGD from a soot-inducing nuclear explosion (e.g., a city attack) is
approximately one order larger than the CGD from the same yield of a fine dust-inducing
surface nuclear explosion (e.g., a surface nuclear weapons test) as shown in Fig. 5. This was
mainly due to the difference in size distributions and optical properties of fine dust and soot
(already described in section 2).

18
Removing nuclear weapons tests at higher altitude than the maximum fireball radius and
those less than 0.025 MT whose fine dust does not reach the stratosphere, 2 combat use, 4
explosions with total yield of 0.765 MT at "surface" and "land surface" on land and 104
explosions by "air", "air drop", "airburst", "balloon" and "tower" on land with total yield of
262 MT, average 2RV of 0.106 and average RStrato of 0.76 were used for the calculation (Table
1). Calculation procedure is as follows:
(1) For combat use cases, CGD was calculated by substituting M into Eq. (23).
(2) For surface nuclear weapons tests, HT and HB were calculated by substituting M into
Eqs. (1) and (2). RStrato was calculated by substituting HT and HB into one of Eqs. (18) to
(20). MSurface was calculated by substituting M, RStrato and RV of 0.5 into Eq. (17). CGD
was calculated by substituting Msurface into Eq. (6).
(3) For nuclear explosion tests in air, RM was calculated by substituting M into Eq. (15). RV
was calculated by substituting RM and H into Eq. (13) or 2RV of 0.106 was assigned to
explosions whose altitude was not given in Table 1 in UNSCEAR (2000). HT and HB
were calculated by substituting M into Eqs. (1) and (2). RStrato was calculated by
substituting HT and HB into one of Eqs. (18) to (20). MSurface was calculated by
substituting M, RStrato and RV into Eq. (17) and then CGD was calculated by substituting
MSurface into Eq. (6).
(4) The peak GST drop Amax was calculated for each explosion by substituting CGD and t
into Eq. (11).
(5) GST drop-time function by each explosion was calculated substituting Amax and t into
Eq. (3).
(6) GST drop-time functions for 110 explosions were superposed considering the explosion
year.
The calculated GST drop for the 110 actual atmospheric nuclear explosions, assuming t to
be 3 years based on Figure 2 in Robock et al. (2007) is shown in Fig. 9a (base case) with

19
results assuming t = 2 and 4 (y) for references. In the base case, the GST drop gradually
increases and reaches the peak in 1965, several years after a significant amount of
atmospheric nuclear weapons tests were carried out just before the PTBT in 1963, mainly due
to the large hydrogen bombs by the Soviet Union. The GST drop decreases after the peak and
becomes almost negligible in 1980. There is not a significant difference between the three
cases but the values of peak GST drop decreases and duration of GST drop becomes longer
with increase in t. Effect of correction for RStrato is not significant (Fig. 9b) because most
GST drop is due to large explosions whose RStrato is 1, namely, nuclear yield is more than
0.433 MT and HB is beyond the tropopause.
The GST drop caused by the 110 selected atmospheric nuclear explosions (base case) was
removed from the GST data, which was already corrected based on Thompson et al. (2008), to
estimate GST behavior without the effects of the actual atmospheric nuclear explosions. The
re-corrected GST (Fig. 1, the red line) continues to rise at an almost constant rate of approx.
0.016K/y from 1917 to 1965 and then slightly decreases until 1976. The slight decrease can
be explained by the low solar activity between 1965 and 1976 (Fig. 1). A detailed
investigation of these figures should be undertaken in the future. However, it would be very
important if GST behavior could be explained simply by the effects of the known radiative
forcings after removing the effects of the actual atmospheric nuclear explosions and
correcting for the change in the measuring method of SST. These results suggest that a
detailed GCM study which included the effects of fine dust from nuclear weapons testing
might be able to reproduce the GST stagnation.
For all of the cases in Fig. 9a, the calculated effects of Little Boy (0.015 MT) and Fat Man
(0.021 MT) were negligible. This is because their yields were very small, despite the fact that
they generated soot. The total mass of conventional explosives for the raids at the end of
World War II in 1945 at Dresden (>2 kt, Feb. 13-14), Nuremberg (2 kt, Feb. 20, 1.8 kt, Feb.
21), Tokyo (1.65 kt, Mar. 9), Essen (4.74 kt, Mar. 11), Nagoya (1.8 kt, Mar. 11), Dortmund

20
(4.9 kt, Mar. 12) and Osaka (1.73 kt, Mar. 13) was 19 kt (= 0.019 Mt, p. 73 in Mark, 1976)
and is comparable to the yield of Little Boy or Fat Man, which caused severe but local and
short term-climate disturbances, including air temperature drop and precipitation. The effects
of Little Boy or Fat Man on GST were, however, calculated as negligible. These raids with
conventional explosives may have induced similar local short-term climate disturbances.
However, the effects of these raids on GST is also negligible.
5. Injection of fine limestone powder into the lower stratosphere to mitigate global
warming
According to the IPCC’s AR4 (2007), predicted GST rise of 2.3K by 2050 since 2000 with
0% reduction of anthropogenic CO2 emissions will be corrected to 1.7K with a 50% reduction
in anthropogenic CO2 emissions. Accompanying world economic loss is predicted to be more
than 5.5% (IPCC’s AR4, 2007). The reduction of anthropogenic CO2 emission may
sometimes induce a reduction of the R/P (reserves to production ratio) of energy resources.
For example, introducing oxygen combustion technique for CCS (carbon dioxide capture and
storage) results in decreasing efficiency of coal power plants by 7-10% for oxygen production
and CO2 compression (p. 1004 of Wall et al., 2009). Introducing Light Water Reactors
worldwide as one of the attempts to reduce anthropogenic CO2 emissions apparently produces
a significant reduction of R/P for uranium, which is only 124 years (Source:
OECD/NEA-IAEA URANIUM2009).
Considering the fact that giant eruptions have actually induced a GST drop and considering
the possibility that atmospheric nuclear explosions induced a GST drop, some geoengineering
proposals (Lenton & Vaughan, 2009), including injection of sulfate aerosol into the
stratosphere (Crutzen, 2006, Jones et al., 2010), seem effective. There are, however, concerns
that sulfate aerosols would induce environmental problems such as acid rain and

21
photochemical oxidants. Chang & Shih (1991) proposed to seed particles of Welsbach
materials (e.g. thorium oxide and other oxides of metal) whose diameter was in the range of
10 to 100 m to the stratosphere by seeding aircrafts. Thorium oxide is however radioactive.
Thorium oxide and other oxides of metal are very likely to cause environmental problems. Fly
ash, mainly consists of silicon dioxide and calcium dioxide, would be very effective for
reducing insolation because of its dark color. However, fly ash is known to cause severe
health problems, if inhaled, such as silicosis, asthma etc. On the other hand, limestone is
harmless to human beings. Fine limestone powder, however, is described in MSDS as "Any
physical condition normally aggravated by dust, such as eye, nose, and throat inflammation,
and asthma, could be aggravated by Calcium Carbonate dust." and "Respirable level 5
mg/m3". Assuming 6.4 Mt/y, which will be later proposed to obtain 0.6K GST drop, is
uniformly distributed in troposphere and average tropopause height is 11 km, concentration
would be 1.14 x 10⁻³ mg/m3. Concentration would be 0.42 mg/m3, which is still less than the
respirable level, even assuming that the powder for one year falls from stratosphere to
troposphere in a day. Moreover, solubility of calcium carbonate is 4.70 x 10⁻⁴ mol/l at PCO2 is
3.5 x 10⁻⁴ atm. Proposing 6.4 Mt/y is 6.35 x 10¹⁰ mol/y. World average rain precipitation is
880 mm/y. Multiplying by the earth's surface area 5.1 x 10⁸ km2, we obtain world average
precipitation volume of 4.49 x 10¹⁷ l3/y. This rain can contain calcium carbonate of 2.11 x 10¹⁴
mol/y, namely, the injected limestone powder will be dissolved into rain, even not acid, as
soon as it falls to troposphere. Rather, liming to improve the environment is widely carried
out. For example, in Sweden, several thousand lakes and streams have been limed repeatedly
to mitigate acidification (Guhrén et al., 2006). Thus the possibility of injecting fine limestone
powder into the lower stratosphere to mitigate global warming was investigated as follows.
A very simple estimation of the GST drop from the injection of fine limestone powder is
given below as a first step of my proposal. This estimation is partly based on the procedure
shown in the Appendix of Robinson (1985). Let's assume a spherical limestone particle with
diameter d (m), the volume of a particle V (m3) and sectional area A (m2) are

22
3
234 dV (24)
4
2dA . (25)
The mass of the particle m (kg) is
Vm , (26)
where is the density in kg/m3. Letting ML, AE, ti and tS be the injection rate of limestone
powder (kg/y), the surface area of the earth (m2), injection period (y) and average duration of
limestone powder in the stratosphere (y), respectively, and assuming that ti tS (Fig. 10), the
amount n (m-2) of limestone powder per unit surface area of the earth on the plateau in Fig. 10
is
E
LS mA
Mtn . (27)
The ratio R (-) of the sectional area of limestone powder to the earth's surface area is
nAR . (28)
Reflected insolation by the limestone powder W (J) is
RWW , (29)
where is the reflectivity of the visible light (-), and W is the insolation (J). Stefan-Boltzmann
law represents radiated heat flux q (W/m2) from an object whose absolute temperature is T
(K) as
4Tq (30)
where is Stefan-Boltzmann constant (5.67 x 10⁻⁸ W·m-2·K-4) and is emissivity (-). Namely,
the fourth power of the absolute temperature of an object is proportional to heat flux.
Assuming that the powder does not absorb energy, the small GST drop T (K) can be roughly
estimated based on the Stefan-Boltzmann law as
TWWT
4, (31)
where T is average GST in K. Substituting Eqs. (24) to (29) into Eq. (31), GST drop can be
represented as

23
E
Ls
83
dATMtT . (32)
It is important that GST drop is inversely proportional to diameter of the powder. Finally, the
injection rate (kg/y) required for the desired GST drop is represented as
s
EL 3
8t
dATTM . (33)
The values shown in Table 2 were used in the calculation. Average GST, density of calcium
carbonate and surface area of the earth are known values. Diameter of limestone, average
duration and GST drop are assumption and reflectivity are after the reference. Substituting for
the values shown in Table 2 into Eq. (33), a very rough estimation is obtained that a
0.4-6.4-Mt/y injection of fine limestone powder (depending on its reflectivity and tS) into the
lower stratosphere would be required to obtain and maintain a 0.6-K GST drop from tS to ti
after injection begins. This injection rate is 8% to 128% the simulated results shown in Fig. 3
on p. 6002 of Jones et al. (2010), where the author proposes a 5-Mt/y SO2 injection for 20
years for a 0.6-K or 0.4-K GST drop calculated with HadGEM2 or ModelE.
The upper 6.4 Mt/y will be used in the following conservative cost estimation. This value is
just 0.19% the world’s limestone production (3,440 Mt in 1999, source: Taiheiyo Cement
Corporation Web Site, http://www.taiheiyo-cement.co.jp/rd/research/3cemcon/313.html in
Japanese). The price of 6.4 Mt of crushed limestone would be around 36 MUSD (source:
HighBeam Business Web Site,
http://business.highbeam.com/industry-reports/mining/crushed-broken-limestone) but fine
limestone powder is more expensive due to grinding cost and would cost around 1.7 GUSD
(Nishiyama, 2009, an engineer at Japanese limestone mining company, personal
communication). Let us assume that transport planes are used to inject fine limestone powder
into the lower stratosphere because missiles are too expensive, and their fragments might
cause environmental problems. Transport planes usually do not fly in the lower stratosphere
because more fuel is required, but they have the capacity to reach that layer. The Antonov

24
An-124 (a Russian transport plane), for example, can carry a 230-t payload so that 28000
flights a year or 76 flights a day would be required to inject fine limestone power at a rate of
6.4 Mt/y. Assuming the cost to be 10 kUSD per flight, the yearly cost would be 280 MUSD.
According to IPCC's AR4, cost to mitigate global warming by 0.6K is more than 5.5% GDP
for 50 years as stated above. The world GDP in 2009 is 57.8 TUSD (source: International
Monetary Fund Web Site,
http://www.imf.org/external/pubs/ft/weo/2010/02/weodata/weorept.aspx?pr.x=37&pr.y=15&s
y=2009&ey=2009&scsm=1&ssd=1&sort=country&ds=.&br=1&c=001%2C998&s=NGDPD
&grp=1&a=1) and 5.5% is 3180 GUSD or 64 GUSD/y. A total yearly cost of 2.0 GUSD for
injection is just 1/32 the cost for reduction of anthropogenic CO2 emissions. It should be
pointed out that the greenhouse effect of the CO2 in the 6.4 Mt limestone powder is negligible
compared with the 29 Gt world CO2 emission (2007). The neutralization of acid rain would
also be expected. Deliberate consideration would, of course, be required before execution of
the injection of fine limestone powder because it may affect temperature stratification, cloud
distributions, stratospheric water load (Solomon et al., 2009), aqueous chemistry etc.
6. Concluding remarks
This study suggests that the cause of the stagnation in global warming in the mid 20th century
was the atmospheric nuclear explosions detonated between 1945 and 1980, especially the
large hydrogen bomb tests. The estimated GST drop due to the fine dust from the actual
atmospheric nuclear explosions based on the published simulation results (TTAPS and
Robock et al., 2007) has served to explain the stagnation in global warming.
The necessity of "possible natural analogues and data from observations that follow nuclear
tests during the late 1950s and early 1960s" to estimate the possible climatic impact of major
post-nuclear disturbances of the gaseous and aerosol composition of the atmosphere has

25
already been pointed out by Kondratyev (1988, p. 13). Atmospheric nuclear explosions can be
regarded as full-scale in situ tests for nuclear winter, albeit with smaller yields. The
non-negligible amount of the GST drop from the actual atmospheric explosions suggests that
nuclear winter is not just a theory but has actually occurred. In other words, it can be said that
ignoring the effects of the actual atmospheric nuclear explosions on GST is equivalent to
denying the possibility of the occurrence of nuclear winter. The accuracy of the simulations of
GST by IPCC may also be significantly improved by introducing the influence of fine dust
from the actual atmospheric nuclear explosions into their climate models; thus, global
warming behavior could be much more accurately predicted.
A method to mitigate global warming by injecting fine limestone powder into the lower
stratosphere was proposed. Many factors still need to be investigated. However, the method
could be implemented at a much smaller cost than the current attempts to reduce
anthropogenic CO2 emissions. The fine limestone powder injection could also mitigate acid
rain and would be much better for human health than other methods that use sulfate aerosols
or oxides of metal.
This study is rather primitive and there are many things left for further investigation. The
possibility is acknowledged that there are different mechanisms to explain the GST drop
produced by atmospheric nuclear explosions. These could consist of either complicated
climate phenomenon induced by the atmospheric nuclear explosions (Arakawa et al., 1955) or
NO2 from the hydrogen bomb explosions (Kondratyev, 1988).
Acknowledgements
The author thanks Dr. Earle Williams at the Massachusetts Institute of Technology and Dr.
Jonah Colman at Air Force Research Laboratory, Space Vehicles Division, Space Weather
Center of Excellence very much for the valuable suggestions. Ms. Yurika Hara at Hokkaido

26
University, Japan, helped the author analyze the data of the actual atmospheric nuclear
explosions.
References
Andronova, N. G. and Schlesinger M. E. (2000), Causes of Global Temperature Changes
during the 19th and 20th Centuries, Geophys. Res. Let., Vol. 27, No. 14, pp. 2137-2140
Arakawa, H. (1954), Possible Atmospheric Disturbances and Damages to the Ricecrops in
Northern Japan that may be Caused by Experimentation with Nuclear Weapons,
Geophysical Magazine, pp. 125-134
Arakawa, A., Fujita, T., Masuda, Y., Matsumoto, S., Murakami, T., Ozawa, T., Suzuki, E.,
Takeuchi, M. and Tomatsu, K. (1955), Climatic Abnormalities as Related to the Explosions
of Volcano and Hydrogen-Bomb, Geophysical Magazine, pp. 231-255
Chang, D. and Shih, I-fu (1991), Stratospheric Welsbach Seeding for Reduction of Global
Warming, US Patent, No. 5003186.
Compo, G. P. and Sardeshmukh, P. D. (2010), Removing ENSO-Related Variations from the
Climate Record, J. Climate, Vol. 23, pp. 1957-1978
Crutzen, P. (2006), Albedo Enhancement by Stratospheric Sulfur Injections: A Contribution to
Resolve a Policy Dilemma?, Climate Change, Vol. 77, pp. 211-219
Dörries, M. (2006), In the public eye: Volcanology and climate change studies in the 20th
century, Historical Studies in the Physical and Biological Sciences. Sep 2006. Vol. 37, Iss.
1; p. 87-125
Ehrlich, P. R., Sagan, C., Kennedy, D. and Roberts, W. O. (1984), The Cold and the Dark,
Sidgwick & Jackson, London
Fujii, Y. (2010), Influence of Atmospheric Nuclear Explosions on Climate Change, 90th AMS
Annual Meeting, J19.5, Atlanta, Jan. 20
Glasstone, S. and Dolan, P.J. (1977), The Effects of Nuclear Weapons, Glasstone, S., and P. J.
Dolan, 1977: The Effects of Nuclear Weapons. 3d ed. U.S. Department of Defense, U.S.

27
Government Printing Office
Guhrén, M., Bigler, C. and Renberg, I. (2006), Liming Placed in a Long-term Perspective: a
Paleolimnological Study of 12 Lakes in the Swedish Liming Program, J. Paleolimnology,
Vol. 37, No. 2, pp. 247-258
Hansen, J., Sato, M., Ruedy, R., Kharecha, P., Lacis, A., Miller, R., Nazarenko, L., Lo, K.,
Schmidt, G. A., G. Russell, Aleinov, I., Bauer, S., Baum, E., Cairns, B., Canuto, V.,
Chandler, M., Cheng, Y., Cohen, A., Del Genio, A., Faluvegi, G., Fleming、E., Friend、A.,
Hall, T., Jackman, C., Jonas, J., Kelley, M., Kiang, N. Y., Koch, D., Labow, G., Lerner, J.,
Menon, S., Novakov, T.,Oinas, V., Perlwitz, Ja., Perlwitz, Ju., Rind, D., Romanou, A.,
Schmunk, R., Shindell, D., Stone, P., Sun, S., Streets, D., Tausnev, N., Thresher, D., Unger,
N., Yao, M., Zhang, S. (2007), Climate simulations for 1880–2003 with GISS modelE,
Clim. Dyn., Vol. 29, pp. 661–696, DOI 10.1007/s00382-007-0255-8
Hishida, M. (2001 in Japanese), On the Effect of the World War II Bombing and the Nuclear
Bomb Test to the Regime Shift of the Mean Global Surface Temperature (SAT SST), Proc.
16th Ocean Engineering Symposium, pp. 29-34
IPCC (2007), The 4th Assessment Report
Jones, A., Haywood, J., Boucher, O., Kravitz, B and Robock, A. (2010), Geoengineering by
Statospheric SO2 Injection: Results from the Met Office HadGEM2 Climate Model and
Comparison with the Goddard Institute for Space Studies ModelE, Atomos. Chem. Phys.,
Vol. 10, pp. 5999-6006
Kitada, M. (2010 in Japanese), Observation of Microstructure of Plaster at Takamatsu-zuka
Tomb, Report at Investigation and Research Committee for Wall Paintings at
Takamatsu-zuka Tomb
Kondratyev, K. Ya. (1988), Climate Shocks: Natural and Anthropogenic, John Wiley & Sons.
Landsberg, H. E. (1958), Trends in Climatology, Science, New Series, Vol. 128, No. 3327, pp.
749-758
Lenton, T. M. and Vaughan, N. E. (2009), The Radiative Forcing Potential of Different
Climate Geoengineering Options, Atmos. Chem. Phys. Discuss, Vol. 9, pp. 2559-2608

28
Markson, R. (2007), The Global Circuit Intensity, Its Measurement and Variation over the
Last 50 Years, Bulletin of the American Meteorological Society, Vol. 88, Issue 2 (February
2007), pp. 223–241. DOI: 10.1175/BAMS-88-2-223
Minnis, P., Harrison, E. F., Stowe, L. L., Gibson, G. G., Denn, F. M., Doelling, D. R. and
Smith, W. L. Jr. (1993), Radiative Climate Forcing by the Mount Pinatubo Eruption,
Science, Vol. 259, pp. 1411-1415
Robinson, R. M. (1985), Fire & Ice, Longman
Robock, A., Oman, L. and Stenchikov, G. L. (2007), Nuclear winter revisited with a modern
climate model and current nuclear arsenals: Still catastrophic consequences, J. Geophys.
Res., Vol. 112, D13107
Schlesinger, M. E. and Ramankutty, N. (1994), An Oscillation in the Global Climate System
of Period 65-70 years, Nature, Vol. 367, pp. 723-726
Solomon, S., Rosenlof, K., Portmann, R., Daniel, J., Davis, S., Sanford, T. and Plattner, G.
(2009), Contributions of Stratospheric Water Vapor to Decadal Changes in the Rate of
Global Warming, Science, Vol. 327, No. 5970, pp. 1219-1223, DOI:
10.1126/science.1182488
Thompson, D. W. J., Kennedy, J. J., Wallace, J. M. and Jones, P. D. (2008), A Large
Discontinuity in the Mid-twentieth Century in Observed Global-mean Surface Temperature.
Nature, Vol. 453, pp. 647-649, doi:10.1038/nature06982.
Turco, R. P., Toon, O. B., Ackerman, T. P., Pollack, J. B. and Sagan, C. (1983), Nuclear
Winter: Global Conseqences of Multiple Nuclear Explosions, Science, Vol. 222, No. 4630,
pp. 1283-1291
Turco, R. P., Toon, O. B., Ackerman, T. P., Pollack, J. B. and Sagan, C. (1984), The Climatic
Effects of Nuclear War, Scientific American, Vol. 251, No. 2, pp. 23-33
UNSCEAR (2000), UNSCEAR 2000 Report, Sources and Effects of Ionizing Radiation, Vol.
I: Sources
Wall, T., Liu, Y., Spero, C., Elliott, L., Khare, S., Rathnam, R., Zeenathal, F., Moghtaderi, B.,
Buhre, B., Sheng, C., Gupta, R., Yamada, T., Makino, K. and Yu, J. (2009), An Overview

29
on Oxyfuel Coal Combustion—State of the Art Research and Technology Development,
Chemical Engineering Research and Design, Vol. 87, pp. 1003-1016
Ward, P. L. (2009), Sulfur Dioxide Initiates Global Climate Change in Four Ways, Thin Solid
Films, Vol. 517, pp. 3188-3203, doi:10.1016/j.tsf.2009.01.005
Winchester, S. (2003), Krakatoa: The Day the World Exploded: August 26, 1883,
HarperCollins Publishers