THE ROLE OF ADVANCE PAYMENTS IN WORKING CAPITAL
63
LAPPEENRANTA UNIVERSITY OF TECHNOLOGY Faculty of Technology Management Department of Industrial Management THE ROLE OF ADVANCE PAYMENTS IN WORKING CAPITAL MANAGEMENT AND PROFITABILITY Instructors: Miia Pirttilä & Sari Viskari Examiners: Professor Timo Kärri & Professor Hannu Rantanen Lappeenranta, October 31 st , 2012 Anna-Maria Talonpoika
Transcript of THE ROLE OF ADVANCE PAYMENTS IN WORKING CAPITAL

LAPPEENRANTA UNIVERSITY OF TECHNOLOGY
Faculty of Technology Management
Department of Industrial Management
THE ROLE OF ADVANCE PAYMENTS IN WORKING
CAPITAL MANAGEMENT AND PROFITABILITY
Instructors: Miia Pirttilä & Sari Viskari
Examiners: Professor Timo Kärri & Professor Hannu Rantanen
Lappeenranta, October 31st, 2012
Anna-Maria Talonpoika

ABSTRACT
Author: Anna-Maria Talonpoika
Title: The role of advance payments in working capital management and
profitability
Year: 2012 Place: Lappeenranta
Master’s thesis. Lappeenranta University of Technology, Industrial Management.
51 pages, 9 figures, 3 tables and 2 appendices.
Examiners: Professor Timo Kärri and professor Hannu Rantanen
Keywords: advance payments, working capital, working capital management,
profitability, cycle time, CCC, mCCC, DIO, DSO, DPO, DAO
The objective of this thesis is to study the role of received advance payments in
working capital management by creating a new measurement and to study the
relationship between advance payments and profitability. The study has been
conducted using narrative literature review and quantitative research methods.
The research was made analyzing 108 companies listed in Helsinki Stock
Exchange.
The results indicate that 68 % of the studied companies are receiving advance
payments and the average cycle time for received advance payments is 13 days.
A new key figure is created to include received advance payments into the
calculation of working capital. Received advance payments shorten the working
capital cycle, by 13 days, when they are used in the calculation. The role of
advance payments is not as significant as the role of receivables and inventories
but advance payments may have a larger role than payables if the company is
receiving noticeable amounts of advance payments. There are three branches
where companies are receiving more advance payments than average companies.
The branches are project business and ICT and publishing sectors. There is a
negative correlation between profitability and advance payments based on the
results of this study.

TIIVISTELMÄ
Tekijä: Anna-Maria Talonpoika
Työn nimi: Saatujen ennakoiden merkitys käyttöpääoman hallinnassa ja
yrityksen kannattavuudessa
Vuosi: 2012 Paikka: Lappeenranta
Diplomityö. Lappeenrannan teknillinen yliopisto, tuotantotalous.
51 sivua, 9 kuvaa, 3 taulukkoa ja 2 liitettä.
Tarkastajat: professori Timo Kärri ja professori Hannu Rantanen
Hakusanat: ennakkomaksut, käyttöpääoma, käyttöpääoman hallinta,
kannattavuus, kiertoaika, CCC, mCCC, DIO, DSO, DPO, DAO
Tämän työn tarkoituksena on selvittää saatujen ennakkomaksujen roolia
käyttöpääoman hallinnassa työssä luotavan tunnusluvun avulla. Tämän lisäksi
tutkitaan saatujen ennakkomaksujen suhdetta yrityksen kannattavuuteen.
Tutkimuksen tekemiseen käytetään kuvailevaa kirjallisuuskatsausta sekä
kvantitatiivisia tutkimusmenetelmiä. Tutkimus toteutetaan analysoimalla 108
Helsingin pörssissä listattua yritystä.
Tulosten perusteella 68 % tutkituista yrityksistä saa ennakkomaksuja ja saatujen
ennakkomaksujen keskimääräinen kiertoaika on 13 päivää. Saatujen
ennakkomaksujen huomioimiseksi käyttöpääoman laskennassa, luotiin uusi
tunnusluku. Saadut ennakkomaksut lyhentävät käyttöpääoman kiertoaikaa
keskimäärin 13 päivällä, kun ne huomioidaan laskennassa. Saatujen
ennakkomaksujen rooli ei ole yhtä merkittävät kuin myyntisaamisten ja
varastojen, mutta ne voivat nousta ostovelkoja merkittävämpään asemaan, mikäli
yritys saa ennakkomaksuja huomattavia määriä. Kolmella eri toimialalla yritykset
saavat ennakkomaksuja keskimääräisiä yrityksiä enemmän. Nämä toimialat ovat
projekti-, ICT- ja kustannustoimiala. Saatujen ennakkomaksujen ja
kannattavuuden väliltä on löydettävissä negatiivinen korrelaatio tämän työn
tulosten pohjalta.

ACKNOWLEDGEMENTS
I am thankful to Professor Timo Kärri for giving this subject for my master’s
thesis. I want to thank Professor Timo Kärri as well as Miia Pirttilä and Sari
Viskari for patient guidance and excellent advices that made it possible for me to
finish this thesis.
I am also grateful to my family and to my friends for support during my studies
and especially during the thesis project. Special thanks go to my dog that keeps
me going.
Lappeenranta, October 31st, 2012
Anna-Maria Talonpoika

TABLE OF CONTENTS
1 INTRODUCTION ........................................................................................... 1
1.1 Background ............................................................................................... 1
1.2 Research questions .................................................................................... 2
1.3 Research methods ..................................................................................... 3
1.4 Structure .................................................................................................... 4
2 LITERATURE REVIEW ................................................................................ 6
2.1 Working capital ......................................................................................... 6
2.2 Optimal levels of working capital ............................................................. 8
2.3 Working capital management ................................................................... 9
2.4 Working capital management policies .................................................... 13
2.5 Challenges of working capital management ........................................... 14
2.6 Measures of working capital management ............................................. 17
2.7 Working capital management and profitability ...................................... 19
2.8 Advance payments .................................................................................. 21
2.9 Summary of the literature review............................................................ 23
3 ANALYSIS OF THE ADVANCE PAYMENTS ......................................... 25
3.1 Modified Cash Conversion Cycle ........................................................... 25
3.2 Research design and procedure ............................................................... 26
3.3 The components of modified Cash Conversion Cycle ........................... 28
3.3.1 Days of Inventory Outstanding ........................................................ 28
3.3.2 Days of Accounts Receivables Outstanding .................................... 29
3.3.3 Days of Accounts Payables Outstanding ......................................... 31
3.3.4 Days of Advance Payments Outstanding ........................................ 31
3.4 The difference between CCC and mCCC ............................................... 32
3.5 Branches with advance payments ........................................................... 35
3.6 Profitability and advance payments ........................................................ 37
3.7 Future research ........................................................................................ 40
4 CONCLUSIONS ........................................................................................... 42

REFERENCES ...................................................................................................... 44
APPENDIXES
Appendix I / All studied companies
Appendix II / Companies in the comparison group
FIGURES
Figure 1. The working capital cycle ........................................................................ 6
Figure 2. Cycle times of working capital and profitability .................................... 23
Figure 3. Modified Cash Conversion Cycle .......................................................... 26
Figure 4. Distribution of the companies ................................................................ 28
Figure 5. The components of mCCC ..................................................................... 29
Figure 6. The difference between CCC and mCCC .............................................. 33
Figure 7. CCC and mCCC ..................................................................................... 35
Figure 8. The relationship between advance payments and profitability .............. 38
Figure 9. The relationship between advance payments and profitability in the
comparison group .................................................................................................. 39
TABLES
Table 1. Research questions .................................................................................... 3
Table 2. Structure of the thesis ................................................................................ 5
Table 3. Balance sheet ........................................................................................... 22

ABBREVIATIONS
CCC Cash Conversion Cycle
mCCC modified Cash Conversion Cycle
DIO Days of Inventory Outstanding
DSO Days of Receivables Outstanding
DPO Days of Payables Outstanding
DAO Days of Advance Payments Outstanding
ROI Return on Investment

1
1 INTRODUCTION
1.1 Background
Working capital management has been studied all over the world. Most of these
studies are made through a practical setting and not scientific (Tahir & Anuar
2011, 366-371). There are also few scientific researches about working capital
management according to Viskari et al. (2011a, 9). These researches are often
made using listed companies from a selected stock exchange. Most research
projects have connected working capital management to profitability of a
company. This master’s thesis will also connect those two.
There are two commonly used definitions for working capital. Companies often
use the operational view of working capital but the financial view is often
observed in the literature. The financial view considers the working capital to be
the value of current assets less the value of current liabilities. This view can also
be defined as net working capital. The working capital can be calculated in an
operational view which uses three specific components. The components are
inventories, accounts receivables and accounts payable. (Hampton 1983, 220;
Proctor 2006, 62)
Most companies calculate profitability for their investors but not working capital.
Working capital is sometimes calculated for the investors through the financial
view. Cash Conversion Cycle (CCC) is the most used tool for working capital
management research in academic world but there is almost no information about
working capital management procedures in business life. CCC takes into account
only inventories, accounts receivable and accounts payable but not advance
payments which are also sometimes used when working capital is defined, for
example Corporate Analysis Association in Finland includes advance payments
on calculation of CCC. This thesis creates a new key figure for operative working
capital management, modified Cash Conversion Cycle (mCCC), which also takes
advance payments into account. There are no published working capital
2
researches with the connection to advance payments. This thesis will connect
received advance payments to working capital management.
Advance payments can be divided into received advance payments and paid
advance payments. Received advance payments are payments that the company
has received from its customers before the company has delivered the goods. Paid
advance payments are the opposite side. The company pays to its suppliers
beforehand in order to receive the product or service later. This research is
concentrated in received advance payments. Therefore only advance payments are
mentioned and they are referred to as received advance payments.
Working capital management is currently researched in Lappeenranta University
of Technology by the Capital, Capacity and Cost Management (C3M) research
group. The research is made with a broad scale concerning all aspects of working
capital management. Most research subjects are studied through a value chain
perspective. The linkage between working capital management and profitability is
also part of the research project. This master’s thesis is partly connected to the
current research project in Lappeenranta University of Technology.
1.2 Research questions
Advance payments are in the center of this research and they are studied in two
different ways: working capital management and profitability. The profitability is
studied through the working capital management view. There are two main
research questions that are divided into sub questions. The research questions are
presented in table 1.

3
Table 1. Research questions
Research questions The purpose of a research question
What is the role of advance payments in
working capital management?
The main purpose of this thesis is to study
changes in working capital management
caused by advance payments.
How does CCC change when the
advance payments are calculated
into it?
The purpose is to create a new key figure
which includes advance payments.
What is the cycle time for advance
payments?
The purpose is to calculate advance
payments in to the operational working
capital and determine cycle times for
advance payments in different branches.
Have companies with advance
payments centered in some
particular branches?
The purpose is to detect the branches and
discover reasons for the concentration.
Do advance payments affect profitability? The purpose is to find changes in
profitability caused by advance payments.
1.3 Research methods
This thesis has two parts: theoretical and empirical. Theoretical part is executed as
a narrative literature review. Salminen (2011, 7) classifies it a descriptive research
method and it is often used to give theoretical guidelines to a study. General
overview of the previous research is one type of narrative literature review and
that is the type used in this thesis. The empirical part of this thesis contains the
research of advance payments. The research is conducted using statistical methods
as a part of quantitative methods. The statistical methods are used to conduct
financial statement analysis. Creswell (2003, 18-19) describes quantitative
approach in three different ways. Developing knowledge by postpositivist claims,
using surveys and collecting data through predetermined instruments are all
indications of quantitative approach. The statistical data for this research is
collected using predetermined instruments but specific surveys have not been

4
used. Postpositivist claims like hypothesis testing have not been used either but
numerical information measurements have been widely executed in this research.
Data used in the empirical part is collected from financial statements of
companies. This sort of data is called secondary data. Zikmund et al. (2010, 161)
describes the secondary data as data that has been previously collected for some
other purpose. The advantages of this type of data collection are availability and
resources saving. These are also the reasons why secondary data was used in this
study. Secondary data was the only available data for this study and it also enables
the publicity of this thesis. The possible problems of secondary data are outdated
information, variation in definition of terms, variations in units of measurement
and data accuracy. The collected data was from the year 2010 so it is still fairly
new and this sort of study can only be made from historical data. All listed
companies in Finland have to make their financial statements according to IFRS
(International Financial Reporting Standards) standard so the terms and units are
invariable. The data is also accurate and it is verified by auditing.
1.4 Structure
There are four chapters in this thesis. The first chapter will introduce the reader to
the study and give some background information. The second chapter presents the
current state of working capital research by written articles. The third chapter
introduces a new figure that is then used to analyze advance payments. The results
are also explained in this chapter. Recommendations for future research are also
included in this chapter. The fourth chapter will summarize the results of this
thesis.

5
Table 2. Structure of the thesis
Input Chapter Output
The reason for this thesis. 1 Introduction
Background, research
questions, methods and
structure of the study.
Literature about working capital
management chosen by using
guidelines defined in the
chapter 1.
2 Literature review
Short review of previous
literature written about
working capital management
and profitability.
Literature review from the
chapter 2 and collected data. 3 Analysis
Definition and usage of a new
figure. Results and analysis
of the research conducted in
this thesis. Recommendations
for future research.
Literature review from chapter
2 and results from chapter 3. 4 Conclusions
The summary of the research
in this thesis.

6
2 LITERATURE REVIEW
2.1 Working capital
Working capital is needed every day until the on-going project is completed
(Kumar et al. 2002, 100). Richards & Laughlin (1980, 34-35) discovered that
working capital is needed in every step of the process but it changes after certain
steps. The working capital cycle can be seen from the figure 1. The basic activities
for companies are purchasing, production, sales and collection of payments. The
cash is invested to the production cycle when resources are purchased. The tied up
cash is back to use after the company has collected its payments. The cash that is
invested in working capital cannot be invested to some profitable targets.
Figure 1. The working capital cycle (Mott 2008, 232)

7
Mullins (2009, 5) considers that working capital is cash that a company needs to
stay in business. The cash needs to be available in short terms so the company can
pay to its employees and suppliers. The company will go out of business very fast
if it cannot keep up the constant cash flow. Profitability is held very important but
it does not help the company if it does not have any cash to pay its suppliers.
Companies should therefore consider a suitable working capital policy that can be
implemented to the company.
The study of Filbeck & Krueger (2005, 17-18) indicates that working capital
measures are not stable and they can change dramatically. The changes can be
explained by macroeconomics. The most important macroeconomic factors for
working capital are interest rate, rate of innovation and competition. The company
also has to ensure excess liquidity to balance unexpected changes in amount of
working capital (Richards & Laughlin 1980, 35). Kumar et al. (2002, 103) have
introduced a fuzzy set theory which can be helpful for companies in order to
improve cost allocation and financial planning. The theory can help managers
understand the effects of qualitative factors in the assessment of the required
amount of working capital.
The research of Padachi et al. (2008, 58) indicates that working capital is financed
mainly with short-term assets like trade credit and other payables. Short-term
bank credits are the most used external source of financing working capital. Small
companies are trying to avoid external financing as long as they can so they would
not get any financial troubles paying back the credits. García-Teruel & Martínez-
Solano (2007, 175) discovered in their research that working capital is also
especially important in small and medium- sized companies because most of their
assets are in the form of current assets. Current liabilities are also the main source
of external finance. Steyn et al. (2002, 47) considers that there are risks for
companies that have large amounts of non-cash working capital and that are
growing at a high rate. The companies that are growing too fast will not have the
sufficient amount of cash needed for working capital. These companies will
probably be liquidated or be combined with some larger companies.

8
Mullins (2009, 5) has found that a company should always aim to negative
working capital which means that the company receives cash from the product
before they have to pay from it. Retail and manufacturing companies can both get
into this ideal situation. One of the key elements on negative working capital is
advance payments. Company can receive cash from the customer before the
product is delivered.
2.2 Optimal levels of working capital
The research of Hill et al. (2010, 27) indicates that optimal levels of working
capital depend on the industry. There are several internal and external factors that
are affecting the optimal level of working capital and every company should
recognize them. Companies in concentrated industries do not need working
capital as much than companies in competitive industries. Companies should also
check the internal factors not only industry benchmarking when considering the
optimal levels of working capital. Chiou et al. (2006, 155) have discovered that
the factors affecting the optimal level are not only internal but also external. The
most important internal factors are operating cash flow, growth rate, company
performance and the size of the company. Industry is the most meaningful
external factor.
Chiou et al. (2006, 155) considers that the optimal level of working capital is
somewhere between meeting unexpected capital requirements and avoiding
inefficient working capital management. Working capital levels might be too low
and as a result of that company may miss profitable investment opportunities and
suffer liquidity crises. The research of Appuhami (2008, 22) indicates that most
important factors are capital, operating and finance expenditures as well as
leverage, performance and operating cash flow. Capital expenditure and operating
cash flow have the largest effect in working capital management. The research
indicates that companies are changing their working capital management policies
according to these factors.

9
Optimal levels for all parts of working capital and profitability can be calculated
by the optimal cash conversion cycle introduced by Nobanee & AlHajjar (2010a,
6-11). This function is similar to cash conversion cycle except it will be calculated
with optimal levels of inventory conversion, receivable collection and payable
deferral period. The optimal inventory level can be calculated with Economic
Order Quantity model (EOQ) where total costs are combined costs of carrying and
shortage costs. This is not the only possible model to calculate optimal inventory
levels and there are several models presented in the literature. Optimal amount of
granted credit can be calculated with the same method as inventory levels. The
optimal amount is the sum of carrying and opportunity costs. The optimal amount
of accounts payables is the sum of carrying costs and opportunity costs of short-
term borrowings.
2.3 Working capital management
Working capital management is a vital part of every company. Noreen et al.
(2009, 169) discovered it is conducted at the corporate level as opposed to local
and regional levels. This indicates that working capital management is considered
important. Sharma & Kumar (2011, 171) as well as Chiou et al. (2006, 155)
consider working capital management to be very important part of financial
management and therefore it should be the backbone for financial decisions of a
company; unfortunately that is not the case in real life. Working capital
management is basically balancing between liquidity and profitability as well as
between financial and managerial decisions. Dramatic changes into one way or
another will cause the finance of the company to go in wrong tracks.
Michalski (2008, 132-133) considers that the goal of working capital management
is to create value for the company. The value creation is considered successful if
the cost of tied up working capital is less than the cost of a debt. Working capital
ties up cash that cannot be used for profitable investments. Increase in the amount
of working capital ties up more cash and therefore reduces the free cash flow to
the company. According to Chiou et al. (2006, 155) working capital management
is basically finding short-term capital and implementing it properly. Working

10
capital management will be ineffective if too much cash is tied up in the working
capital. This will reduce the benefits of short-term investments. The research of
Hutchison et al. (2007, 43-44) as well as Strischek (2001, 34-40) indicate that
effective management of a company needs both profit and cash management.
Efficient working capital management also implicates larger cash flow which ends
up increasing shareholder value. The company will have numerous benefits if it
will have more cash available. Short cash conversion cycle also generates a better
net present value and therefore higher value for the business.
Appuhami (2008, 22) discovered that working capital management is especially
efficient when the company has growth opportunities and they can ensure the
required capital expenditure to expand their business. Strischek (2001, 38-40)
claims that working capital management is one of the things that banks check
when they are allowing credit to their customers. Companies that have efficient
working capital management will easily get external financing with low interest
rate. The cost of capital is therefore lower for these companies and they are
assumed to be more profitable.
The research of Howorth & Westhead (2003, 106-109) indicates that companies
which do not manage their working capital as much as most of the companies will
get a higher profitability. The companies with less working capital management
will also have less interest in growth as well as less external finance. They do not
usually buy in credit and they have short production cycles. The companies also
have several on-time paying customers and they do not normally have cash flow
problems. These companies are not smaller or younger than the average
companies. Companies focus their working capital management only in one area
because they have limited resources for working capital management. Companies
with limited resources are not the smallest ones but these companies do not
usually have advanced financial skills. These companies also need to be
convinced that proper working capital management will improve their
performance.

11
Hutchison et al. (2007, 42-43) have found that a cash conversion cycle can be
positive or negative. A positive cycle means that the company has to tie up
working capital before it gets payment from the customer. Negative cycle means
that the company gets cash from the customer before it has to pay its suppliers.
Essentially every company should have as short cash conversion cycle as possible.
Shorter CCC indicates that the company manages its cash flows efficiently.
Therefore it will have more cash cycles during a year and an invested dollar will
generate more sales. Managers have in recent years noticed the importance of
working capital management. The reduction in CCC will almost automatically
lead to improvements in operational and financial management.
According to Strischek (2001, 38-40) the company can have numerous positive
effects by improving its working capital management practices. Hutchison et al.
(2007, 43-44) found that the improvements depend on which variable will be
improved. Ongoing expenses and inventory carrying costs are examples of these.
Payne (2002, 41-42) considers that the improvements usually start at the financial
department but they will affect the whole company. Changes in financial
operations do not usually remove the problem. The problems are hidden in the
processes. The ordering system might be ineffective or the sales personnel might
be offering too long payment times. The improvements will be effective after the
root of the problems is found. All the companies should consider the optimization
of working capital management even though the company would not be in crisis.
The changes in working capital management will end up showing as larger
revenue for the company. The research of Richards & Laughlin (1980, 35)
indicates that a company can shorten the cash conversion cycle with a few
implementations. Payables will decrease the length of cycle time for working
capital. The company should therefore use the offered credit. The different
inventory managing techniques will also decrease the cycle time by ensuring the
appropriate inventory levels. The company should also decide the right credit
times for its customers.
12
Hill et al. (2010, 27) discovered that working capital (CCC) has a positive
relationship with operating cash flow and company size. There is also a negative
relationship between working capital and financial distress as well as between
working capital and market share. Essentially companies with weak internal
financing abilities, limited access to capital markets and greater costs of external
financing will more likely use payables than receivables or inventory in order to
adjust the working capital.
Howorth & Westhead (2003, 106-107) discovered in their research that
companies that have focused on cash management are usually larger and younger
than average companies. They do not have that much cash sales and they work in
seasons. These companies have more cash flow problems and they have more
external financing. Companies that have focused on stock management are
smaller and younger. They do not usually have that much external finance and
they also have long production cycles. Companies with focus on credit
management are not that profitable but they have an interest to grow. They usually
do purchases on credit and their customers do not pay on time.
The research of Uyar (2009, 192) was conducted by analyzing companies listed in
the Istanbul Stock Exchange. The research indicates that smaller firms have
longer cash conversion cycles. The research also indicates that retail industry has
a shorter cash conversion cycle than manufacturing industry. Textile industry has
the longest cash conversion cycle in the manufacturing industry. The reason for
shorter CCC is the fact that retail industry does not manufacture goods so
therefore it does not need that much inventory. The retail industry also pays bills
slowly and accepts only cash payments so it has optimized the cash conversion
cycle.
The research of Filbeck & Krueger (2005, 13-14) was conducted by analyzing
1 000 U.S. companies during a five year period from 1996 to 2000. The results
show that the average CCE was nine percent and it fluctuated between six and ten
percent. The average CCC was 51.8 days and it fluctuated between 46 and 59

13
days. The average rates for components of CCC were 50.6 days for DSO, 32 days
for DIO and 32.4 days for DPO. Wang (2002, 168) has found evidence that
Japanese companies have shorter cash conversion cycles than companies in
Taiwan. The average cash conversion cycle length on Japanese companies is 87
days and 219 days in Taiwanese companies. The shortest cash conversion cycles
are found (calculated from mean values) from food industry in Japan and
transportation industry in Taiwan.
2.4 Working capital management policies
Meszek & Polewski (2006, 226) discovered that working capital management of a
company depends on the management policy or the lack of it. Different
companies have variable approaches to working capital management. There are
companies that do not control all components of working capital and therefore
they do not have a holistic view over it but there are three policies that are widely
used: aggressive, moderate and conservative. According to Kaur (2010, 13-14)
companies should choose a policy that fits into their needs and financing
capabilities. Yadav et al. (2009, 34) have found that working capital management
policies of the companies are not static. They change over time. The changes in
economy have the biggest effect on working capital management policy.
Aggressive policy is according to Michalski (2009, 132-133) financing the
changes in working capital with short-term assets and conservative policy with
long-term assets. Aggressive policy has been proved efficient when working
capital management needs to be refined and it will bring most value for the
company but it has also most risks. Hill et al. (2010, 27) claim that companies are
using an aggressive policy if their sales are volatile and the company is growing.
Yadav et al. (2009, 34) on the other hand considers that companies use the
conservative approach when the volatility of the business is high and aggressive
approach when the volatility is low.
There are few things that need to be considered when planning working capital
management policy for a company referred to Kaiser & Young (2009, 67).

14
Companies should not use income statements as the primary source of financial
information. Inventories and accounts receivables are tying up cash even though it
cannot be seen on the income statement. The rewarding systems of the companies
can also be the reason for problems in working capital management. Sales persons
should not be rewarded only for completed sales because they will concentrate
only to selling and not keeping up accounts receivables. Production quality is a
good thing but if quality is emphasized it will lead to a slow-down of the
production. Keeping the production in satisfying level and keeping up the speed
will free some cash from the working capital. Companies sometimes connect
accounts receivables and accounts payable. They are not related to each other so
they should be handled separately. Current and quick ratios are measurements to
calculate liquidity of the company. They do not give any information about
working capital. Working capital management is balancing between liquidity and
profitability. If they are not in balance the company will suffer. Benchmarking is a
good way to recover information about the practices inside the industry.
Benchmarking does not tell the right levels of working capital and it should not be
used that way.
2.5 Challenges of working capital management
The problem of working capital management according to Richards & Laughlin
(1980, 35) is to find the ideal level of working capital so the company can have
enough cash as well as money to invest. The key issue is to find a balance
between resources tied up in working capital and in capital investments.
Appuhami (2008, 22) has discovered that working capital management needs to
be done efficiently or the company will invest too much money on working
capital and profitability of the company will be reduced. Inefficient working
capital management might also lead to situation where the company does not have
enough working capital and it will cause the company some financial difficulties.
The risk of the company develops between these two situations. According to
Hutchison et al. (2007, 43) the problem to find the balance can be divided into
operational and financial decisions. The operational management wants to

15
lengthen the CCC to increase liquidity and financial management wants to shorten
the CCC to release cash for capital investments.
The research of Nobanee & AlHajjar (2010b, 15-19) indicates that working
capital has a significantly negative relationship on performance of the company.
There are several factors in this relationship that affect the impact. The indication
is that reduction of working capital does not increase profitability in every
situation. Shortening of CCC may lead into trouble because the shortage costs will
increase if the inventory is kept on a too low level. The reduction of receivable
collection periods will louse the company some credit customers and lengthening
of payable period will cause the company a bad reputation in the eyes of other
companies. The most important piece of working capital management is therefore
to find an optimal level of working capital which maximizes the profitability.
Payne (2002, 40) believes that working capital management can be a key to a
better functioning company. The shortening of cash conversion cycle can free
large amounts of cash for the company. Hard times in the economy can increase
the need of cash in a company. Several companies issue short or long-term debts
to cover the cash demand. The cost of debts is increasing rapidly and therefore it
is not very wise to use a debt to pay another one. Companies should improve their
working capital practices so they could get the needed amount of cash from inside
the company. The improvement takes more time than negotiations at the bank but
they are free of charge. Reilly & Reilly (2002, 15-18) introduces accounts
receivable as one of the elements companies could improve most. Companies
should do more effective evaluation of companies they are granting credit. Bad
debts are costing the company a lot. Companies should also set policies for
granting credit. Every salesperson should know the principles for granting credit.
Flexibility of payment methods is also one way of improving the accounts
receivable. Company could offer several different ways to pay the bill and this
way make sure the bill gets paid.
16
Reilly & Reilly (2002, 13-14) consider that working capital management is these
days financially oriented and it is conducted by financial managers. The
measurements for working capital are traditionally financial ratios. These ratios
do not tell where the origin of the problem is. The problems should be detected
before they end up in financial statements. These situations require the company
to focus its actions into reducing the inventory levels and accounts receivable as
well as prolonging the accounts payable.
Molina & Preve (2009, 684) discovered that companies that have problems with
profitability are more likely to increase the level of accounts receivables. This
procedure is done in order to gain more market share. Companies that are in
financial distress are doing the other way around and they reduce the level of
accounts receivables. This way more working capital is released for other use.
Companies in competitive industries face difficulties when they reduce the
accounts receivables because customers can easily choose another supplier.
Companies in concentrated industries do not face same sort of problem.
According to Bougheas et al. (2009, 306) companies can use accounts payables to
finance the changes in inventories. The companies also have to find a balance
between accounts payables and accounts receivables in order to run the business
effectively.
The research of Long et al. (1993, 126-127) presents that small companies with
unique products usually grant longer credit periods so the customers can verify the
product quality before payment. Large companies with less unique products and
high turnover do not need to grant trade credit. The companies that are granting
trade credit do not usually buy on credit. Large and creditworthy companies are
most likely to extend their trade credits. Extension of trade credit is also used by
companies that have variable demand. Small companies with long production
times are very likely to extend their trade credits in order to finance their
receivables.

17
Late payments are a common problem among small companies in UK according
to Peel et al. (2000, 33). The companies have recognized the problem and are
supporting the legislation for late payments. The companies also consider that the
most helpful way to reduce late payments is interest. Almost all small companies
have at least once paid late to their suppliers and about 15 percent do it regularly.
Small companies still are not the worst type of companies to pay late. Large
companies pay late almost every time then the small companies and the medium
sized companies pay on time.
2.6 Measures of working capital management
Working capital management efficiency can be measured with several different
ways. The calculation methods can be divided into financial and operational
methods. Financial methods include for example Quick Ratio and Current Ratio.
Operational methods are for example Cash-to-Cash method and Cash Conversion
Cycle (CCC). CCC is the most used measurement and there are few variations of
it. Most commonly known versions are Cash Conversion Efficiency (CCE), Net
Trade Cycle (NTC) and Weighted Cash Conversion Cycle (WCCC). All of these
measurements are used in the business life and they might be used together
because they measure working capital management in a different perspective.
(Farris & Hutchison 2003, 83; Filbeck & Krueger 2005, 12; Shin & Soenen 1998,
38)
Cash conversion cycle developed by Richards & Laughlin (1980, 34) is an
important measurement in financial management. It measures liquidity of the
company. The cash conversion cycle reflects the time between the moments when
resources are purchased and the cash is recovered from sales. Basically it
establishes the period of time needed to convert cash disbursements back to cash
inflow. Cycle times for inventory and receivables are calculated to find out the
liquidity of the company. Cash conversion cycle also adds cycle times for
payables into this calculation. This calculation shows that when inventories and
receivables increase the amount of working capital increases and it has to be
therefore financed. The increase in payables in the other hand indicates that

18
spontaneous working capital will accumulate during a longer period of time.
According to Farris & Hutchison (2003, 90) the management needs to understand
the calculation of CCC in order to use it as a tool. Effective use of CCC requires
information about the working capital from a longer period of time.
Shin & Soenen (1998, 38, 43) have developed net trade cycle (NTC) that can be
easily used to check the efficiency of working capital management. NTC is a
more simplified version of cash conversion cycle where the three components of
cash conversion cycle are expressed as percentage of sales. The main goal of the
NTC is to show the number of day’s sales the company needs to finance the
needed working capital. NTC can be easily used when evaluating the required
amount of working capital. A short NTC implicates that the company is managing
its working capital efficiently and therefore the company does not need external
financing for working capital. Reductions in the NTC are one option to create
shareholder value and therefore working capital management should be done
efficiently.
Gentry et al. (1990, 98-99) have developed a weighted cash conversion cycle that
provides more accurate information than the traditional cash conversion cycle.
WCCC is a good measurement for short-term financial management. It focuses
the management to the real engagement of resources in the working capital
process. The WCCC describes of the amount and speed the working capital is
changing in the company. Accounts payable is the factor that is causing the gap
between CCC and WCCC.
CCC is calculated in this thesis using the equation 1 which is based on the
calculation method of Shin & Soenen (1998, 38).
��� = ��� + ��� − �� (1)

19
Where,
CCC = Cash Conversion Cycle
DIO = Days of Inventory Outstanding
DSO = Days of Accounts Receivables Outstanding
DPO = Days of Accounts Payables Outstanding
��� =��� ����� × 365
� ���� � (2)
��� =��������� � ����� × 365
� ���� � (3)
�� =������������� × 365
� ���� � (4)
2.7 Working capital management and profitability
According to Raheman & Nasr (2007, 294) companies have invested large
amounts of money into working capital. Working capital management has
therefore a substantial effect on profitability of the companies. Several studies (for
example Mojtahedzadeh (2011, 165), Lazaridis & Tryfonidis (2006, 34-35),
Dong & Su (2010, 66), Eljelly (2004, 59)) indicate a significant negative
relationship between the cash conversion cycle and profitability of the company.
A long cash conversion cycle is reducing the profitability and vice versa. Deloof
(2003, 585) has found a relationship between profitability and all three aspects of
cash conversion cycle. So there is a relationship between accounts payable and
profitability as well as between account receivable and profitability. The research
of Raheman & Nasr (2007, 294) indicates that the reduction of length of cash
conversion cycle should be done reducing accounts receivables and inventories.
Basically the company will have a better profitability if it pays its bills more
slowly. The payables deferral period has to be appropriate or otherwise the
company will harm its own credit reputation.
Working capital management procedures in a company are affected by the
operational profitability according to Lazaridis & Tryfonidis (2006, 34-35). Talha
et al. (2010, 226) discovered that maintaining the acquired level of profitability

20
requires companies to have the optimum amount of current assets needed in daily
use. The companies also have to take care of their short-term maturities in order to
survive. The basic rule is to have low liquidity and high profitability. Companies
should efficiently use the working capital resources in order to increase
profitability and the values of the company. Mathuva (2010, 10) considers that a
company can increase profitability by decreasing the cash conversion cycle. The
decrease needs efficient use of working capital management resources.
Lazaridis & Tryfonidis (2006, 35) found a significant relationship between gross
operating profit and DPO in their research. DPO will increase when the gross
operating profit is decreasing. This means that less profitable companies are
paying their bills slower to take advantage of the credit period granted to them.
DSO and gross operating profit also has a negative relationship. The companies
that are not so profitable are trying to decrease the accounts receivable in order to
gain more cash. There is a negative relationship between DIO and gross operating
profit. The relationship indicates that if sales are decreasing and the inventories
are not managed properly the company will have lots of capital tied up in
inventories and not available for investments.
There is a negative relationship between the measures of profitability and
aggressiveness of working capital management according to Nazir & Afta (2009,
27-28). The companies will most likely have negative return if they have very
aggressive working capital management policy. On the other hand companies that
have aggressive management policy will get more investors because the
aggressiveness is highly valued by them. Most investors believe that companies
that have less equity and less long-term loans will perform better than other
companies. Filbeck et al. (2007, 20) discovered that also companies that are
ranked high in the CFO Magazine’s working capital survey are doing more return.
This indicates that there is a positive relationship between efficient working
capital management and profitability. Investors also find companies with efficient
working capital management policies interesting.

21
Kieschnick et al. (2011, 12) finds working capital management to be important for
the value of the company. The shareholder value can simply be increased by
optimizing the cash conversion cycle and especially all its parts according to
Deloof (2003, 585). The importance is understandable because significant amount
of company assets are tied up in working capital in most companies. On the other
hand outside investments to working capital are reducing the value of the
company. The invested value is decreasing at the same pace than the invested
amount is increasing. The reductions are not so dramatic if the company has an
easy access to public capital markets. The research of Kieschnick et al. (2011, 19)
indicates that the outside investments into the working capital of a company are
not profitable. The value of the investment will be negative. Basically the investor
will save his money by keeping it on cash than investing it to the working capital.
The research indicates that the pattern is similar in all industries.
Raheman et al. (2010, 426-427) have been analyzing 204 companies listed in
Karachi Stock Exchange in the period 1998-2007. The results indicate that there is
sectoral deviance between the different measures of working capital management.
The results vary significantly between the sectors. The measures may predict the
profitability in some sectors but in others it has no role. Several researches on the
other hand have indicated that there is a negative relationship between liquidity
and profitability. This particular study shows that there might be a positive
relationship as well as negative. There is also evidence that CCC and NTC
measures liquidity differently than Current Ratio.
2.8 Advance payments
Advance payments are one part of current liabilities. Their position in the balance
sheet can be seen from the table 3. Leppiniemi (2002) considers that advance
payments are liabilities from the moment they are received until the finished
goods are delivered. Yritystutkimus (2011, 48) on the other hand does not see
advance payments as liabilities when the goods are still work-in-progress.
Advance payments can also be part of long-term liabilities but the ones in current
liabilities are studied in this thesis.

22
Table 3. Balance sheet (modified from Yritystutkimus 2011, 28-29)
ASSETS LIABILITIES
Fixed assets Shareholder’s equity
Intangible assets Share capital
Tangible assets Retained earnings
Investments Profit for the period
Funds
Current assets Minority interest
Inventories Capital loans
Receivables
Current financial assets Liabilities
Cash and cash equivalents Long-term liabilities
Current liabilities
Advance payments
Advance payments are considered as a part of working capital according to
Yritystutkimus (2011, 68-69). Advance payments are reducing the amount of
working capital needed. Advance payments are therefore one form of financing to
the companies. Companies do not necessarily need to take any other liabilities to
finance their working capital. Advance payments are also affecting profitability
not only working capital. Advance payments can be considered as a one
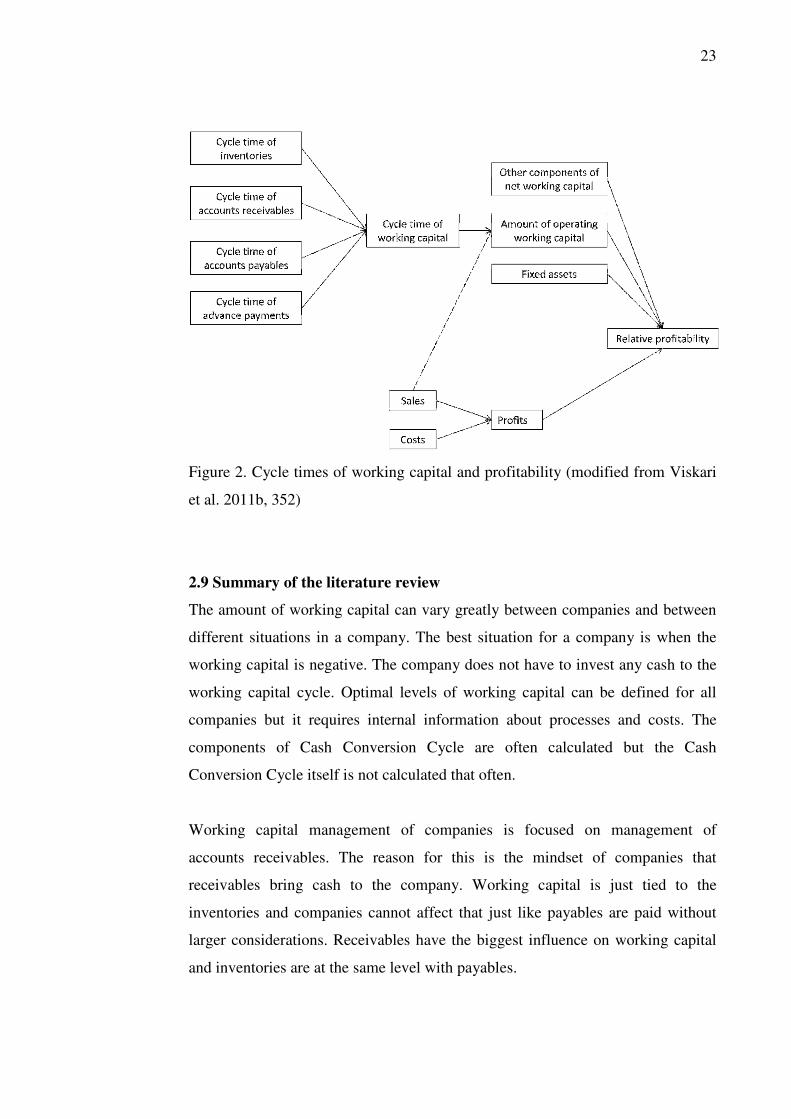
component of working capital and thus figure 2 can be drawn.
23
Figure 2. Cycle times of working capital and profitability (modified from Viskari
et al. 2011b, 352)
2.9 Summary of the literature review
The amount of working capital can vary greatly between companies and between
different situations in a company. The best situation for a company is when the
working capital is negative. The company does not have to invest any cash to the
working capital cycle. Optimal levels of working capital can be defined for all
companies but it requires internal information about processes and costs. The
components of Cash Conversion Cycle are often calculated but the Cash
Conversion Cycle itself is not calculated that often.
Working capital management of companies is focused on management of
accounts receivables. The reason for this is the mindset of companies that
receivables bring cash to the company. Working capital is just tied to the
inventories and companies cannot affect that just like payables are paid without
larger considerations. Receivables have the biggest influence on working capital
and inventories are at the same level with payables.

24
Reductions of working capital can increase profitability of a company. There are
results from several researches that working capital and profitability are linked
together. The results indicate that efficient working capital management can
increase profitability and add a larger cash flow to the company. Companies have
to ensure the liquidity and not only profitability by reasonable working capital
management in order to keep the company running. The company may fall in to
problems if they do not have enough cash and they have poor profitability.

25
3 ANALYSIS OF THE ADVANCE PAYMENTS
3.1 Modified Cash Conversion Cycle
Modified Cash Conversion Cycle (mCCC) is an advanced version from the Cash
Conversion Cycle. mCCC takes into consideration also the received advance
payments which are normally left out from the calculation of working capital. The
reason why they are not used is the fact that they were not included in the first
research conducted by Richards and Laughlin. The CCC was originally used in
scientific research to calculate long stock exchange lists during a longer time
period. These days CCC is widely used in business life to evaluate the levels of
working capital. Therefore companies should calculate DAO and mCCC instead
of CCC because many companies have significant amounts of advance payments.
Advance payments, one part of the short time assets, can shorten the cycle time
many days because the company will receive cash earlier than in the usual cycle.
The needed amount of working capital will be then reduced and it might
sometimes even turn negative. The mCCC will therefore give a more accurate
view of the working capital for the companies. mCCC can be seen from the figure
3.
mCCC is calculated through the same pattern than CCC. First all the components
of mCCC are calculated. The components DIO, DSO and DPO are calculated
similarly than in CCC. Days of Advance Payments Outstanding (DAO) is the only
new component. DAO is calculated by dividing the amount of advance payments
in a year with the same year’s turnover. The plain number is then multiplied with
365 days. DAO is then reduced from the CCC. The equation is presented below.
��� = ��� + ��� − �� − ��� (5)
��� = �!���� �� ��� × 365
� ���� � (6)
26
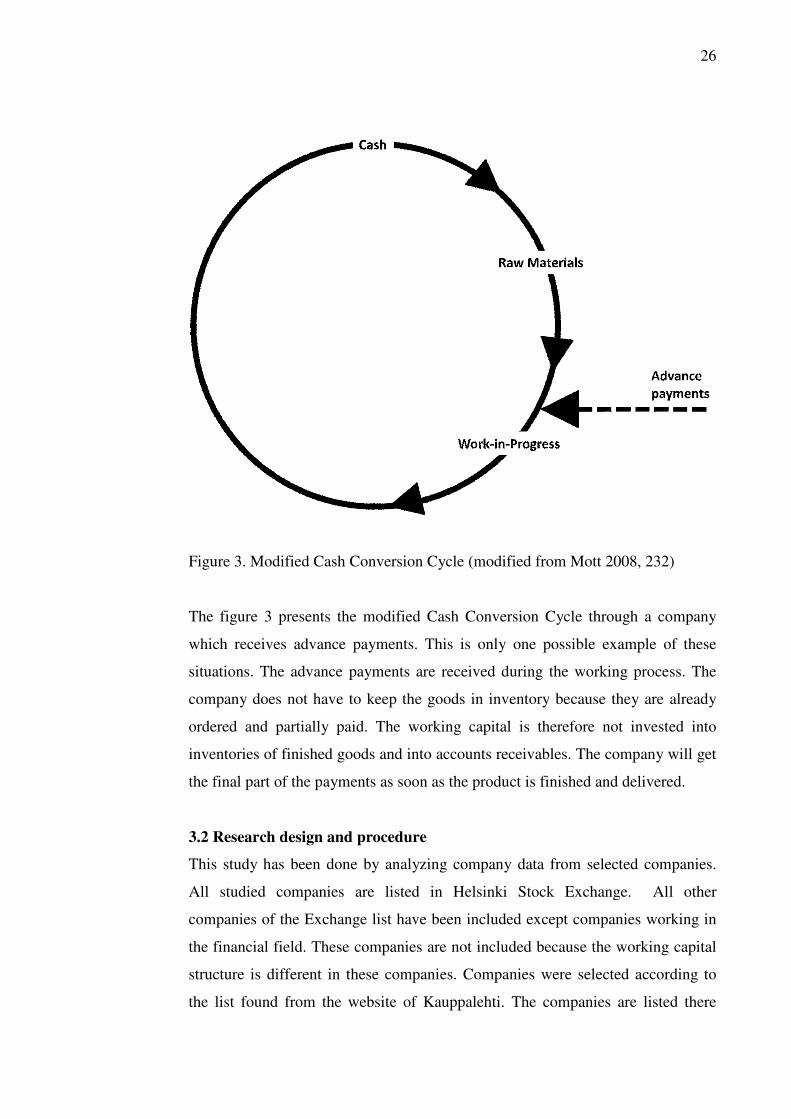
Figure 3. Modified Cash Conversion Cycle (modified from Mott 2008, 232)
The figure 3 presents the modified Cash Conversion Cycle through a company
which receives advance payments. This is only one possible example of these
situations. The advance payments are received during the working process. The
company does not have to keep the goods in inventory because they are already
ordered and partially paid. The working capital is therefore not invested into
inventories of finished goods and into accounts receivables. The company will get
the final part of the payments as soon as the product is finished and delivered.
3.2 Research design and procedure
This study has been done by analyzing company data from selected companies.
All studied companies are listed in Helsinki Stock Exchange. All other
companies of the Exchange list have been included except companies working in
the financial field. These companies are not included because the working capital
structure is different in these companies. Companies were selected according to
the list found from the website of Kauppalehti. The companies are listed there

27
according to the branches. There are two companies that were left out because of
various reasons. TeliaSonera was left out because it does not produce its financial
statements in Euros and SieviCapital is also left out because it was in 2010 still
called Scanfil. Scanfil is among the studied companies.
The data required for the study was collected from two different sources.
Information about ROI and sales were collected from the website of Kauppalehti.
Kauppalehti calculates ROI for every company the same way unlike companies
which can calculate ROI differently. This way it was ensured that the data was
comparable. All other data was recovered from the annual reports of the
companies. The reports were found in their websites. The data was collected
during January 2012. The website of Kauppalehti was at that point free of
registration and fees. The used data is from the year 2010 because the annual
reports of 2011 were not published at that point. Information used for this thesis is
public and everyone can use it. All of the studied companies have made their
financial statements according to the IFRS standard. Companies may assess their
belongings differently but the basic principles are always the same. Therefore all
collected data is equal.
The research was executed in two stages. The first stage was data collection and
calculation. Data was collected from previously presented sources. Calculation
was conducted after the data was collected. Calculation changed the raw data into
figures. The second stage is analyzing. The results of calculation were analyzed.
The findings were described and they were compared to the previous researches
presented in the beginning of this thesis.
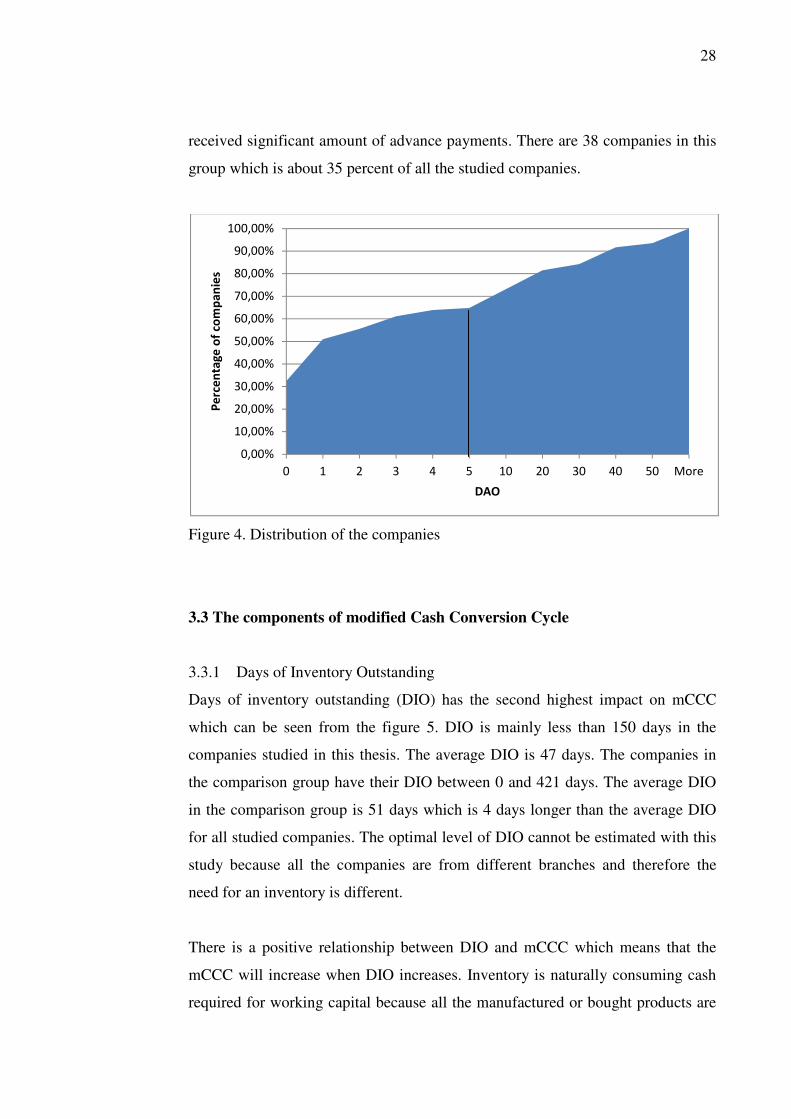
The companies in this research were divided into two groups. The allocation was
made by checking the amount of received advance payments. Histogram in the
figure 4, which has been drawn from the data, shows that about 65 percent of the
companies have DAO less than five days. The limit was then put into the five
days. A closer look was taken to a comparison group which consists of companies
that have their DAO more than five days. It can be said that these companies have
28
received significant amount of advance payments. There are 38 companies in this
group which is about 35 percent of all the studied companies.
Figure 4. Distribution of the companies
3.3 The components of modified Cash Conversion Cycle
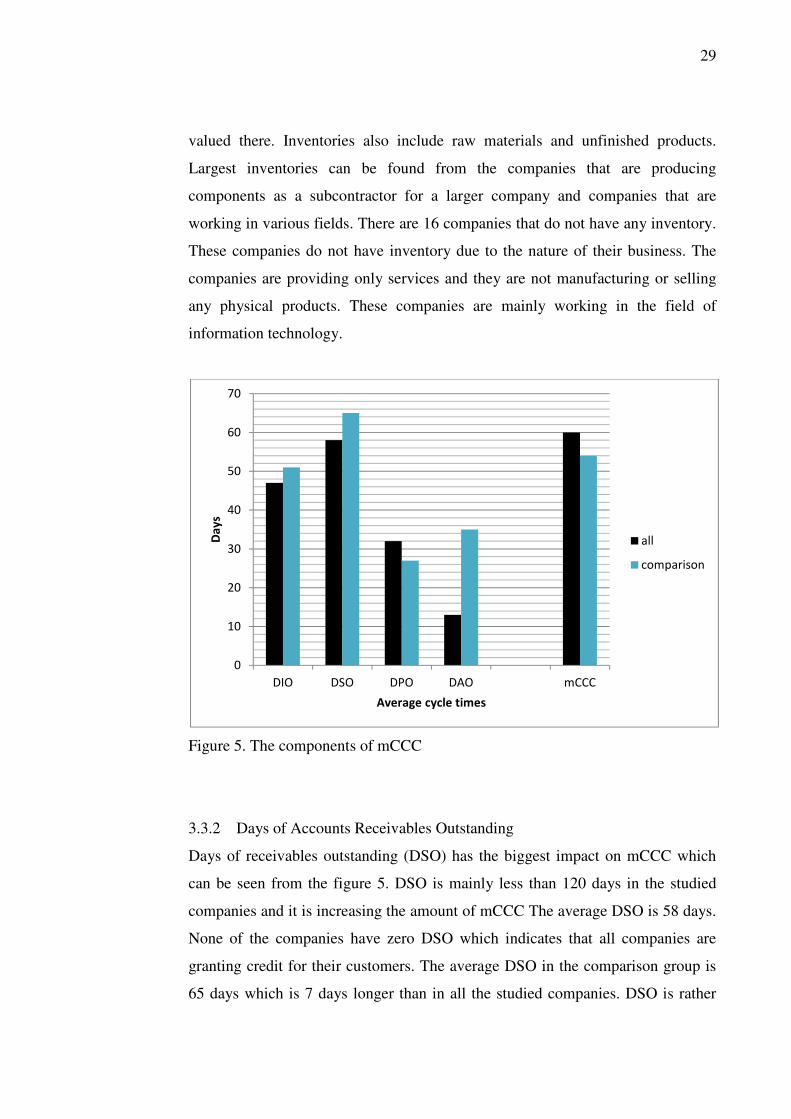
3.3.1 Days of Inventory Outstanding
Days of inventory outstanding (DIO) has the second highest impact on mCCC
which can be seen from the figure 5. DIO is mainly less than 150 days in the
companies studied in this thesis. The average DIO is 47 days. The companies in
the comparison group have their DIO between 0 and 421 days. The average DIO
in the comparison group is 51 days which is 4 days longer than the average DIO
for all studied companies. The optimal level of DIO cannot be estimated with this
study because all the companies are from different branches and therefore the
need for an inventory is different.
There is a positive relationship between DIO and mCCC which means that the
mCCC will increase when DIO increases. Inventory is naturally consuming cash
required for working capital because all the manufactured or bought products are
0,00%
10,00%
20,00%
30,00%
40,00%
50,00%
60,00%
70,00%
80,00%
90,00%
100,00%
0 1 2 3 4 5 10 20 30 40 50 More
Pe
rce
nta
ge
of
com
pa
nie
s
DAO
29
valued there. Inventories also include raw materials and unfinished products.
Largest inventories can be found from the companies that are producing
components as a subcontractor for a larger company and companies that are
working in various fields. There are 16 companies that do not have any inventory.
These companies do not have inventory due to the nature of their business. The
companies are providing only services and they are not manufacturing or selling
any physical products. These companies are mainly working in the field of
information technology.
Figure 5. The components of mCCC
3.3.2 Days of Accounts Receivables Outstanding
Days of receivables outstanding (DSO) has the biggest impact on mCCC which
can be seen from the figure 5. DSO is mainly less than 120 days in the studied
companies and it is increasing the amount of mCCC The average DSO is 58 days.
None of the companies have zero DSO which indicates that all companies are
granting credit for their customers. The average DSO in the comparison group is
65 days which is 7 days longer than in all the studied companies. DSO is rather
0
10
20
30
40
50
60
70
DIO DSO DPO DAO mCCC
Da
ys
Average cycle times
all
comparison

30
long because the average credit time in Finland varies between 7 and 28 days. The
shortest receivables collection times can be found from companies that are
working close to consumers and longest receivable collection times can be found
from companies that are doing business in the information technology sector.
The long DSO indicates that companies have difficulties to collect their
receivables in time. Some of the long credit times can be explained with foreign
sales. There are several countries where companies are used to get longer credit
times and therefore they are not paying their bills on time. Companies may also
grant longer credit times for these companies. One of the reasons for receivable
collecting times is the current economic situation. There are companies that do not
have any cash to pay the products or services they are bought. They will not get
any credit from financial institutions so their only change is to use credit granted
by their suppliers. This way they will ensure their working capital levels. The
companies might also have difficulties to collect cash payments and therefore they
will end up having receivables. Companies used to grant cash discounts to their
buyers if they pay their purchase immediately or within the next seven days. It
used be very profitable for the buyer the use this discount but these days only few
companies can take advantage of the discounts. This is an effect caused by the
financial crisis.
Previous researches indicate that companies concentrate on managing receivables
even they would not otherwise manage working capital at all. Receivables bring
cash to the companies and the concentration can be therefore easily explained.
This study shows that receivables are the most significant factor in working
capital. The company has to manage them properly in order to minimize the
working capital. Holistic view over working capital is still the best approach to
working capital management because all components of working capital needs to
be considered.

31
3.3.3 Days of Accounts Payables Outstanding
Days of payables outstanding (DPO) has the third highest impact on mCCC
among all companies and the fourth highest impact on comparison group. The
difference can be seen from the figure 5. DPO is less than 60 days in most of the
companies studied in this thesis. The average DPO is 32 days. The average DPO
in the comparison group is 27 days which is 5 days shorter than the average DPO
for all companies. These days a normal credit time is somewhere between 7 and
28 days so the average time is a bit long. Most of the companies are granting 28
days for their customers to pay their bills. But it is not by any means a standard.
This credit time is shortening all the time and the financial crisis decreased it even
more. 14 days is probably the most popular credit time in the business-to-business
environment. There same reasons for the behavior of accounts payables than
accounts receivables because they are the same payment only looked from
different sides of the coin. Companies that work closer to consumers have also
shorter DPO.
mCCC and DPO has positive relationship which means that mCCC is increasing
when DPO is increasing. This is controversial to the previous researches that
indicate that mCCC will decrease when DPO is increasing. The definition of
mCCC, as well as CCC, indicates that payables are subtracted from inventories
and receivables. Companies should always use the longest possible payment times
if the cash discounts are not significant. The company can ensure better liquidity
if the payables are extended.
3.3.4 Days of Advance Payments Outstanding
Days of advance payments outstanding (DAO) has a higher impact on comparison
group than among all studied companies. This can be seen from the figure 5.
DAOis less than 50 days among most of the companies that are receiving advance
payments and that are studied in this thesis. The average DAO is 13 days. mCCC
and DAO has a negative relationship which means that mCCC is reducing when
DAO is increasing The average DAO in the comparison group is 35 days which is
22 days longer than within all the studied companies. There are 73 companies that

32
are receiving advance payments of some sort which is 68 percent of all the studied
companies. Most of the companies do not receive large amounts of advance
payments because the focus of cash transactions is still after the product has
changed its owner. The longest DAO can be found from the companies that are
working in the project business.
There are various reasons for receiving advance payments. Smoothing of the cash
flow can be seen as a one major factor for advance payments. Advance payments
are helping both the producer as well as the customer to keep their finance in
balance. Customers do not have to pay enormous amount of cash at once instead
they can pay the cash in small portions. The advance payments are beneficial for
the receiver as well because they are reducing the need of working capital.
Basically the producer does not need as much cash of their own as they would
without the advance payments. The advance payments are a necessity in situations
where the company just does not have enough working capital to start with. The
companies that are working with private customers are using advance payments to
secure the cash flow. Airline tickets for example are bought before the flight so
that the company can make sure they get cash from all the customers on board.
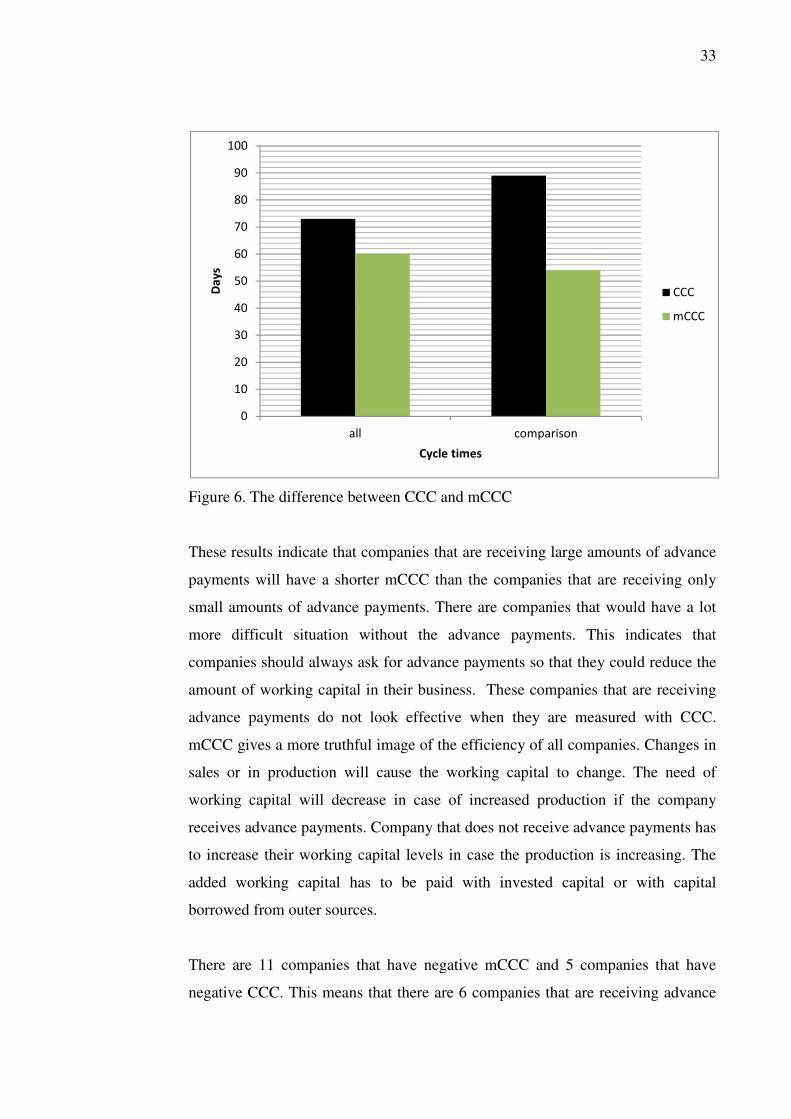
3.4 The difference between CCC and mCCC
Average CCC in this studied data is 73 days and the average mCCC is 60 days.
Average mCCC is 82 percent of CCC. These findings indicate that advance
payments really help companies with working capital. The advanced payments are
dropping the need of working capital by 13 days. The companies need almost a
fortnight’s amount of less working capital to run their businesses. There is also a
difference between CCC and mCCC in the comparison group. The average CCC
in the comparison group is 89 days and the average mCCC is 54 days. mCCC is
60 percent out of CCC and the difference between these two is 35 days. The
relationship of CCC and mCCC can be seen from the figure 6.
33
Figure 6. The difference between CCC and mCCC
These results indicate that companies that are receiving large amounts of advance
payments will have a shorter mCCC than the companies that are receiving only
small amounts of advance payments. There are companies that would have a lot
more difficult situation without the advance payments. This indicates that
companies should always ask for advance payments so that they could reduce the
amount of working capital in their business. These companies that are receiving
advance payments do not look effective when they are measured with CCC.
mCCC gives a more truthful image of the efficiency of all companies. Changes in
sales or in production will cause the working capital to change. The need of
working capital will decrease in case of increased production if the company
receives advance payments. Company that does not receive advance payments has
to increase their working capital levels in case the production is increasing. The
added working capital has to be paid with invested capital or with capital
borrowed from outer sources.
There are 11 companies that have negative mCCC and 5 companies that have
negative CCC. This means that there are 6 companies that are receiving advance
0
10
20
30
40
50
60
70
80
90
100
all comparison
Da
ys
Cycle times
CCC
mCCC
34
payments so much that their need for working capital is negative. These 11
companies do not need any working capital because their customers and suppliers
are paying for them. Negative cycle time is a good thing because companies do
not need any working capital. It has usually been considered that if companies
have negative CCC they get longer period to pay their bills than they request from
their customers. Advance payments change this setting. Company can receive
advance payments before the capital is contracted into the inventories. They do
not need long period to pay their bills because they already have sufficient amount
of cash to conduct their work.
REL has made working capital benchmarking for one thousand largest companies
in United States of America. Cycle times for working capital were calculated
using data from the years 2008 and 2009. The average CCC for all industries was
35.4 days in 2008 and 38.3 days in 2009. (The Controller’s Report 2010, 5-6)
These cycle times are significantly lower than cycle times discovered in this
study. The difference might be explained by the varying working capital
structures in different countries and with the smaller sample size. There are
researches that present that the average CCC in pulp and paper industry is 63 days
and in automotive industry 67 days (Pirttilä et al. 2010, 9; Lind et al. 2012, 8).
These figures are close to the figures discovered in this study. The discovered
CCC is a bit longer than these and mCCC is a bit shorter than the CCC indicated
in these studies. Figure 7 gives more information about the differences between
CCC and mCCC. The figures are average figures among all studied companies.
This comparison reflects that working capital structures are variable in different
branches.

35
Figure 7. CCC and mCCC
3.5 Branches with advance payments
Companies that have DAO more than five days mainly work in the project
business but there is also remarkable amount of companies from the ICT and
publishing industries. This group also includes companies from the manufacturing
industry as well as mining and service industries. The companies are divided into
two categories for further research; project companies and other companies. There
are 13 project companies and 25 other companies. This research concentrates to
project companies but there are also closer looks to ICT and publishing
companies.
All these three industries; project, ICT and publishing, receive a lot advance
payments. There are different and similar reasons for receiving advance payments
in all these industries. There are similarities in project and ICT industries because
some ICT companies conduct only projects. Most ICT companies provide only
services, not products and sometimes the services are done project based.
-60
-40
-20
0
20
40
60
80
100
120
CCC CCC mCCC mCCC
Da
ys
Average cycle times
mCCC
CCC
DAO
DPO
DSO
DIO

36
Publishing companies are different because they do not do projects. Book
publishing could be considered as projects but for the companies it is just regular
continuous business. They are printing books all the time, only the book title
changes.
Project companies do not necessarily have enough equity to finance different
steps of the project. Construction companies for example need a lot of money to
buy the materials for the project. They do not necessarily have enough working
capital to cover the expenses so they need the customer to pay advance payments.
The companies also need less working capital which is good because they can
invest the money to get more profit. The amount of advance payments is not
constant. Companies negotiate with customers about the needed level of advance
payments. Advance payments are usually some percentage of the total price of the
project. Advance payments might also be paid in several steps of the project.
One reason for the advance payments is commitment. Large scale projects take
several years to finish and they require huge amounts of money and working
hours. Project companies need to commit the customer to the project so the
customer will not change the company providing the project. Customers may find
a cheaper option to carry out the project. Project companies cannot sell the
finished product or service to the next client unlike production companies can.
Project company has then made redundant work that will affect their financial
status. Customers that pay advance payments will be more committed to the
project because they already have invested money to the project.
Publishing is the only branch with advance payments that is close to consumers.
They are publishing almost exclusively to consumers. Magazines and newspapers
are usually paid in advance in order to get it delivered at home. Annual
subscriptions are also often cheaper than single copies. Books are usually paid
when they are purchased from the bookstore or from the Internet. One of the
biggest reasons for this advance payment system is custom. People are used to pay
in advance and they do not see it strange. Individual consumers also do not have

37
any influence in large publishing companies in order to change the system. The
system is very affordable for publishing companies because they get the cash in
advance. They will easily achieve negative cycle times which are always good for
the companies.
The reason why advance payments concentrate into particular branches is not
clear. Project companies in ICT and construction branches receive a lot of them
but why not wholesale traders? They have to purchase the products with their own
capital and they will get cash from the products after they have sold them. The
branches where there is no custom for advance payments will have difficulties in
asking for advance payments because the customers are not used to them.
Competition in a branch is also one determining factor for advance payments.
Companies with unique products can do almost anything they want but companies
in very competitive branches with bulk products do not have a chance.
3.6 Profitability and advance payments
Working capital affects profitability of a company according to previous
researches and the question in this thesis is that how does advance payments
affect the profitability. Several researches indicate that CCC and profitability have
a negative relationship. The shorter the CCC more profitable the company will be.
The study in thesis indicates that mCCC, as well as CCC, and profitability have a
positive relationship. ROI increases when the mCCC increases. There is a
negative correlation between advance payments and profitability. The relationship
can be seen from the figure 8. This is controversial to the previous researches. The
explanation for these findings could be found from the financial situation in year
2010. There was still a financial crisis in Finland. The reason why companies
seem to be unprofitable is the fact that they are reducing profitability in order to
increase liquidity. Liquidity is considered more important than profitability
especially during financial crises.
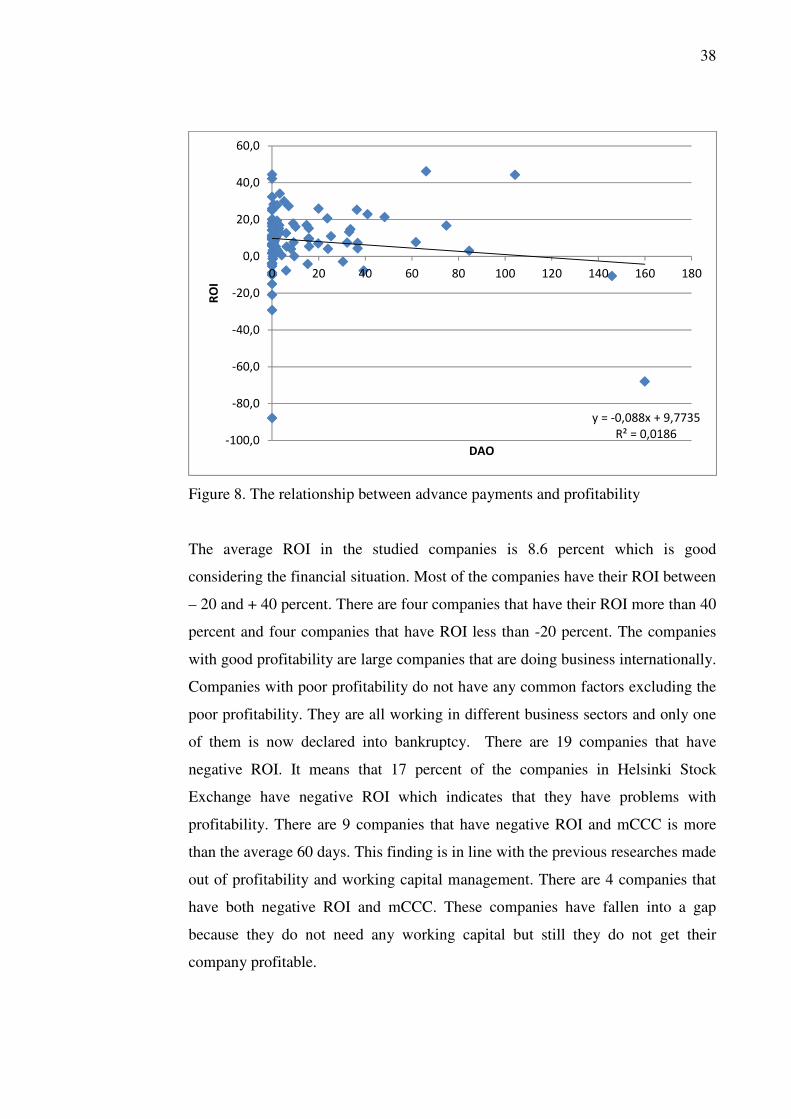
38
Figure 8. The relationship between advance payments and profitability
The average ROI in the studied companies is 8.6 percent which is good
considering the financial situation. Most of the companies have their ROI between
– 20 and + 40 percent. There are four companies that have their ROI more than 40
percent and four companies that have ROI less than -20 percent. The companies
with good profitability are large companies that are doing business internationally.
Companies with poor profitability do not have any common factors excluding the
poor profitability. They are all working in different business sectors and only one
of them is now declared into bankruptcy. There are 19 companies that have
negative ROI. It means that 17 percent of the companies in Helsinki Stock
Exchange have negative ROI which indicates that they have problems with
profitability. There are 9 companies that have negative ROI and mCCC is more
than the average 60 days. This finding is in line with the previous researches made
out of profitability and working capital management. There are 4 companies that
have both negative ROI and mCCC. These companies have fallen into a gap
because they do not need any working capital but still they do not get their
company profitable.
y = -0,088x + 9,7735
R² = 0,0186-100,0
-80,0
-60,0
-40,0
-20,0
0,0
20,0
40,0
60,0
0 20 40 60 80 100 120 140 160 180
RO
I
DAO

39
Increase in DAO increases ROI in project companies but other studied companies
had their results other way around. Increase in DAO means decrease in ROI
which can be seen from the figure 9. These findings are a bit controversial to the
results of all the studied companies. The project companies are behaving like all
studied companies and other companies in comparison group are going in the
same lines than the previous studies show. This setting is very interesting and it is
challenging to find reasons for this. There are no clear patterns that could be seen
in the behavior of these companies.
Figure 9. The relationship between advance payments and profitability in the
comparison group
The average ROI in the comparison group is 10 percent. It is a bit better compared
to all studied companies. The variation of ROI is as large as in the whole group.
The ROI varies between -68 percent and 46.2 percent. Six companies out of 38
researched companies had negative ROI. Two companies had both negative ROI
and negative mCCC. These two companies have many financial problems due to
the financial crisis. Changes in working capital management would not affect
y = -0,2362x + 17,338
R² = 0,2657
y = 0,5438x - 8,6349
R² = 0,3941
-80,0
-60,0
-40,0
-20,0
0,0
20,0
40,0
60,0
0 50 100 150 200
RO
I
DAO
other
project
Linear
(other)

40
mCCC or ROI. The other four companies have still hope because they have
enough amount of working capital to keep the business going although they are
not profitable at this point. Publishing companies have profitability problems most
likely because customers are more reserved during financial crisis. One part of the
problems in ICT companies has the companies’ decisions to move the production
from Europe to Asia. There are several factors affecting the poor profitability and
the ones mentioned here are only parts of the factors.
3.7 Future research
This research was conducted using only 108 companies. The sample size was
fairly small and therefore a larger sample size in the future research would be
necessary in order to reduce the possible distortion. The sample size could be
grown be taking other Finnish companies that are not listed in the Helsinki Stock
Exchange. Other companies are not required to do their financial statements
according to the IFRS standard and that would make the research more difficult.
The most feasible enlargement would be companies from other stock exchanges.
The information would be easily available and it would have been easy to analyze.
Multinational sample would also bring the possibility to compare the results
between different countries. This study has shown that there are not so many
branches which are actively using advance payments in their business. The
situation might be different in other countries. Multinational sample would also
give a possibility to test mCCC in a larger scale. It is difficult to execute a
research that would be wide enough but already few countries would help.
The research in this thesis was conducted by using data from the year 2010.
Financial crisis was still on in Finland and therefore these results are not the best
ones to provide the general picture of advance payments in working capital
management. Longer time frame would give more accurate results and therefore
the time frame should also include years before, after and during the financial
crisis. Longer time frame would also give more information about the changes in
advance payments. The amount of advance payments may vary from year to year

41
and the longer time frame would be ideal to discover the mean for advance
payments.
Project companies are receiving advance payments more than companies in other
branches. The future research could go more deeply into the working capital
management of project companies. There are differences between the types of the
projects these companies are executing and there could also be changes in
working capital management and especially the role of advance payments is
probably different among these companies. The difficulty is to find companies
that are doing only project business. Projects might be only one part of the
business the company is conducting.
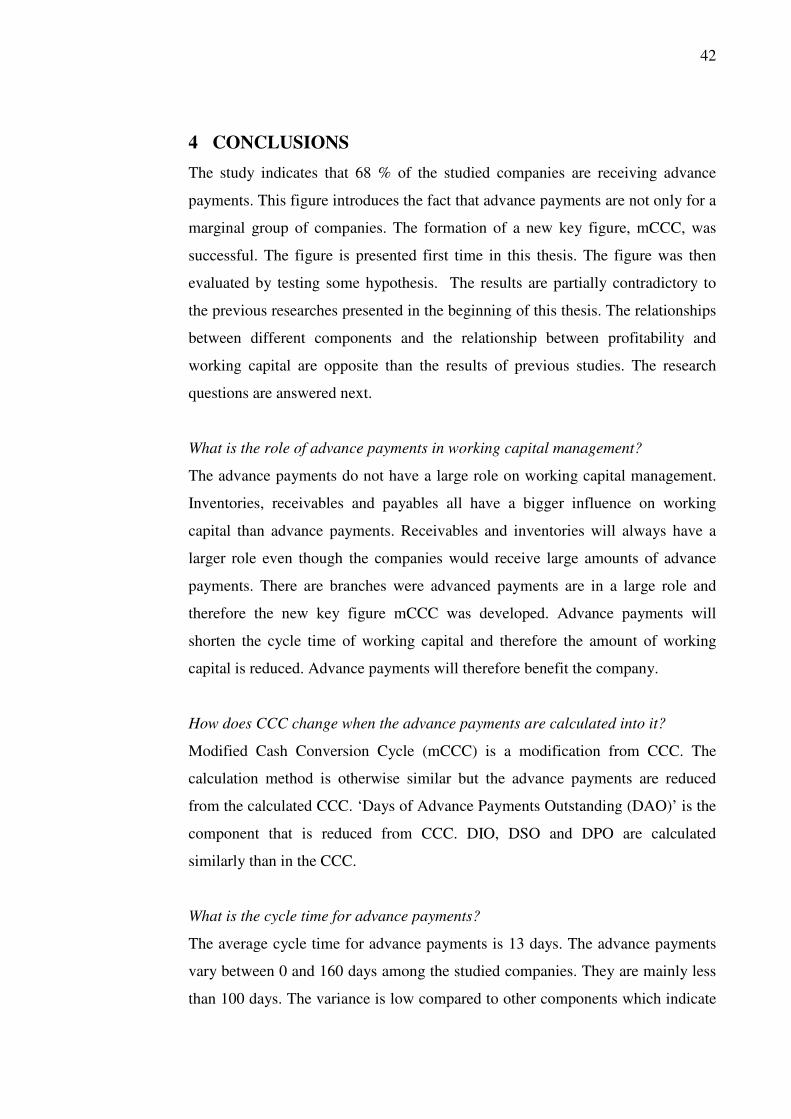
42
4 CONCLUSIONS
The study indicates that 68 % of the studied companies are receiving advance
payments. This figure introduces the fact that advance payments are not only for a
marginal group of companies. The formation of a new key figure, mCCC, was
successful. The figure is presented first time in this thesis. The figure was then
evaluated by testing some hypothesis. The results are partially contradictory to
the previous researches presented in the beginning of this thesis. The relationships
between different components and the relationship between profitability and
working capital are opposite than the results of previous studies. The research
questions are answered next.
What is the role of advance payments in working capital management?
The advance payments do not have a large role on working capital management.
Inventories, receivables and payables all have a bigger influence on working
capital than advance payments. Receivables and inventories will always have a
larger role even though the companies would receive large amounts of advance
payments. There are branches were advanced payments are in a large role and
therefore the new key figure mCCC was developed. Advance payments will
shorten the cycle time of working capital and therefore the amount of working
capital is reduced. Advance payments will therefore benefit the company.
How does CCC change when the advance payments are calculated into it?
Modified Cash Conversion Cycle (mCCC) is a modification from CCC. The
calculation method is otherwise similar but the advance payments are reduced
from the calculated CCC. ‘Days of Advance Payments Outstanding (DAO)’ is the
component that is reduced from CCC. DIO, DSO and DPO are calculated
similarly than in the CCC.
What is the cycle time for advance payments?
The average cycle time for advance payments is 13 days. The advance payments
vary between 0 and 160 days among the studied companies. They are mainly less
than 100 days. The variance is low compared to other components which indicate
43
that advance payments are important only in some branches. 32 percent of the
companies did not receive advance payments during the studied year and therefore
the average is fairly low. The average cycle time in the comparison group, which
includes only companies with more than 5 days worth of advance payments, was
35 days.
Have companies with advance payments centered in some particular branches?
There are three branches where companies receive more advance payments than
average companies in other branches. Project business uses advance payments
widely as well as ICT and publishing companies. These companies should take
advance payments into a account and calculate mCCC instead of CCC when
measuring cycle time for operational working capital management.
Do advance payments affect profitability?
There is a negative correlation between advance payments and profitability. The
results of this study indicate that profitability increases when working capital
increases. Advance payments would reduce the amount of working capital as well
as profitability according to this study.

44
REFERENCES
Appuhami, R. 2008. The Impact of Firms’ Capital Expenditure on Working
Capital Management: An Empirical Study across Industries in Thailand.
International Management Review, vol. 4, no. 1, pp. 11-24.
Bougheas, S., Mateut, S. & Mizen, P. 2009. Corporate trade credit and
inventories: New evidence of a trade-off from accounts payable and receivable.
Journal of Banking and Finance, vol. 33, no. 2, pp. 300-307.
Chiou, J.-R., Cheng, L. & Wu, H.-W. 2006. The Determinants of Working Capital
Management. Journal of American Academy of Business, vol. 10, no. 1, pp. 149-
155.
Creswell, J. W. 2003. Research design: Qualitative, Quantitative and Mixed
Methods Approaches. 2nd
edition. Thousand Oaks (CA): Sage Publications.
Creswell, J. W. & Plano Clark, V. L. 2011. Designing and Conducting Mixed
Methods Research. 2nd
edition. Thousand Oaks (CA): Sage Publications.
Deloof, M. 2003. Does Working Capital Management Affect Profitability of
Belgian Firms? Journal of Business Finance & Accounting, vol. 30, no. 3, pp.
573-587.
Dong, H. P. & Su, J.-T. 2010. The Relationship between Working Capital
Management and Profitability: A Vietnam Case. International Research Journal
of Finance and Economics, no. 49, pp. 59-67.
Eljelly, A. M. A. 2004. Liquidity – profitability tradeoff: an empirical
investigation in an emerging market. International Journal of Commerce and
Management, vol. 14, no. 2, pp. 48-61.

45
Farris, M. T. & Hutchison, P. D. 2003. Measuring Cash-to-Cash Performance.
International Journal of Logistics Management, vol. 14, no. 2, pp. 83-91.
Filbeck, G. & Krueger, T. M. 2005. An Analysis of Working Capital Management
Results Across Industries. Mid-American Journal of Business, vol. 20, no. 2, pp.
11-18.
Filbeck, G., Krueger, T. & Preece, D. 2007. CFO Magazine’s “Working Capital
Survey”: Do Selected Firms Work for Shareholders? Quarterly Journal of
Business and Economics, vol. 46, no. 1, pp. 3-22.
García-Teruel, P. J. & Martínez-Solano, P. 2007. Effects of working capital
management on SME profitability. International Journal of Managerial Finance,
vol. 3, no. 2, pp. 164-177.
Gentry, J. A., Vaidyanathan, R. & Lee, H. W. 1990. A Weighted Cash Conversion
Cycle. Financial Management, vol. 14, no. 4, pp. 90-99.
Hampton, J. J. 1983. Financial Decision Making – Concepts, Problems & Cases.
3rd
edition. Reston (VA): Reston Publishing Company.
Hill, M. D., Kelly, G. W. & Highfield, M. J. 2010. Net Operating Working
Capital Behavior: A First Look. Financial Management, vol. 39, no. 2, pp. 783-
805.
Howorth, C. & Westhead, P. 2003. The focus of working capital management in
UK small firms. Management Accounting Research, vol. 14, no. 2, pp. 94-111.
Hutchison, P. D., Farris, M. T. & Anders, S. B. 2007. Cash-to-Cash Analysis and
Management. CPA Journal, vol. 77, no. 8, pp. 42-47.

46
Kaiser, K. & Young, S. D. 2009. Need Cash? Look Inside Your Company.
Harvard Business Review, vol. 87, no. 5, pp. 64-71.
Kaur, J. 2010. Working Capital Management in Indian Tyre Industry.
International Research Journal of Finance and Economics, no. 46, pp. 7-31.
Kieschnick, R., LaPlante, M. & Moussawi, R. 2011. Working Capital
Management and Shareholder Wealth. SSRN Working Paper Series.
Kumar, V. S. S., Hanna, A. S. & Adams, T. 2000. Assesment of working capital
requirements by fuzzy set theory. Engineering, Construction and Architectural
Management, vol. 7, no. 1, pp. 93-103.
Lazaridis, I. & Tryfonidis, D. 2006. Relationship between Working Capital
Management and Profitability of Listed Companies in the Athens Stock
Exchange. Journal of Financial Management and Analysis, vol. 19, no. 1, pp. 26-
35.
Leppiniemi, J. 2002. Maksetut ennakot ovat tärkeä erä. Taloussanomat. [e-
journal] Updated Nov 19th
, 2002. [retrieved Oct 16th
, 2012] From:
http://www.taloussanomat.fi/arkisto/2002/11/19/maksetut-ennakot-ovat-tarkea-
era/200223839/12
Lind, L., Pirttilä, M., Viskari, S., Schupp, F. and Kärri, T. 2012. Working capital
management in the automotive industry: Financial value chain analysis, Journal of
Purchasing and Supply Management , vol. 18, no. 2, pp. 92-100.
Long, M. S., Malitz, I. B. & Ravid, S. A. 1993. Trade Credit, Quality Guarantees
and Product Marketability. Financial Management, vol. 22, no. 4, pp. 117-127.
47
Mathuva, D. M. 2010. The Influence of Working Capital Management
Components on Corporate Profitability: A Survey on Kenyan Listed Firms.
Research Journal of Business Management, vol. 4, no. 1, pp. 1-11.
Meszek, W. & Polewski, M. 2006. Certain aspects of working capital in a
construction company. Ükio technologinis ir ekonomis vystymas, vol. 12, no. 3,
pp. 222-226.
Michalski, G. 2008. Liquidity or profitability: financial effectiveness of
investments in working capital. Sbornik Prispevku Z Mezinarodni Vedecke
Konference, June 25 – June 26, Brno, Czech Republic, pp. 129-138.
Mojtahedzadeh, V., Tabari, S. H. A. & Mosayebi, R. 2011. The Relationship
between Working Capital Management and Profitability of the Companies (Case
Study: Listed Companies on TSE). International Research Journal of Finance
and Economics, no. 76, pp. 158-166.
Molina, C. A. & Preve, L. A. 2009. Trade Receivables Policy of Distressed Firms
and Its Effects on the Costs of Financial Distress. Financial Management, vol. 38,
no. 3, pp. 663-686.
Mott, G. 2008. Accountig for Non-Accountants: A Manual for Managers and
Students. 7th
edition. London: Kogan Page.
Mullins, J. W. 2009. Capital is king! Business Strategy Review, vol. 20, no. 4, pp.
5-8.
Nazir, M. S. & Afza, T. 2009. Impact of Aggressive Working Capital
Management Policy on Firms’ Profitability. IUP Journal of Applied Finance, vol.
15, no. 8, pp. 19-30.
48
Nobanee, H. & AlHajjar, M. 2010a. Optimizing Working Capital Management.
SSRN Working Paper Series.
Nobanee, H. & AlHajjar, M. 2010b. A Note on Working Capital Management and
Corporate Profitability of Japanese Firms. SSRN Working Paper Series.
Noreen, U., Khan, S. K. & Abbas, Q. 2009. International Working Capital
Practices in Pakistan. International Research Journal of Finance and Economics,
no. 32, pp. 160-170.
Padachi, K., Narasimhan, M. S., Durbarry, R. & Howorth, C. 2008. An Analysis
of Working Capital Structure and Financing Pattern of Mauritanian Small
Manufacturing Firms. Icfai Journal of Applied Finance, vol. 14, no. 7, pp. 41-62.
Payne, S. 2002. Working Capital Optimization Can Yield Real Gains. Financial
Executive, vol. 18, no. 6, pp. 40-42.
Peel, M. J., Wilson, N. & Howorth, C. 2000. Late Payment and Credit
Management in the Small Firm Sector: Some Empirical Evidence. International
Small Business Journal, vol. 18, no. 2, pp. 17-37.
Pirttilä, M., Viskari, S. & Kärri, T. 2010. Working Capital in the Value Chain:
Cycle Times of Pulp and Paper Industry. Proceedings of 19th Annual IPSERA
Conference, May 16-19, 2010, Lappeenranta, pp. 365-377.
Proctor, R. 2006. Managerial Accounting for Business Decisions. 2nd edition.
Harlow: Pearson Education.
Raheman, A. & Nasr, M. 2007. Working Capital Management and Profitability –
Case of Pakistani Firms. International review of Business Research Papers, vol.
3, no. 1, pp. 279-300.

49
Raheman, A., Qayyum, A., Afza, T. & Bodla, M. A. 2010. Sector-wise Analysis
of Working Capital Management and Firm Performance in Manufacturing Sector
of Pakistan. Interdisciplinary Journal of Contemporary Research in Business, vol.
2, no. 7, pp. 412-437.
Reilly, G. P. & Reilly, R. R. 2002. Performance measurement for improved
working-capital management. Journal of Cost Management, vol. 47, no. 3, pp. 13-
20.
Ricci, C. & Di Vito, N. 2000. International working capital practices in the UK.
European Financial Management, vol. 6, no. 1, pp. 69-84.
Richards, V. R. & Laughlin, E. J. 1980. A Cash Conversion Cycle Approach to
Liquidity Analysis. Financial Management, vol. 9, no. 1, pp. 32-38.
Salminen, A. 2011. Mikä kirjallisuuskatsaus? Johdatus kirjallisuuskatsauksen
tyyppeihin ja hallintotieteellisiin sovelluksiin. Vaasa: Vaasan Yliopisto.
Opetusjulkaisuja 62.
Sharma, A. K. & Kumar, S. 2011. Effect of Working Capital Management on
Firm Profitability: Empirical Evidence from India. Global Business Review, vol.
12, no. 1, pp. 159-173.
Shin, H.-H. & Soenen, L. 1998. Efficiency of Working Capital Management and
Corporate Profitability. Financial Practice and Education, vol. 8, no. 2, pp. 37-
45.
Steyn, W., Hamman, W. D. & Smit, E. M. 2002. The danger of high growth
combined with a large non-cash working capital base – a descriptive analysis.
South African Journal of Business Management, vol. 33, no. 4, pp. 41-47.
50
Strischek, D. 2001. A Banker’s Perspective on Working Capital and Cash Flow
Management. Strategic Finance, vol. 83, no. 4, pp. 38-44.
Tahir, M. & Anuar, M. B. A. 2011. The Effect of Working Capital Management
on Firm’s Profitability: A Review Paper. Interdisciplinary Journal of
Contemporary Research in Business, vol. 3, no. 4, pp. 365-376.
Talha, M., Christopher, S. B. & Kamalavalli, A. L. 2010. Sensitivity of
profitability to working capital management: a study of Indian corporate hospitals.
International Journal of Managerial and Financial Accounting, vol. 2, no. 3, pp.
213-227.
Uyar, A. 2009. The Relationship of Cash Conversion Cycle with Firm Size and
Profitability: An Empirical Investigation in Turkey. International Research
Journal of Finance and Economics, no. 24, pp. 186-193.
Wang, Y.-J. 2002. Liquidity management, operating performance and corporate
value: evidence from Japan and Taiwan. Journal of Multinational Financial
Management, vol. 12, no. 2, pp. 159-169.
Viskari, S., Lukkari, E. & Kärri, T. 2011a. State of Working Capital Management
Research: Bibliometric study. State of working capital management research:
Bibliometric study, Middle Eastern Finance and Economics, no. 14, pp. 99-108.
Viskari, S., Pirttilä, M. & Kärri, T. 2011b. Improving profitability by managing
working capital in the value chain of pulp and paper industry. International
Journal of Managerial and Financial Accounting, vol. 3, no. 4, pp. 348-366.
Yadav, R., Kamath, V. & Manjrekar, P. 2009. Working Capital Management: A
study of Maharashtra’s bulk drugs listed companies. Chemical Business, vol. 23,
no. 7, pp. 27-34.

51
Yritystutkimus ry. 2011. Yritystutkimuksen tilinpäätösanalyysi. 9th
edition.
Helsinki: Gaudeamus.
Zikmund, W. G., Babin, B. J., Carr, J. C. & Griffin, M. 2010. Business Research
Methods. 8th
edition. Mason (OH): South-Western.

APPENDIXES
Appendix I / All studied companies
Name ROI (%) DIO DSO DPO DAO CCC mCCC
Affecto 4.3 2 99 25 37 75 38
Ahlström 6.9 38 52 54 0 36 36
Aldata Solution 5.4 2 89 22 1 69 67
Alma Media 42.2 1 27 7 0 21 21
Amer Sports 9.4 63 97 38 0 122 122
Aspo 13.0 41 36 29 3 48 45
Aspocomp Group 9.1 41 67 23 0 86 86
Atria 3.3 30 41 31 0 39 39
Basware 20.1 0 73 7 0 66 66
Biohit 5.3 48 60 17 2 91 89
Biotie Therapies -29.2 0 15 133 0 -117 -117
Cargotec 10.4 96 54 44 0 107 107
Cencorp -8.8 141 222 191 0 172 172
Componenta 9.6 34 22 42 0 13 13
Comptel 17.9 0 114 10 9 104 95
Cramo 4.0 10 78 34 8 54 46
Digia 19.3 0 61 7 2 55 52
Dovre Group 15.2 0 59 16 3 44 41
Efore 18.2 44 70 59 0 54 54
Elecster 9.6 121 106 34 16 193 177
Elektrobit -3.7 4 101 16 0 89 89
Elisa 16.9 10 67 40 3 37 34
Etteplan 16.4 0 57 21 1 36 35
Exel Composites 18.6 48 44 34 1 59 57
Finnair 0.1 9 17 8 10 18 9
Finnlines 1.8 4 35 20 0 19 19
Fiskars 16.3 68 53 24 0 97 97
Fortum 12.6 22 55 25 6 52 46
F-Secure 44.3 1 68 13 104 57 -48
GeoSentric -87.8 0 2 57 0 -55 -55
Glaston -7.7 68 82 25 39 125 86
HKScan 5.8 28 29 24 1 33 32
Honkarakenne 7.5 62 40 18 32 84 52
Huhtamäki 11.3 50 49 42 0 56 56
Ilkka-Yhtymä 9.6 6 23 9 16 20 4
Incap -15.0 81 79 56 0 104 104
Innofactor 9.6 0 144 212 0 -67 -67
Ixonos 14.2 0 81 12 0 70 70
Kemira 8.5 34 50 24 1 60 59
Keskisuomalainen 25.9 4 24 8 20 19 -1
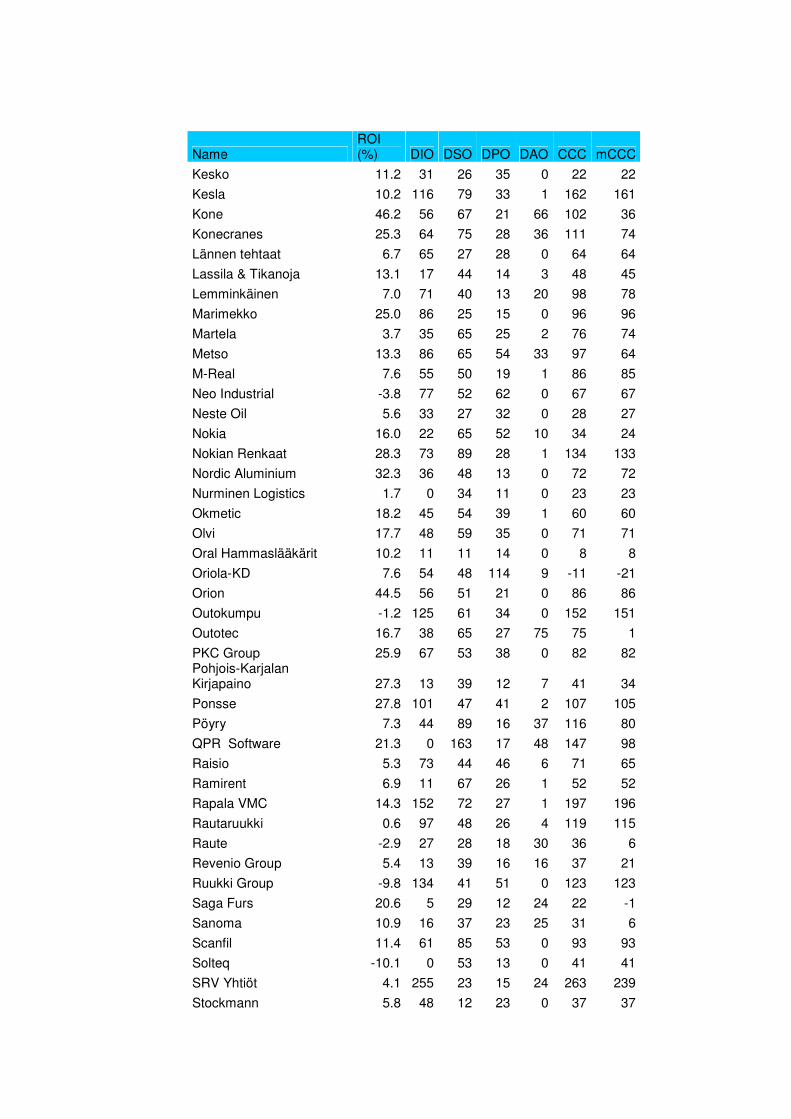
Name ROI (%) DIO DSO DPO DAO CCC mCCC
Kesko 11.2 31 26 35 0 22 22
Kesla 10.2 116 79 33 1 162 161
Kone 46.2 56 67 21 66 102 36
Konecranes 25.3 64 75 28 36 111 74
Lännen tehtaat 6.7 65 27 28 0 64 64
Lassila & Tikanoja 13.1 17 44 14 3 48 45
Lemminkäinen 7.0 71 40 13 20 98 78
Marimekko 25.0 86 25 15 0 96 96
Martela 3.7 35 65 25 2 76 74
Metso 13.3 86 65 54 33 97 64
M-Real 7.6 55 50 19 1 86 85
Neo Industrial -3.8 77 52 62 0 67 67
Neste Oil 5.6 33 27 32 0 28 27
Nokia 16.0 22 65 52 10 34 24
Nokian Renkaat 28.3 73 89 28 1 134 133
Nordic Aluminium 32.3 36 48 13 0 72 72
Nurminen Logistics 1.7 0 34 11 0 23 23
Okmetic 18.2 45 54 39 1 60 60
Olvi 17.7 48 59 35 0 71 71
Oral Hammaslääkärit 10.2 11 11 14 0 8 8
Oriola-KD 7.6 54 48 114 9 -11 -21
Orion 44.5 56 51 21 0 86 86
Outokumpu -1.2 125 61 34 0 152 151
Outotec 16.7 38 65 27 75 75 1
PKC Group 25.9 67 53 38 0 82 82 Pohjois-Karjalan Kirjapaino 27.3 13 39 12 7 41 34
Ponsse 27.8 101 47 41 2 107 105
Pöyry 7.3 44 89 16 37 116 80
QPR Software 21.3 0 163 17 48 147 98
Raisio 5.3 73 44 46 6 71 65
Ramirent 6.9 11 67 26 1 52 52
Rapala VMC 14.3 152 72 27 1 197 196
Rautaruukki 0.6 97 48 26 4 119 115
Raute -2.9 27 28 18 30 36 6
Revenio Group 5.4 13 39 16 16 37 21
Ruukki Group -9.8 134 41 51 0 123 123
Saga Furs 20.6 5 29 12 24 22 -1
Sanoma 10.9 16 37 23 25 31 6
Scanfil 11.4 61 85 53 0 93 93
Solteq -10.1 0 53 13 0 41 41
SRV Yhtiöt 4.1 255 23 15 24 263 239
Stockmann 5.8 48 12 23 0 37 37

Name ROI (%) DIO DSO DPO DAO CCC mCCC
Stonesoft -68.0 14 130 24 160 120 -40
Stora Enso 9.7 52 49 36 1 66 65
Suominen Yhtymä -3.9 51 23 25 0 49 49
Takoma -4.1 66 49 24 0 92 92
Talentum 7.7 5 39 11 62 33 -28
Talvivaara 3.0 421 126 95 85 452 367
Tecnotree -7.7 6 105 36 6 75 69
Tectia -10.7 0 112 9 146 104 -42
Tekla 34.1 0 53 7 3 47 43
Teleste 10.2 46 61 24 2 83 81
Tieto 17.0 0 78 20 15 59 44
Tiimari -5.3 70 9 54 0 24 24
Tikkurila 20.1 48 43 24 0 66 66
Trainers' House -1.3 0 58 16 0 43 42
Tulikivi 0.0 71 33 18 0 86 86
Turvatiimi -20.9 1 41 6 0 36 36
UPM-Kymmene 6.6 53 51 29 0 75 75
Uponor 19.3 41 45 25 0 62 61
Vaahto Group -4.2 35 30 28 15 37 21
Vacon 29.9 34 84 38 5 80 75
Vaisala 14.2 53 81 23 0 111 111
Viking Line 5.8 8 6 17 0 -3 -3
Wärtsilä 22.9 100 69 29 41 139 98
Wulff 3.0 46 47 34 2 59 56
YIT 14.7 143 49 28 34 164 130
Yleiselektroniikka 15.3 46 42 30 16 58 42

Appendix II / Companies in the comparison group
Name ROI (%) DIO DSO DPO DAO CCC mCCC
Affecto 4.3 2 99 25 37 75 38
Comptel 17.9 0 114 10 9 104 95
Cramo 4.0 10 78 34 8 54 46
Elecster 9.6 121 106 34 16 193 177
Finnair 0.1 9 17 8 10 18 9
Fortum 12.6 22 55 25 6 52 46
F-Secure 44.3 1 68 13 104 57 -48
Glaston -7.7 68 82 25 39 125 86
Honkarakenne 7.5 62 40 18 32 84 52
Ilkka-Yhtymä 9.6 6 23 9 16 20 4
Keskisuomalainen 25.9 4 24 8 20 19 -1
Kone 46.2 56 67 21 66 102 36
Konecranes 25.3 64 75 28 36 111 74
Lemminkäinen 7.0 71 40 13 20 98 78
Metso 13.3 86 65 54 33 97 64
Nokia 16.0 22 65 52 10 34 24
Oriola-KD 7.6 54 48 114 9 -11 -21
Outotec 16.7 38 65 27 75 75 1 Pohjois-Karjalan Kirjapaino 27.3 13 39 12 7 41 34
Pöyry 7.3 44 89 16 37 116 80
QPR Software 21.3 0 163 17 48 147 98
Raisio 5.3 73 44 46 6 71 65
Raute -2.9 27 28 18 30 36 6
Revenio Group 5.4 13 39 16 16 37 21
Saga Furs 20.6 5 29 12 24 22 -1
Sanoma 10.9 16 37 23 25 31 6
SRV Yhtiöt 4.1 255 23 15 24 263 239
Stonesoft -68.0 14 130 24 160 120 -40
Talentum 7.7 5 39 11 62 33 -28
Talvivaara 3.0 421 126 95 85 452 367
Tecnotree -7.7 6 105 36 6 75 69
Tectia -10.7 0 112 9 146 104 -42
Tieto 17.0 0 78 20 15 59 44
Vaahto Group -4.2 35 30 28 15 37 21
Vacon 29.9 34 84 38 5 80 75
Wärtsilä 22.9 100 69 29 41 139 98
YIT 14.7 143 49 28 34 164 130
Yleiselektroniikka 15.3 46 42 30 16 58 42