The Role and Potentials of Field User Interaction Data in ...
10
The Role and Potentials of Field User Interaction Data in the Automotive UX Development Lifecycle: An Industry Perspective Patrick Ebel [email protected] Technische Universität Berlin Berlin, Germany Florian Brokhausen fl[email protected] Technische Universität Berlin Berlin, Germany Andreas Vogelsang [email protected] Technische Universität Berlin Berlin, Germany ABSTRACT We are interested in the role of field user interaction data in the de- velopment of In-Vehicle Information Systems (IVISs), the potentials practitioners see in analyzing this data, the concerns they share, and how this compares to companies with digital products. We conducted interviews with 14 UX professionals, 8 from automotive and 6 from digital companies, and analyzed the results by emergent thematic coding. Our key findings indicate that implicit feedback through field user interaction data is currently not evident in the automotive UX development process. Most decisions regarding the design of IVISs are made based on personal preferences and the intuitions of stakeholders. However, the interviewees also indicated that user interaction data has the potential to lower the influence of guesswork and assumptions in the UX design process and can help to make the UX development lifecycle more evidence-based and user-centered. CCS CONCEPTS • General and reference → Surveys and overviews; • Human- centered computing → HCI design and evaluation methods; Empirical studies in HCI. KEYWORDS interview study, user experience, in-vehicle information systems ACM Reference Format: Patrick Ebel, Florian Brokhausen, and Andreas Vogelsang. 2020. The Role and Potentials of Field User Interaction Data in the Automotive UX Devel- opment Lifecycle: An Industry Perspective. In 12th International Conference on Automotive User Interfaces and Interactive Vehicular Applications (Auto- motiveUI ’20), September 21–22, 2020, Virtual Event, DC, USA. ACM, New York, NY, USA, 10 pages. https://doi.org/10.1145/3409120.3410638 1 INTRODUCTION The influence of software-based systems on the in-car User Expe- rience (UX) has changed from purely operating the car, through adding simple infotainment devices to the highly complex systems we experience today [17]. Modern cars are equipped with various In-Vehicle Information Systems (IVISs) that offer a large variety of features, interaction possibilities, and can be controlled via multiple interfaces [25]. The expectations towards those systems are not AutomotiveUI ’20, September 21–22, 2020, Virtual Event, DC, USA © 2020 Patrick Ebel. ACM 2020. This is the author’s version of the work. It is posted here for your personal use. Not for redistribution. The definitive Version of Record was published in 12th International Conference on Automotive User Interfaces and Interactive Vehicular Applications. ACM ISBN 978-1-4503-8065-2/20/09. . . $15.00 https://doi.org/10.1145/3409120.3410638 only driven by the customer’s experiences with other car manufac- turers but also by modern smartphones, websites, and other digital products. Baker et al. [4] report that customers are willing to pay up to 15 % of a car’s list price, or as much as $10,000 for connected car and infotainment technology. This paradigm shift leads to a grow- ing and diverse competition in the automotive domain and unlocks potential for advanced and intelligent in-vehicle features [9, 38, 45]. As a consequence, the task of designing user interfaces that meet customer demands has become more challenging and represents a crucial part of automotive development [17]. User-centered Design (UCD) requires experienced designers and exhaustive user studies and, therefore, is a costly, yet critical, task. This applies in particular to the design and evaluation of IVISs. Compared to many digital products, the complex automotive ar- chitecture, the critical requirements regarding functional safety, and the traditional structures in the automotive industry are chal- lenging [2, 6]. Additionally, the driver’s experience does not only depend on the system itself but also on the current driving and traffic situation [1, 44]. While driving a car, the interaction with the IVIS is only a secondary task, which makes the interactions highly context-sensitive [17]. Therefore, it is necessary to create a realistic simulation of the driving situation when evaluating IVISs. Simulating the driving situation provides value to the designers but requires high investments. While more cost-effective alterna- tives [14] are developed, they are still in an early research stage. The analysis of field user interaction data can reduce the effort for extensive user studies and expensive simulations by gaining insights about user behavior through data analysis [37]. Despite the generally growing awareness of the potentials of big data analysis, there is a lack of research on how data-driven approaches may support the automotive UX development process. In this paper, we present results from a qualitative study on the current role of field user interaction data in the automotive indus- try and highlight the differences to digital products. We conducted semi-structured interviews with 14 UX professionals, where 8 are currently employed in the automotive industry and 6 in other indus- tries. In the interviews, we addressed the current state-of-the-art, the challenges, and the potentials of field user interaction data in the respective UX development lifecycles. Our key findings indicate that implicit feedback through field user interaction data is currently not evident in the automotive UX development process. However, practitioners confirm its potential to make the UX development lifecycle more evidence-based and user-centered. Additionally, par- ticipants are concerned about insurmountable organizational, legal, or technical restrictions that prevent data collection. Participants from digital companies share most of the needs and potentials with the automotive participants but are generally concerned with more arXiv:2007.10884v1 [cs.HC] 21 Jul 2020
Transcript of The Role and Potentials of Field User Interaction Data in ...

The Role and Potentials of Field User Interaction Data in theAutomotive UX Development Lifecycle: An Industry Perspective
Patrick [email protected]
Technische Universität BerlinBerlin, Germany
Florian [email protected] Universität Berlin
Berlin, Germany
Andreas [email protected] Universität Berlin
Berlin, Germany
ABSTRACTWe are interested in the role of field user interaction data in the de-velopment of In-Vehicle Information Systems (IVISs), the potentialspractitioners see in analyzing this data, the concerns they share,and how this compares to companies with digital products. Weconducted interviews with 14 UX professionals, 8 from automotiveand 6 from digital companies, and analyzed the results by emergentthematic coding. Our key findings indicate that implicit feedbackthrough field user interaction data is currently not evident in theautomotive UX development process. Most decisions regarding thedesign of IVISs are made based on personal preferences and theintuitions of stakeholders. However, the interviewees also indicatedthat user interaction data has the potential to lower the influenceof guesswork and assumptions in the UX design process and canhelp to make the UX development lifecycle more evidence-basedand user-centered.
CCS CONCEPTS• General and reference → Surveys and overviews; • Human-centered computing→HCI design and evaluationmethods;Empirical studies in HCI.
KEYWORDSinterview study, user experience, in-vehicle information systemsACM Reference Format:Patrick Ebel, Florian Brokhausen, and Andreas Vogelsang. 2020. The Roleand Potentials of Field User Interaction Data in the Automotive UX Devel-opment Lifecycle: An Industry Perspective. In 12th International Conferenceon Automotive User Interfaces and Interactive Vehicular Applications (Auto-motiveUI ’20), September 21–22, 2020, Virtual Event, DC, USA. ACM, NewYork, NY, USA, 10 pages. https://doi.org/10.1145/3409120.3410638
1 INTRODUCTIONThe influence of software-based systems on the in-car User Expe-rience (UX) has changed from purely operating the car, throughadding simple infotainment devices to the highly complex systemswe experience today [17]. Modern cars are equipped with variousIn-Vehicle Information Systems (IVISs) that offer a large variety offeatures, interaction possibilities, and can be controlled via multipleinterfaces [25]. The expectations towards those systems are not
AutomotiveUI ’20, September 21–22, 2020, Virtual Event, DC, USA© 2020 Patrick Ebel. ACM 2020. This is the author’s version of the work. It is postedhere for your personal use. Not for redistribution. The definitive Version of Recordwas published in 12th International Conference on Automotive User Interfaces andInteractive Vehicular Applications.ACM ISBN 978-1-4503-8065-2/20/09. . . $15.00https://doi.org/10.1145/3409120.3410638
only driven by the customer’s experiences with other car manufac-turers but also by modern smartphones, websites, and other digitalproducts. Baker et al. [4] report that customers are willing to pay upto 15 % of a car’s list price, or as much as $10,000 for connected carand infotainment technology. This paradigm shift leads to a grow-ing and diverse competition in the automotive domain and unlockspotential for advanced and intelligent in-vehicle features [9, 38, 45].As a consequence, the task of designing user interfaces that meetcustomer demands has become more challenging and represents acrucial part of automotive development [17].
User-centered Design (UCD) requires experienced designers andexhaustive user studies and, therefore, is a costly, yet critical, task.This applies in particular to the design and evaluation of IVISs.Compared to many digital products, the complex automotive ar-chitecture, the critical requirements regarding functional safety,and the traditional structures in the automotive industry are chal-lenging [2, 6]. Additionally, the driver’s experience does not onlydepend on the system itself but also on the current driving andtraffic situation [1, 44]. While driving a car, the interaction withthe IVIS is only a secondary task, which makes the interactionshighly context-sensitive [17]. Therefore, it is necessary to create arealistic simulation of the driving situation when evaluating IVISs.Simulating the driving situation provides value to the designersbut requires high investments. While more cost-effective alterna-tives [14] are developed, they are still in an early research stage.The analysis of field user interaction data can reduce the effortfor extensive user studies and expensive simulations by gaininginsights about user behavior through data analysis [37].
Despite the generally growing awareness of the potentials ofbig data analysis, there is a lack of research on how data-drivenapproaches may support the automotive UX development process.In this paper, we present results from a qualitative study on thecurrent role of field user interaction data in the automotive indus-try and highlight the differences to digital products. We conductedsemi-structured interviews with 14 UX professionals, where 8 arecurrently employed in the automotive industry and 6 in other indus-tries. In the interviews, we addressed the current state-of-the-art,the challenges, and the potentials of field user interaction data inthe respective UX development lifecycles. Our key findings indicatethat implicit feedback through field user interaction data is currentlynot evident in the automotive UX development process. However,practitioners confirm its potential to make the UX developmentlifecycle more evidence-based and user-centered. Additionally, par-ticipants are concerned about insurmountable organizational, legal,or technical restrictions that prevent data collection. Participantsfrom digital companies share most of the needs and potentials withthe automotive participants but are generally concerned with more
arX
iv:2
007.
1088
4v1
[cs
.HC
] 2
1 Ju
l 202
0
AutomotiveUI ’20, September 21–22, 2020, Virtual Event, DC, USA Patrick Ebel, Florian Brokhausen, and Andreas Vogelsang
advanced issues like data interpretability and triangulation betweenqualitative and quantitative feedback.
2 BACKGROUNDIn this section, we discuss the concept of UX, its different perceptionin industry and academia, and its special role in the automotiveindustry. We present a definition of field user interaction data andgive an overview of related studies.
2.1 UX and its Role in the Automotive IndustryA good UX is the main goal of most product development processes.However, UX is perceived differently in academia and industry.Academics commonly agree that UX is a holistic and subjectiveconcept [42], which goes beyond solving usability problems orcreating a pleasant UI. Usability aspects contribute to the overallUX but do not suffice as stand-alone UX measures since they do notyield insights on how the interaction was perceived by the user [41].The perceived UX is mainly influenced by the user’s internal state,the characteristics of the system at use, and the context in whichthe interaction occurs [20].
This holistic concept of UX leads to challenges in practice [15, 47]with some of them being particularly relevant in automotive UX de-velopment. On the one hand, UX is strongly affected by the contextin which the interaction occurs [19, 35]. The interaction with anIVIS is therefore dependent on environmental conditions, such asthe driving scenario, the dual-task environment, and the frequencyof use [18]. Those aspects must be addressed by the designers, in-creasing the complexity of the design task [11] by the need for acontext-dependent presentation of information [29]. On the otherhand, practitioners and organizations are more interested in thelong-term experience rather than in temporary emotions [26]. Re-garding the automotive industry with its long product lifecycles [6],its different touch-points, and diverse and global user base [21] thequestion of how to capture an ‘overall’ UX score [26] gets evenmore interesting. Additionally, Frison et al. emphasize the impor-tance of UX, as it influences trust in the vehicle [13] and gets evenmore important with the transition toward automated driving [12].
2.2 Field User Interaction DataIn line with the definition of Harvey et al. [19], we define userinteraction data as every kind of interaction between the user andthe IVIS. User interactions are neither bound to a specific type ofinterface nor a specific type of interaction and therefore vary intheir granularity. User Interaction data can be generated both inthe field and in the lab. In the following, we will mainly focus onuser interaction data generated during field usage. We define thisas field user interaction data, which is continuously and implicitlyrecorded automatically in all production line vehicles.
2.3 Related WorkThe approach of using field user interaction data to evaluate andenhance a product’s UX is already well researched and widely es-tablished in digital domains like web and app development. In 2006,Atterer et al. [3] presented an approach for detailed user trackingon web pages that benefits usability evaluation by incorporating im-plicit user interactions. While Atterer et al. track multiple different
user actions, Navalpakkam and Churchill [32] propose an approachthat predicts the overall experience of web page users by mousetracking alone. Nebeling et al. [33] developed a framework thatcombines automated usability testing with crowdsourcing. Theyargue that the benefits of large-scale online user testing outweighthe trade-offs compared to lab studies. Compared to digital do-mains, the research field on the usage of implicit interaction datato evaluate IVISs is not yet widely explored.
This aligns with the findings of Lamm andWolff [25], who foundthat model-based approaches and automated evaluations do notplay an important role in automotive UX development. However,they do not reflect on the views of practitioners and what mightprevent them from applying these approaches.
A method to measure UX in an automotive context based onthe fulfillment of psychological needs is proposed by Körber andBengler [22, 23]. They argue that the presented questionnaire is notonly able to measure the UX and compare products quantitativelybut also to predict possible experiences in early prototype stages.
Another approach is presented by Harvey et al. [19]. They pro-pose a framework based on thirteen methods that measure theobjective and subjective levels of performance and workload ofusers interacting with IVIS. Similarly, Alvarez et al. [2] present aset of tools and methodologies that aim to benefit the creation ofa holistic automotive design space. The work of Riener et al. [39]gives an extensive overview on how the driver-interaction loop canbe modeled. Although some of the presented methods are based onuser interaction data, the use of data, implicitly , automatically, andcontinuously collected from the whole user base, is not considered.
This is investigated by Orlovska et al. [37], showing how fielduser interaction data can support the evaluation of IVISs. Theyargue that field data-driven approaches enable more accurate feed-back and enable testing of the whole user base. They also found thatsoftware platforms of Original Equipment Manufacturers (OEMs)are not designed for user behavior logging and that methods needto be developed that enable compliance with data protection regu-lations. Additionally, they present a case study [36] on how fielduser interaction data can benefit the overall usability assessment.However, this study exclusively deals with a specific system of asingle manufacturer. Therefore, the results are hard to generalize.
3 STUDY DESIGNDespite the claimed potentials of using field user interaction data toimprove the UX development lifecycle and its success in other fields,there are indications that these potentials are not (yet) leveraged inthe development of automotive IVISs. We are interested in why thisis the case. We want to answer the following research questions:
RQ1: What is the current role of field user interaction data in theautomotive UX development lifecycle?
RQ2: What are the needs, challenges, and concerns in the contextof data-driven UX Development?
RQ3: How can the automotive UX development lifecycle benefitfrom field-data-driven approaches?
RQ4: What is specific to the automotive UX development lifecycleand what can be generalized from digital companies?
Field User Interaction Data in the Automotive UX Development AutomotiveUI ’20, September 21–22, 2020, Virtual Event, DC, USA
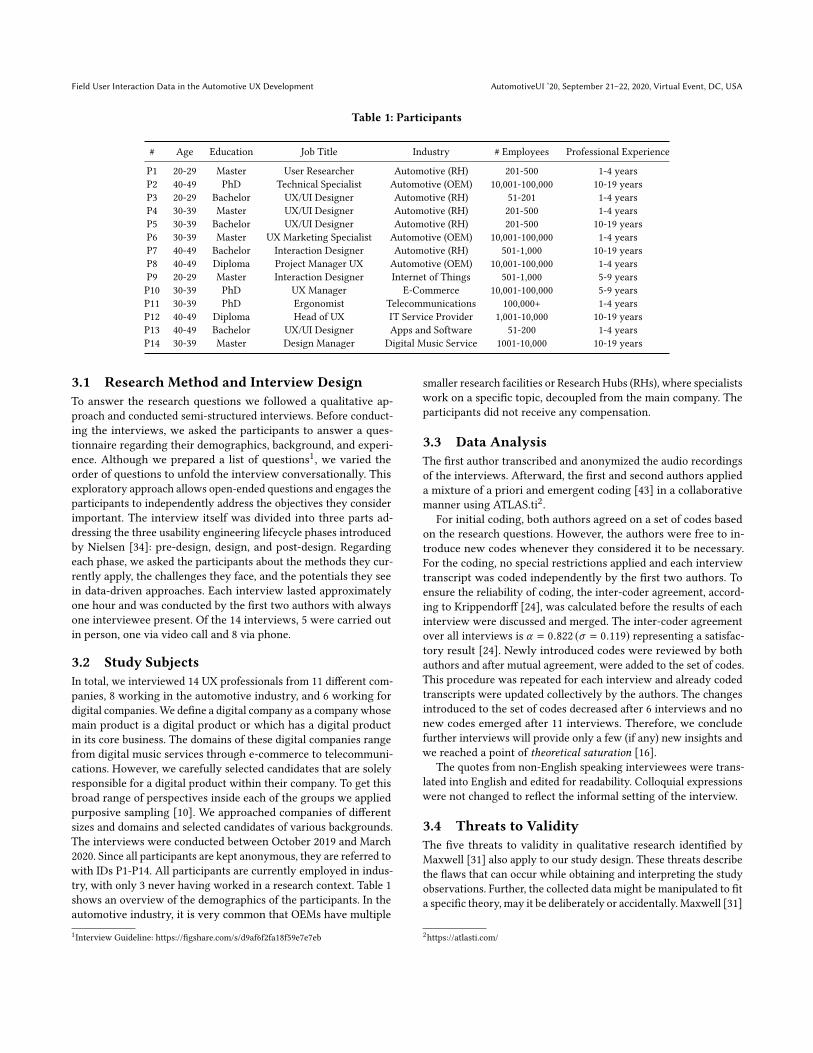
Table 1: Participants
# Age Education Job Title Industry # Employees Professional Experience
P1 20-29 Master User Researcher Automotive (RH) 201-500 1-4 yearsP2 40-49 PhD Technical Specialist Automotive (OEM) 10,001-100,000 10-19 yearsP3 20-29 Bachelor UX/UI Designer Automotive (RH) 51-201 1-4 yearsP4 30-39 Master UX/UI Designer Automotive (RH) 201-500 1-4 yearsP5 30-39 Bachelor UX/UI Designer Automotive (RH) 201-500 10-19 yearsP6 30-39 Master UX Marketing Specialist Automotive (OEM) 10,001-100,000 1-4 yearsP7 40-49 Bachelor Interaction Designer Automotive (RH) 501-1,000 10-19 yearsP8 40-49 Diploma Project Manager UX Automotive (OEM) 10,001-100,000 1-4 yearsP9 20-29 Master Interaction Designer Internet of Things 501-1,000 5-9 yearsP10 30-39 PhD UX Manager E-Commerce 10,001-100,000 5-9 yearsP11 30-39 PhD Ergonomist Telecommunications 100,000+ 1-4 yearsP12 40-49 Diploma Head of UX IT Service Provider 1,001-10,000 10-19 yearsP13 40-49 Bachelor UX/UI Designer Apps and Software 51-200 1-4 yearsP14 30-39 Master Design Manager Digital Music Service 1001-10,000 10-19 years
3.1 Research Method and Interview DesignTo answer the research questions we followed a qualitative ap-proach and conducted semi-structured interviews. Before conduct-ing the interviews, we asked the participants to answer a ques-tionnaire regarding their demographics, background, and experi-ence. Although we prepared a list of questions1, we varied theorder of questions to unfold the interview conversationally. Thisexploratory approach allows open-ended questions and engages theparticipants to independently address the objectives they considerimportant. The interview itself was divided into three parts ad-dressing the three usability engineering lifecycle phases introducedby Nielsen [34]: pre-design, design, and post-design. Regardingeach phase, we asked the participants about the methods they cur-rently apply, the challenges they face, and the potentials they seein data-driven approaches. Each interview lasted approximatelyone hour and was conducted by the first two authors with alwaysone interviewee present. Of the 14 interviews, 5 were carried outin person, one via video call and 8 via phone.
3.2 Study SubjectsIn total, we interviewed 14 UX professionals from 11 different com-panies, 8 working in the automotive industry, and 6 working fordigital companies.We define a digital company as a companywhosemain product is a digital product or which has a digital productin its core business. The domains of these digital companies rangefrom digital music services through e-commerce to telecommuni-cations. However, we carefully selected candidates that are solelyresponsible for a digital product within their company. To get thisbroad range of perspectives inside each of the groups we appliedpurposive sampling [10]. We approached companies of differentsizes and domains and selected candidates of various backgrounds.The interviews were conducted between October 2019 and March2020. Since all participants are kept anonymous, they are referred towith IDs P1-P14. All participants are currently employed in indus-try, with only 3 never having worked in a research context. Table 1shows an overview of the demographics of the participants. In theautomotive industry, it is very common that OEMs have multiple1Interview Guideline: https://figshare.com/s/d9af6f2fa18f59e7e7eb
smaller research facilities or Research Hubs (RHs), where specialistswork on a specific topic, decoupled from the main company. Theparticipants did not receive any compensation.
3.3 Data AnalysisThe first author transcribed and anonymized the audio recordingsof the interviews. Afterward, the first and second authors applieda mixture of a priori and emergent coding [43] in a collaborativemanner using ATLAS.ti2.
For initial coding, both authors agreed on a set of codes basedon the research questions. However, the authors were free to in-troduce new codes whenever they considered it to be necessary.For the coding, no special restrictions applied and each interviewtranscript was coded independently by the first two authors. Toensure the reliability of coding, the inter-coder agreement, accord-ing to Krippendorff [24], was calculated before the results of eachinterview were discussed and merged. The inter-coder agreementover all interviews is α = 0.822 (σ = 0.119) representing a satisfac-tory result [24]. Newly introduced codes were reviewed by bothauthors and after mutual agreement, were added to the set of codes.This procedure was repeated for each interview and already codedtranscripts were updated collectively by the authors. The changesintroduced to the set of codes decreased after 6 interviews and nonew codes emerged after 11 interviews. Therefore, we concludefurther interviews will provide only a few (if any) new insights andwe reached a point of theoretical saturation [16].
The quotes from non-English speaking interviewees were trans-lated into English and edited for readability. Colloquial expressionswere not changed to reflect the informal setting of the interview.
3.4 Threats to ValidityThe five threats to validity in qualitative research identified byMaxwell [31] also apply to our study design. These threats describethe flaws that can occur while obtaining and interpreting the studyobservations. Further, the collected data might be manipulated to fita specific theory, may it be deliberately or accidentally. Maxwell [31]
2https://atlasti.com/

AutomotiveUI ’20, September 21–22, 2020, Virtual Event, DC, USA Patrick Ebel, Florian Brokhausen, and Andreas Vogelsang
Post-DesignDesign
Pre-Design
PotentialsState-of-the-Art
Needs
Challenges
Concerns
reveals
leads to
hind
er addressed by
hind
er address
ed by
Figure 1: Thematic Coding Model
argues that the researchers must preclude those threats by devel-oping a study design that provides evidence that no “alternativehypotheses” can be made [27].
Descriptive validity refers to the threat of incomplete and in-accurate recordings. To preclude this threat all interviews wererecorded and transcribed. The transcripts are annotated with times-tamps such that the original conversation can be traced back duringanalysis.
The threat of Interpretation validity addresses the challenge tocapture the observations as intended by the participants. To avoidthis threat, we used open-ended and non-directional questions. Ad-ditionally, all interviews were independently coded by two authors,and potentially ambiguous statements were discussed to identifythe interpretation intended by the participant.
Theory validity and researcher bias refer to the threat that theresearchers force the data to fit a certain theory theywant to supportor that they possess a deliberate bias regarding the participantsor a certain outcome. Mitigating this threat is the fact that thestudy is constructed to be very exploratory, having the intentionto reflect the current state-of-the-art in the industry and identifypotentials. Additionally, we lowered the researcher bias by applyingthe introduced coding and reviewing concepts.
Reactivity describes the threat that the presence of the inter-viewers may influence the interviewees. This threat can hardly bemitigated but still, the authors payed attention to not influence theinterviewees when conducting the interviews.
An additional threat is posed by the selection of the interviewees.We only interviewed employees of automotive OEMs, which mightintroduce some bias by excluding suppliers. The OEM research hubsusually act as company-internal suppliers, being solely responsiblefor whole systems within the car, which might add some similarperspectives.
4 RESULTSWe structured the identified codes into categories and illustratetheir relations in Figure 1.
State-of-the-Art: Statements of phenomena in current prac-tice, which reveals a challenge or leads toa need
Challenges: Statements of problems that arise from cur-rent practices
Needs: Statements of demands towards improvingthe UX development lifecycle
Concerns: Statements of doubts that a challenge canbe overcome or a need can be fulfilled
Potentials: Statements of areas where data-driven ap-proaches may address a challenge or fulfilla need
The model shows that the reported State-of-the-Art revealsChallenges and leads to Needs of practitioners. Some of thesechallenges and needs can be addressed by analyzing field user inter-action data (Potentials). These potentials are expressed explicitlyand implicitly by the participants. Concerns were mentioned ashindering factors. The model applies to the pre-design, design, andpost-design phase.
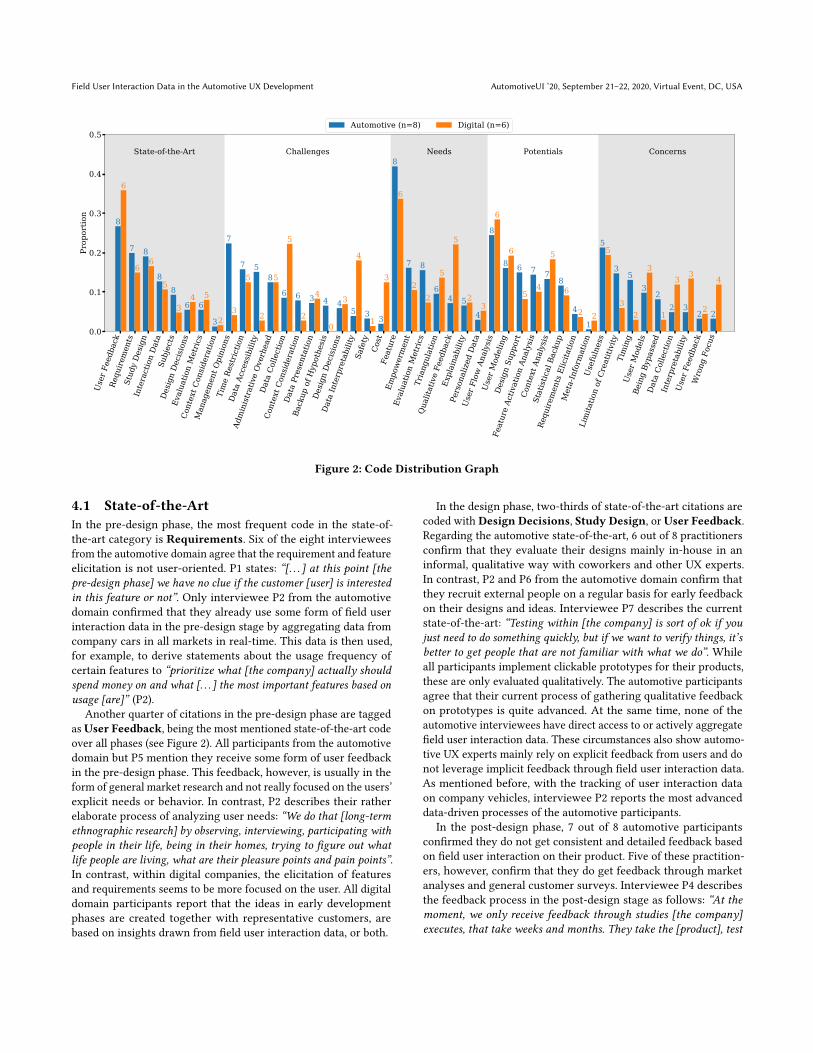
Figure 2 shows the distribution of codes within each category asbars, and the number of interviews the code occurred in as numberson top. On average we introduced 80 (σ = 26) codes per interview.
Field User Interaction Data in the Automotive UX Development AutomotiveUI ’20, September 21–22, 2020, Virtual Event, DC, USAU
ser
Feed
back
Requ
irem
ents
Stud
y D
esig
nIn
tera
ctio
n D
ata
Subj
ects
Des
ign
Dec
isio
nsEv
alua
tion
Met
rics
Cont
ext C
onsi
dera
tion
Man
agem
ent O
pini
ons
Tim
e Re
stri
ctio
nD
ata
Acce
ssib
ility
Adm
inis
trat
ive
Ove
rhea
dD
ata
Colle
ctio
n
Cont
ext C
onsi
dera
tion
Dat
a Pr
esen
tatio
nBa
ckup
of H
ypot
hesi
sD
esig
n D
ecis
ions
Dat
a In
terp
reta
bilit
ySa
fety
Cost
Feat
ure
Empo
wer
men
tEv
alua
tion
Met
rics
Tria
ngul
atio
nQ
ualit
ativ
e Fe
edba
ckEx
plai
nabi
lity
Pers
onal
ized
Dat
aU
ser
Flow
Ana
lysi
sU
ser
Mod
elin
gD
esig
n Su
ppor
t
Feat
ure
Activ
atio
n An
alys
isCo
ntex
t Ana
lysi
sSt
atis
tical
Bac
kup
Requ
irem
ents
Elic
itatio
nM
eta-
Info
rmat
ion
Use
fuln
ess
Lim
itatio
n of
Cre
atiti
vity
Tim
ing
Use
r M
odel
sBe
ing
Bypa
ssed
Dat
a Co
llect
ion
Inte
rpre
tabi
lity
Use
r Fe
edba
ckW
rong
Foc
us
0.0
0.1
0.2
0.3
0.4
0.5
Prop
ortio
n
8
7 8
88
6 6
3
7
7 58
6 6 3 4 45 3 3
8
7 8
64 5
4
8
8 6 7 78
4
1
5
35
32
2 32 2
6
66
5
34 5
23
5
2
5
5
2
4
0
3
4
1
3
6
22
5
5
23
6
6
54
5
6
2 2
5
32
3
1
33
2
4
State-of-the-Art Challenges Needs Potentials Concerns
Automotive (n=8) Digital (n=6)
Figure 2: Code Distribution Graph
4.1 State-of-the-ArtIn the pre-design phase, the most frequent code in the state-of-the-art category is Requirements. Six of the eight intervieweesfrom the automotive domain agree that the requirement and featureelicitation is not user-oriented. P1 states: “[. . . ] at this point [thepre-design phase] we have no clue if the customer [user] is interestedin this feature or not”. Only interviewee P2 from the automotivedomain confirmed that they already use some form of field userinteraction data in the pre-design stage by aggregating data fromcompany cars in all markets in real-time. This data is then used,for example, to derive statements about the usage frequency ofcertain features to “prioritize what [the company] actually shouldspend money on and what [. . . ] the most important features based onusage [are]” (P2).
Another quarter of citations in the pre-design phase are taggedas User Feedback, being the most mentioned state-of-the-art codeover all phases (see Figure 2). All participants from the automotivedomain but P5 mention they receive some form of user feedbackin the pre-design phase. This feedback, however, is usually in theform of general market research and not really focused on the users’explicit needs or behavior. In contrast, P2 describes their ratherelaborate process of analyzing user needs: “We do that [long-termethnographic research] by observing, interviewing, participating withpeople in their life, being in their homes, trying to figure out whatlife people are living, what are their pleasure points and pain points”.In contrast, within digital companies, the elicitation of featuresand requirements seems to be more focused on the user. All digitaldomain participants report that the ideas in early developmentphases are created together with representative customers, arebased on insights drawn from field user interaction data, or both.
In the design phase, two-thirds of state-of-the-art citations arecoded with Design Decisions, Study Design, or User Feedback.Regarding the automotive state-of-the-art, 6 out of 8 practitionersconfirm that they evaluate their designs mainly in-house in aninformal, qualitative way with coworkers and other UX experts.In contrast, P2 and P6 from the automotive domain confirm thatthey recruit external people on a regular basis for early feedbackon their designs and ideas. Interviewee P7 describes the currentstate-of-the-art: “Testing within [the company] is sort of ok if youjust need to do something quickly, but if we want to verify things, it’sbetter to get people that are not familiar with what we do”. Whileall participants implement clickable prototypes for their products,these are only evaluated qualitatively. The automotive participantsagree that their current process of gathering qualitative feedbackon prototypes is quite advanced. At the same time, none of theautomotive interviewees have direct access to or actively aggregatefield user interaction data. These circumstances also show automo-tive UX experts mainly rely on explicit feedback from users and donot leverage implicit feedback through field user interaction data.As mentioned before, with the tracking of user interaction dataon company vehicles, interviewee P2 reports the most advanceddata-driven processes of the automotive participants.
In the post-design phase, 7 out of 8 automotive participantsconfirmed they do not get consistent and detailed feedback basedon field user interaction on their product. Five of these practition-ers, however, confirm that they do get feedback through marketanalyses and general customer surveys. Interviewee P4 describesthe feedback process in the post-design stage as follows: “At themoment, we only receive feedback through studies [the company]executes, that take weeks and months. They take the [product], test
AutomotiveUI ’20, September 21–22, 2020, Virtual Event, DC, USA Patrick Ebel, Florian Brokhausen, and Andreas Vogelsang
it in multiple markets with many people, and curate a [report] withthe results.” In the digital domain, 4 out of 6 practitioners haveimplemented a process to receive user feedback for their productsbased on field user interaction data.
Key findings:State-of-the-art in automotive (RQ1):
• Requirements and feature elicitation is not user-centeredand only supported by general market research.
• Focus is on explicit feedback; implicit feedback throughfield user interaction data is not evident.
• Prototypes are mainly evaluated qualitatively by co-workers and in-house UX experts.
Differences to digital companies (RQ4):• In digital companies, field user interaction data is consid-ered for decisions throughout all design phases.
• For feature elicitation and prioritization, digital compa-nies use a mixture of explicit feedback from representa-tive users and implicit insights from field user interactiondata.
• Within digital companies, insights from field user inter-action data are very broad and range from feature usagesto sophisticated hypotheses testing.
4.2 ChallengesFigure 2 shows thatManagementOpinions are often considered achallenge in the automotive domain. In particular, in the pre-designphase, six out of eight participants from the automotive domainreport that their findings from user research are not considered inthe decision making process. They argue that their proposals areoften overruled by higher management even though they provideevidence through their research. Practitioners from digital com-panies do not experience this challenge as often. This correlateswith the challenge to back up the designer’s hypotheses towarduser interaction with the product (Backup of Hypothesis). Thischallenge was expressed only by automotive participants. P7 states:“There are a lot of assumptions that people make about who is drivingour cars, but none of them is actually backed up with any kind ofinformation”. Data Accessibility and Data Collection are alsomentioned frequently in the pre-design phase. Data accessibilityrefers to a generally insufficient availability, i.e. accessibility ofuser-related data within the company. P8 mentions that “[t]here isa very strong silo mentality in companies in the acquisition of infor-mation, but also in the distribution of information”. The fact that allcitations tagged with Data Accessibility come from automotiveparticipants highlights the significant deficits regarding data trans-parency. Considering the data collection challenges, all participantsmainly refer to the challenge of collecting data as detailed as possi-ble without violating legal restrictions. However, there are furthertechnical peculiarities that complicate extensive data collectionfrom users in the automotive domain. P7 states that for “the oldersystems none of this existed, so we have no way of understandingwhat people did with it”. Additionally challenging is the need forlong-lasting architectures and the heterogeneous data processed bymultiple different Electronic Control Units (ECUs). P2 exemplifies
that the current architecture of their vehicle platform is not yetprepared for the kind of interaction logging needed today.
Time Restriction and Design Decisions are the most oftenmentioned challenges by all participants regarding the design phase.Six participants describe that they often lack time to dive deep intouser studies or interaction data. P1 explains: “The first priority isspeed. We can’t work on data for two or three days”. Consideringdesign decisions, 5 out of 8 automotive participants see a significantchallenge in evaluating their designs and prototypes with regardto the context, i.e. the driving situation (Context Consideration).The participants further describe that the driving task itself and theinfluences from the environment affect how the driver interactswith the system. The difficulty of recreating this driving situationin a lab experiment is explained by P1: “The difference lies in thedual-task paradigm. When you are in the lab, the interaction withthe HMI is the primary task, when you are driving it is only thesecondary task”. P5 adds that dynamic driving simulators offer thepossibility to model the driving situation to a certain degree butthat due to high cost and low availability they are only used forvery few studies. The participants from digital companies focuson Data Interpretability and what methods need to be applied tomake reliable statements.
In the post-design phase, the challenge of Data Accessibilityreoccurs. Three automotive participants argue that the biggestchallenge after a product’s release is to get field user interactiondata to evaluate how the product is accepted by the users. P2 statesthat “one of the main challenges is to make the right data available atthe right time”. In addition to the data being available, the challengesof intuitive Data Presentation are discussed by the participantsas well. Six participants express that, due to the amount of data,field user interaction data needs to be visualized in an intuitivelyunderstandable way. P4 underlines this challenge by saying that “an80-page pdf with results [...] doesn’t help that much because nobodywants to read through it and it doesn’t motivate designers to changeanything”.
Key findings:Challenges in automotive (RQ2):
• Field user interaction data is often not available or acces-sible throughout the design process due to organizational,legal, or technical restrictions.
• User research is not valued; Evidence-based design deci-sions are overruled by management.
• The complexity of the driving context further affects thealready challenging task to create insights from largeamounts of field user interaction data.
Differences to digital companies (RQ4):• The disparity between user insights and managementopinions is less challenging for digital companies.
• Digital companies face more mature challenges in termsof integrating data in their design process rather thantechnical or organizational challenges.
4.3 NeedsThe distribution of codes addressing the needs of the UX expertsdoes not show major differences between the automotive and the
Field User Interaction Data in the Automotive UX Development AutomotiveUI ’20, September 21–22, 2020, Virtual Event, DC, USA
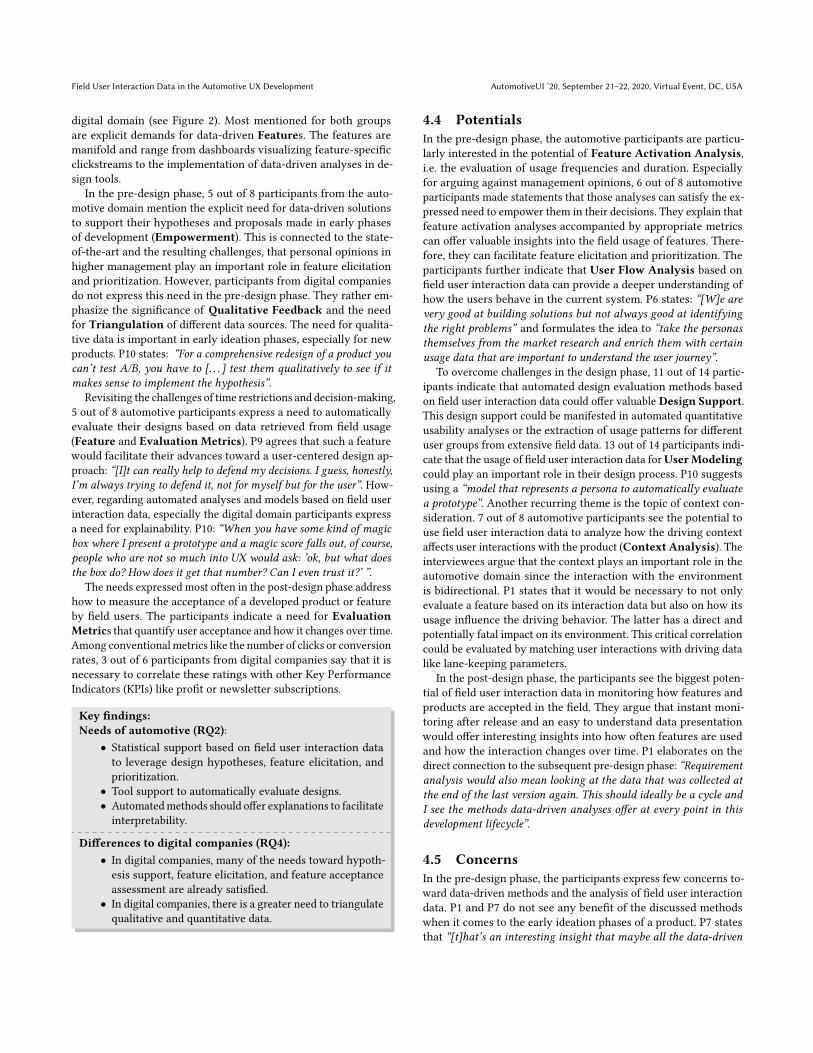
digital domain (see Figure 2). Most mentioned for both groupsare explicit demands for data-driven Features. The features aremanifold and range from dashboards visualizing feature-specificclickstreams to the implementation of data-driven analyses in de-sign tools.
In the pre-design phase, 5 out of 8 participants from the auto-motive domain mention the explicit need for data-driven solutionsto support their hypotheses and proposals made in early phasesof development (Empowerment). This is connected to the state-of-the-art and the resulting challenges, that personal opinions inhigher management play an important role in feature elicitationand prioritization. However, participants from digital companiesdo not express this need in the pre-design phase. They rather em-phasize the significance of Qualitative Feedback and the needfor Triangulation of different data sources. The need for qualita-tive data is important in early ideation phases, especially for newproducts. P10 states: “For a comprehensive redesign of a product youcan’t test A/B, you have to [. . . ] test them qualitatively to see if itmakes sense to implement the hypothesis”.
Revisiting the challenges of time restrictions and decision-making,5 out of 8 automotive participants express a need to automaticallyevaluate their designs based on data retrieved from field usage(Feature and Evaluation Metrics). P9 agrees that such a featurewould facilitate their advances toward a user-centered design ap-proach: “[I]t can really help to defend my decisions. I guess, honestly,I’m always trying to defend it, not for myself but for the user”. How-ever, regarding automated analyses and models based on field userinteraction data, especially the digital domain participants expressa need for explainability. P10: “When you have some kind of magicbox where I present a prototype and a magic score falls out, of course,people who are not so much into UX would ask: ’ok, but what doesthe box do? How does it get that number? Can I even trust it?’ ”.
The needs expressed most often in the post-design phase addresshow to measure the acceptance of a developed product or featureby field users. The participants indicate a need for EvaluationMetrics that quantify user acceptance and how it changes over time.Among conventional metrics like the number of clicks or conversionrates, 3 out of 6 participants from digital companies say that it isnecessary to correlate these ratings with other Key PerformanceIndicators (KPIs) like profit or newsletter subscriptions.
Key findings:Needs of automotive (RQ2):
• Statistical support based on field user interaction datato leverage design hypotheses, feature elicitation, andprioritization.
• Tool support to automatically evaluate designs.• Automatedmethods should offer explanations to facilitateinterpretability.
Differences to digital companies (RQ4):• In digital companies, many of the needs toward hypoth-esis support, feature elicitation, and feature acceptanceassessment are already satisfied.
• In digital companies, there is a greater need to triangulatequalitative and quantitative data.
4.4 PotentialsIn the pre-design phase, the automotive participants are particu-larly interested in the potential of Feature Activation Analysis,i.e. the evaluation of usage frequencies and duration. Especiallyfor arguing against management opinions, 6 out of 8 automotiveparticipants made statements that those analyses can satisfy the ex-pressed need to empower them in their decisions. They explain thatfeature activation analyses accompanied by appropriate metricscan offer valuable insights into the field usage of features. There-fore, they can facilitate feature elicitation and prioritization. Theparticipants further indicate that User Flow Analysis based onfield user interaction data can provide a deeper understanding ofhow the users behave in the current system. P6 states: “[W]e arevery good at building solutions but not always good at identifyingthe right problems” and formulates the idea to “take the personasthemselves from the market research and enrich them with certainusage data that are important to understand the user journey”.
To overcome challenges in the design phase, 11 out of 14 partic-ipants indicate that automated design evaluation methods basedon field user interaction data could offer valuable Design Support.This design support could be manifested in automated quantitativeusability analyses or the extraction of usage patterns for differentuser groups from extensive field data. 13 out of 14 participants indi-cate that the usage of field user interaction data forUserModelingcould play an important role in their design process. P10 suggestsusing a “model that represents a persona to automatically evaluatea prototype”. Another recurring theme is the topic of context con-sideration. 7 out of 8 automotive participants see the potential touse field user interaction data to analyze how the driving contextaffects user interactions with the product (Context Analysis). Theinterviewees argue that the context plays an important role in theautomotive domain since the interaction with the environmentis bidirectional. P1 states that it would be necessary to not onlyevaluate a feature based on its interaction data but also on how itsusage influence the driving behavior. The latter has a direct andpotentially fatal impact on its environment. This critical correlationcould be evaluated by matching user interactions with driving datalike lane-keeping parameters.
In the post-design phase, the participants see the biggest poten-tial of field user interaction data in monitoring how features andproducts are accepted in the field. They argue that instant moni-toring after release and an easy to understand data presentationwould offer interesting insights into how often features are usedand how the interaction changes over time. P1 elaborates on thedirect connection to the subsequent pre-design phase: “Requirementanalysis would also mean looking at the data that was collected atthe end of the last version again. This should ideally be a cycle andI see the methods data-driven analyses offer at every point in thisdevelopment lifecycle”.
4.5 ConcernsIn the pre-design phase, the participants express few concerns to-ward data-driven methods and the analysis of field user interactiondata. P1 and P7 do not see any benefit of the discussed methodswhen it comes to the early ideation phases of a product. P7 statesthat “[t]hat’s an interesting insight that maybe all the data-driven

AutomotiveUI ’20, September 21–22, 2020, Virtual Event, DC, USA Patrick Ebel, Florian Brokhausen, and Andreas Vogelsang
Key findings:Potentials in automotive (RQ3):
• Insights from field user interaction data can shift theelicitation and prioritization of features from personalbest guesses to more user-centered decisions.
• Automated evaluation methods and user modeling basedon field user interaction data may offer valuable designsupport.
• Field user interaction data can be triangulated with con-textual data to investigate the impact of the driving situa-tion on the interaction and vice versa, making evaluationsless biased.
Differences to digital companies (RQ4):• Most identified potentials apply to both, automotive anddigital domains, but digital companies are more advancedin unlocking these potentials.
stuff has a bigger impact on everything where you try to optimizesomething in contrast to the work where the creative process is themain part”.
The predominant concern in the design phase regards the Limi-tation of Creativity of the designers which might be caused byextensive use of data-driven analyses. This is strongly connectedto the concerns in the pre-design stage, as participants from bothgroups see a risk to get stuck in small, iterative optimization pro-cesses. They anticipate that optimizing features based on historicaldata prevents thinking outside of the box to create something new.These concerns are related to the concerns toward User Models.P10 states that it is difficult to build a model without limiting cre-ativity and describes it as an “overfitting problem: the model hasseen too much old data and is therefore not able to generalize whenit is applied to something new”. Further, 7 participants (4 automo-tive) are concerned about how to interpret the results produced byan automated evaluation method (Interpretability). They mainlyargue that an explanation has to be provided to develop trust inautomatic evaluation “because usage scores alone produce very littleinsight”, according to P12. P4 agrees by indicating: “A score mightbe ok, but there should be suggestions or information on how the scoreis calculated and influenced”.
There are very few concerns regarding the post-design phase.However, 5 out of 8 automotive participants communicate generaldoubts that legislation may prevent certain features and functionsfrom being realized due to data collection restrictions. This espe-cially holds for potentially person-related data, e.g. GPS coordinatesof a vehicle.
5 DISCUSSIONIn this section, we reflect on the needs, challenges, and concernsexpressed by the practitioners and emphasize untapped potentialin the evaluation and development of IVISs. We additionally relateour findings to prior published research and present methods thatmay benefit the automotive UX development lifecycle.
Leadership, culture, and the mindset within a company highlyinfluence the usage of data-driven methods. Compared to digital-native companies, automotive OEMs find it difficult to keep up
Key findings:Concerns in automotive (RQ2):
• Insurmountable organizational, legal, or technical restric-tions prevent that data can be collected.
• Quantitative insights may not be useful in early ideationphases to evaluate volatile concepts.
• Data-driven methods may limit creativity and shift thefocus to small incremental changes.
Differences to digital companies (RQ4):• Participants from digital companies expressed more con-cerns.
• A lack of interpretability can lead to disuse of data-drivenmethods.
when it comes to the integration of data-driven methodologies inUX development. However, data-driven methods based on fielduser interaction data can benefit the development and evaluation ofIVISs. In the pre-design phase, we see great potential in generatinga deeper understanding of the users and their behavior throughanalyses of field user interaction data. Data-driven methods canfacilitate decisions in early phases to prioritize features or products.Multiple approaches [5, 28, 48] that enhance the user understandingbased on analyses of automatically collected field user interactiondata can be leveraged to unlock this potential for IVISs. However, asparticipants also mentioned, these approaches should be consideredas an additional source of user feedback and not as a replacementfor already existing qualitative methods.
In the design phase, automated usability tests [8, 30, 46] can playan important role in making the design process more user-centeredand efficient at the same time. The fact that the context of use,i.e. the driving situation, is inherently contained in field data isanother key advantage. Additionally, the possibility to explicitlymap field user interaction data with naturalistic driving data createsnew opportunities in the design and evaluation of IVISs. One can,for example, predict driver distraction [7], secondary task engage-ment [40], or identify drivers based on their driving behavior [49].This allows considering the complex interactions between driver,car, and environment without the costs and bias introduced by sim-ulator experiments. This is in line with the findings made in earlierwork on this topic [36, 37]. However, to provide the biggest possiblevalue for practitioners, all automated methods should provide anexplanatory component and be triangulated with qualitative userfeedback.
In the post-design phase, there is a need to monitor the accep-tance and usage of IVISs after deployment. Here, data-driven meth-ods offer insights that can then benefit the next development cycle.
However, in line with the findings of Lamm and Wolff [25], au-tomated and model-based approaches currently do not play animportant role in the evaluation of IVISs. This originates from noneof the interviewed OEMs having a system in place that is explicitlydeveloped to record detailed user interactions. Current systems areyet built for different purposes and only modified to offer basic ca-pabilities, while dedicated systems are only available for test fleets.Legacy car architectures and long product life cycles aggravate the
Field User Interaction Data in the Automotive UX Development AutomotiveUI ’20, September 21–22, 2020, Virtual Event, DC, USA
difficulty to implement such new systems. Additionally, strong re-strictions regarding privacy and security are challenging for OEMs.However, a dedicated system for interaction logging that providesdetailed and high-quality data is the cornerstone of the potentialsintroduced by field data-driven methods.
6 CONCLUSIONOur results show that data-driven methods based on field user inter-action data can have great value for the automotive UX developmentlifecycle and can play an essential role in making the developmentof IVISs more user-centered. All automotive domain experts in ourstudy agree that there is a lack of implicit feedback through fielduser interaction data in UX development. These findings coincidewith the work of Orlovska et al. [36, 37]. Additionally, our resultssupport the disparity presented in Section 2.3 that in comparison tothe automotive domain, digital domains are far ahead in exploringthe potentials of field user interaction data. We conclude that thetransition from predominately explicit and qualitative user feed-back, e.g. through customer surveys or studies, to a combination ofthe former with implicit feedback through automatically collectedfield user interaction data is a necessary process for the develop-ment of an automotive UX fulfilling users’ diverse needs. Anotherimportant benefit is the statistical support of designers’ decisionsto overcome the current opinionated guesswork often encounteredin automotive UX development. Interestingly, in the automotiveand the digital domain, we identified a high potential for the auto-mated evaluation of field user interaction data and advanced usermodeling based on interaction data for early prototype evaluation.These identified potentials will be subject to future work to unlockthe benefits field user interaction data offers. Finally, the results ofthis work facilitate research on data-driven methods in the auto-motive UX development by directing the focus toward the needs,challenges, and concerns UX experts face today.
REFERENCES[1] Bashar I. Ahmad, Patrick M. Langdon, Simon J. Godsill, Robert Hardy, Lee
Skrypchuk, and Richard Donkor. 2015. Touchscreen usability and input per-formance in vehicles under different road conditions. In Proceedings of the 7thInternational Conference on Automotive User Interfaces and Interactive Vehicu-lar Applications - AutomotiveUI '15. ACM Press, Nottingham, 47–50. https://doi.org/10.1145/2799250.2799284
[2] Ignacio Alvarez, Adam Jordan, Juliana Knopf, Darrell LeBlanc, Laura Rumbel,and Alexandra Zafiroglu. 2017. The Insight–Prototype–Product Cycle BestPractices and Processes to Iteratively Advance In-Vehicle Interactive ExperiencesDevelopment. In Automotive User Interfaces. Springer International Publishing,Cham, Switzerland, 377–400. https://doi.org/10.1007/978-3-319-49448-7_14
[3] Richard Atterer, Monika Wnuk, and Albrecht Schmidt. 2006. Knowing the user'severy move. In Proceedings of the 15th international conference on World WideWeb - WWW '06. ACM Press, Edinburgh, Scotland, 203–212. https://doi.org/10.1145/1135777.1135811
[4] Edward H Baker, David Crusius, Marco Fischer, Walter Gerling, KaushikGnanaserakan, Henning Kerstan, Felix Kuhnert, Julia Kusber, Joachim Mohs,Manuel Schulte, Jonas Seyfferth, Juliane Stephan, and Trent Warnke. 2016. Con-nected car report 2016: Opportunities, risk, and turmoil on the road to au-tonomous vehicles. https://www.strategyand.pwc.com/gx/en/insights/2016/connected-car-2016-study.html
[5] Fabrício Benevenuto, Tiago Rodrigues, Meeyoung Cha, and Virgílio Almeida.2009. Characterizing user behavior in online social networks. In Proceedingsof the 9th ACM SIGCOMM conference on Internet measurement conference, AnjaFeldmann (Ed.). ACM,NewYork, NY, 49. https://doi.org/10.1145/1644893.1644900
[6] Manfred Broy. 2006. Challenges in Automotive Software Engineering. In Pro-ceedings of the 28th International Conference on Software Engineering (ICSE ’06).Association for Computing Machinery, New York, NY, USA, 33–42. https://doi.org/10.1145/1134285.1134292
[7] Emmanuel de Salis, Dan Yvan Baumgartner, and Stefano Carrino. 2019. Canwe predict driver distraction without driver psychophysiological state?. In Pro-ceedings of the 11th International Conference on Automotive User Interfaces andInteractive Vehicular Applications Adjunct Proceedings - AutomotiveUI '19. ACMPress, Utrecht Netherlands, 194–198. https://doi.org/10.1145/3349263.3351514
[8] Biplab Deka, Zifeng Huang, Chad Franzen, Jeffrey Nichols, Yang Li, and RanjithaKumar. 2017. ZIPT. In Proceedings of the 30th Annual ACM Symposium on UserInterface Software and Technology - UIST '17. ACM Press, Quebec City QC Canada,727–736. https://doi.org/10.1145/3126594.3126647
[9] Patrick Ebel, Ibrahim Emre Göl, Christoph Lingenfelder, and Andreas Vogelsang.2020. Destination Prediction Based on Partial Trajectory Data. In acceptedat: IEEE Intelligent Vehicles Symposium (IV). arXiv.org, Las Vegas Nevada, 1–7.https://arxiv.org/abs/2004.07473
[10] Ilker Etikan. 2016. Comparison of convenience sampling and purposive sampling.American journal of theoretical and applied statistics 5, 1 (2016), 1–4.
[11] Pierre Fastrez and Jean-Baptiste Haué. 2008. Designing and evaluating driversupport systems with the user in mind. International Journal of Human-ComputerStudies 66, 3 (mar 2008), 125–131. https://doi.org/10.1016/j.ijhcs.2008.01.001
[12] Anna Katharina Frison, Philipp Wintersberger, and Andreas Riener. 2019. Res-urrecting the ghost in the shell: A need-centered development approach foroptimizing user experience in highly automated vehicles. Transportation Re-search Part F Traffic Psychology and Behaviour 65 (2019), 439–456. https://doi.org/10.1016/j.trf.2019.08.001
[13] Anna-Katharina Frison, Philipp Wintersberger, Andreas Riener, Clemens Schart-müller, Linda Ng Boyle, Erika Miller, and Klemens Weigl. 2019. In UX WeTrust. In Proceedings of the 2019 CHI Conference on Human Factors in Com-puting Systems - CHI ’19, Stephen Brewster, Geraldine Fitzpatrick, Anna Cox,and Vassilis Kostakos (Eds.). ACM Press, New York, New York, USA, 1–13.https://doi.org/10.1145/3290605.3300374
[14] Michael A. Gerber, Ronald Schroeter, and Julia Vehns. 2019. A Video-BasedAutomated Driving Simulator for Automotive UI Prototyping, UX and BehaviourResearch. In Proceedings of the 11th International Conference on Automotive UserInterfaces and Interactive Vehicular Applications - AutomotiveUI '19. ACM Press,Utrecht Netherlands, 14–23. https://doi.org/10.1145/3342197.3344533
[15] Colin M. Gray. 2014. Evolution of design competence in UX practice. In Pro-ceedings of the 32nd annual ACM conference on Human factors in computingsystems - CHI '14. ACM Press, Toronto Ontario Canada, 1645–1654. https://doi.org/10.1145/2556288.2557264
[16] Greg Guest, Arwen Bunce, and Laura Johnson. 2006. How Many Interviews AreEnough?: An Experiment with Data Saturation and Variability. Field Methods 18,1 (feb 2006), 59–82. https://doi.org/10.1177/1525822x05279903
[17] Catherine Harvey and Neville A. Stanton. 2016. Usability Evaluationfor In-Vehicle Systems. Taylor & Francis Ltd., Boca Raton Florida.https://www.ebook.de/de/product/21182820/catherine_harvey_neville_a_stanton_usability_evaluation_for_in_vehicle_systems.html
[18] Catherine Harvey, Neville A. Stanton, Carl A. Pickering, Michael McDonald, andPengjun Zheng. 2010. Context of use as a factor in determining the usabilityof in-vehicle devices. Theoretical Issues in Ergonomics Science 12, 4 (jun 2010),318–338. https://doi.org/10.1080/14639221003717024
[19] Catherine Harvey, Neville A. Stanton, Carl A. Pickering, Mike McDonald, andPengjun Zheng. 2011. A Usability Evaluation Toolkit for In-Vehicle InformationSystems (IVISs). Applied Ergonomics 42, 4 (may 2011), 563–574. https://doi.org/10.1016/j.apergo.2010.09.013
[20] Marc Hassenzahl and Noam Tractinsky. 2006. User experience - a researchagenda. Behaviour & Information Technology 25, 2 (mar 2006), 91–97. https://doi.org/10.1080/01449290500330331
[21] RÃijdiger HeimgÃďrtner, Alkesh Solanki, and Helmut Windl. 2017. CulturalUser Experience in the Car—Toward a Standardized Systematic InterculturalAgile Automotive UI/UX Design Process. In Automotive User Interfaces. SpringerInternational Publishing, Cham Switzerland, 143–184. https://doi.org/10.1007/978-3-319-49448-7_6
[22] Moritz Körber and Klaus Bengler. 2013. Measurement of Momentary User Experi-ence in an Automotive Context. In Proceedings of the 5th International Conferenceon Automotive User Interfaces and Interactive Vehicular Applications (Automo-tiveUI ’13). Association for Computing Machinery, New York, NY, USA, 194–201.https://doi.org/10.1145/2516540.2516555
[23] Moritz Körber, Armin Eichinger, Klaus Bengler, and Cristina Olaverri-Monreal.2013. User experience evaluation in an automotive context. In 2013 IEEE Intelli-gent Vehicles Symposium Workshops (IV Workshops). Institute of Electrical andElectronics Engineers, Gold Coast City, Australia, 13–18. https://doi.org/10.1109/IVWorkshops.2013.6615219
[24] Klaus Krippendorff. 2018. Content analysis: An introduction to its methodology.Sage publications, Thousand Oaks, California.
AutomotiveUI ’20, September 21–22, 2020, Virtual Event, DC, USA Patrick Ebel, Florian Brokhausen, and Andreas Vogelsang
[25] Lukas Lamm and Christian Wolff. 2019. Exploratory Analysis of the ResearchLiterature on Evaluation of In-Vehicle Systems Interfaces and Interactive Ve-hicular Applications, AutomotiveUI 2019, Utrecht, The Netherlands, Septem-ber 21-25, 2019. In Proceedings of the 11th International Conference on Automo-tive User Interfaces and Interactive Vehicular Applications, AutomotiveUI 2019,Utrecht, The Netherlands, September 21-25, 2019, Christian P. Janssen, Stella F.Donker, Lewis L. Chuang, and Wendy Ju (Eds.). ACM, Utrecht, Netherlands,60–69. https://doi.org/10.1145/3342197.3344527
[26] Lai-Chong Law, Virpi Roto, Marc Hassenzahl, Arnold Vermeeren, and Joke Kort.2009. Understanding, scoping and defining user experience: A survey approach,In Proceedings of the SIGCHI conference on human factors in computing systems.Proc. CHI ’09 1, 27, 719–728. https://doi.org/10.1145/1518701.1518813
[27] John Lewis. 2009. Redefining Qualitative Methods: Believability in the FifthMoment. International Journal of Qualitative Methods 8, 2 (2009), 1–14. https://doi.org/10.1177/160940690900800201
[28] Zhicheng Liu, Yang Wang, Mira Dontcheva, Matthew Hoffman, Seth Walker, andAlan Wilson. 2017. Patterns and Sequences: Interactive Exploration of Click-streams to Understand Common Visitor Paths. IEEE transactions on visualizationand computer graphics 23, 1 (2017), 321–330. https://doi.org/10.1109/TVCG.2016.2598797
[29] Andreas LÃűcken, Shadan Sadeghian Borojeni, Heiko MÃijller, Thomas M. Gable,Stefano Triberti, Cyriel Diels, Christiane Glatz, Ignacio Alvarez, Lewis Chuang,and Susanne Boll. 2017. Towards Adaptive Ambient In-Vehicle Displays andInteractions: Insights and Design Guidelines from the 2015 AutomotiveUI Dedi-cated Workshop. In Automotive User Interfaces. Springer International Publishing,Nottingham, UK, 325–348. https://doi.org/10.1007/978-3-319-49448-7_12
[30] Xiaoxiao Ma, Bo Yan, Guanling Chen, Chunhui Zhang, Ke Huang, Jill Drury,and Linzhang Wang. 2012. Design and Implementation of a Toolkit for UsabilityTesting of Mobile Apps. Mobile Networks and Applications 18, 1 (nov 2012), 81–97.https://doi.org/10.1007/s11036-012-0421-z
[31] Joseph A Maxwell. 2012. Qualitative research design: An interactive approach.Vol. 41. Sage publications, Thousand Oaks, California, USA.
[32] Vidhya Navalpakkam and Elizabeth Churchill. 2012. Mouse tracking. In Pro-ceedings of the 2012 ACM annual conference on Human Factors in Comput-ing Systems - CHI '12. ACM Press, New York, NY, United States, 2963–2972.https://doi.org/10.1145/2207676.2208705
[33] Michael Nebeling, Maximilian Speicher, and Moira C. Norrie. 2013. CrowdStudy.In Proceedings of the 5th ACM SIGCHI symposium on Engineering interactivecomputing systems - EICS '13. ACM Press, London, UK, 255 – 264. https://doi.org/10.1145/2494603.2480303
[34] Jakob Nielsen. 1992. The usability engineering life cycle. Computer 25, 3 (1992),12–22. https://doi.org/10.1109/2.121503
[35] Julia Orlovska, FjollÃń Novakazi, Bligård Lars-Ola, MariAnne Karlsson, CasperWickman, and Rikard SÃűderberg. 2020. Effects of the driving context on theusage of Automated Driver Assistance Systems (ADAS) -Naturalistic DrivingStudy for ADAS evaluation. Transportation Research Interdisciplinary Perspectives4 (feb 2020), 100093. https://doi.org/10.1016/j.trip.2020.100093
[36] Julia Orlovska, Casper Wickman, and Rikard Söderberg. 2018. Big Data Anal-ysis as a new Approach for Usability Attributes Evaluation of User InterfacesAn Automotive Industry Context. In Proceedings of the DESIGN 2018 15th In-ternational Design Conference (Design Conference Proceedings). Faculty of Me-chanical Engineering and Naval Architecture, University of Zagreb, Croatiaand The Design Society, Glasgow, UK, Dubrovnik, Croatia, 1651–1662. https://doi.org/10.21278/idc.2018.0243
[37] Julia Orlovska, CasperWickman, and Rikard Söderberg. 2018. Big Data Usage CanBe a Solution for User Behavior Evaluation: An Automotive Industry Example.Procedia CIRP 72 (2018), 117–122. https://doi.org/10.1016/j.procir.2018.03.102
[38] Bastian Pfleging, Stefan Schneegass, and Albrecht Schmidt. 2012. Multimodalinteraction in the car. In Proceedings of the 4th International Conference on Au-tomotive User Interfaces and Interactive Vehicular Applications - AutomotiveUI'12. ACM Press, Portsmouth, New Hampshire, 155–162. https://doi.org/10.1145/2390256.2390282
[39] Andreas Riener, Myounghoon Jeon, Ignacio Alvarez, and Anna K. Frison. 2017.Driver in the Loop: Best Practices in Automotive Sensing and Feedback Mecha-nisms. In Automotive User Interfaces. Springer International Publishing, Cham,Switzerland, 295–323. https://doi.org/10.1007/978-3-319-49448-7_11
[40] Martina Risteska, Joyita Chakraborty, and Birsen Donmez. 2018. Predict-ing Environmental Demand and Secondary Task Engagement using VehicleKinematics from Naturalistic Driving Data. In Proceedings of the 10th Interna-tional Conference on Automotive User Interfaces and Interactive Vehicular Ap-plications - AutomotiveUI '18. ACM Press, New York, NY, United States, 66–73.https://doi.org/10.1145/3239060.3239091
[41] Virpi Roto, Effie Lai-Chong Law, Arnold P. O. S. Vermeeren, and Jettie Hoonhout.2011. User Experience White Paper âĂŞ Bringing clarity to the concept ofuser experience. In Dagstuhl Seminar on Demarcating User Experience. Dagstuhlreports, Dagstuhl, Germany, 1–26.
[42] Virpi Roto, Heli Rantavuo, and Kaisa Väänänen. 2009. Evaluating user experienceof early product concepts. Proceeding of the International Conference on DesigningPleasurable Products and Interfaces DPPI09 4 (2009), 1–10.
[43] Johnny Saldaña. 2015. The coding manual for qualitative researchers. Sage, NewYork, NY, United States.
[44] Stefan Schneegass, Bastian Pfleging, Nora Broy, Albrecht Schmidt, and FrederikHeinrich. 2013. A data set of real world driving to assess driver workload. InProceedings of the 5th International Conference on Automotive User Interfacesand Interactive Vehicular Applications - AutomotiveUI '13. ACM Press, Eindhove,Netherlands, 150–157. https://doi.org/10.1145/2516540.2516561
[45] Ronald Schroeter, Andry Rakotonirainy, and Marcus Foth. 2012. The social car.In Proceedings of the 4th International Conference on Automotive User Interfacesand Interactive Vehicular Applications - AutomotiveUI '12. ACM Press, Portsmouth,New Hampshire, 107–110. https://doi.org/10.1145/2390256.2390273
[46] Maximilian Speicher, Andreas Both, andMartin Gaedke. 2015. Inuit: The InterfaceUsability Instrument. In Design, User Experience, and Usability: Design Discourse.Springer International Publishing, Heidelberg, Germany, 256–268. https://doi.org/10.1007/978-3-319-20886-2_25
[47] Kaisa VÃďÃďnÃďnen, Virpi Roto, and Marc Hassenzahl. 2008. Towards PracticalUser Experience Evaluation Methods. Meaningful measures: Valid useful userexperience measurement (VUUM) (01 2008), 1–4.
[48] Gang Wang, Xinyi Zhang, Shiliang Tang, Haitao Zheng, and Ben Y. Zhao. 2016.Unsupervised Clickstream Clustering for User Behavior Analysis. In Proceedingsof the 2016 CHI Conference on Human Factors in Computing Systems (CHI ’16).Association for Computing Machinery, New York, NY, USA, 225–236. https://doi.org/10.1145/2858036.2858107
[49] Cheng Zhang, Mitesh Patel, Senaka Buthpitiya, Kent Lyons, Beverly Harrison,and Gregory D. Abowd. 2016. Driver Classification Based on Driving Behaviors.In Proceedings of the 21st International Conference on Intelligent User Interfaces -IUI '16. ACM Press, New York, NY, United States, 80–84. https://doi.org/10.1145/2856767.2856806