The ROI of the PA Dutch Convention & Visitors Bureau ... Economics... · 2.6 Perishability of the...
40
May 28, 2014 The ROI of the PA Dutch Convention & Visitors Bureau Promotional Activities
Transcript of The ROI of the PA Dutch Convention & Visitors Bureau ... Economics... · 2.6 Perishability of the...

May 28, 2014
The ROI of the PA Dutch Convention & Visitors Bureau Promotional Activities

The ROI of the PA Dutch Convention & Visitors Bureau Promotional Activities May 2014
2
Contents
1. Executive Summary ........................................................................ 3
2. Vital Role of Destination Promotion ............................................... 4
2.1 Tourism as a fragmented sector ................................................................. 5
2.2 Efficiencies of scale and stable, sustained operations ............................... 6
2.3 Essence of the tourism product .................................................................. 7
2.4 Competitive market ..................................................................................... 7
2.5 Global market opportunity ........................................................................... 8
2.6 Perishability of the tourism product and seasonality of demand ..............10
3. Key Performance Indicator Analysis ........................................... 11
4. Market Share Analysis .................................................................. 15
4.1 Visitor spending.........................................................................................16
4.2 Tourism employment ................................................................................18
4.3 Room revenue based on bed tax receipts ................................................19
4.4 Hotel performance as measured by STR .................................................21
5. Case Study Review........................................................................ 24
5.1 Destination marketing ROI matrix .............................................................24
5.2 Case studies in which destination marketing spending was reduced.......28
5.3 Brand USA and the effectiveness of destination marketing .....................29
6. Economic Impact Analysis ........................................................... 32
6.1 Economic impact of travel and tourism in Lancaster County ....................32
6.2 Economic impact of PDCVB .....................................................................36
7. About Tourism Economics ........................................................... 39

The ROI of the PA Dutch Convention & Visitors Bureau Promotional Activities May 2014
3
1. Executive Summary
Destination marketing is a proven driver of economic development and is
particularly important due to the unique characteristics of the tourism sector. To
document the important role of Pennsylvania Dutch Convention and Visitors Bureau
(PDCVB) promotional activities, Tourism Economics has conducted a multi-layered
analysis.
The analysis begins with an explanation of the vital role that destination promotion
plays in Lancaster County. Given the characteristics of the tourism sector, including
its fragmented structure and prevalence of small businesses, individual businesses
lack the economic incentives and financial wherewithal to independently conduct
true destination marketing. As a destination marketing organization (DMO), the
PDCVB communicates a coordinated, sustained message to potential travelers that
conveys important aspects of Lancaster County as a destination. These activities
help Lancaster County stay relevant and visible in the eyes of potential travelers, to
maintain relationships with tour operators, and keep a current online presence that
is useful to households whether they are in the Mid-Atlantic region, or across the
globe.
Tourism Economics’ analysis of key performance indicators shows an organization
that continues to succeed at not only creating brand awareness through advertising,
but also driving interest among potential visitors that results in interaction with the
PDCVB as a source of information on the destination.
To assess changes in Lancaster County’s tourism market share over recent years,
Tourism Economics conducted a market share analysis across four measures of
tourism activity. The results show that Lancaster County has grown its market share
as measured by visitor spending and accommodations revenue as tracked by room
rental taxes, and maintained its share of employment. The analysis also shows that
Lancaster County hotels have posted stronger occupancy and RevPAR gains than
comparable regions. In dollar terms, market share improvements between 2007 and
2012 translated into $51.5 million of additional visitor spending and $7.9 million of
additional room rental revenue.
The analysis concludes with two final sections. The first is a case study review that
documents the importance of destination marketing based on typical ranges of
estimated marketing returns that are realized by DMOs, and by considering case
study examples in which marketing funding reductions have resulted in substantial
declines in visitation. The second is an analysis of the economic impacts of tourism
in Lancaster County updated on a preliminary basis for 2013, and the estimated
PDCVB contribution to these impacts. In total, $1.9 billion of direct visitor spending
in Lancaster County by 7.9 million visitors helps support almost 23,700 tourism
economy jobs and generate $184.7 million of state and local taxes. Of this, the
PDCVB contribution represents approximately $120.9 million of visitor spending,
supporting almost 1,600 jobs and $10.2 million of state and local taxes.

The ROI of the PA Dutch Convention & Visitors Bureau Promotional Activities May 2014
4
2. Vital Role of Destination Promotion
The case for destination marketing is broad and compelling. Indeed, across the US,
there are more than 500 destination marketing organizations (DMOs) with a
combined budget of $1.5 billion in the 2011/12 fiscal year. This chapter briefly
outlines the rationale for destination marketing and the particular importance of the
Pennsylvania Dutch Convention and Visitors Bureau (PDCVB) in fostering the
economic value for Lancaster County of the tourism sector.
In summary, destination marketing is vital because:
The tourism sector is fragmented across various industries and is
made up of smaller companies. Individual businesses lack the
capacity to conduct certain types of marketing effectively, and certain
benefits accrue across the economy rather to just an individual
business.
Scale supports marketing efficiencies, leveraging the impact of each
marketing dollar. DMOs provide a stable base for coordinated
marketing over time.
The destination and overall experience of an area is a fundamental
motivator of tourism. As a result, the message to a potential traveler
extends beyond the offerings of a single business.
Competing destinations are actively marketing and a failure to
engage with travel markets results in lost market share.
The global market opportunity is vast, presenting attractive growth
prospects for domestic destinations that can present a coordinated
message to potential visitors.
Destination marketing helps address challenges presented by the
perishability of tourism products and the seasonality of demand.
Lastly, as discussed in case studies in Section 2, destination marketing has been
proven to be historically effective, producing returns in excess of investments and
greater than many other sectors.

The ROI of the PA Dutch Convention & Visitors Bureau Promotional Activities May 2014
5
Other transport25%
Lodging20%
Food & beverage
16%
Air transport16%
Shopping13%
Recreation and Ent.
10%
Distribution of tourism spending in the US2012, Share of total spending
Source: BEA Travel & Tourism Satellite Account
2.1 Tourism as a fragmented sector
The tourism sector faces two natural disadvantages that impact destination
marketing. The first is that tourism is not represented by a single industry, the
second is that many tourism sector businesses are small establishments. As a
result, relying on individual businesses to conduct independent destination
marketing would leave a destination short of its potential. Collaborative destination
marketing effectively deals with this challenge by representing a fragmented tourism
industry as a single product to a common customer. Destination marketing
represents all of these disparate businesses to origin markets in a way that no
single business or industry segment could.
The following provides a more thorough discussion of these
points.
- Tourism spending is spread across multiple
industries. As with the national view of the
distribution of tourism spending presented in an
accompanying graph, visitors are customers to
Lancaster County businesses across numerous
industries, including hotels, restaurants, shops, rental
car companies, taxi services, museums, and
theaters. As a result, a visitor benefits multiple
segments of the Lancaster County economy.
- Tourism-related businesses tend to be smaller
than in other sectors. Similar to national norms, the
tourism sector in Lancaster County is comprised of
small and medium sized businesses, and many
businesses have fewer than 50 employees. Of the
110 lodging establishments in the County listed by STR at year-end 2013,
the average room count was 63 rooms per property and the largest hotel
had a roughly 5% share of total room supply in the County. At the level of an
individual destination, this implies that very few of these organizations would
have the resources needed for concerted investments in destination
marketing.
- Coordinated destination marketing addresses the challenges posed by
the tourism industry structure. As a result of the industry structure,
independent marketing of the destination by individual businesses can be
far less compelling than coordinated destination marketing. Because a
visitor’s spending is spread across businesses, any single business may not
capture sufficient share of a visitor’s spending to justify marketing to attract
visitors to a destination. For example, an individual hotel could market the
attractiveness of a destination, but it would only benefit from those

The ROI of the PA Dutch Convention & Visitors Bureau Promotional Activities May 2014
6
additional visitors who not only choose the destination, but also choose that
particular hotel; and the hotel would only benefit directly from the visitor’s
spending at the hotel and not other businesses in the area. In other words,
at the level of an individual business, the returns on independent marketing
to attract visitors to a destination can be less compelling. However, when
viewed at the level of the destination, there is a more direct connection. The
destination captures a substantial dollar amount per visitor, and in
aggregate there are compelling returns on effective destination marketing.
The fragmented nature of the sector, and the prominence of small businesses in the
Lancaster County tourism industry, implies that no one business entity would have
the resources to adequately fund the promotion activities conducted by PDCVB in a
way that would generate meaningful returns in the form of increased visitation.
Hence, collaborative destination marketing by PDCVB plays a vital role, and yields
results that benefit the Lancaster County economy, including its businesses and
other stakeholders.
2.2 Efficiencies of scale and stable, sustained operations
Effective destination marketing requires significant and consistent funding with the
aim of gaining a sufficient “share of voice” to be heard and make an impact. While
the cost of media purchases is expensive, per unit advertising costs go down as the
volume of purchases goes up. Further, scale produces efficiencies that reduce
overhead and maximize the share of funding that goes to actual marketing and
advertising. As a result, the larger scale of collaborative destination marketing is
more effective than what individual businesses could accomplish. Simply put, the
whole of destination marketing is greater than the sum of individual parts.
One of the benefits of coordinated marketing facilitated by a DMO such as PDCVB
is the ability to have a stable organization and funding base to support destination
marketing. For example, this allows a DMO to build the infrastructure, brand
awareness, and relationships that yield results over time.
As a result, PDCVB is at the point at which it is effectively using annual funds to
leverage a brand, infrastructure and relationships that have been built up over time.
For example, in terms of marketing, because a base level of awareness of the
destination has already been established with some target customers, additional
annual marketing spend can be more effective at activating and reinforcing key
messages. Infrastructure, such as the website, and the processes around
maintaining and updating material such as the Lancaster County Getaway Guide, as
well as current staff of the organization, represent key resources, allowing PDCVB
to accomplish more with its marketing budget than it could without such resources.
Also, PDCVB supports market research, such as visitor profile studies, that help
individual businesses better target market opportunities, but which would likely not
be economical for individual businesses to support independently. Lastly, PDCVB
The ROI of the PA Dutch Convention & Visitors Bureau Promotional Activities May 2014
7
leverages established relationships with local tourism-sector businesses and
marketing service providers that enable it to better promote Lancaster County as a
destination.
2.3 Essence of the tourism product
The fundamental motivation driving a visit to Lancaster County is not a single
business—it is the destination and the overall experience the area has to offer. This
experience is comprised of a visitor’s interaction with and patronage of numerous
businesses and local experiences: hotels and other accommodations; restaurants;
shopping and galleries; conferences; performances and other events; family
activities; sports and other recreation; and cultural sites and attractions. In many
cases, the choice of a hotel, for example, is not the primary decision for potential
visitors choosing between Lancaster County and another destination.
Instead, for many visitors the destination is the primary decision and as a result,
destination marketing is an essential driver of demand for tourism-related goods.
Marketing efforts that focus on only one segment of the tourism market, such as
communicating the offering of a specific hotel or other business, do not also
adequately address the core motivation for potential visitors. The activities of
PDCVB recognize that fact. By banding together, the members of the County’s
tourism industry are able to represent the destination collectively, and in doing so
drive demand for all segments of the tourism industry. Stand-alone marketing efforts
would almost certainly be less effective than a collective destination marketing
campaign.
As an example, packages that are offered by partnerships of local businesses, or in
conjunction with events held throughout the year, are also part of the vital role of
destination marketing. Coordination and marketing of such packages may be more
effective when the package offers the potential visitor the option of several hotels or
dining choices as a part of the package.
2.4 Competitive market
To lack destination promotion is to lose market share. This is partly evident by the
sheer number of DMOs in the US and the amount invested annually. One oft-cited
example of what happens when destination promotion is defunded comes from
Colorado. Prior to 1993, Colorado had a $12 million marketing budget, funded by a
0.2% tax on travel-related goods and services. Voters struck down the tax,
effectively eliminating the marketing and promotion budget. The effect of the abrupt
stop to marketing was significant and swift: Colorado lost 30% of its market share of
US tourism within two years and more than $1.4 billion annually in visitor spending.
When a new Colorado Tourism office opened and the budget was expanded,
spending recovered.

The ROI of the PA Dutch Convention & Visitors Bureau Promotional Activities May 2014
8
50%
55%
60%
65%
70%
75%
80%
85%
90%
95%
1996 1998 2000 2002 2004 2006 2008 2010 2012
US Share of North American Outbound% out-of-region travel by source
Source: Tourism Economics
Mexico
Canada
Another example has played out on a national level, as the US competes to attract
visitors from other countries. Similar to the regional destination level, the absence of
destination marketing at the national level can lead to a lack of competitiveness and
declines in market share. Global competition for such international travelers is
steep, with tourism offices around the world devoting significant resources to
destination marketing. Oxford Economics, the parent company of Tourism
Economics, estimates that $4.3 billion was spent on national level tourism promotion
in 2012; primarily by European ($1.7 billion) and Asia Pacific destinations ($1.2
billion). Although the United States remains a top destination among worldwide
travelers, during a 15 year period, beginning in 1996 and 1997 (depending on the
market), the United States lost market share to destinations with consistently funded
destination marketing programs (see accompanying graphs).
Tourism Economics works with national tourism offices around the world and
regularly observes the positive effects of tourism campaigns sponsored by these
organizations. Implicitly, these activities result in lost market share among
destinations that are not investing in destination promotion. And this is one of the
reasons that the United States has lost global market share.
2.5 Global market opportunity
The sheer size of the global travel market also makes a compelling case for
destination marketing. Since 1990, growth in international travel has averaged 4%
per annum and has expanded a cumulative 62% since 2000. In 2013, international
tourist arrivals reached 1.1 billion. Many of these travelers have limited, or no, initial
familiarity with the offerings of Lancaster County as a destination. By working with
tour group leads, and providing resources such as its website, PDCVB helps
promote Lancaster County to visitors from these growing markets in ways that
extend beyond the capabilities of many small or medium-sized tourism businesses.
0%
5%
10%
15%
20%
25%
30%
35%
40%
45%
50%
1996 1998 2000 2002 2004 2006 2008 2010 2012
US Share of Long Haul Outbound Travel% out-of-region travel by source
Source: Tourism Economics
South America
Europe
Asia

The ROI of the PA Dutch Convention & Visitors Bureau Promotional Activities May 2014
9
This rate of global travel growth is expected to persist as the global middle class
continues to expand (see accompanying graphs). By 2020, the global market for
international travel is expected to reach 1.5 billion annual tourist arrivals.
The growth of the US tourism industry, in all of its parts, depends largely on its
success in attracting international visitors. International markets represent the
highest growth area of business for the tourism sector in the United States. In 2007,
international visitor spending on US trips represented 16% of all travel spending in
the United States. In 2013, this is estimated to have reached 20% and is expected
to continue to rise based on Oxford Economics latest econometric forecasts.
0 5 10 15 20
China
India
Indonesia
Malaysia
Thailand
New "Middle-Class" Households 2013-23millions
Source: Oxford Economics
75 mn
9 mn
7 mn
2 mn
1 mn
0
200
400
600
800
1,000
1,200
1,400
1,600
1990 1993 1996 1999 2002 2005 2008 2011 2014 2017 2020
International tourist arrivals by regionMillions
Source: Tourism Economics
Americas
Europe
Asia Pacific
Mideast & Africa
50
100
150
200
250
2007 2009 2011 2013 2015 2017 2019
US visitor spending by type2007=100
Source: U.S. Travel Association, BEA, Tourism Economics
International travel spending
Domestic travel spending
15%
16%
17%
18%
19%
20%
21%
22%
23%
2007 2009 2011 2013 2015 2017 2019
International visitor spendingShare of total visitor spending (including domestic and international)
Source: U.S. Travel Association, BEA, Tourism Economics

The ROI of the PA Dutch Convention & Visitors Bureau Promotional Activities May 2014
10
2.6 Perishability of the tourism product and seasonality of demand
In manufacturing, inventory can be stored or redistributed to markets where demand
is stronger, and seasonal fluctuations in demand can be managed effectively. This
same degree of flexibility doesn’t exist for many tourism-dependent businesses, the
product of which is perishable, fixed in one market, and typically under more heavy
demand during some seasons and days of the week than others.
For example, in the lodging sector, the product sold is a room night, which cannot
be held over to another day. If a room goes unoccupied, the potential room night
sale and associated revenue are lost. The hotel product depends heavily on
infrastructure, which cannot be picked up and moved to another location. Also, the
upfront investment of capital required in lodging, and the fixed nature of many
operating costs, results in a situation in which successful ongoing operations are
frequently heavily dependent on demand reaching a “break even” level of
operations. Restaurant and retail products are less perishable in a direct sense,
however management of inventory and staffing for these industries is also
challenging, particularly for the types of small businesses that make up Lancaster
County’s tourism industry. In situations in which demand is concentrated in peak
periods, staffing can be challenging for employers and employees alike due to
season duration.
Effective destination marketing helps address these challenges. By broadening
potential visitors’ understanding of a destination’s offering, destination marketing is
frequently designed to boost demand during shoulder periods. This helps
businesses make use of resources that would otherwise be idle, extends the
duration of seasonal employment, and supports a better base for year-round jobs.
This incremental activity supported by destination marketing can be critically
important to successful and profitable operations in the tourism sector. The end
result is a level of market demand that benefits local businesses, employees and
other stakeholders and expands the tax base.

The ROI of the PA Dutch Convention & Visitors Bureau Promotional Activities May 2014
11
3. Key Performance Indicator Analysis
As a window to recent PDCVB promotional activities, Tourism Economics analyzed
information provided by PDCVB and selected a set of key performance indicators.
These measures track advertising exposure, as well as interactions with the
PDCVB, such as through the website and room bookings.
To document the advertising activities of PDCVB, Tourism Economics relied on an
analysis presented by Harmelin Media and marketing budget information provided
by PDCVB.1 Key aspects of PDCVB’s 2013 advertising are summarized as follows:
- Marketing activities were focused on reaching specific target markets. For
example, a condensed list of geographic markets was used, and media mix
was selected to reach women ages 25-54 with families, and couples/empty
nesters ages 45-64 in particular. Also, digital marketing was introduced to
extend PDCVB’s reach to targets with active, evolving lifestyles.
- Television advertising was targeted to Harrisburg/Lancaster/Lebanon/York
(HLLY), Philadelphia and New York (Long Island and Northern NJ). The
advertising delivered 1,933 target rating points (TRPs).2
- The digital campaign was targeted to the same markets as the television
marketing, plus Washington DC. The display and online video campaigns
combined generated over 27,000 clicks and over 3.3 million completed
video views (81.4% video completion rate, above industry benchmarks) on
nearly 12 million impressions. Search engine marketing resulted in 1.8
million impressions through the end of October 2013, with a click-through-
rate of 5.1%.
- Out of home advertising, including billboards, generated 42.6 million gross
impressions.
Such advertising is designed to influence the trip planning process of a potential
visitor. In many cases, these households take an intermediate step in the trip
planning process to learn more about Lancaster County by interacting with the
PDCVB in some way. To document such interactions, and to provide a view to
various other marketing conducted by PDCVB beyond the advertising described
1 Harmelin Media (2013, November) PA Dutch Convention & Visitors Bureau 2013
Media Recap & Post Analysis.
2 TRPs is a measure of the number of ad impressions delivered to the target group
population. For example, if 50% of a target population sees an ad spot four times a
week for 10 weeks, that is equivalent to 2,000 TRPs (50 x 4 x 10).

The ROI of the PA Dutch Convention & Visitors Bureau Promotional Activities May 2014
12
above, Tourism Economics selected a set of PDCVB metrics for further
consideration, and noted the following observations.
- Potential visitors are interacting with PDCVB through a variety of means.
These activities include online means, extending from the website, which
received 2.3 million visits and generated over 33,000 sign-ups for email
communications, to Facebook, where the PDCVB recorded over 26,000
measures of engagement such as likes and shares. Offline interactions
were also substantial, with over 106,000 visitors recorded at the two visitor
centers combined, and distribution of over 755,000 copies of the Getaway
Guide
- While some activities decreased in 2013, many of the key measures
increased. Some of these shifts appear consistent with a transition to online
mediums. For example, while distributions of the Getaway Guide and visits
to the visitors centers decreased, online and other types of offline activities
increased, such as website visits, public relations stories, and room nights
booked.
Overall, the metrics support the picture of a DMO that continues to succeed at not
only creating brand awareness through advertising, but also driving interest among
potential visitors that results in interaction with the PDCVB as a source of
information on the destination.

The ROI of the PA Dutch Convention & Visitors Bureau Promotional Activities May 2014
13
Metric 2012 2013 Change
Website
Visits 2,165,661 2,333,793 8%
Page views 10,768,992 10,538,248 -2%
Unique visitors 1,473,609 1,636,698 11%
Website Visits From Top Feeder Markets
Philadelphia 390,252 380,903 -2%
New York 386,381 367,263 -5%
Harrisburg/Lancaster/
Lebanon/York (HLLY) 343,240 360,618 5%
Washington D.C. 155,774 150,923 -3%
Baltimore 83,950 85,530 2%
Website Conversion Rate
Email sign-ups 38,393 33,159 -14%
Clicks to member websites 1,155,126 1,282,140 11%
Reservation inquiries 214,175 143,351 -33%
Getaway Guide requests 47,124 40,776 -13%
Consumer e-Marketing
Number of emails opened 499,688 749,111 50%
Advertiser click thru 9,541 9,867 3%
Total click thru 182,121 182,401 0.2%
Site visits 141,108 128,636 -9%
Engagement (likes, shares,
comments) 13,253 26,199 98%
Website visits 8,631 29,734 245%
Source: PDCVB
PDCVB Online Activity

The ROI of the PA Dutch Convention & Visitors Bureau Promotional Activities May 2014
14
Metric 2012 2013 Change
Getaway Guide Distribution
Total 793,558 755,279 -5%
Visitor Center Traffic
Greenfield Visitors Center 106,977 79,550 -26%
Downtown Visitors Center 31,445 26,978 -14%
Total 138,422 106,528 -23%
PR Activity
Number of stories 1,038 1,738 67%
Audience impressions (in
billions) 1.1 2.0 82%
Ad value (in millions) $8.5 $12.2 44%
Reservation Center
Leisure room nights 3,186 1,617 -49%
Sports & convention room
nights 11,645 23,130 99%
Sales Activity
Lead room nights 146,839 120,137 -18%
Room nights booked 45,974 52,240 14%
Source: PDCVB
PDCVB Offline Activity

The ROI of the PA Dutch Convention & Visitors Bureau Promotional Activities May 2014
15
4. Market Share Analysis
Recent years have witnessed substantial shifts in travel activity across the country,
initially as travelers responded to the national recession that extended from
December 2007 to June 2009 by pulling back on trips and spending, and more
recently as travel activity has resumed. To understand the recent performance of
the tourism sector in Lancaster County, and to understand how Lancaster County’s
market share has weathered these changes, it is useful to consider several sets of
comparable markets in the region. It is also useful to consider several sets of
indicators to help form a holistic understanding of relative performance trends.
The overall message from the discussion that follows is that Lancaster County has
improved its tourism market share slightly in recent years, and is emerging from the
recession well-positioned to further grow tourism as a key industry in the local
economy. The following key points are noted:
- In terms of visitor spending, Lancaster County tourism has grown at a
slightly faster pace than the state (in this case, the state total adjusted to
remove Philadelphia and Pittsburgh). Overall, this indicates that Lancaster
County is improving its market share and attractiveness in the eyes of
visitors. With national and regional economies that are gradually recovering
from the recession, and visitor spending volumes that are expanding,
Lancaster County is a competitive destination that is positioned to continue
to retain and grow its market share.
- In terms of tourism employment, Lancaster County tourism has expanded,
exceeding the pace of growth in some comparable regions, but has grown
at a slower pace than the adjusted state total. Given the favorable
indications on the other market share measures, there is potential for
Lancaster County tourism employment to continue to grow in future years.
- In terms of accommodations revenue as tracked by room rental taxes,
which provides a broad measure of hotel, motel, and B&B performance,
Lancaster County accommodations establishments have out-performed
peers in comparable regions.
- In terms of lodging performance as tracked STR, a firm that aggregates
hotel and motel performance data, Lancaster County hotels have out-
performed peers in comparable regions as measured by strong occupancy
and RevPAR gains.
The following provides a more detailed discussion of the market share analysis
across four measures of tourism activity: visitor spending, tourism employment,
estimated room revenue based on bed tax receipts, and hotel performance as
measured by STR.

The ROI of the PA Dutch Convention & Visitors Bureau Promotional Activities May 2014
16
4.1 Visitor spending
As part of its annual analysis for the Commonwealth of Pennsylvania, Tourism
Economics estimates visitor spending in each county.3 These estimates show a total
of $1.8 billion of tourism sector spending by visitors to Lancaster County during
2012, an increase of 26.5% from the level of $1.4 billion in 2005 (reflects rounding).4
These estimates are based on visitor spending surveys and industry data.
Tourism Economics analyzed visitor spending in Lancaster County in relation to the
following areas:
- Dutch Country Roads region, of which Lancaster County is one of nine
counties (Adams, Berks, Cumberland, Dauphin, Franklin, Lancaster,
Lebanon, Perry, and York counties);
- Valleys of the Susquehanna, a five-county region (Columbia, Montour,
Northumberland, Snyder, and Union counties);
- The Alleghenies, an eight-county region (Bedford, Blair, Cambria, Centre,
Fulton, Huntingdon, Juniata, and Mifflin counties); and,
- The state, adjusted to exclude the counties that are part of the Philadelphia
and Pittsburgh metropolitan statistical areas (for Philadelphia this includes
five Pennsylvanian counties, and for Pittsburgh this includes seven).
The Lehigh Valley region was excluded from the comparisons, as the opening of a
casino in Bethlehem, PA in 2009 impacts the visitor spending growth in a way that is
not comparable with Lancaster County.
To support comparability across the regions, Tourism Economics indexed the
spending levels such that spending in each region was equal to 100 in 2005. In the
accompanying graph, the index value of 126.5 for Lancaster County shows that the
26.5% increase since 2005 trails only the Valleys of the Susquehanna region, and
slightly outpaces the Dutch Country Roads and The Alleghenies regions and the
state.
3 Tourism Economics (2013, December). The Economic Impact of Travel and
Tourism in Pennsylvania, Tourism Satellite Account Calendar Year 2012.
4 The economic analysis section of this report includes a preliminary estimate of
2013 visitor spending in Lancaster County for the purpose of estimating economic
impacts of travel and tourism during 2013. For the purpose of the market share
analysis, discussion is limited to the period through 2012, as that is the period with
comparable information across regions.

The ROI of the PA Dutch Convention & Visitors Bureau Promotional Activities May 2014
17
To take a closer look at the more recent performance in Lancaster County, Tourism
Economics calculated the change in market share from 2007 to 2012. As shown in
the adjacent table, Lancaster County improved from a 7.9% share of state visitor
spending in 2007 (excluding Philadelphia and Pittsburgh) to a 8.2% share in 2012,
representing a market share increase of 20 basis points (reflects rounding). As
shown in the accompanying table, a comparison of actual 2012 visitor spending in
Lancaster County to the hypothetical level of spending that would have occurred
without an increase in market share (i.e. remaining at 7.9%), shows that the market
share increase resulted in a gain of $51.5 million of additional visitor spending,
equivalent to a 2.9% increase of visitor spending relative to the hypothetical
alternative.
95
100
105
110
115
120
125
130
2005 2006 2007 2008 2009 2010 2011 2012
Valleys of the Susquehanna (128.1) Lancaster County (126.5)
State (excluding Phila. and Pitt.) (126) Dutch Country Roads (126.1)
The Alleghenies (124.6)
Visitor Spending
Index (2005=100)
Source: Tourism Economics

The ROI of the PA Dutch Convention & Visitors Bureau Promotional Activities May 2014
18
4.2 Tourism employment
Tourism Economics’ analysis for the Commonwealth also includes estimates of
tourism sector employment in Lancaster County, such as is supported by visitor
spending on lodging, retail, food and beverage, and other services. As a
supplemental measure of market share trends, an accompanying graph shows
tourism employment in Lancaster County as compared to selected comparable
regions. On the basis of employment, Lancaster County’s tourism sector has
expanded each year, with the exception of 2009 (due to the national recession). As
a result, tourism employment in 2012 in Lancaster County was 7.9% higher than in
2005. However, growth in Lancaster County has been somewhat slower than at the
state level. Despite this slower growth, there is still potential for Lancaster County to
continue to grow tourism sector employment in future years, especially because
other measures of market share and performance appear favorable.
Tourism spending analysis
Lancaster County market share (ratio to State excluding
Philadelphia and Pittsburgh)
7.9% 2007
8.2% 2012
20 Market share increase (in basis points, reflects rounding)
$1,817.5 Lancaster County tourism spending in 2012 (in millions)
$1,766.0 Hypothetical Lancaster County tourism spending in 2012 if market
share had remained at 2007 level (in millions)
$51.5 Gain attributable to improved market share (in millions)
2.9% Percentage increase attributable to improved market share
Source: Tourism Economics
Tourism Spending Market Share Change ('07 to '12)

The ROI of the PA Dutch Convention & Visitors Bureau Promotional Activities May 2014
19
4.3 Room revenue based on bed tax receipts
Lancaster County collects an excise tax of 1.1% on room rental revenue at all
hotels, motels and bed and breakfasts. Additionally, Lancaster County collects an
additional 3.9% room rental tax on hotels, motels and bed and breakfasts that have
greater than ten rooms. Information on the 1.1% excise tax can be used to estimate
total room revenue of accommodation establishments in Lancaster County, and
trends in these estimates are comparable across regions. Since bed tax receipt
information is available for Lancaster County for 2013, but was not yet obtainable for
the other regions, Tourism Economics has used hotel performance data from STR
to estimate 2013 performance for the comparable regions.
95
100
105
110
115
2005 2006 2007 2008 2009 2010 2011 2012
State (excluding Phila. and Pitt.) (111.6) Valleys of the Susquehanna (110.4)
Lancaster County (107.9) Dutch Country Roads (104.2)
The Alleghenies (102.1)
Tourism Employment
Index (2005=100)
Source: Tourism Economics

The ROI of the PA Dutch Convention & Visitors Bureau Promotional Activities May 2014
20
Based on this analysis, room revenue in Lancaster County has expanded more
quickly than the adjusted state total, as well as the estimates for two of the three
comparable regions. Lancaster County growth has been similar to the Dutch
Country Roads region overall, increasing 38.7% between 2007 and 2012, as
compared to a gain of 38.1% for Dutch Country Roads overall. Based on estimated
performance for 2013, Dutch Country Roads room revenue appears to have grown
slightly faster than that of Lancaster County, with both continuing to outperform the
comparable regions.
To take a closer look at the more recent performance in Lancaster County, Tourism
Economics calculated the change in room revenue market share from 2007 to 2012
based on the bed tax estimates. As shown in the adjacent table, Lancaster County
improved from a 9.3% share of state room revenue in 2007 (excluding Philadelphia
and Pittsburgh) to a 9.9% share in 2012, a market share increase of 60 basis points.
As shown in the accompanying table, a comparison of estimated 2012 room
revenue in Lancaster County to the hypothetical level of room revenue that would
have occurred without an increase in market share (i.e. remaining at 9.3%), shows
that the market share increase resulted in a gain of $7.9 million of additional room
revenue, equivalent to a 6.2% increase of room revenue relative to the hypothetical
alternative.
90
100
110
120
130
140
150
2007 2008 2009 2010 2011 2012 2013
Lancaster County (138.7) Dutch Country Roads (138.1)
State without Philadelphia and Pittsburgh (130.7) The Alleghenies (114.6)
Valleys of the Susquehanna (112.9)
Room Revenue Based on Bed Tax
Index (2007=100)
Sources: Tourism Economics; state and local sources

The ROI of the PA Dutch Convention & Visitors Bureau Promotional Activities May 2014
21
4.4 Hotel performance as measured by STR
The hotel performance statistics aggregated from individual hotel properties by STR,
formerly Smith Travel Research, provides a timely measure of hotel performance.
Based on this information, we observe that lodging supply as measured by the STR
census of lodging properties has expanded more slowly in Lancaster County than in
comparable regions, but that performance levels of existing hotels have shown
stronger than average improvement.
Occupancy levels at Lancaster County hotels have improved substantially from
2008 levels, surpassing the gains achieved by the Dutch Country Roads region
more broadly and the adjusted state total (see accompanying graph).
Lodging analysis
Lancaster County market share (ratio to State excluding
Philadelphia and Pittsburgh)
9.3% 2007
9.9% 2012
60 Market share increase (in basis points, reflects rounding)
$136.8 Lancaster County room revenue in 2012 (in millions)
$128.8 Hypothetical Lancaster County room revenue in 2012 if market
share had remained at 2007 level (in millions)
$7.9 Gain attributable to improved market share (in millions)
6.2% Percentage increase attributable to improved market share
Source: Tourism Economics, state and local tax records
Lodging Market Share Change ('07 to '12)
The ROI of the PA Dutch Convention & Visitors Bureau Promotional Activities May 2014
22
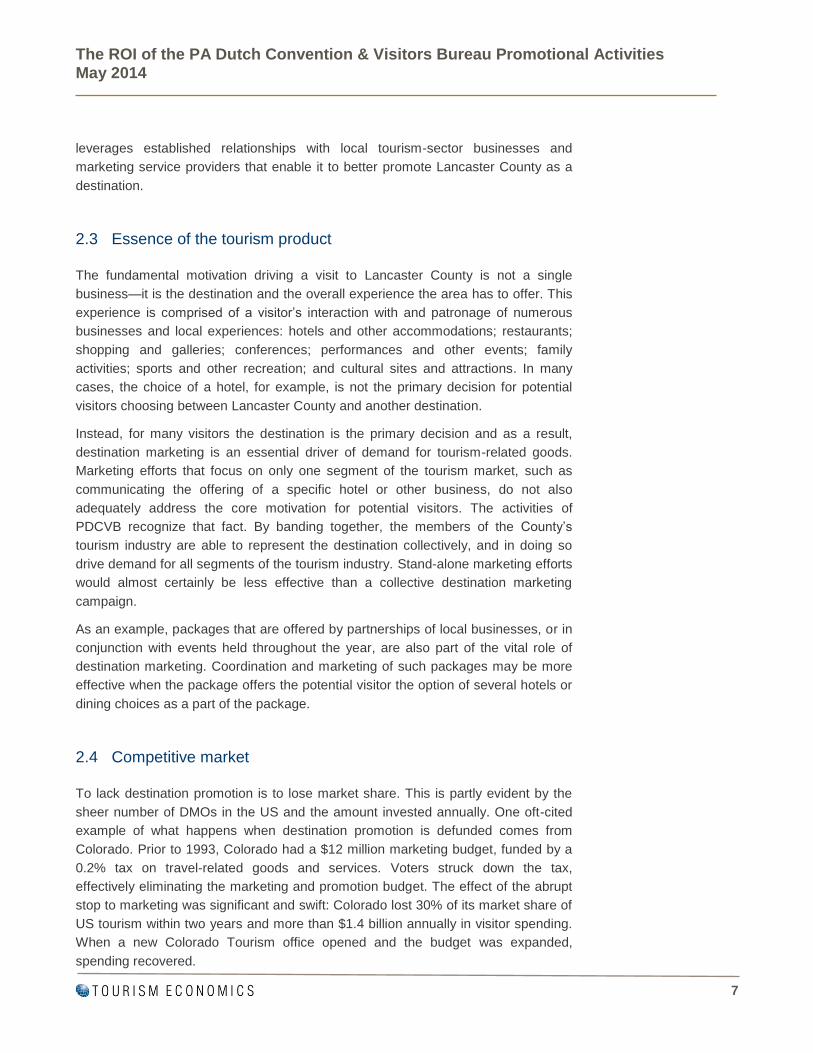
Room rates at Lancaster County hotels have traced a similar pattern of gains as
comparable regions, but given strong occupancy gains, revenue per available room
(RevPAR) gains have outperformed. RevPAR at Lancaster County hotels reached
$55.36 in 2013 (occupancy of 57.3% with average daily rate of $96.65), which is
13.3% higher than in 2008. In comparison, as shown in the accompanying graph,
adjusted state total RevPAR has increased 4.6% since 2008, and Dutch Country
Roads RevPAR increased only 1.8%.
80
90
100
110
2008 2009 2010 2011 2012 2013
Lancaster County (108.5) State (excluding Phila. and Pitt.) (98.5)
Dutch Country Roads (97)
Lodging Occupancy Relative to Comparable Regions
Index (2008=100)
Sources: STR, Tourism Economics

The ROI of the PA Dutch Convention & Visitors Bureau Promotional Activities May 2014
23
80
90
100
110
120
2008 2009 2010 2011 2012 2013
Lancaster County (113.3) State (excluding Phila. and Pitt.) (104.6)
Dutch Country Roads (101.8)
Lodging RevPAR Relative to Comparable Regions
Index (2008=100)
Sources: STR, Tourism Economics

The ROI of the PA Dutch Convention & Visitors Bureau Promotional Activities May 2014
24
5. Case Study Review
Given the important role of destination marketing, and the spending that is
undertaken every year across the US by local and regional destination marketing
groups in carrying out that role, understanding the connection between marketing
spend and corresponding destination impacts is an important topic. To that end,
Tourism Economics has compiled a repository of case studies of destination
promotion effectiveness. To communicate key findings, we have summarized three
aspects of this research. First, we present a return-on-investment (“ROI”) matrix that
summarizes destination marketing ROI estimates prepared through research in a
variety of US destinations. Second, we present several case studies of situations in
which destination marketing amounts have been reduced and discuss the resulting
effects on visitation and spending. Third, we discuss marketing of the US as a
destination for international travelers, and the returns that have been realized in
recent years.
5.1 Destination marketing ROI matrix
Many DMOs conduct periodic assessments of marketing effectiveness. There are
several goals of these studies, including understanding how specific marketing
campaigns were perceived by households, how effective the campaigns were in
having an impact on households’ intent to travel to a given destination, and which
target markets are showing differing level of responsiveness to marketing. Many of
these studies also include a specific analysis of the ROI of marketing spending in
the form of a quantitative assessment of the level of incremental visitor spending
and tax revenues that are attributable to the destination marketing being analyzed.
These studies use a variety of methodologies, and are measuring the impact of a
range of different campaigns used by destinations in a variety of situations. For
example, a specific study may look at incremental visitors attracted by a state-level
marketing campaign conducted by a state that attracts travelers from a range of
national markets, while another study may focus on the results of a more targeted
regional campaign carried out by a city-level CVB. While the results of a specific
study pertain most directly to the situation that was analyzed, and the corresponding
assumptions, it is appropriate to consider broader inferences from the research.
For the purpose of this report, Tourism Economics analyzed 16 recent studies that
included an estimate of the incremental visitor spending attributable to marketing
spending. For example, in a fairly typical approach, a study would:
- use a survey to analyze the effect of a specific advertising campaign on
households’ travel to a given destination, such as by analyzing the impact
on actual travel among those that had observed the advertising or by
analyzing the impact on households’ intentions to travel;

The ROI of the PA Dutch Convention & Visitors Bureau Promotional Activities May 2014
25
- project that effect to the broader set of households in the marketing area to
estimate the number of incremental visits attributable to the campaign;
- apply typical levels of spending per visitor to estimate incremental visitor
spending; and,
- compare incremental visitor spending to the level of marketing spending to
estimate the ROI.
Tourism Economics has summarized the estimates of incremental visitor spending
per dollar of marketing spend from these studies in the accompanying table. The
results range from as low as $12 for an analysis conducted for Syracuse, NY to as
high as $200 for an analysis conducted for Colorado. However, for the most part,
visitor spending per dollar of marketing spend ranges between $50 and $100, with
an average for state studies of $116 and an average of metro and regional studies
of $54. In other words, in general, recent marketing campaigns by destination
marketing organizations at the metro and regional level in the US have generated
approximately $54 of incremental visitor spending for each dollar of destination
marketing spending.

The ROI of the PA Dutch Convention & Visitors Bureau Promotional Activities May 2014
26
As it relates to Lancaster County, it is useful to consider several selected regions
covered in the marketing impact research.
- Finger Lakes Wine Country consists of four counties. In economic impact
analysis for the State of New York, Tourism Economics estimated visitor
spending in this region totaled $328.0 million in 2012.5 Based on marketing
5 Tourism Economics (2013). The Economic Impact of Travel and Tourism in New
York, Calendar Year 2012, Finger Lakes Focus.
Marketing ROI Matrix
Region Timing
Visitor
Spending Per
Ad Dollar
States
Colorado 2012 200
Florida 2011 177
Maryland 2012 160
Wyoming 2013 134
Missouri 2013 131
North Dakota 2010 91
Virginia 2006 71
Michigan 2009/10 54
New Mexico 2012 29
Metros and regions
Philadelphia, PA 2009/10 100
Branson, MO 2012 79
Kansas City, MO 2013 65
Springfield, MO 2011 61
Finger Lakes Wine Country, NY 2012 44
San Diego, CA 2013 19
Syracuse, NY 2008 12
Average of all studies $89
Median of all studies $75
Average of states $116
Average of metros and regions $54
Sources: Local studies compiled by Tourism Economics
The ROI of the PA Dutch Convention & Visitors Bureau Promotional Activities May 2014
27
effectiveness analysis conducted by Longwoods International6, 2012
marketing spending of $873,000 generated $38.4 million of incremental
spending, which is equivalent to 11.7% of total visitor spending.
- The Kansas City Convention and Visitors Association is supported by bed
taxes generated by incorporated Kansas City, Missouri and promotes the
Kansas City region. In economic impact analysis, Tourism Economics
estimated visitor spending in the five county Kansas City region totaled $2.8
billion.7 Based on marketing effectiveness conducted by H2R
8, 2013 media
spending of $1.1 million generated $71.2 million of incremental visitor
spending, which is equivalent to 2.5% of total visitor spending (using 2012
data).
- Visit Philadelphia, formerly the Greater Philadelphia Tourism Marketing
Corporation, represents a five county region. Tourism Economics estimated
visitor spending in the region totaled $8.0 billion in 2010.9 Based on
marketing effectiveness research by Longwoods International10
, 2009/2010
marketing spending of $4.3 million generated $432 million of incremental
visitor spending, which is equivalent to 5.4% of total visitor spending.
Depending on the economic structure of the local area being analyzed, and the
types of visitor spending typically being generated, it is also possible to estimate the
ROI in terms of state and local tax dollars generated per $1 of marketing spending.
In each of the studies that Tourism Economics analyzed that included such a
measure, the ROI was greater than $1, and was typically in the range of $5 of state
and local taxes per $1 of destination marketing spending.
6 Longwoods International (2012, December). Finger Lakes Wine Country 2012
Benchmark Study.
7 Tourism Economics, Longwoods International, and Reach Market Planning LLC.
(2013, August) Understanding the Visitor to Kansas City.
8 H2R Market Research (2013, October). KCCVA 2013 Advertising Effectiveness
Study.
9 Tourism Economics (2013, December). The Economic Impact of Travel and
Tourism in Pennsylvania, Tourism Satellite Account Calendar Year 2012.
10 US Travel Association and Longwoods International. (2011, July). The Power of
Destination Marketing, “Pure Michigan” and “Philadelphia: With Love” Case Studies.

The ROI of the PA Dutch Convention & Visitors Bureau Promotional Activities May 2014
28
5.2 Case studies in which destination marketing spending was
reduced
Colorado
Colorado provides an example of the impact of a dramatic reduction in destination
marketing spending.
- Prior to 1993 the Colorado Tourism Board (CTB) had a $12 million
marketing budget, funded by a 0.2% tax on most tourism spend.
- Within two years of the 1993 repeal of funding, Colorado lost 30% of its US
visitor market share, which translated into the equivalent of over $1.4 billion
annually in lost revenues. By the late 1990s, this had escalated to $2.4
billion a year.
- After having moved from 14th to 1st position in the states’ summer resorts
category, Colorado slipped to 17th in 1994. It also shifted back to being
more of a regional drive destination opposed to being a national fly-in venue
and attracting fewer international visitors.
- The subsequent establishment of the Colorado Travel & Tourism Authority,
which was an attempt to market the state with private sector funding in co-
operation with the CTB, failed miserably. This was attributed to the fact that
private sector companies had separate priorities.
- The new Colorado Tourism Office opened with a $5 million budget and in
2003, $9 million was approved for tourism promotion. A campaign
conducted from October 2003 through December 2004 resulted in 5.3
million incremental visits (or 17% of total visitation to the state). In 2004, this
generated $1.4 billion of additional spend and $89.5 million in state and
local taxes.
- These estimates are equivalent to an implied visitor spending ROI per
marketing dollar of $140 (i.e. each dollar change in marketing spending
resulted in a change in visitor spending of $140).
San Diego
A series of events in San Diego recently resulted in a reduction in tourism marketing
spending, providing a case study for consideration. Tourism Economics has studied

The ROI of the PA Dutch Convention & Visitors Bureau Promotional Activities May 2014
29
the situation in San Diego and recently published a report quantifying the impact of
reduced marketing.11
- In recent years, the San Diego Tourism Marketing District (SDTDM) had a
budget ranging from $21 million to $27 million. As a result of litigation, funds
intended for the SDTDM were held in limbo starting January 1, 2013.
SDTDM funding in the second half of fiscal 2013 was reduced to a 61%
funding level, and at the point of Tourism Economics’ analysis, funding for
FY 2014 was anticipated to be 16% of what would normally be expected.
- As a result, over the course of FY 2013 and FY 2014, there was an
expected $30 million reduction in marketing activities relative to the level of
spending likely under normal funding conditions. The impact of the reduced
funding was reflected in the performance of the San Diego hotel industry, as
room demand leveled off in 2013, and occupancy rates and prices levels
increased more slowly than in competing markets. The city’s performance
trailed other regional and national destinations that maintained funding
levels and marketing programs.
- Tourism Economics analyzed the impacts of reduced marketing through two
independent methods and estimated the total amount of losses experienced
by San Diego’s hotel sector over 2013 and 2014 would sum to over $200
million in room revenues and 1.2 million room nights. In total, the impacts
were expected to result in a loss of total visitor spending of $560 million,
reduced city tax revenues of $22.3 million, and total reduced business sales
in the San Diego economy of $1.3 billion (including indirect and induced
impacts).
- These estimates are equivalent to a $19 decrease in visitor spending per
dollar of marketing spend (i.e. each dollar decrease in marketing spending
resulted in an expected reduction in visitor spending of $19).
5.3 Brand USA and the effectiveness of destination marketing
In addition to a role at the state and local level, destination marketing also plays an
important part in economic development strategy for countries around the world as
they seek to increase exports generated by international tourists. For the US, Brand
USA was established as the sole organization with the mandate to promote the
country globally to increase international visitation and spending in the US.
11 Tourism Economics (2013, November) The Impact of Reduced Funding for the
San Diego Tourism Marketing District.

The ROI of the PA Dutch Convention & Visitors Bureau Promotional Activities May 2014
30
Oxford Economics, in coordination with its Tourism Economics subsidiary company,
recently conducted a detailed analysis of the return on investment of Brand USA’s
marketing in its 2013 fiscal year (October 1, 2012-September 30, 2013).12
Overall,
this analysis documented the impact of Brand USA in supporting incremental visits
to the US by international travelers, helping draw a more complete picture of the
effectiveness of destination marketing and the importance of international travel as a
growth market for US destinations.
- This analysis was based on an econometric model of how the eight markets
in which Brand USA was fully active would have performed without its
investments in marketing compared with actual performance. These
markets include Canada, Mexico, Japan, South Korea, the United Kingdom,
Germany, Brazil and Australia.
- The model indicated that Brand USA marketing generated 1.1 million
incremental trips to the United States—a 2.3% increase over the growth that
would have occurred without Brand USA’s activities.
- These incremental visitors spent $3.4 billion in the US, including both travel
and U.S. carrier airfare receipts. The results equate to a marketing ROI
equivalent to $47 dollars of incremental visitor spending per dollar of
marketing spending based on Brand USA’s marketing expenses of $72
million (a ratio of 47:1). The total budget ROI, including overhead ($9.6
million), startup expenses (e.g. new website development), and expenses
from partially deployed markets is estimated at 34:1.
- A parallel analysis was conducted to validate the model results based on
advertising tracking surveys conducted by Ipsos in Brazil and Mexico in
2013. With an average ROI of 49:1, these surveys confirm the range of
impact indicated by the econometric analysis.
- A secondary validation was conducted based on an analysis of US market
share for each of the eight markets where Brand USA’s marketing was fully
deployed. During fiscal year 2013, US market share of the key origin
markets increased 0.5 percentage points over FY 2012 against a
competitive set of destinations.
- Across the markets, a consistent trend of either an increase in share, or a
slowdown in the rate of share losses, is evident. This indicates a
strengthening of competitiveness that coincided with Brand USA’s
marketing investments, providing a confirmation of the returns indicated by
the econometric model.
12 Oxford Economics (2014, February) The Return on Investment of Brand USA
Marketing, 2013 Fiscal Year Analysis.
The ROI of the PA Dutch Convention & Visitors Bureau Promotional Activities May 2014
31
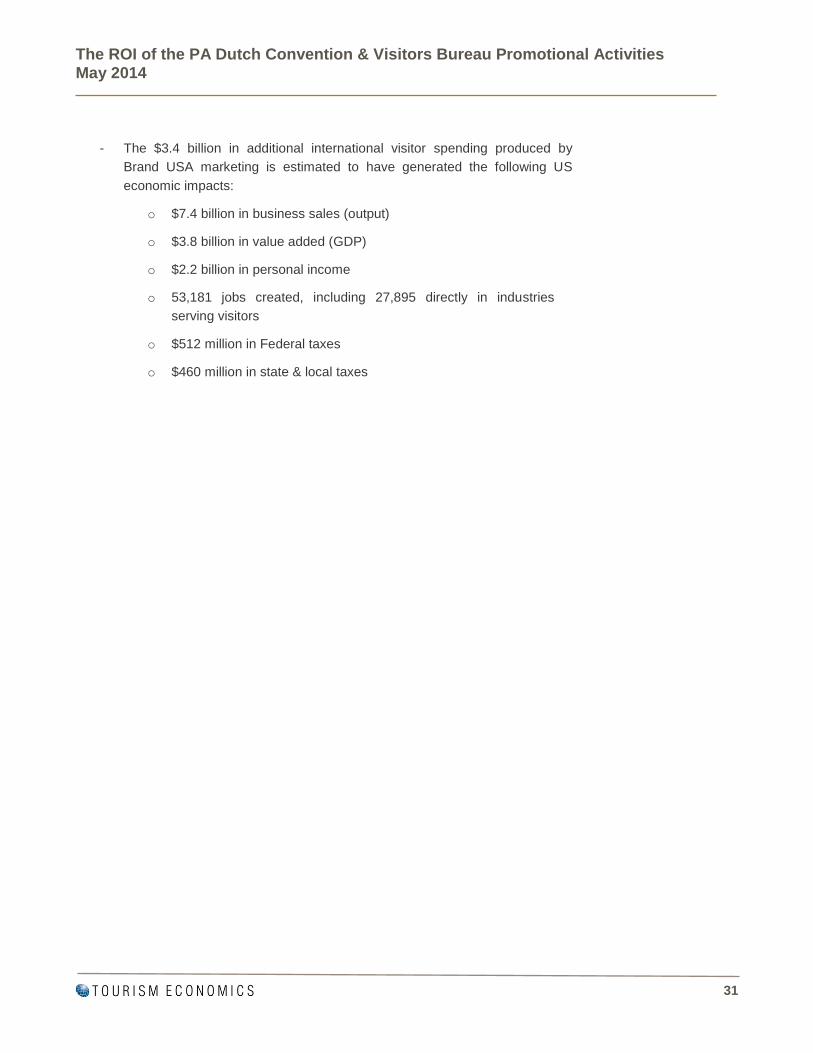
- The $3.4 billion in additional international visitor spending produced by
Brand USA marketing is estimated to have generated the following US
economic impacts:
o $7.4 billion in business sales (output)
o $3.8 billion in value added (GDP)
o $2.2 billion in personal income
o 53,181 jobs created, including 27,895 directly in industries
serving visitors
o $512 million in Federal taxes
o $460 million in state & local taxes

The ROI of the PA Dutch Convention & Visitors Bureau Promotional Activities May 2014
32
6. Economic Impact Analysis
6.1 Economic impact of travel and tourism in Lancaster County
As part of its analysis for the Commonwealth of Pennsylvania, Tourism Economics
analyzes the economic impact of travel and tourism in Lancaster County on an
annual basis.13
For the purpose of this analysis, Tourism Economics updated the
most recent calculation of 2012 impacts to provide a preliminary assessment of the
economic contribution of travel and tourism in Lancaster County in 2013, and
analyzed the portion of the impacts that represent the contribution of the ongoing
activities of the PDCVB.
Key points of background on economic impact
analysis of travel and tourism are summarized as
follows.
Travelers create direct economic value within
a discreet group of sectors (e.g. recreation,
transportation). This supports a relative
proportion of jobs, wages, taxes, and GDP
within each sector.
Each directly affected sector also purchases
goods and services as inputs (e.g. food
wholesalers, utilities) into production. These
impacts are called indirect impacts.
Lastly, the induced impact is generated when
employees whose incomes are generated
either directly or indirectly by tourism, spend
those incomes in the state economy.
Specific terms are used in the economic impact
analysis.
- Traveler: Includes both leisure and business travelers.
- Travel and tourism industry: The value of traveler activity within “travel
characteristic industries.” This concept measures only the direct impact of
the travel industry from the sales made to travelers.
13 Tourism Economics (2013, December). The Economic Impact of Travel and
Tourism in Pennsylvania, Tourism Satellite Account Calendar Year 2012.

The ROI of the PA Dutch Convention & Visitors Bureau Promotional Activities May 2014
33
- Travel and tourism economy: This expands the focus to measure the
overall impact of tourism on all sectors of the economy. The value of
traveler activity plus government spending and capital investment in support
of travel and tourism and certain personal consumption expenditures. This
is the basis of the total economic impact analysis, including the direct impact
and the downstream indirect and induced impacts.
Tourism Economics used the IMPLAN modeling system, a well-respected economic
impact analysis tool, to quantify key relationships in the Lancaster County economy.
The IMPLAN model traces the flow of visitor-related expenditures through the local
economy and their effects on employment, wages, and taxes. IMPLAN also
quantifies the indirect (supplier) and induced (income) impacts of tourism. For
example, when a visitor purchases a meal at a local restaurant, a portion of the sale
supports wages for restaurant employees, while a portion of the sale may consist of
locally produced food and beverages. The IMPLAN model captures these types of
relationships based on a structured analysis of economic statistics. Tourism
Economics’ annual report for the Commonwealth provides further discussion of the
economic impact methodology.
Overall, Tourism Economics estimates that Lancaster County visitor spending
totaled $1.9 billion in 2013. For the purpose of this preliminary analysis of 2013
impacts, this represents an increase of 2.5% from the prior year, which is an
estimate generated by Tourism Economics using the annual increase in lodging
revenue as reported by STR as a proxy for overall spending growth. Based on
analysis of the number of visitors to the Dutch Country Roads region as part of the
annual analysis for the Commonwealth, Tourism Economics estimates there were
7.9 million visitors to Lancaster County in 2012, including day and overnight
visitors.14
Applying STR data that shows an increase in hotel room nights of 0.4%
during 2013, Tourism Economics estimates that 2013 visitor volume increased from
2012, but that the total still rounds to approximately 7.9 million visitors. Overall, the
average spend per visitor is estimated at $235, which includes some visitors who
stay one or more nights, as well as day visitors.
The estimated $1.9 billion of direct visitor spending, plus corresponding impacts of
more than $600 million of indirect and induced business sales, is estimated to have
supported $2.5 billion in total visitor-generated sales in Lancaster County. For
example, direct spending by visitors on food and beverages results in additional
demand in industries that supply the restaurants, such as food inputs, energy,
capital equipment and professional services such as legal and accounting services.
Additionally, induced impacts are produced as incomes earned through visitor
14 The definition of day visitors includes visitors who traveled outside of their normal
pattern to spend time in Lancaster County.

The ROI of the PA Dutch Convention & Visitors Bureau Promotional Activities May 2014
34
spending are spent in Lancaster County. To a degree, such impacts tend to leak out
of the area in which the direct spending occurs, for example as local businesses
purchase inputs that are produced outside of Lancaster County. However, there are
also some tourism-related impacts that relate to spending by visitors to other
Pennsylvania counties but that accrue to businesses and households in Lancaster
County, and these are included.
This annual level of spending activity is estimated to support 23,694 total jobs in
Lancaster County, including 15,617 direct tourism industry jobs. Total employee
wages and other labor income are estimated at almost $755.9 million, including
$384.7 million of direct labor income.
Tourism Economics’ estimate of direct tourism
sector employment is also useful in considering
the importance of tourism in the Lancaster
County economy relative to other sectors. As
shown in the accompanying table, we have
summarized employment levels for sectors as
reported by the Bureau of Labor Statistics
(BLS), and consolidated our estimate of direct
tourism employment, moving direct tourism jobs
from the sector in which they were originally
reported to the tourism sector row. Based on
this analysis, tourism ranks as the fifth largest
employer in Lancaster County, ahead of mining
and construction. Overall, the tourism industry
directly accounts for 1 out of every 15 non-
agriculture private sector jobs in Lancaster
County. Several additional comments are also
relevant:
- This analysis shows employment as tracked using standard BLS categories,
adjusted to reclassify tourism sector employment as its own sector. For
example, this moves almost 8,500 tourism jobs from the accommodation
and food service sector to the tourism sector, leaving approximately 10,100
non-tourism food service and other accommodation jobs (e.g. dormitories).
- This analysis only includes direct tourism employment, and does not include
jobs in other sectors of the economy that are indirectly supported.
- Tourism is also important as an industry because it represents an “export
sector”, in which services are provided to visitors from other regions,
representing a source of revenue and income that can be spent on services
from local businesses, such as at local retail establishments.
- The ranking analysis is prepared using 2012 employment levels, the most
recent consistent basis for such a ranking. The 2013 analysis of the tourism
Rank Industry 20121 Manufacturing 36,100
2 Health Care and Social Assistance 35,200
3 Retail Trade 25,794
4 Professional and Business Services 21,700
5 Tourism 15,2396 Mining, Logging, and Construction 14,800
7 Wholesale Trade 12,900
8 Other Services 10,752
9 Food Services and Other Accommodations 10,054
10 Transportation and Utilities 8,597
11 Financial Activities 8,400
12 Arts, Entertainment, and Recreation 3,600
13 Educational Services 3,365
14 Information (e.g. publishing, telecom) 3,100
Source: Bureau of Labor Statistics, Tourism Economics
Private-Sector Employment Ranking
Lancaster County
The ROI of the PA Dutch Convention & Visitors Bureau Promotional Activities May 2014
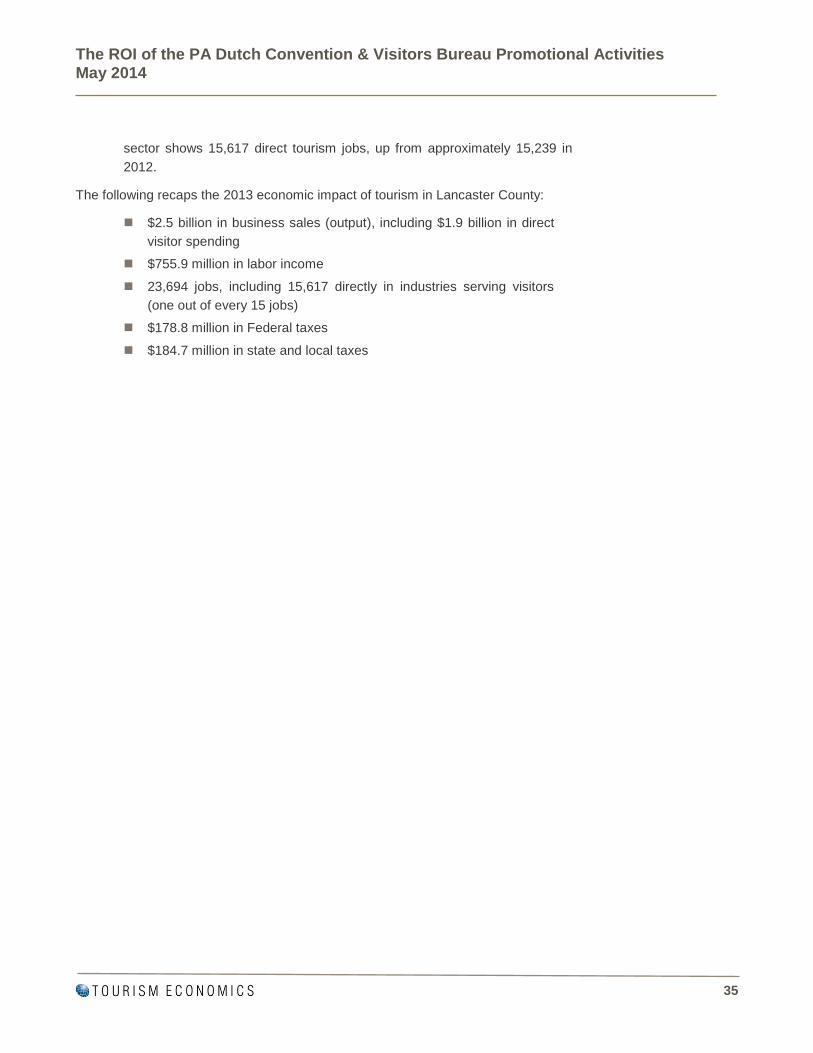
35
sector shows 15,617 direct tourism jobs, up from approximately 15,239 in
2012.
The following recaps the 2013 economic impact of tourism in Lancaster County:
$2.5 billion in business sales (output), including $1.9 billion in direct
visitor spending
$755.9 million in labor income
23,694 jobs, including 15,617 directly in industries serving visitors
(one out of every 15 jobs)
$178.8 million in Federal taxes
$184.7 million in state and local taxes
The ROI of the PA Dutch Convention & Visitors Bureau Promotional Activities May 2014
36
6.2 Economic impact of PDCVB
To provide perspective, we have estimated the portion of the total tourism economy
impact that represents a contribution of PDCVB. For the purpose of this analysis, we
estimated that PDCVB contributed to approximately $120.9 million of the almost
$1.9 billion in total tourism direct sales in 2013. This estimate is based on the
assumption that PDCVB generates incremental visitor spending that represents a
similar order of magnitude marketing return as the average of $54 dollars of visitor
spending per dollar of marketing spending observed for metro and regional
destinations in the case studies. Based on financial information provided by PDCVB,
we calculated average annual PDCVB marketing spend of $2.2 million during the
last two years.15
Thus, we estimated that $2.2 million of annual marketing spending
supported approximately $120.9 million of annual visitor spending in 2013.
We considered several additional perspectives to assess the reasonability of the
estimated PDCVB contribution of $120.9 million in visitor spending, which is
equivalent to approximately 515,000 visitors (assuming spending per visitor of $235
consistent with the Lancaster County average). One was to consider a
representative “funnel” from a wide number of marketing and public relations
impressions, to a moderate set of interested “potential” travelers, and finally to a
more narrow set of visitors influenced by PDCVB marketing to visit Lancaster
County, to extend their stay, or to make additional purchases while visiting.
For example, at the marketing and public relations stage of the funnel, we
considered measures such as the number of audience impressions from media
coverage supported by PDCVB PR activity (2.0 billion audience impressions), out of
home advertising including billboards (42.6 million gross impressions), and
completed video views (3.3 million). At the next stage of the funnel, we considered
website visit activity as demonstrating interest by potential visitors (1.6 million
unique website visitors). Understandably, many of these PR and advertising
impressions and even website visits do not result in incremental visits to Lancaster
County, and as expected, the PDCVB contribution of spending equivalent to that of
515,000 visitors represents a small fraction of the aforementioned impression
metrics.
Secondly, we considered the aspects of PDCVB activities that extend beyond
marketing spending. For example, by maintaining its website and providing visitors
information through the Getaway Guide and visitor centers, PDCVB supports
15 Includes co-op advertising in 2012. We used a two-year average to reflect the
expectation that visitor spending depends on spending over time, not just the
current year.

The ROI of the PA Dutch Convention & Visitors Bureau Promotional Activities May 2014
37
opportunities for travelers to extend the length of their trip or experience a greater
range of area activities. This helps both with influencing the initial trip, and by
supporting reasons for repeat visits or word of mouth referrals. While difficult to
quantify directly, one can consider the incremental spending and return trip impacts
of the distribution of over 700,000 Getaway Guides, reception of over 100,000
visitors at visitor centers, and impressions through 750,000 opened emails.
Third, we considered the role of PDCVB in helping secure bookings for local hotels.
This includes sales activity of the PDCVB sales team (over 52,000 room nights
booked in 2013), and the reservation center (over 24,000 room nights booked).
Using an approximate average visitor spending per room night associated with
meetings and group business in the region of $250, the room nights sold by PDCVB
would represent approximately $13.1 million of visitor spending.
Fourth, we considered the estimated level of PDCVB contribution of $120.9 million
as representing 6.5% of total direct visitor spending in Lancaster County. This
compares to estimates based on marketing
effectiveness studies of 2.5% for the Kansas City
region, 5.4% for the Philadelphia region, and 11.7%
for the Finger Lakes Wine Country region as noted in
Destination marketing ROI matrix.
In aggregate, considering the activities of PDCVB as
we understand them, the KPI’s as reported by
PDCVB, and the level of marketing spend and the
impact of such marketing spend estimated in other
regional and metro-level markets, we believe the
estimate of PDCVB-contributed visitor spending of
$120.9 million is a reasonable estimate of the
PDCVB contribution. This estimate supports
economic impact calculations that set the return on
investment on PDCVB activities in the context of the
Lancaster County tourism economy and the broader
economy in the county.
Based on this analysis, Tourism Economics
estimates that PDCVB activities supported, on
average during 2013, approximately 1,554 total jobs
in Lancaster County, including 1,195 in the tourism
sector. These jobs generated approximately $42.8
million of wages and other labor income. PDCVB
activities supported an estimated $10.2 million of
state and local taxes, including a substantial level of
Lancaster County bed taxes. Overall, this
contribution in terms of visitor spending, jobs, and
state and local tax revenue represents a substantial
Lancaster
County
PDCVB
Contribution
In millions, except
employment
Tourism direct sales
Lodging $248.6
Food & beverage 383.5
Retail 377.2
Recreation 338.2
Transport 515.0
Total $1,862.5
Tourism industry
Direct sales $1,862.5 $120.9
Employment 15,617 1,195
Labor income $384.7 $28.3
Taxes
State and local $106.3 $7.9
Federal $88.8 $6.4
Total tourism economy
Business sales $2,482.2 $161.1
Employment 23,694 1,554
Labor income $755.9 $42.8
Taxes
State and local $184.7 $10.2
Federal $178.8 $9.7
Source: Tourism Economics
Economic Impact Analysis (2013)
Not separately
analyzed

The ROI of the PA Dutch Convention & Visitors Bureau Promotional Activities May 2014
38
return on the marketing spending coordinated through the PDCVB and supported by
the local tourism sector.
The following recaps the contribution of the PDCVB to the economic impact of
tourism in Lancaster County in 2013:
$161.1 million in business sales (output), including $120.9 million in direct
visitor spending
$42.8 million in labor income
1,554 jobs, including 1,195 directly in industries serving visitors
$9.7 million in Federal taxes
$10.2 million in state and local taxes

The ROI of the PA Dutch Convention & Visitors Bureau Promotional Activities May 2014
39
7. About Tourism Economics
Tourism Economics is an Oxford Economics company with a singular objective:
combine an understanding of tourism dynamics with rigorous economics in order to
answer the most important questions facing destinations, developers, and strategic
planners. By combining quantitative methods with industry knowledge, Tourism
Economics designs custom market strategies, destination recovery plans, tourism
forecasting models, tourism policy analysis, and economic impact studies.
With over four decades of experience of our principal consultants, it is our passion
to work as partners with our clients to achieve a destination’s full potential.
Oxford Economics is one of the world’s leading providers of economic analysis,
forecasts and consulting advice. Founded in 1981 as a joint venture with Oxford
University’s business college, Oxford Economics enjoys a reputation for high quality,
quantitative analysis and evidence-based advice. For this, its draws on its own staff
of 30 highly-experienced professional economists; a dedicated data analysis team;
global modeling tools, and a range of partner institutions in Europe, the US and in
the United Nations Project Link. Oxford Economics has offices in London, Oxford,
Dubai, Philadelphia, and Belfast.

PHILADELPHIA
303 LANCASTER AVENUE, SUITE 2E
WAYNE PA 19087, USA
TEL: +1 610 995 9600
OXFORD
ABBEY HOUSE, 121 ST ALDATES
OXFORD, OX1 1HB, UK
TEL: +44 1865 268900
LONDON
BROADWALL HOUSE, 21 BROADWALL
LONDON, SE1 9PL, UK
TEL: +44 207 803 1400
BELFAST
LAGAN HOUSE, SACKVILLE STREET
LISBURN, BT27 4AB, UK
TEL: +44 28 9266 0669
NEW YORK
817 BROADWAY, 10TH FLOOR
NEW YORK, NY 10003, USA
TEL: +1 646 786 1863
SINGAPORE
NO.1 NORTH BRIDGE ROAD
HIGH STREET CENTRE #22-07
SINGAPORE 179094
TEL: +65 6338 1235
PARIS
9 RUE HUYSMANS
75006 PARIS, FRANCE
TEL: + 33 6 79 900 846
EMAIL: [email protected]
WWW.TOURISMECONOMICS.COM