The ROI of ITSM – Know Your Financial Impact! An ITSM Academy Webinar
50
MetricNet Best Practices Series The ROI of ITSM Know Your Financial Impact!
-
Upload
itsm-academy-inc -
Category
Technology
-
view
100 -
download
0
Transcript of The ROI of ITSM – Know Your Financial Impact! An ITSM Academy Webinar

MetricNet Best Practices Series
The ROI of ITSM
Know Your Financial Impact!

2© 2017 MetricNet, LLC, www.metricnet.com
Leveraging Metrics to Take Southwest Airlines to a Higher
Plane – A Case Study
Session 302
Wednesday, April 11 at 3:00 PM
_______________________________________________________________________________________________________________
The Enterprise Service Desk - The Greatest Opportunity in a
Generation!
Session 604
Thursday, April 12 at 4:00 PM
APRIL 10 – APRIL 13, 2018
Las Vegas, NV | #HDIConf
3© 2017 MetricNet, LLC, www.metricnet.com #CCExpoThe Most Comprehensive Program for
Contact Center Professionals!
Maximizing the ROI of
Customer Care
Tuesday, May 22nd, 2018
4:30 pm-5:30 pm
Track: Executive Perspectives
2018 Contact Center
Benchmarking Results - See
How You Stack Up!
Wednesday, May 23rd, 2018
2:45 pm-3:45 pm
Track: Maximize Productivity

4© 2017 MetricNet, LLC, www.metricnet.com
28 Years of Service and Support Benchmarks
Nearly 4,000 IT Service and Support Benchmarks
Global Database
70+ Key Performance Indicators
More than 120 Industry Best Practices

5© 2017 MetricNet, LLC, www.metricnet.com
The ITSM Discipline
ITSM Framework
IT Service And Support
IT Service Delivery
• Change Management
• Configuration Management
• Incident Management
• Release Management
• Problem Management
• Service Desk
• Availability Management
• Capacity Management
• IT Service Continuity
• Service Level Management
• Financial Management
6© 2017 MetricNet, LLC, www.metricnet.com
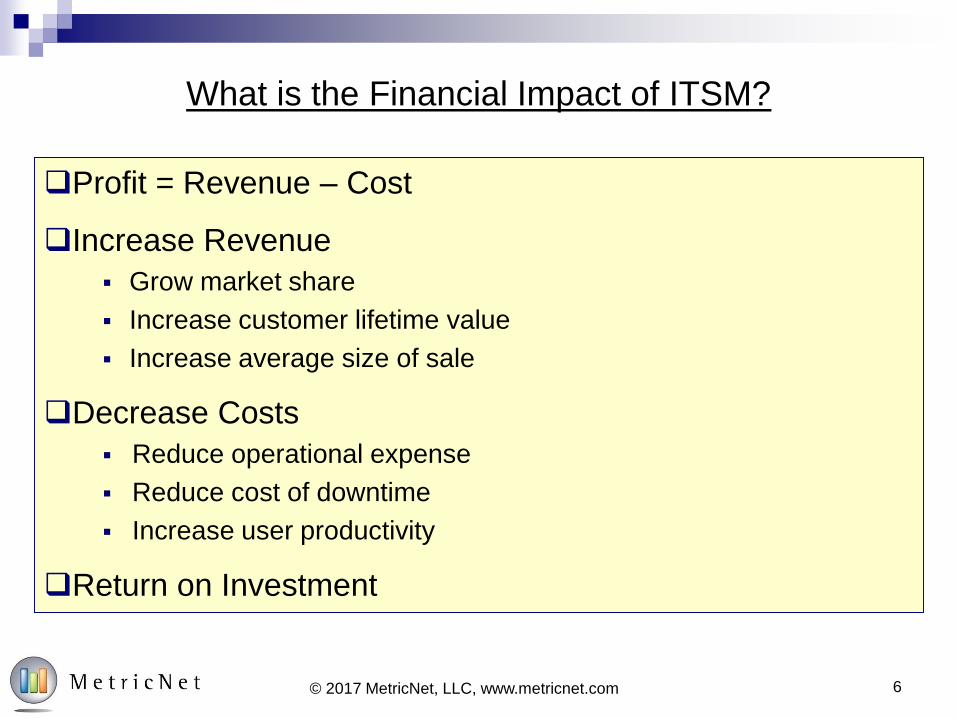
What is the Financial Impact of ITSM?
Profit = Revenue – Cost
Increase Revenue
▪ Grow market share
▪ Increase customer lifetime value
▪ Increase average size of sale
Decrease Costs
▪ Reduce operational expense
▪ Reduce cost of downtime
▪ Increase user productivity
Return on Investment

7© 2017 MetricNet, LLC, www.metricnet.com
ROI Defined
ROI =Return
Investment=
Savings or Profits
Spending
ROI is a simple ratio
It requires quantification of Return (Savings or Profits), and Investment
(Spending)
It is measured over a one-year timeframe (One Year ROI is implied in the
metric)
It is one of the most widely used and accepted financial metrics
It can be used prospectively, as part of a Business Case Analysis
…Or retrospectively to evaluate the past business success

8© 2017 MetricNet, LLC, www.metricnet.com
ROI: Two Simple Examples
Example Investment One Year Return First Year ROI
Bank CD $10,000 $300 3%
Service Desk Training $10,000 $20,000 200%
Service Desk Training: A 200% Return
Company XYZ hires an outside training firm in an effort to reduce handle times, and improve First Contact
Resolution rates
Following the training, handle times drop from 10 minutes to 9 minutes, and Cost per Contact drops from
$20 to $19
The $1 savings in Cost per Contact, when multiplied by 20,000 contacts per year, yields a one year savings
of $20,000
The end result is an ROI of 200% in year 1

9© 2017 MetricNet, LLC, www.metricnet.com
Success Stories From the World of ITSM
Finance
Pershing reduced incident response time by more than 50%. CIO Magazine
Raymond James Financial dropped the number of calls to the service desk
by as much as 25% within 18 months. Computerworld
JPMorgan Chase eliminated 500,000 service desk calls.
Capital One reduced system crashes and software distribution errors by
30% and business critical incidents by 92%. Computerworld
Sallie Mae reduced the handle time of service desk calls by 40%. Bank
Tech News
Visa saw a reduction in the mean time to resolve incidents by as much as
75%. Smart Enterprise Magazine

10© 2017 MetricNet, LLC, www.metricnet.com
Education
Perdue University reduced second-level support calls by 50% and enabled a $73
million ERP implementation without adding more FTEs or degrading service levels.
InfoWorld
Telecommunications
Avaya cut its IT budget by 30%. Techworld
Telkomsel reduced operational IT costs by 50-60%. Computerworld UK
Government
The State of Illinois saved over $130 million annually.
The US Postal Service realized a 50% reduction in incident resolution time, and a 30%
reduction in time to implement new changes. Pink Elephant
Success Stories From the World of ITSM (contd.)

11© 2017 MetricNet, LLC, www.metricnet.com
Show Me the Money!!

12© 2017 MetricNet, LLC, www.metricnet.com
Let’s Get Specific
13© 2017 MetricNet, LLC, www.metricnet.com
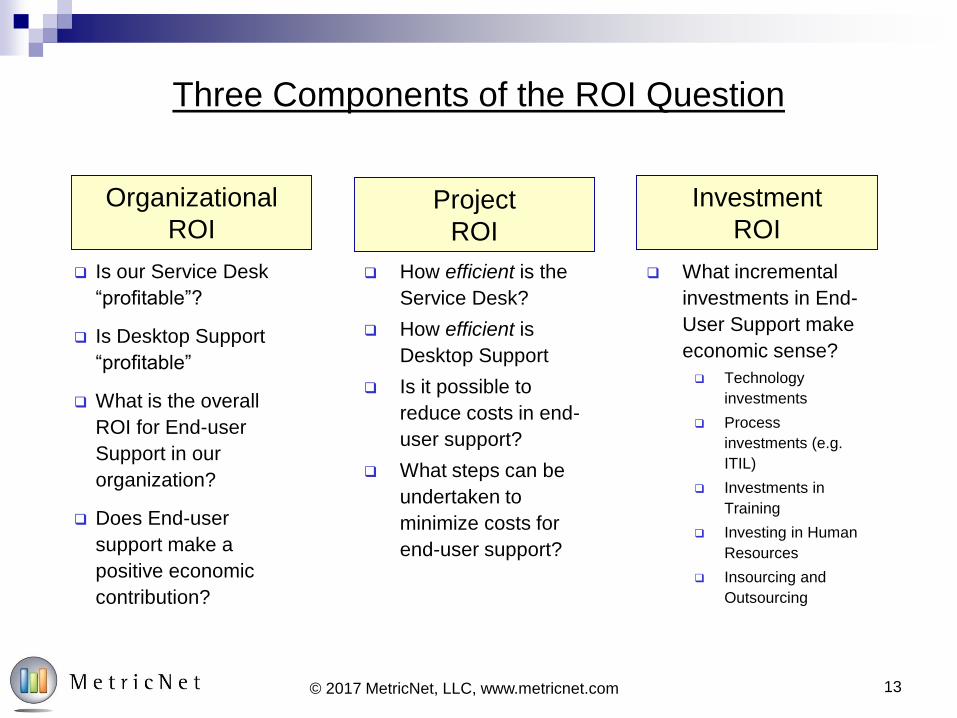
Three Components of the ROI Question
Is our Service Desk
“profitable”?
Is Desktop Support
“profitable”
What is the overall
ROI for End-user
Support in our
organization?
Does End-user
support make a
positive economic
contribution?
Organizational
ROI
Investment
ROI
What incremental
investments in End-
User Support make
economic sense?
Technology
investments
Process
investments (e.g.
ITIL)
Investments in
Training
Investing in Human
Resources
Insourcing and
Outsourcing
Project
ROI
How efficient is the
Service Desk?
How efficient is
Desktop Support
Is it possible to
reduce costs in end-
user support?
What steps can be
undertaken to
minimize costs for
end-user support?
14© 2017 MetricNet, LLC, www.metricnet.com
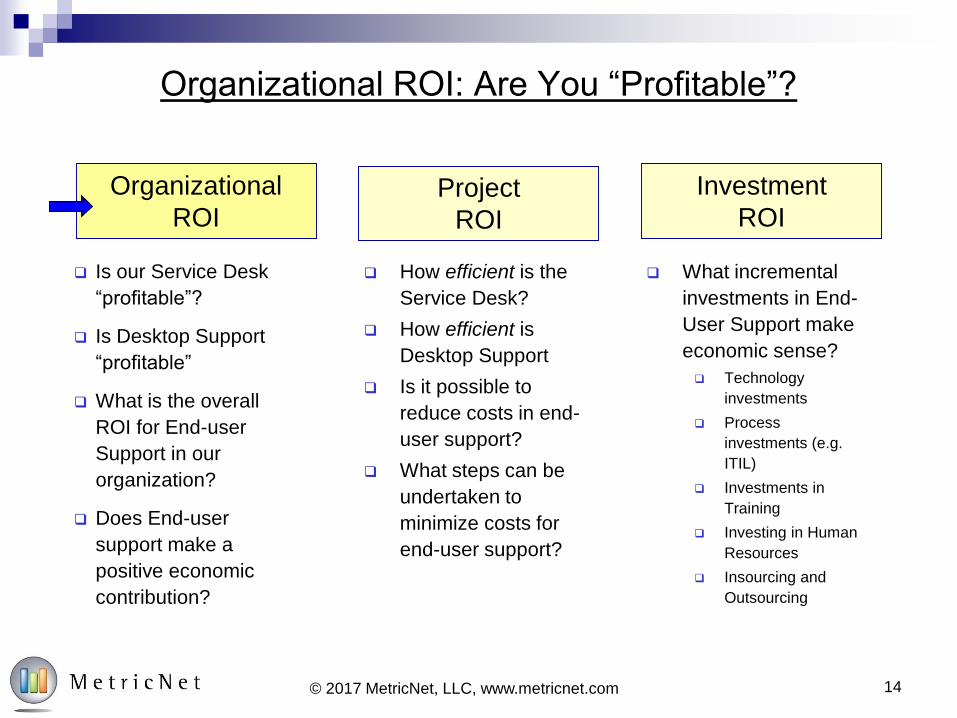
Organizational ROI: Are You “Profitable”?
Organizational
ROI
Investment
ROIProject
ROI
Is our Service Desk
“profitable”?
Is Desktop Support
“profitable”
What is the overall
ROI for End-user
Support in our
organization?
Does End-user
support make a
positive economic
contribution?
What incremental
investments in End-
User Support make
economic sense?
Technology
investments
Process
investments (e.g.
ITIL)
Investments in
Training
Investing in Human
Resources
Insourcing and
Outsourcing
How efficient is the
Service Desk?
How efficient is
Desktop Support
Is it possible to
reduce costs in end-
user support?
What steps can be
undertaken to
minimize costs for
end-user support?
15© 2017 MetricNet, LLC, www.metricnet.com
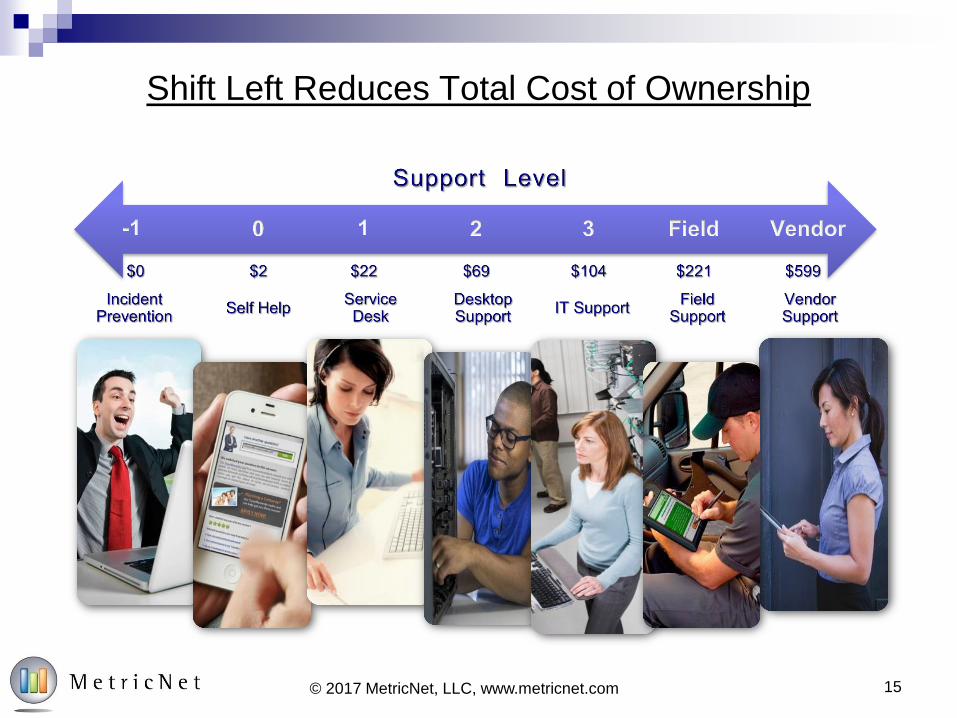
Shift Left Reduces Total Cost of Ownership
16© 2017 MetricNet, LLC, www.metricnet.com
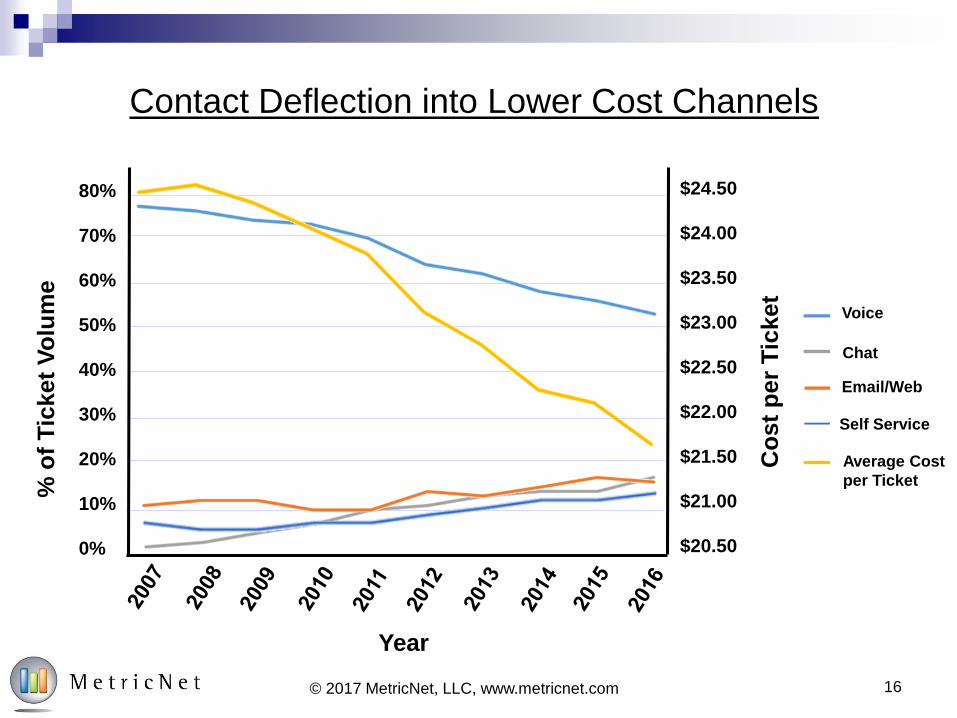
Contact Deflection into Lower Cost Channels
Year
% o
f T
icket
Vo
lum
e
Co
st
per
Tic
ket
Self Service
Average Cost
per Ticket
Email/Web
Chat
Voice
80%
70%
60%
50%
40%
30%
20%
10%
0%
$24.50
$24.00
$23.50
$23.00
$22.50
$22.00
$21.50
$21.00
$20.50
17© 2017 MetricNet, LLC, www.metricnet.com
0
10
20
30
40
50
60
70
0 1 2 3 4 5
Pro
du
cti
ve H
ou
rs L
ost
per
Em
plo
yee p
er
Year
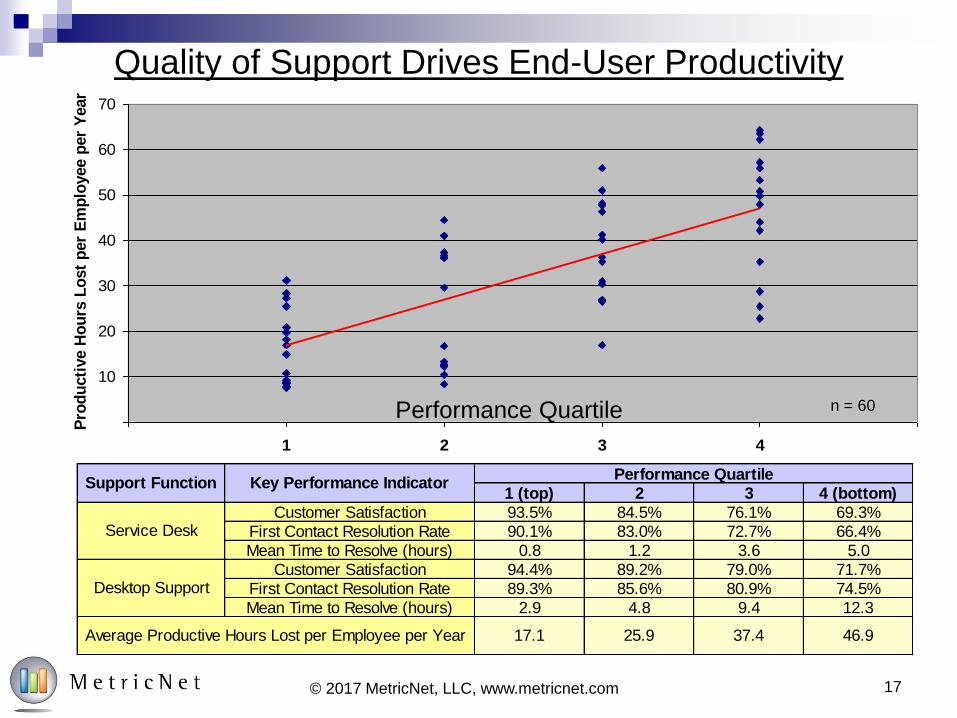
1 (top) 2 3 4 (bottom)
Customer Satisfaction 93.5% 84.5% 76.1% 69.3%
First Contact Resolution Rate 90.1% 83.0% 72.7% 66.4%
Mean Time to Resolve (hours) 0.8 1.2 3.6 5.0
Customer Satisfaction 94.4% 89.2% 79.0% 71.7%
First Contact Resolution Rate 89.3% 85.6% 80.9% 74.5%
Mean Time to Resolve (hours) 2.9 4.8 9.4 12.3
Service Desk
Desktop Support
Performance QuartileSupport Function Key Performance Indicator
37.4 46.9Average Productive Hours Lost per Employee per Year 17.1 25.9
Performance Quartile n = 60
Quality of Support Drives End-User Productivity

18© 2017 MetricNet, LLC, www.metricnet.com
Case Study 101: Service Desk ROI
Voice
Voicemail
Web Portal
Chat
Walk-In
Self Service
Other
Total
Technician Level 1 11.0 Trouble Ticket System Cherwell
Technician Level 2 6.0 Automatic Call Distributor (ACD) Avaya Aura Contact Center
Technician Level 3 5.0 Interactive Voice Response (IVR) Avaya Aura Contact Center
Supervisor/Team Lead 1.0 Knowledge Management System Right Answers/Cherwell
Manager 1.0 Labor Reporting System Custom software
QA/QC 0.5 Remote Control Software Bomgar
Trainer 0.5 Self-Help Software Right Answers/Cherwell
Service Delivery 1.0 Call Quality Avaya
Technology Tools Analyst 1.0 Other Technology DeskAlerts, Oracle OIM
Administrative 0.25
Total 27.25
Service Desk Location(s) Anytown, USA
Hours of Operation Sunday – Thursday, 7 AM – 9 PM ● Friday, 7 AM – 6 PM
Data Time Period July 2016 – June 2017
Annual Operating Expense $2,754,406
Monthly Inbound Contact Volume
6,763
817
1,027
464
439
15,115
5,275
Monthly Outbound Contact Volume 3,707
FTE Personnel Headcount Technology Profile
93
237

19© 2017 MetricNet, LLC, www.metricnet.com
A Closer Look at the Data
15,115
Monthly Outbound Contact Volume 3,707
FTE Personnel Headcount 27.25
Annual Operating Expense $2,754,406
Monthly Inbound Contact volume
20© 2017 MetricNet, LLC, www.metricnet.com
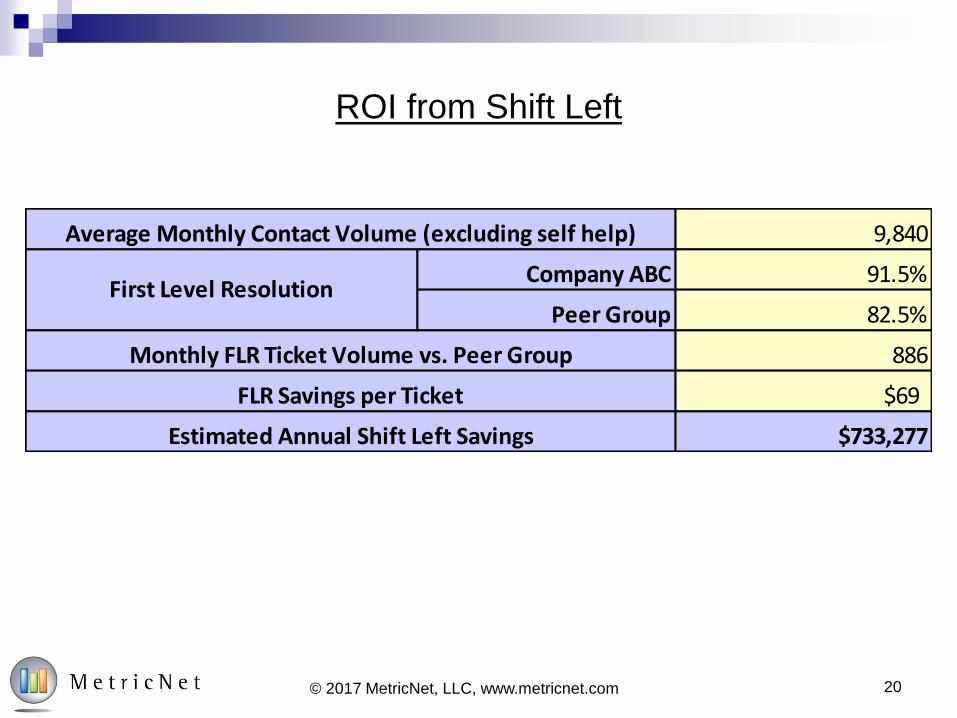
ROI from Shift Left
9,840
Company ABC 91.5%
Peer Group 82.5%
886
$69
$733,277
First Level Resolution
Average Monthly Contact Volume (excluding self help)
Monthly FLR Ticket Volume vs. Peer Group
FLR Savings per Ticket
Estimated Annual Shift Left Savings
21© 2017 MetricNet, LLC, www.metricnet.com
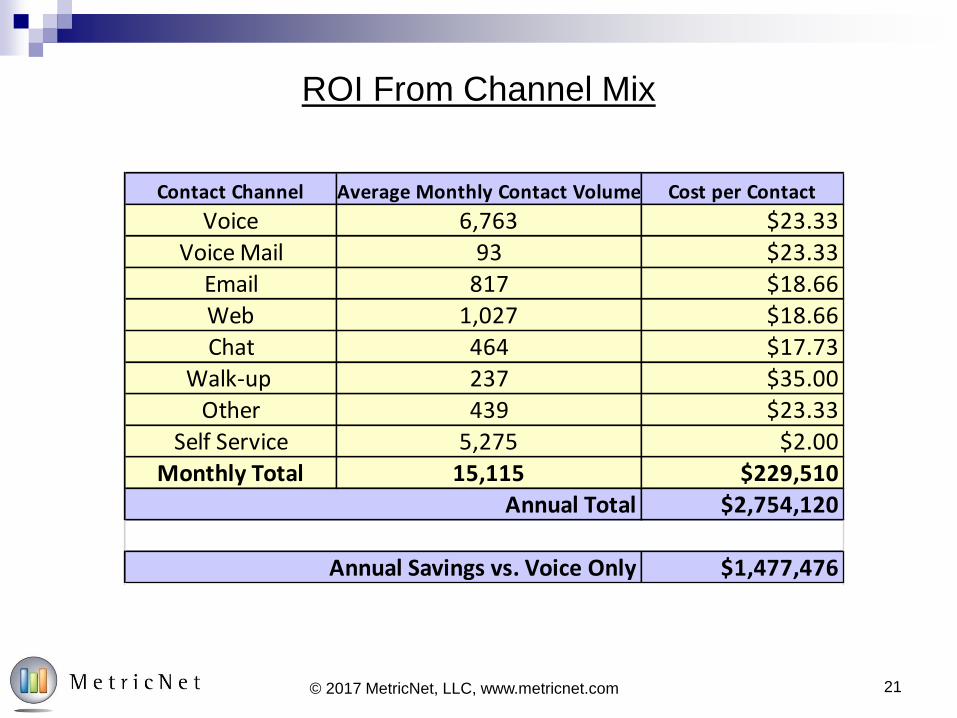
ROI From Channel Mix
Contact Channel Average Monthly Contact Volume Cost per Contact
Voice 6,763 $23.33
Voice Mail 93 $23.33
Email 817 $18.66
Web 1,027 $18.66
Chat 464 $17.73
Walk-up 237 $35.00
Other 439 $23.33
Self Service 5,275 $2.00
Monthly Total 15,115 $229,510
$2,754,120
$1,477,476
Annual Total
Annual Savings vs. Voice Only

22© 2017 MetricNet, LLC, www.metricnet.com
ROI from User Productivity Gains
1
Industry Average 25.9
Company ABC 17.1
8.8
8,200
72,160
1,800
40
$120,000
$4,810,667
Estimated FTE Savings
Estimated Annual Fully Loaded FTE Cost
Productivity ROI
Balanced Scorecard Quartile Performance
Annual Productive Hours Lost per User
Productive Hours Returned per User per Year
Total Productive Hours Returned to ABC End Users
Annual Working Hours per FTE
Number of End Users Supported
23© 2017 MetricNet, LLC, www.metricnet.com
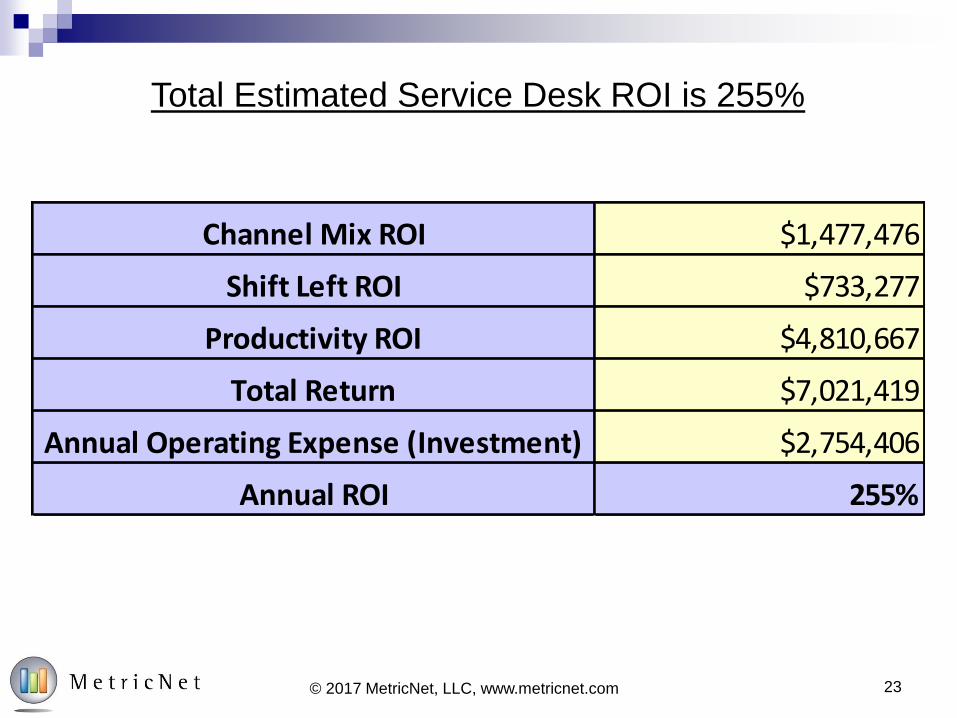
Total Estimated Service Desk ROI is 255%
Channel Mix ROI $1,477,476
Shift Left ROI $733,277
Productivity ROI $4,810,667
Total Return $7,021,419
Annual Operating Expense (Investment) $2,754,406
Annual ROI 255%
24© 2017 MetricNet, LLC, www.metricnet.com
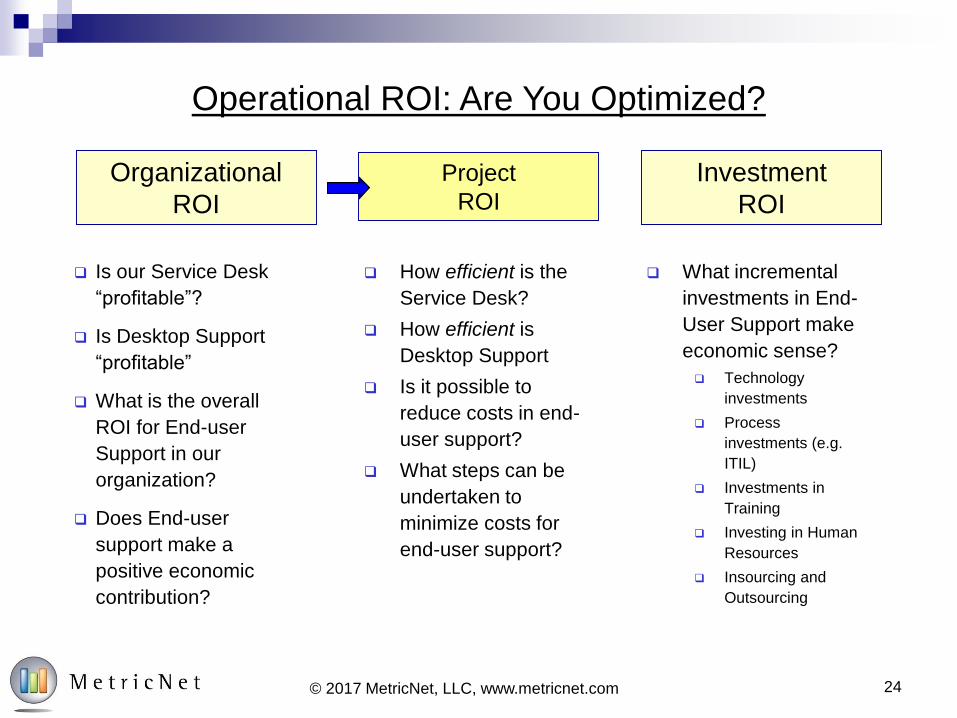
Operational ROI: Are You Optimized?
Organizational
ROI
Investment
ROI
Project
ROI
Is our Service Desk
“profitable”?
Is Desktop Support
“profitable”
What is the overall
ROI for End-user
Support in our
organization?
Does End-user
support make a
positive economic
contribution?
What incremental
investments in End-
User Support make
economic sense?
Technology
investments
Process
investments (e.g.
ITIL)
Investments in
Training
Investing in Human
Resources
Insourcing and
Outsourcing
How efficient is the
Service Desk?
How efficient is
Desktop Support
Is it possible to
reduce costs in end-
user support?
What steps can be
undertaken to
minimize costs for
end-user support?

25© 2017 MetricNet, LLC, www.metricnet.com
ITSM Maturity Directly Impacts The Number of Incidents
Chart Source: HDI http://www.thinkhdi.com/landing/~/media/HDICorp/Files/Industry-Reports/state-of-todays-IT-2017.pdf
Calculator Source: ITSM Academy
https://www.itsmacademy.com/roi-calculator/

26© 2017 MetricNet, LLC, www.metricnet.com
Case Study 102: Root Cause Analysis
The Scenario
An insurance company spending $4.8 million per year on
their service desk
The service desk supports 8,190 users
And handles 21,300 tickets per month
They embarked upon an aggressive Root Cause
Analysis program

27© 2017 MetricNet, LLC, www.metricnet.com
The Result: Cost Savings from Root Cause Analysis
Metric Beginning of Year End of Year Change
End-Users Supported 8,190 8,650 460
Monthly Ticket Volume 21,300 19,100 -2,200
Monthly Tickets per User 2.60 2.21 -0.39
Annual Operating Expense $4,769,496 $4,226,448 -$543,048
Cost per Ticket $18.66 $18.44 -$0.22
Annual Cost per User $582 $489 -$94
$ 94 in Savings per User per Year
X 8,650 End-Users
=========================================
$ 813,100 Estimated Savings from Root Cause Analysis
28© 2017 MetricNet, LLC, www.metricnet.com
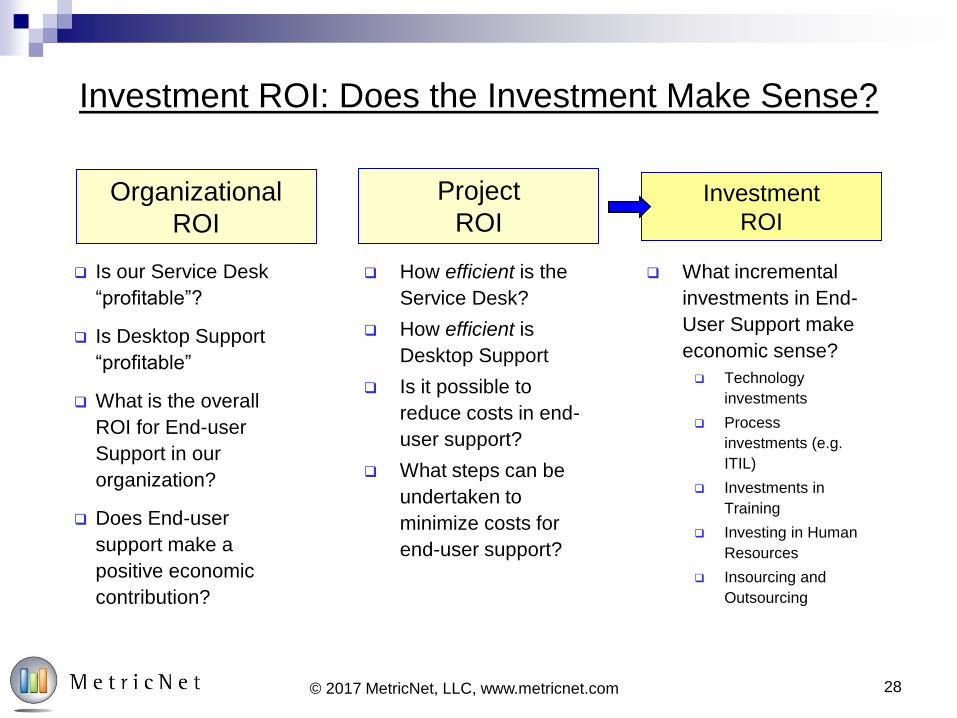
Investment ROI: Does the Investment Make Sense?
Organizational
ROI
Investment
ROI
Project
ROI
Is our Service Desk
“profitable”?
Is Desktop Support
“profitable”
What is the overall
ROI for End-user
Support in our
organization?
Does End-user
support make a
positive economic
contribution?
What incremental
investments in End-
User Support make
economic sense?
Technology
investments
Process
investments (e.g.
ITIL)
Investments in
Training
Investing in Human
Resources
Insourcing and
Outsourcing
How efficient is the
Service Desk?
How efficient is
Desktop Support
Is it possible to
reduce costs in end-
user support?
What steps can be
undertaken to
minimize costs for
end-user support?

29© 2017 MetricNet, LLC, www.metricnet.com
ROI: The Heart of Every Business Case
A Business Case is a proposed investment, and an economic
evaluation of that investment
It is based on quantifiable projections of investment (spending) and return (cost savings)
Return on Investment is a central component of every
Business Case
Other Business Case metrics may include Time to Breakeven (or payback period), and
Cost/Benefit Ratio

30© 2017 MetricNet, LLC, www.metricnet.com
Case Study #3: Investment ROI
18
4,927
$2,245,766
7,620
$24.56
72.9%First Level Resolution Rate
Service Desk Headcount
Number of End Users Supported
Annual Operating Expense
Monthly Ticket Volume
Cost per Ticket

31© 2017 MetricNet, LLC, www.metricnet.com
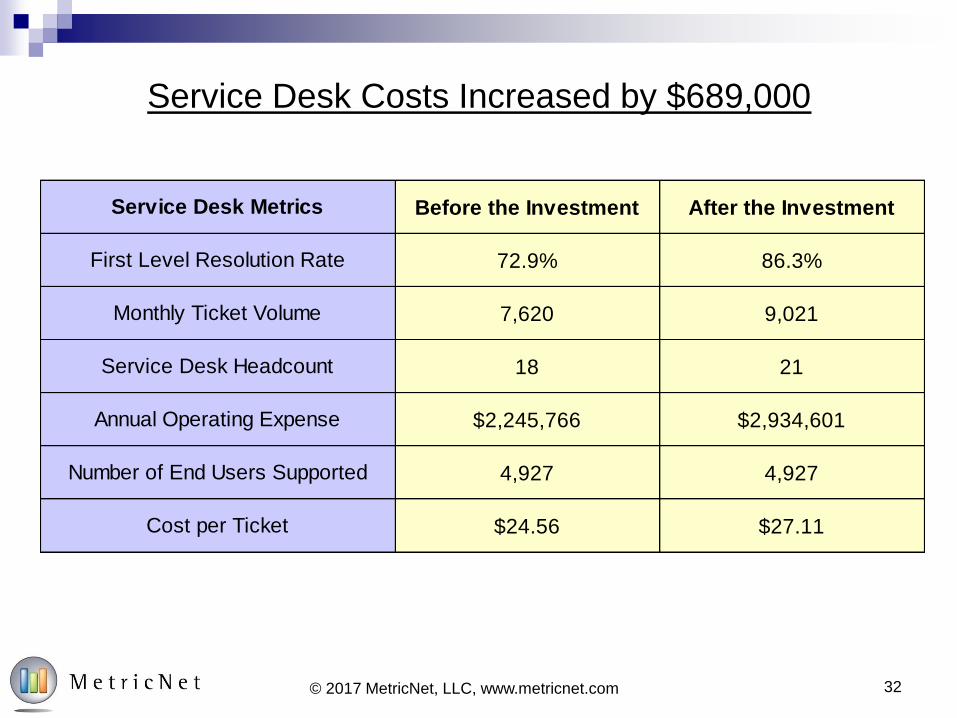
The Value Proposition
Invest in a Remote Control Tool to Increase First Level Resolution
First Level Resolution Rate will increase, Driving Shift Left
The cost of the tool is $12,000 per month, or $144,000 annually
But what’s the Return?
32© 2017 MetricNet, LLC, www.metricnet.com
Service Desk Costs Increased by $689,000
Before the Investment After the Investment
72.9% 86.3%
7,620 9,021
18 21
$2,245,766 $2,934,601
4,927 4,927
$24.56 $27.11Cost per Ticket
Service Desk Metrics
Service Desk Headcount
Number of End Users Supported
Annual Operating Expense
Monthly Ticket Volume
First Level Resolution Rate
33© 2017 MetricNet, LLC, www.metricnet.com
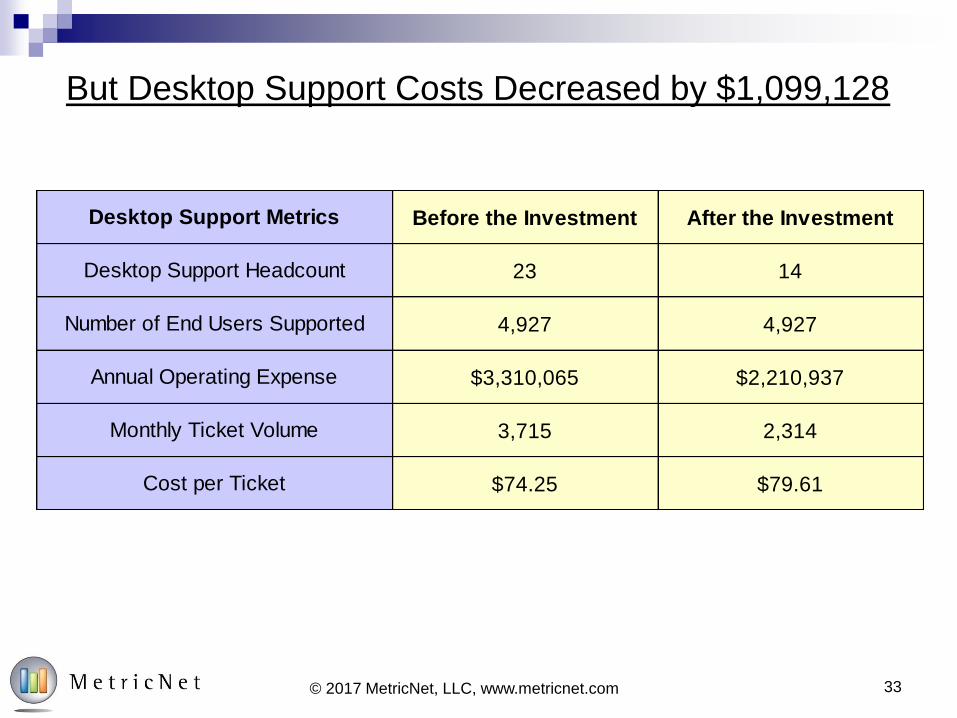
But Desktop Support Costs Decreased by $1,099,128
Before the Investment After the Investment
23 14
4,927 4,927
$3,310,065 $2,210,937
3,715 2,314
$74.25 $79.61
Desktop Support Metrics
Desktop Support Headcount
Number of End Users Supported
Annual Operating Expense
Monthly Ticket Volume
Cost per Ticket
34© 2017 MetricNet, LLC, www.metricnet.com
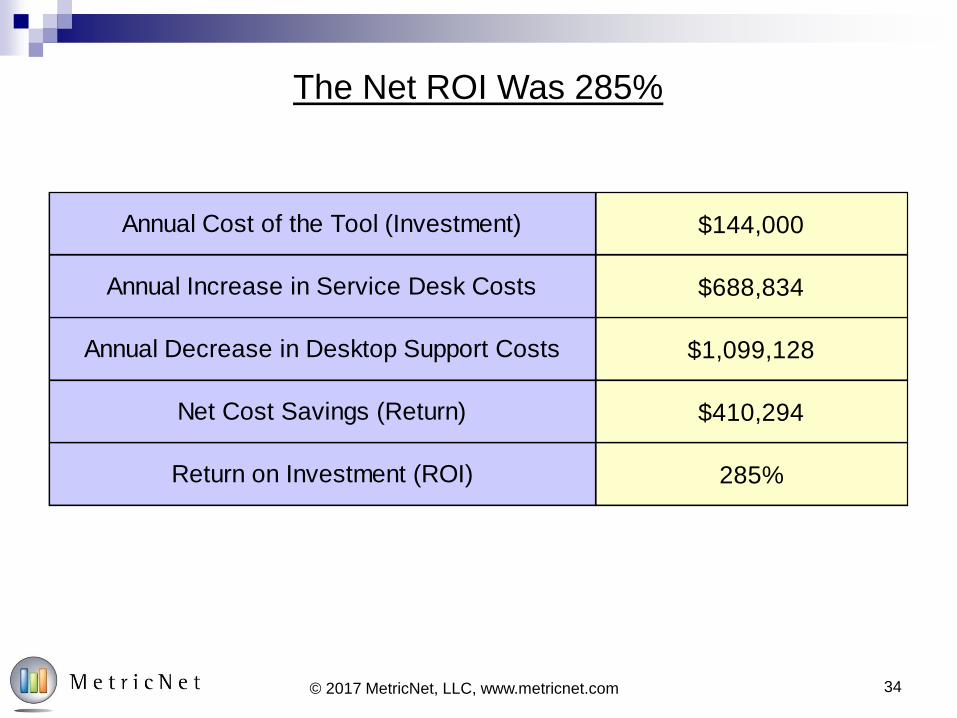
The Net ROI Was 285%
$144,000
$688,834
$1,099,128
$410,294
285%
Annual Cost of the Tool (Investment)
Annual Increase in Service Desk Costs
Annual Decrease in Desktop Support Costs
Net Cost Savings (Return)
Return on Investment (ROI)
35© 2017 MetricNet, LLC, www.metricnet.com
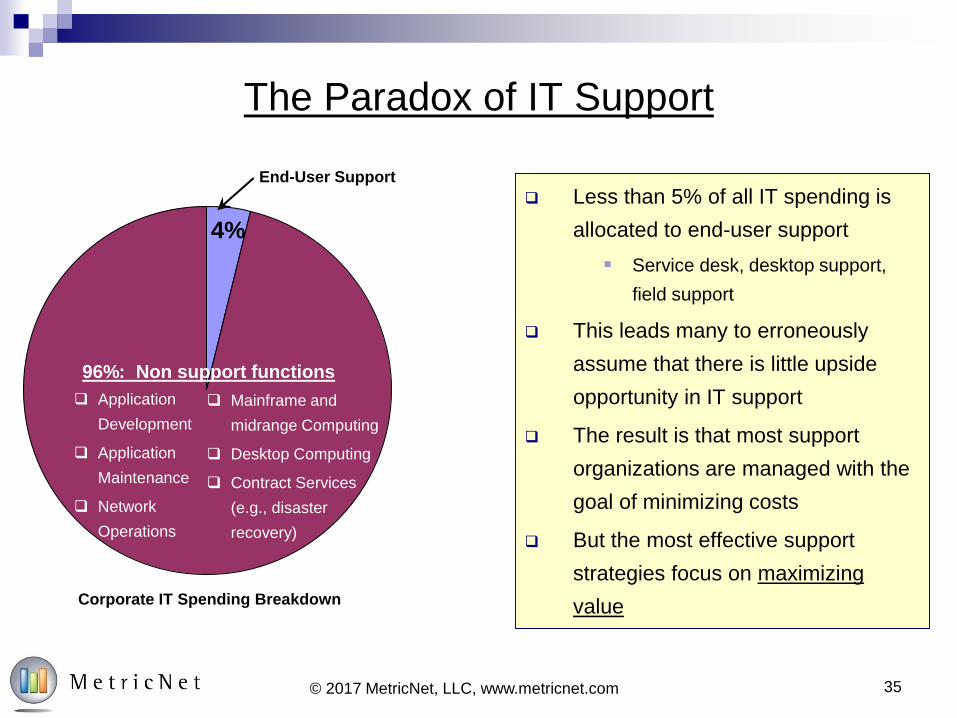
The Paradox of IT Support
Less than 5% of all IT spending is
allocated to end-user support
▪ Service desk, desktop support,
field support
This leads many to erroneously
assume that there is little upside
opportunity in IT support
The result is that most support
organizations are managed with the
goal of minimizing costs
But the most effective support
strategies focus on maximizing
valueCorporate IT Spending Breakdown
4%
96%: Non support functions
End-User Support
Application
Development
Application
Maintenance
Network
Operations
Mainframe and
midrange Computing
Desktop Computing
Contract Services
(e.g., disaster
recovery)

36© 2017 MetricNet, LLC, www.metricnet.com
The Cost Center Dilemma in ITSM
Responsible for cost
control
Not responsible for…
▪ Revenue generation
▪ Profits
▪ Investment decisions
Cost Center Value CenterVS.
Creates value
Demonstrates value
▪ Cost savings
▪ Cost Benefit
Analysis
▪ ROI Analysis
The vast majority of service and support organizations operate as cost centers
▪ They are expected to control costs, but are not expected to make any explicit financial
contribution to the enterprise
The focus in a cost center is on minimizing costs
The focus in a Value Center is on maximizing value!

37© 2017 MetricNet, LLC, www.metricnet.com
Shift Left Reduces Total Cost of Ownership

38© 2017 MetricNet, LLC, www.metricnet.com
Contact Deflection into Lower Cost Channels
Year
% o
f T
icket
Vo
lum
e
Co
st
per
Tic
ket
Self Service
Average Cost
per Ticket
Email/Web
Chat
Voice
80%
70%
60%
50%
40%
30%
20%
10%
0%
$24.50
$24.00
$23.50
$23.00
$22.50
$22.00
$21.50
$21.00
$20.50

39© 2017 MetricNet, LLC, www.metricnet.com
0
10
20
30
40
50
60
70
0 1 2 3 4 5
Pro
du
cti
ve H
ou
rs L
ost
per
Em
plo
yee p
er
Year
1 (top) 2 3 4 (bottom)
Customer Satisfaction 93.5% 84.5% 76.1% 69.3%
First Contact Resolution Rate 90.1% 83.0% 72.7% 66.4%
Mean Time to Resolve (hours) 0.8 1.2 3.6 5.0
Customer Satisfaction 94.4% 89.2% 79.0% 71.7%
First Contact Resolution Rate 89.3% 85.6% 80.9% 74.5%
Mean Time to Resolve (hours) 2.9 4.8 9.4 12.3
Service Desk
Desktop Support
Performance QuartileSupport Function Key Performance Indicator
37.4 46.9Average Productive Hours Lost per Employee per Year 17.1 25.9
Performance Quartile n = 60
Quality of Support Drives End-User Productivity

40© 2017 MetricNet, LLC, www.metricnet.com
84%
47%
31%29%
22%19%
8%
0%
10%
20%
30%
40%
50%
60%
70%
80%
90%
Service Desk Desktop
Support
Network
Outages
VPN Training Enterprise
Applications
Desktop
Software
Factors Contributing to IT Customer Satisfaction
% S
ayin
g V
ery
Im
po
rtan
t
n = 1,044
Global large cap companies
Survey type: multiple choice
3 responses allowed per survey
84% cited the service desk as a very important factor in their overall satisfaction with corporate IT
47% cited desktop support as a very important factor in their overall satisfaction with corporate IT
Service and Support Drives Customer Satisfaction for All of IT

41© 2017 MetricNet, LLC, www.metricnet.com
Some Final Thoughts on ROI
Progressive support organizations use ROI to demonstrate their
economic contribution to the organization, and justify
investments
Demonstrably positive ROI greatly increases your credibility
within the organization, and leverages your ability to get things
done!
Changing the IT Service and Support paradigm from Cost
Center to Value Center should be high on your list of priorities!
Be bold about asserting your rights as a Value Center!

Questions?

Thank You!

About MetricNet
Your Benchmarking Partner

45© 2017 MetricNet, LLC, www.metricnet.com
Your Speaker: Jeff Rumburg
Co Founder and Managing Partner,
MetricNet, LLC
Winner of the Ron Muns Lifetime
Achievement Award
Former CEO, The Verity Group
Former Vice President, Gartner
Founder of the Service Desk
Benchmarking Consortium
Author of A Hands-On Guide to
Competitive Benchmarking
Harvard MBA, Stanford MS
45

46© 2017 MetricNet, LLC, www.metricnet.com
Benchmarking is MetricNet’s Core Business
Call Centers
Telecom
Information
Technology
Satisfaction
Customer Service
Technical Support
Telemarketing/Telesales
Collections
Service Desk
Desktop Support
Field Support
Price Benchmarking
Customer Satisfaction
Employee Satisfaction
47© 2017 MetricNet, LLC, www.metricnet.com
28 Years of Service and Support Benchmarks
Nearly 4,000 IT Service and Support Benchmarks
Global Database
70+ Key Performance Indicators
More than 120 Industry Best Practices
48© 2017 MetricNet, LLC, www.metricnet.com
Meet a Sampling of Our Clients
MetricNet Conducts benchmarking for IT Service and Support
organizations worldwide, and across virtually every industry sector.

49© 2017 MetricNet, LLC, www.metricnet.com
www.metricnet.com 703.992.8160 [email protected]
Contact MetricNet…

Thank You!