The Rise of the Asian Giants: China and India compared Martin Wolf, Associate Editor & Chief...
44
The Rise of the Asian Giants: China and India compared Martin Wolf, Associate Editor & Chief Economics Commentator, Financial Times Leverhulme Centre for Research on Globalisation and School of Economics, Nottingham University March 15 th , 2007
-
Upload
phoebe-hudson -
Category
Documents
-
view
216 -
download
0
Transcript of The Rise of the Asian Giants: China and India compared Martin Wolf, Associate Editor & Chief...

The Rise of the Asian Giants: China and India comparedMartin Wolf, Associate Editor & Chief Economics Commentator, Financial Times
Leverhulme Centre for Research on Globalisationand School of Economics, Nottingham University
March 15th, 2007

2
China and India
“Let China sleep, for when she wakes, she will shake the world.” Napoleon Bonaparte

3
China and India
“China will again become a viable great power; India may become a great democracy.” Lord Meghnad Desai

4
China and India
• Potential
• Priorities
• Performance
• Prospects
5
1. Potential
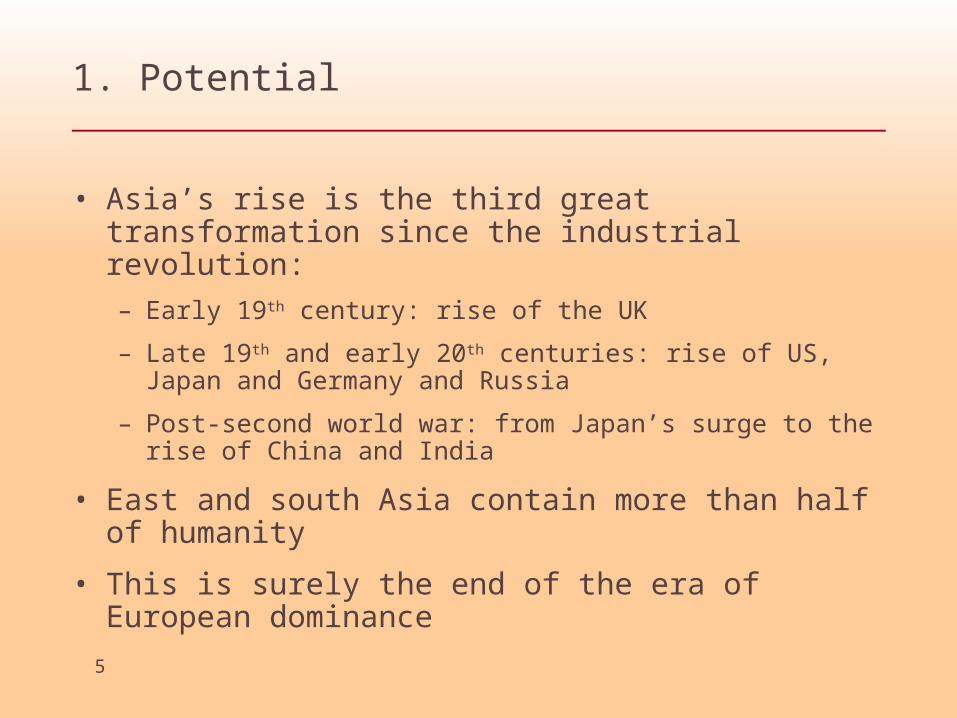
• Asia’s rise is the third great transformation since the industrial revolution:
– Early 19th century: rise of the UK
– Late 19th and early 20th centuries: rise of US, Japan and Germany and Russia
– Post-second world war: from Japan’s surge to the rise of China and India
• East and south Asia contain more than half of humanity
• This is surely the end of the era of European dominance
6
1. Potential
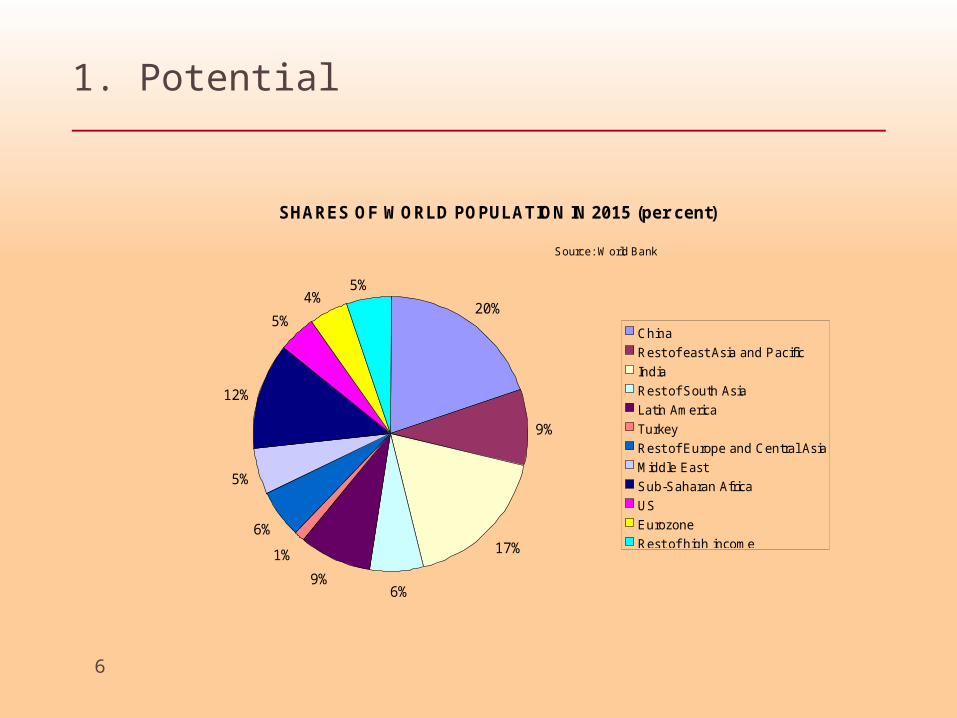
SHARES OF WORLD POPULATION IN 2015 (per cent)
20%
9%
17%
6%9%
1%
6%
5%
12%
5%
4%5%
China
Rest of east Asia and Pacific
India
Rest of South Asia
Latin America
Turkey
Rest of Europe and Central Asia
Middle East
Sub-Saharan Africa
US
Eurozone
Rest of high income
Source: World Bank

7
1. Potential
SHARES OF THE ASIAN GIANTS IN WORLD PRODUCT(per cent, at PPP)
22 23
33 33 3225 24
20 18
9
16 19
2522
2121
43
2
33 4
8
87
22
33
17
11 9 5 5 1115
24
1612 9 7
4 35 6
0
10
20
30
40
50
60
70
80
90
1700 1820 1870 1900 1913 1957 1973 1995 2003
EU-15 United States Japan China India
8
1. Potential
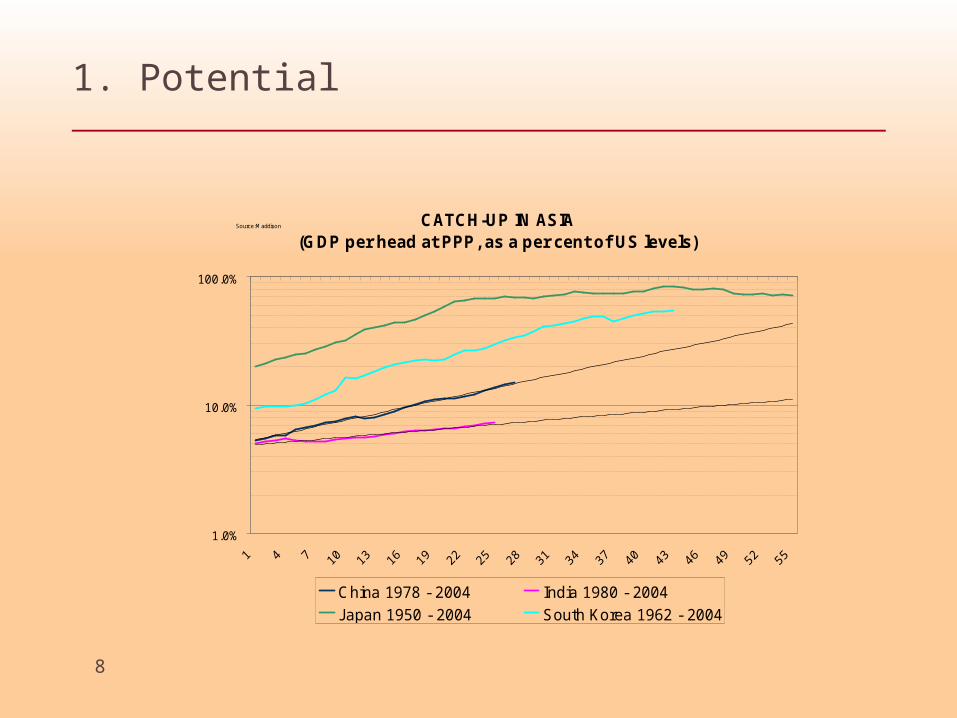
CATCH-UP IN ASIA(GDP per head at PPP, as a per cent of US levels)
1.0%
10.0%
100.0%
China 1978 - 2004 India 1980 - 2004
Japan 1950 - 2004 South Korea 1962 - 2004
Source: Maddison
9
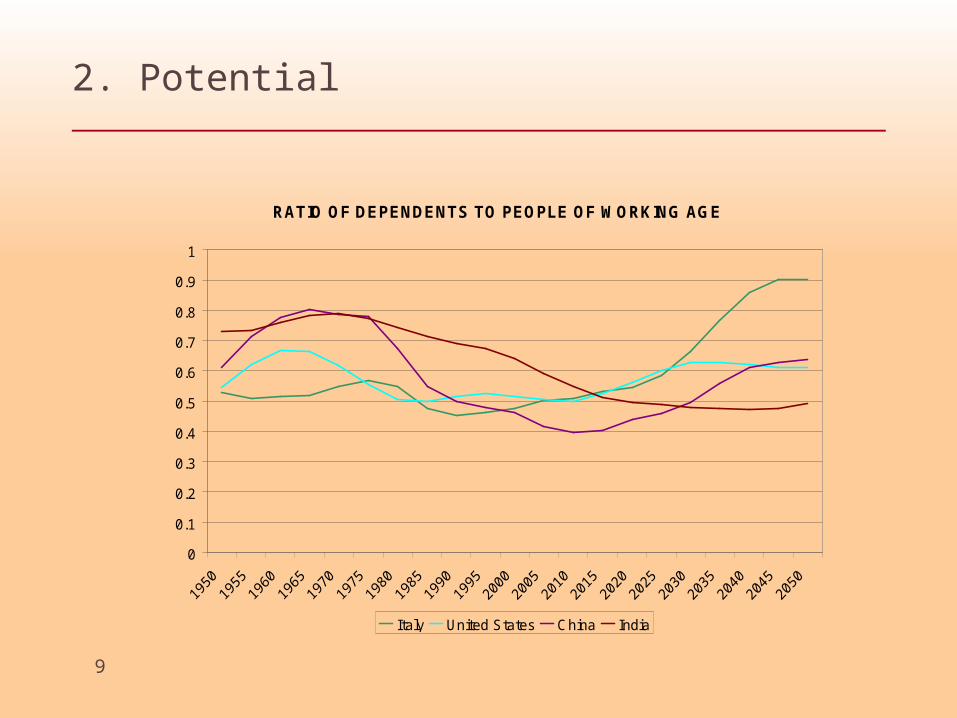
2. Potential
RATIO OF DEPENDENTS TO PEOPLE OF WORKING AGE
0
0.1
0.2
0.3
0.4
0.5
0.6
0.7
0.8
0.9
1
Italy United States China India

10
1. Priorities
• The two countries are both enormous and homes to ancient and sophisticated civilisations.
• But they are also fundamentally different:
– China has been unified for at least half of the last 2,000 years, while India was never brought fully under a single centralised system of government.
– India was conquered by foreigners who brought their culture with them; China’s were “sinicised”.
11
1. Priorities
– China’s had an imperial system; India had dynasties.
– Chinese imperial dynasties endured; India’s were brief.
– China’s is an integrated society; India’s is pluralistic.
– China’s historic source of stability was political; India’s was social.

12
1. Priorities
• These differences help explain a number of contrasts between today’s China and India:
– China’s meritocracy; and India’s policy of reservations
– China’s ability to mobilise resources; and India’s weaker public sector
– China’s bureaucratic authoritarianism; and India’s democracy.
– Chinese elites think democracy is inefficient; without democracy, there would be no India.
• These differences also are reflected in growth strategy and performance.

13
1. Priorities
• China’s growth strategy is a hybrid:
– Like Japan and South Korea in the past, it relies on:
• Industrialisation through very high savings and investment; and;
• Trade as an engine of growth;
– But China is far more open to trade and foreign direct investment than its smaller predecessors; and so
– China is a vast combination of South Korea and Hong Kong.
14
1. Priorities
• China’s state plays a central role in development:
– As mobiliser of resources;
– As investor;
– As manager of political consequences.
• China’s aim is “development without political upheaval”.
15
1. Priorities
• India’s growth strategy has been unique:
– Growth without industrialisation;
– Driven by skill-intensive services;
– With low formal sector employment;
– Tyranny of interest groups;
– And relatively low trade and foreign investment.
• India’s aim is “growth without social upheaval”.
16
3. Performance
• Overview
• Openness
• Growth
• Contributions to growth

17
3. Performance: overview
Units China IndiaPopulation(2004) millions 1,296 1,080GNI (PPP) $bn $7,634 $3,369GDP per head growth 1970-2004 8.4% 3.4%GDP per head growth 1990-2004 8.9% 4.0%Share of industry in GDP 2004 46.0% 27.0%
ECONOMIC
Source: World Bank, World Development Indicators 2006 , UNDP, Human Development Report 2006
18
3. Performance: overview
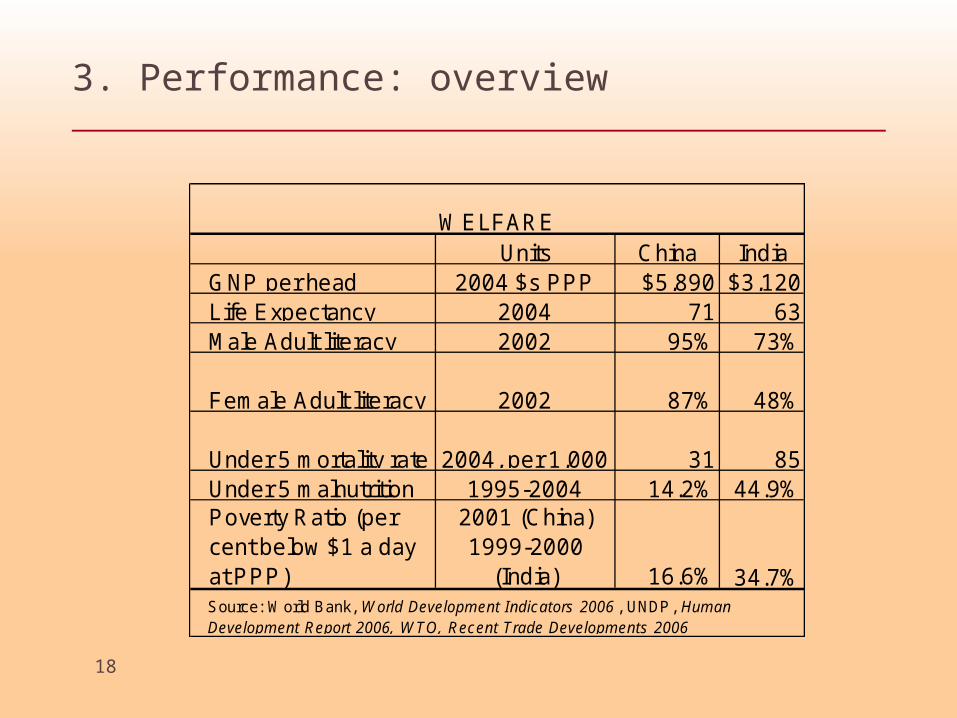
Units China IndiaGNP per head 2004 $s PPP $5,890 $3,120Life Expectancy 2004 71 63Male Adult literacy 2002 95% 73%
Female Adult literacy 2002 87% 48%
Under 5 mortality rate 2004, per 1,000 31 85Under 5 malnutrition 1995-2004 14.2% 44.9%Poverty Ratio (per cent below $1 a day at PPP)
2001 (China) 1999-2000
(India) 16.6% 34.7%
WELFARE
Source: World Bank, World Development Indicators 2006 , UNDP, Human Development Report 2006, WTO, Recent Trade Developments 2006
19
3. Performance: overview
Units China India
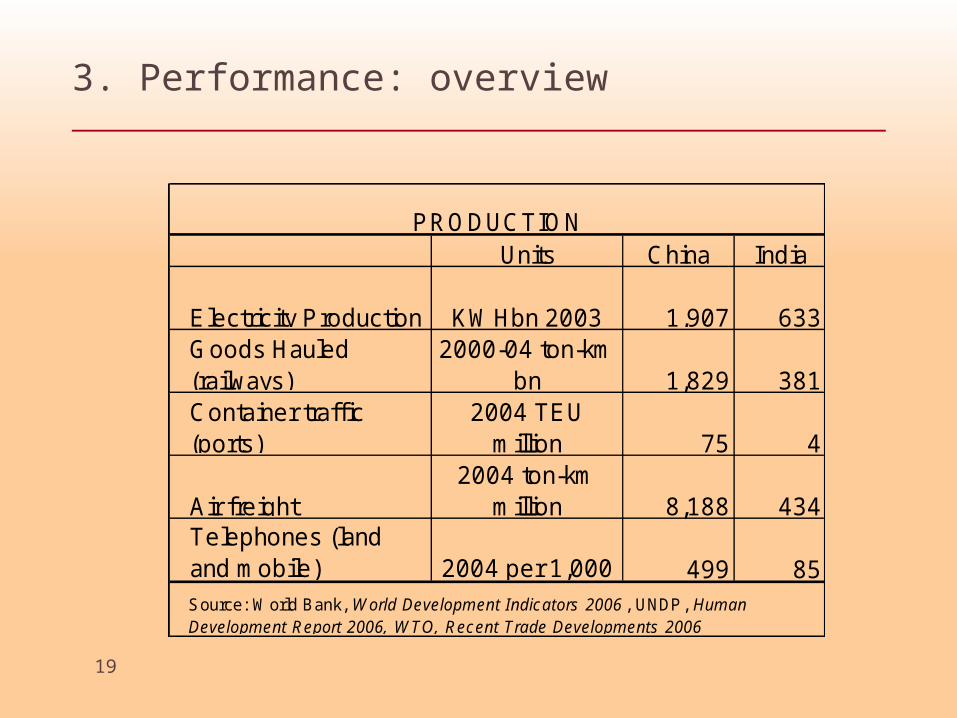
Electricity Production KWHbn 2003 1,907 633Goods Hauled (railways)
2000-04 ton-km bn 1,829 381
Container traffic (ports)
2004 TEU million 75 4
Air freight2004 ton-km
million 8,188 434Telephones (land and mobile) 2004 per 1,000 499 85Source: World Bank, World Development Indicators 2006 , UNDP, Human Development Report 2006, WTO, Recent Trade Developments 2006
PRODUCTION
20
3. Performance: overview
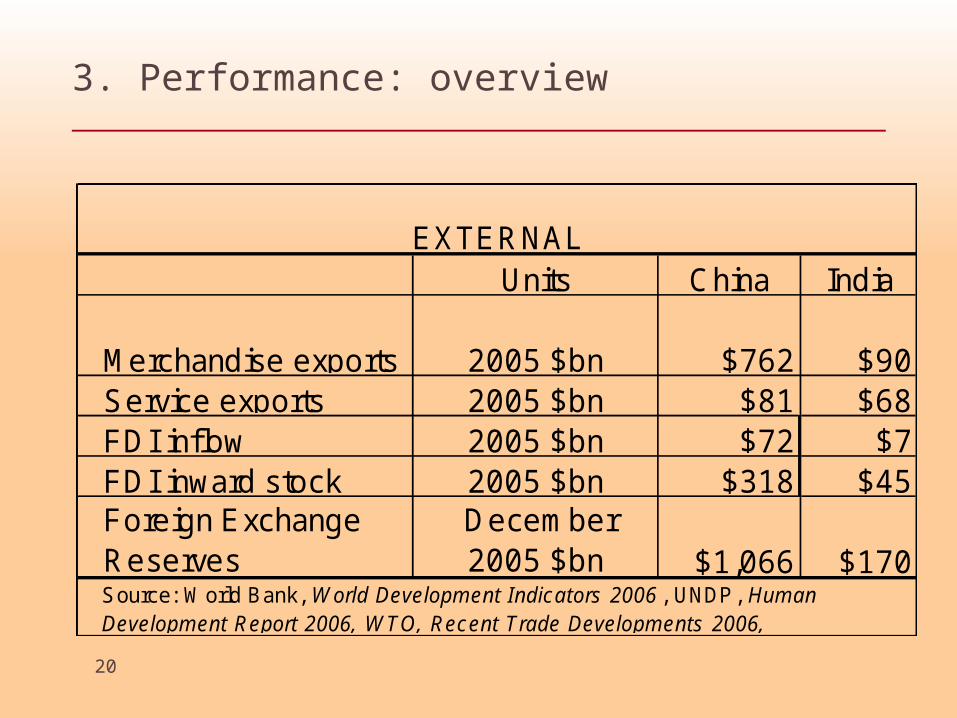
Units China India
Merchandise exports 2005 $bn $762 $90Service exports 2005 $bn $81 $68FDI inflow 2005 $bn $72 $7FDI inward stock 2005 $bn $318 $45Foreign Exchange Reserves
December 2005 $bn $1,066 $170
Source: World Bank, World Development Indicators 2006 , UNDP, Human Development Report 2006, WTO, Recent Trade Developments 2006,
EXTERNAL

21
3. Performance: openness
TARIFF RATES IN 2004
9.6%
6.0%
9.6%
6.2%
9.5%
5.8%
28.1% 28.0%29.0%
36.9%
27.8%
25.3%
0.0%
5.0%
10.0%
15.0%
20.0%
25.0%
30.0%
35.0%
40.0%
Simple mean Weighted mean Simple mean Weighted mean Simple mean Weighted mean
All Primary Manufactures
China India
Source: World Bank, World Development Indicators
22
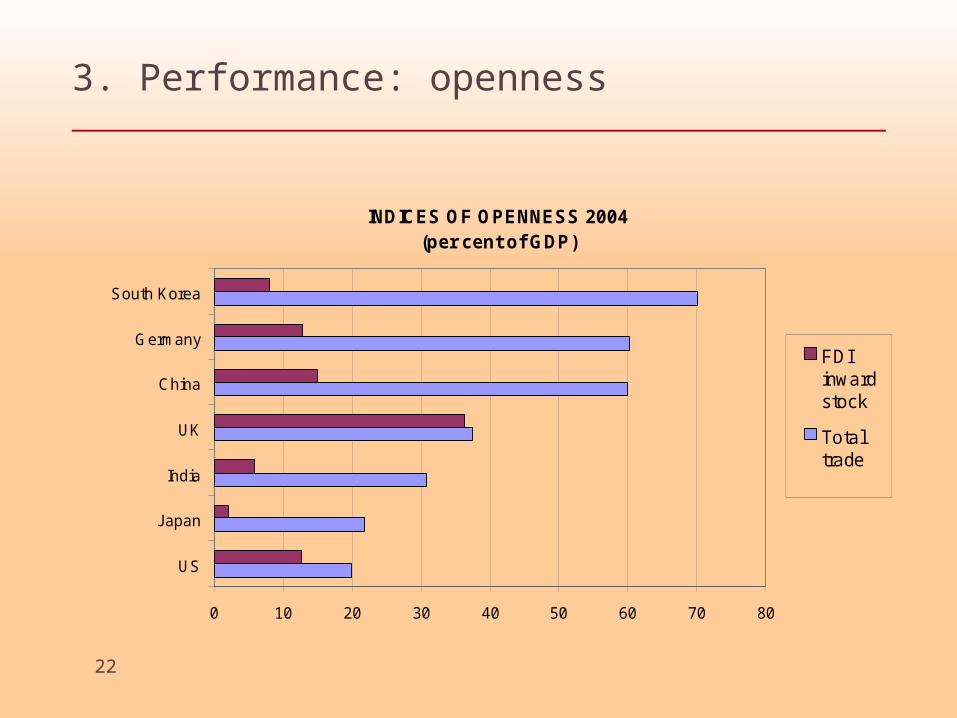
3. Performance: openness
INDICES OF OPENNESS 2004(per cent of GDP)
0 10 20 30 40 50 60 70 80
US
Japan
India
UK
China
Germany
South Korea
FDIinwardstock
Totaltrade

23
3. Performance: openness
MERCHANDISE EXPORTS OVER GDP(per cent)
0.0%
5.0%
10.0%
15.0%
20.0%
25.0%
30.0%
35.0%
40.0%
China India
24
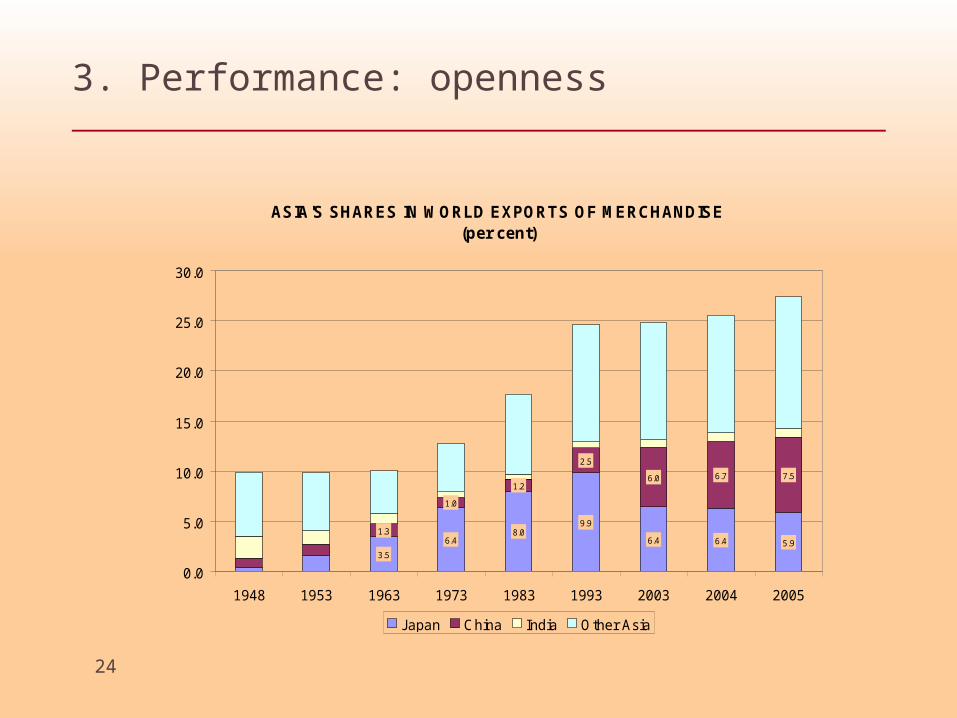
3. Performance: openness
ASIA'S SHARES IN WORLD EXPORTS OF MERCHANDISE(per cent)
3.5
6.48.0
9.9
6.4 6.4 5.91.3
1.0
1.2
2.5
6.0 6.7 7.5
0.0
5.0
10.0
15.0
20.0
25.0
30.0
1948 1953 1963 1973 1983 1993 2003 2004 2005
Japan China India Other Asia

25
3. Performance: openness
MERCHANDISE EXPORTS OF LEADING COUNTRIES($m, previous 12 months)
$0
$200,000
$400,000
$600,000
$800,000
$1,000,000
$1,200,000
Jan-
98
May
-98
Sep-9
8
Jan-
99
May
-99
Sep-9
9
Jan-
00
May
-00
Sep-0
0
Jan-
01
May
-01
Sep-0
1
Jan-
02
May
-02
Sep-0
2
Jan-
03
May
-03
Sep-0
3
Jan-
04
May
-04
Sep-0
4
Jan-
05
May
-05
Sep-0
5
Jan-
06
May
-06
Sep-0
6
China India US Japan Germany

26
3. Performance: openness
CURRENT ACCOUNT BALANCE(as per cent of GDP)
-6
-4
-2
0
2
4
6
8
10
China India

27
3. Performance: growth
A TALE OF TWO ASIAN GIANTS(GDP per head, at PPP)
0
500
1000
1500
2000
2500
3000
3500
4000
4500
5000
China IndiaSource: Maddison, IMF, World Economic Outlook

28
3. Performance: growth
GROWTH OF GDP IN INDIA AND CHINA(per cent)
0
2
4
6
8
10
12
14
16
1984
1985
1986
1987
1988
1989
1990
1991
1992
1993
1994
1995
1996
1997
1998
1999
2000
2001
2002
2003
2004
2005
2006
2007
China India
Source: EIU

29
3. Performance: growth
GROWTH OF GDP IN INDIA AND CHINA(5-year moving averages per cent)
0.0
2.0
4.0
6.0
8.0
10.0
12.0
14.0
1984
1985
1986
1987
1988
1989
1990
1991
1992
1993
1994
1995
1996
1997
1998
1999
2000
2001
2002
2003
2004
2005
2006
2007
China India
Source: EIU

30
3. Performance: growth
STRUCTURE OF GROWTH COMPARED, 1990-2000(per cent a year)
10.4%
4.1%
13.7%
10.2%
6.0%
3.0%
6.3%
8.0%
0.0%
2.0%
4.0%
6.0%
8.0%
10.0%
12.0%
14.0%
16.0%
GDP Agriculture Industry Services
China India
Source: World Bank

31
3. Performance: growth
STRUCTURE OF GROWTH COMPARED 2000-04(per cent a year)
9.4%
3.4%
10.6%
9.8%
6.2%
2.0%
6.2%
8.2%
0.0%
2.0%
4.0%
6.0%
8.0%
10.0%
12.0%
GDP Agriculture Industry Services
China India
32
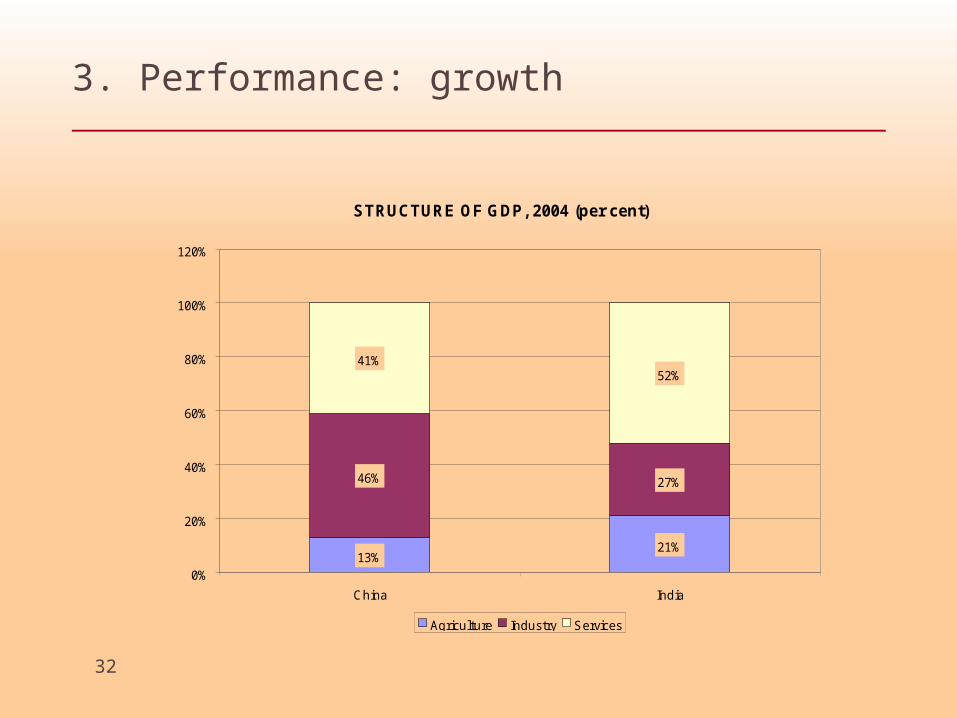
3. Performance: growth
STRUCTURE OF GDP, 2004 (per cent)
13%21%
46% 27%
41%52%
0%
20%
40%
60%
80%
100%
120%
China India
Agriculture Industry Services
33
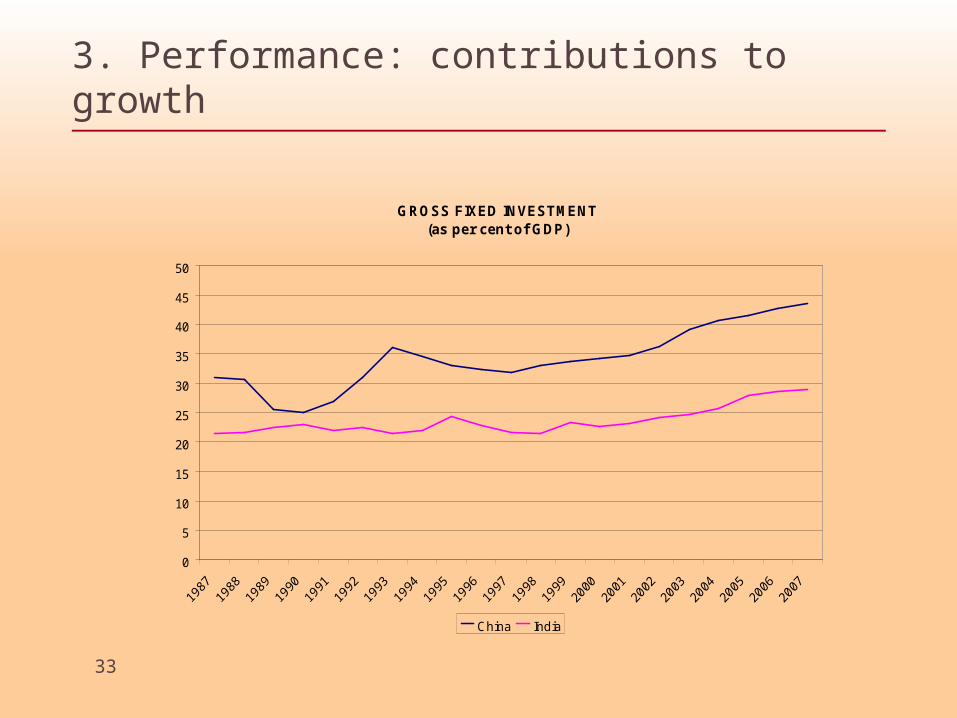
3. Performance: contributions to growth
GROSS FIXED INVESTMENT(as per cent of GDP)
0
5
10
15
20
25
30
35
40
45
50
China India

34
3. Performance: contributions to growth
DECOMPOSITION OF GROWTH, 1993-2004(percentage points)
1.2%1.9%
8.5%
4.6%
0.0%
2.0%
4.0%
6.0%
8.0%
10.0%
12.0%
China India
Employment Output per worker
Source: Barry Bosworth and Susan Collins, "Accounting for Growth: Comparing China and India", January 2007

35
3. Performance: contributions to growth
GROWTH OF TOTAL FACTOR PRODUCTIVITY (percentage points)
3.8%3.6%
4.0%
1.6%
1.1%
2.3%
0.0%
0.5%
1.0%
1.5%
2.0%
2.5%
3.0%
3.5%
4.0%
4.5%
1978-2004 1978-93 1993-2004
China India
Source: Barry Bosworth and Susan Collins, "Accounting for Growth: Comparing China and India", January 2007

36
3. Performance: contributions to growth
CONTRIBUTIONS TO GROWTH OF OUTPUT PER WORKER,1993-2004 (percentage points)
4.2%
1.8%
4.0%
2.3%
0.0%
1.0%
2.0%
3.0%
4.0%
5.0%
6.0%
7.0%
8.0%
9.0%
China India
Physical Capital Factor Productivity
Source: Barry Bosworth and Susan Collins, "Accounting for Growth: Comparing China and India", January 2007

37
3. Performance: contributions to growth
CONTRIBUTIONS TO GROWTH IN OUTPUT PER WORKER IN AGRICULTURE (1993-2004, percentage points)
2.1%
0.7%
1.8%
0.5%
-0.5%
0.0%
0.5%
1.0%
1.5%
2.0%
2.5%
3.0%
3.5%
4.0%
4.5%
China India
Physical Capital Land Education Factor Productivity
Source: Barry Bosworth and Susan Collins, Accounting for Growth: Comparing China and India
38
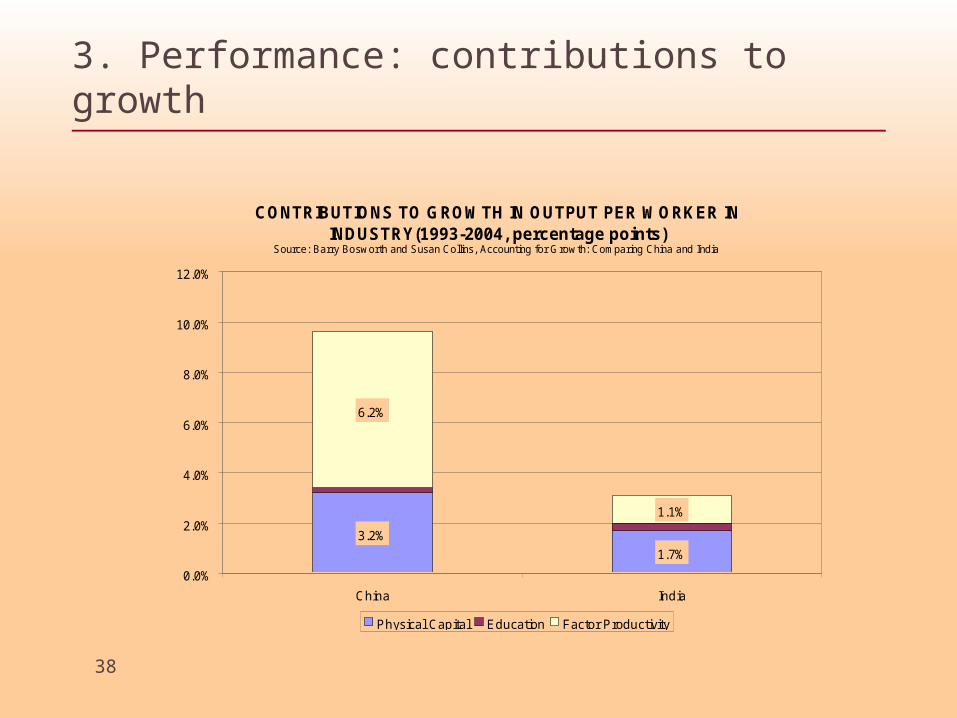
3. Performance: contributions to growth
CONTRIBUTIONS TO GROWTH IN OUTPUT PER WORKER IN INDUSTRY(1993-2004, percentage points)
3.2%
1.7%
6.2%
1.1%
0.0%
2.0%
4.0%
6.0%
8.0%
10.0%
12.0%
China India
Physical Capital Education Factor Productivity
Source: Barry Bosworth and Susan Collins, Accounting for Growth: Comparing China and India
39
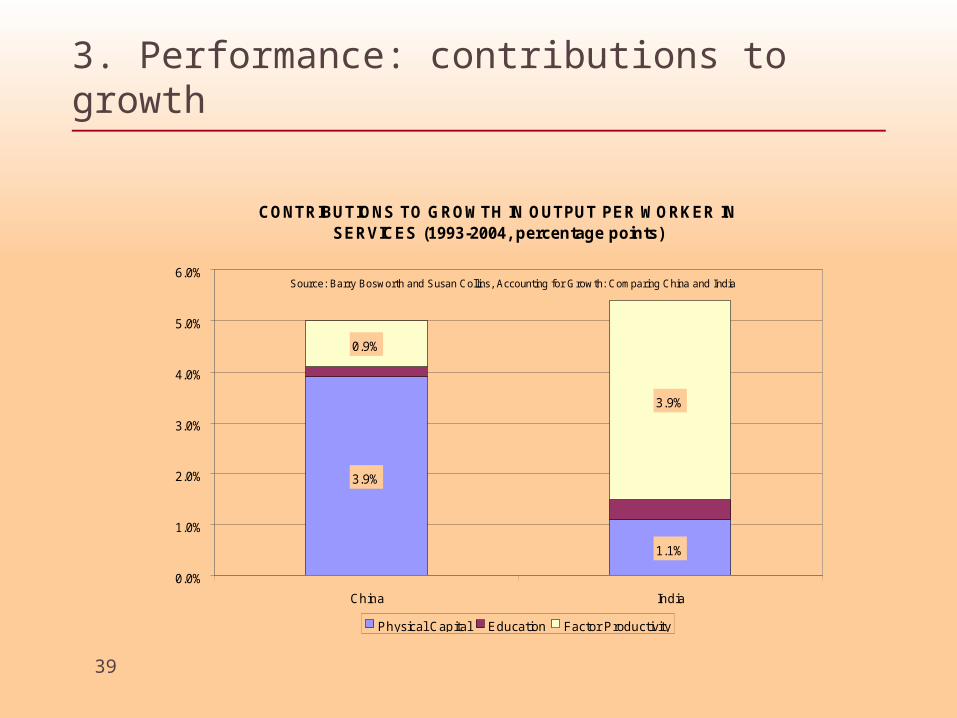
3. Performance: contributions to growth
CONTRIBUTIONS TO GROWTH IN OUTPUT PER WORKER IN SERVICES (1993-2004, percentage points)
3.9%
1.1%
0.9%
3.9%
0.0%
1.0%
2.0%
3.0%
4.0%
5.0%
6.0%
China India
Physical Capital Education Factor Productivity
Source: Barry Bosworth and Susan Collins, Accounting for Growth: Comparing China and India

40
4. Prospects
• China has outperformed India so far
• China does have weaknesses– A communist party-state
– Weak rule of law
• But also important strengths:– Open economy
– High saving and investment
– High literacy
– Classic east Asian export-oriented manufacturing
– Big investment in infrastructure
41
3. Prospects
• India does have strengths:– Stable political institutions
– A sophisticated legal system
– English as the business language
• But also weaknesses:– Lower investment;
– Failure to industrialise;
– Weaker integration into the world economy;
– Misallocation of public spending and worse infrastructure;
– Distorted labour markets; and
– Lower literacy.

42
3. Prospects
GDP AT MARKET PRICES ($bns)
$100
$1,000
$10,000
$100,000
2000 2010 2020 2030 2040 2050
China India Germany Japan UK US
Source: Goldman Sachs
43
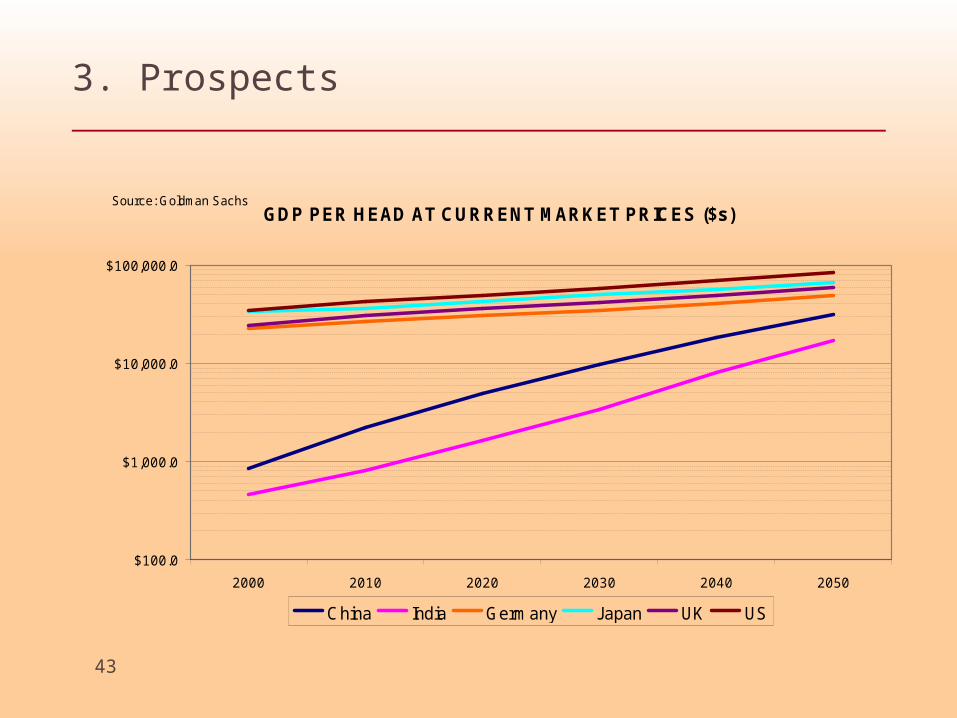
3. Prospects
GDP PER HEAD AT CURRENT MARKET PRICES ($s)
$100.0
$1,000.0
$10,000.0
$100,000.0
2000 2010 2020 2030 2040 2050
China India Germany Japan UK US
Source: Goldman Sachs
44
3. Prospects
• India is in an excellent position to exploit the opportunities and, given its size, manage the risks
• Its performance has greatly improved over the past one and a half decades.
• But China’s performance shows India could do much better