The Rise and Fall of American Growth - LSE Home Rise and Fall of American Growth ... The U.S....
40
The Rise and Fall of American Growth Hashtag for Twitter users: #LSEAmerica Department of Economics and Centre for Macroeconomics public lecture Professor Robert J Gordon Stanley G Harris Professor in Social Sciences, Northwestern University Author, The Rise and Fall of American Growth: The U.S. Standard of Living since the Civil War Fellow, Econometric Society and American Academy of Arts and Sciences Professor Wouter Den Haan Chair, LSE
Transcript of The Rise and Fall of American Growth - LSE Home Rise and Fall of American Growth ... The U.S....

The Rise and Fall of American Growth
Hashtag for Twitter users: #LSEAmerica
Department of Economics and Centre for Macroeconomics public lecture
Professor Robert J Gordon
Stanley G Harris Professor in Social Sciences, Northwestern University
Author, The Rise and Fall of American Growth: The U.S. Standard of Living since the Civil War
Fellow, Econometric Society and American Academy of Arts and Sciences
Professor Wouter Den Haan Chair, LSE

The Current Growth Slowdown from the Perspective
of the Special Century
Robert J. Gordon Northwestern University and NBER
London School of Economics,
May 11, 2016

Secular Stagnation: The Perspective in 2016
• Today 2015: slowing potential GDP growth
–Potential Output per Hour
–Potential Hours of Work
•Working-age Population
• Falling Labor-force Participation Rate (LFPR) reduces Hours per capita
• Actual real GDP growth: 1974-2004 3.12, 2004-15 1.56

Decline in Population Growth As Seen From 1938 and 2015

Productivity Growth, 1937-40 vs. 2009-14

Preview: Primary Source of Secular Stagnation
is Slowing Productivity Growth
• The best organizing principle to think about innovation is to distinguish among the industrial revolutions (IR #1, IR #2, IR #3).
• The 1st IR occurred 1770-1840, continued impact through 1900
• Steam engine, railroad, steamships
• Cotton spinning and weaving
• Transition from wood to steel

The 2nd IR occurred 1870-1920,
continued impact through 1970
• Electricity, light, elevators, machines, air conditioning
• Internal combustion engine, vehicles, air transport
• Telephone, phonograph, movies, radio, TV
• Running water, sewer pipes, and the conquest of infant mortality
• Chemicals, plastics, antibiotics, modern medicine
• Utter change in working conditions, job & home
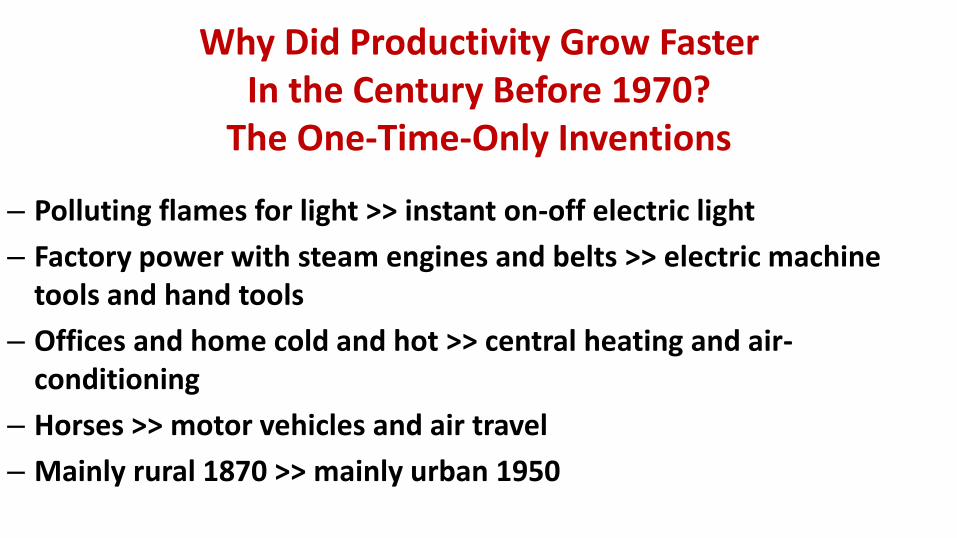
Why Did Productivity Grow Faster In the Century Before 1970?
The One-Time-Only Inventions
– Polluting flames for light >> instant on-off electric light
– Factory power with steam engines and belts >> electric machine tools and hand tools
– Offices and home cold and hot >> central heating and air-conditioning
– Horses >> motor vehicles and air travel
– Mainly rural 1870 >> mainly urban 1950
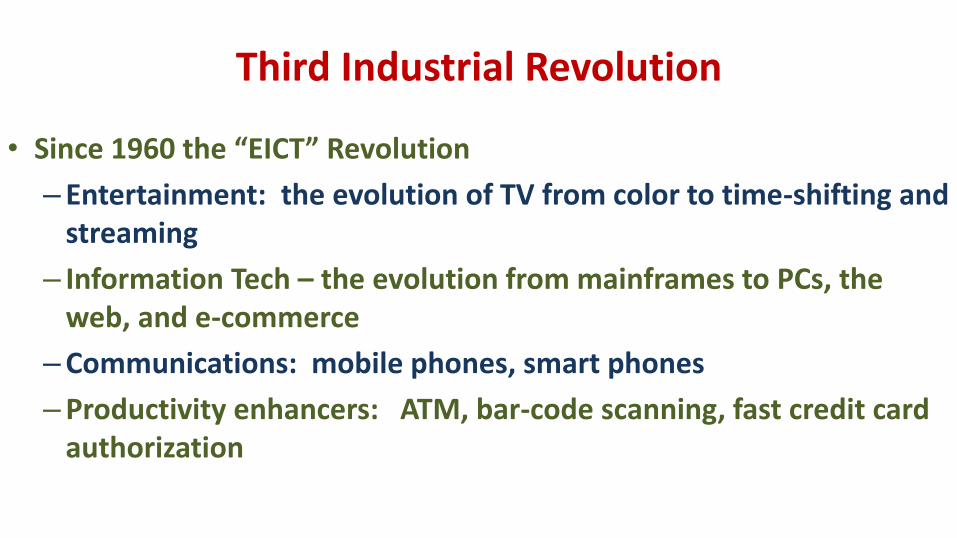
Third Industrial Revolution
• Since 1960 the “EICT” Revolution
– Entertainment: the evolution of TV from color to time-shifting and streaming
– Information Tech – the evolution from mainframes to PCs, the web, and e-commerce
–Communications: mobile phones, smart phones
–Productivity enhancers: ATM, bar-code scanning, fast credit card authorization

The Three Eras of Productivity Growth

The Three Eras of TFP Growth

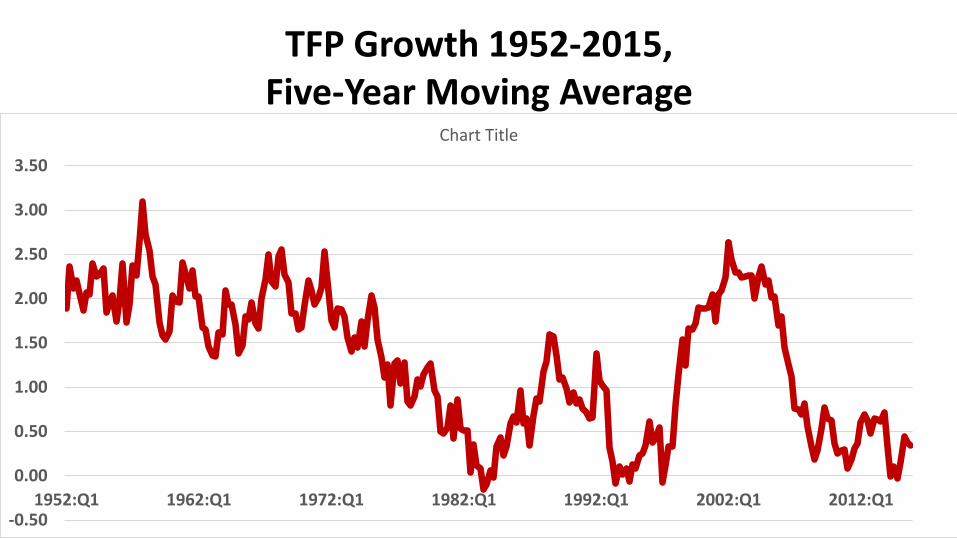
TFP Growth 1952-2015, Five-Year Moving Average
-0.50
0.00
0.50
1.00
1.50
2.00
2.50
3.00
3.50
1952:Q1 1962:Q1 1972:Q1 1982:Q1 1992:Q1 2002:Q1 2012:Q1
Chart Title

IR #3 Has Failed the TFP Test
• Failure #1: TFP growth post-1970 barely 1/3 of 1920-70
• Failure #2: IR #3 boosted TFP growth only briefly 1996-2004
• STARTLING CONCLUSION: HAS THE PRODUCTIVITY IMPACT OF THE THIRD INDUSTRIAL REVOLUTION ALREADY HAPPENED?
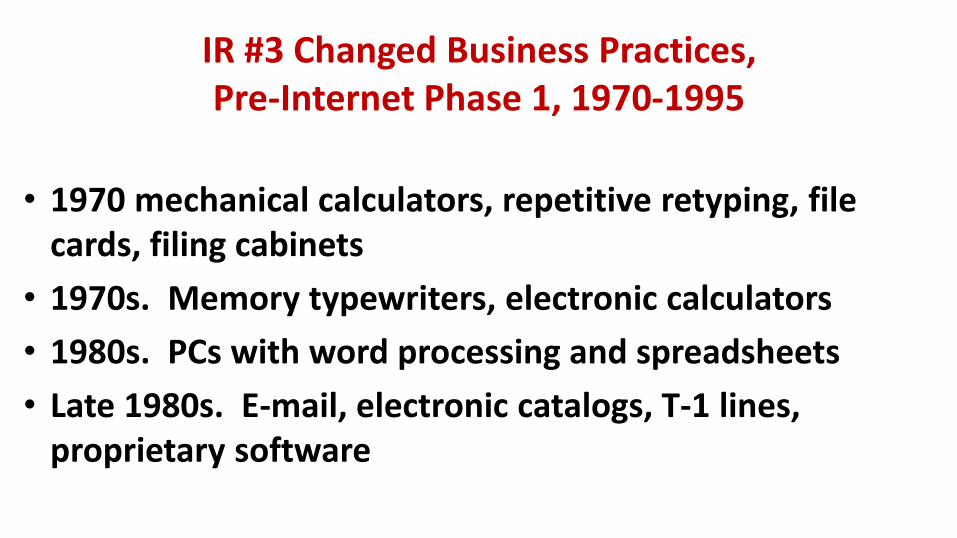
IR #3 Changed Business Practices, Pre-Internet Phase 1, 1970-1995
• 1970 mechanical calculators, repetitive retyping, file cards, filing cabinets
• 1970s. Memory typewriters, electronic calculators
• 1980s. PCs with word processing and spreadsheets
• Late 1980s. E-mail, electronic catalogs, T-1 lines, proprietary software
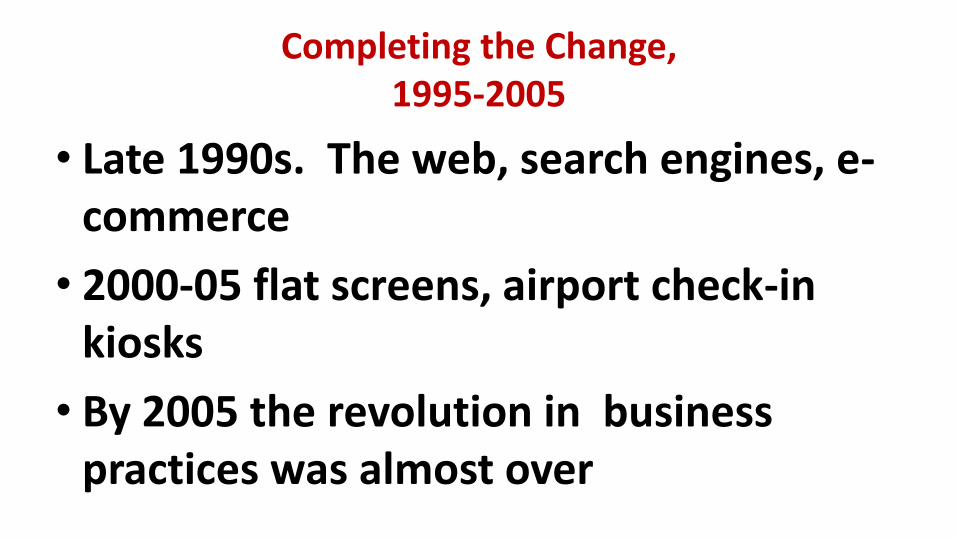
Completing the Change, 1995-2005
• Late 1990s. The web, search engines, e-commerce
• 2000-05 flat screens, airport check-in kiosks
• By 2005 the revolution in business practices was almost over

Eliminating the Middle in Publishing
• Newspaper publishing circa 1994
–A newsroom of PC screens (not flat)
–By then no linotype operator
–Replaced by linked word processing and publication software
• Newspapers, magazines, books, academic papers
• The whole layer of secretaries, typesetters, middlemen had been eliminated before web browsers arrived
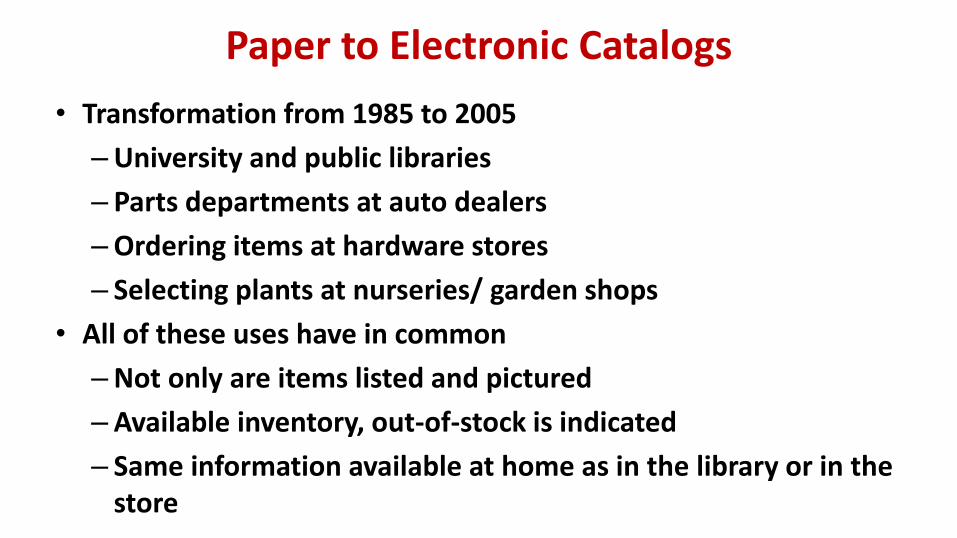
Paper to Electronic Catalogs
• Transformation from 1985 to 2005
–University and public libraries
– Parts departments at auto dealers
–Ordering items at hardware stores
– Selecting plants at nurseries/ garden shops
• All of these uses have in common
–Not only are items listed and pictured
–Available inventory, out-of-stock is indicated
– Same information available at home as in the library or in the store

Transformation in Retailing Completed by 2005
• 1980s and 1990s Wal-Mart led big box revolution with innovations in supply chain and inventory management
• Check-out revolution: bar-code scanners, credit/debit card authorization technology
• Impact of self check-out surprisingly small (is it surprising?)
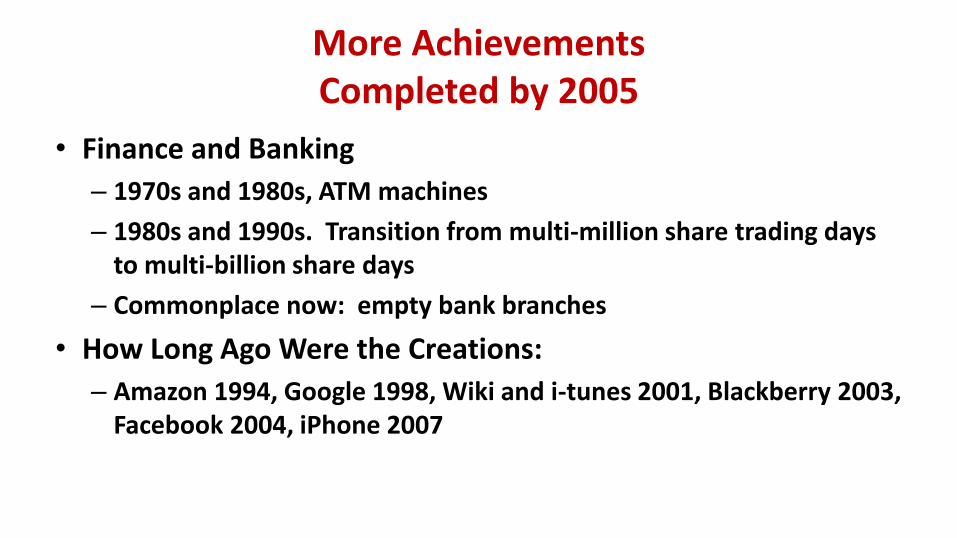
More Achievements Completed by 2005
• Finance and Banking
– 1970s and 1980s, ATM machines
– 1980s and 1990s. Transition from multi-million share trading days to multi-billion share days
– Commonplace now: empty bank branches
• How Long Ago Were the Creations:
– Amazon 1994, Google 1998, Wiki and i-tunes 2001, Blackberry 2003, Facebook 2004, iPhone 2007

Summary: Stasis Everywhere You Look
• Offices use desktop computers and proprietary information as they did 10-15 years ago
• Retail stasis. Shelves stocked by humans, meat sliced at service counters, checkout bar-code scanning.
• Medicine: electronic medical records largely rolled out, little change in what nurses and doctors do
• Higher Education: cost inflation comes from rising ratio of administrative staff to instructional staff
TFP Growth 1952-2015, Five-Year Moving Average
-0.50
0.00
0.50
1.00
1.50
2.00
2.50
3.00
3.50
1952:Q1 1962:Q1 1972:Q1 1982:Q1 1992:Q1 2002:Q1 2012:Q1
Chart Title

Declining Business “Dynamism” Measured by New Firm Entry

Stagnation Symptom #2: Declining Rate of Net Investment

Stagnation Symptom #3: Growth in Manufacturing Capacity
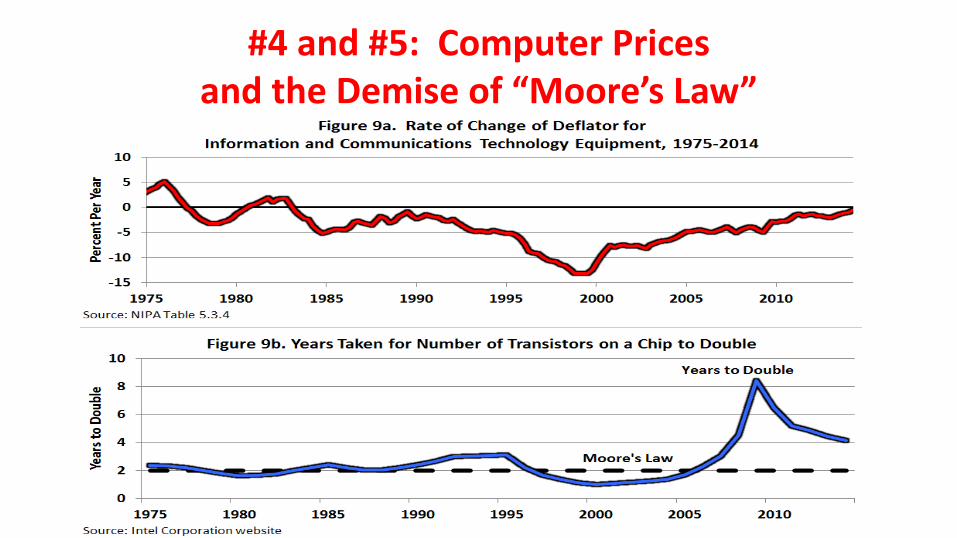
#4 and #5: Computer Prices and the Demise of “Moore’s Law”
Innovations Continue But How Important Are They?
(I only look ahead 25 years)
• Medical Care
– Life expectancy fell 2015 vs. 2014
• US lower than Canada, Europe, and Japan
– Stunning new report on death rates of whites aged 45-54
– Life expectancy gap rich vs. poor (87 vs. 73)
–Coming collision between physical wellness and mental illness (Alzheimers)
Innovations Continue But How Important Are They?
• Small Robots
–Robots date back to 1961, continued development is evolutionary not revolutionary
–Robot description from NYT
• 3-D Printing
–Greatly speeded up speed and efficiency of designing prototypes, not mass production

Innovations Continue But Are Evolutionary Not Revolutionary
• Artificial Intelligence – Predominant uses of big data are in marketing, zero-sum game
– Evolutionary change: legal searches, radiology reading, voice recognition, language translation,
“Robo-advice”
• Driverless Cars and Trucks – Truck drivers don’t just drive trucks, they unload them and stock the
shelves
– Evaluation from Consumer Reports (May 2016)
Slower Growth Goes Beyond Innovation: The Four Headwinds
• The slowing contribution of education to economic growth
• The demographic headwind
• Rising inequality, bottom 99% vs. average including top 1%
• The fiscal headwind

First Headwind: Education
• A major driver of that epochal 20th century productivity achievement was education
– High school completion rate has barely changed since 1970.
– Most people drop out of 2-year community colleges
– College completion is increasing but 40% of recent graduates are in jobs that do not require a college education
– High cost, growing indebtedness

Education: International Comparisons
• Poor preparation for college. International PISA test scores rank out of 34 OECD countries: US #17 in reading, 20th in science, 27th in math
• U.S. has dropped from #1 to #16 in college completion as percent of population; same for high-school dropouts
• This will reduce future economic growth by -0.3 percent per year compared to the contribution of education to 20th century growth

Demographic Headwind: Decline in Hours per Person
• Retirement of Baby-Boom Generation
• Reduction of Participation of Prime-Age Males
• Youth
– Employment/Population Ratio 65% in 1988 to 46% in 2012. Only about 1/3 of this decline is accounted for by increased school participation
• Females 20 and Over
– Labor Force Participation Rate rose 35% in 1968 to 58% in 2000, then fell back to 55% in 2012

Third Headwind: Inequality
• For 1993-2012 the gap between average real income growth of total vs. bottom 99% is
-0.53 percent per year.
• This is continuing, it’s not over. Count the ways – CEO pay, sports and entertainment stars. ($10-15 million)
– Wage pushbacks – lower wages, two-tier wages, shaving pension and medical care benefits
– Firms pushing employees into part-time work to avoid paying medical care benefits

The Fiscal Headwind: Future Debt-GDP Ratio
Adverse Future Implications • Future consequences of single-parent households
– More children growing up in poverty
– Greater likelihood of future high-school dropping out
– Greater likelihood of criminal activity
• Additional adverse effects: 1979-2009 percent with prison records
– white high school dropouts with prison records 4 to 28 percent
blacks 15 to 68 percent
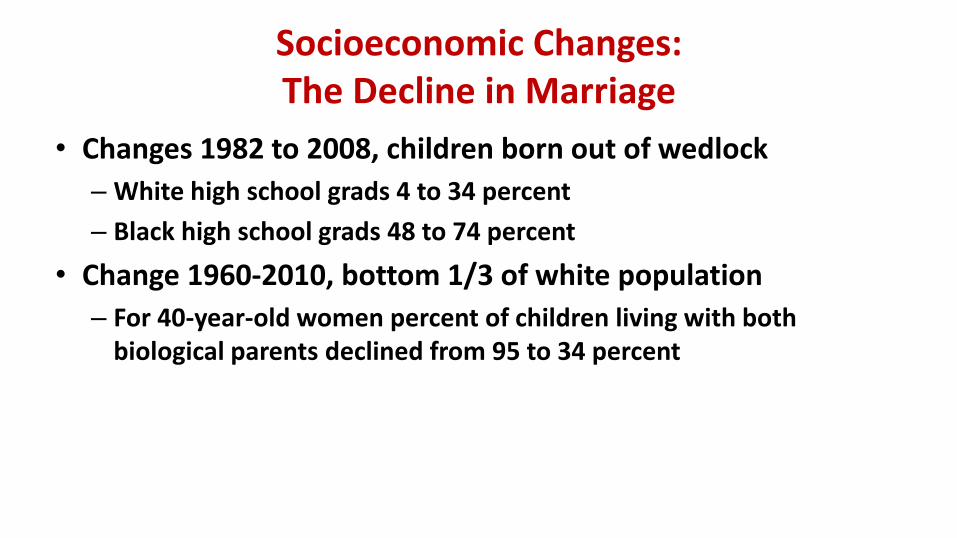
Socioeconomic Changes: The Decline in Marriage
• Changes 1982 to 2008, children born out of wedlock
– White high school grads 4 to 34 percent
– Black high school grads 48 to 74 percent
• Change 1960-2010, bottom 1/3 of white population
– For 40-year-old women percent of children living with both biological parents declined from 95 to 34 percent
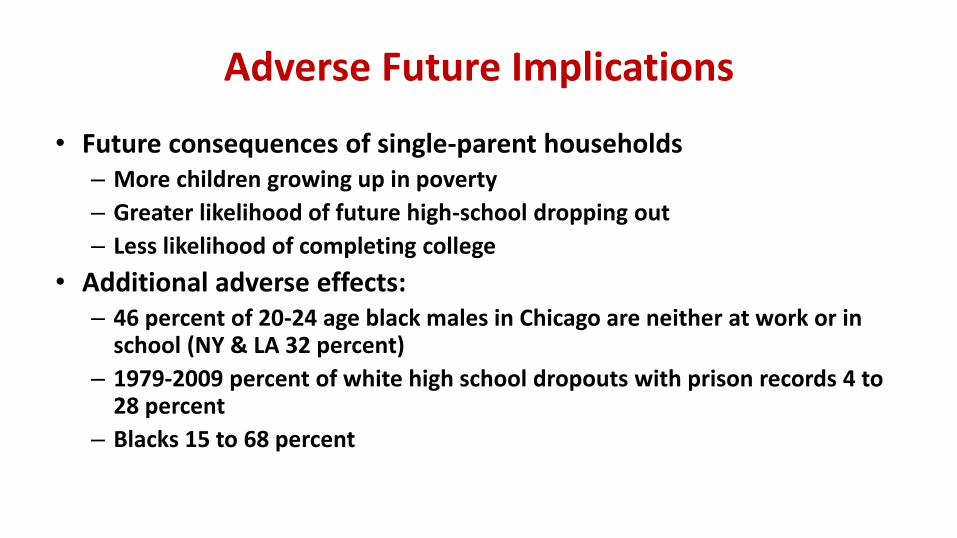
Adverse Future Implications
• Future consequences of single-parent households – More children growing up in poverty
– Greater likelihood of future high-school dropping out
– Less likelihood of completing college
• Additional adverse effects: – 46 percent of 20-24 age black males in Chicago are neither at work or in
school (NY & LA 32 percent)
– 1979-2009 percent of white high school dropouts with prison records 4 to 28 percent
– Blacks 15 to 68 percent

Combined Effects of Headwinds
• Education headwind reduces productivity growth
• Demographic headwind reduces hours per person
• Inequality headwind reduces median growth below average growth
• Fiscal headwind raises taxes or reduces transfer payments

0.0
0.5
1.0
1.5
2.0
2.5
Output per Hour Output per Person Median Output per Person Disposable Median IncomePer Person
Pe
rce
nt
Figure 18-5. Annual Growth Rate of Alternative Real Income Concepts, Actual Outcomes 1920-2014 and Projected Values 2015-2040
1920-20142015-2040
2.26
1.20
Source: Data underlying Table 18-4.
2.11
1.82
1.69
0.80
0.40
0.30
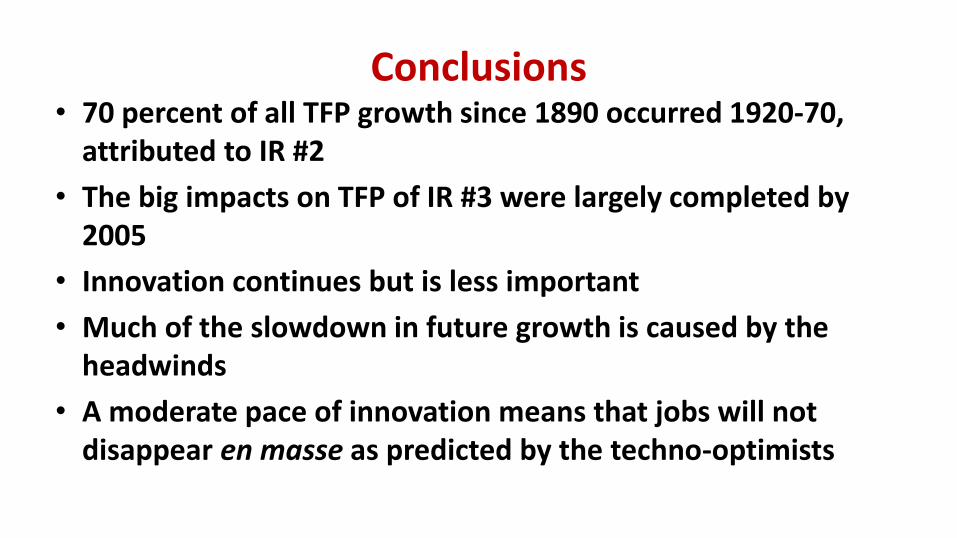
Conclusions • 70 percent of all TFP growth since 1890 occurred 1920-70,
attributed to IR #2
• The big impacts on TFP of IR #3 were largely completed by 2005
• Innovation continues but is less important
• Much of the slowdown in future growth is caused by the headwinds
• A moderate pace of innovation means that jobs will not disappear en masse as predicted by the techno-optimists

The Rise and Fall of American Growth
Hashtag for Twitter users: #LSEAmerica
Department of Economics and Centre for Macroeconomics public lecture
Professor Robert J Gordon
Stanley G Harris Professor in Social Sciences, Northwestern University
Author, The Rise and Fall of American Growth: The U.S. Standard of Living since the Civil War
Fellow, Econometric Society and American Academy of Arts and Sciences
Professor Wouter Den Haan Chair, LSE