![[M. M Botvinnik] Alekhine vs. Euwe Return Match 19(BookFi.org)](https://static.fdocuments.us/doc/165x107/577cd2de1a28ab9e78963257/m-m-botvinnik-alekhine-vs-euwe-return-match-19bookfiorg.jpg)
[M. M Botvinnik] Alekhine vs. Euwe Return Match 19(BookFi.org)
Jeroen Euwe – [email protected]
1
The Rhine; backbone of Dutch-German economic interdependence 1919-
1933
Abstract For a long time, it has been said that Rhine transport plays an important role in Dutch-
German economic ties. Nevertheless, this has never been the subject of statistical
research. This essay aims to fill this gap for the period 1919-1933. To do so, it charts
Dutch, German, Belgian and French freight traffic, both by Rhine barge and by train.
Statistical data shows that on the lower Rhine, Dutch ships were in the majority from
1925-on, while on the middle and upper Rhine – where German ships were in the
majority – the Dutch share increased significantly as the 1920s progressed. By the end
of the decade, Dutch barges were in the majority in overall Rhine shipping. Throughout
the period, Belgian and French Rhine shipping was – in comparison – negligible.
However, given that – for various reasons – by the end of the 1920s at least 39% of the
Dutch Rhine fleet was actually owned by Germans, the „Dutch‟ superiority in numbers
is more a sign of how the Dutch and German economies were interwoven than anything
else.
Rhine shipping concentrated on the Ruhr. The image of the Ruhr as centre of
German economic activity is confirmed by German internal transport, where both
inland shipping as well as rail freight was focused on the Ruhr. The majority of
German exports that was sent by railroad transport also originated in the Ruhr, with
only German imports by rail freight being less oriented on the Ruhr itself, and more on
the extended Ruhr area, which in addition to the Ruhr consisted of the Rheinprovinz
and Westphalia. Although transport between the Netherlands and Germany was almost
entirely over the Rhine, the Dutch had an important share in rail freight, alternating
with France for first place while Belgian railroad transport was consistently less than
Dutch railroad freight.
This essay therefore concludes that the economic structure and international
economic ties of Germany find a strong expression in the transport sector, with
Germany‟s economic heartland clearly being the Ruhr area. Although transport to and
from Belgium and France was also concentrated on the (extended) Ruhr area, for both
Germany as a whole and the Ruhr area in particular it was transport to and from the
Netherlands that was – by a large margin – the most important. Of all this transport, the
vast majority was via Rhine shipping, making the Rhine truly the backbone of Dutch-
German economic relations.
„Just a cursory look at the map already reveals the almost natural inevitability of the
interweaving of traffic and economy of the Rhine areas with the Netherlands: the close
proximity to the border of both economic areas, their integration into the Rhine river system
and their economic community with the large ports of the Rhine and the seaports‟.1 Such were
the words Konrad Adenauer – at the time mayor of Cologne, later the first Chancellor of West
1 K. Adenauer, „Die wirtschaftlichen Beziehungen zwischen dem rheinland und den niederlanden‟. In:
Jahresberichten der Nederlandsche Kamer van Koophandel voor Duitschland 1929-1930, 5-8, there 5.
The original text reads: „Schon ein kurzer Blick auf die Landkarte erfasst die geradezu natürliche
Zwangsläufigkeit der Verkehrs- und Wirtschaftsverflechtung der rheinischen Gebiete mit den
Niederlanden: die enge Grenznachbarschaft der beiden Wirtschaftsgebiete, ihre Eingliederung in das
gemeinsame Rheinstromsystem und ihre Wirtschaftsgemeinschaft mit den grossen Häfen des Rheines
und der Meeresküste.‟
Jeroen Euwe – [email protected]
2
Germany – chose to open his essay on the economic relations between the Netherlands and the
Rhineland for the annual report for 1929-1930. Adenauer concluded „The backbone of the
economic ties between Germany and the Netherlands is the Rhine‟.2 This essay examines the
correctness of Adenauer‟s claim. To do so, it first explores the changing relation between the
port of Rotterdam and its hinterland and the development of the infrastructure necessary for
transport. This is then followed by an analysis of the internal and international transport flows
in both Germany and Holland, which – apart from the work done by Rainer Fremdling on
Dutch-German railroad traffic, and on German internal trade flows by Nikolaus Wolf – has
been a largely neglected subject.3 In order to be able to put Dutch-German transport into
perspective, the competition between the Netherlands, Belgium and France for transport to and
from Germany – both by Rhine shipping and railroads – will then be reviewed. Only after all
flows of traffic, competition with other ports and between modes of transportation have been
assessed, will the extent of Dutch-German dependence in international transport be sufficiently
clear to conclude whether Adenauer‟s claim was valid.
Rotterdam and the German hinterland
Rhine shipping and railroad traffic with Germany took off when German – more specifically
Rheinisch-Westphalian – industrialization started in the 1860‟s. Just across the Dutch-German
border, partly in the German Rheinprovinz and partly in Westphalia, industry concentrated near
the Ruhr, a tributary of the Rhine. The area combined large deposits of high quality coal and by
way of the Rhine provided a convenient and cheap mode of transportation. The Rhine proved
to be uniquely suitable for inland shipping: the water level was always sufficient, and stable
due to the regulating influence of Lake Constance. As a consequence, the Rhine was navigable
up to Mannheim for ships of 4,000 tons, while Strasbourg could be reached with ships
measuring 2.500 tons.4 Transport in bulk of coal and ores along the Rhine grew at a fast rate as
Germany changed from an agrarian- to an industrialized economy. Whereas traffic across the
Dutch-German border in 1840 amounted to some 375.000 ton exports – mostly raw materials –
2 The original text reads: „Das Rückgrat der deutsch-holländischen Wirtschaftsverbindung ist der
Rhein‟. 3 Rainer Fremdling, „Per spoor de grens over: niederländisch-deutsche Eisenbahnbeziehungen, 1853-
1938‟, in: J.C.G.M. Jansen, ed., Economische betrekkingen in grensregio’s in een industrieel tijdperk,
1750-1965 (Leeuwarden/Mechelen 1996) pp.37-67; Nikolaus Wolf, „Was Germany ever united?
Evidence from Intra- and International Trade, 1885-1933‟, in: Journal of Economic History 69 (3),
September 2009, pp. 846-881. 4 Josef Lülsdorfs, Die Bedeutung Rotterdams für die rheinische Wirtschaft, insbesondere für die
deutsche Rheinschiffahrt (Köln 1940), 38.
Jeroen Euwe – [email protected]
3
and 128.000 tons imports – mostly merchandise – by 1913 exports consisted of coal and
wholly and semi-manufactured products, while imports consisted mostly of raw materials for
industry. Dutch ports – especially Rotterdam, to a lesser extent Amsterdam and other ports –
profited from this development, and as a result became more dependent on Germany: in 1913
almost 75% of overseas goods where destined for Germany. Just twenty-three years earlier this
had been 50%.5
While the port of Amsterdam focussed on mixed cargo, Rotterdam concentrated on
transport in bulk. Before long, Rotterdam became „the bridge that connects the German
hinterland and west-German industry to the world market‟.6 Connections to the coalmines and
iron industry of the lower Rhine were especially strong, though there was also significant
traffic to and from other spheres of industry, such as the chemical- and paper industry.7
Rotterdam actively attracted as much of Rhine traffic as it possibly could. Acknowledging the
importance of accessibility both for inland shipping and large ocean-going freighters as well as
the advantages conferred by modern harbour machinery and low harbour rates, the Rotterdam
Chamber of Commerce and Industry constantly pressured the Dutch government and the city
of Rotterdam to make improvements. With regards to accessibility and machinery, the
Chamber was successful: in 1918 it was decided that the Nieuwe Waterweg – Rotterdam‟s
gateway to the sea since 1875 – should be dredged to a significantly greater depth.8 Its
concerns regarding the harbour costs were not heeded however, and these would remain
significantly higher than those of Antwerp and Hamburg throughout the period 1919-1931.9
The hinterland of the port of Rotterdam did not consist of just the Rhine basin. Rhine
traffic extended further east through the Rhine-Herne Canal and the Lippe branch canal – both
mainly used for the transportation of coal – and the tributaries Main, Neckar, and Lahn.10
During the rise of railway transport in the first half of the nineteenth century, railway transport
and inland shipping along the Rhine enjoyed a mutually advantageous relationship. In
Germany, railroads were constructed at right angles to the Rhine, and rail transport carried
5 Lülsdorfs, Die Bedeutung Rotterdams, 7-8, 53.
6 Idem, 33.
7 Idem, 34.
8 H.J.D. van Lier, Kamer van Koophandel en Fabrieken voor Rotterdam, 1803-1928 (Rotterdam 1928)
828, 849-853. 9 J. Verseput, Kamer van Koophandel en Fabrieken voor Rotterdam, 1928-1955 (Rotterdam 1955) 69-
70, 73. 10
Lülsdorfs, Die Bedeutung Rotterdams, 33-34, 38.
Jeroen Euwe – [email protected]
4
goods from specially constructed ports further inland.11
During the 1860‟s and 1870‟s
however, the Rheinische Eisenbahngesellschaft was laying tracks alongside the Rhine towards
the Netherlands.12
In the Netherlands, the first plans for a railroad connection to Germany were
considered in the early 1830‟s. Primarily intended for transport of goods, it was supposed to
connect Amsterdam with Cologne.13
The plans were aborted however, and the first railroad
connecting the Netherlands with Germany would be the Maastricht-to-Aachen railroad, opened
in 1853.14
Far more significant was the establishment three years later of a railroad between
Arnhem and Oberhausen.15
However, while railroad traffic within Germany soon exceeded
inland shipping, traffic with the Netherlands remained based on Rhine shipping. For
Rotterdam‟s Belgian competitor Antwerp however, railroads were the main mode of transport
to and from its hinterland. By 1913, Belgium boasted the world‟s highest railroad density,
which connected Antwerp to Germany by three major routes: Antwerp – Löwen – Lüttich –
Aachen – Cologne (opened in 1853 and widely known as the „Iron Rhine‟), Antwerp – Hasselt
– Maastricht – Aachen, and Antwerp – Mönchen Gladbach.16
While the German railroads – originally a multitude of private firms – were soon either
partially or entirely nationalized, thereby keeping internal competition to a minimum, all facets
of Rhine shipping such as ports, ships, etcetera remained in the hands of either private
individuals, firms, or German states. Thus, in contrast to the railroads, the Rhine was open to
fierce competition. Combined with technological improvements, by the 1890s this led to faster
and more efficient inland shipping, which in turn led to Rhine shipping becoming a cheap and
viable alternative to railroad freight as Rhine transport costs dropped 78 percent between 1890
and 1913, whereas the cost of rail transport remained stable, even showing a tendency to rise.17
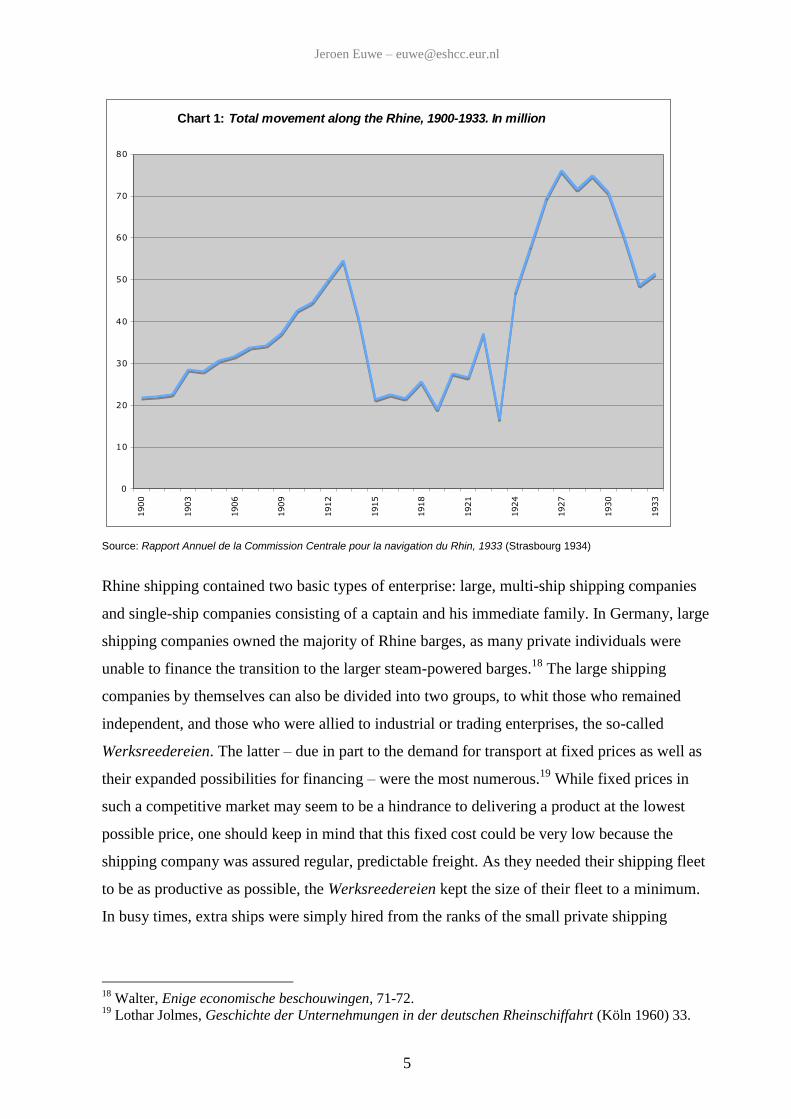
Combined with rapid industrial growth, the result was a fast expanding Rhine traffic (Chart 1).
11
A.F. Napp-Zinn, Binnenschiffahrt und Eisenbahn (Leipzig 1928) 5; J. Walter, Enige economische
beschouwingen over de Rijnscheepvaart (Assen z.j.) 99. 12
Rainer Fremdling,„Per spoor de grens over‟, 47. 13
Idem, 40. 14
Idem, 54. 15
Idem, 41. 16
W. Warsch, Antwerpen, Rotterdam und ein Rhein-Maas-Scheldekanal (Duisburg 1920) 35. 17
Jan-Pieter Smits, Edwin Horlings and Jan Luiten van Zanden, Dutch GNP and its Components,
1800-1913 (Groningen 2000) 146-147; own calculations.
Jeroen Euwe – [email protected]
5
Chart 1: Total movement along the Rhine, 1900-1933. In million
0
10
20
30
40
50
60
70
80
1900
1903
1906
1909
1912
1915
1918
1921
1924
1927
1930
1933
Source: Rapport Annuel de la Commission Centrale pour la navigation du Rhin, 1933 (Strasbourg 1934)
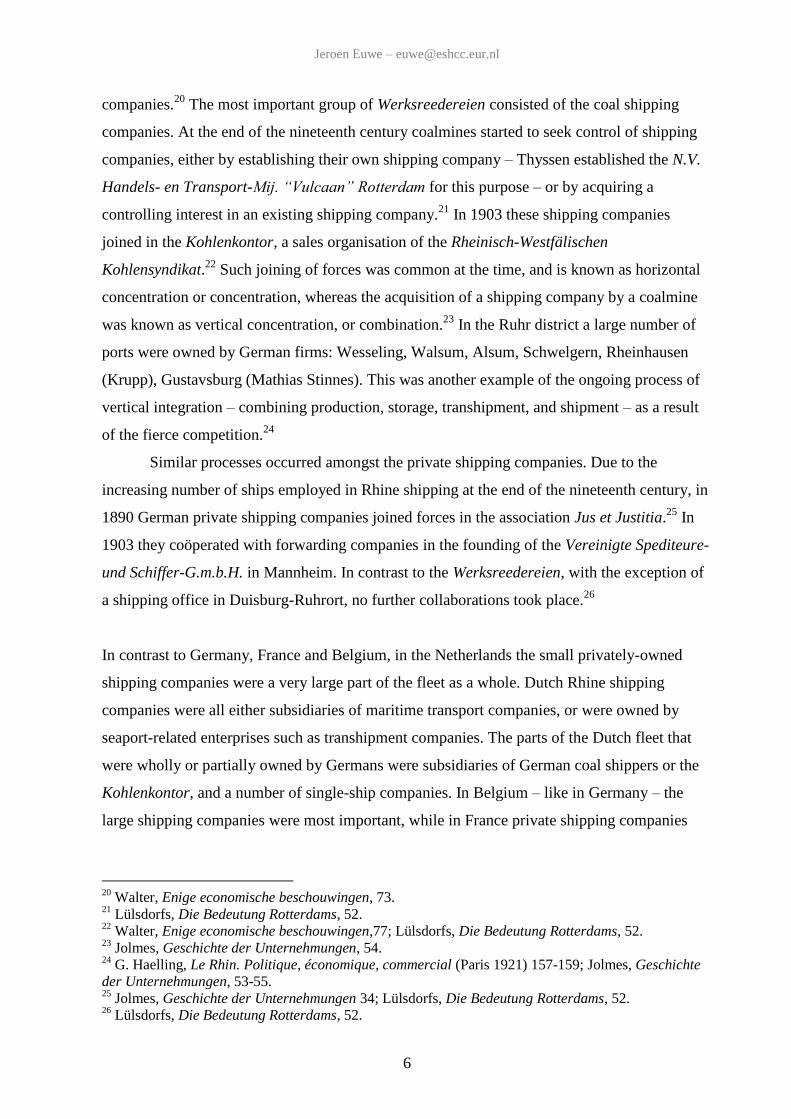
Rhine shipping contained two basic types of enterprise: large, multi-ship shipping companies
and single-ship companies consisting of a captain and his immediate family. In Germany, large
shipping companies owned the majority of Rhine barges, as many private individuals were
unable to finance the transition to the larger steam-powered barges.18
The large shipping
companies by themselves can also be divided into two groups, to whit those who remained
independent, and those who were allied to industrial or trading enterprises, the so-called
Werksreedereien. The latter – due in part to the demand for transport at fixed prices as well as
their expanded possibilities for financing – were the most numerous.19
While fixed prices in
such a competitive market may seem to be a hindrance to delivering a product at the lowest
possible price, one should keep in mind that this fixed cost could be very low because the
shipping company was assured regular, predictable freight. As they needed their shipping fleet
to be as productive as possible, the Werksreedereien kept the size of their fleet to a minimum.
In busy times, extra ships were simply hired from the ranks of the small private shipping
18
Walter, Enige economische beschouwingen, 71-72. 19
Lothar Jolmes, Geschichte der Unternehmungen in der deutschen Rheinschiffahrt (Köln 1960) 33.
Jeroen Euwe – [email protected]
6
companies.20
The most important group of Werksreedereien consisted of the coal shipping
companies. At the end of the nineteenth century coalmines started to seek control of shipping
companies, either by establishing their own shipping company – Thyssen established the N.V.
Handels- en Transport-Mij. “Vulcaan” Rotterdam for this purpose – or by acquiring a
controlling interest in an existing shipping company.21
In 1903 these shipping companies
joined in the Kohlenkontor, a sales organisation of the Rheinisch-Westfälischen
Kohlensyndikat.22
Such joining of forces was common at the time, and is known as horizontal
concentration or concentration, whereas the acquisition of a shipping company by a coalmine
was known as vertical concentration, or combination.23
In the Ruhr district a large number of
ports were owned by German firms: Wesseling, Walsum, Alsum, Schwelgern, Rheinhausen
(Krupp), Gustavsburg (Mathias Stinnes). This was another example of the ongoing process of
vertical integration – combining production, storage, transhipment, and shipment – as a result
of the fierce competition.24
Similar processes occurred amongst the private shipping companies. Due to the
increasing number of ships employed in Rhine shipping at the end of the nineteenth century, in
1890 German private shipping companies joined forces in the association Jus et Justitia.25
In
1903 they coöperated with forwarding companies in the founding of the Vereinigte Spediteure-
und Schiffer-G.m.b.H. in Mannheim. In contrast to the Werksreedereien, with the exception of
a shipping office in Duisburg-Ruhrort, no further collaborations took place.26
In contrast to Germany, France and Belgium, in the Netherlands the small privately-owned
shipping companies were a very large part of the fleet as a whole. Dutch Rhine shipping
companies were all either subsidiaries of maritime transport companies, or were owned by
seaport-related enterprises such as transhipment companies. The parts of the Dutch fleet that
were wholly or partially owned by Germans were subsidiaries of German coal shippers or the
Kohlenkontor, and a number of single-ship companies. In Belgium – like in Germany – the
large shipping companies were most important, while in France private shipping companies
20
Walter, Enige economische beschouwingen, 73. 21
Lülsdorfs, Die Bedeutung Rotterdams, 52. 22
Walter, Enige economische beschouwingen,77; Lülsdorfs, Die Bedeutung Rotterdams, 52. 23
Jolmes, Geschichte der Unternehmungen, 54. 24
G. Haelling, Le Rhin. Politique, économique, commercial (Paris 1921) 157-159; Jolmes, Geschichte
der Unternehmungen, 53-55. 25
Jolmes, Geschichte der Unternehmungen 34; Lülsdorfs, Die Bedeutung Rotterdams, 52. 26
Lülsdorfs, Die Bedeutung Rotterdams, 52.
Jeroen Euwe – [email protected]
7
were virtually non-existent.27
Until after the war, France had not been active in Rhine shipping.
As part of the reparations payments however, it received a large number of different type
Rhine barges and tugboats. From its total available tonnage of 2.2 million tons, Germany had
to surrender a total tonnage of about 360.000 tons to the French. From the available tugboats,
almost 14% had to be handed over. The ships were divided over six newly founded shipping
companies that were strictly coordinated by the French state.28
The Rhine barges from these
four countries were the most active in Rhine shipping, and where almost exclusively used for
transporting bulk goods: only about 3% of Rhine traffic consisted of merchandise.29
Traffic of goods within Germany
Briefly described, Germany had four major centres for the transport of goods: the Ruhr area –
parts of Westfalia and the Rhine province, from Rheinhausen to Walsum – and Mannheim
along the Rhine, the ports on the North Sea – primarily Hamburg, to a lesser extent Bremen
and Emden – and greater Berlin. The North Sea ports of Bremen and Emden handled goods
from mostly the Ruhr area and southern Germany, while Hamburg also handled goods from
eastern Germany by way of Berlin.30
Already before the war, railroads were the predominant
mode of transport for both mixed goods as well as bulk goods. Both in rail transport and inland
shipping coal was most important, followed by building materials such as soil, bricks, stone,
and cement. Nevertheless, there were some notable differences. Inland shipping was geared
more toward transporting ores, while iron and steel showed a tendency towards transportation
by rail.31
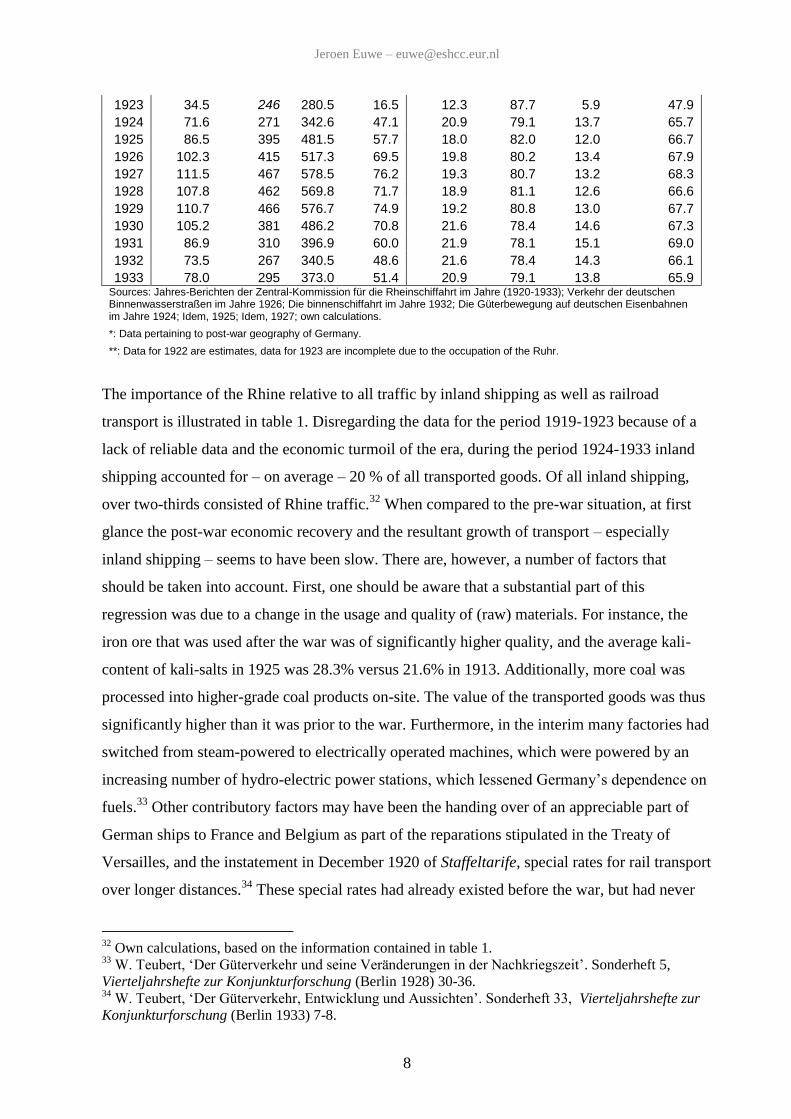
Table 1: Total transport of goods in Germany by rail and inland shipping, compared to Rhine traffic, 1913, 1919-1933 Year
Inland shipping
Railways**
Total traffic
Rhine shipping
Inland shipping Railways
Rhine shipping
Rhine traffic as a percentage of inland shipping
in million tons in percentages of total traffic
1913* 97.0 445 542.0 54.6 17.9 82.1 10.1 56.2
1919 n.a. n.a. n.a. 19.0 n.a n.a n.a. n.a.
1920 44.7 337 381.7 27.7 11.7 88.3 7.2 61.9
1921 42.1 n.a. n.a. 26.7 n.a n.a. n.a. 63.5
1922 59.3 405 464.3 37.2 12.8 87.2 8.0 62.7
27
Walter, Enige economische beschouwingen, 74, 80 28
Jolmes, Geschichte der Unternehmungen, 79-80 29
Walter, Enige economische beschouwingen, 118. 30
E. Tiessen, Seehafenverkehr und Binnenschiffahrt im Deutschen Reich, 1913 und 1922 (Berlin 1925) 31
Napp-Zinn, Binnenschiffahrt und Eisenbahn, 33 (table “Mengenleistung von Eisenbahn und
Binnenschiffahrt nach Gütergattungen” for 1913 and 1925), 34.
Jeroen Euwe – [email protected]
8
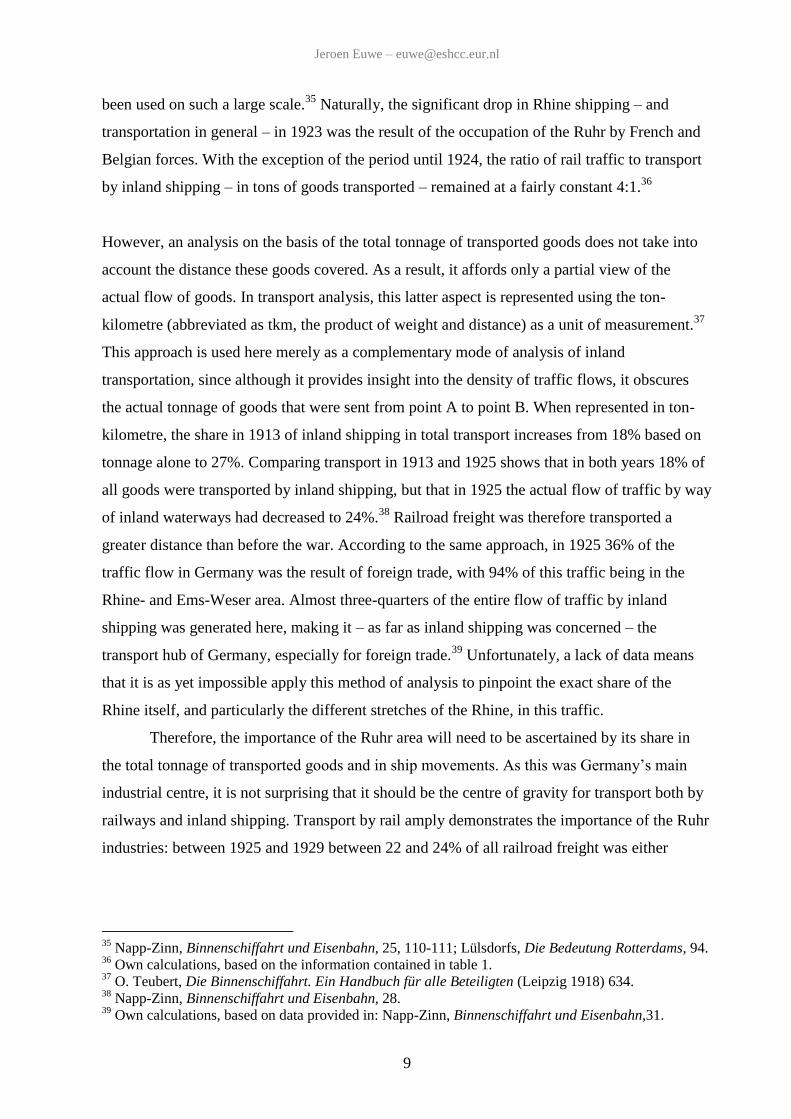
1923 34.5 246 280.5 16.5 12.3 87.7 5.9 47.9
1924 71.6 271 342.6 47.1 20.9 79.1 13.7 65.7
1925 86.5 395 481.5 57.7 18.0 82.0 12.0 66.7
1926 102.3 415 517.3 69.5 19.8 80.2 13.4 67.9
1927 111.5 467 578.5 76.2 19.3 80.7 13.2 68.3
1928 107.8 462 569.8 71.7 18.9 81.1 12.6 66.6
1929 110.7 466 576.7 74.9 19.2 80.8 13.0 67.7
1930 105.2 381 486.2 70.8 21.6 78.4 14.6 67.3
1931 86.9 310 396.9 60.0 21.9 78.1 15.1 69.0
1932 73.5 267 340.5 48.6 21.6 78.4 14.3 66.1
1933 78.0 295 373.0 51.4 20.9 79.1 13.8 65.9 Sources: Jahres-Berichten der Zentral-Kommission für die Rheinschiffahrt im Jahre (1920-1933); Verkehr der deutschen Binnenwasserstraßen im Jahre 1926; Die binnenschiffahrt im Jahre 1932; Die Güterbewegung auf deutschen Eisenbahnen im Jahre 1924; Idem, 1925; Idem, 1927; own calculations.
*: Data pertaining to post-war geography of Germany.
**: Data for 1922 are estimates, data for 1923 are incomplete due to the occupation of the Ruhr.
The importance of the Rhine relative to all traffic by inland shipping as well as railroad
transport is illustrated in table 1. Disregarding the data for the period 1919-1923 because of a
lack of reliable data and the economic turmoil of the era, during the period 1924-1933 inland
shipping accounted for – on average – 20 % of all transported goods. Of all inland shipping,
over two-thirds consisted of Rhine traffic.32
When compared to the pre-war situation, at first
glance the post-war economic recovery and the resultant growth of transport – especially
inland shipping – seems to have been slow. There are, however, a number of factors that
should be taken into account. First, one should be aware that a substantial part of this
regression was due to a change in the usage and quality of (raw) materials. For instance, the
iron ore that was used after the war was of significantly higher quality, and the average kali-
content of kali-salts in 1925 was 28.3% versus 21.6% in 1913. Additionally, more coal was
processed into higher-grade coal products on-site. The value of the transported goods was thus
significantly higher than it was prior to the war. Furthermore, in the interim many factories had
switched from steam-powered to electrically operated machines, which were powered by an
increasing number of hydro-electric power stations, which lessened Germany‟s dependence on
fuels.33
Other contributory factors may have been the handing over of an appreciable part of
German ships to France and Belgium as part of the reparations stipulated in the Treaty of
Versailles, and the instatement in December 1920 of Staffeltarife, special rates for rail transport
over longer distances.34
These special rates had already existed before the war, but had never
32
Own calculations, based on the information contained in table 1. 33
W. Teubert, „Der Güterverkehr und seine Veränderungen in der Nachkriegszeit‟. Sonderheft 5,
Vierteljahrshefte zur Konjunkturforschung (Berlin 1928) 30-36. 34
W. Teubert, „Der Güterverkehr, Entwicklung und Aussichten‟. Sonderheft 33, Vierteljahrshefte zur
Konjunkturforschung (Berlin 1933) 7-8.
Jeroen Euwe – [email protected]
9
been used on such a large scale.35
Naturally, the significant drop in Rhine shipping – and
transportation in general – in 1923 was the result of the occupation of the Ruhr by French and
Belgian forces. With the exception of the period until 1924, the ratio of rail traffic to transport
by inland shipping – in tons of goods transported – remained at a fairly constant 4:1.36
However, an analysis on the basis of the total tonnage of transported goods does not take into
account the distance these goods covered. As a result, it affords only a partial view of the
actual flow of goods. In transport analysis, this latter aspect is represented using the ton-
kilometre (abbreviated as tkm, the product of weight and distance) as a unit of measurement.37
This approach is used here merely as a complementary mode of analysis of inland
transportation, since although it provides insight into the density of traffic flows, it obscures
the actual tonnage of goods that were sent from point A to point B. When represented in ton-
kilometre, the share in 1913 of inland shipping in total transport increases from 18% based on
tonnage alone to 27%. Comparing transport in 1913 and 1925 shows that in both years 18% of
all goods were transported by inland shipping, but that in 1925 the actual flow of traffic by way
of inland waterways had decreased to 24%.38
Railroad freight was therefore transported a
greater distance than before the war. According to the same approach, in 1925 36% of the
traffic flow in Germany was the result of foreign trade, with 94% of this traffic being in the
Rhine- and Ems-Weser area. Almost three-quarters of the entire flow of traffic by inland
shipping was generated here, making it – as far as inland shipping was concerned – the
transport hub of Germany, especially for foreign trade.39
Unfortunately, a lack of data means
that it is as yet impossible apply this method of analysis to pinpoint the exact share of the
Rhine itself, and particularly the different stretches of the Rhine, in this traffic.
Therefore, the importance of the Ruhr area will need to be ascertained by its share in
the total tonnage of transported goods and in ship movements. As this was Germany‟s main
industrial centre, it is not surprising that it should be the centre of gravity for transport both by
railways and inland shipping. Transport by rail amply demonstrates the importance of the Ruhr
industries: between 1925 and 1929 between 22 and 24% of all railroad freight was either
35
Napp-Zinn, Binnenschiffahrt und Eisenbahn, 25, 110-111; Lülsdorfs, Die Bedeutung Rotterdams, 94. 36
Own calculations, based on the information contained in table 1. 37
O. Teubert, Die Binnenschiffahrt. Ein Handbuch für alle Beteiligten (Leipzig 1918) 634. 38
Napp-Zinn, Binnenschiffahrt und Eisenbahn, 28. 39
Own calculations, based on data provided in: Napp-Zinn, Binnenschiffahrt und Eisenbahn,31.
Jeroen Euwe – [email protected]
10
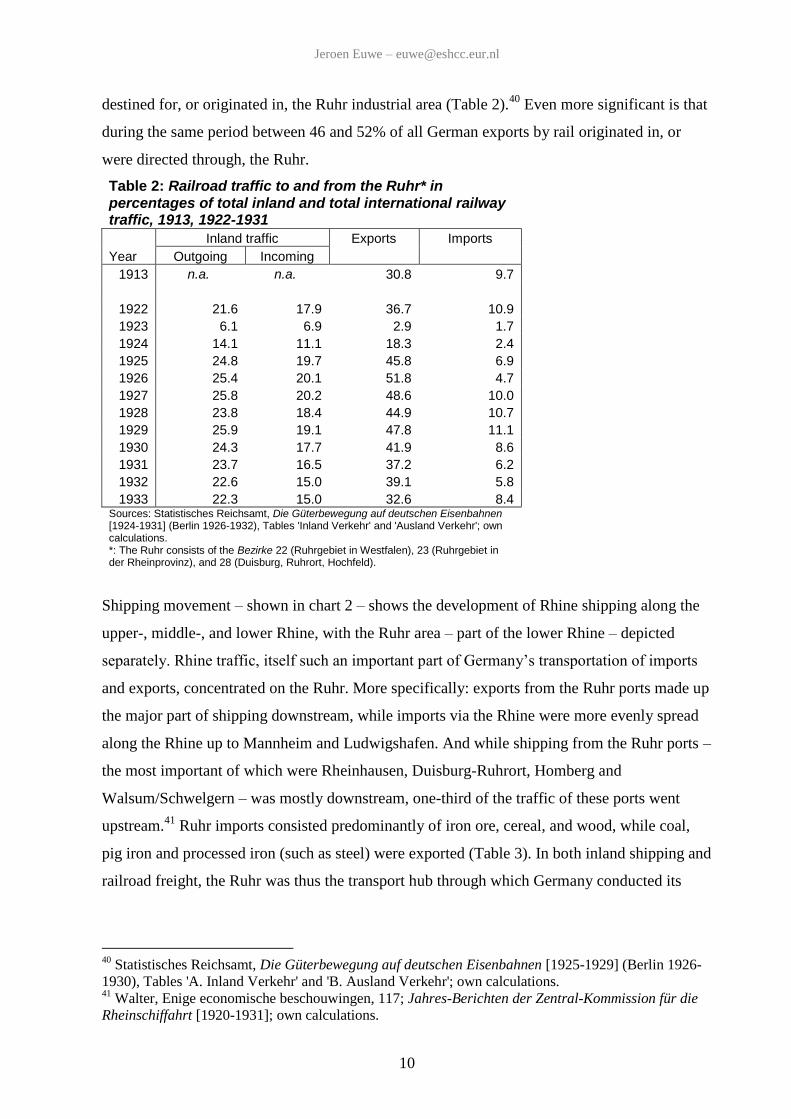
destined for, or originated in, the Ruhr industrial area (Table 2).40
Even more significant is that
during the same period between 46 and 52% of all German exports by rail originated in, or
were directed through, the Ruhr.
Table 2: Railroad traffic to and from the Ruhr* in percentages of total inland and total international railway traffic, 1913, 1922-1931
Inland traffic Exports Imports
Year Outgoing Incoming
1913 n.a. n.a. 30.8 9.7
1922 21.6 17.9 36.7 10.9
1923 6.1 6.9 2.9 1.7
1924 14.1 11.1 18.3 2.4
1925 24.8 19.7 45.8 6.9
1926 25.4 20.1 51.8 4.7
1927 25.8 20.2 48.6 10.0
1928 23.8 18.4 44.9 10.7
1929 25.9 19.1 47.8 11.1
1930 24.3 17.7 41.9 8.6
1931 23.7 16.5 37.2 6.2
1932 22.6 15.0 39.1 5.8
1933 22.3 15.0 32.6 8.4 Sources: Statistisches Reichsamt, Die Güterbewegung auf deutschen Eisenbahnen [1924-1931] (Berlin 1926-1932), Tables 'Inland Verkehr' and 'Ausland Verkehr'; own calculations. *: The Ruhr consists of the Bezirke 22 (Ruhrgebiet in Westfalen), 23 (Ruhrgebiet in der Rheinprovinz), and 28 (Duisburg, Ruhrort, Hochfeld).
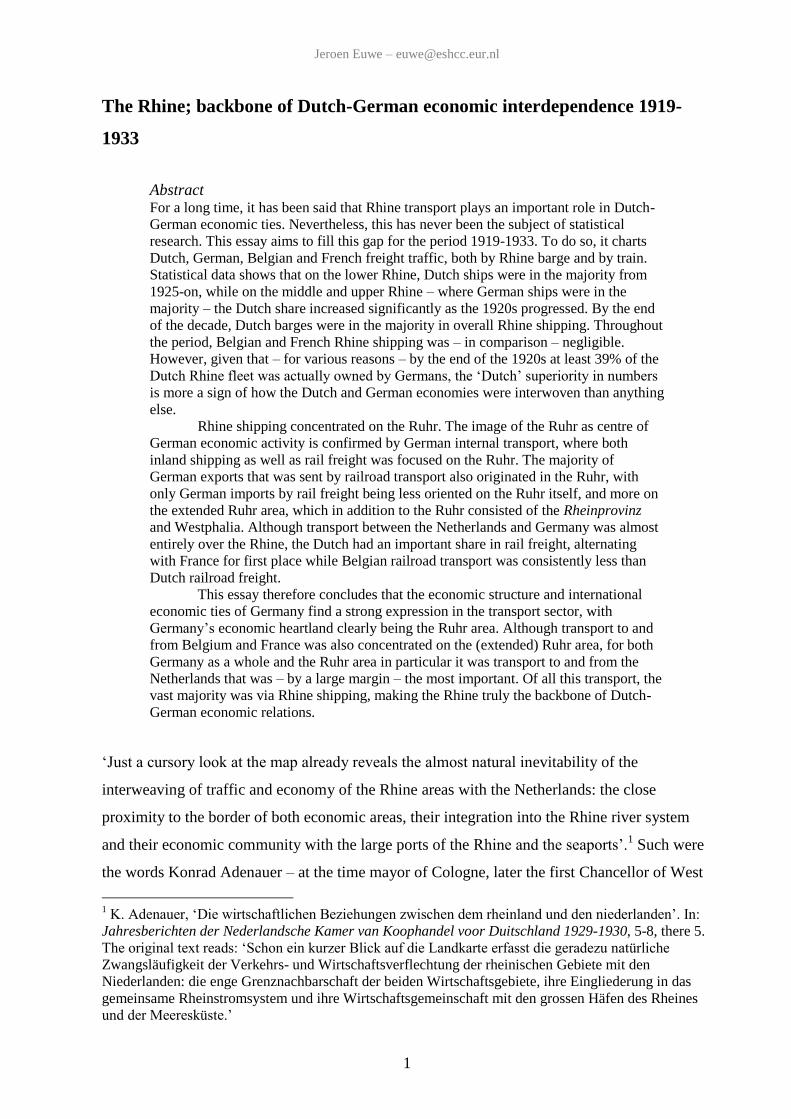
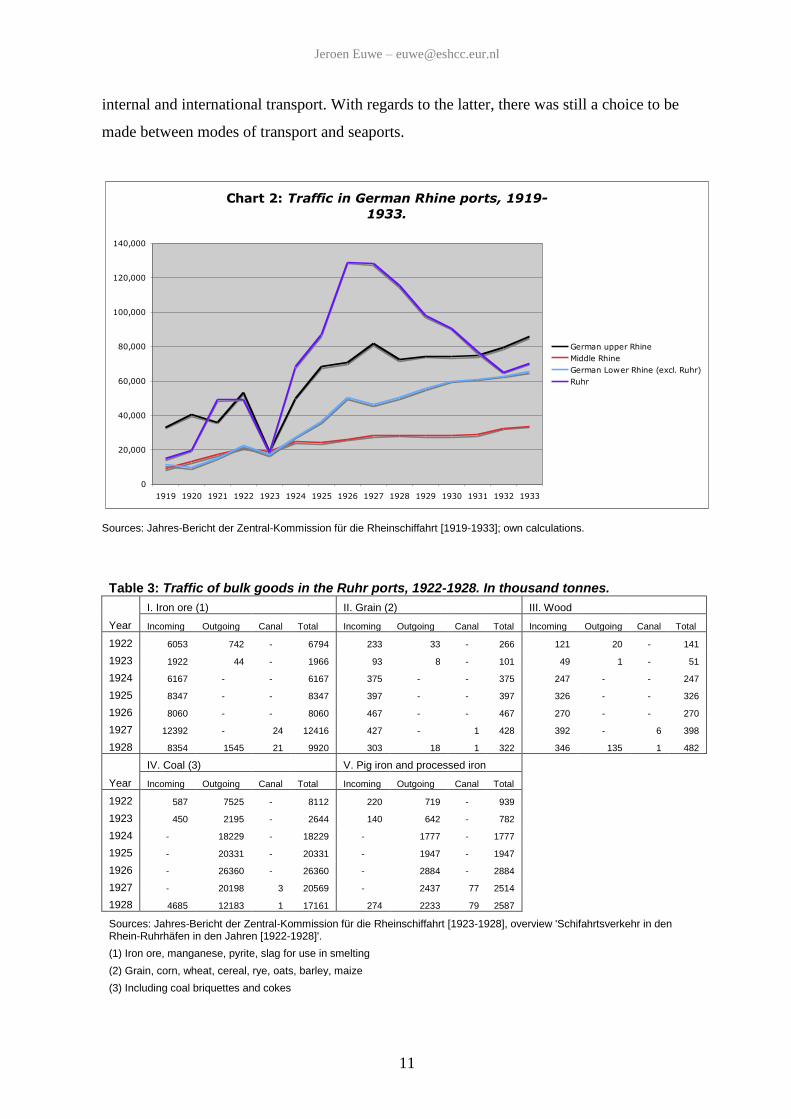
Shipping movement – shown in chart 2 – shows the development of Rhine shipping along the
upper-, middle-, and lower Rhine, with the Ruhr area – part of the lower Rhine – depicted
separately. Rhine traffic, itself such an important part of Germany‟s transportation of imports
and exports, concentrated on the Ruhr. More specifically: exports from the Ruhr ports made up
the major part of shipping downstream, while imports via the Rhine were more evenly spread
along the Rhine up to Mannheim and Ludwigshafen. And while shipping from the Ruhr ports –
the most important of which were Rheinhausen, Duisburg-Ruhrort, Homberg and
Walsum/Schwelgern – was mostly downstream, one-third of the traffic of these ports went
upstream.41
Ruhr imports consisted predominantly of iron ore, cereal, and wood, while coal,
pig iron and processed iron (such as steel) were exported (Table 3). In both inland shipping and
railroad freight, the Ruhr was thus the transport hub through which Germany conducted its
40
Statistisches Reichsamt, Die Güterbewegung auf deutschen Eisenbahnen [1925-1929] (Berlin 1926-
1930), Tables 'A. Inland Verkehr' and 'B. Ausland Verkehr'; own calculations. 41
Walter, Enige economische beschouwingen, 117; Jahres-Berichten der Zentral-Kommission für die
Rheinschiffahrt [1920-1931]; own calculations.
Jeroen Euwe – [email protected]
11
internal and international transport. With regards to the latter, there was still a choice to be
made between modes of transport and seaports.
Chart 2: Traffic in German Rhine ports, 1919-
1933.
0
20,000
40,000
60,000
80,000
100,000
120,000
140,000
1919 1920 1921 1922 1923 1924 1925 1926 1927 1928 1929 1930 1931 1932 1933
German upper Rhine
Middle Rhine
German Lower Rhine (excl. Ruhr)
Ruhr
Sources: Jahres-Bericht der Zentral-Kommission für die Rheinschiffahrt [1919-1933]; own calculations.
Table 3: Traffic of bulk goods in the Ruhr ports, 1922-1928. In thousand tonnes.
I. Iron ore (1) II. Grain (2) III. Wood
Year Incoming Outgoing Canal Total Incoming Outgoing Canal Total Incoming Outgoing Canal Total
1922 6053 742 - 6794 233 33 - 266 121 20 - 141
1923 1922 44 - 1966 93 8 - 101 49 1 - 51
1924 6167 - - 6167 375 - - 375 247 - - 247
1925 8347 - - 8347 397 - - 397 326 - - 326
1926 8060 - - 8060 467 - - 467 270 - - 270
1927 12392 - 24 12416 427 - 1 428 392 - 6 398
1928 8354 1545 21 9920 303 18 1 322 346 135 1 482
IV. Coal (3) V. Pig iron and processed iron
Year Incoming Outgoing Canal Total Incoming Outgoing Canal Total
1922 587 7525 - 8112 220 719 - 939
1923 450 2195 - 2644 140 642 - 782
1924 - 18229 - 18229 - 1777 - 1777
1925 - 20331 - 20331 - 1947 - 1947
1926 - 26360 - 26360 - 2884 - 2884
1927 - 20198 3 20569 - 2437 77 2514
1928 4685 12183 1 17161 274 2233 79 2587
Sources: Jahres-Bericht der Zentral-Kommission für die Rheinschiffahrt [1923-1928], overview 'Schifahrtsverkehr in den Rhein-Ruhrhäfen in den Jahren [1922-1928]'.
(1) Iron ore, manganese, pyrite, slag for use in smelting
(2) Grain, corn, wheat, cereal, rye, oats, barley, maize
(3) Including coal briquettes and cokes
Jeroen Euwe – [email protected]
12
Traffic of goods within the Netherlands
„In spite of the fact that in the Netherlands transportation by waterway is one of the most
important means of transport, until now little is known on the subject‟ admitted the Dutch
Centraal Bureau voor de Statistiek in 1933.42
In contrast to the detail with which the German
Statistisches Reichsamt recorded and published the movement of goods throughout Germany
as well as its imports, exports and transit traffic, its Dutch counterpart published far less
detailed records. As a result, so far it has proven to be impossible to assess the total volume of
transport by all modes of transport in the Netherlands. However, ton-kilometric data for the
flow of inland shipping in the Netherlands and its provinces do exist, albeit only for the period
1912-1913 and 1917-1924.43
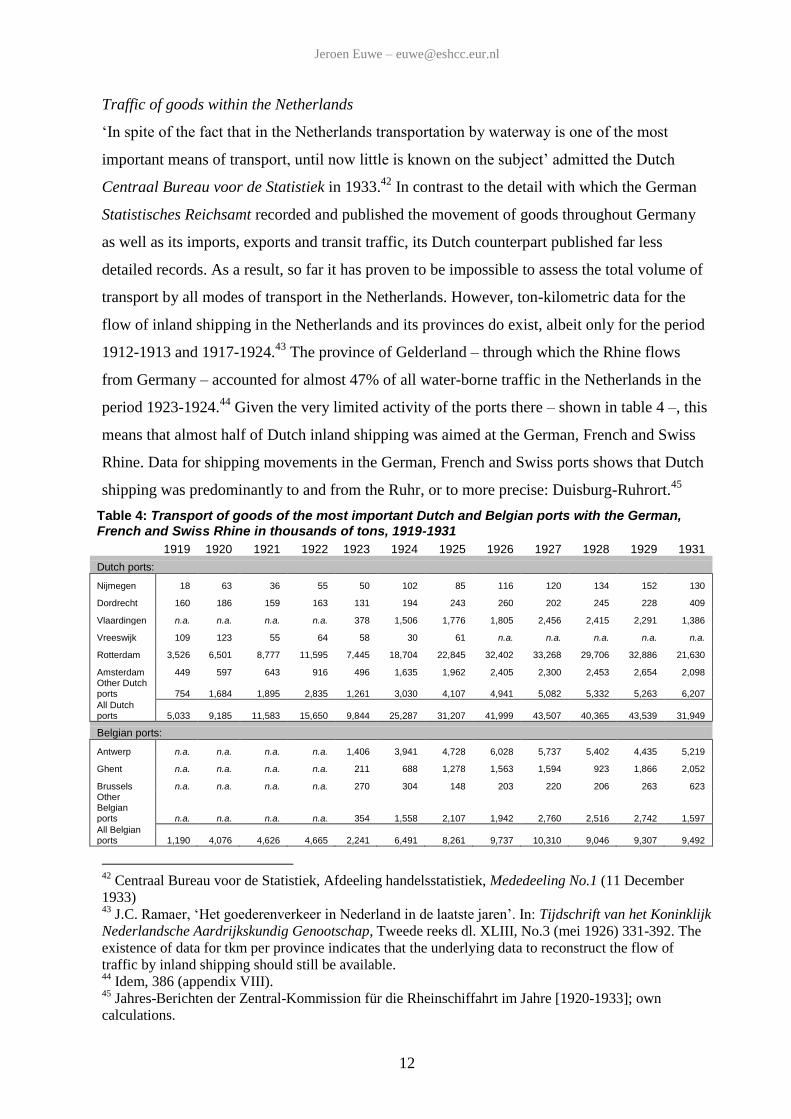
The province of Gelderland – through which the Rhine flows
from Germany – accounted for almost 47% of all water-borne traffic in the Netherlands in the
period 1923-1924.44
Given the very limited activity of the ports there – shown in table 4 –, this
means that almost half of Dutch inland shipping was aimed at the German, French and Swiss
Rhine. Data for shipping movements in the German, French and Swiss ports shows that Dutch
shipping was predominantly to and from the Ruhr, or to more precise: Duisburg-Ruhrort.45
Table 4: Transport of goods of the most important Dutch and Belgian ports with the German, French and Swiss Rhine in thousands of tons, 1919-1931
1919 1920 1921 1922 1923 1924 1925 1926 1927 1928 1929 1931
Dutch ports:
Nijmegen 18 63 36 55 50 102 85 116 120 134 152 130
Dordrecht 160 186 159 163 131 194 243 260 202 245 228 409
Vlaardingen n.a. n.a. n.a. n.a. 378 1,506 1,776 1,805 2,456 2,415 2,291 1,386
Vreeswijk 109 123 55 64 58 30 61 n.a. n.a. n.a. n.a. n.a.
Rotterdam 3,526 6,501 8,777 11,595 7,445 18,704 22,845 32,402 33,268 29,706 32,886 21,630
Amsterdam 449 597 643 916 496 1,635 1,962 2,405 2,300 2,453 2,654 2,098 Other Dutch ports 754 1,684 1,895 2,835 1,261 3,030 4,107 4,941 5,082 5,332 5,263 6,207
All Dutch ports 5,033 9,185 11,583 15,650 9,844 25,287 31,207 41,999 43,507 40,365 43,539 31,949
Belgian ports:
Antwerp n.a. n.a. n.a. n.a. 1,406 3,941 4,728 6,028 5,737 5,402 4,435 5,219
Ghent n.a. n.a. n.a. n.a. 211 688 1,278 1,563 1,594 923 1,866 2,052
Brussels n.a. n.a. n.a. n.a. 270 304 148 203 220 206 263 623 Other Belgian ports n.a. n.a. n.a. n.a. 354 1,558 2,107 1,942 2,760 2,516 2,742 1,597
All Belgian ports 1,190 4,076 4,626 4,665 2,241 6,491 8,261 9,737 10,310 9,046 9,307 9,492
42
Centraal Bureau voor de Statistiek, Afdeeling handelsstatistiek, Mededeeling No.1 (11 December
1933) 43
J.C. Ramaer, „Het goederenverkeer in Nederland in de laatste jaren‟. In: Tijdschrift van het Koninklijk
Nederlandsche Aardrijkskundig Genootschap, Tweede reeks dl. XLIII, No.3 (mei 1926) 331-392. The
existence of data for tkm per province indicates that the underlying data to reconstruct the flow of
traffic by inland shipping should still be available. 44
Idem, 386 (appendix VIII). 45
Jahres-Berichten der Zentral-Kommission für die Rheinschiffahrt im Jahre [1920-1933]; own
calculations.
Jeroen Euwe – [email protected]
13
Sources: Jahres-Bericht der Zentral-Kommission für die Rheinschiffahrt [1919-1931], "IIa. Übersicht des Gesamthafenverkehrs im Jahr 1920, 2. Verkehr in den niederländischen und belgischen Häfen von und nach dem deutschen Rhein"; own calculations.
Most of this traffic was mass freight – mostly coal and ores, but also raw materials for e.g. the
chemical industry, and the paper industry46
– for which the port of Rotterdam handled most of
the transhipment, with Amsterdam a distant second (Table 4). Amsterdam was mostly
important in the transhipment of merchandise.47
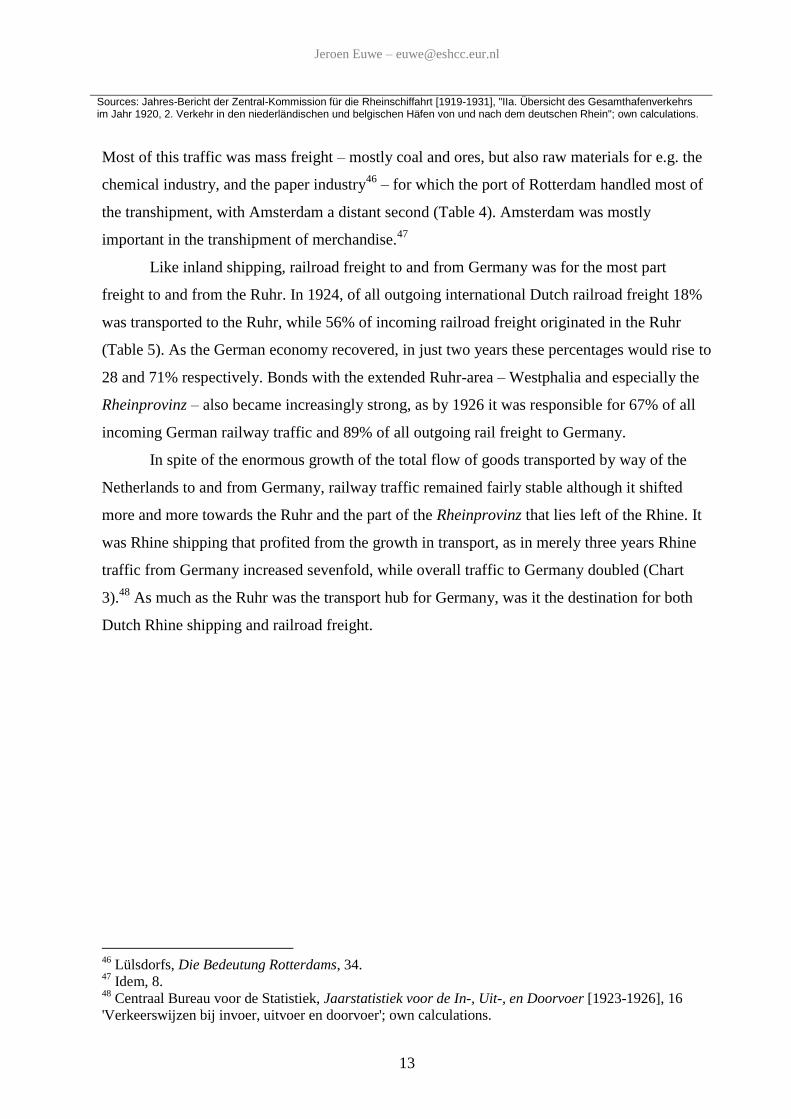
Like inland shipping, railroad freight to and from Germany was for the most part
freight to and from the Ruhr. In 1924, of all outgoing international Dutch railroad freight 18%
was transported to the Ruhr, while 56% of incoming railroad freight originated in the Ruhr
(Table 5). As the German economy recovered, in just two years these percentages would rise to
28 and 71% respectively. Bonds with the extended Ruhr-area – Westphalia and especially the
Rheinprovinz – also became increasingly strong, as by 1926 it was responsible for 67% of all
incoming German railway traffic and 89% of all outgoing rail freight to Germany.
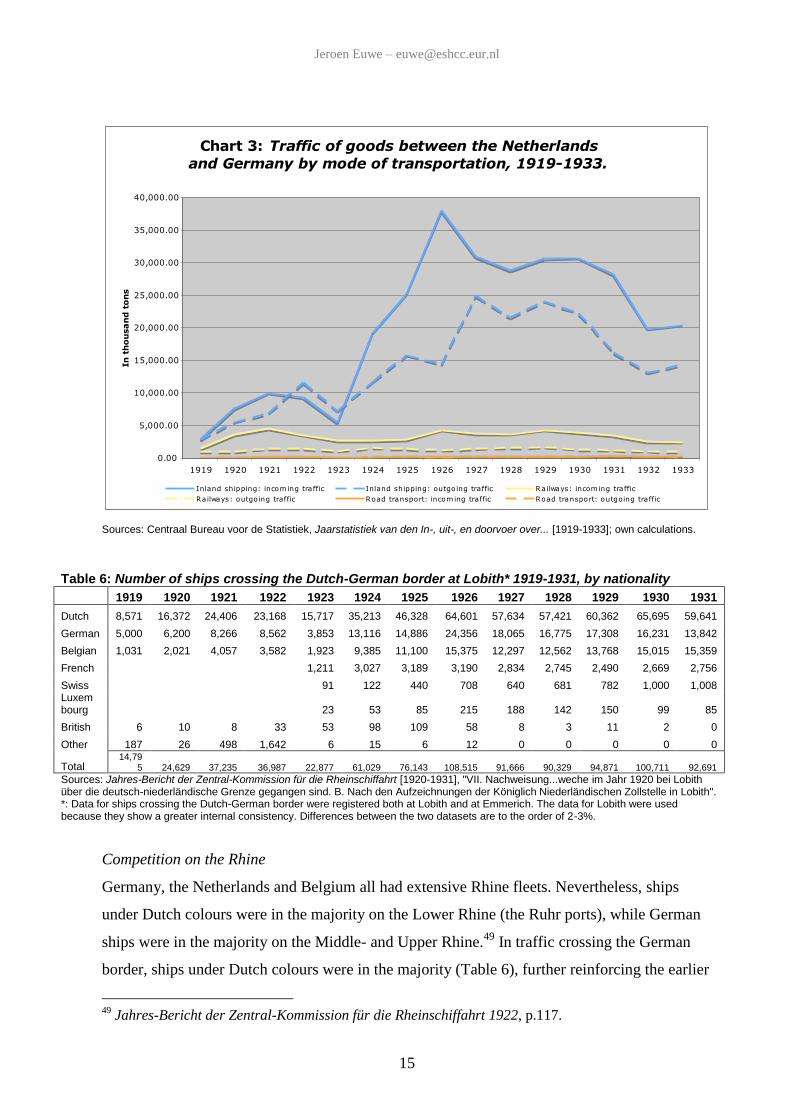
In spite of the enormous growth of the total flow of goods transported by way of the
Netherlands to and from Germany, railway traffic remained fairly stable although it shifted
more and more towards the Ruhr and the part of the Rheinprovinz that lies left of the Rhine. It
was Rhine shipping that profited from the growth in transport, as in merely three years Rhine
traffic from Germany increased sevenfold, while overall traffic to Germany doubled (Chart
3).48
As much as the Ruhr was the transport hub for Germany, was it the destination for both
Dutch Rhine shipping and railroad freight.
46
Lülsdorfs, Die Bedeutung Rotterdams, 34. 47
Idem, 8. 48
Centraal Bureau voor de Statistiek, Jaarstatistiek voor de In-, Uit-, en Doorvoer [1923-1926], 16
'Verkeerswijzen bij invoer, uitvoer en doorvoer'; own calculations.
Jeroen Euwe – [email protected]
14
Table 5: Rail transport of goods from the Netherlands to and from Germany, 1922-1927. In percentages per destination.
1922* 1923* 1924* 1925 1926 1927
Destination German imports
German exports I E I E I E I E I O
Provinz Ostpreussen (ohne Häfen) 0.6
Provinz Pommern (ohne Häfen) 0.1 0.1 0.7
Elbhäfen 0.1 0.6 0.5 1.1 2.0 0.2 0.7 0.2 2.0 0.1 2.5 0.2
Weserhäfen 0.1 0.7 0.9 0.4 0.6 0.4 0.9 0.7 1.5 1.1
Oldenburg, Reg.-Bez. Lüneburg, Stade usw. 8.0 7.7 15.8 17.6 17.9 2.0 10.5 1.3 10.1 0.4 4.3 0.5
Reg.Bez.Hannover und Hildesheim; Braunschweig usw. 3.1 4.1 1.2 1.8 1.5 0.8 1.4 1.2
Berlin: inneres Stadtgebiet 0.6 0.8 1.7 1.7 4.4 0.7 0.9 0.8 4.8 0.2 4.2 0.2 Provinz Brandenburg 0.1 0.2 1.3 0.4 0.2 0.6 0.2 0.4 0.2 0.3 Reg.-Bez.Magdeburg und Anhalt 0.5 0.3 0.7 1.6 1.2 0.4 0.4 0.5 0.3 0.6 0.6
Reg.-Bez.Merseburg und Erfurt usw. 0.2 2.9 0.5 12.0 1.3 3.0 0.5 2.4 0.7 2.1 0.6 2.2
Thüringen usw. 0.5 1.1 0.2 0.9 0.2 0.8 0.2 1.4
Land Sachsen (ohne Leipzig und Umgebung) 1.0 1.9 1.9 5.5 0.2 3.3 0.2 1.1 1.6 0.7 1.6 0.6
Leipzig und Umgebung 0.1 0.5 0.4 0.6 0.5 0.3 1.2 0.2 1.5 0.1
Provinz Hessen-Nassau, Oberhessen usw. 2.0 5.8 3.1 4.5 3.1 4.8 0.7 3.5 1.8 1.9 2.2 2.0
Frankfurt (Main) und Umgebung 0.4 0.3
Ruhrgebiet (Westfalen) 0.6 30.0 5.5 3.2 9.3 30.5 9.8 31.6 10.7 40.9 10.6 31.0
Ruhrgebiet (Rheinprovinz) 2.9 4.0 1.9 4.6 8.0 24.2 14.9 31.0 15.1 29.3 14.5 37.1
Provinz Westfalen (ohne Ruhrgebiet), Lippe usw. 1.6 5.0 29.0 25.0 15.9 8.5 4.6 5.7 3.9 8.6 4.1 8.1
Rheinprovinz rechts des Rheins 3.4 8.2 10.1 7.5 8.4 3.9 2.9 2.5 4.0 1.9 4.2 1.6
Rheinprovinz links des Rheins 59.2 22.6 5.8 1.0 13.5 4.6 40.7 9.5 30.9 7.4 29.7 8.0
Duisburg, Ruhrort, Hochfeld 1.2 1.7 0.4 0.8 2.5 1.0 2.3 0.8 1.9 1.7 Bayerische Pfalz (ohne Ludwigshafen) 0.2 0.1 0.4 0.3 0.1 0.2 0.2 0.3
Baden 10.7 2.4 8.9 2.1 1.8 0.3 2.7 0.2 2.4 0.1 6.7 0.2
Württemberg und Hohenzollern 1.3 0.6 4.3 2.0 0.9 0.2 0.4 0.2 0.2 0.5 0.3
Südbayern 3.0 0.8 3.6 2.4 1.8 1.0 0.7 0.8 1.4 0.3 2.0 0.2
Nordbayern 0.4 0.7 1.2 1.5 1.5 1.1 0.9 0.6 0.7 0.5 1.9 0.5
Other areas 3.0 2.5 5.5 6.5 4.0 2.2 2.6 1.1 2.8 1.2 2.8 0.8
Total 100 100 100 100 100 100 100 100 100 100 100 100
Sources: Statistisches Reichsamt, Die Güterbewegung auf deutschen Eisenbahnen 1925, 17-18, Übersicht 13, Wechselverkehr wichtigerer Auslandbezirke mit inländischen Verkehrsbezirken in den Jahren 1922, 1924 und 1925; Idem 1927, Übersicht 7, Wechselverkehr des Saargebiets und wichtigerer Auslandbezirke mit inländischen Verkehrsbezirken in den Jahren 1926 und 1927; own calculations.
*: Incomplete data.
Areas in grey: combined data
Jeroen Euwe – [email protected]
15
Chart 3: Traffic of goods between the Netherlands
and Germany by mode of transportation, 1919-1933.
0.00
5,000.00
10,000.00
15,000.00
20,000.00
25,000.00
30,000.00
35,000.00
40,000.00
1919 1920 1921 1922 1923 1924 1925 1926 1927 1928 1929 1930 1931 1932 1933
In
th
ou
sa
nd
to
ns
Inland shipping: incoming traffic Inland shipping: outgoing traffic Railways: incoming traffic
Railways: outgoing traffic Road transport: incoming traffic Road transport: outgoing traffic
Sources: Centraal Bureau voor de Statistiek, Jaarstatistiek van den In-, uit-, en doorvoer over... [1919-1933]; own calculations.
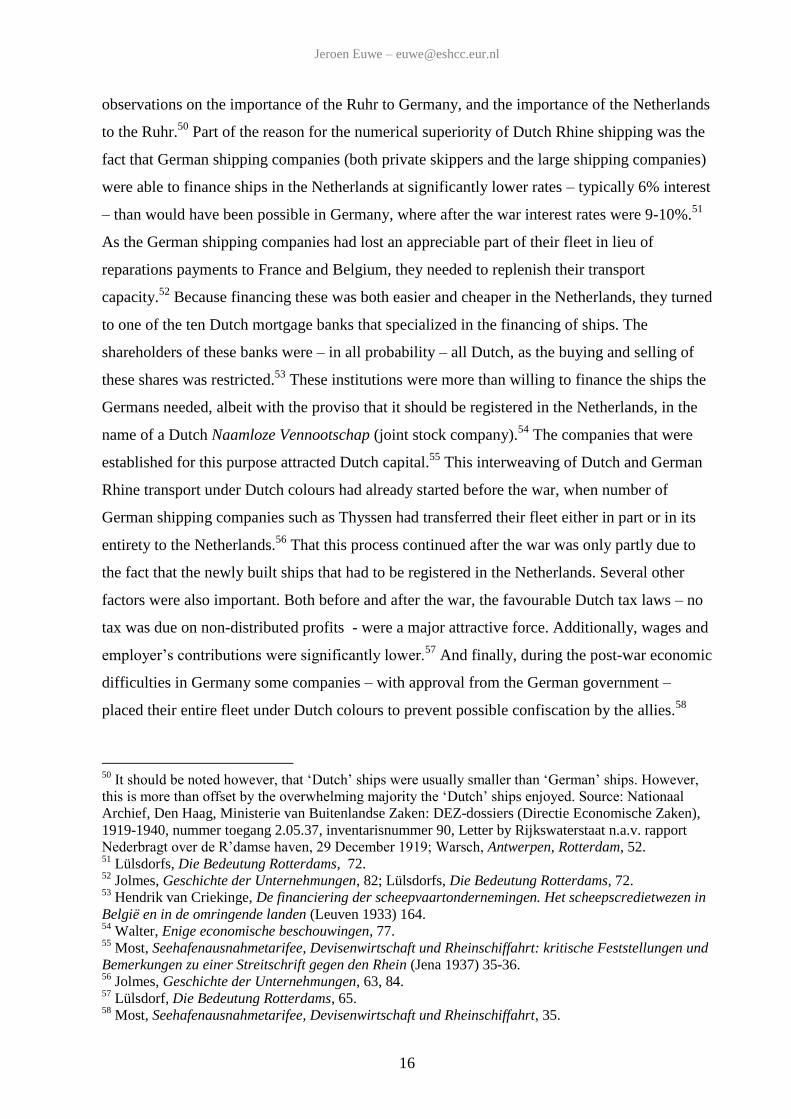
Table 6: Number of ships crossing the Dutch-German border at Lobith* 1919-1931, by nationality
1919 1920 1921 1922 1923 1924 1925 1926 1927 1928 1929 1930 1931
Dutch 8,571 16,372 24,406 23,168 15,717 35,213 46,328 64,601 57,634 57,421 60,362 65,695 59,641
German 5,000 6,200 8,266 8,562 3,853 13,116 14,886 24,356 18,065 16,775 17,308 16,231 13,842
Belgian 1,031 2,021 4,057 3,582 1,923 9,385 11,100 15,375 12,297 12,562 13,768 15,015 15,359
French 1,211 3,027 3,189 3,190 2,834 2,745 2,490 2,669 2,756
Swiss 91 122 440 708 640 681 782 1,000 1,008 Luxem bourg 23 53 85 215 188 142 150 99 85
British 6 10 8 33 53 98 109 58 8 3 11 2 0
Other 187 26 498 1,642 6 15 6 12 0 0 0 0 0
Total 14,79
5 24,629 37,235 36,987 22,877 61,029 76,143 108,515 91,666 90,329 94,871 100,711 92,691
Sources: Jahres-Bericht der Zentral-Kommission für die Rheinschiffahrt [1920-1931], "VII. Nachweisung...weche im Jahr 1920 bei Lobith über die deutsch-niederländische Grenze gegangen sind. B. Nach den Aufzeichnungen der Königlich Niederländischen Zollstelle in Lobith". *: Data for ships crossing the Dutch-German border were registered both at Lobith and at Emmerich. The data for Lobith were used because they show a greater internal consistency. Differences between the two datasets are to the order of 2-3%.
Competition on the Rhine
Germany, the Netherlands and Belgium all had extensive Rhine fleets. Nevertheless, ships
under Dutch colours were in the majority on the Lower Rhine (the Ruhr ports), while German
ships were in the majority on the Middle- and Upper Rhine.49
In traffic crossing the German
border, ships under Dutch colours were in the majority (Table 6), further reinforcing the earlier
49
Jahres-Bericht der Zentral-Kommission für die Rheinschiffahrt 1922, p.117.
Jeroen Euwe – [email protected]
16
observations on the importance of the Ruhr to Germany, and the importance of the Netherlands
to the Ruhr.50
Part of the reason for the numerical superiority of Dutch Rhine shipping was the
fact that German shipping companies (both private skippers and the large shipping companies)
were able to finance ships in the Netherlands at significantly lower rates – typically 6% interest
– than would have been possible in Germany, where after the war interest rates were 9-10%.51
As the German shipping companies had lost an appreciable part of their fleet in lieu of
reparations payments to France and Belgium, they needed to replenish their transport
capacity.52
Because financing these was both easier and cheaper in the Netherlands, they turned
to one of the ten Dutch mortgage banks that specialized in the financing of ships. The
shareholders of these banks were – in all probability – all Dutch, as the buying and selling of
these shares was restricted.53
These institutions were more than willing to finance the ships the
Germans needed, albeit with the proviso that it should be registered in the Netherlands, in the
name of a Dutch Naamloze Vennootschap (joint stock company).54
The companies that were
established for this purpose attracted Dutch capital.55
This interweaving of Dutch and German
Rhine transport under Dutch colours had already started before the war, when number of
German shipping companies such as Thyssen had transferred their fleet either in part or in its
entirety to the Netherlands.56
That this process continued after the war was only partly due to
the fact that the newly built ships that had to be registered in the Netherlands. Several other
factors were also important. Both before and after the war, the favourable Dutch tax laws – no
tax was due on non-distributed profits - were a major attractive force. Additionally, wages and
employer‟s contributions were significantly lower.57
And finally, during the post-war economic
difficulties in Germany some companies – with approval from the German government –
placed their entire fleet under Dutch colours to prevent possible confiscation by the allies.58
50
It should be noted however, that „Dutch‟ ships were usually smaller than „German‟ ships. However,
this is more than offset by the overwhelming majority the „Dutch‟ ships enjoyed. Source: Nationaal
Archief, Den Haag, Ministerie van Buitenlandse Zaken: DEZ-dossiers (Directie Economische Zaken),
1919-1940, nummer toegang 2.05.37, inventarisnummer 90, Letter by Rijkswaterstaat n.a.v. rapport
Nederbragt over de R‟damse haven, 29 December 1919; Warsch, Antwerpen, Rotterdam, 52. 51
Lülsdorfs, Die Bedeutung Rotterdams, 72. 52
Jolmes, Geschichte der Unternehmungen, 82; Lülsdorfs, Die Bedeutung Rotterdams, 72. 53
Hendrik van Criekinge, De financiering der scheepvaartondernemingen. Het scheepscredietwezen in
België en in de omringende landen (Leuven 1933) 164. 54
Walter, Enige economische beschouwingen, 77. 55
Most, Seehafenausnahmetarifee, Devisenwirtschaft und Rheinschiffahrt: kritische Feststellungen und
Bemerkungen zu einer Streitschrift gegen den Rhein (Jena 1937) 35-36. 56
Jolmes, Geschichte der Unternehmungen, 63, 84. 57
Lülsdorf, Die Bedeutung Rotterdams, 65. 58
Most, Seehafenausnahmetarifee, Devisenwirtschaft und Rheinschiffahrt, 35.
Jeroen Euwe – [email protected]
17
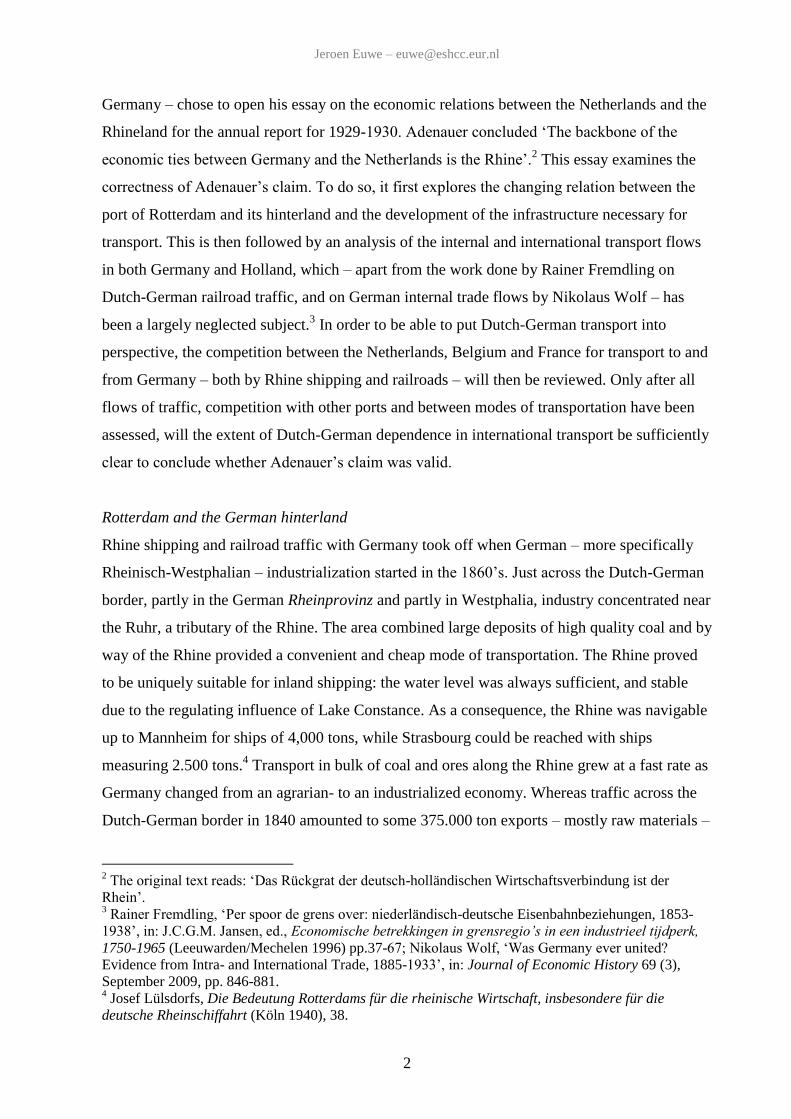
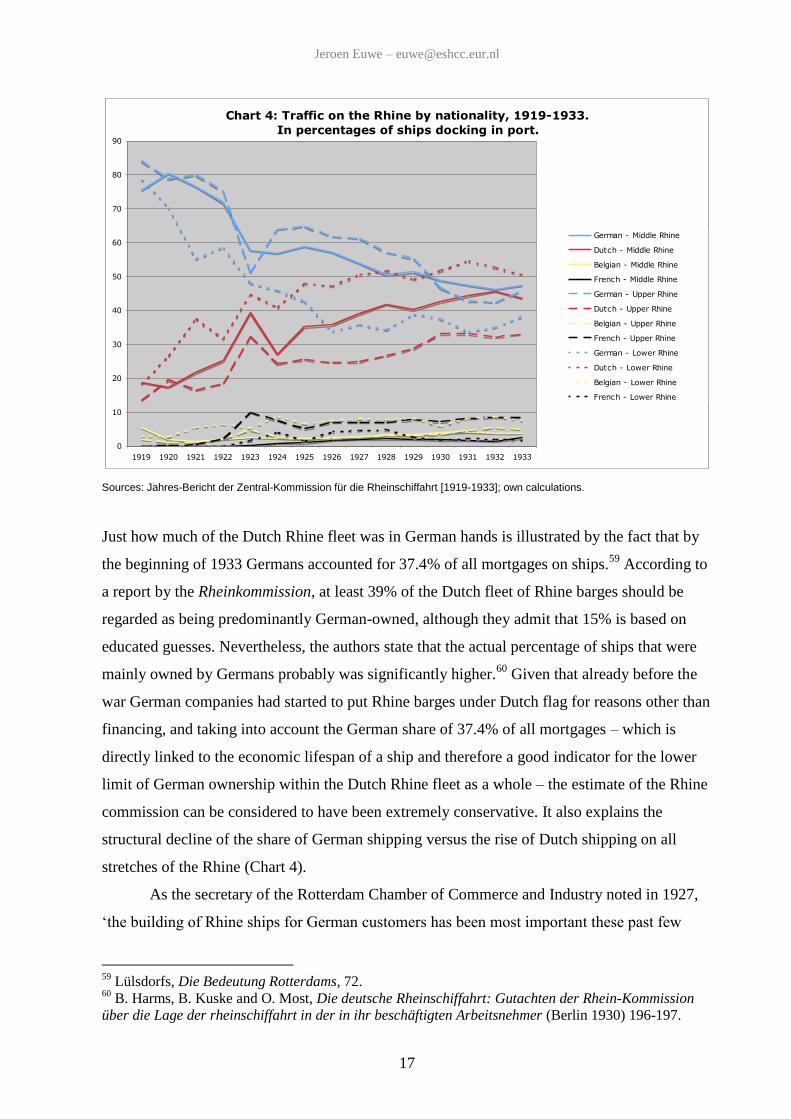
Chart 4: Traffic on the Rhine by nationality, 1919-1933.
In percentages of ships docking in port.
0
10
20
30
40
50
60
70
80
90
1919 1920 1921 1922 1923 1924 1925 1926 1927 1928 1929 1930 1931 1932 1933
German - Middle Rhine
Dutch - Middle Rhine
Belgian - Middle Rhine
French - Middle Rhine
German - Upper Rhine
Dutch - Upper Rhine
Belgian - Upper Rhine
French - Upper Rhine
German - Lower Rhine
Dutch - Lower Rhine
Belgian - Lower Rhine
French - Lower Rhine
Sources: Jahres-Bericht der Zentral-Kommission für die Rheinschiffahrt [1919-1933]; own calculations.
Just how much of the Dutch Rhine fleet was in German hands is illustrated by the fact that by
the beginning of 1933 Germans accounted for 37.4% of all mortgages on ships.59
According to
a report by the Rheinkommission, at least 39% of the Dutch fleet of Rhine barges should be
regarded as being predominantly German-owned, although they admit that 15% is based on
educated guesses. Nevertheless, the authors state that the actual percentage of ships that were
mainly owned by Germans probably was significantly higher.60
Given that already before the
war German companies had started to put Rhine barges under Dutch flag for reasons other than
financing, and taking into account the German share of 37.4% of all mortgages – which is
directly linked to the economic lifespan of a ship and therefore a good indicator for the lower
limit of German ownership within the Dutch Rhine fleet as a whole – the estimate of the Rhine
commission can be considered to have been extremely conservative. It also explains the
structural decline of the share of German shipping versus the rise of Dutch shipping on all
stretches of the Rhine (Chart 4).
As the secretary of the Rotterdam Chamber of Commerce and Industry noted in 1927,
„the building of Rhine ships for German customers has been most important these past few
59
Lülsdorfs, Die Bedeutung Rotterdams, 72. 60
B. Harms, B. Kuske and O. Most, Die deutsche Rheinschiffahrt: Gutachten der Rhein-Kommission
über die Lage der rheinschiffahrt in der in ihr beschäftigten Arbeitsnehmer (Berlin 1930) 196-197.
Jeroen Euwe – [email protected]
18
years, and must undoubtedly be counted amongst the factors that create an economic bond
between the Ruhr and Rotterdam‟.61
Between 1925 and 1931 the Rhine fleet expanded from
circa 5.2 million tons to 7.2 million tons. Because the other Rhine fleets remained stable, most
of this expansion can be attributed to the Dutch Rhine fleet.62
A less desirable side-effect of
this building activity was that the total capacity of the Rhine fleet – where signs of
overcapacity had already been in evidence before the war – grew even larger.63
This resulted in
lower freight prices, and made Rhine shipping one of the least profitable enterprises.64
Nevertheless, the extensive German direct investments in the Dutch Rhine fleet and associated
activities such as port installations – although financed by Dutch banks – contributed greatly to
a Rhine transport system where Dutch and German companies were to a considerable extent
integrated. This in turn no doubt enhanced the ability of Rotterdam to compete with other
ports.
Competition with other ports
The port of Rotterdam was in constant competition with the Belgian port of Antwerp and
Ghent, and the German North Sea ports of Hamburg, Bremen and Emden. Of these ports, the
only significant competition came from Antwerp and Hamburg (Table 7). Representatives in
the competing ports kept the Commissie Concurrentiemogelijkheden of the Rotterdam
Chamber of Commerce informed on developments regarding investments, monthly traffic
statistics, etcetera, while other representatives were actively promoting Rotterdam in potential
growth markets such as Switzerland.65
Antwerp was Belgium‟s most important port, both for seagoing transport as well as
inland shipping. For seagoing traffic, Antwerp was much better located than Rotterdam: thanks
to the extremely wide estuary of the Scheldt, the port was both easy and safe to enter, while
during bad weather ships bound for Rotterdam had to wait for the weather to clear at sea near
61
NL-HaNa, BuZa / Economische Zaken, 2.05.37 inv.nr.2682, Brief door Van Lier, Secretaris
KvK&Fabrieken voor Rotterdam, 6 april 1927. 62
Walter, Enige economische beschouwingen, 83. 63
Jolmes, Geschichte der Unternehmungen, 82. 64
Lülsdorfs, Die Bedeutung Rotterdams, 74. 65
Nationaal Archief, Den Haag, Kamer van Koophandel en Fabrieken voor Rotterdam: Secretariaat,
1922-1969, nummer toegang 3.17.17.04, invoer nummer 2375, miscellaneous letters, reports and
minutes; NL-HaNa, BuZa / Economische Zaken, 2.05.37, inv.nr.90, Letter by the consul in Switzerland
to the Dutch foreign minister, 28 Juli 1920; NL-HaNa, BuZa / Economische Zaken, 2.05.37, inv.nr. 90,
Report on transshipment in Rotterdam and Antwerp, dated 19 October 1920; Idem, Letter to the consul
in Geneva, 24 September 1920.
Jeroen Euwe – [email protected]
19
Hoek van Holland.66
However, its position with regards to the Rhine was less favourable. To
get to the Rhine, ships had to follow the arduous route Westerschelde – Kanaal van Hansweert-
Wemeldinge –Oosterschelde – Keeten – Mastgat – Zijpe – Krammer – Volkerak – Hollands
Diep – Dordtsche Kil – Oude Maas to Dordrecht, where they could enter the tributary Waal of
the Rhine. Locks as well as the tide would often cause traffic-jams along the route.67
In contrast to Rotterdam – which focussed on the transhipment of bulk goods, Antwerp
concentrated on merchandise. Port fees and other costs incurred while in port were much
higher in the transhipment of merchandise than they were in the handling of bulk. In
Rotterdam, costs had always been considerably higher than either Antwerp or Hamburg due to
high wages, as well as high port fees.68
Therefore, a special commission that was tasked with
expanding Rotterdam‟s handling of merchandise – the Stukgoedcommissie – tried to get the
various parties that were levying these fees – the state, the city council, and various private
parties – to lower them. Despite years of effort, the commission never really succeeded.69
In
the transhipment of bulk goods such as grain, ores, or coal, these higher costs were offset by
the superior technical equipment in use in Rotterdam.70
Grain was unloaded more than twice as
fast as in Antwerp, while coal and ores were unloaded at two to three times the speed, with
even higher speeds available if need be.71
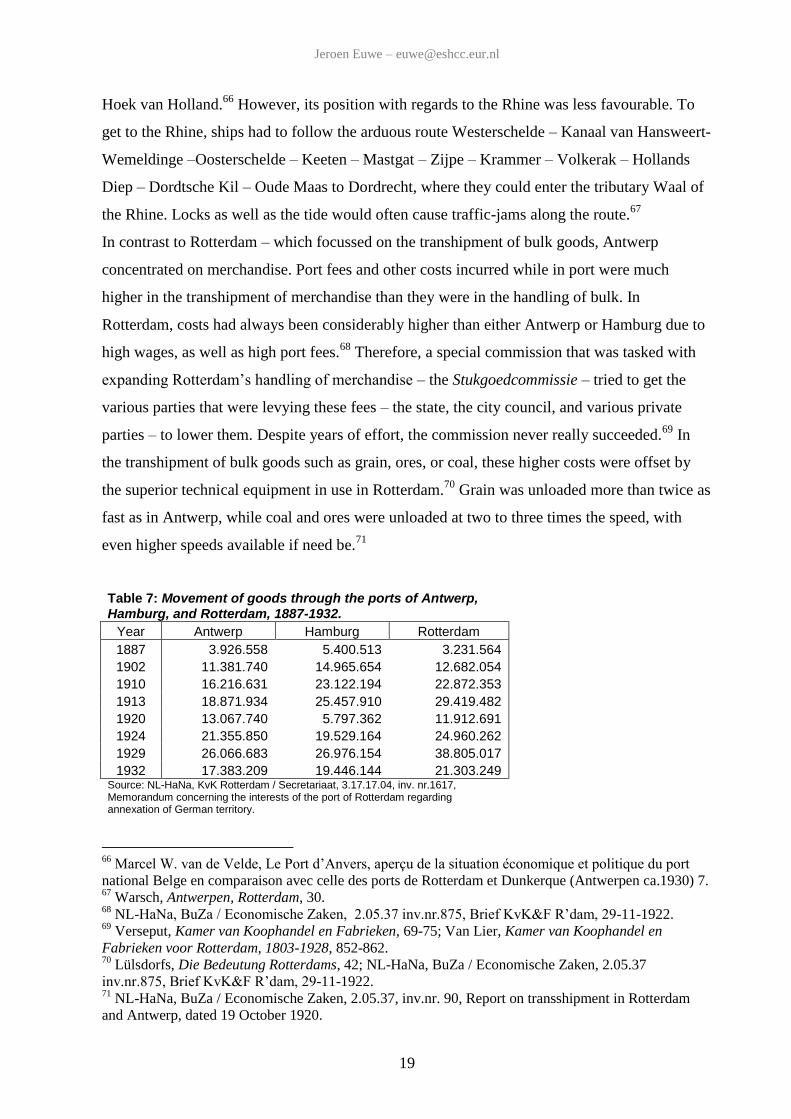
Table 7: Movement of goods through the ports of Antwerp, Hamburg, and Rotterdam, 1887-1932.
Year Antwerp Hamburg Rotterdam
1887 3.926.558 5.400.513 3.231.564
1902 11.381.740 14.965.654 12.682.054
1910 16.216.631 23.122.194 22.872.353
1913 18.871.934 25.457.910 29.419.482
1920 13.067.740 5.797.362 11.912.691
1924 21.355.850 19.529.164 24.960.262
1929 26.066.683 26.976.154 38.805.017
1932 17.383.209 19.446.144 21.303.249 Source: NL-HaNa, KvK Rotterdam / Secretariaat, 3.17.17.04, inv. nr.1617, Memorandum concerning the interests of the port of Rotterdam regarding annexation of German territory.
66
Marcel W. van de Velde, Le Port d‟Anvers, aperçu de la situation économique et politique du port
national Belge en comparaison avec celle des ports de Rotterdam et Dunkerque (Antwerpen ca.1930) 7. 67
Warsch, Antwerpen, Rotterdam, 30. 68
NL-HaNa, BuZa / Economische Zaken, 2.05.37 inv.nr.875, Brief KvK&F R‟dam, 29-11-1922. 69
Verseput, Kamer van Koophandel en Fabrieken, 69-75; Van Lier, Kamer van Koophandel en
Fabrieken voor Rotterdam, 1803-1928, 852-862. 70
Lülsdorfs, Die Bedeutung Rotterdams, 42; NL-HaNa, BuZa / Economische Zaken, 2.05.37
inv.nr.875, Brief KvK&F R‟dam, 29-11-1922. 71
NL-HaNa, BuZa / Economische Zaken, 2.05.37, inv.nr. 90, Report on transshipment in Rotterdam
and Antwerp, dated 19 October 1920.
Jeroen Euwe – [email protected]
20
During the first half of the 1920‟s competition between the two ports was especially fierce, as
both ports tried reclaim the traffic they had lost during the war and the economic troubles of
the time. Antwerp gained a competitive edge when – in order to promote their own seaports –
in 1919 the French re-instituted the surtaxes d’entrepôt (a levy on almost all non-European
products) and surtaxes d’origine (a levy on a large number of European products) on goods
that were not transported directly from the country of origin to a French port.72
The taxes
payable were often greater than the cost of shipping: in 1924, this duty amounted to 33.6 francs
per ton, whilst freight costs to Strasbourg were 25-40 francs per ton.73
When Antwerp was
granted exemptions a year later, Rotterdam lost its traffic to Strasbourg.74
By way of
compensation for the surtaxes, Antwerp had already instituted a free tug service to the Rhine
from its port, and had committed itself to the construction of a canal to the Rhine at Moerdijk.75
This threatened to further weaken the position of Rotterdam, and caused widespread protests
amongst those who had interests in Rhine shipping and opened a lively debate in the press.76
Ultimately, the construction of a canal in Dutch territory was denied in 1927, causing the
resignation of the Dutch minister for foreign affairs who was in favour of the canal.77
Belgium
tried to further improve its position by instituting lower rates for transport by rail from its ports
toward the hinterland and vice versa.78
Despite these Belgian measures, Rotterdam surpassed
Antwerp in 1924 (Table 7).79
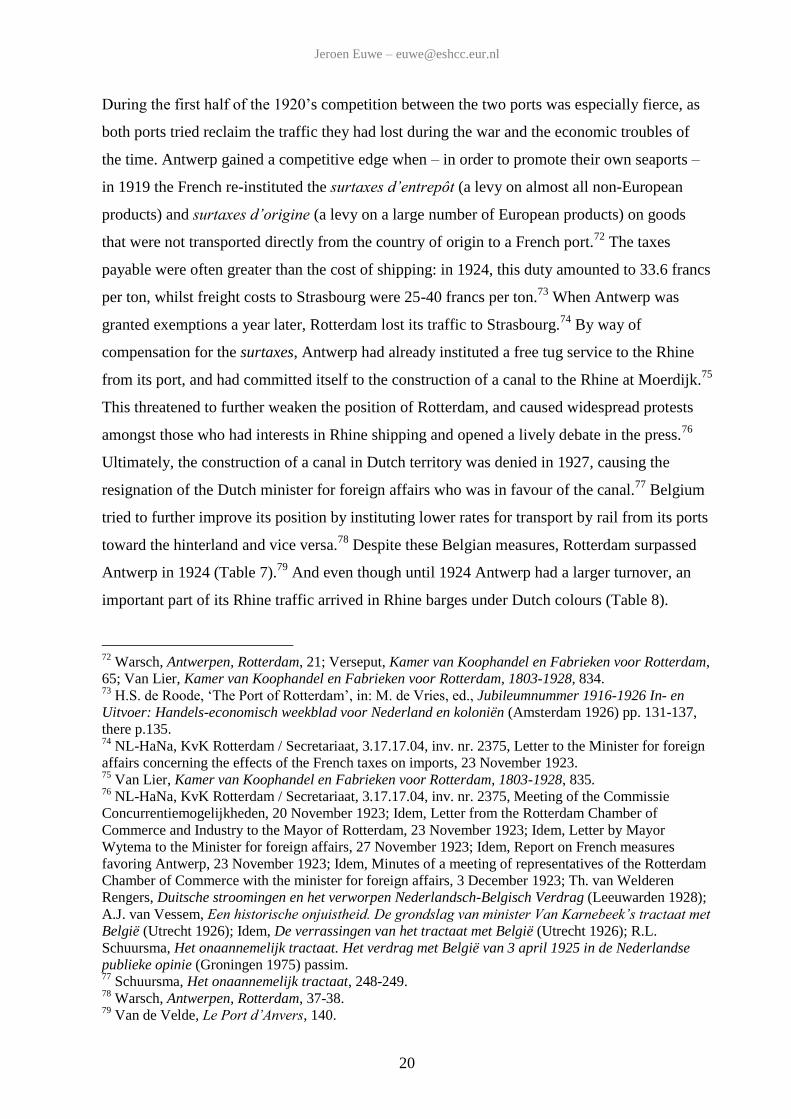
And even though until 1924 Antwerp had a larger turnover, an
important part of its Rhine traffic arrived in Rhine barges under Dutch colours (Table 8).
72
Warsch, Antwerpen, Rotterdam, 21; Verseput, Kamer van Koophandel en Fabrieken voor Rotterdam,
65; Van Lier, Kamer van Koophandel en Fabrieken voor Rotterdam, 1803-1928, 834. 73
H.S. de Roode, „The Port of Rotterdam‟, in: M. de Vries, ed., Jubileumnummer 1916-1926 In- en
Uitvoer: Handels-economisch weekblad voor Nederland en koloniën (Amsterdam 1926) pp. 131-137,
there p.135. 74
NL-HaNa, KvK Rotterdam / Secretariaat, 3.17.17.04, inv. nr. 2375, Letter to the Minister for foreign
affairs concerning the effects of the French taxes on imports, 23 November 1923. 75
Van Lier, Kamer van Koophandel en Fabrieken voor Rotterdam, 1803-1928, 835. 76
NL-HaNa, KvK Rotterdam / Secretariaat, 3.17.17.04, inv. nr. 2375, Meeting of the Commissie
Concurrentiemogelijkheden, 20 November 1923; Idem, Letter from the Rotterdam Chamber of
Commerce and Industry to the Mayor of Rotterdam, 23 November 1923; Idem, Letter by Mayor
Wytema to the Minister for foreign affairs, 27 November 1923; Idem, Report on French measures
favoring Antwerp, 23 November 1923; Idem, Minutes of a meeting of representatives of the Rotterdam
Chamber of Commerce with the minister for foreign affairs, 3 December 1923; Th. van Welderen
Rengers, Duitsche stroomingen en het verworpen Nederlandsch-Belgisch Verdrag (Leeuwarden 1928);
A.J. van Vessem, Een historische onjuistheid. De grondslag van minister Van Karnebeek’s tractaat met
België (Utrecht 1926); Idem, De verrassingen van het tractaat met België (Utrecht 1926); R.L.
Schuursma, Het onaannemelijk tractaat. Het verdrag met België van 3 april 1925 in de Nederlandse
publieke opinie (Groningen 1975) passim. 77
Schuursma, Het onaannemelijk tractaat, 248-249. 78
Warsch, Antwerpen, Rotterdam, 37-38. 79
Van de Velde, Le Port d’Anvers, 140.
Jeroen Euwe – [email protected]
21
Throughout the period 1919-1931, Rotterdam had a dominant position in Rhine traffic.
Even though Antwerp was at times able to secure a lead on a destination such as Strasbourg,
such partial dominance was only temporary and of little importance when viewed in context of
the total flow of goods to and from the Rhine. In spite of vehement protests over such
dominance by those with interests in Rhine shipping, at the time this was clearly recognized at
cabinet level and did not result in government action.80
Table 8: Rhine barges in the port of Antwerp 1923-1931, by nationality
German Dutch Belgian French
Year Arr
ivals
Depart
ure
s
Arr
ivals
Depart
ure
s
Arr
ivals
Depart
ure
s
Arr
ivals
Depart
ure
s
1923 76 43 291 144 284 276 291 207
1924 275 260 870 277 1204 904 670 441
1925 537 313 414 362 1890 1260 608 489
1926 701 382 2172 250 2711 950 543 545
1927 542 441 2514 266 1930 988 481 419
1928 508 344 2148 256 1541 716 550 177
1929 668 338 2125 242 1598 612 522 140
1930 523 229 2043 317 1445 444 498 138
1931 456 425 1727 337 1655 453 548 501 Sources: Jahres-Bericht der Zentral-Kommission für die Rheinschiffahrt [1923-1931], "Beilage 1 zu IV, B, a u. IV, c 1, Übersicht der Schiffe und Flösse, welche im Jahre 1924 in den schweizer, französischen, deutschen und belgischen Rheinhäfen angekommen sind"; Idem, "Beilage 1 zu IV, B, a u. IV, c 1, Übersicht der Schiffe und Flösse, welche im Jahre 1924 aus den schweizer, französischen, deutschen und belgischen Rheinhäfen abgefahren sind".
Competition between modes of transport
Closely linked to competition between ports was the competition between modes of transport.
The only relevant competition during this period was between rail transport and inland
shipping. Although in relative terms large-scale road transport showed explosive growth –
between 1913 and 1925 the number of trucks in Germany grew with some 50.000 units, and by
1925 just over 2% of total transport of goods in that country was transported by road – the
sector was still in its infancy.81
As most road transport was local, its importance in international
transport was even less: the same year, only 0.9% of freight between the Netherlands and
80
NL-HaNa, KvK Rotterdam / Secretariaat, 3.17.17.04, inv. nr. 2375, Meeting of representatives of the
Rotterdam chamber of commerce and industry with the Minister for foreign affairs, 3 Dec 1923. 81
Teubert, Der Güterverkehr und seine Veränderungen in der Nachkriegszeit, p.43; Table 1; own
calculations.
Jeroen Euwe – [email protected]
22
Germany was sent by road (Chart 3).82
However, competition between railroads and inland
shipping was fierce. In Germany, France, the Netherlands and Belgium railroad freight was
actively promoted.
As the role of Belgian special railway rates implied, such measures not only served to
attract seagoing freighters to a specific (group of) port(s), they were also used to divert traffic
from inland waterways. Thus, during this period there was not only a strong competition
between ports, but between modes of transport as well. Both types of rivalry were intimately
connected. All four major countries along the Rhine employed such measures to attract to their
ports the largest possible amount of traffic. In Belgium the Tarifs des ports de mer were used
to direct Belgian exports to rail transport and Belgian seaports, while the Transit-Barême was
destined for transit traffic from Belgian seaports.83
In 1923 France lowered railroad freight
charges for transit traffic from its seaports to Germany.84
The Netherlands employed a
different system: when traffic exceeded 15,000 tons per year, a 10% rebate was given at the
end of the year. For traffic exceeding 80,000 tons, the rebate was raised to 20%.85
Whether
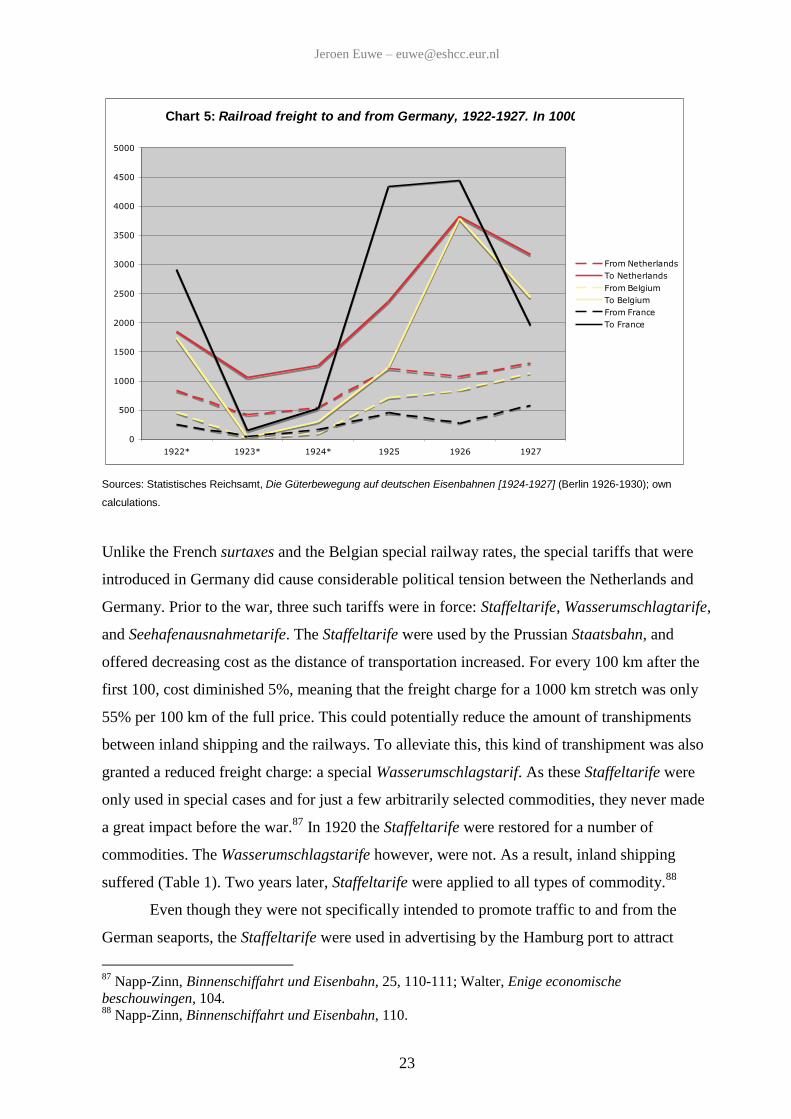
these ways of attracting traffic worked, remains open to debate. A comparison of the
development of these countries‟ railroad transport to and from Germany shows that (apart from
exports to France) traffic with the Netherlands was significantly more important than traffic
with either Belgium or France (Chart 5). Yet there are too many variables influencing this
traffic – the payment of reparations in kind to France and Belgium, political complications
such as the Ruhr occupation – to draw definite conclusions. What these measures did not
manage – at least in the case of the Netherlands – was to direct much traffic from Rhine
shipping to railroad transport. Railroad transport showed only a very slight growth while Rhine
shipping multiplied (Table 1, Chart 3). The share of the railways in freight traffic between the
Netherlands and Germany dropped from 30% in 1919 to just over 9% in 1925, and would
continue to be around 9% throughout the remainder of the 1920s and early 30s.86
82
Centraal Bureau voor de Statistiek, Jaarstatistiek voor de In-, Uit-, en Doorvoer 1925, 16
'Verkeerswijzen bij invoer, uitvoer en doorvoer'; own calculations. 83
Warsch, Antwerpen, Rotterdam, 37-38. 84
Jahres-Bericht der Zentral-Kommission für die Rheinschiffahrt im Jahre 1923 (Strasbourg 1924) 75. 85
Warsch, Antwerpen, Rotterdam, 37-38. 86
CBS, Jaarstatistiek voor de In-, Uit-, en Doorvoer [1919 -1924], 16 'Verkeerswijzen bij invoer,
uitvoer en doorvoer'; own calculations.
Jeroen Euwe – [email protected]
23
Chart 5: Railroad freight to and from Germany, 1922-1927. In 1000
0
500
1000
1500
2000
2500
3000
3500
4000
4500
5000
1922* 1923* 1924* 1925 1926 1927
From Netherlands
To Netherlands
From Belgium
To Belgium
From France
To France
Sources: Statistisches Reichsamt, Die Güterbewegung auf deutschen Eisenbahnen [1924-1927] (Berlin 1926-1930); own
calculations.
Unlike the French surtaxes and the Belgian special railway rates, the special tariffs that were
introduced in Germany did cause considerable political tension between the Netherlands and
Germany. Prior to the war, three such tariffs were in force: Staffeltarife, Wasserumschlagtarife,
and Seehafenausnahmetarife. The Staffeltarife were used by the Prussian Staatsbahn, and
offered decreasing cost as the distance of transportation increased. For every 100 km after the
first 100, cost diminished 5%, meaning that the freight charge for a 1000 km stretch was only
55% per 100 km of the full price. This could potentially reduce the amount of transhipments
between inland shipping and the railways. To alleviate this, this kind of transhipment was also
granted a reduced freight charge: a special Wasserumschlagstarif. As these Staffeltarife were
only used in special cases and for just a few arbitrarily selected commodities, they never made
a great impact before the war.87
In 1920 the Staffeltarife were restored for a number of
commodities. The Wasserumschlagstarife however, were not. As a result, inland shipping
suffered (Table 1). Two years later, Staffeltarife were applied to all types of commodity.88
Even though they were not specifically intended to promote traffic to and from the
German seaports, the Staffeltarife were used in advertising by the Hamburg port to attract
87
Napp-Zinn, Binnenschiffahrt und Eisenbahn, 25, 110-111; Walter, Enige economische
beschouwingen, 104. 88
Napp-Zinn, Binnenschiffahrt und Eisenbahn, 110.
Jeroen Euwe – [email protected]
24
freight from the Ruhr. Misleading statements were not shunned, reported the Dutch consul in
Duisburg-Ruhrort in December 1921: in a folder sent to ex- and importers the cost of sending
freight via Hamburg was compared to Rotterdam and Antwerp. Naturally, Hamburg was
noticeably cheaper. The reason however, was that for transport by way of Rotterdam the cost
of railway freight was used instead of Rhine shipping. A corrected specification showed that
even with the Staffeltarife, routing traffic through Rotterdam was still the cheaper option.89
On the first of March 1924, the Seehafenausnahmetarife were re-introduced. Unlike the
Staffeltarife, these tariffs were aimed at diverting very specific traffic at an extremely low
freight cost along specific routes to the German seaports, thereby reducing Germany‟s
dependence on foreign seaports and in passing aiding the economic development of these
ports. Whereas before the war, its negative effect on inland shipping had been tempered by the
Wasserumschlagstarife, these were not re-introduced.90
Moreover, the reduction in cost was
now 53 to 56%, compared to the pre-war reduction of 40%.91
Because of the stipulations in the
Treaty of Versailles Germany was obligated to unilaterally grant the same reductions to
Belgium and France at their request, and Belgium received a number of special tariffs during
the course of the year.92
The Netherlands tried at that time to negotiate a number of special
tariffs, but could do no better than a German promise that it would be treated at the same level
as Belgium „within a reasonable amount of time‟. This would be the end of January 1925,
when Germany could rightfully withdraw the special tariffs it had been forced to grant the
Belgians, and which were duly retracted. Although the Netherlands was now in the same
position as Belgium, the German seaports were still attracting traffic with the
Seehafenausnahmetarife that otherwise might have gone to Rotterdam.
The precise consequences of these tariffs for the amount of traffic with the Netherlands
are not clear, but they do not seem to have been serious. The throughput of the port of
Rotterdam recovered more quickly and grew faster than that of Hamburg, Rotterdam‟s most
important German rival.93
According to the Rotterdam Chamber of Commerce and Industry,
the port of Rotterdam lost some traffic in merchandise, which they themselves admit was never
89
NL-HaNa, BuZa / Economische Zaken, 2.05.37 inv.nr.875, 12 December 1921, Report by the Dutch
consul in Duisburg-Ruhrort. 90
Verseput, Kamer van Koophandel en Fabrieken voor Rotterdam, 66; Walter, Enige economische
beschouwingen, 105, Lülsdorfs, Die Bedeutung Rotterdams, 94. 91
Rapport Annuel de la Commission Centrale pour la Navigation du Rhin 1928, 59-60. 92
Van Lier, Kamer van Koophandel en Fabrieken voor Rotterdam, 1803-1928, 880. 93
NL-HaNa, KvK Rotterdam / Secretariaat, 3.17.17.04, inv. nr.1617, Memorandum concerning the
interests of the port of Rotterdam regarding annexation of German territory; own calculations.
Jeroen Euwe – [email protected]
25
their strong suit.94
The annual report for 1928 of the Central Commission for Navigation on the
Rhine mentions that the Ausnahmetarife caused an important expansion of the port of
Bremen.95
Although Bremen shows an altogether faster recovery than either Hamburg or
Rotterdam, it is a relatively small port. To accurately assess the impact of the Ausnahmetarife it
will be necessary to chart developments in transport for all three North Sea ports by destination
and origin in Germany.
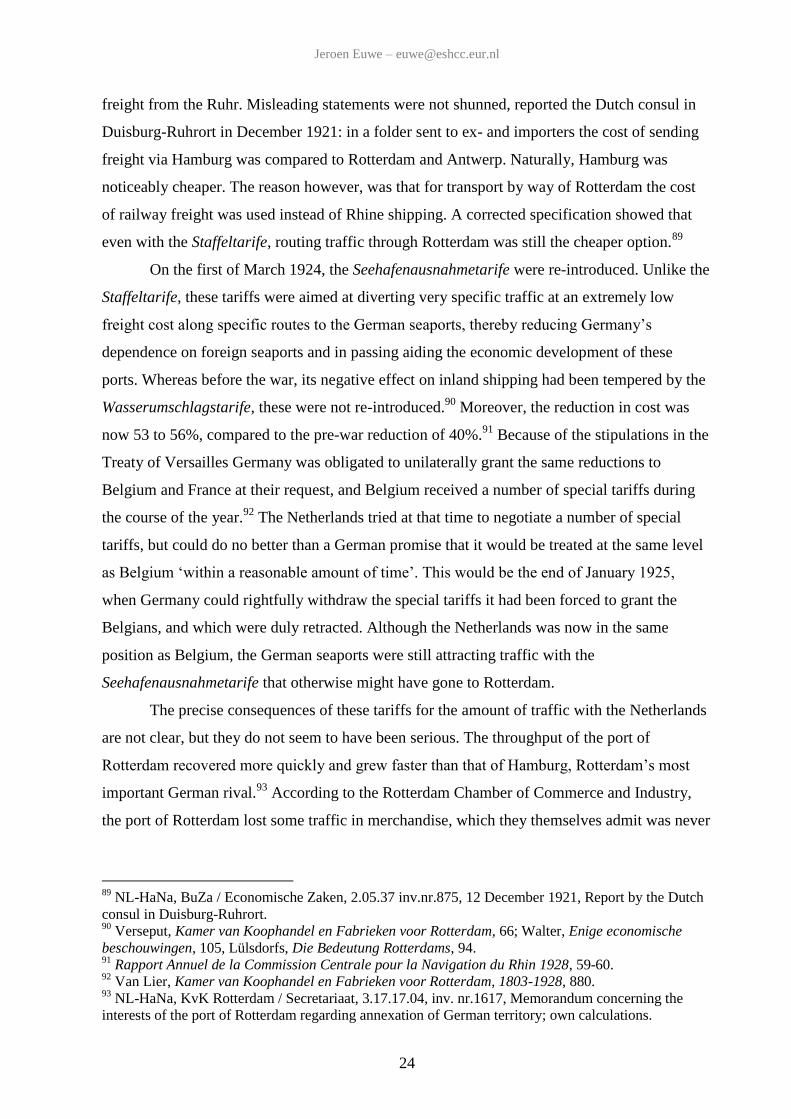
Chart 6: The share of the Ruhr in Dutch, Belgian and French
rail transport with Germany, 1922-1927. In percentages.
0.0
10.0
20.0
30.0
40.0
50.0
60.0
70.0
80.0
90.0
1922* 1923* 1924* 1925 1926 1927
To the Netherlands
To Belgium
To France
From the Netherlands
From Belgium
From France
Sources: Statistisches Reichsamt, Die Güterbewegung auf deutschen Eisenbahnen [1924-1927] (Berlin 1926-1930); own calculations.
In spite of the strong competition and government intervention, Rhine shipping was
considerably more important than the railroads in freight transport between Germany and its
western neighbours the Netherlands and Belgium. Like Rhine shipping, rail transport of these
countries concentrated on Ruhr exports while German imports were geographically more
evenly distributed (Chart 6).
Conclusion
94
Kamer van Koophandel en Fabrieken voor Rotterdam 1803-1927, 834; Verseput, Kamer van
Koophandel en Fabrieken voor Rotterdam, 67.
Rapport Annuel de la Commission Centrale pour la Navigation du Rhin 1928, 56.
Jeroen Euwe – [email protected]
26
The economic structure and international economic ties of Germany find a strong expression in
the transport sector. Statistics for both inland shipping as well as internal railroad transport
show that Germany‟s economic heartland clearly was the Ruhr area. International traffic also
centred on the Ruhr, and consisted mostly of shipping along the Rhine. In turn, the Dutch
transport sector was focussed on international transport with Germany, specifically the Ruhr
area and the (left bank of the) Rheinprovinz. Although railroad freight was sizeable, Rhine
traffic was considerably more important. When Germany‟s economic recovery started, it was
Rhine shipping which profited.
In shipping to and from the Ruhr, ships under the Dutch flag were in an overwhelming
majority. A significant part of these ships however, were actually German. These ships had
usually been financed by Dutch banks, and were mostly part of Dutch subsidiaries of German
concerns. Nevertheless, this fact does not necessarily refute Adenauer‟s claim. In fact, it
enhances it. Even though mostly financed by the Dutch, these foreign direct investments (that
had already started before the war) only added to the interweaving of Dutch and German
companies, and therefore their economy.
It is during this period, that Rotterdam surpassed its two main rivals Antwerp and
Hamburg as Germany‟s gateway to the world market. In spite of Antwerp‟s better accessibility
for sea-going vessels and the more extensive Belgian railroad network, both Dutch shipping
and railroad traffic with Germany were greater. When German international traffic by way of
the Rotterdam is compared with traffic through Antwerp or Hamburg, the Dutch transport
sector was clearly Germany‟s most important partner in international freight.
All in all, the answer to whether Adenauer‟s claim that „the backbone of the economic
ties between Germany and the Netherlands is the Rhine‟ holds water can best be summed up
as: most definitely, with the addendum that transport flows indicate that the economic centre of
the Rhine consisted of the (extended) Ruhr area.