The revolution of the checkout area · The queuing system of the supermarket is not much different...
29
The revolution of the checkout area Niels Horst 1273574 mBMI January 5, 2009
Transcript of The revolution of the checkout area · The queuing system of the supermarket is not much different...

The revolution of the checkout area
Niels Horst 1273574 mBMI
January 5, 2009

Preface
This document is what we call a BMI-thesis. The BMI-thesis is part of the curriculum of themaster’s program Business Mathematics and Informatics, or BMI. The BMI program is a multi-disciplinary program, aimed at improving business processes by applying a combination of methodsbased upon mathematics, computer science and business management. I participated in the BMIprogram at the Vrije Universiteit in Amsterdam. This is the only university that offers BusinessMathematics and Informatics.
The BMI-thesis has several goals. Based upon a problem statement the student performs aresearch. The student reports on the research in a written report. The main goal is to describethe problem clearly and make it understandable for a reasonably educated reader. The aim ofthe project is to focus on the business aspect of the problem as well as on the mathematical andcomputer science aspects.
The main subject of this thesis is the queue at the checkout counter of a supermarket. At themoment, this is a very hot topic, because of the recent introduction of a revolutionary checkoutsystem: the self checkout machine. Many supermarkets are experimenting with the new system.The goal of this thesis is to perform a mainly quantitative analysis of the self checkout system.The thesis will particularly focus on the system that has been introduced in several establishmentsof the C1000 supermarket. The reader of this document will gain insight in the pros and cons ofthe new system relative to the traditional system with cashiers.
I would like to express special thanks to Wemke van der Weij, PhD at the Vrije Universiteit,for supporting me throughout the process of creating this document.
1
Contents
1 The rise of self service 31.1 The grocery store . . . . . . . . . . . . . . . . . . . . . . . . . . . . . . . . . . . . . 31.2 The self-serving store . . . . . . . . . . . . . . . . . . . . . . . . . . . . . . . . . . . 31.3 The supermarket . . . . . . . . . . . . . . . . . . . . . . . . . . . . . . . . . . . . . 41.4 The next step . . . . . . . . . . . . . . . . . . . . . . . . . . . . . . . . . . . . . . . 51.5 Self checkout at C1000 . . . . . . . . . . . . . . . . . . . . . . . . . . . . . . . . . . 6
2 Modeling the traditional supermarket 72.1 The arrival process . . . . . . . . . . . . . . . . . . . . . . . . . . . . . . . . . . . . 72.2 Counter selection . . . . . . . . . . . . . . . . . . . . . . . . . . . . . . . . . . . . . 72.3 Service times . . . . . . . . . . . . . . . . . . . . . . . . . . . . . . . . . . . . . . . 82.4 Interpreting the traditional model . . . . . . . . . . . . . . . . . . . . . . . . . . . 8
2.4.1 Mean Value Analysis . . . . . . . . . . . . . . . . . . . . . . . . . . . . . . . 92.4.2 The distribution of the queue length . . . . . . . . . . . . . . . . . . . . . . 9
2.5 Computational example . . . . . . . . . . . . . . . . . . . . . . . . . . . . . . . . . 12
3 Self checkout at C1000 143.1 Service times at the self checkout machines . . . . . . . . . . . . . . . . . . . . . . 153.2 Departure process at the self checkout machines . . . . . . . . . . . . . . . . . . . . 153.3 Arrival processes at the cash payment counters . . . . . . . . . . . . . . . . . . . . 163.4 Interpreting the C1000 model . . . . . . . . . . . . . . . . . . . . . . . . . . . . . . 183.5 Computational example . . . . . . . . . . . . . . . . . . . . . . . . . . . . . . . . . 18
4 Pro’s and cons of self scanning 194.1 Customer perception . . . . . . . . . . . . . . . . . . . . . . . . . . . . . . . . . . . 194.2 Added value for the supermarket . . . . . . . . . . . . . . . . . . . . . . . . . . . . 204.3 Cashiers: the victims . . . . . . . . . . . . . . . . . . . . . . . . . . . . . . . . . . . 20
5 Alternatives 215.1 The handscanner of Albert Heijn . . . . . . . . . . . . . . . . . . . . . . . . . . . . 21
5.1.1 Advantages and disadvantages of the handscanner . . . . . . . . . . . . . . 215.2 Radio Frequency Identification . . . . . . . . . . . . . . . . . . . . . . . . . . . . . 22
5.2.1 Advantages and disadvantages of RFID . . . . . . . . . . . . . . . . . . . . 225.2.2 C1000 and RFID . . . . . . . . . . . . . . . . . . . . . . . . . . . . . . . . . 23
5.3 Automatic cash payments . . . . . . . . . . . . . . . . . . . . . . . . . . . . . . . . 23
6 Conclusions 24
2
Chapter 1
The rise of self service
Nowadays nobody finds it strange to walk into a supermarket with a shopping cart, gather all yourrequired goods and bring them to the cash desk. However, this form of self service has not existedfor very long yet. It took years and years for the foodstuffs branch to realize that consumers wereprepared to do many things themselves.
Throughout the years the foodstuffs branch has evolved from the traditional grocery storeto high tech supermarkets with self checkout machines. During this process, the queues at thecheckout desks have also experienced some radical changes. This chapter describes the historyof the supermarket and the consequences on the checkout queue. The history has been derivedfrom [3], [5], [12], [15], and [25].
1.1 The grocery store
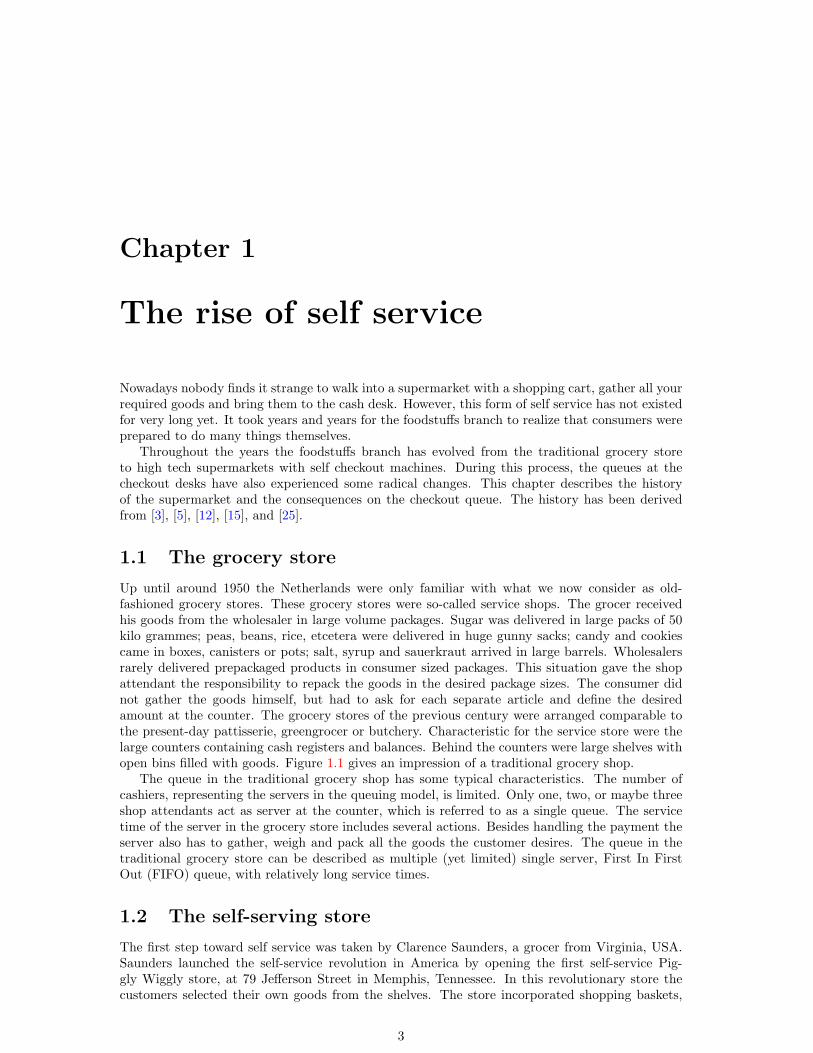
Up until around 1950 the Netherlands were only familiar with what we now consider as old-fashioned grocery stores. These grocery stores were so-called service shops. The grocer receivedhis goods from the wholesaler in large volume packages. Sugar was delivered in large packs of 50kilo grammes; peas, beans, rice, etcetera were delivered in huge gunny sacks; candy and cookiescame in boxes, canisters or pots; salt, syrup and sauerkraut arrived in large barrels. Wholesalersrarely delivered prepackaged products in consumer sized packages. This situation gave the shopattendant the responsibility to repack the goods in the desired package sizes. The consumer didnot gather the goods himself, but had to ask for each separate article and define the desiredamount at the counter. The grocery stores of the previous century were arranged comparable tothe present-day pattisserie, greengrocer or butchery. Characteristic for the service store were thelarge counters containing cash registers and balances. Behind the counters were large shelves withopen bins filled with goods. Figure 1.1 gives an impression of a traditional grocery shop.
The queue in the traditional grocery shop has some typical characteristics. The number ofcashiers, representing the servers in the queuing model, is limited. Only one, two, or maybe threeshop attendants act as server at the counter, which is referred to as a single queue. The servicetime of the server in the grocery store includes several actions. Besides handling the payment theserver also has to gather, weigh and pack all the goods the customer desires. The queue in thetraditional grocery store can be described as multiple (yet limited) single server, First In FirstOut (FIFO) queue, with relatively long service times.
1.2 The self-serving store
The first step toward self service was taken by Clarence Saunders, a grocer from Virginia, USA.Saunders launched the self-service revolution in America by opening the first self-service Pig-gly Wiggly store, at 79 Jefferson Street in Memphis, Tennessee. In this revolutionary store thecustomers selected their own goods from the shelves. The store incorporated shopping baskets,
3
CHAPTER 1. THE RISE OF SELF SERVICE 4
Figure 1.1: A traditional grocery store.
self-service branded products, and checkouts at the front. Removing unnecessary clerks, creatingelaborate aisle displays, and rearranging the store to force customers to view all the merchan-dise were just some of the characteristics of the early Piggly Wiggly stores. The concept of the‘Self-Serving Store’ was patented by Saunders in 1917.
The concept of self service was introduced in the Netherlands several years later. In 1948the Van Woerkom brothers introduced the concept in Nijmegen. The low counters with cashregisters and balances, characteristics of the traditional grocery store, disappeared from the shop.All articles were pre-packed and labeled with a price tag. Arriving customers could now take ashopping basket and start collecting all their goods from the shelves. The grocery stores wereready for the step toward the supermarket. The wholesalers, however, did not adapt to the newconcept yet. Deliveries were still made in large volume packages and the grocer still needed torepack the goods in consumer sized packs. The only difference for the grocer was the fact thatthe balance had been moved from the store to the storage room. Not much of an improvementone could say. However, both the customers and the shopkeepers appeared to be very attractedto the new self-service system. The customers appreciated the privilege to be allowed to gathertheir goods themselves and the grocer was able to allocate his time more efficient. In idle timesthere was room for the shopkeeper to weigh and pack the goods in consumer sized packages.
The step from the grocery store to the self-serving store also means a change in the queuingsystem. With the introduction of checkouts at the front of the store the single queue belongs tothe past. Moreover, the service times of the servers decrease radically as the shop attendant hasno longer the obligation to weigh and pack all goods for the customers. The queuing system in theself-serving store can be described as an FIFO multi-server, multi-queue with short service timesrelative to those of the grocery store.
With the introduction of self serving stores most grocers realized that the foodstuffs industrywas about to change radically.
1.3 The supermarket
Shortly after the introduction of self-serving the first supermarkets started to emerge. Accordingto the Smithsonian Institution, the first true supermarket in the United States was opened byMichael J. Cullen, on August 4, 1937, in a 560 square meter former garage in Jamaica, Queens,New York. The store, King Kullen, operated under the slogan “Pile it high. Sell it low.” Aswith the self-serving stores, the Netherlands followed America several years later. The first Dutch
CHAPTER 1. THE RISE OF SELF SERVICE 5
supermarket was the N.V. Suco, opened in Amsterdam in 1953. This first real supermarket didnot bring the expected success. Shortly after the opening it was taken over by Dirk van den Broek.
The main characteristics of a supermarket that distinguish it from the self-serving stores andthe traditional grocery stores are the size and the selection. The supermarket is bigger in size andhas a wider selection of products.
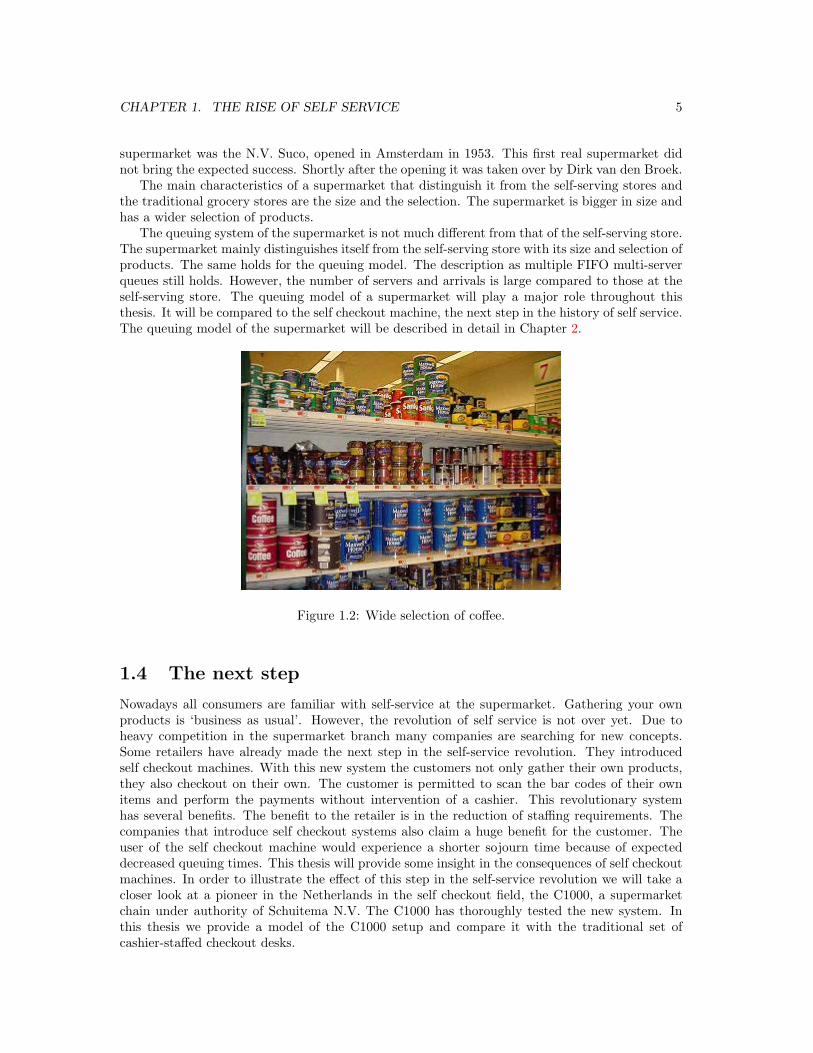
The queuing system of the supermarket is not much different from that of the self-serving store.The supermarket mainly distinguishes itself from the self-serving store with its size and selection ofproducts. The same holds for the queuing model. The description as multiple FIFO multi-serverqueues still holds. However, the number of servers and arrivals is large compared to those at theself-serving store. The queuing model of a supermarket will play a major role throughout thisthesis. It will be compared to the self checkout machine, the next step in the history of self service.The queuing model of the supermarket will be described in detail in Chapter 2.
Figure 1.2: Wide selection of coffee.
1.4 The next step
Nowadays all consumers are familiar with self-service at the supermarket. Gathering your ownproducts is ‘business as usual’. However, the revolution of self service is not over yet. Due toheavy competition in the supermarket branch many companies are searching for new concepts.Some retailers have already made the next step in the self-service revolution. They introducedself checkout machines. With this new system the customers not only gather their own products,they also checkout on their own. The customer is permitted to scan the bar codes of their ownitems and perform the payments without intervention of a cashier. This revolutionary systemhas several benefits. The benefit to the retailer is in the reduction of staffing requirements. Thecompanies that introduce self checkout systems also claim a huge benefit for the customer. Theuser of the self checkout machine would experience a shorter sojourn time because of expecteddecreased queuing times. This thesis will provide some insight in the consequences of self checkoutmachines. In order to illustrate the effect of this step in the self-service revolution we will take acloser look at a pioneer in the Netherlands in the self checkout field, the C1000, a supermarketchain under authority of Schuitema N.V. The C1000 has thoroughly tested the new system. Inthis thesis we provide a model of the C1000 setup and compare it with the traditional set ofcashier-staffed checkout desks.

CHAPTER 1. THE RISE OF SELF SERVICE 6
Figure 1.3: Self checkout at C1000.
1.5 Self checkout at C1000
As mentioned in the annual report 2002 of Schuitema N.V. [19], Schuitema realized that thecustomer really desired fast checkout at supermarkets. One way to fulfill this demand is placingso-called self checkout machines. In November 2002, C1000 initiated this as a test in Bodegraven.A press release [16] noted that, with the installation of three fully operational unmanned selfcheckout counters, C1000 Bodegraven was the first of its kind in the Netherlands. The systemconsists of a scanner and a conveyor belt at which the customer scans his products. In this firstpilot the customer still has to visit a cashier to perform the payments. The pilot appeared tobe an immediate success. According to the 2002 annual report [19] 25% of the customers werewilling to use the new system. This success leaded to an expansion of the test. Four more C1000supermarkets in Surhuisterveen, Eibergen, Landgraaf and Bodegraven were equipped with the newself checkout system. A press release of November 2, 2003 [17] makes notion of this next step inthe test program. At two of the four test sites the customers not only scanned their own articles,but were also able to perform electronic payment of the goods with PIN1 or chipknip2. For cashpayments the client still had to attend a cashier. Again the pilot was considered a succes. Asstated in the Schuitema N.V. annual report of 2004 [21] the tests of self checkout systems covered10 establishments of C1000 in 2004. At present day, the self checkout systems are in use in manyC1000 stores.
Due to the introduction of self checkout machines the queuing model of the supermarket hasto be changed dramatically. The rather straight-forward model of the traditional supermarkethas to be replaced by a more complicated model. This new model is the core of this thesis. Inthe following chapters both the traditional situation and the new self checkout system will bemodeled and compared quantitatively. In the new situation the customer perception also plays animportant role. This perception will be addressed in Chapter 4.
1PIN is an online electronic point-of-sale payment system which transfers payments in real-time.2Chipknip is an electronic cash system used in the Netherlands. All ATM cards issued by Dutch banks have
smart cards that can be loaded with value via Chipknip loading stations next to ATMs. Chipknip can be used forpayments at parking machines, shops etc.

Chapter 2
Modeling the traditionalsupermarket
In order to compare the traditional supermarket with cashiers and the new self checkout systemof C1000, checkouts are modeled as a queue length model. This model has several components onwhich assumptions have to be made. In this chapter all components will be addressed separately.Finally the components will be merged into a model that can be analyzed and compared to theself checkout system.
2.1 The arrival process
The process of customers arriving at a supermarket can be modeled as a Poisson process (see [10], [26]and [23] for more information on the Poisson process). The Poisson process is a viable modelwhen the arrivals originate from a large population of independent potential customers (see Vir-tamo [26]). This immediately justifies the choice for the Poisson arrival process. A supermarkethas a large population of potential customers and each customer acts independently of other cus-tomers. The choice for a Poisson arrival process has several advantages. One of these advantages isthe useful consequence of randomly splitting a Poisson process. This aspect of the Poisson processis used in Section 2.2 on counter selection. Another useful characteristic of the Poisson process isthe PASTA property (see [10], [26] and [23] for more information on the PASTA property). Thisproperty holds that arriving customers find on average the same situation in the queuing systemas an outside observer does, looking at an arbitrary point in time. This makes it possible to drawconclusions about interesting measures such as expected sojourn time and average queue length.
2.2 Counter selection
In the previous section the arrival process at the supermarket has been defined. However, whatreally matters is the arrival process at the checkout counters. Assume that the supermarketcheckout region consists of N counters and that an arbitrary customer chooses counter i withprobability pi. The arrival process at each individual checkout counter can then be described aswhat Virtamo [26] calls a randomly split Poisson process, which we recall in Theorem 2.1.
Theorem 2.1 If a Poisson process with intensity λ is randomly split into subprocesses with prob-abilities p1, p2, . . . , pN , where p1 + p2 + . . . + pN = 1, then the resulting processes are independentPoisson processes with intensities p1λ, p2λ, . . . , pNλ.
As a result of Theorem 2.1 the model of the traditional supermarket consists of N independentPoisson arrival processes. Hence, customers arrive at the First In First Out (FIFO) queue on
7

CHAPTER 2. MODELING THE TRADITIONAL SUPERMARKET 8
Figure 2.1: Model of the traditional supermarket.
server i according to a Poisson process with rate piλ. Figure 2.1 schematically illustrates themodel of the traditional queues at the supermarket.
All servers are assumed to have identically distributed service times. We also assume thatthere are no special counters for shopping baskets. Consequence of this assumption is that p1 =p2 = . . . = pN = 1/N since no counter will be preferred over another. The expected service timeES of a checkout counter will be discussed in detail in the next section.
2.3 Service times
The service time at a checkout counter highly depends on the method of payment. Two paymentmethods are considered in this model. A customer can either pay cash or pay electronicallywith PIN. For computational reasons the two different service times are both assumed to havean exponential distribution. Denote with βpin the expected service time for a customer payingelectronically and let βcash denote the expected service time of a customer paying cash. Nowsuppose that an arbitrary customer wants to pay electronically with probability ppin and cashwith probability pcash. Hence, the service times S in the model of the traditional supermarket areassumed to be hyper exponentially distributed and hence, have the following characteristics:
ES =2∑
i=1
pi
µi=
ppin
µpin+
pcash
µcash(2.1)
ES2 =2∑
i=1
2µ2
i
pi =2
µ2pin
ppin +2
µ2cash
pcash, (2.2)
where µpin = 1/βpin and µcash = 1/βcash are the service rates for the different payment methods.And note that ES denotes the expected service time and ES2 the second moment of the servicetime.
2.4 Interpreting the traditional model
As a result of Theorem 2.1 the model of Figure 2.1 can be interpreted as N independent M |G|1queues. Performance measures for these queues come in two types. The first type of performancemeasures result from mean value analysis. The mean value analysis measures things such as

CHAPTER 2. MODELING THE TRADITIONAL SUPERMARKET 9
average queue length and average sojourn time. The second type of performance measures concerntail probabilities, like the probability that more than k customers are waiting in the queue. Thesetail probabilities can only be computed if the stationary distribution of the number of customersin the system is known.
2.4.1 Mean Value Analysis
The mean value analysis for the M |G|1 queues of the model of the traditional supermarket can beperformed using the Pollaczek-Khintchine formula (See for example [23]) for the expected numberof customers in the queue EL. Using Equations 2.1 and 2.2 this leads to:
EL = λ
(ppin
µpin+
pcash
µcash
)+
λ2(
2ppin
µ2pin
+ 2pcash
µ2cash
)2(1− λ
(ppin
µpin+ pcash
µcash
)) . (2.3)
where L denotes the average length of the queue including the customer in service, λ is the arrivalrate, and S is the service time. As discussed in Section 2.3 the service times in the model of thetraditional supermarket are assumed to be hyper exponentially distributed. Using Little’s law, asdescribed in [10], [23] and others, it is possible to obtain the average sojourn time EW .
Law 2.1 (Little) The expected number of customers in the system EL can be expressed in termsof the expected sojourn time EW as follows:
EL = λEW.
2.4.2 The distribution of the queue length
The distribution of the number of customers in the queue can be determined based on the lecturenotes of J. Virtamo [27]. We start the derivation with the observation that there exists an em-bedded Markov chain, by means of which the distribution can be solved. This embedded markovchain has state transition epochs at the moment a customer leaves the system. The state of thechain is defined as the number of customers in the queue at the moment a departure takes place.From now on the following notation will be used:
• L− = the queue length observed by an arriving customer;
• L+ = the queue length observed by a departing customer;
• L = the queue length at an arbitrary moment.
By the PASTA property of a Poisson arrival process it holds that L− ∼ L. In addition to that,it also holds that L− ∼ L+. Proof of the latter can be derived from Figure 2.2 below. The figureshows that the events {L− = i} and {L+ = i} occur pairwise for all i. Hence, P(L− = i) =P(L+ = i), and thus L− ∼ L+. Some simple logic tells that {L− ∼ L+} ∩ {L− ∼ L} ⇒ L+ ∼ L,so to find the distribution of L it is sufficient to find the distribution of the number of customersin the queue immediately after departures. From now on we focus on the discrete-event processformed by L+. Since L+ ∼ L we can forget about the plus and let Lk simply denote the state ofthe process (queue length) at the moment customer k departs. Furthermore, we introduce Vk, thenumber of customers arrived during the service time of customer k. The discrete-event process Lk
constitutes a Markov chain. This can be proved by showing that Lk+1 can be expressed in termsof Lk and a random variable Vk+1 that is independent of Lk and its history:
Lk+1 = Lk − 1 + Vk+1

CHAPTER 2. MODELING THE TRADITIONAL SUPERMARKET 10
Figure 2.2: The arrival process in a graph
Virtamo [27] gives the following proof:
• If Lk ≥ 1, then, upon the departure of customer k, customer k +1 is in the queue and entersthe server immediately. The next state is viewed at the departure moment of customer k+1.At that moment there will be one customer less in the queue than at the previous departure(Customer k + 1 left). However, during service of customer k + 1 there have been Vk+1
arrivals.
• If Lk = 0, the remaining queue at the departure moment of customer k is empty. Uponthe arrival of customer k + 1 the queue length will be incremented by one. However, thisincrement will be undone at the next transition epoch. Upon departure of customer k + 1the queue will only contain the customers arrived during the service time of customer k + 1,which equals Vk+1.
• As the service times are independent and the arrivals are Poissonian, the Vk are independentof each other. Moreover, Vk+1 is independent of the queue length process before the departureof customer k, i.e. Lk, and its previous values.
Hence, Lk+1 depends on Lk but not on the earlier history. The Markov property holds and theprocess Lk constitutes a Markov chain.
2
The queue length distribution can now be determined algorithmically. In order to do so, considerthe embedded Markov chain Lk. Now introduce ni = P(Vk+1 = i) and let fS(x) denote theprobability density function of the service time S. By the law of total probability (see Koole [10],paragraph 1.4) it holds that
ni = P(Vk+1 = i) =∫ ∞
0
P(Vk+1 = i|S = x)fS(x)dx
=∫ ∞
0
(λx)i
i!e−λxfS(x)dx, i = 0, 1, . . . (2.4)
The values of ni are needed for the transition probabilities of the Markov chain and can becalculated. For some simple distributions (like exponential) it can even be computed analytically.For the somewhat more complicated hyper exponential service times we have to rely on numerical
CHAPTER 2. MODELING THE TRADITIONAL SUPERMARKET 11
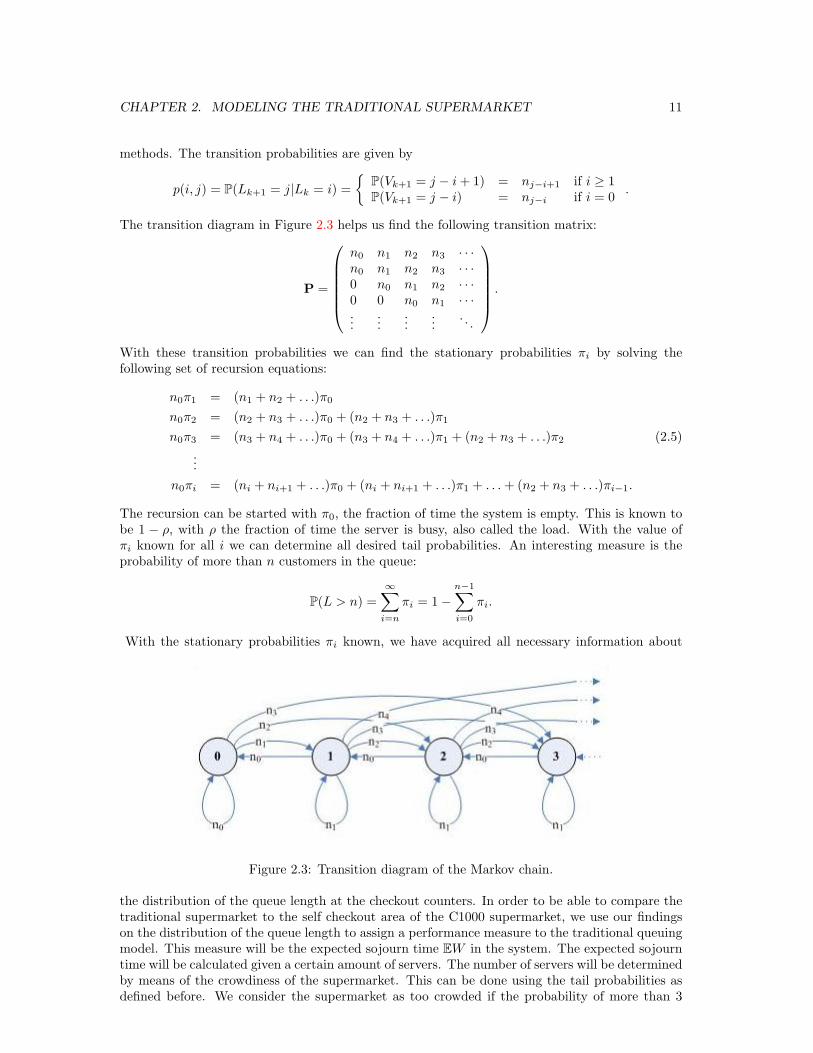
methods. The transition probabilities are given by
p(i, j) = P(Lk+1 = j|Lk = i) ={
P(Vk+1 = j − i + 1) = nj−i+1 if i ≥ 1P(Vk+1 = j − i) = nj−i if i = 0 .
The transition diagram in Figure 2.3 helps us find the following transition matrix:
P =
n0 n1 n2 n3 · · ·n0 n1 n2 n3 · · ·0 n0 n1 n2 · · ·0 0 n0 n1 · · ·...
......
.... . .
.
With these transition probabilities we can find the stationary probabilities πi by solving thefollowing set of recursion equations:
n0π1 = (n1 + n2 + . . .)π0
n0π2 = (n2 + n3 + . . .)π0 + (n2 + n3 + . . .)π1
n0π3 = (n3 + n4 + . . .)π0 + (n3 + n4 + . . .)π1 + (n2 + n3 + . . .)π2 (2.5)...
n0πi = (ni + ni+1 + . . .)π0 + (ni + ni+1 + . . .)π1 + . . . + (n2 + n3 + . . .)πi−1.
The recursion can be started with π0, the fraction of time the system is empty. This is known tobe 1 − ρ, with ρ the fraction of time the server is busy, also called the load. With the value ofπi known for all i we can determine all desired tail probabilities. An interesting measure is theprobability of more than n customers in the queue:
P(L > n) =∞∑
i=n
πi = 1−n−1∑i=0
πi.
With the stationary probabilities πi known, we have acquired all necessary information about
Figure 2.3: Transition diagram of the Markov chain.
the distribution of the queue length at the checkout counters. In order to be able to compare thetraditional supermarket to the self checkout area of the C1000 supermarket, we use our findingson the distribution of the queue length to assign a performance measure to the traditional queuingmodel. This measure will be the expected sojourn time EW in the system. The expected sojourntime will be calculated given a certain amount of servers. The number of servers will be determinedby means of the crowdiness of the supermarket. This can be done using the tail probabilities asdefined before. We consider the supermarket as too crowded if the probability of more than 3

CHAPTER 2. MODELING THE TRADITIONAL SUPERMARKET 12
Figure 2.4: The probability of crowdiness
customers in the queue is larger than 0.05. Figure 2.4 shows the probability of the supermarketbeing too crowded, at arrival rates of respectively 1000, 2000 and 5000 customers per day. It isobvious that an arrival rate of 5000 customers per day requires a very large number of servers.The black dashed line in the figure is the crowdiness norm of 0.05. In the next section we measurethe performance of the traditional supermarket with six available servers, since at that number ofcashiers the probability of crowdiness at a moderate day (2000 customers) is less than 0.05. Thisnumber of servers will also be used to model the situation at C1000 in Chapter 3.
2.5 Computational example
In this section we describe a computational example. We use the statistical properties of the queuelength, as described in the previous sections, to assign a performance measure to the queuingsystem of the traditional supermarket. For this purpose we first gather numerical data regardingthe checkouts observed in practice.
De Nederlandsche Bank (DNB) has investigated methods of payment preferred by consumersin several counter based facilities. The results have been published in a quarterly report [6].Interesting for our computational example is the ratio of cash paying customers relative to cus-tomers preferring to pay electronically. Figure 2.5 shows the results of our interest. From thefigure we can learn that approximately 31% of the transactions in the supermarket is performedthrough cash payment. The rest of the transactions is performed electronically. In the model ofthe traditional supermarket we use the following probabilities for the payments, pcash = 0.31 andppin = 0.69. The report from DNB also mentions average transaction times. Paying cash takeson average 19 seconds and paying electronically requires on average 26 seconds. The differencein service times of 7 seconds will be maintained in this computational example. Assuming thatscanning the articles takes on average 30 seconds, we get the following expected service times.βcash = 30 + 19 = 49 seconds and βpin = 30 + 26 = 56 seconds.
We consider a supermarket with six checkout counters. As mentioned in the previous section,this number suffices to prevent crowdiness in the supermarket. The mean value analysis describedin Section 2.4.1 can now be applied to measure the performance of the traditional supermarketin this computational example. We are interested in the expected sojourn time and the expectedqueue length. These measures can be obtained using the Pollaczek-Khintchine formulas fromSection 2.4.1. The expected queue length of the traditional supermarket is displayed as a function
CHAPTER 2. MODELING THE TRADITIONAL SUPERMARKET 13
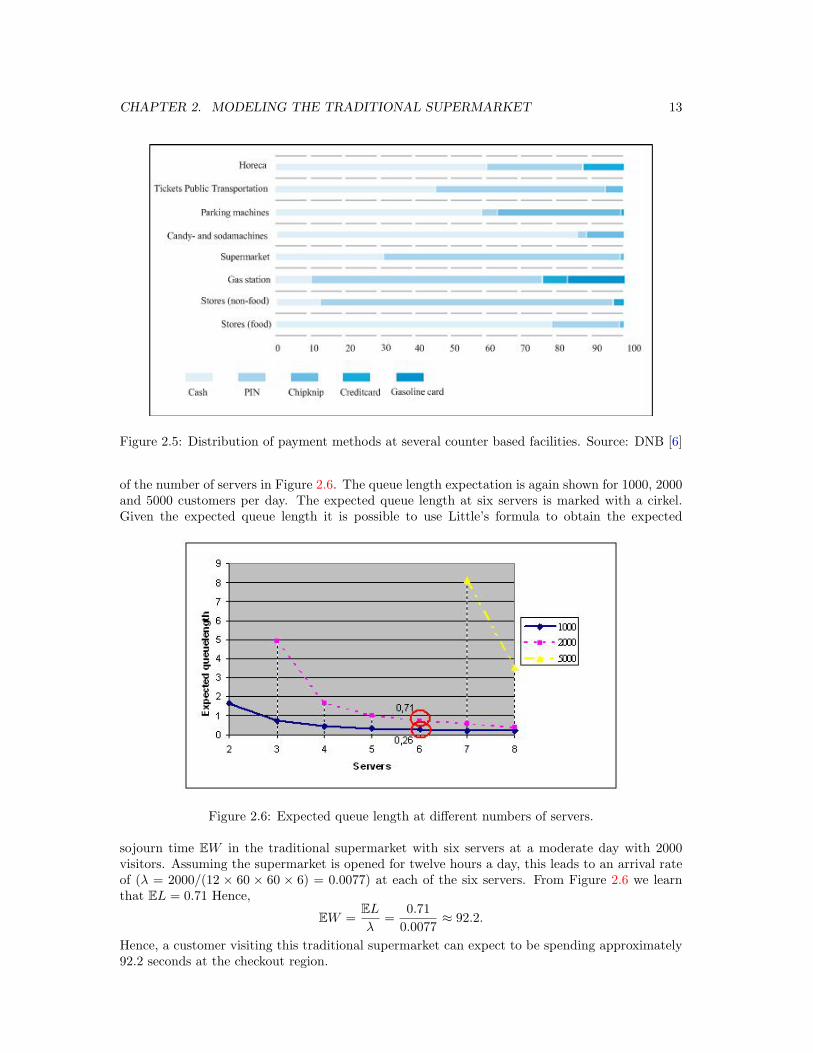
Figure 2.5: Distribution of payment methods at several counter based facilities. Source: DNB [6]
of the number of servers in Figure 2.6. The queue length expectation is again shown for 1000, 2000and 5000 customers per day. The expected queue length at six servers is marked with a cirkel.Given the expected queue length it is possible to use Little’s formula to obtain the expected
Figure 2.6: Expected queue length at different numbers of servers.
sojourn time EW in the traditional supermarket with six servers at a moderate day with 2000visitors. Assuming the supermarket is opened for twelve hours a day, this leads to an arrival rateof (λ = 2000/(12 × 60 × 60 × 6) = 0.0077) at each of the six servers. From Figure 2.6 we learnthat EL = 0.71 Hence,
EW =EL
λ=
0.710.0077
≈ 92.2.
Hence, a customer visiting this traditional supermarket can expect to be spending approximately92.2 seconds at the checkout region.
Chapter 3
Self checkout at C1000
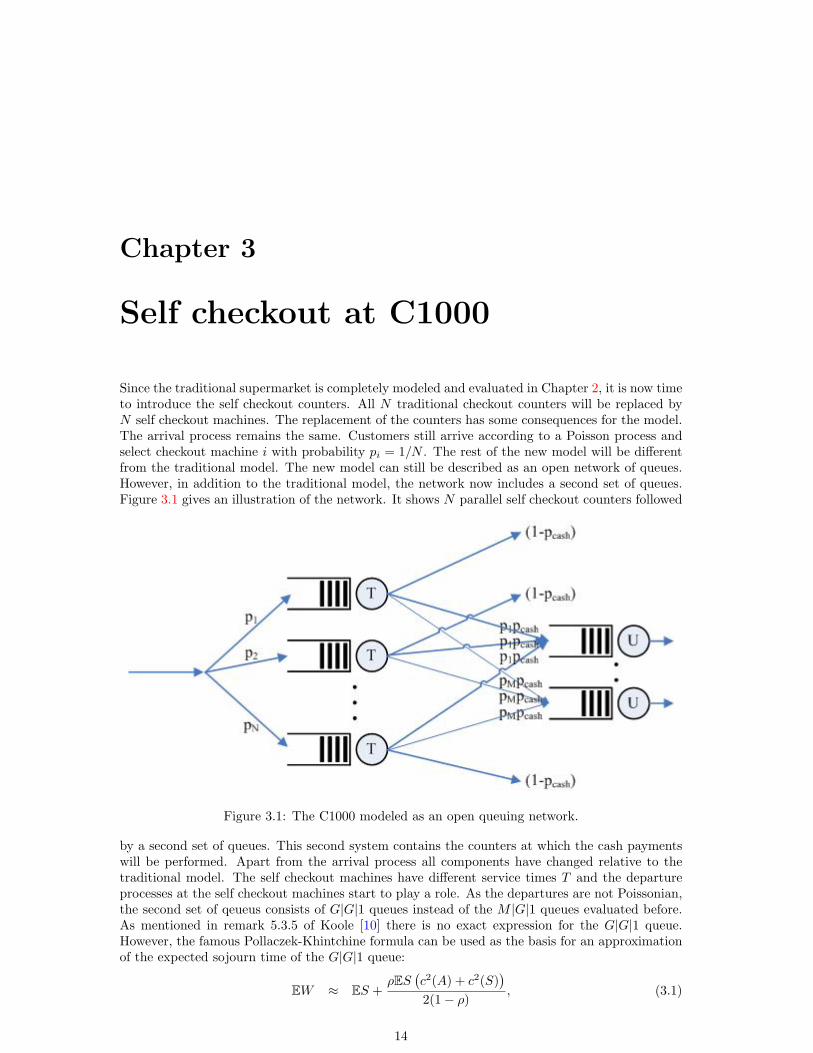
Since the traditional supermarket is completely modeled and evaluated in Chapter 2, it is now timeto introduce the self checkout counters. All N traditional checkout counters will be replaced byN self checkout machines. The replacement of the counters has some consequences for the model.The arrival process remains the same. Customers still arrive according to a Poisson process andselect checkout machine i with probability pi = 1/N . The rest of the new model will be differentfrom the traditional model. The new model can still be described as an open network of queues.However, in addition to the traditional model, the network now includes a second set of queues.Figure 3.1 gives an illustration of the network. It shows N parallel self checkout counters followed
Figure 3.1: The C1000 modeled as an open queuing network.
by a second set of queues. This second system contains the counters at which the cash paymentswill be performed. Apart from the arrival process all components have changed relative to thetraditional model. The self checkout machines have different service times T and the departureprocesses at the self checkout machines start to play a role. As the departures are not Poissonian,the second set of qeueus consists of G|G|1 queues instead of the M |G|1 queues evaluated before.As mentioned in remark 5.3.5 of Koole [10] there is no exact expression for the G|G|1 queue.However, the famous Pollaczek-Khintchine formula can be used as the basis for an approximationof the expected sojourn time of the G|G|1 queue:
EW ≈ ES +ρES
(c2(A) + c2(S)
)2(1− ρ)
, (3.1)
14
CHAPTER 3. SELF CHECKOUT AT C1000 15
where S is the service time, ρ is the load on the G|G|1 queues, A is the expected inter arrival time,and c2(x) is the squared coefficient of variation of x. In order to perform a mean value analysis weneed information about the departure process of the self checkout machines and the service timesat the cash payment counters. All the desired information will be provided in the next sections.
3.1 Service times at the self checkout machines
Two different routines can be performed at a self checkout machine. With probability pcash thecustomer is paying cash. In that case the only action performed at the self checkout machine isscanning the products. Because of the computational advantages we again assume an exponen-tially distributed scanning time with expectation βscan. The second routine will take place withprobability ppin = 1 − pcash. In this case the customer is paying electronically. This methodof payment is available at the self checkout machines. The service time at the machines in thisscenario consists of scanning the products and paying electronically. We assume that a customeris able to scan and pay the products just as fast as the cashier in the traditional system. Theresulting overall service time at the self checkout machines is assumed to be exponentially dis-tributed with expectation βscan, with probability pcash, whereas the expectation is βpin, withprobability ppin = 1 − pcash. Hence, the service times T at the self checkout machines are againhyper exponentially distributed.
3.2 Departure process at the self checkout machines
As discussed in the previous section, the service times of the self checkout machines are not justexponentially distributed. The choice for the more realistic hyper exponential distribution hasconsequences for the departure processes of each of the servers. In case of exponential distributionsthe departure processes would simply be new Poisson processes. The departure processes in theC1000 model are somewhat more complicated. The output of the parallel M |G|1 queues is theinput for the cash counters. As mentioned before we need some characteristics of the departureprocess to perform a mean value analysis. First we need the expected inter departure times E(D)or the departure rate λi of self checkout machine i. In equilibrium the outflow of a server equalsthe inflow and hence, λi = λ/N . Furthermore we need the squared coefficient of variation c2(D) ofthe departure process. In chapter 5 of Graves, Rinnooy Kan, and Zipkin [9] we find the followingapproximation:
c2(D) = (1− ρ2)c2(A) + ρ2c2(S), (3.2)
where ρ is the load on the server, A is the stochastic variable denoting the inter arrival time,and S denotes the hyper exponentially distributed service time. The coefficient of variation of aprobability distribution is defined as the ratio of the standard deviation to the mean: cs = σS/ES.The inter arrival times A at the self checkout machines are exponentially distributed and thusc2(A) = 1 (see chapter 7 of Thijms and Kalvelagen [24]). The first and second moment of theexpectation of the hyper exponential distribution are known (see (2.1) and (2.2)). Hence, by usingthe relation σ2
S = ES2− (ES)2 (see chapter 4 of Ross [13]) in combination with (2.1) and (2.2) wederive c2(S):
c2(S) =σ2
S
E2S=
2µ2
pinppin + 2
µ2scan
pcash −(
ppin
µpin+ pcash
µscan
)2
(ppin
µpin+ pcash
µscan
)2
=2
µ2pin
ppin + 2µ2
scanpcash(
ppin
µpin+ pcash
µscan
)2 − 1. (3.3)
CHAPTER 3. SELF CHECKOUT AT C1000 16
Using Equation (3.3) in Equation (3.2), and using that the squared coefficient of variation of aPoisson arrival process equals 1, the following expression for c2(D) yields:
c2(D) = (1− ρ2) + ρ2
2µ2
pinppin + 2
µ2scan
pcash(ppin
µpin+ pcash
µscan
)2 − 1
. (3.4)
Using that the load ρ on the self checkout machine equals
ρ = λES = λ
(ppin
µpin+
pcash
µscan
), (3.5)
we can write Equation (3.4) as
c2(D) = 1− 2(
λ
(ppin
µpin+
pcash
µscan
))2
+ λ2
2µ2
pinppin + 2
µ2scan
pcash(ppin
µpin+ pcash
µscan
)2 (3.6)
3.3 Arrival processes at the cash payment counters
In the previous section we derived an expression for the squared coefficient of variation of the depar-ture process at a self checkout machine. The next step is to determine the desired characteristicsof the arrival processes at the cash counters. The model of the C1000 supermarket is a networkof G|G|1 queues. The departure process at each of the self checkout counters is split into M + 1flows: one flow to each of the M cash payment counters and one flow leaving the system. Theoverall arrival process at cash counter j consists of the combination of all flows departing fromthe N self checkout machines that arrive at counter j. Denote by C2
ij the squared coefficient ofvariation of the flow leading from self checkout machine i to cash payment counter j. Zijm [30]gives the following expression for the squared coefficient of variation of the flow from i to j.
C2ij = pijc
2(Di) + 1− pij , (3.7)
where c2(Di) denotes the squared coefficient of variation of the departure process at self-checkoutmachine i. This coefficient equals the result of equation (3.6) for all i, since all self-checkoutmachines are identical. Furthermore, a customer moves from self-checkout machine i to cashcounter j with probability pij , where pi0 = ppin is the probability that the customer leaves thesystem. The cash counters are assumed to be identical and hence, the probability that a customerchooses cash counter j equals pcash/M for all j = 1, . . . ,M . Hence,
C2ij =
pcash
Mc2(Di) + 1− pcash
M. (3.8)
The final step toward the squared coefficient of variation of the arrival processes is combiningthe flows arriving at the cash counter. Many research has been performed on approximations forcombined flows. Here we will use the approximation of Whitt [28]:
c2(Aj) = wj
N∑i=0
QijC2ij + 1− wj , j = 1, . . . ,M, (3.9)
where
wj =1
1 + 4(1− ρj)2(vj − 1), j = 1, . . . ,M, (3.10)
and
vj =
(N∑
i=0
Q2ij
)−1
, j = 1, . . . ,M. (3.11)

CHAPTER 3. SELF CHECKOUT AT C1000 17
Hence, required input for the calculation of the squared coefficients of variation are the values ofQij , denoting the fraction of the arrival flow at cash counter j that originates from self checkoutmachine i. Because of the assumption of similar cash counters this value equals 1/N for eachcounter. Hence,
vj =
(N∑
i=0
(1N
)2)−1
=(
N
N2
)−1
=N2
N= N, (3.12)
and
wj =1
1 + 4(1− ρj)2(N − 1), j = 1, . . . ,M. (3.13)
Hence,(3.9) can be written as
c2(Aj) =1
1 + 4(1− ρj)2(N − 1)
N∑i=0
C2ij
N+ 1− 1
1 + 4(1− ρj)2(N − 1), j = 1, . . . ,M,(3.14)
With Equation (3.14) the squared coefficients of variation c2(A) of the arrival processes at thecash counters have been fully defined. Now, before we can apply Equation (3.1) to calculate theexpected sojourn time, we need one more ingredient: the load on the cash payment counters.
In order to calculate the load on the cash checkout counters, we use a characteristic of a queuingsystem in equilibrium: The inflow of a server equals the outflow. Hence, the outflow λi at selfcheckout counter i equals λ/N . Each outflow is split up into two parts. With probability ppin acustomer leaves the system. Let λi0 denote the flow leading from self checkout counter i out ofthe system. Then λi0 = ppin
λN . The remainder of the flow from self checkout counter i continues
toward the cash checkout region. Since each cash checkout is assumed to be identical the flow λij
from self checkout i to cash counter j equals pcashλN
1M for all i, j.
The final ingredient for the calculation of the load on the cash counters is the expected servicetime. This is relatively easy to define. Service at the cash counters only consists of one possibleaction: handling the payment. The service times U at the cash counters are assumed to beexponentially distributed with mean βpay. The load ρ on server j can be defined as λjESj =N · λijESj . Hence,
ρj =λpcash
Mβpay, for all j. (3.15)
Now, using all ingredients gathered in this chapter, we can summarize the expression for theexpected sojourn time EWcash at the cash checkout area as follows:
EWcash ≈ ES +ρES
(c2(A) + c2(S)
)2(1− ρ)
, (3.16)
ES = βpay, (3.17)
ρ =λpcash
Mβpay, (3.18)
c2(Aj) =1
1 + 4(1− ρ)2(N − 1)
N∑i=0
C2ij
N+ 1− 1
1 + 4(1− ρ)2(N − 1), (3.19)
C2ij =
pcash
Mc2(Di) + 1− pcash
M, for all j, (3.20)
c2(Di) = 1− 2(
λ
(ppin
µpin+
pcash
µscan
))2
+ λ2
2µ2
pinppin + 2
µ2scan
pcash(ppin
µpin+ pcash
µscan
)2 for all i, (3.21)
c2(S) = 1 (exponential distribution) (3.22)

CHAPTER 3. SELF CHECKOUT AT C1000 18
3.4 Interpreting the C1000 model
As mentioned before the model of the C1000 configuration can be analyzed like an open queuingnetwork. The first part of the network consists of N parallel M |G|1 queues with a Poisson arrivalprocess and hyper exponential service times. The second part consists of M parallel G|M |1 queueswith exponential service times and an arrival process defined by the departure processes of theM |G|1 queues. Based on these observations we will compare the performance of the new modelwith the traditional model through mean value analysis. The expected sojourn time in the newsupermarket can be computed as follows.
Let Ws denote the sojourn time at the self checkout machines and let Wc be the sojourn timeat the cash counters. With probability ppin the customer only uses the self checkout machines.With probability pcash = 1− ppin the customer has to visit a cash counter. The expected sojourntime EW of the new supermarket can be expressed as follows:
EW = ppin × EWs + pcash × (EWc + EWs) (3.23)
3.5 Computational example
In the previous sections we have gathered all necessary ingredients for the mean value analysisof the new system. In this section each component will be computed separately before they willbe combined into an overall expected sojourn time. The first component that will be dealt withis the expected sojourn time at the self checkout desks EWs. This expectation can be computedrather straightforward from the Pollaczek-Khintchine formula.
ELs = λES +λ2ES2
2(1− λES)(3.24)
= λ
(ppin
µpin+
pcash
µscan
)+
(λ/N)2(
ppin
µ2pin
+ pcash
µ2scan
)2(1− (λ/N)
(ppin
µpin+ pcash
µscan
)) , (3.25)
where µscan = 1/βscan. For computational efforts we assume that βscan equals 30 seconds, whichis just the original βcash minus the cash transaction time of 19 seconds as described in the reportfrom DNB [6]. The number of self checkout machines N is assumed to be 6, being the optimalnumber of servers found in Section 2.5. The arrival rate is again chosen to represent a moderateday with a total of 2000 customers arriving. With all these parameters set we find as averagequeue length ELs = 0.60. Hence, using Little’s law again, we find that
EWs =ELs
λ=
0.600.0077
= 77.9. (3.26)
From this result we can already draw the first conclusion. If a customer prefers to pay elec-tronically, he or she benefits from the self checkout region. The checkout procedure takes placeat the self checkout counters only. Hence, the expected sojourn time in the checkout area equalsEWs. Compared to the traditional supermarket, the sojourn time decreases by 92.2− 77.9 = 14.3seconds.
Now, using Equation 3.16, we learn that
EWc ≈ ES +ρES
(c2(A) + c2(S)
)2(1− ρ)
= 19.3 seconds,
and thusEW = ppin · 77.9 + pcash · (77.9 + 19.3) = 83.4 seconds,
almost 9 seconds shorter than in the traditional supermarket.From this computational example we can conclude that the sojourn time in the checkout area
decreases due to the introduction of the self checkout counters. Especially when a customer payselectronically, the new checkout methodology results in a strong reduction of the sojourn time.

Chapter 4
Pro’s and cons of self scanning
In the previous chapters we discussed the theoretical consequences of self checkout systems. Theanalysis of the different queuing models pointed out that self checkout counters can decreasesojourn times and shorten the queue lengths. Theoretically the new approach seems to be anoutcome for all the annoyance a customer runs into when visiting a supermarket.
After years of pilots and test phases, several supermarkets have now started to enroll the selfcheckout concept. Time to test whether the theoretical conclusions also hold in practice. In thischapter we discuss several practical consequences of the self checkout system. We address the con-sequences for three different groups of stakeholders: the customers, the supermarket management,and the employees or cashiers.
4.1 Customer perception
An important measure for the self checkout systems is the way customers experience the newshopping methodology. Many proponents of the system propagated with the advantages the selfcheckout counters have for the customers. Queues would decrease to a minimum, sojourn timeswould be shortened and the increased amount of responsibility would give the customer an extrafeeling of freedom.
Interviews with customers and responses on internet forums indeed proved several advantagesof the new system. Besides the advantages mentioned before, several other issues appeared toplay a role. An important observation was that many customers appreciated the fact that the selfcheckout counters are always open. Customers are no longer dependent of the number of cashiersavailable.
The lack of a cashier results in both positive and negative reactions. An interesting observationis the fact that customers appeared to appreciate the responsibility over their own products.Several customers stated that they often denounced the way a cashier treated the products in theold situation. Hasty operations often caused food to be crushed and eggs to be broken. Now thatthe customer is responsible for its own goods, no angry looks have to be exchanged because ofsome dispute about the way products are treated.
The overall customer perception is positive. People using the machines even seem to enjoyit. Some minor disadvantages can be mentioned. There are some arguments against the lack ofcashiers. First there is the fact that the machines do not work flawlessly. If the scanner declines aproduct, or refuses service in some other way, a cashier or service employee remains indispensable.The way employees respond to problems is not always experienced as good and fast.
Besides the sometimes questionable response to problems, there is the social aspect of thepresence of a cashier. Several customers mentioned the fact that shopping should be a socialevent. The cashier is often referred to as a nice opportunity for some social interaction. Criticspretend that the self checkout machines cause people to drift further apart. The comparison withshopping on line is often made. People no longer meet other people while obtaining their daily
19

CHAPTER 4. PRO’S AND CONS OF SELF SCANNING 20
needing.Another minor shortcoming of the new methodology is the fact that there is no possibility
(yet) to withdraw additional money at the automatic counters. For this purpose the person eitherhas to line up at the traditional counter or has to pay a visit to the cash dispenser around thecorner.
Some customers have their doubts about the system being theft-proof. Several people men-tioned their concern about the relative ease at which products can be ‘forgotten’. Supermarketchain Albert-Heijn responded to this concern with the announcement that anomalies in the advan-tage of the customer probably evened out against the mistakes of the customer in the company’sadvantage. Besides, the regular random checks discourage the customer to restrain any products.These checks are not experienced as annoying. It only happens once in a while and the disturbancedoes not even out against the everlasting queues at the traditional checkout counters.
4.2 Added value for the supermarket
Implementing a self checkout area is an expensive operation. It requires an investment of some-where between 75,000 and 100,000 euro’s. An article on Distrifood [8], an independent news sitefor supermarkets, mentions that self scanning is three times as expensive as the traditional methodper checkout. Besides, several tests pointed out that the large investment needed for a self check-out zone is only effective with at least 6 checkouts, and if more than 40 percent of all transactionsis actually being performed by means of the new checkout method.
The checkout systems initially leave the supermarket with a huge amount of costs. However,they are not just a source of expenses. The supermarkets also benefit from the machines by meansof increasing efficiency when it comes to staffing requirements. The new system makes cashiersredundant which causes the staffing costs to decrease. Spokesmen of the major supermarketsdismiss this argument by stating that the cashiers will not be replaced, but rather attain a newrole as service provider. However, once the customer is getting used to the new system, service willbe required less frequent, and many cashiers will become redundant after all. Staffing requirementsdecrease and the supermarket saves costs.
An interesting observation is the fact that the cost arguments mentioned above do not seem tobe the main discussion when it comes to the decision whether to implement the self checkout serviceor not. Large players in the field, like Albert Heijn and C1000, dismiss this kind of argumentsby stating that the costs do not compensate for the many advantages the new system provides.The supermarkets view the self checkout area as an extra quality of service for the customer.The customer perception described in the previous section appears to be a strong argument forC1000 and its competitors to take the costs for granted and to use the system as a means to becompetitive in the area of quality of service rather than in the area of costs.
4.3 Cashiers: the victims
As mentioned in the previous section, cashiers seem to become redundant if the self checkoutrevolution continues. Despite of the promises of employers that cashiers will only attain a new role,we believe that on the long run the cashiers may be considered as the victims of this innovation.Although staffed checkouts will probably exist adjacent to the new system for a while, the staffingrequirements will decrease. Especially as the customers get more and more used to the newsituation, and cashiers will no longer be needed as service providers.
Chapter 5
Alternatives
5.1 The hand scanner of Albert Heijn
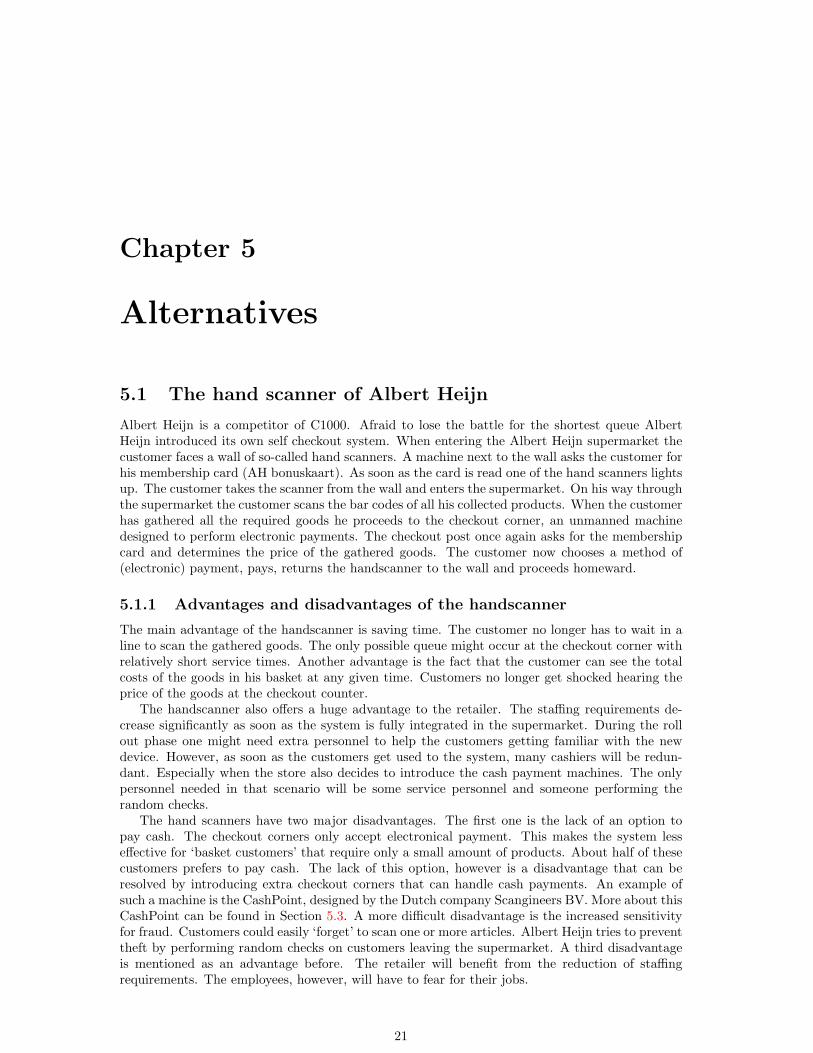
Albert Heijn is a competitor of C1000. Afraid to lose the battle for the shortest queue AlbertHeijn introduced its own self checkout system. When entering the Albert Heijn supermarket thecustomer faces a wall of so-called hand scanners. A machine next to the wall asks the customer forhis membership card (AH bonuskaart). As soon as the card is read one of the hand scanners lightsup. The customer takes the scanner from the wall and enters the supermarket. On his way throughthe supermarket the customer scans the bar codes of all his collected products. When the customerhas gathered all the required goods he proceeds to the checkout corner, an unmanned machinedesigned to perform electronic payments. The checkout post once again asks for the membershipcard and determines the price of the gathered goods. The customer now chooses a method of(electronic) payment, pays, returns the handscanner to the wall and proceeds homeward.
5.1.1 Advantages and disadvantages of the handscanner
The main advantage of the handscanner is saving time. The customer no longer has to wait in aline to scan the gathered goods. The only possible queue might occur at the checkout corner withrelatively short service times. Another advantage is the fact that the customer can see the totalcosts of the goods in his basket at any given time. Customers no longer get shocked hearing theprice of the goods at the checkout counter.
The handscanner also offers a huge advantage to the retailer. The staffing requirements de-crease significantly as soon as the system is fully integrated in the supermarket. During the rollout phase one might need extra personnel to help the customers getting familiar with the newdevice. However, as soon as the customers get used to the system, many cashiers will be redun-dant. Especially when the store also decides to introduce the cash payment machines. The onlypersonnel needed in that scenario will be some service personnel and someone performing therandom checks.
The hand scanners have two major disadvantages. The first one is the lack of an option topay cash. The checkout corners only accept electronical payment. This makes the system lesseffective for ‘basket customers’ that require only a small amount of products. About half of thesecustomers prefers to pay cash. The lack of this option, however is a disadvantage that can beresolved by introducing extra checkout corners that can handle cash payments. An example ofsuch a machine is the CashPoint, designed by the Dutch company Scangineers BV. More about thisCashPoint can be found in Section 5.3. A more difficult disadvantage is the increased sensitivityfor fraud. Customers could easily ‘forget’ to scan one or more articles. Albert Heijn tries to preventtheft by performing random checks on customers leaving the supermarket. A third disadvantageis mentioned as an advantage before. The retailer will benefit from the reduction of staffingrequirements. The employees, however, will have to fear for their jobs.
21

CHAPTER 5. ALTERNATIVES 22
Figure 5.1: The hand scanners of Albert Heijn
5.2 Radio Frequency Identification
A new and upcoming technique that could further resolve the queuing problem in the supermarketis Radio Frequency Identification, or RFID. Dekker [7] explains RFID as a small chip that cantransmit a radio signal containing an identification code. A commonly used standard for theseidentification codes is the Electronic Product Code (EPC). The number transmitted by the RFIDtag can be looked up in a central EPC database. This database contains the meaning of thetransmitted number and links the number to products, producers, serial numbers etcetera. Thereare two types of RFID tags. Active tags have their own power source to generate their outgoingsignal. These active tags have a large range and are very reliable. Unfortunately active tags arenot very well suited for the foodstuffs branch. At present the smallest active RFID tags have aboutthe size of a cold capsule and cost a few dollars. It is simply too expensive to fit all products withan RFID tag. More interesting for the supermarket is the passive RFID tag. The passive versionhas no power source of its own. The power needed to transmit the identification code is providedby the RFID receiver. The incoming radio frequency signal provides just enough power for thetag to transmit a response. The lack of an on board power supply means that the device can bevery small. In February 2007 Hitachi created an RFID device measuring 0.05x0.05mm, and thinenough to be embedded in a sheet of paper. A pioneering supermarket in the area of RFID isWalMart. They were the first to introduce the technique in 7 stores throughout Texas. WalMartuses RFID tags that cost about $0,05 a piece and have the size of a postage stamp.
5.2.1 Advantages and disadvantages of RFID
The challenge for the RFID tag in the supermarket branch is to compete with the traditionalbar code. The RFID tag has some interesting characteristics that the bar code lacks. The RFIDtags work at a distance. The consequence is that the scanner or receiver does not have to beaimed at the code or tag. RFID technology enables tag reading from a greater distance, even inharsh environments. The greatest ambition of the supermarket branch is to be able to identify allproducts in a shopping cart in a small time instance. This would yield a significant decrease inwaiting times at the checkout counters since the products no longer have to be scanned one by one.Another advantage is the storage capacity of the RFID tag. The identification code transmittedby the RFID tag can be much longer than the bar code. This creates a larger number of availablecodes and makes it possible to track each product individually. The bar code only identifies thetype of product.
The RFID tag could be a very interesting technology for all sorts of applications. However,the technology is still rather immature. The signals transmitted by the tags are sensitive toattenuation. The product’s packaging reduces the amplitude and intensity of the signal. Suppliersof WalMart in the United States have tried to successfully introduce the RFID tags in theirproduction lines for several years now. However, the technology did not work as good as expected.

CHAPTER 5. ALTERNATIVES 23
In practice, the successful read rates currently run only 80%1. The suppliers faced another difficultywith the introduction of RFID. The new technology is relatively expensive and especially smallsuppliers find it hard to create return on investment (ROI). Only very large companies such asProcter&Gamble are able to benefit from the RFID technology. Paul Fox, a spokesman for P&GGlobal Operations said at computerworld.com [4]: “We have seen significant benefits within ourown four walls. It’s helping streamline processes and making them more efficient. We know whatwe’re about to ship, and there are no errors and no picking the wrong case and no miscounting”.Large suppliers like Procter&Gamble are able to create ROI through large volume transactions.Small suppliers do not have that luxury and face the relatively high costs of the new technology.
5.2.2 C1000 and RFID
As mentioned in the 2004 annual report of schuitema NV [21], C1000 is very interested in RFIDtechnology. The supermarket likes the possibility of driving a shopping cart along an RFIDreceiver to scan all products at once. Although the technology is still rather immature, SchuitemaNV sees great opportunities in RFID and is in several ways involved with the development of thetechnology. Schuitema’s chairman of the executive board Jan Brouwer is also chairman of the Taskforce RFID, an initiative of Centraal Bureau Levensmiddelenhandel (CBL, the Dutch authorityof Food retail) and the Dutch Federation of Foodstuffs Industry (FNLI). Moreover, SchuitemaNV cooperated with Accenture, Hewlett Packard, KPN, Philips, Rabobank en SAP to set up theRFID Foundation in the Netherlands. Goal of this foundation is to join forces and knowledge inthe area of RFID to perform research and stimulate its applications. At present C1000 has made afirst step toward implementation of RFID by starting a test in the distribution center in Woerden.Containers are equipped with passive tags in order to identify and track them.
5.3 Automatic cash payments
Automatic cash payment is not really an alternative for the self checkout machines. It is actuallyan extension to the system. Scangineers BV, a Dutch company producing self checkout machines,mentions in its brochure [14] the possibility to integrate a so-called CashPoint in the self checkoutregion. The CashPoint enables the customer to perform cash payments as well as electronicpayments. The main advantage of this extension is further reduction of staffing requirements.
1The test phase of RFID at WalMart turned out that on average 20% of the tags do not function properly

Chapter 6
Conclusions
Throughout the years the foodstuffs branch has evolved from the traditional grocery store to hightech supermarkets with self checkout machines. During this process, the queues at the checkoutdesks have also experienced some radical changes. In this thesis we discussed both theoretical andpractical consequences of the introduction of self checkout counters.
In order to perform theoretical analysis on the impact of self checkout systems we modeled boththe traditional supermarket and the new supermarket with a self checkout region. The traditionalsupermarket can be modeled as a set of N independent M |G|1 queues. The arrival process ateach of these queues can be described by means of Poisson processes. Service times are assumedto be exponentially distributed.
The M |G|1 queue provides us with several opportunities to measure the performance of thetraditional supermarket. Using Little’s law and the Pollaczek-Khintchine formula we were ableto perform a mean value analysis. Moreover, we were able to approximate the distribution of thequeue length. The mean value analysis and the approximation of the queue length distributiongave us the opportunity to calculate several measures for an artificial traditional supermarket.Interesting statistics can be derived such as the probability that more than k customers are in thequeue, and the expected sojourn time in the system.
The model of the traditional supermarket can be used as a reference when evaluating the newsystem with self checkout counters. In order to do so, we also modeled the new situation. Thismodel is slightly more complicated. The new model can be described as an open network ofqueues, with two sets of queues. The first set consists of the self checkout counters, whereas thesecond set consists of the cash payment counters for customers who do not use the possibility ofpaying electronically. Due to this new situation we can no longer use the interesting properties ofthe M |G|1 queues. The arrival process at the second set of queues (the cash payment counters)depends on the departure process at the self checkout counters, which is not Poissonian. Aconsequence of this fact is that the second set of queues consists of G|G|1 queues instead of M |G|1queues.
There is no exact expression for the sojourn time of the G|G|1 queue. However, using thePollaczek-Khintchine formula, we managed to derive an approximation for the expected sojourntime in the queue. Furthermore, we used ideas of Graves, Rinnooy Kan, and Zipkin [9], Thijms andKalvelagen [24], and Zijm [30] to derive several statistical properties of the new queuing system.
The models of the traditional supermarket and the new self checkout supermarket providedus with tools to make a theoretical comparison between both queuing mechanisms. The mainconclusion of this comparison is the fact that the average sojourn time in the queuing systemdecreases because of the introduction of self checkout counters. The average sojourn time isdecreased from 92 seconds to 83 seconds by means of the self checkout area. This is a reduction ofapproximately 10%. For an electronically paying customer the reduction in sojourn time is evenlarger (15%).
The theoretical results obtained by means of the models are based on several assumptions.Judging the new queuing system merely on the results of the model, is therefore rather naive. After
24

CHAPTER 6. CONCLUSIONS 25
years of pilots and test phases, several supermarkets have now started to enroll the self checkoutconcept. Hence, experience from practice can support the theoretical comparison. Findings ofthree different groups of stakeholders gave us a good impression of the true impact of the selfcheckout regions.
An important group of stakeholders is formed by the customers of the supermarket. Thecustomers point of view revealed the following advantages:
• sojourn times decrease;
• self checkouts give the customers more responsibility leading to a feeling of freedom;
• self checkout counters are always open;
• customers are responsible for their own goods: no dispute about how to treat the products.
and the following disadvantages:
• self checkouts eliminate the social interaction with a cashier;
• machines do not work flawlessly;
• there is no possibility to withdraw cash at the self checkout counters;
• there are doubts about the system being theft proof.
A second group of stakeholders is formed by the supermarkets and their managers. Imple-menting a self checkout area is an expensive operation. Although costs can be saved throughdecreasing staffing requirements, self checkout areas still seem to be more expensive than thetraditional system. However, the cost arguments do not seem to be the main discussion when itcomes to the decision whether to implement the self checkout service or not. Large players in thefield, such as Albert Heijn and C1000, dismiss this kind of arguments by stating that the costs donot compensate for the many advantages the new system provides. The supermarkets view theself checkout area as an extra quality of service for the customer. Supermarkets use the system asa means to be competitive in the area of quality of service rather than in the area of costs.
The last group of stakeholders is the group we refer to as the victims of the self checkoutsystem. The employees (cashiers) become redundant because of the unmanned checkout machines.Although the staffed checkout counters will probably exist adjacent to the new system for a while,the staffing requirements will decrease. Especially as customers get more and more used to thenew situation, and cashiers will no longer be needed as service providers.
Besides the self checkout machines of C1000, there exist several alternative methodologies ofself checkout systems. Albert Heijn seems to be outrunning the competitors with its handscanner.This system has been successfully tested in several Albert Heijn stores throughout the country.Besides the handscanner of Albert Heijn there exists a revolutionary system called Radio Fre-quency Identification (RFID). However, this technique is still in a rather premature stadium ofdevelopment. High costs and frequent errors still form obstacles for comprehensive implementationof this new system.
Overall we conclude that self checkout areas offer great advantages to most stakeholders. Cus-tomer perception is the most important driver for implementing the new system. C1000 is not theonly player in the field of self checkout systems, and several alternatives are competing for victoryin the revolution of the checkout area.

Bibliography
[1] Albrecht: Supermarket Cards: The Tip of the Retail Surveillance Iceberg,Denver University Law Review, Volume 79, Issue 4, pp. 534-539 and 558-565(2002)
[2] Bose: An introduction to queuing systems,Springer: ISBN 0306467348(2002)
[3] Clerx: Middenstandsbeleid, realiteit of leuze,Politieke Opstellen 8, Centrum voor Parlementaire Geschiedenis, Radboud UniversiteitNijmegen(1988)
[4] Computerworld: Procter&Gamble: Wal-Mart RFID Effort Effective,Computerworld, edition February 26, 2007http://www.computerworld.com/action/article.do?command=viewArticleBasic&articleId=284160(2007)
[5] De Jager: Albert Heijn. Memoires van een optimist,De Prom, Amsterdam: ISBN 9057132737(1997)
[6] De Nederlandse Bank: Hoe consumenten betaalmiddelen beleven: een publieksmeting,DNB Kwartaalbericht 2005(2005)
[7] Dekker: FAQ: Radio frequency identification,Emerce, edition 38, May 21(2004)
[8] Distrifood.nl: AH en C1000: zelfscan is service,http://www.distrifood.nl/bedrijfsvoering/id540-49756/ah en c1000 zelfscan is service.html(2007)
[9] Graves, Rinnooy Kan, and Zipkin: Logistics of Production and Inventory,Handbooks in Operations Research and Management Science, Vol. 4: Logistics of Productionand Inventory.(1993)
[10] Koole: Optimization of Business Processes: An Introduction to Applied Stochastic Modeling,version of April 4, 2007(2007)
[11] Latouche and Ramaswami: Introduction to Matrix Analytic Methods in Stochastic Modelling,1st edition. Chapter 2: PH Distributions(1999)
26
BIBLIOGRAPHY 27
[12] Rijkens: Handel en Wandel, nagelaten gedenkschriften 1888-1965,Ad Donker, Rotterdam(1965)
[13] Ross: A first course in probability,6th edition, Prentice Hall: ISBN 0130338516(2001)
[14] Scangineers BV: ScanPoint modulair zelfscan concept v0.1,Brochure Scangineers September 2005(2005)
[15] Schrover: De Fiva als een bijzondere variant van collectieve verticale prijsbinding, 1928-1975,NEHA jaarboek 1996, pp 292-329(1996)
[16] Schuitema nieuwsarchief: Consumenten rekenen zelf boodschappen af,http://www.schuitema.nl/files/financieel/2002/magaz-fjv-2002 04-09.pdf(2002)
[17] Schuitema nieuwsarchief: Proef met zelfscankassa’s wordt uitgebreid,http://www.schuitema.com/default.asp?action=KlapUitMenu&MenuItemid=104&SubMenuItemid=110&archief=true&nieuwsid=105(2003)
[18] Schuitema nieuwsarchief: Schuitema in platform RFID Nederland,http://www.schuitema.nl/default.asp?action=KlapUitMenu&MenuItemid=104&SubMenuItemid=110&archief=true&nieuwsid=142(2004)
[19] Schuitema NV: Inspelen op veranderend consumentengedrag,Jaarverslag 2002(2002)
[20] Schuitema NV: Werken aan de winkel,Jaarverslag 2003(2003)
[21] Schuitema NV: Kosten verlagen, efficiency verbeteren,Jaarverslag 2004(2004)
[22] Schuitema.nl: C1000/innovaties: zelfscankassa’s,http://www.schuitema.nl/default.asp?action=ShowMenuHorizontaal&MenuItemID=65&SubMenuItemid=166&ContentID=167
[23] Thijms: Operationele Analyse, een inleiding in modellen en methoden,Epsilon Uitgaven Utrecht, ISBN 9050410755(2002)
[24] Thijms and Kalvelagen: Modelbouw in de operations research,Academic Service Schoonhoven, ISBN 9052611157(1994)
[25] Van der Velden: Ondernemen in Detailhandel 2002, sectorscoop,EIM Zoetermeer(2002)

BIBLIOGRAPHY 28
[26] Virtamo: Queueing Theory / Poisson process,Lecture notes October 2005http://www.netlab.hut.fi/opetus/s383143/kalvot/E poisson.pdf(2005)
[27] Virtamo: Queueing Theory / The M/G/1 queue,Lecture notes October 2005http://www.netlab.hut.fi/opetus/s383143/kalvot/E mg1jono.pdf(2005)
[28] Whitt:Approximating a point process by a renewal process. two basic methods,Operations Research, volume 30, number 1(1982)
[29] Yan and Veeraraghavan: Networks of queues,lecture notes April 19, 2004http://www.ece.virginia.edu/∼mv/edu/715/lectures/QNet.pdf(2004)
[30] Zijm: Manufacturing and logistic systems analysis, planning and control,Dictation(2003)