The Return of Volatility: An Update on Equity Markets · Susan Blanchard, CFA Lead Portfolio...
30
The Return of Volatility: An Update on Equity Markets
Transcript of The Return of Volatility: An Update on Equity Markets · Susan Blanchard, CFA Lead Portfolio...
The Return of Volatility: An Update on Equity Markets
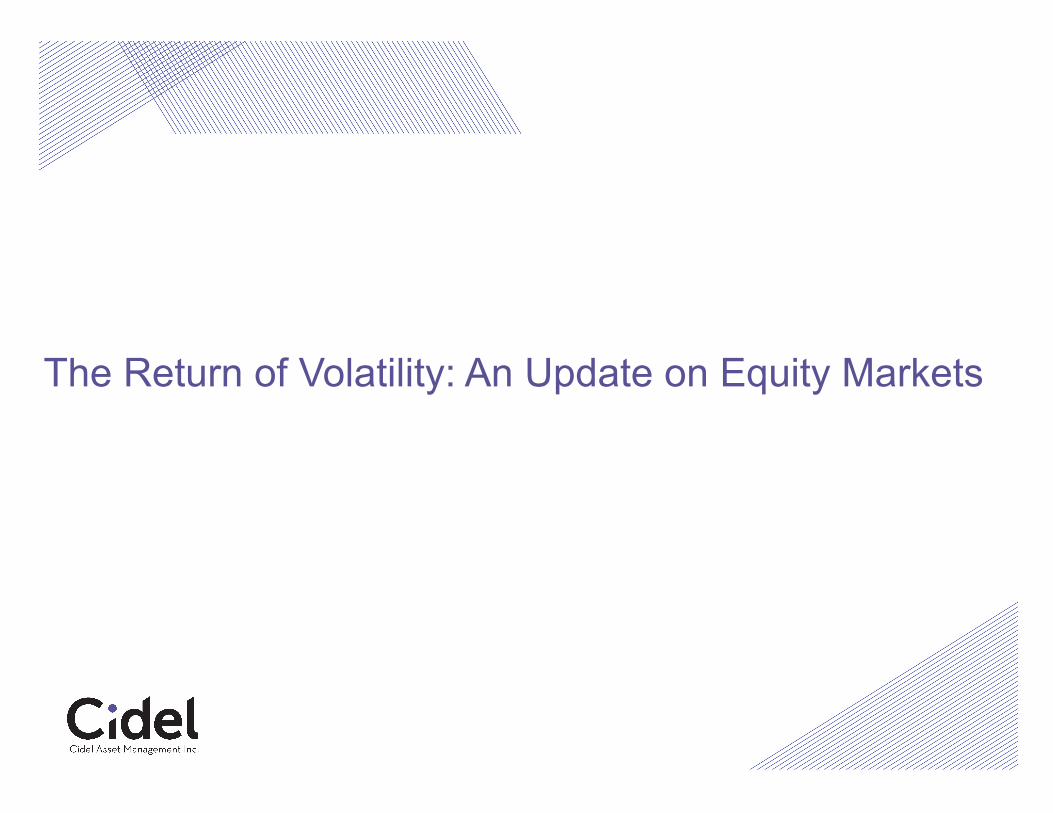
Equity markets have exhibited recent volatility…
0
500
1,000
1,500
2,000
2,500
3,000
2008 2010 2012 2014 2016 2018
S&P 500 INDEX, 2008 TO 2018
2
2,200
2,300
2,400
2,500
2,600
2,700
2,800
2,900
Source: Thompson Reuters Datastream, Cidel Asset Management
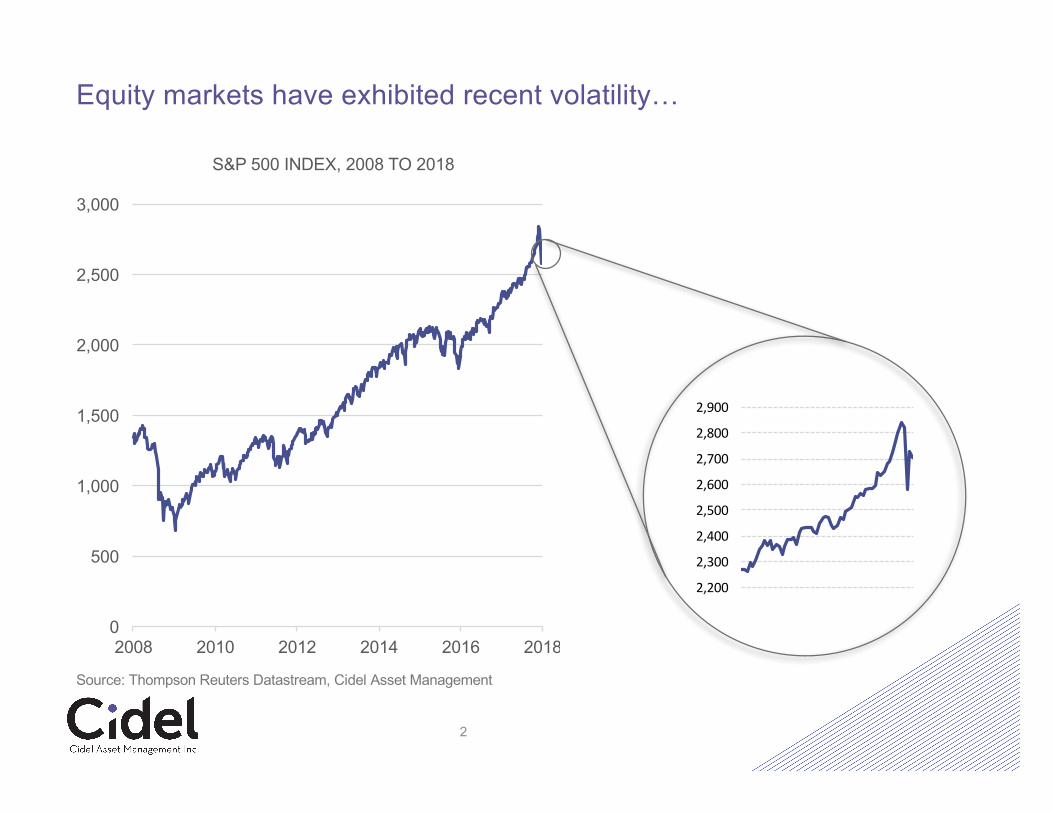
…as have the bond markets
0%
2%
4%
6%
8%
10%
12%
14%
16%
1950 1960 1970 1980 1990 2000 2010
10-year U.S. Treasury yields, 1950 to 2018
3
2.0%
2.2%
2.4%
2.6%
2.8%
3.0%
Source: Thompson Reuters Datastream, Cidel Asset Management
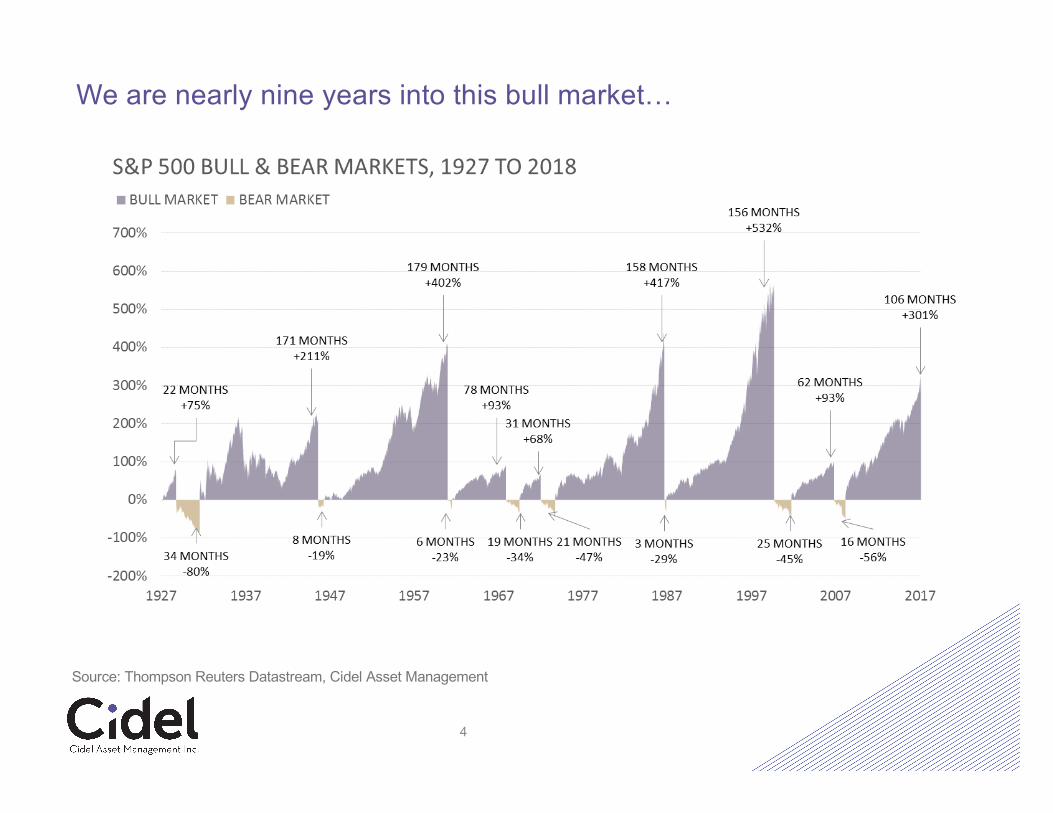
We are nearly nine years into this bull market…
4
Source: Thompson Reuters Datastream, Cidel Asset Management
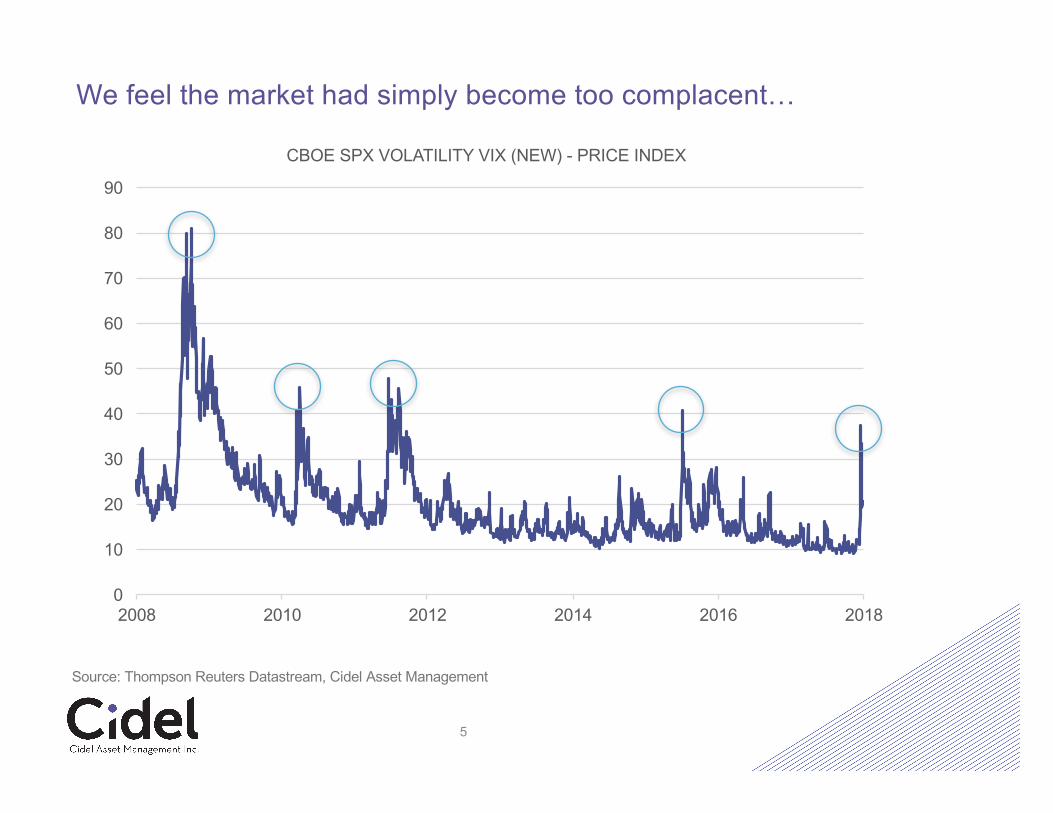
We feel the market had simply become too complacent…
0
10
20
30
40
50
60
70
80
90
2008 2010 2012 2014 2016 2018
CBOE SPX VOLATILITY VIX (NEW) - PRICE INDEX
5
Source: Thompson Reuters Datastream, Cidel Asset Management
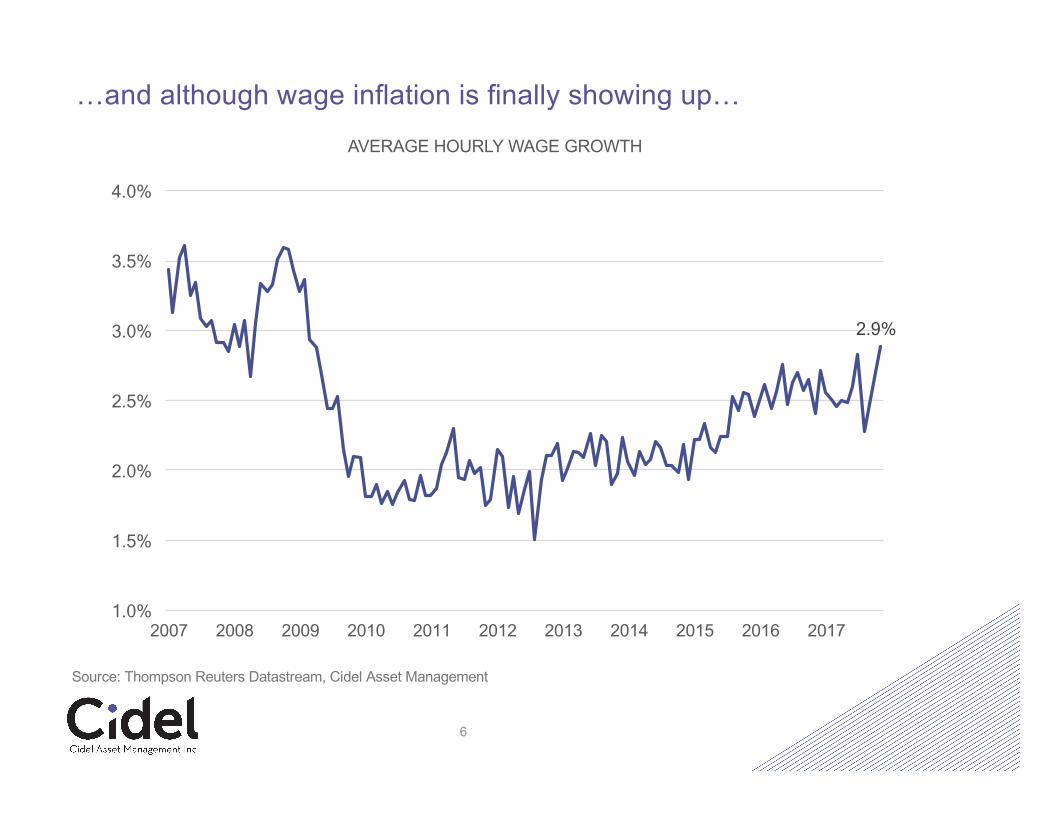
…and although wage inflation is finally showing up…
2.9%
1.0%
1.5%
2.0%
2.5%
3.0%
3.5%
4.0%
2007 2008 2009 2010 2011 2012 2013 2014 2015 2016 2017
AVERAGE HOURLY WAGE GROWTH
6
Source: Thompson Reuters Datastream, Cidel Asset Management
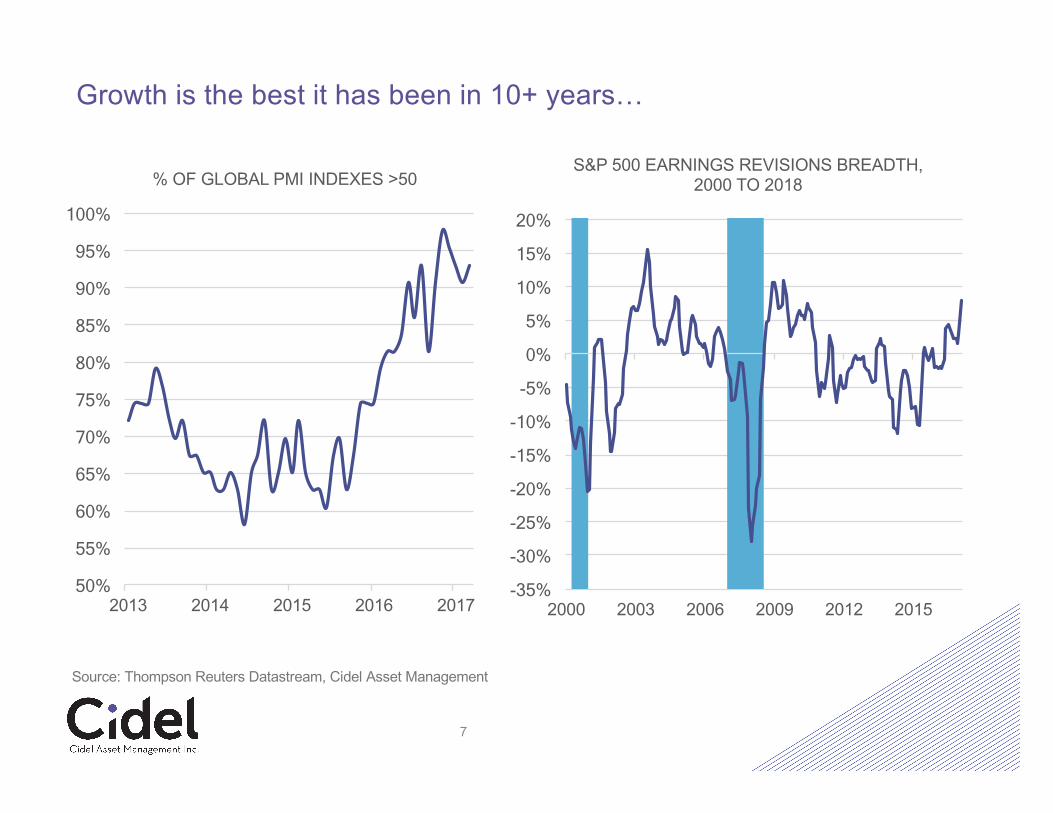
Growth is the best it has been in 10+ years…
-35%
-30%
-25%
-20%
-15%
-10%
-5%
0%
5%
10%
15%
20%
2000 2003 2006 2009 2012 2015
S&P 500 EARNINGS REVISIONS BREADTH, 2000 TO 2018
7
50%
55%
60%
65%
70%
75%
80%
85%
90%
95%
100%
2013 2014 2015 2016 2017
% OF GLOBAL PMI INDEXES >50
Source: Thompson Reuters Datastream, Cidel Asset Management
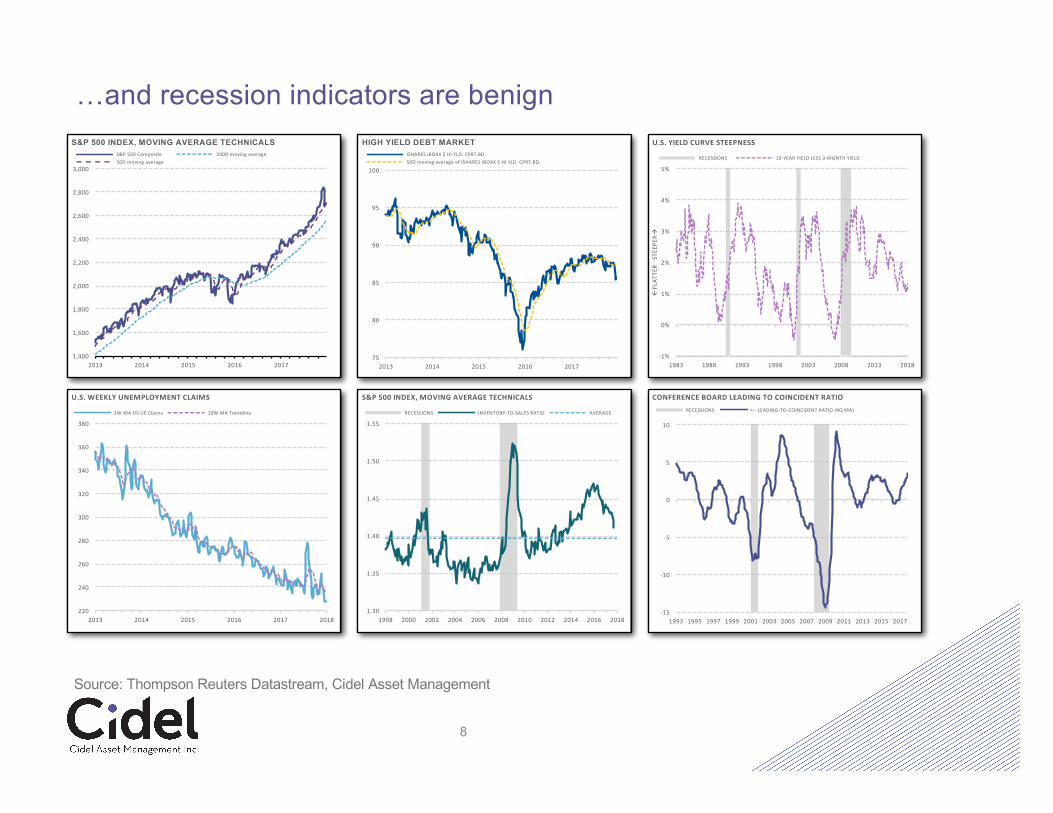
…and recession indicators are benign
1,400
1,600
1,800
2,000
2,200
2,400
2,600
2,800
3,000
2013 2014 2015 2016 2017
S&P 500 INDEX, MOVING AVERAGE TECHNICALSS&P500Composite 200Dmovingaverage50Dmovingaverage
8
75
80
85
90
95
100
2013 2014 2015 2016 2017
HIGH YIELD DEBT MARKETISHARESIBOXX$HI.YLD.CPRT.BD.50DmovingaverageofISHARESIBOXX$HI.YLD.CPRT.BD.
-1%
0%
1%
2%
3%
4%
5%
1983 1988 1993 1998 2003 2008 2013 2018
ßFLAT
TERSTE
EPER
à
U.S.YIELDCURVESTEEPNESS
RECESSIONS 10-YEARYIELDLESS3-MONTHYIELD
220
240
260
280
300
320
340
360
380
2013 2014 2015 2016 2017 2018
U.S.WEEKLYUNEMPLOYMENTCLAIMS
3WMAUSUEClaims 10WMATrendline
1.30
1.35
1.40
1.45
1.50
1.55
1998 2000 2002 2004 2006 2008 2010 2012 2014 2016 2018
S&P500INDEX,MOVINGAVERAGETECHNICALS
RECESSIONS INVENTORY-TO-SALESRATIO AVERAGE
-15
-10
-5
0
5
10
1993 1995 1997 1999 2001 2003 2005 2007 2009 2011 2013 2015 2017
CONFERENCEBOARDLEADINGTOCOINCIDENTRATIORECESSIONS <-- LEADING-TO-COINCIDENTRATIO(4QMA)
Source: Thompson Reuters Datastream, Cidel Asset Management
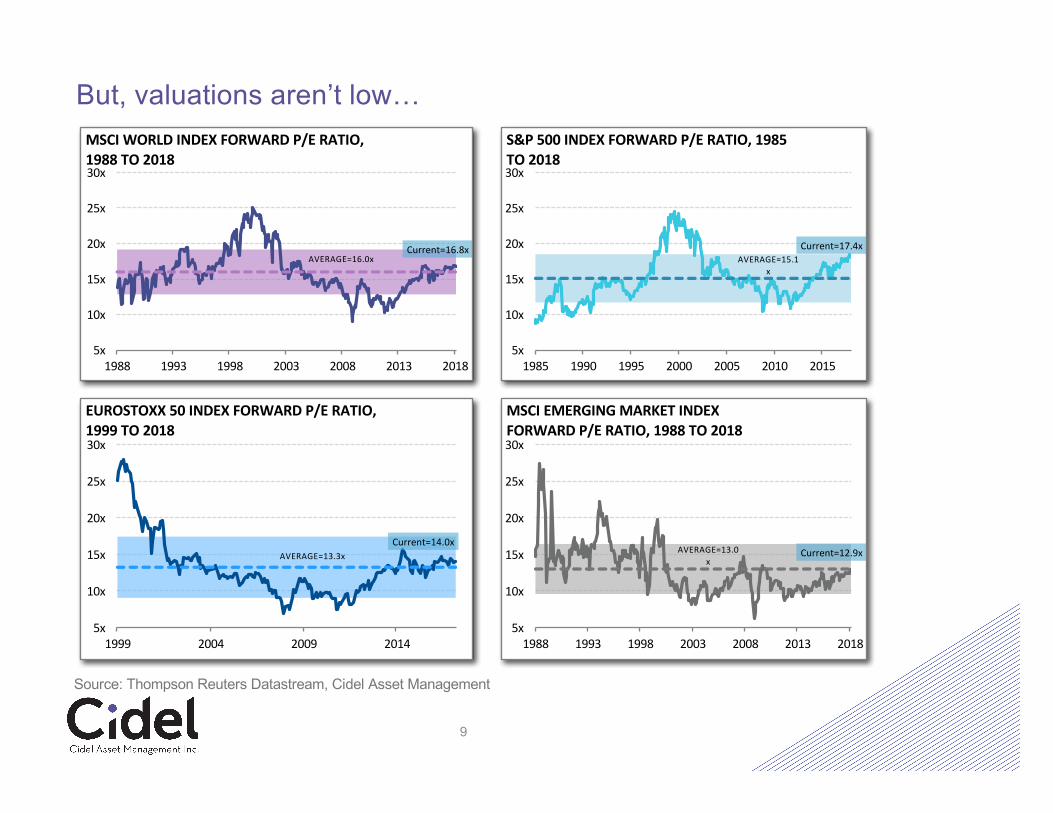
But, valuations aren’t low…
Current=16.8xAVERAGE=16.0x
5x
10x
15x
20x
25x
30x
1988 1993 1998 2003 2008 2013 2018
MSCIWORLDINDEXFORWARDP/ERATIO,1988TO2018
9
Current=17.4xAVERAGE=15.1
x
5x
10x
15x
20x
25x
30x
1985 1990 1995 2000 2005 2010 2015
S&P500INDEXFORWARDP/ERATIO,1985TO2018
Current=14.0xAVERAGE=13.3x
5x
10x
15x
20x
25x
30x
1999 2004 2009 2014
EUROSTOXX50INDEXFORWARDP/ERATIO,1999TO2018
Current=12.9xAVERAGE=13.0x
5x
10x
15x
20x
25x
30x
1988 1993 1998 2003 2008 2013 2018
MSCIEMERGINGMARKETINDEXFORWARDP/ERATIO,1988TO2018
Source: Thompson Reuters Datastream, Cidel Asset Management
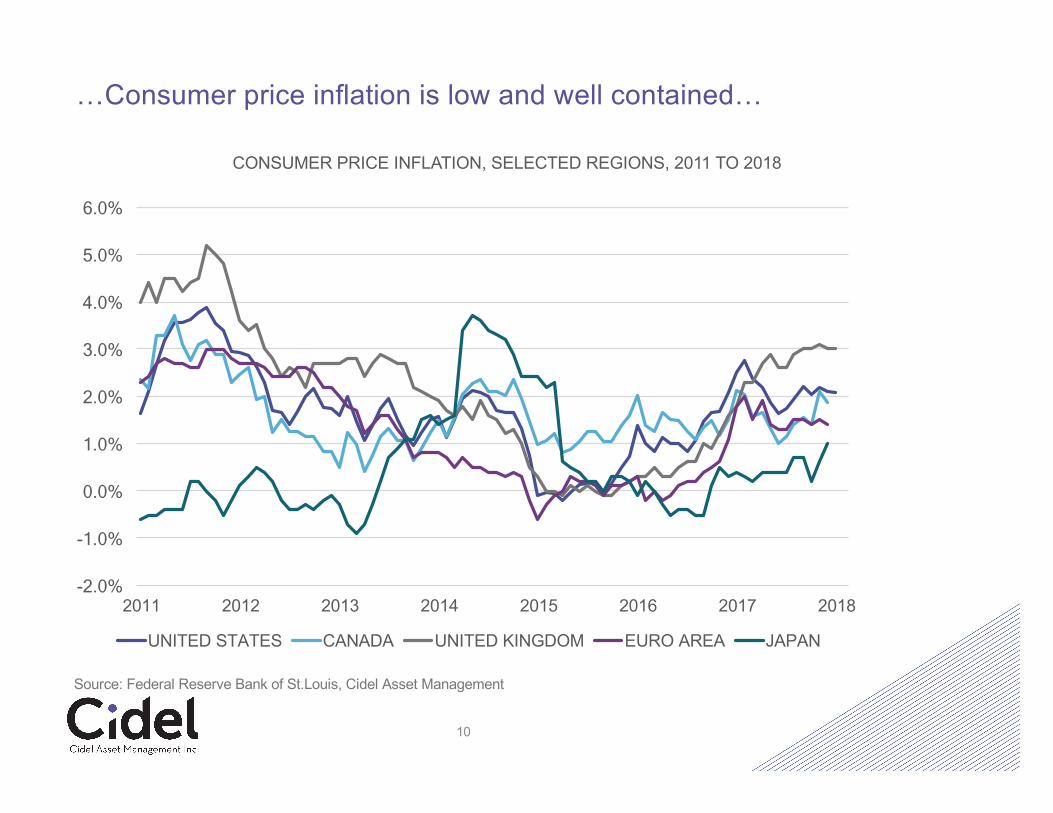
…Consumer price inflation is low and well contained…
-2.0%
-1.0%
0.0%
1.0%
2.0%
3.0%
4.0%
5.0%
6.0%
2011 2012 2013 2014 2015 2016 2017 2018
CONSUMER PRICE INFLATION, SELECTED REGIONS, 2011 TO 2018
UNITED STATES CANADA UNITED KINGDOM EURO AREA JAPAN
10
Source: Federal Reserve Bank of St.Louis, Cidel Asset Management
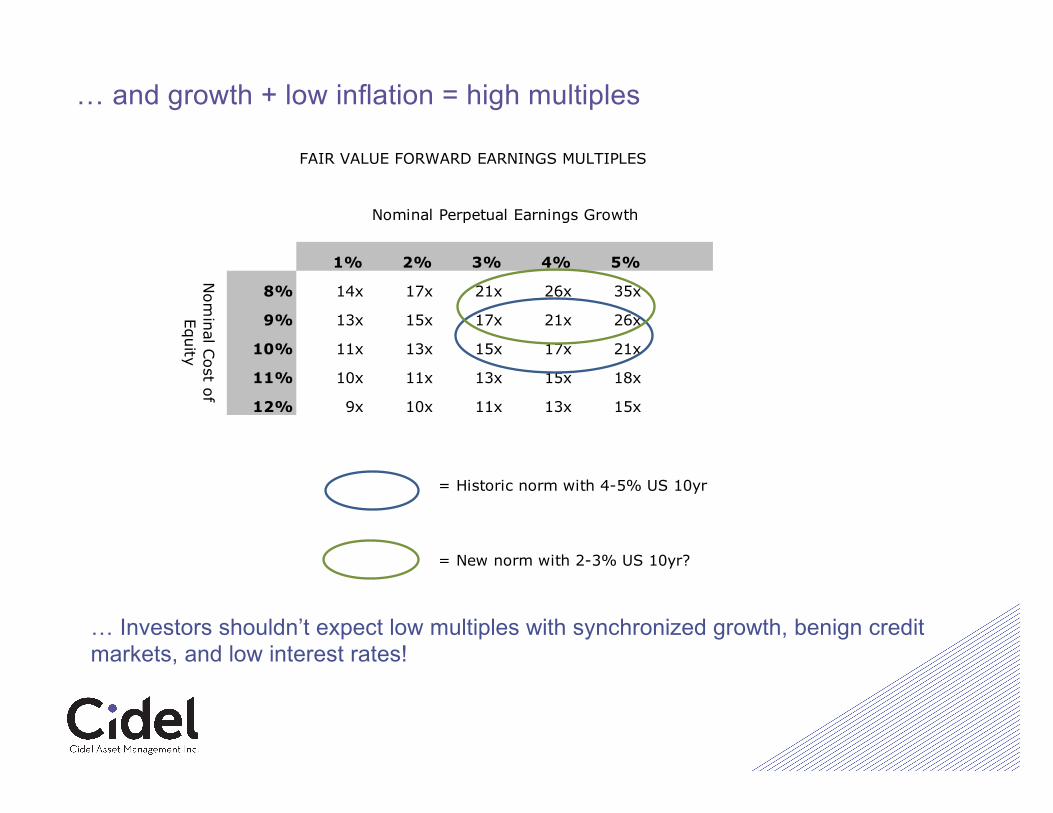
… and growth + low inflation = high multiples
… Investors shouldn’t expect low multiples with synchronized growth, benign credit markets, and low interest rates!
FAIR VALUE FORWARD EARNINGS MULTIPLES
Nominal Perpetual Earnings Growth
15 1% 2% 3% 4% 5%
8% 14x 17x 21x 26x 35x
9% 13x 15x 17x 21x 26x
10% 11x 13x 15x 17x 21x
11% 10x 11x 13x 15x 18x
12% 9x 10x 11x 13x 15x
= Historic norm with 4-5% US 10yr
= New norm with 2-3% US 10yr?
Nom
inal Cost of
Equity
Cidel Asset ManagementQ4 2017
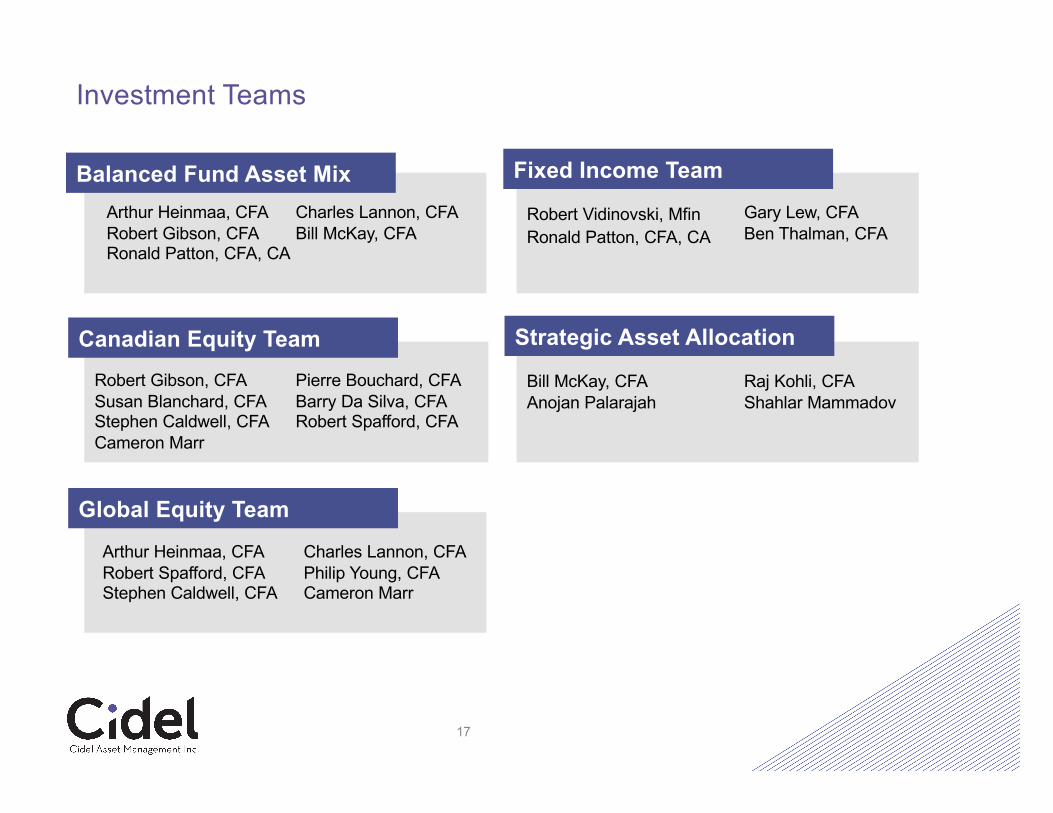
Investment Teams
17
Balanced Fund Asset MixArthur Heinmaa, CFARobert Gibson, CFARonald Patton, CFA, CA
Charles Lannon, CFABill McKay, CFA
Canadian Equity TeamRobert Gibson, CFASusan Blanchard, CFAStephen Caldwell, CFACameron Marr
Pierre Bouchard, CFABarry Da Silva, CFARobert Spafford, CFA
Global Equity TeamArthur Heinmaa, CFARobert Spafford, CFAStephen Caldwell, CFA
Charles Lannon, CFAPhilip Young, CFACameron Marr
Fixed Income Team
Robert Vidinovski, Mfin Gary Lew, CFABen Thalman, CFA
Strategic Asset Allocation
Bill McKay, CFAAnojan Palarajah
Raj Kohli, CFAShahlar Mammadov
Ronald Patton, CFA, CA
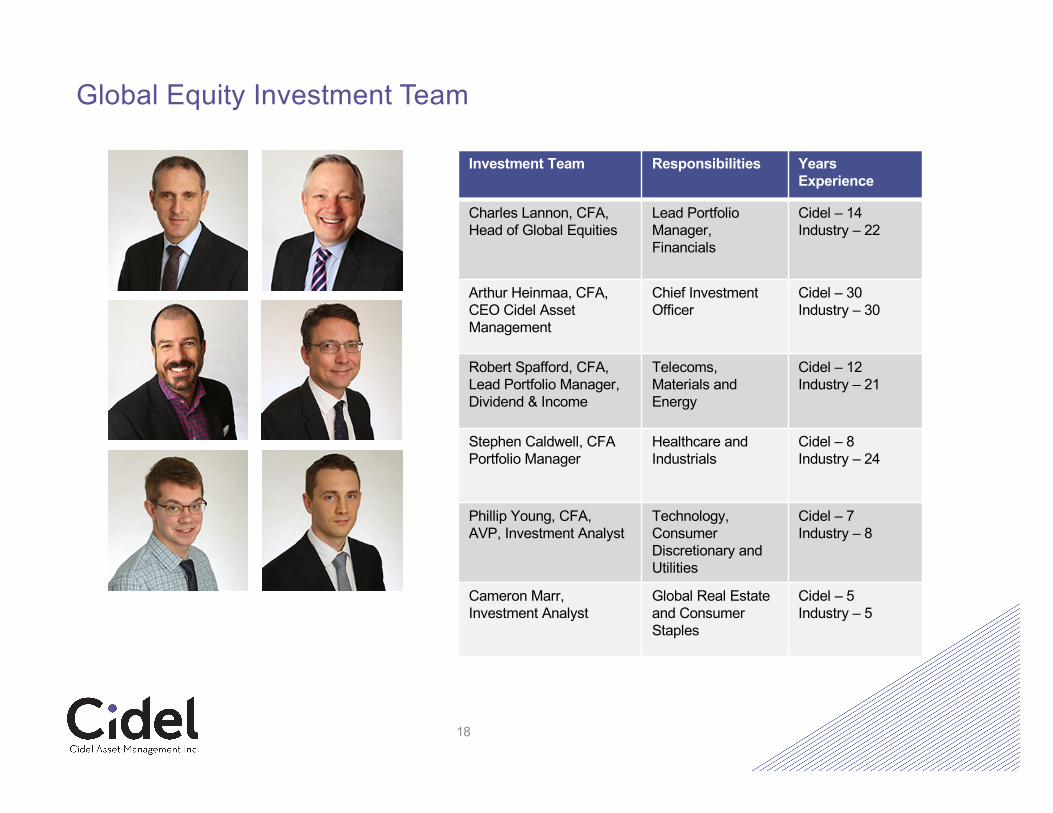
Global Equity Investment Team
18
Investment Team Responsibilities Years Experience
Charles Lannon, CFA,Head of Global Equities
Lead Portfolio Manager,Financials
Cidel – 14Industry – 22
Arthur Heinmaa, CFA,CEO Cidel Asset Management
Chief Investment Officer
Cidel – 30Industry – 30
Robert Spafford, CFA,Lead Portfolio Manager,Dividend & Income
Telecoms, Materials and Energy
Cidel – 12Industry – 21
Stephen Caldwell, CFAPortfolio Manager
Healthcare and Industrials
Cidel – 8Industry – 24
Phillip Young, CFA,AVP, Investment Analyst
Technology,Consumer Discretionary and Utilities
Cidel – 7Industry – 8
Cameron Marr,Investment Analyst
Global Real Estate and Consumer Staples
Cidel – 5Industry – 5
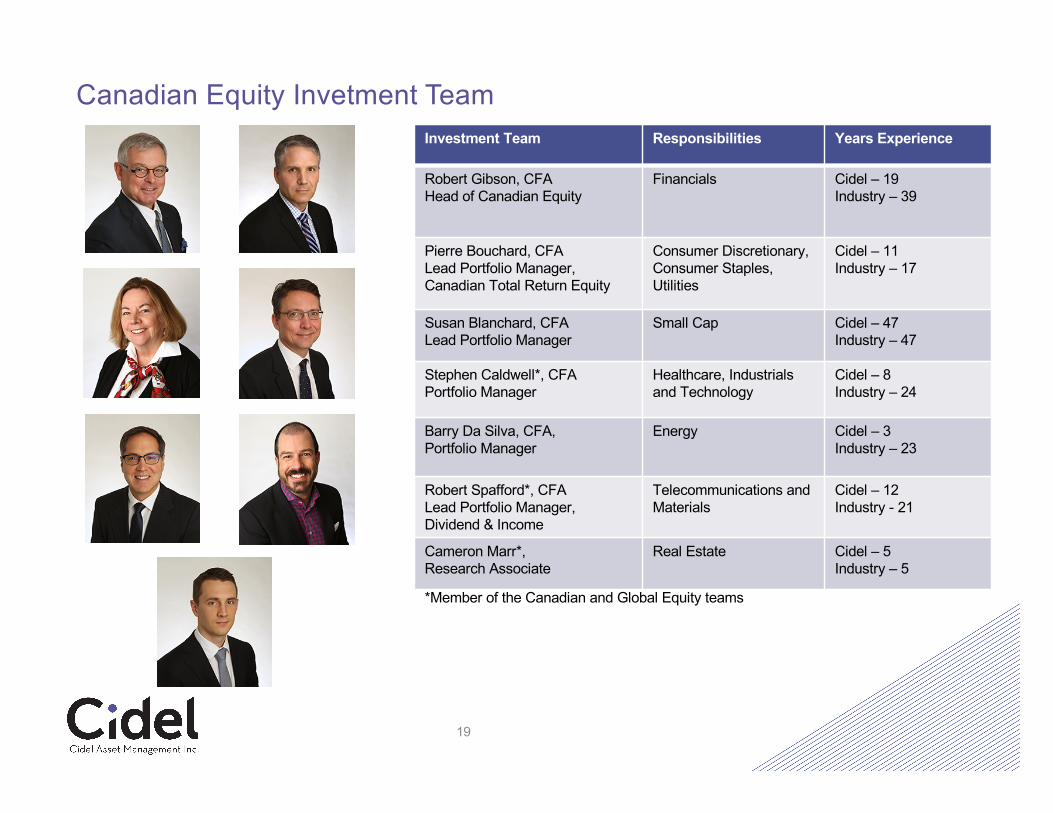
Canadian Equity Invetment Team
19
Investment Team Responsibilities Years Experience
Robert Gibson, CFAHead of Canadian Equity
Financials Cidel – 19Industry – 39
Pierre Bouchard, CFALead Portfolio Manager, Canadian Total Return Equity
Consumer Discretionary, Consumer Staples, Utilities
Cidel – 11Industry – 17
Susan Blanchard, CFALead Portfolio Manager
Small Cap Cidel – 47Industry – 47
Stephen Caldwell*, CFAPortfolio Manager
Healthcare, Industrials and Technology
Cidel – 8Industry – 24
Barry Da Silva, CFA,Portfolio Manager
Energy Cidel – 3Industry – 23
Robert Spafford*, CFALead Portfolio Manager,Dividend & Income
Telecommunications and Materials
Cidel – 12Industry - 21
Cameron Marr*,Research Associate
Real Estate Cidel – 5Industry – 5
*Member of the Canadian and Global Equity teams
Investment Philosophy
• We believe superior investment results are generated for clients by:
• Investing in financially strong, growing businesses that have a history of returning cash to shareholders; and by
• Constructing a concentrated portfolio that balances diversification with conviction; and by
• Focusing on risk management in order to reduce volatility and minimize the frequency and severity of negative alpha; and by
• Following a standardized and repeatable investment process which is designed to provide a consistent, sustainable and differentiated approach.
20
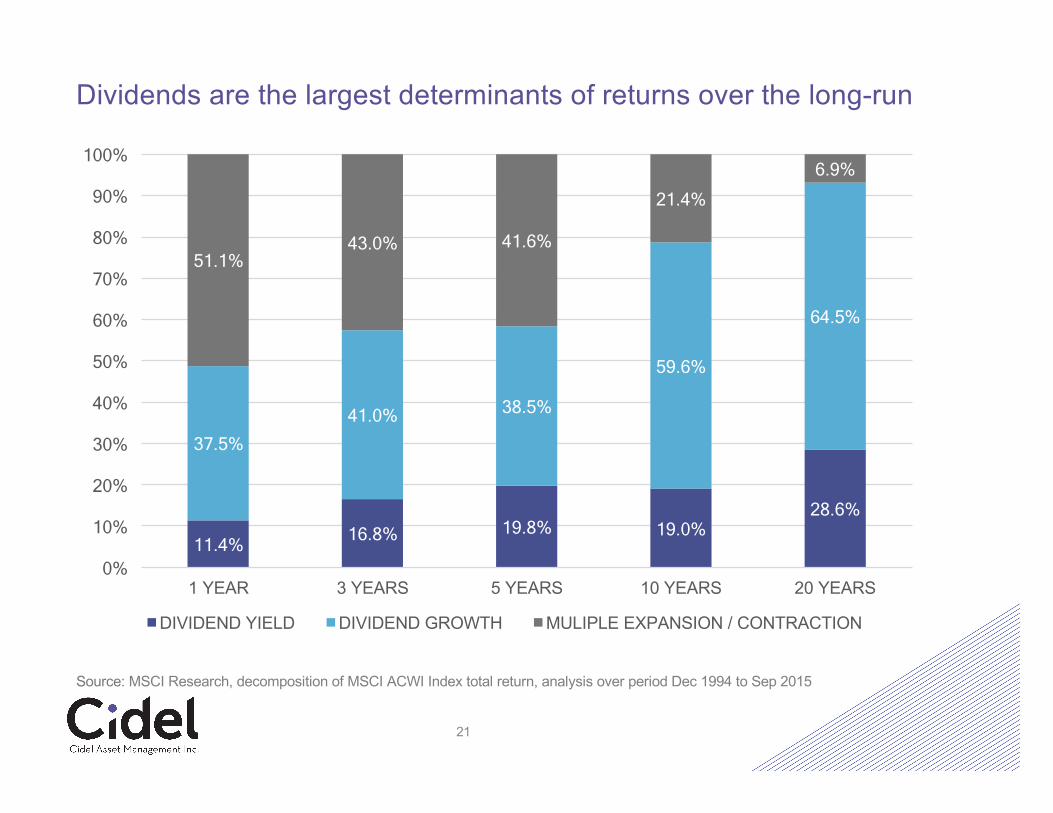
Dividends are the largest determinants of returns over the long-run
11.4% 16.8% 19.8% 19.0% 28.6%
37.5% 41.0% 38.5%
59.6%
64.5%
51.1% 43.0% 41.6%
21.4% 6.9%
0%
10%
20%
30%
40%
50%
60%
70%
80%
90%
100%
1 YEAR 3 YEARS 5 YEARS 10 YEARS 20 YEARS
DIVIDEND YIELD DIVIDEND GROWTH MULIPLE EXPANSION / CONTRACTION
21
Source: MSCI Research, decomposition of MSCI ACWI Index total return, analysis over period Dec 1994 to Sep 2015
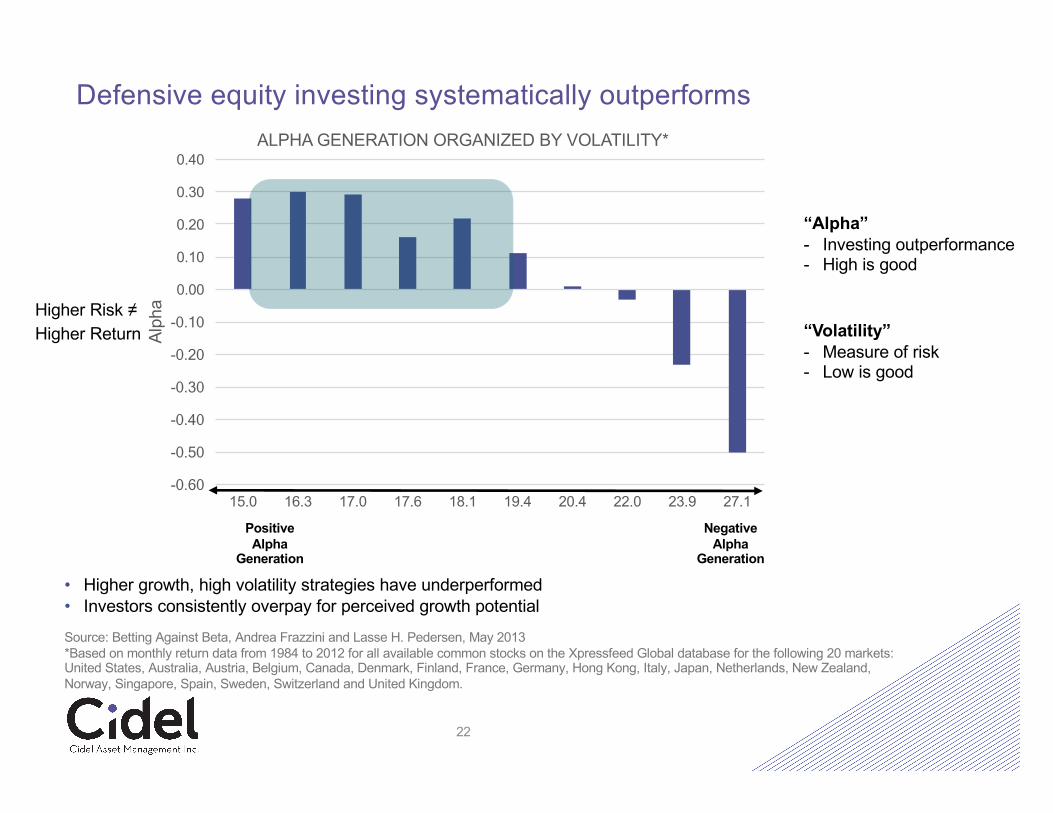
-0.60
-0.50
-0.40
-0.30
-0.20
-0.10
0.00
0.10
0.20
0.30
0.40
15.0 16.3 17.0 17.6 18.1 19.4 20.4 22.0 23.9 27.1
Alph
aALPHA GENERATION ORGANIZED BY VOLATILITY*
Defensive equity investing systematically outperforms
22
Source: Betting Against Beta, Andrea Frazzini and Lasse H. Pedersen, May 2013*Based on monthly return data from 1984 to 2012 for all available common stocks on the Xpressfeed Global database for the following 20 markets: United States, Australia, Austria, Belgium, Canada, Denmark, Finland, France, Germany, Hong Kong, Italy, Japan, Netherlands, New Zealand, Norway, Singapore, Spain, Sweden, Switzerland and United Kingdom.
Positive Alpha
Generation
Negative Alpha
Generation
Higher Risk ≠Higher Return
“Alpha”- Investing outperformance- High is good
“Volatility”- Measure of risk- Low is good
• Higher growth, high volatility strategies have underperformed• Investors consistently overpay for perceived growth potential
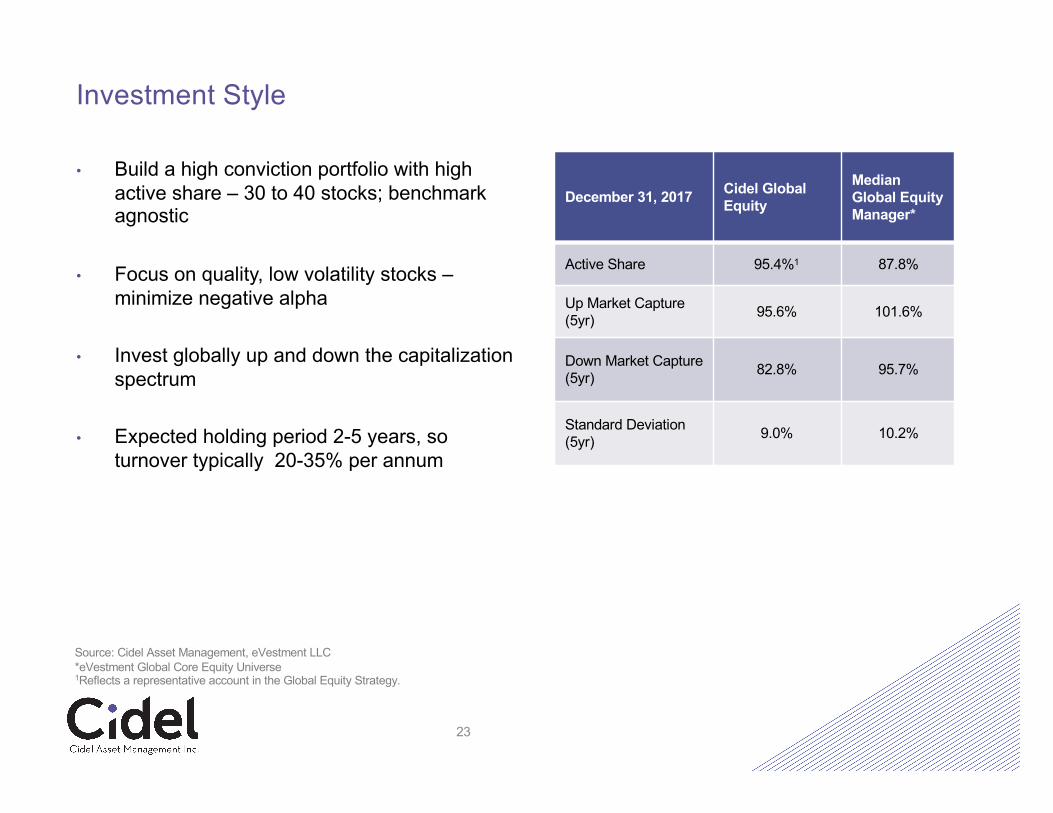
Investment Style
• Build a high conviction portfolio with high active share – 30 to 40 stocks; benchmark agnostic
• Focus on quality, low volatility stocks –minimize negative alpha
• Invest globally up and down the capitalization spectrum
• Expected holding period 2-5 years, so turnover typically 20-35% per annum
23
December 31, 2017 Cidel Global Equity
Median Global Equity Manager*
Active Share 95.4%1 87.8%
Up Market Capture (5yr) 95.6% 101.6%
Down Market Capture (5yr) 82.8% 95.7%
Standard Deviation (5yr) 9.0% 10.2%
Source: Cidel Asset Management, eVestment LLC*eVestment Global Core Equity Universe1Reflects a representative account in the Global Equity Strategy.
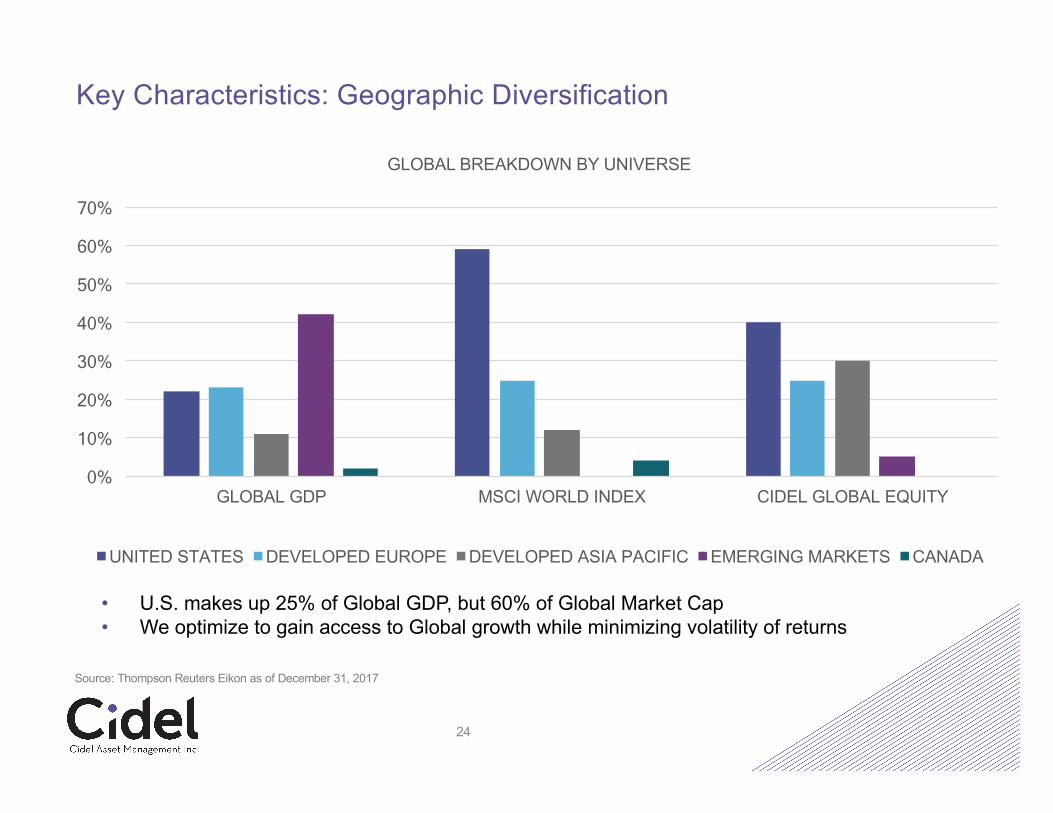
Key Characteristics: Geographic Diversification
0%
10%
20%
30%
40%
50%
60%
70%
GLOBAL GDP MSCI WORLD INDEX CIDEL GLOBAL EQUITY
GLOBAL BREAKDOWN BY UNIVERSE
UNITED STATES DEVELOPED EUROPE DEVELOPED ASIA PACIFIC EMERGING MARKETS CANADA
24
• U.S. makes up 25% of Global GDP, but 60% of Global Market Cap• We optimize to gain access to Global growth while minimizing volatility of returns
Source: Thompson Reuters Eikon as of December 31, 2017
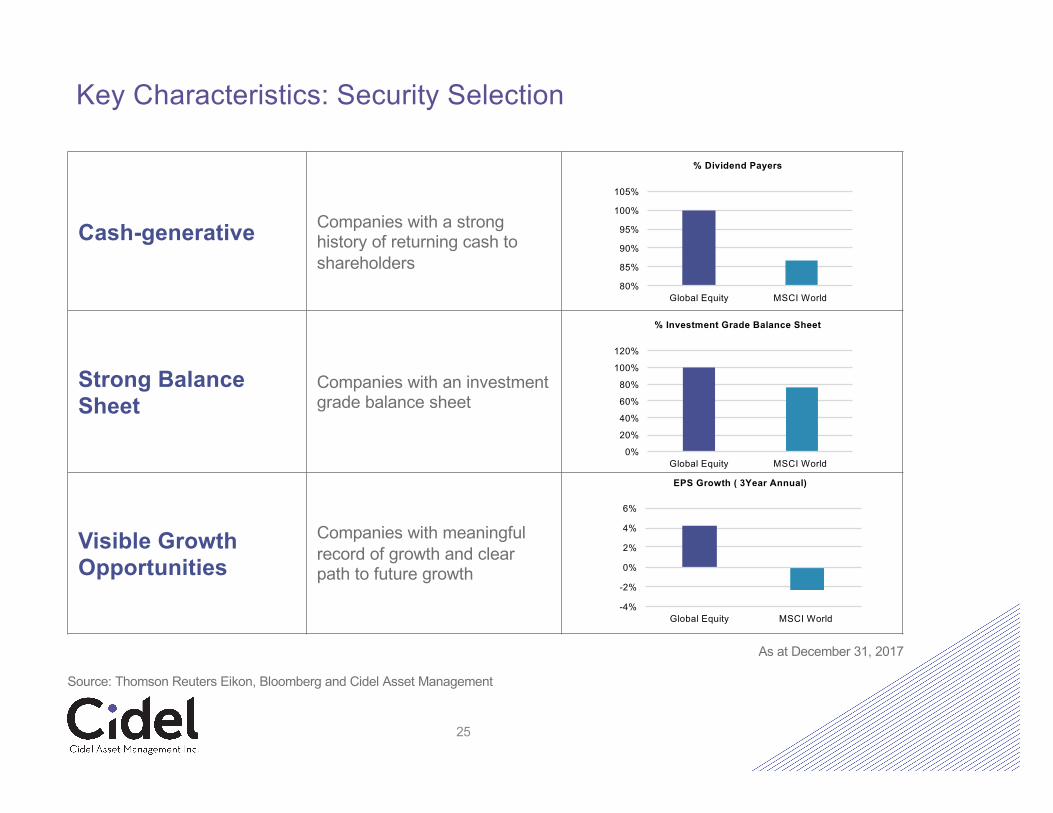
Key Characteristics: Security Selection
25
Cash-generative Companies with a strong history of returning cash to shareholders
Strong BalanceSheet
Companies with an investment grade balance sheet
Visible Growth Opportunities
Companies with meaningful record of growth and clear path to future growth
0%
20%
40%
60%
80%
100%
120%
Global Equity MSCI World
% Investment Grade Balance Sheet
-4%
-2%
0%
2%
4%
6%
Global Equity MSCI World
EPS Growth ( 3Year Annual)
80%
85%
90%
95%
100%
105%
Global Equity MSCI World
% Dividend Payers
Source: Thomson Reuters Eikon, Bloomberg and Cidel Asset Management
As at December 31, 2017
26
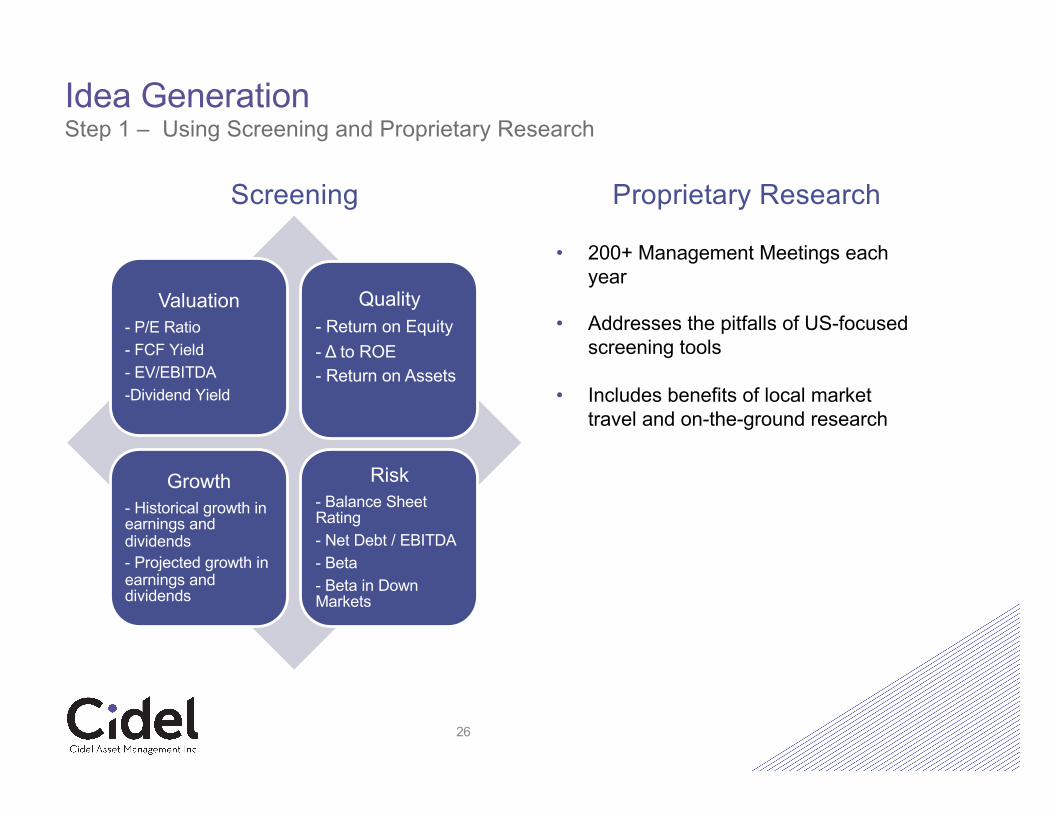
Idea GenerationStep 1 – Using Screening and Proprietary Research
Valuation - P/E Ratio- FCF Yield- EV/EBITDA-Dividend Yield
Quality- Return on Equity - Δ to ROE- Return on Assets
Growth- Historical growth in earnings and dividends- Projected growth in earnings and dividends
Risk- Balance Sheet Rating- Net Debt / EBITDA- Beta- Beta in Down Markets
Screening Proprietary Research
• 200+ Management Meetings each year
• Addresses the pitfalls of US-focused screening tools
• Includes benefits of local market travel and on-the-ground research

PreliminaryValuation
Confirmation of ‘Moat’
Management Track Record Review
Risk & Financial Statement AnalysisIndustry
Analysis & Competitor Evaluation
Management Interview
Final Valuation
Decision & Source of Funding
27
Our proprietary stock picking methodology is designed to minimize frequency and severity of negative alpha generation.
Stocks passing quality and volatility screens are subject to a rigorous 8-stage analysis
Research ProcessStep 2 – Standardized stock analysis
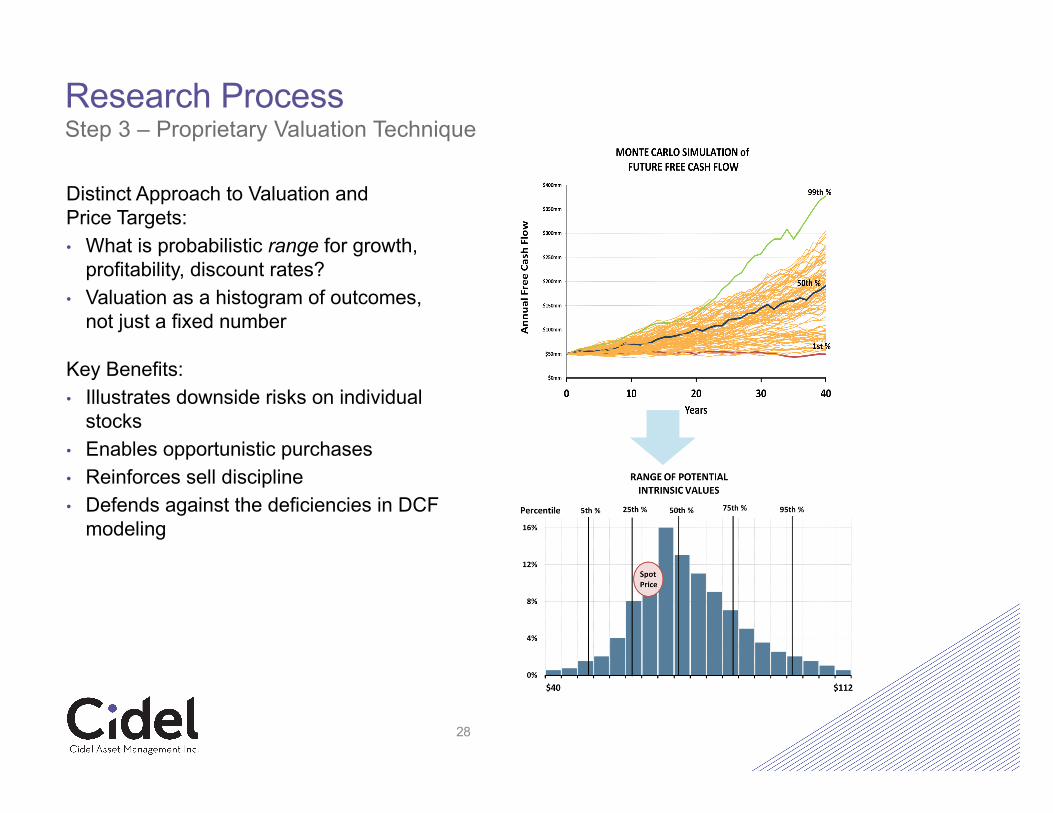
Distinct Approach to Valuation and Price Targets:• What is probabilistic range for growth,
profitability, discount rates?• Valuation as a histogram of outcomes,
not just a fixed number
Key Benefits:• Illustrates downside risks on individual
stocks• Enables opportunistic purchases• Reinforces sell discipline• Defends against the deficiencies in DCF
modeling
28
Research ProcessStep 3 – Proprietary Valuation Technique
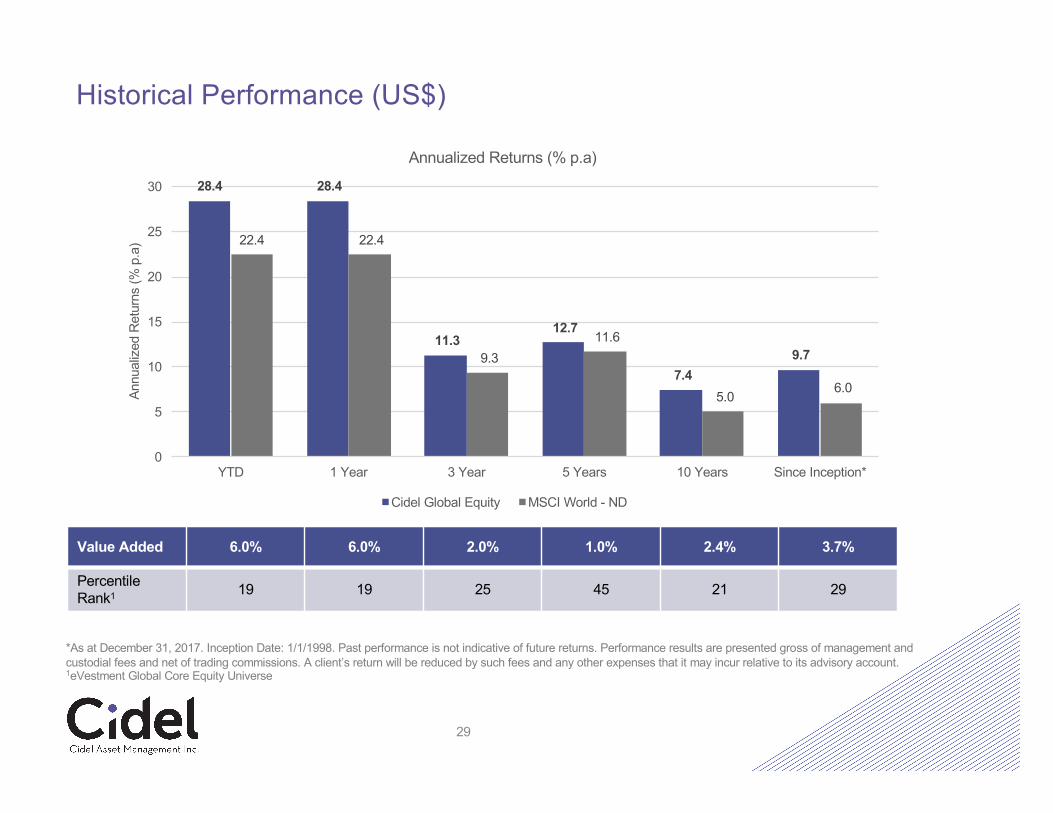
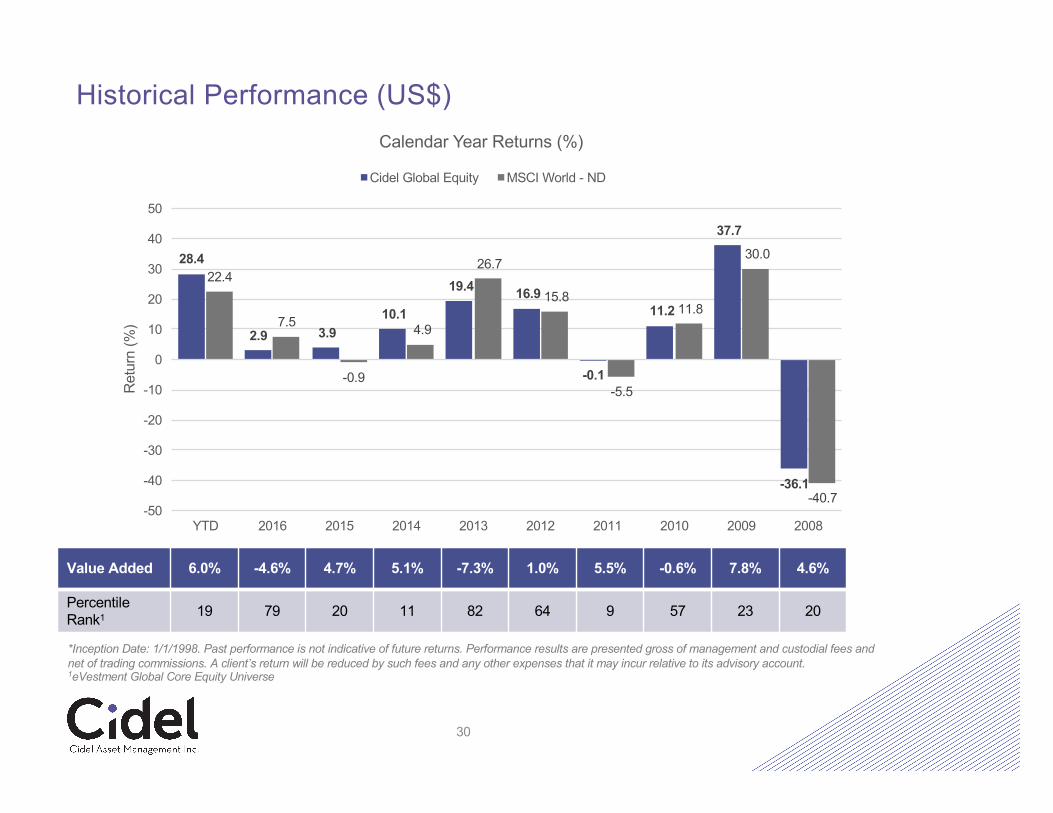
Historical Performance (US$)
29
Value Added 6.0% 6.0% 2.0% 1.0% 2.4% 3.7%
Percentile Rank1 19 19 25 45 21 29
*As at December 31, 2017. Inception Date: 1/1/1998. Past performance is not indicative of future returns. Performance results are presented gross of management and custodial fees and net of trading commissions. A client’s return will be reduced by such fees and any other expenses that it may incur relative to its advisory account. 1eVestment Global Core Equity Universe
28.4 28.4
11.3 12.7
7.4 9.7
22.4 22.4
9.3 11.6
5.0 6.0
0
5
10
15
20
25
30
YTD 1 Year 3 Year 5 Years 10 Years Since Inception*
Annu
aliz
ed R
etur
ns (%
p.a
)
Annualized Returns (% p.a)
Cidel Global Equity MSCI World - ND
Historical Performance (US$)
30
Value Added 6.0% -4.6% 4.7% 5.1% -7.3% 1.0% 5.5% -0.6% 7.8% 4.6%
Percentile Rank1 19 79 20 11 82 64 9 57 23 20
*Inception Date: 1/1/1998. Past performance is not indicative of future returns. Performance results are presented gross of management and custodial fees andnet of trading commissions. A client’s return will be reduced by such fees and any other expenses that it may incur relative to its advisory account.1eVestment Global Core Equity Universe
28.4
2.9 3.9 10.1
19.4 16.9
-0.1
11.2
37.7
-36.1
22.4
7.5
-0.9
4.9
26.7
15.8
-5.5
11.8
30.0
-40.7-50
-40
-30
-20
-10
0
10
20
30
40
50
YTD 2016 2015 2014 2013 2012 2011 2010 2009 2008
Ret
urn
(%)
Calendar Year Returns (%)
Cidel Global Equity MSCI World - ND
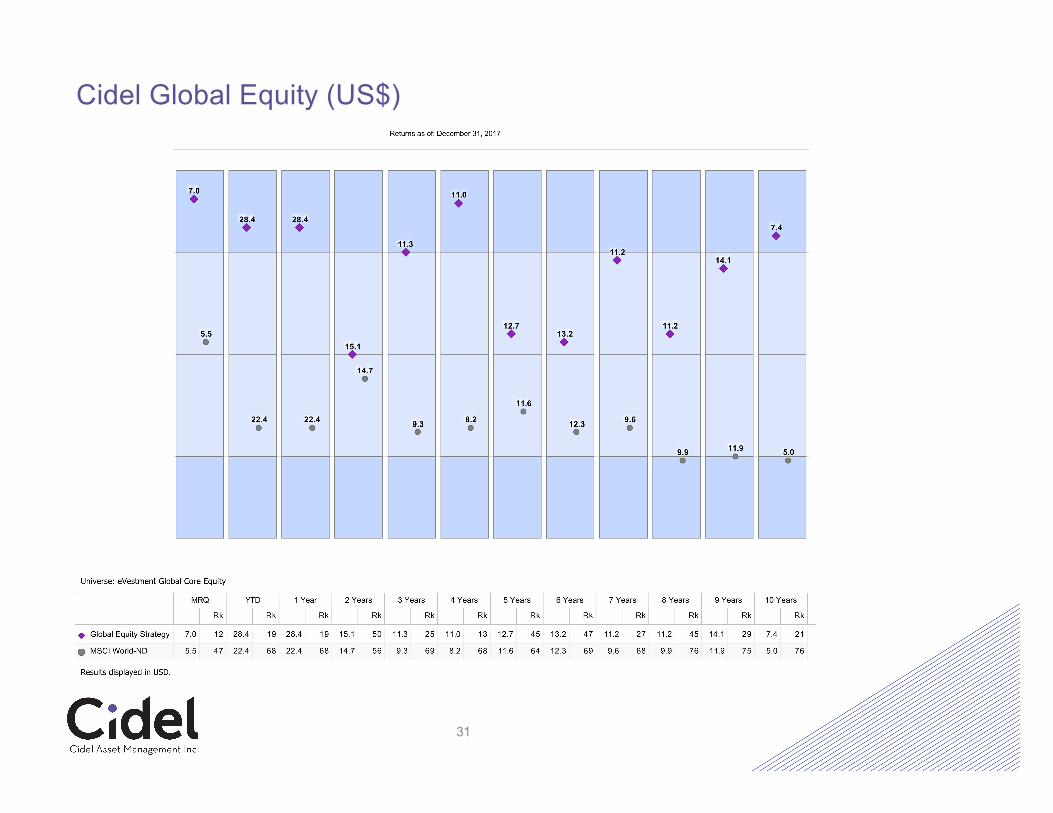
Cidel Global Equity (US$)
31

Cidel Global Equity (US$) – Risk Metrics
32
Current Portfolio: Country & Sector Weights
North America
Asia & Pacific Basin
Europe Latin America
Africa & ME0.0%
10.0%
20.0%
30.0%
40.0%
50.0%
60.0%
70.0%
Regional Breakdown1
Global Equity MSCI World
33
0.0% 5.0% 10.0% 15.0% 20.0%
Real Estate
Utilities
Telecomm Services
Information Technology
Financials
Heath Care
Consumer Staples
Consumer Discretionary
Industrials
Materials
Energy
Industry Breakdown1
Global Equity MSCI World
Source: Thomson Reuters Eikon, Bloomberg, Cidel Asset Management.1Reflects a representative account in the Global Equity Strategy.
As at December 31, 2017
DisclaimerThe Cidel Group consists of, but is not limited to, the following companies: Cidel Bank & Trust Inc., Cidel (Pty) Ltd., CidelBank Canada, Cidel Trust Company, Cidel Asset Management Inc. (operating as Toron Asset Management International,Cidel and Cidel Financial Group) and AFL Investments. In Canada, Cidel Bank Canada is regulated by the Office of theSuperintendent of Financial Institutions and provides banking services and Cidel Trust Company is a non-deposit taking trustcompany regulated by the Office of the Superintendent of Financial Institutions. Cidel Asset Management Inc. is regulated bythe Ontario Securities Commission and provides investment management services.
Past performance is not an indication of future results. The material contained in this document is for information purposesonly. It is not intended as an offer or solicitation for purchase or sale of any security or financial instrument, nor is it advice ora recommendation to enter into any transaction. The information contained herein should not be construed as financial orinvestment advice on any subject matter.
Where applicable, Cidel has selected a benchmark so that a relevant and relative comparison can be made between theperformance of the portfolio vs. the benchmark. Where possible, Cidel has selected a benchmark that best fits the portfoliocomposition based on asset class, geographic and currency allocations. Benchmark performance does not include the costof investing and should be taken into account when comparing net performance (i.e. after management fees have beendeducted) of the portfolio vs. the benchmark. Please contact your Cidel representative if more detailed information is requiredon the benchmark.
We have endeavored to offer current, accurate and clearly expressed information. However, since inadvertent errors mayoccur, relevant legislation and regulations may change and or the application of laws and regulations may vary; theinformation may be neither current nor accurate. Additionally, the information contained in this document is intended toprovide general guidance and is not intended to replace or serve as substitute for any professional or tax advice,consultation, advisory or service, nor does any information constitute a comprehensive or complete statement of the issuesdiscussed. All individuals should obtain specific professional advice with regard to the respective tax or other professionalarea. No action should be taken or omitted to be taken in reliance upon any of the information provided and in no event shallCidel Bank & Trust Inc., its subsidiaries, its directors, principals, agents or employees be liable for any direct, indirect,incidental, special, exemplary, punitive, consequential or other damages whatsoever including but not limited to contract,negligence or other tortuous actions arising out of or in connection with any content of the information provided or other usehereof.
41