THE RETENTION GAP - Infrastructure Intelligence · 2015-10-05 · In this decade, Engineering UK...
58
THE RETENTION GAP What it is and how to tackle it July 2015
Transcript of THE RETENTION GAP - Infrastructure Intelligence · 2015-10-05 · In this decade, Engineering UK...
THE RETENTION GAPWhat it is and how to tackle it
July 2015
TABLE OF CONTENTS
Foreward.........................................................................................................Executive Summary........................................................................................Productivity vs skills: A difficult balancing act................................................Understanding the retention gap challenge....................................................Size matters...................................................................................................Our three point plan.......................................................................................Case studies...................................................................................................Recruiting more than just technical skills - Matchtech...................................Widening the pool of internal talent - TfL.......................................................The importance of developing and retaining staff - The Technician Apprenticeship Consortium....................................................From Trainee Engineer to Assistant Project Manager - Thames Tideway Tunnel..................................................................................Analysing the data..........................................................................................Understanding the importance of employees..................................................Length of service............................................................................................Employee turnover and recruitment cost........................................................Measuring the potential scale of the retention gap.........................................Analysing the retention gap............................................................................The effect of internal promotion.....................................................................Large companies.............................................................................................SME companies...............................................................................................All companies.................................................................................................Appendix A – Model numbers – Summary no delayed replacement................Appendix B – Model numbers Summary delayed replacement........................Appendix C – Model numbers – Large firms....................................................Appendix D – Model numbers – SME firms......................................................Appendix E – Model numbers – All firms.........................................................About EngTechNow.........................................................................................About ACE.......................................................................................................Benchmarking................................................................................................
345689151617
18
19202123232526293337414647485153555556
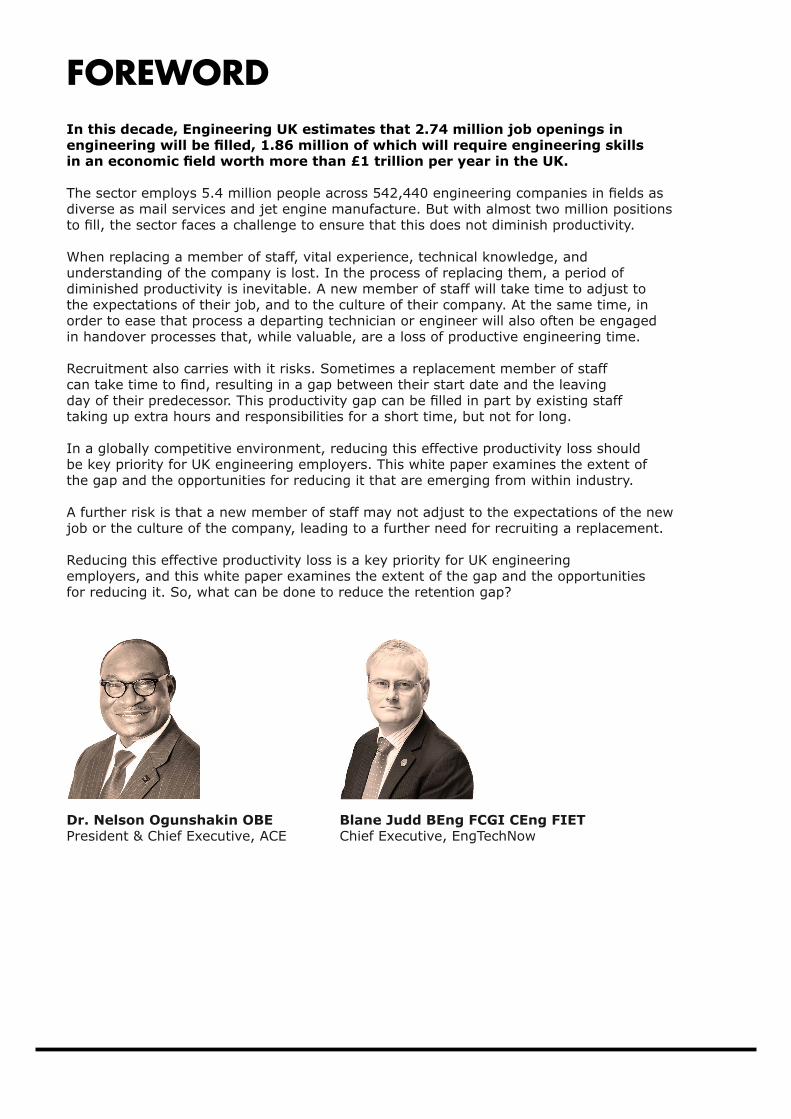
In this decade, Engineering UK estimates that 2.74 million job openings in engineering will be filled, 1.86 million of which will require engineering skills in an economic field worth more than £1 trillion per year in the UK.
The sector employs 5.4 million people across 542,440 engineering companies in fields as diverse as mail services and jet engine manufacture. But with almost two million positions to fill, the sector faces a challenge to ensure that this does not diminish productivity.
When replacing a member of staff, vital experience, technical knowledge, and understanding of the company is lost. In the process of replacing them, a period of diminished productivity is inevitable. A new member of staff will take time to adjust to the expectations of their job, and to the culture of their company. At the same time, in order to ease that process a departing technician or engineer will also often be engaged in handover processes that, while valuable, are a loss of productive engineering time.
Recruitment also carries with it risks. Sometimes a replacement member of staff can take time to find, resulting in a gap between their start date and the leaving day of their predecessor. This productivity gap can be filled in part by existing staff taking up extra hours and responsibilities for a short time, but not for long.
In a globally competitive environment, reducing this effective productivity loss should be key priority for UK engineering employers. This white paper examines the extent of the gap and the opportunities for reducing it that are emerging from within industry.
A further risk is that a new member of staff may not adjust to the expectations of the new job or the culture of the company, leading to a further need for recruiting a replacement.
Reducing this effective productivity loss is a key priority for UK engineering employers, and this white paper examines the extent of the gap and the opportunities for reducing it. So, what can be done to reduce the retention gap?
FOREWORD
Blane Judd BEng FCGI CEng FIETChief Executive, EngTechNow
Dr. Nelson Ogunshakin OBEPresident & Chief Executive, ACE

EXECUTIVE SUMMARY
5
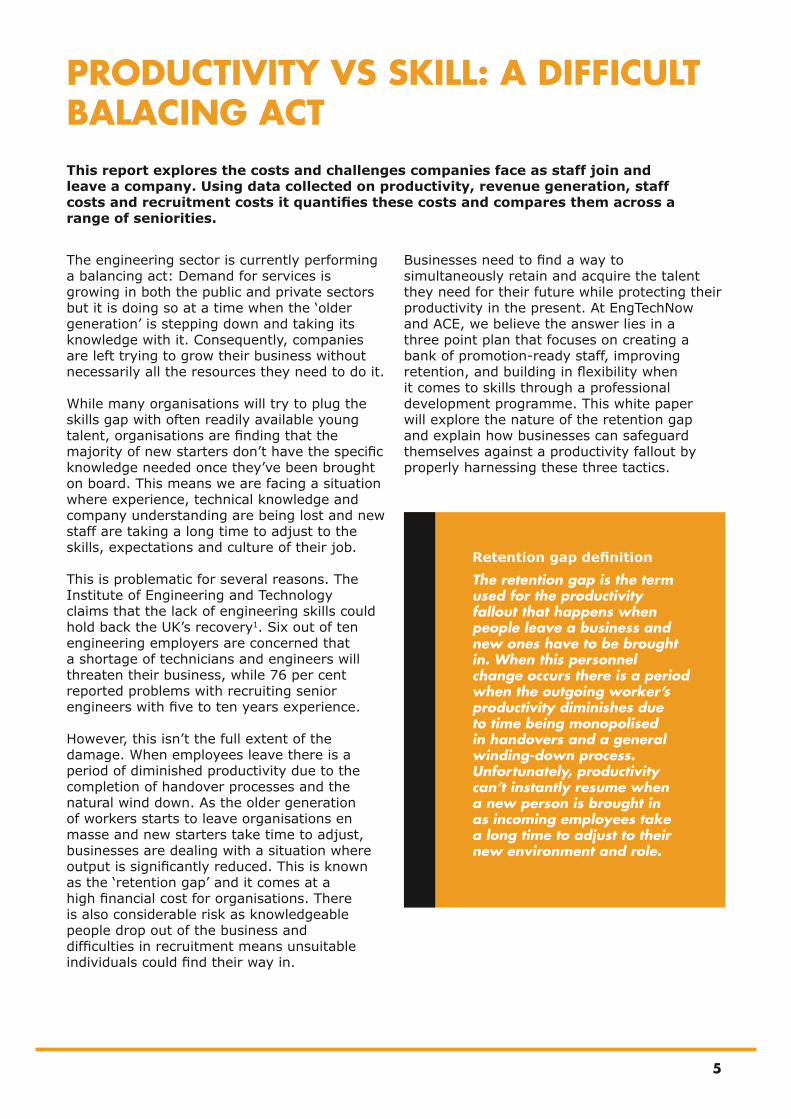
This report explores the costs and challenges companies face as staff join and leave a company. Using data collected on productivity, revenue generation, staff costs and recruitment costs it quantifies these costs and compares them across a range of seniorities.
The engineering sector is currently performing a balancing act: Demand for services is growing in both the public and private sectors but it is doing so at a time when the ‘older generation’ is stepping down and taking its knowledge with it. Consequently, companies are left trying to grow their business without necessarily all the resources they need to do it.
While many organisations will try to plug the skills gap with often readily available young talent, organisations are finding that the majority of new starters don’t have the specific knowledge needed once they’ve been brought on board. This means we are facing a situation where experience, technical knowledge and company understanding are being lost and new staff are taking a long time to adjust to the skills, expectations and culture of their job.
This is problematic for several reasons. The Institute of Engineering and Technology claims that the lack of engineering skills could hold back the UK’s recovery1. Six out of ten engineering employers are concerned thata shortage of technicians and engineers will threaten their business, while 76 per cent reported problems with recruiting senior engineers with five to ten years experience.
However, this isn’t the full extent of the damage. When employees leave there is a period of diminished productivity due to the completion of handover processes and the natural wind down. As the older generation of workers starts to leave organisations en masse and new starters take time to adjust, businesses are dealing with a situation where output is significantly reduced. This is known as the ‘retention gap’ and it comes at a high financial cost for organisations. There is also considerable risk as knowledgeable people drop out of the business and difficulties in recruitment means unsuitable individuals could find their way in.
Businesses need to find a way to simultaneously retain and acquire the talent they need for their future while protecting their productivity in the present. At EngTechNow and ACE, we believe the answer lies in a three point plan that focuses on creating a bank of promotion-ready staff, improving retention, and building in flexibility when it comes to skills through a professional development programme. This white paper will explore the nature of the retention gap and explain how businesses can safeguard themselves against a productivity fallout by properly harnessing these three tactics.
PRODUCTIVITY VS SKILL: A DIFFICULT BALACING ACT
Retention gap definitionThe retention gap is the term used for the productivity fallout that happens when people leave a business and new ones have to be brought in. When this personnel change occurs there is a period when the outgoing worker’s productivity diminishes due to time being monopolised in handovers and a general winding-down process. Unfortunately, productivity can’t instantly resume when a new person is brought in as incoming employees take a long time to adjust to their new environment and role.
6
The UK is undergoing a period of considerable investment in engineering works. In 2014 the government committed to continue a programme of infrastructure improvement, including £15 billion of investment in the Strategic Road Network (part of the new road investment strategy that includes 100 major schemes), a £2.3 billion programme of flood investment covering 1,400 schemes to protect at least 300,000 homes, and a £38 billion Network Rail delivery programme2. The government also pledged continued support for digital and science infrastructure.
Siemens claims that engineering employers have the ability to generate a further £27 billion per year from 20223. This is the equivalent to the cost of building 1,800 secondary schools or 110 new hospitals. However, the ability to achieve these things could be in jeopardy if 257,000 new vacancies aren’t created and filled in the same time scale.
Unfortunately this could prove to be difficult. In the 2014 IET skills survey, 59 per cent of companies indicated their concern that a shortage of engineers would be a threat to their business4. It was also found that for the ninth year running the skills gap increased and 44 per cent of employers said that engineering, IT and technical recruits did not meet reasonable expectations for levels of skills. As the old guard steps down and skills leave the business, these stats are a concern. The knowledge cliff is looming large and organisations now need to find a way to deal with it.
The answer is thought to lie in a combination of skill retention, cultivation and acquisition. However, no matter the approach taken, there is still a retention gap that emerges as experienced staff leave a business. This inevitably impacts on productivity and it does so in five key ways: Loss of productive output while staff leave, time to raise productivity of new staff, time-lag, the price of recruitment and risk.
UNDERSTANDING THE RETENTION GAP CHALLENGE
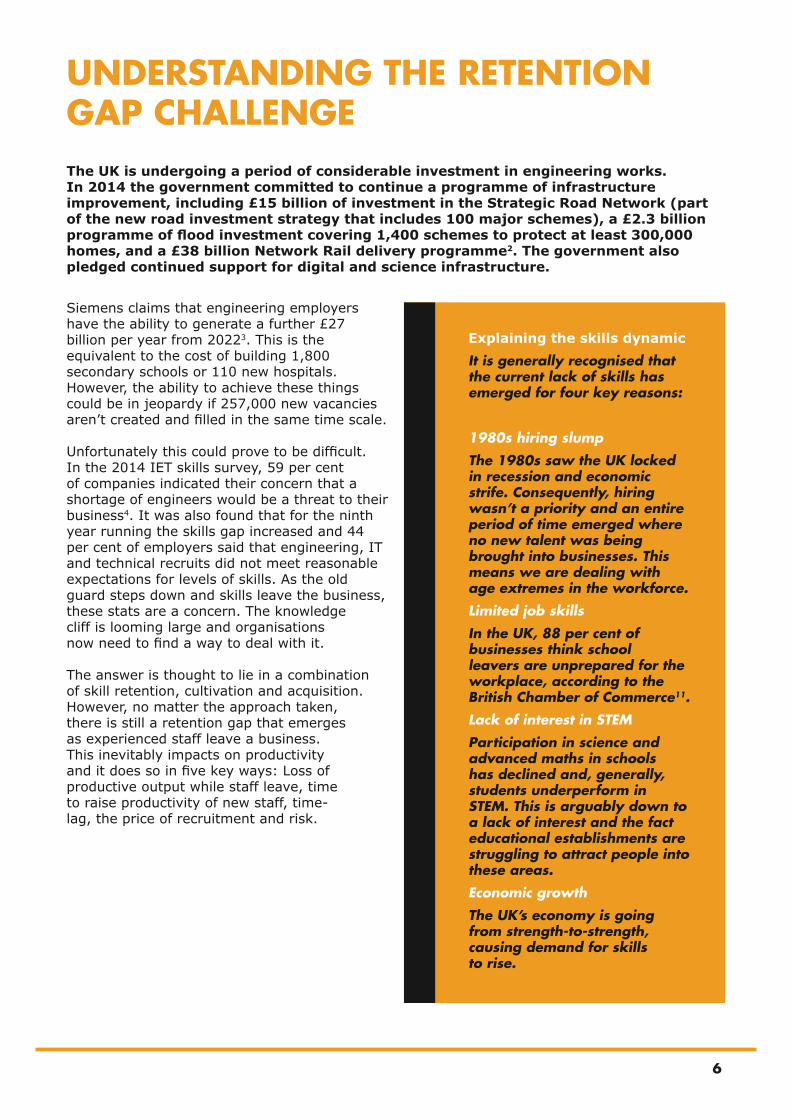
Explaining the skills dynamicIt is generally recognised that the current lack of skills has emerged for four key reasons:
1980s hiring slump
The 1980s saw the UK locked in recession and economic strife. Consequently, hiring wasn’t a priority and an entire period of time emerged where no new talent was being brought into businesses. This means we are dealing with age extremes in the workforce.
Limited job skills
In the UK, 88 per cent of businesses think school leavers are unprepared for the workplace, according to the British Chamber of Commerce11.
Lack of interest in STEM
Participation in science and advanced maths in schools has declined and, generally, students underperform in STEM. This is arguably down to a lack of interest and the fact educational establishments are struggling to attract people into these areas.
Economic growth
The UK’s economy is going from strength-to-strength, causing demand for skills to rise.
7
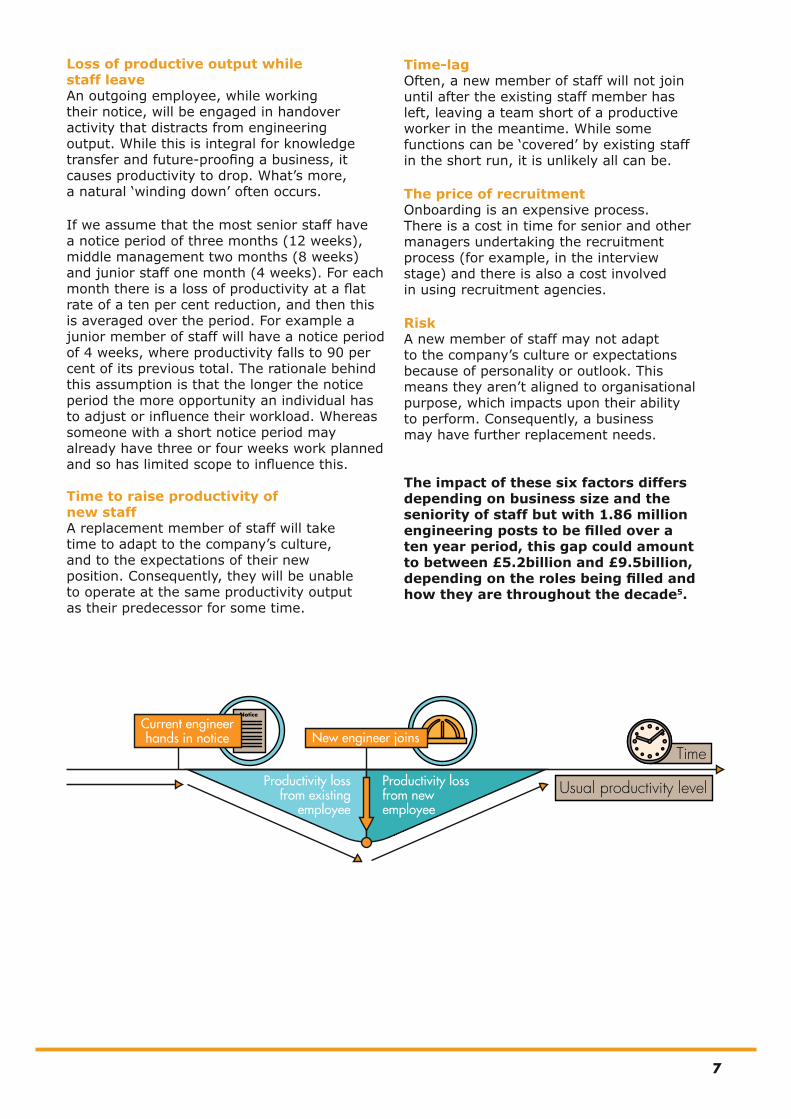
Loss of productive output while staff leaveAn outgoing employee, while working their notice, will be engaged in handover activity that distracts from engineering output. While this is integral for knowledge transfer and future-proofing a business, it causes productivity to drop. What’s more, a natural ‘winding down’ often occurs. If we assume that the most senior staff have a notice period of three months (12 weeks), middle management two months (8 weeks) and junior staff one month (4 weeks). For each month there is a loss of productivity at a flat rate of a ten per cent reduction, and then this is averaged over the period. For example a junior member of staff will have a notice period of 4 weeks, where productivity falls to 90 per cent of its previous total. The rationale behind this assumption is that the longer the notice period the more opportunity an individual has to adjust or influence their workload. Whereas someone with a short notice period may already have three or four weeks work planned and so has limited scope to influence this.
Time to raise productivity of new staffA replacement member of staff will take time to adapt to the company’s culture, and to the expectations of their new position. Consequently, they will be unable to operate at the same productivity output as their predecessor for some time.
Time-lagOften, a new member of staff will not join until after the existing staff member has left, leaving a team short of a productive worker in the meantime. While some functions can be ‘covered’ by existing staff in the short run, it is unlikely all can be.
The price of recruitmentOnboarding is an expensive process. There is a cost in time for senior and other managers undertaking the recruitment process (for example, in the interview stage) and there is also a cost involved in using recruitment agencies.
RiskA new member of staff may not adapt to the company’s culture or expectations because of personality or outlook. This means they aren’t aligned to organisational purpose, which impacts upon their ability to perform. Consequently, a business may have further replacement needs.
The impact of these six factors differs depending on business size and the seniority of staff but with 1.86 million engineering posts to be filled over a ten year period, this gap could amount to between £5.2billion and £9.5billion, depending on the roles being filled and how they are throughout the decade5.
Notice
Productivity loss from existing
employee
Productivity loss from newemployee
Usual productivity level
Current engineer hands in notice New engineer joins
Time
8
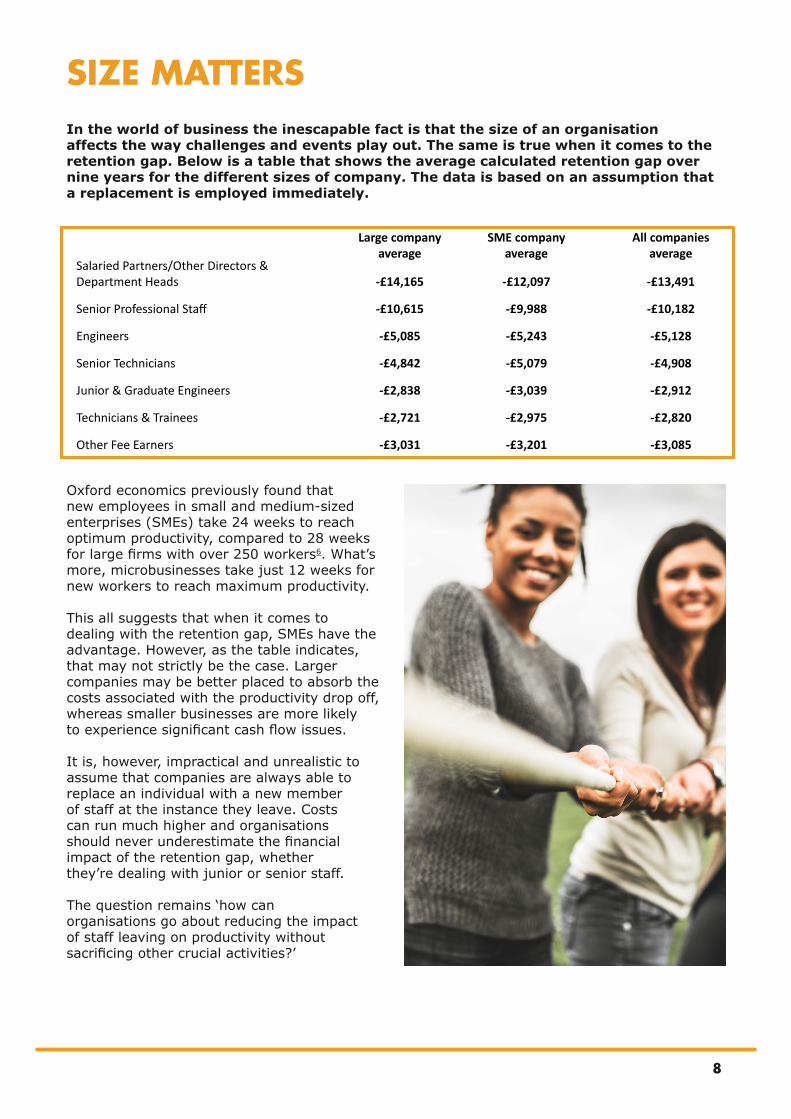
In the world of business the inescapable fact is that the size of an organisation affects the way challenges and events play out. The same is true when it comes to the retention gap. Below is a table that shows the average calculated retention gap over nine years for the different sizes of company. The data is based on an assumption that a replacement is employed immediately.
Oxford economics previously found that new employees in small and medium-sized enterprises (SMEs) take 24 weeks to reach optimum productivity, compared to 28 weeks for large firms with over 250 workers6. What’s more, microbusinesses take just 12 weeks for new workers to reach maximum productivity.
This all suggests that when it comes to dealing with the retention gap, SMEs have the advantage. However, as the table indicates, that may not strictly be the case. Larger companies may be better placed to absorb the costs associated with the productivity drop off, whereas smaller businesses are more likely to experience significant cash flow issues.
It is, however, impractical and unrealistic to assume that companies are always able to replace an individual with a new member of staff at the instance they leave. Costs can run much higher and organisations should never underestimate the financial impact of the retention gap, whether they’re dealing with junior or senior staff.
The question remains ‘how can organisations go about reducing the impact of staff leaving on productivity without sacrificing other crucial activities?’
SIZE MATTERS
Large company average
SME company average
All companies average
Salaried Partners/Other Directors & Department Heads -£14,165 -£12,097 -£13,491
Senior Professional Staff -£10,615 -£9,988 -£10,182
Engineers -£5,085 -£5,243 -£5,128
Senior Technicians -£4,842 -£5,079 -£4,908
Junior & Graduate Engineers -£2,838 -£3,039 -£2,912
Technicians & Trainees -£2,721 -£2,975 -£2,820
Other Fee Earners -£3,031 -£3,201 -£3,085
9
Having analysed nine years of company data collected by the ACE Benchmarking programme, and with further evidence provided by industry working with EngTechNow, we have arrived at a three point plan – which will be elaborated on in the rest of this White Paper – that the smallest and largest engineering employers and clients can follow to reduce the productivity cost of recruitment.
Promotion ready staffThe impact on productivity of losing a member of staff varies according to their position. By having staff in place who are already prepared for promotion, the need for recruitment can be pushed down to more junior positions. This reduces the productivity cost and the risk that a new member of staff does not adapt to the company’s culture and expectations. Furthermore, it creates a ‘recruitment from within’ culture that centres on greater professional development.
Address the first yearIt has long been asserted that investing in staff is a means of reducing staff turnover, though empirical evidence of this is complicated to establish. With strong evidence that staff are more likely to leave in the first year than in later years, however, creating channels to embed staff successfully is vital to reducing replacement needs. This of course has to be complemented by effective recruitment. By hiring proven professionals who fit their corporate culture, companies can reduce the risk of hiring someone who does not work out.
FlexibilityThe ability to move technicians and engineers seamlessly between parts of the business can put significant control of replacement in the hands of an employer. It gives greater control over start dates and over where any time lag may occur. It can also help to ensure that more senior positions are taken up by people already knowledgeable about the company’s practices – speeding up the time it take them to become fully productive.
OUR THREE POINT PLAN
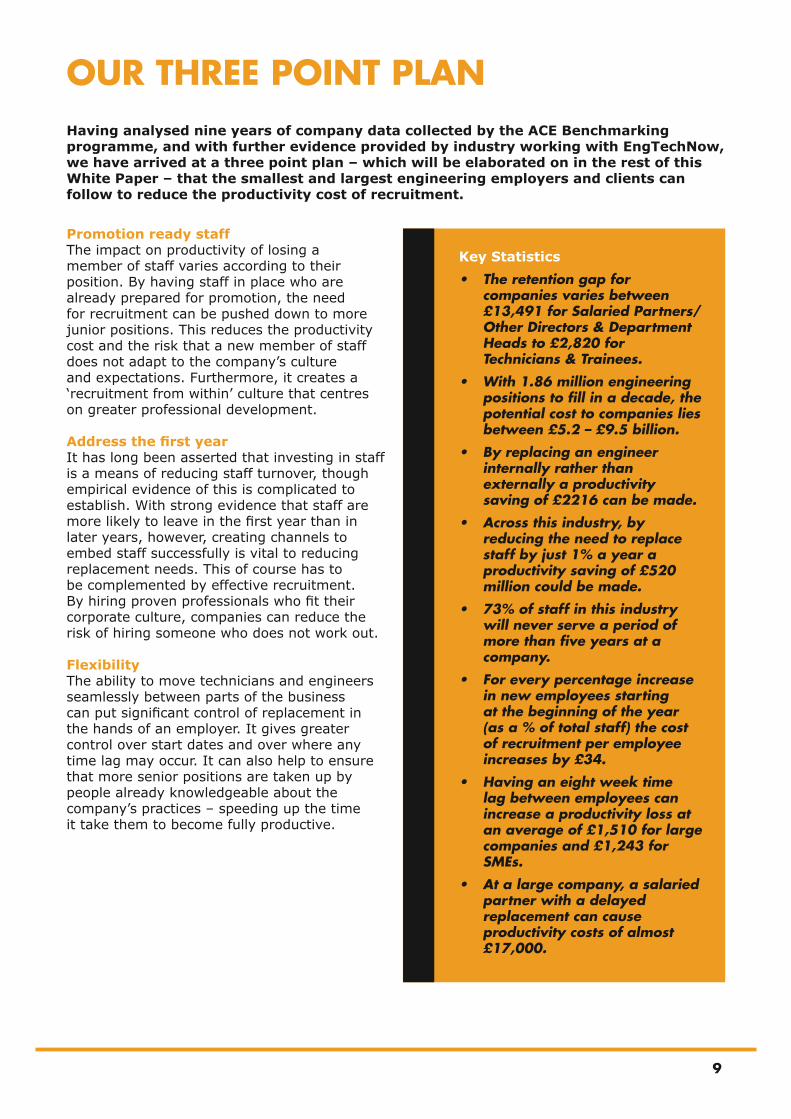
Key Statistics• The retention gap for
companies varies between £13,491 for Salaried Partners/Other Directors & Department Heads to £2,820 for Technicians & Trainees.
• With 1.86 million engineering positions to fill in a decade, the potential cost to companies lies between £5.2 – £9.5 billion.
• By replacing an engineer internally rather than externally a productivity saving of £2216 can be made.
• Across this industry, by reducing the need to replace staff by just 1% a year a productivity saving of £520 million could be made.
• 73% of staff in this industry will never serve a period of more than five years at a company.
• For every percentage increase in new employees starting at the beginning of the year (as a % of total staff) the cost of recruitment per employee increases by £34.
• Having an eight week time lag between employees can increase a productivity loss at an average of £1,510 for large companies and £1,243 for SMEs.
• At a large company, a salaried partner with a delayed replacement can cause productivity costs of almost £17,000.
10
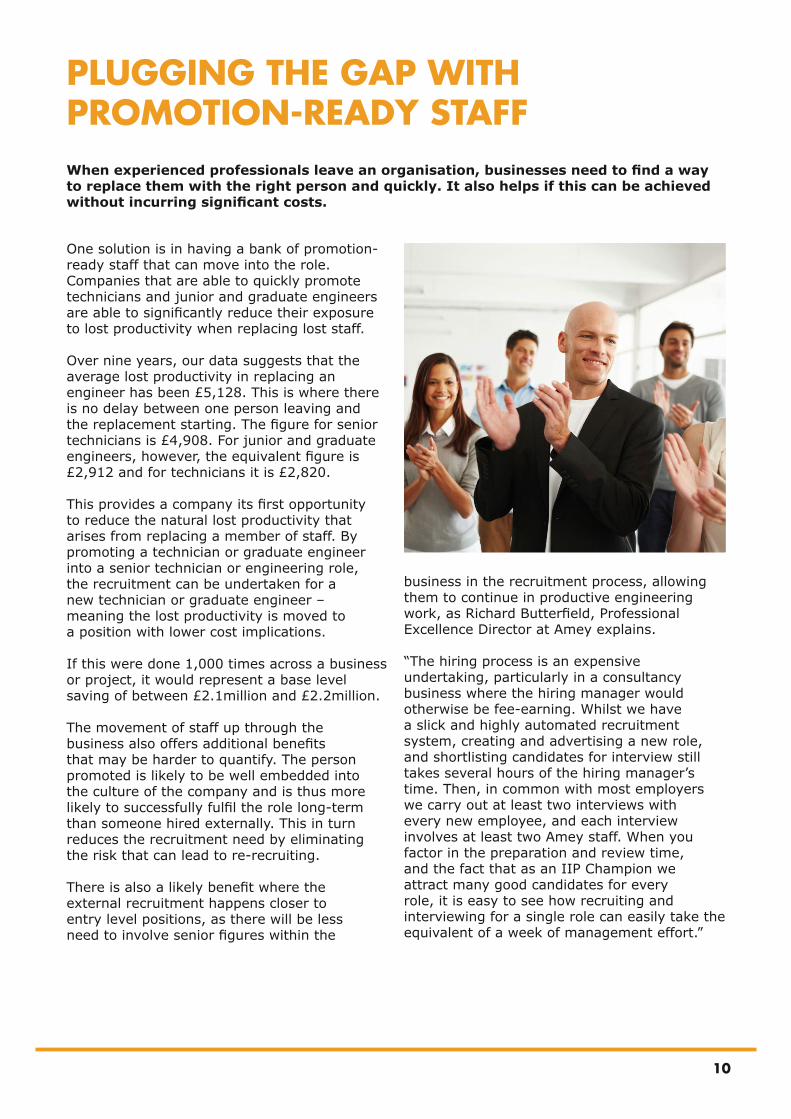
One solution is in having a bank of promotion-ready staff that can move into the role. Companies that are able to quickly promote technicians and junior and graduate engineers are able to significantly reduce their exposure to lost productivity when replacing lost staff.
Over nine years, our data suggests that the average lost productivity in replacing an engineer has been £5,128. This is where there is no delay between one person leaving and the replacement starting. The figure for senior technicians is £4,908. For junior and graduate engineers, however, the equivalent figure is £2,912 and for technicians it is £2,820.
This provides a company its first opportunity to reduce the natural lost productivity that arises from replacing a member of staff. By promoting a technician or graduate engineer into a senior technician or engineering role, the recruitment can be undertaken for a new technician or graduate engineer – meaning the lost productivity is moved to a position with lower cost implications.
If this were done 1,000 times across a business or project, it would represent a base level saving of between £2.1million and £2.2million.
The movement of staff up through the business also offers additional benefits that may be harder to quantify. The person promoted is likely to be well embedded into the culture of the company and is thus more likely to successfully fulfil the role long-term than someone hired externally. This in turn reduces the recruitment need by eliminating the risk that can lead to re-recruiting.
There is also a likely benefit where the external recruitment happens closer to entry level positions, as there will be less need to involve senior figures within the
PLUGGING THE GAP WITH PROMOTION-READY STAFF
business in the recruitment process, allowing them to continue in productive engineering work, as Richard Butterfield, Professional Excellence Director at Amey explains.
“The hiring process is an expensive undertaking, particularly in a consultancy business where the hiring manager would otherwise be fee-earning. Whilst we have a slick and highly automated recruitment system, creating and advertising a new role, and shortlisting candidates for interview still takes several hours of the hiring manager’s time. Then, in common with most employers we carry out at least two interviews with every new employee, and each interview involves at least two Amey staff. When you factor in the preparation and review time, and the fact that as an IIP Champion we attract many good candidates for every role, it is easy to see how recruiting and interviewing for a single role can easily take the equivalent of a week of management effort.”
When experienced professionals leave an organisation, businesses need to find a way to replace them with the right person and quickly. It also helps if this can be achieved without incurring significant costs.

11
As with most industries and companies, the engineering sector faces several challenges with regards to internal recruitment. Organisations that don’t invest in training employees and encourage learning can’t expect to have a bank of promotion-ready staff. Companies must therefore ensure that a culture is created that sees staff prepare themselves – with the help of employers – for promotion within the business. By facilitating employees into a professional development programme, organisations are cultivating this desired culture and helping to make effective internal recruitment a reality. This has the dual benefit of demonstrating the presence of development opportunities, which are crucial for retention (we’ll look at this again in the next chapter).
The other challenge when promoting internally is created by the current skills shortage: If you promote a graduate engineer, for example, you then need to find a suitable replacement when there are very few coming out of universities. The increasing global competition for engineering talent means that the past solution of hiring from abroad is also likely to play a smaller role in future.
Chris Sexton, Technical Director at Crossrail, told EngTechNow that this is a long term
problem and it is unfortunately making it hard for organisations to offer development opportunities. “Many graduates spend years on that first rung of the ladder because industry can’t replace them quickly enough for them to move on to new things.”
Of course, graduates aren’t the only option. While it is often expected that people holding relatively senior positions have the status traditionally conferred by a degree, there are other ways into the profession that need to be looked at. Good practice can then be ensured by using professional registration. EngTech, IEng and CEng are all externally verified and provide evidence of an individual’s experience and professionalism.
This means that along with serving as a valuable indicator internally of who is ready for promotion, professional registration and continuous professional development can ensure the quality you’d expect from the staff you consider for promotion.
All this serves to reinforce the development and internal recruitment culture, while ensuring professionals have an easier transition to take up the responsibilities of the new role, thanks to EngTech status, reducing the time it takes for them to become fully productive.
12
RETAINING STAFF AND ADDRESSING THE FIRST YEAR
This means if organisations fail to have a retention strategy in place, they are essentially throwing money down the drain. After all, as mentioned previously, onboarding is a costly business, productivity drop off is significant among exiting staff and skills hard to come by.
Reducing the need to replace staff by just one per cent per year throughout this decade would amount to a productivity saving of at least £520 million per year across the industry. Getting this first year right is clearly crucial to reduce replacement needs, foster loyalty and strengthen the business.
“The days of pulling out a job spec and matching it with CVs are gone – or if they are not, they should be,” says Keith Lewis, Chief Operating Officer of Matchtech Group. “Technical skills can be learnt and transferred but behaviours can’t; if a company hires someone with the right technical knowledge but the wrong professional or personality fit, it probably won’t last.”
And of course applicants need to know the company will fit their personality too. “Applicants must be given all the necessary information to fully understand the company that they are potentially joining to ensure full commitment from the outset, so they don’t move on soon after joining,” explains Keith. “This means companies must not only sell themselves well, but they must outline the culture, vision and direction of the organisation.”
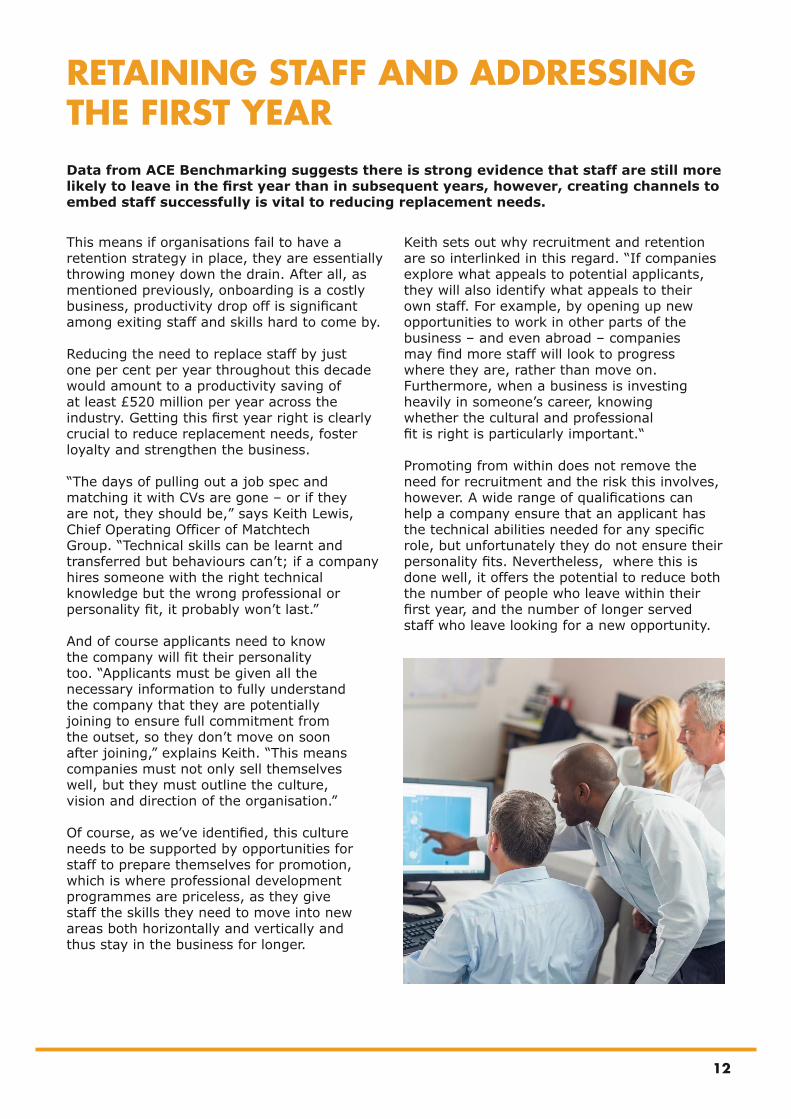
Of course, as we’ve identified, this culture needs to be supported by opportunities for staff to prepare themselves for promotion, which is where professional development programmes are priceless, as they give staff the skills they need to move into new areas both horizontally and vertically and thus stay in the business for longer.
Keith sets out why recruitment and retention are so interlinked in this regard. “If companies explore what appeals to potential applicants, they will also identify what appeals to their own staff. For example, by opening up new opportunities to work in other parts of the business – and even abroad – companies may find more staff will look to progress where they are, rather than move on. Furthermore, when a business is investing heavily in someone’s career, knowing whether the cultural and professional fit is right is particularly important.“
Promoting from within does not remove the need for recruitment and the risk this involves, however. A wide range of qualifications can help a company ensure that an applicant has the technical abilities needed for any specific role, but unfortunately they do not ensure their personality fits. Nevertheless, where this is done well, it offers the potential to reduce both the number of people who leave within their first year, and the number of longer served staff who leave looking for a new opportunity.
Data from ACE Benchmarking suggests there is strong evidence that staff are still more likely to leave in the first year than in subsequent years, however, creating channels to embed staff successfully is vital to reducing replacement needs.

13
THE IMPORTANCE OF FLEXIBILITY
For organisations this means they have greater control over the timing of staff replacements and the culture of their company. While a business will often seek to replace a member of staff immediately, there is often a lag between one member of staff leaving and a replacement starting. Our research with ACE suggests this can cost up to £3,692 – depending on the particular position and circumstance of the recruitment being undertaken. This is something that companies can take control of just by ensuring there is flexibility within the workforce.
When one field of engineering faces the greatest competition for staff it is likely to be both the field in which retention and replacement both become most complicated. Consequently, finding a work around is key and there is great value for businesses in moving people from one field of work to another. Essentially, this allows organisations to recruit from a wider pool of talent than available in an under pressure specialism.
This is something that Transport for London has found out. Dana Skelly, Head of Asset Management at TfL, explained: “We are moving away from a culture of stove pipe development in which people can move up only within their existing specialism. That started with the Olympics which saw many staff take on a wide variety of opportunities in areas of work they would not have experienced in the past.”
That ‘unlocking’ of staff careers has enabled TfL to encourage more movement across the business rather than just up one particular ladder. “Leaders of the business in future need a rounded understanding of the company,” explains Dana. “Engineers and technicians benefit from stakeholder engagement and we have a range of events we are involved in supporting that. These enable us to embed
that culture of new experiences – such as the London Marathon - into the business.”
There may be significant additional benefits to this broader approach of enabling people to move from one part of the business to another by creating an internal hiring culture and supporting learning. A study at the University of Pennsylvania’s Wharton School found that internal hires often outperform external hires for several years after the post is filled7. Opening up promotion opportunities internally is also likely to give staff greater reason to stay within a business as it shows that with hard work they can advance and grow. In ‘Navigating Ambiguity: Career Research Report 2014’, Blessingwhite found that employees are more likely to stay loyal to a company if there are opportunities for development8.
Top organisations generally have one thing in common: they have the ability to be flexible. EngTech status does more than offer staff a diverse career in exchange for loyalty; it gives them the skills to operate in different parts of a business.
14
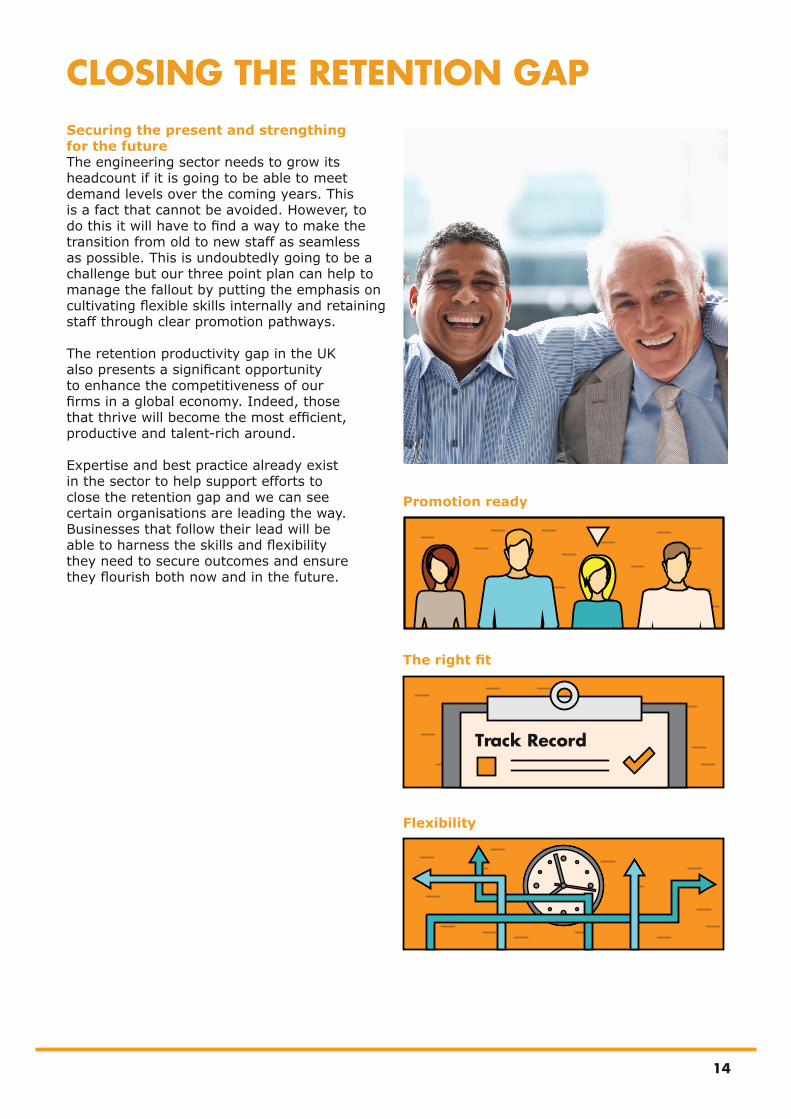
Securing the present and strengthing for the futureThe engineering sector needs to grow its headcount if it is going to be able to meet demand levels over the coming years. This is a fact that cannot be avoided. However, to do this it will have to find a way to make the transition from old to new staff as seamless as possible. This is undoubtedly going to be a challenge but our three point plan can help to manage the fallout by putting the emphasis on cultivating flexible skills internally and retaining staff through clear promotion pathways.
The retention productivity gap in the UK also presents a significant opportunity to enhance the competitiveness of our firms in a global economy. Indeed, those that thrive will become the most efficient, productive and talent-rich around.
Expertise and best practice already exist in the sector to help support efforts to close the retention gap and we can see certain organisations are leading the way. Businesses that follow their lead will be able to harness the skills and flexibility they need to secure outcomes and ensure they flourish both now and in the future.
CLOSING THE RETENTION GAP
Track Record
Promotion ready
The right fit
Flexibility

CASE STUDIES
16
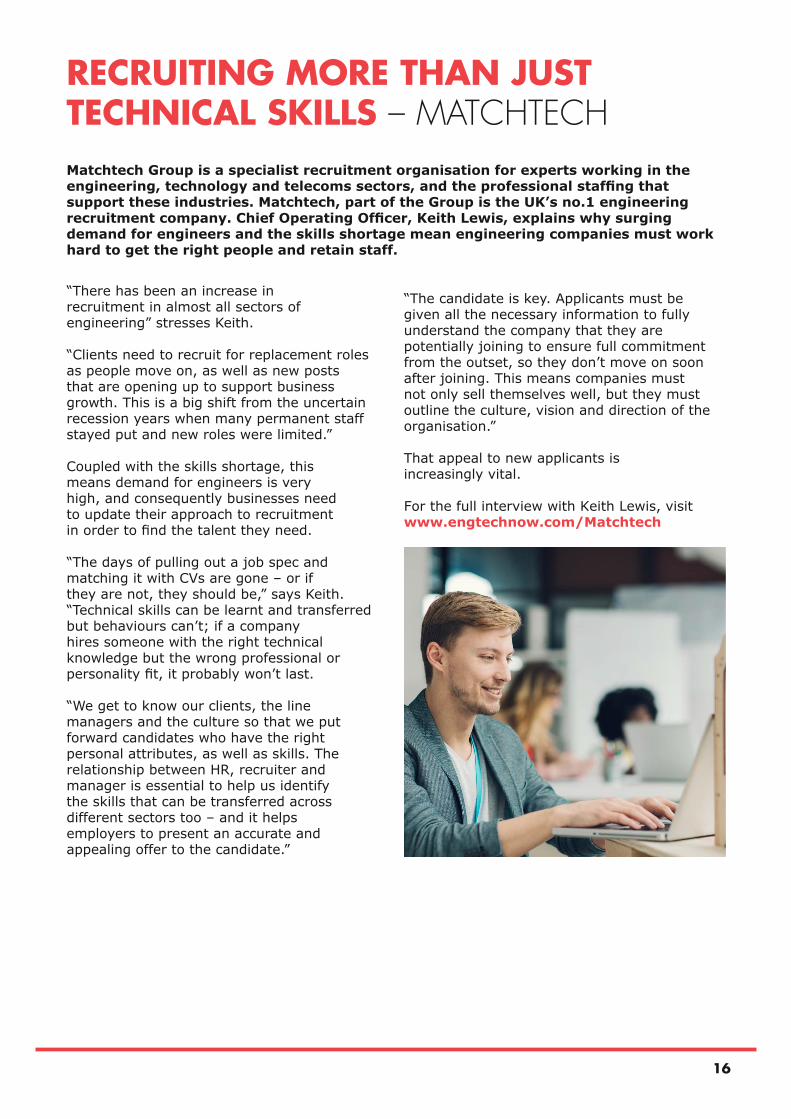
RECRUITING MORE THAN JUST TECHNICAL SKILLS – MATCHTECHMatchtech Group is a specialist recruitment organisation for experts working in the engineering, technology and telecoms sectors, and the professional staffing that support these industries. Matchtech, part of the Group is the UK’s no.1 engineering recruitment company. Chief Operating Officer, Keith Lewis, explains why surging demand for engineers and the skills shortage mean engineering companies must work hard to get the right people and retain staff.
“There has been an increase in recruitment in almost all sectors of engineering” stresses Keith.
“Clients need to recruit for replacement roles as people move on, as well as new posts that are opening up to support business growth. This is a big shift from the uncertain recession years when many permanent staff stayed put and new roles were limited.”
Coupled with the skills shortage, this means demand for engineers is very high, and consequently businesses need to update their approach to recruitment in order to find the talent they need.
“The days of pulling out a job spec and matching it with CVs are gone – or if they are not, they should be,” says Keith. “Technical skills can be learnt and transferred but behaviours can’t; if a company hires someone with the right technical knowledge but the wrong professional or personality fit, it probably won’t last.
“We get to know our clients, the line managers and the culture so that we put forward candidates who have the right personal attributes, as well as skills. The relationship between HR, recruiter and manager is essential to help us identify the skills that can be transferred across different sectors too – and it helps employers to present an accurate and appealing offer to the candidate.”
“The candidate is key. Applicants must be given all the necessary information to fully understand the company that they are potentially joining to ensure full commitment from the outset, so they don’t move on soon after joining. This means companies must not only sell themselves well, but they must outline the culture, vision and direction of the organisation.”
That appeal to new applicants is increasingly vital.
For the full interview with Keith Lewis, visit www.engtechnow.com/Matchtech

17
WIDENING THE POOL OF INTERNAL TALENT – TFLTransport for London (TfL) is a major employer of technicians, and a large client organisation for engineering companies. Dana Skelley, Director of Asset Management, explains how they are addressing the need for talent and learning from valuable experience gained during the Olympics in 2012.
“We need to ensure the pond we fish in is as deep as possible,” explains Dana Skelley. “So diversity and development from within is vital, and we are undertaking a programme of professional registration to strengthen that by making our careers more attractive to potential applicants and to the people already working with us.”
That pool of talent is one TfL shares with its contractors, and as a major client it sees that relationship as particularly valuable.
“We are in the third year of an eight year London Highways framework that requires contractors to hire apprentices. We do the same across London Traffic Signals and Maintenance, and major projects like Hammersmith flyover strengthening.
“The key to this is that all apprenticeships have to be outcome based. The value of the qualifications achieved can help with that, but we really need people who are prepared for career progression and who have the opportunity to grow.
Those promotions are also less linear than in the past, as Dana Skelley points out.
“We are moving away from a culture of ‘stovepipe development’. Industry can often focus career progression within a specialism but it can be really valuable to staff and the business to promote across the business.
“During our work on the London Olympics and Paralympics there was a real unlocking of that culture at TfL.
Many of our staff had the opportunity to work across different areas of the project and gain experience thatwent beyond their normal work.
“Since then we have seen more engineers gain greater experience of stakeholder engagement, talking to the public and being travel ambassadors for example.”
For the full interview with Dana Skelly, visit www.engtechnow.com/TfL
18
THE IMPORTANCE OF DEVELOPING AND RETAINING STAFF – THE TECHNICIAN APPRENTICESHIP CONSORTIUM
The future for the consultancy and engineering sector is undoubtedly looking more positive than it has done over the past five years. This optimism, however, is tempered by a concern as to whether we have the right quantity and quality of skilled personnel that we need in order to meet our commitments.
Recent forecasts have shown that the highest annual recruitment requirement is amongst professional and technical staff. These staff are not only vital to delivering the infrastructure needed for the next decade but also as the guardians of industry as they reach the full professional potential.
When replacing a member of staff, vital experience, technical knowledge, and understanding of the company is often lost. This latest piece of research, highlights not only the challenge the industry faces with the turnover of staff which over nine years has averaged 20%, but also the potential cost of the associated recruitment and productivity losses that occur as a result.
The average lost productivity in replacing an engineer over nine years is £5,128 where there is no delay between one person leaving and the replacement starting. The figure for senior technicians is £4,908. For junior and graduate engineers, however, the equivalent figure is £2,912 and for technicians it is £2,820.
This is not an insignificant amount when scaled up the size of large company’s workforces or when considering the potential cash flow constraints SMEs can suffer.
Apprenticeships and fair access are also high on the Government’s agenda and this project successfully addresses both of them. The Technician Apprenticeship Consortium (TAC) model, for example, demonstrates what can be achieved through effective collaboration between companies, the professional institutions and the training sector. Together everyone benefits. Companies are obtaining the skills they need. Young people, particularly those from black ethnic minority and socially disadvantaged backgrounds, have an alternative route to a career as a professional engineer.
The experience of all of the companies in the consortium is that these young people very quickly become invaluable members of the team through their hard work and commitment. As you will see from reading the document there are also some significant challenges for everyone involved if we are to make the most of the opportunity open to us to access these young people and convince them to join us as engineers of the future.
It is these benefits, and the commitment of technicians that overcome the challenge company’s face when promoting them through the engineer level of seniority. This report reveals that operating alone and looking purely at productivity and recruitment costs, promoting a senior technician due to the close nature of their output and wages does not necessarily result in a productivity benefit. This figure does not, however, include the commitment and wider skills of the individual mentioned previously.
Equally important is the collaboration that TAC offers, it effectively reduces the cost of undertaking such development activity, whilst also improving the benefits such as growing committed and staff that are interested in long term careers.
This report provides an interesting insight into the cost of retention and where companies need to focus their efforts if we are to generate the next generation of engineers, senior professionals and industry leaders.
Graham Nicholson - Chairman, Technician Apprenticeship Consortium and Executive Managing Director, Tony Gee and Partnerswww.tacnet.org.uk
19
FROM TRAINEE ENGINEER TO ASSISTANT PROJECT MANAGER – THAMES TIDEWAY TUNNEL
On the £4.2bn Thames Tideway Tunnel project, which aims to prevent untreated sewage over-flowing from London’s Victorian sewerage system into the River Thames, there are many interfaces with utility providers – 15km of water mains, 34km of gas mains and 18km of sewers. In some case utility services need to be diverted because they interfere with the construction of the main works.
The team managing the diversion of these various utilities at the project’s 24 proposed construction sites require individuals with a good knowledge of the proposals at each site. It can take months to become familiar with these and, when people leave, they take with them significant amounts of knowledge. So when they sought to recruit a project manager to oversee the engineering, procurement, construction and commissioning activities for these works, the advantage of filling the post with one of the project’s trainee engineers was clear. Charles had undertaken various placements over the previous 18 months. The time that he spent with the utilities team in the design phase gave him a good understanding of the technical difficulties in managing complex utility diversions. Of Charles’ attributes, Utilities Programme Manager Ian Simmonds says: “Charles was a natural choice. During his placement with the team he demonstrated a thirst for knowledge and developed an appreciation for the potential programme impact that these works could have on the main works contracts and how important it is to get it right. “When the opportunity arose to offer Charles a full time position I didn’t hesitate. The time invested by the team was money well spent as Charles’ familiarity ensured a smooth transition into his current role. It also enabled me to continue with his mentoring to help him develop his skills further whilst ensuring the delivery of a key element of the Tideway Project.”
Thames Tideway Tunnel’s HR team recognises the cost of losing experienced staff and training new ones, whether through lost productivity during the recruitment process and as new staff become familiar with the programme. Recruiting internally also reduces training costs, whilst promotion improves the likelihood of staff retention in the longer term and the transferable skills of the individuals concerned. As more graduate trainees and apprentices complete their programme with Thames Tideway Tunnel, the project is confident that these young people will add value to vacancies elsewhere in the team and learn invaluable skills in the process. In his own words, Charles says of his time at the Thames Tideway Tunnel: “When the opportunity to apply for the Assistant Project Manager role came up, I was confident that I would be able to fulfil the requirements of the role given the technical and commercial knowledge I had developed during my time working with various teams on the project as a trainee engineer. “In my current role, I am directly responsible for the delivery of a section of the utility works on the project. I have been empowered to make decisions on critical issues pertaining to the projects I am looking after. When required, I know that I can call upon some of my colleagues who have offered to mentor and support me in my career development.”
www.thamestidetunnel.co.uk

ANALYSING THE DATA
21
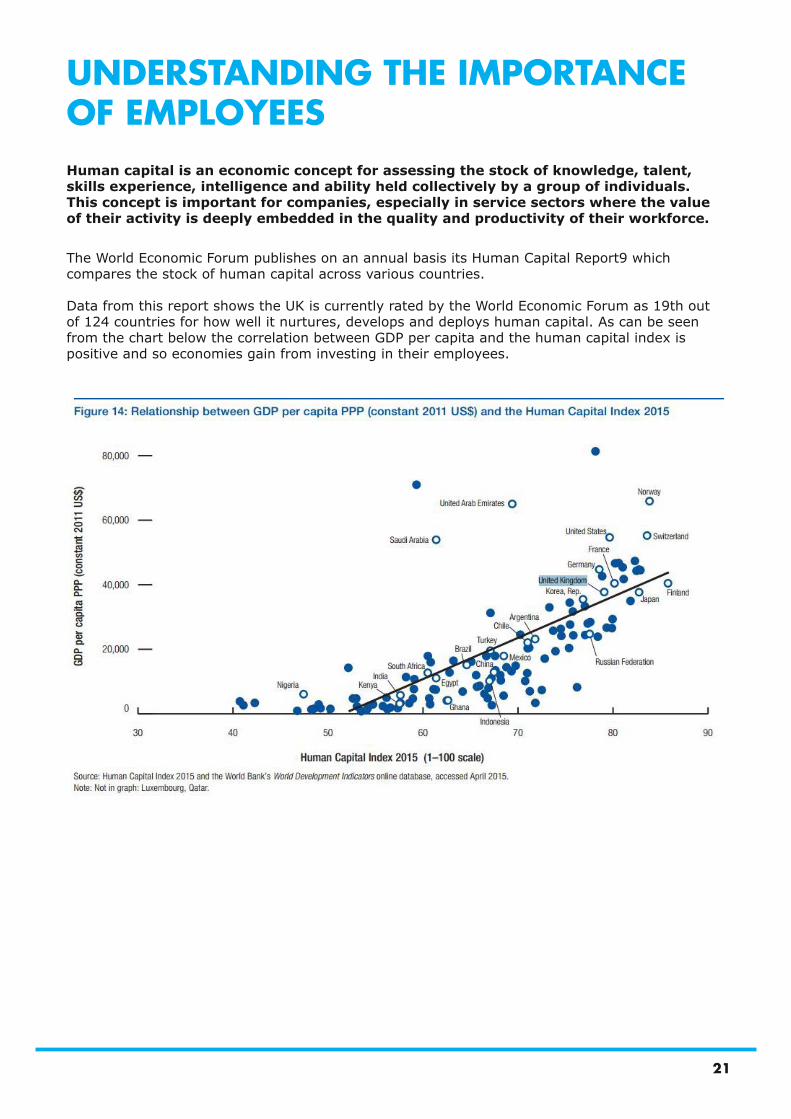
UNDERSTANDING THE IMPORTANCE OF EMPLOYEESHuman capital is an economic concept for assessing the stock of knowledge, talent, skills experience, intelligence and ability held collectively by a group of individuals. This concept is important for companies, especially in service sectors where the value of their activity is deeply embedded in the quality and productivity of their workforce.
The World Economic Forum publishes on an annual basis its Human Capital Report9 which compares the stock of human capital across various countries.
Data from this report shows the UK is currently rated by the World Economic Forum as 19th out of 124 countries for how well it nurtures, develops and deploys human capital. As can be seen from the chart below the correlation between GDP per capita and the human capital index is positive and so economies gain from investing in their employees.
22
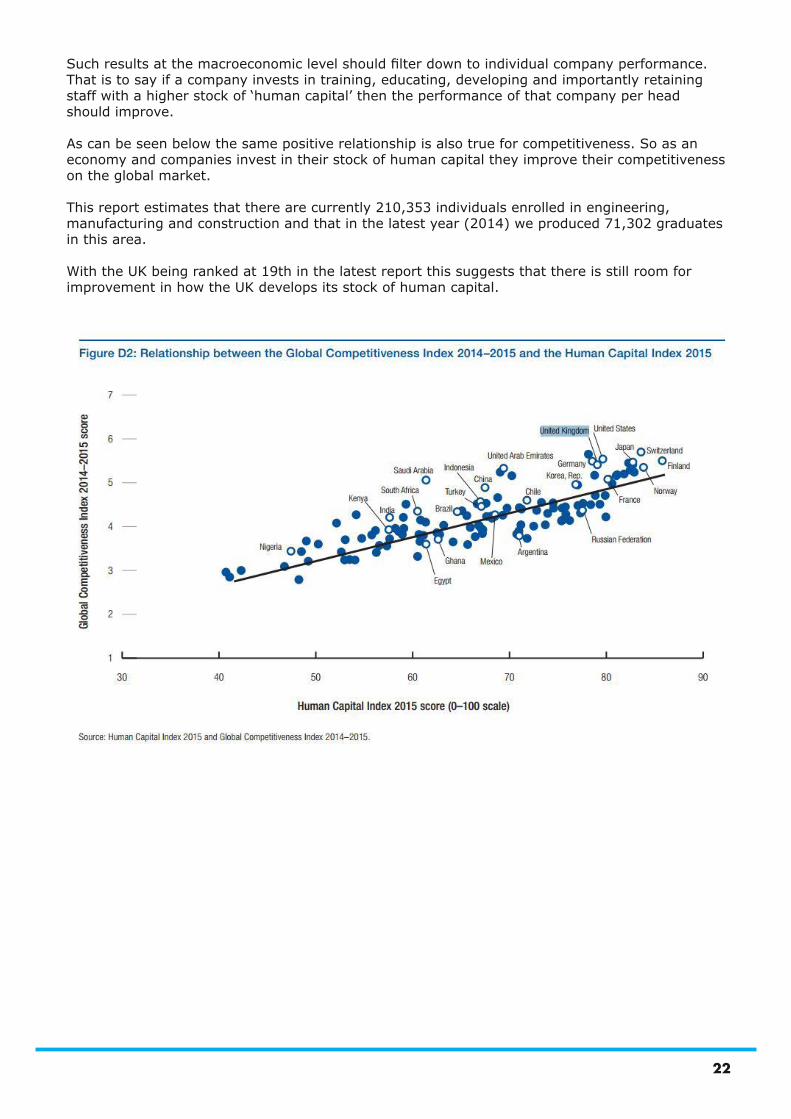
Such results at the macroeconomic level should filter down to individual company performance. That is to say if a company invests in training, educating, developing and importantly retaining staff with a higher stock of ‘human capital’ then the performance of that company per head should improve.
As can be seen below the same positive relationship is also true for competitiveness. So as an economy and companies invest in their stock of human capital they improve their competitiveness on the global market.
This report estimates that there are currently 210,353 individuals enrolled in engineering, manufacturing and construction and that in the latest year (2014) we produced 71,302 graduates in this area. With the UK being ranked at 19th in the latest report this suggests that there is still room for improvement in how the UK develops its stock of human capital.
23
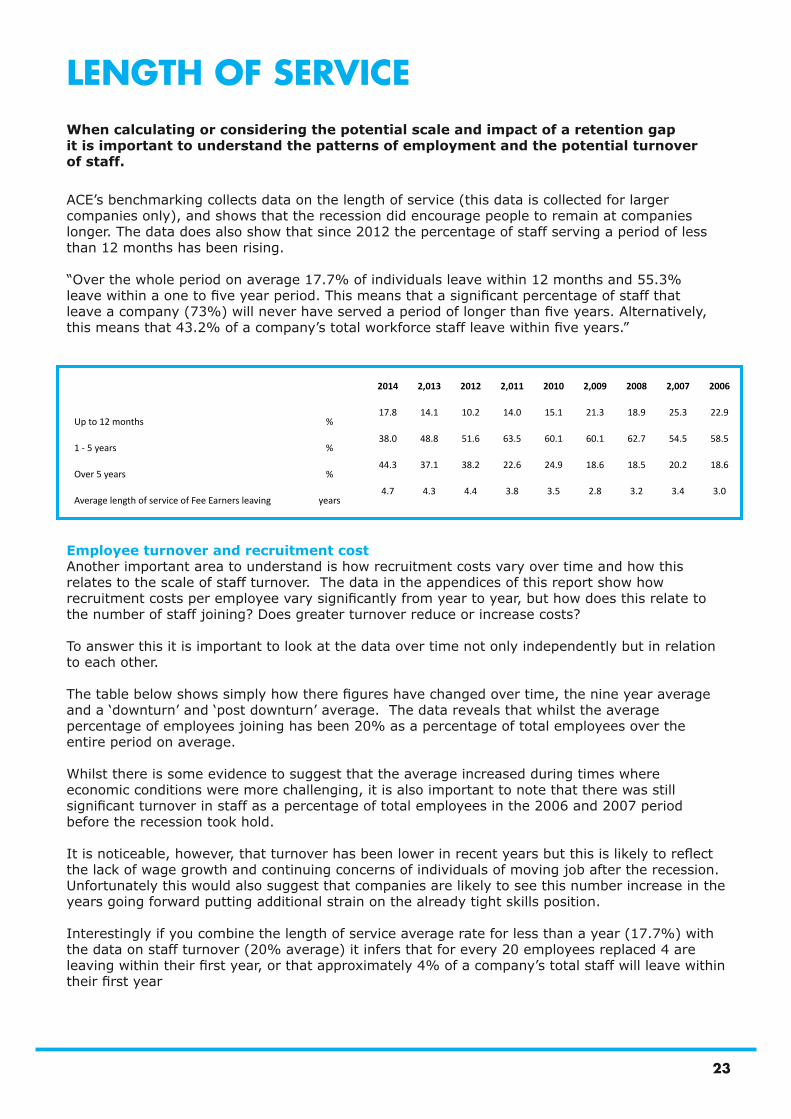
LENGTH OF SERVICEWhen calculating or considering the potential scale and impact of a retention gap it is important to understand the patterns of employment and the potential turnover of staff.
ACE’s benchmarking collects data on the length of service (this data is collected for larger companies only), and shows that the recession did encourage people to remain at companies longer. The data does also show that since 2012 the percentage of staff serving a period of less than 12 months has been rising.
“Over the whole period on average 17.7% of individuals leave within 12 months and 55.3% leave within a one to five year period. This means that a significant percentage of staff that leave a company (73%) will never have served a period of longer than five years. Alternatively, this means that 43.2% of a company’s total workforce staff leave within five years.”
2014 2,013 2012 2,011 2010 2,009 2008 2,007 2006
Up to 12 months %17.8 14.1 10.2 14.0 15.1 21.3 18.9 25.3 22.9
1 - 5 years %38.0 48.8 51.6 63.5 60.1 60.1 62.7 54.5 58.5
Over 5 years %44.3 37.1 38.2 22.6 24.9 18.6 18.5 20.2 18.6
Average length of service of Fee Earners leaving years4.7 4.3 4.4 3.8 3.5 2.8 3.2 3.4 3.0
Employee turnover and recruitment costAnother important area to understand is how recruitment costs vary over time and how this relates to the scale of staff turnover. The data in the appendices of this report show how recruitment costs per employee vary significantly from year to year, but how does this relate to the number of staff joining? Does greater turnover reduce or increase costs?
To answer this it is important to look at the data over time not only independently but in relation to each other.
The table below shows simply how there figures have changed over time, the nine year average and a ‘downturn’ and ‘post downturn’ average. The data reveals that whilst the average percentage of employees joining has been 20% as a percentage of total employees over the entire period on average.
Whilst there is some evidence to suggest that the average increased during times where economic conditions were more challenging, it is also important to note that there was still significant turnover in staff as a percentage of total employees in the 2006 and 2007 period before the recession took hold.
It is noticeable, however, that turnover has been lower in recent years but this is likely to reflect the lack of wage growth and continuing concerns of individuals of moving job after the recession. Unfortunately this would also suggest that companies are likely to see this number increase in the years going forward putting additional strain on the already tight skills position.
Interestingly if you combine the length of service average rate for less than a year (17.7%) with the data on staff turnover (20% average) it infers that for every 20 employees replaced 4 are leaving within their first year, or that approximately 4% of a company’s total staff will leave within their first year
24
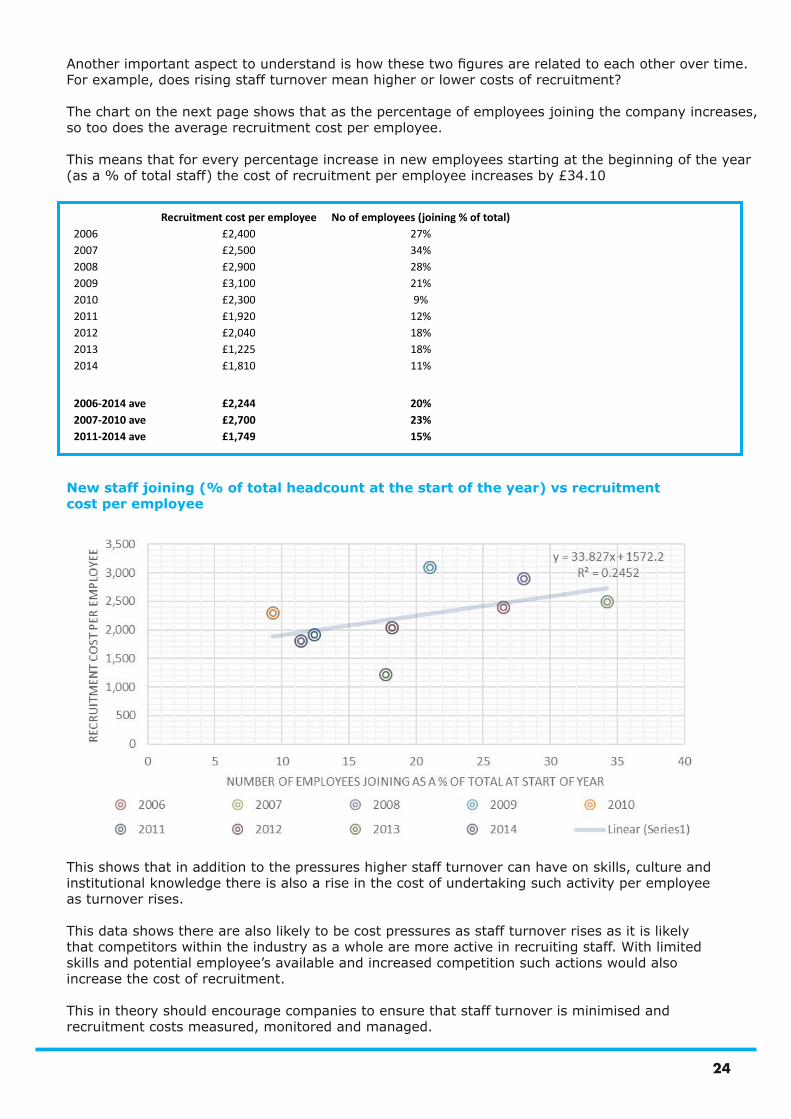
Another important aspect to understand is how these two figures are related to each other over time. For example, does rising staff turnover mean higher or lower costs of recruitment?
The chart on the next page shows that as the percentage of employees joining the company increases, so too does the average recruitment cost per employee.
This means that for every percentage increase in new employees starting at the beginning of the year (as a % of total staff) the cost of recruitment per employee increases by £34.10
Recruitment cost per employee No of employees (joining % of total)2006 £2,400 27%2007 £2,500 34%2008 £2,900 28%2009 £3,100 21%2010 £2,300 9%2011 £1,920 12%2012 £2,040 18%2013 £1,225 18%2014 £1,810 11%
2006-2014 ave £2,244 20%2007-2010 ave £2,700 23%2011-2014 ave £1,749 15%
This shows that in addition to the pressures higher staff turnover can have on skills, culture and institutional knowledge there is also a rise in the cost of undertaking such activity per employee as turnover rises.
This data shows there are also likely to be cost pressures as staff turnover rises as it is likely that competitors within the industry as a whole are more active in recruiting staff. With limited skills and potential employee’s available and increased competition such actions would also increase the cost of recruitment.
This in theory should encourage companies to ensure that staff turnover is minimised and recruitment costs measured, monitored and managed.
New staff joining (% of total headcount at the start of the year) vs recruitment cost per employee
25
MEASURING THE POTENTIAL SCALE OF THE RETENTION GAPTo measure the scale of the retention gap data was utilised from ACE’s benchmarking programme and modelled with the following assumptions:
Productivity factorOnce employees announce their resignation their outlook and commitments towards the organisation change. The employees incentive is to leave in the shortest period possible while producing the lowest reasonable level of output not to jeopardise their future career. Employers on the other hand wish to try to maintain output at the same level as previously was the case and minimise the interruption and cost of replacement.
As such, there are two effects. The first is that there will be a reduction in productivity of the leaving individual, and the second is that the joining member of staff will undertake a period of learning and development to understand the role in order to become fully productive.
This loss and gain in productivity needs to be linked to the actual likelihood and potential for an individual to be able to influence their level of productivity.
As such, in the model we assume that the most senior staff have a notice period of three months (12 weeks), middle management two months (8 weeks) and junior staff one month (4 weeks). For each month it is assumes that there is a loss of productivity at a flat rate of a 10% reduction, and then this is averaged over the period.
So for example a junior member of staff will have a notice period of 4 weeks, where productivity fall to 90% of its previous total. The rationale behind this assumptions is that the longer the notice period the more opportunity an individual has to adjust or influence their workload. Whereas someone with a short notice period may already have 3 or 4 weeks work planned and so has limited scope to influence this.
Finally, this report assumes that the joining member of staff improves their knowledge and productivity since joining at the same rate as the individual that left. That is to say a junior individual will take a month to reach full productivity from 90% to 100% whereas a senior member of staff will take a period of three months. This not only simplifies the model but also therefore assumes that the company intends to maintain operations in the way they did previously. Introducing changes to roles, activities, etc would cause complications that would then make comparisons across roles difficult.
Delayed replacementAnother area the model considers is the difference between being able to replace an employee without any gap between individuals or having a gap between the departing employee and their replacement.
In the calculation of the gap takes into account existing team members being able to undertake in a short term flexibility in assisting with tasks to the extent of being able to undertake 20% of normal productivity, meaning the productivity loss is 80% of the role. This is then offset against the saving from the individuals payroll costs (payroll includes NI, pensions etc).
26
ANALYSING THE RETENTION GAPOne important area to consider as part of the analysis of any potential retention gap is how it varies across companies and various job types. For this reason this report will look not only at various job roles but also in detail at SMEs, large companies and all companies separately in order to identify if there are any significant differences between these groupings.
Given the data we available for this report we analyse the retention gap for the following roles within each company band. For large companies:
• Salaried Partners/Other Directors & Department Heads
• Senior Professional Staff• Engineers • Senior Technicians• Junior & Graduate Engineers• Technicians & Trainees• Other Fee Earners• Finance & Accounts Staff• Marketing Staff• IT Staff• HR Staff• Quality & H&S Staff• General Administration
& Other Support Staff
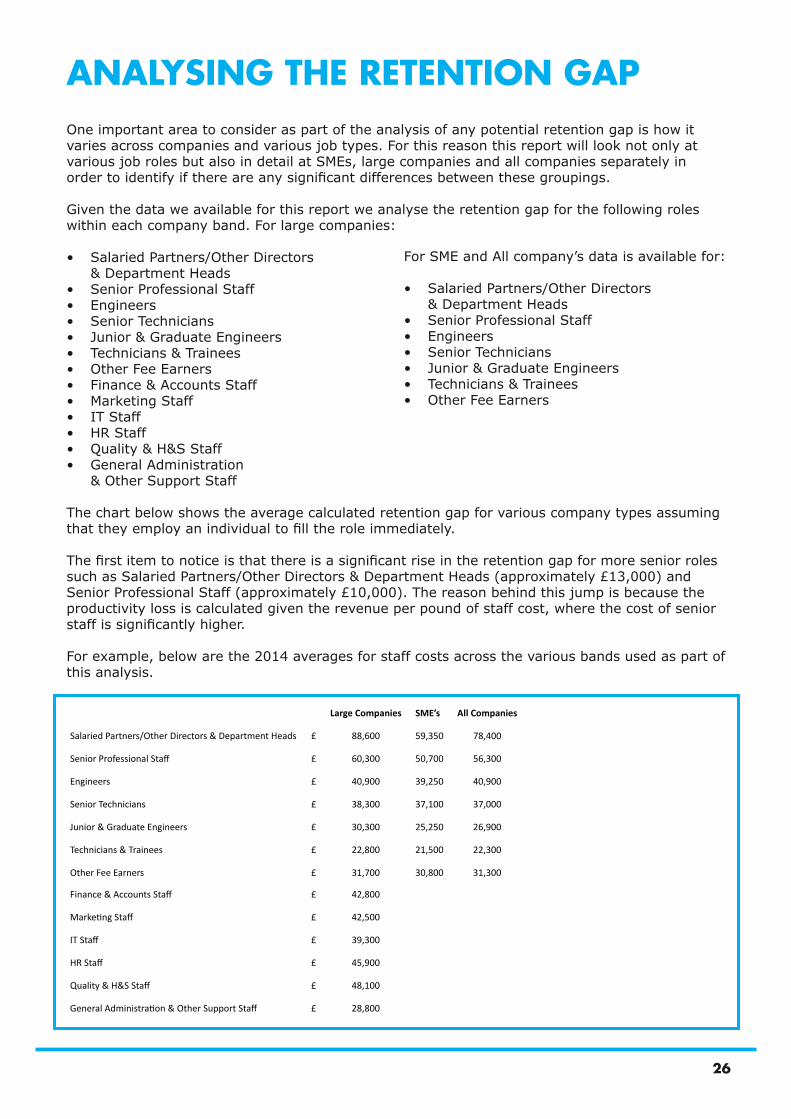
The chart below shows the average calculated retention gap for various company types assuming that they employ an individual to fill the role immediately.
The first item to notice is that there is a significant rise in the retention gap for more senior roles such as Salaried Partners/Other Directors & Department Heads (approximately £13,000) and Senior Professional Staff (approximately £10,000). The reason behind this jump is because the productivity loss is calculated given the revenue per pound of staff cost, where the cost of senior staff is significantly higher.
For example, below are the 2014 averages for staff costs across the various bands used as part of this analysis.
Large Companies SME’s All Companies
Salaried Partners/Other Directors & Department Heads £ 88,600 59,350 78,400
Senior Professional Staff £ 60,300 50,700 56,300
Engineers £ 40,900 39,250 40,900
Senior Technicians £ 38,300 37,100 37,000
Junior & Graduate Engineers £ 30,300 25,250 26,900
Technicians & Trainees £ 22,800 21,500 22,300
Other Fee Earners £ 31,700 30,800 31,300
Finance & Accounts Staff £ 42,800
Marketing Staff £ 42,500
IT Staff £ 39,300
HR Staff £ 45,900
Quality & H&S Staff £ 48,100
General Administration & Other Support Staff £ 28,800
For SME and All company’s data is available for:
• Salaried Partners/Other Directors & Department Heads
• Senior Professional Staff• Engineers • Senior Technicians• Junior & Graduate Engineers• Technicians & Trainees• Other Fee Earners
27
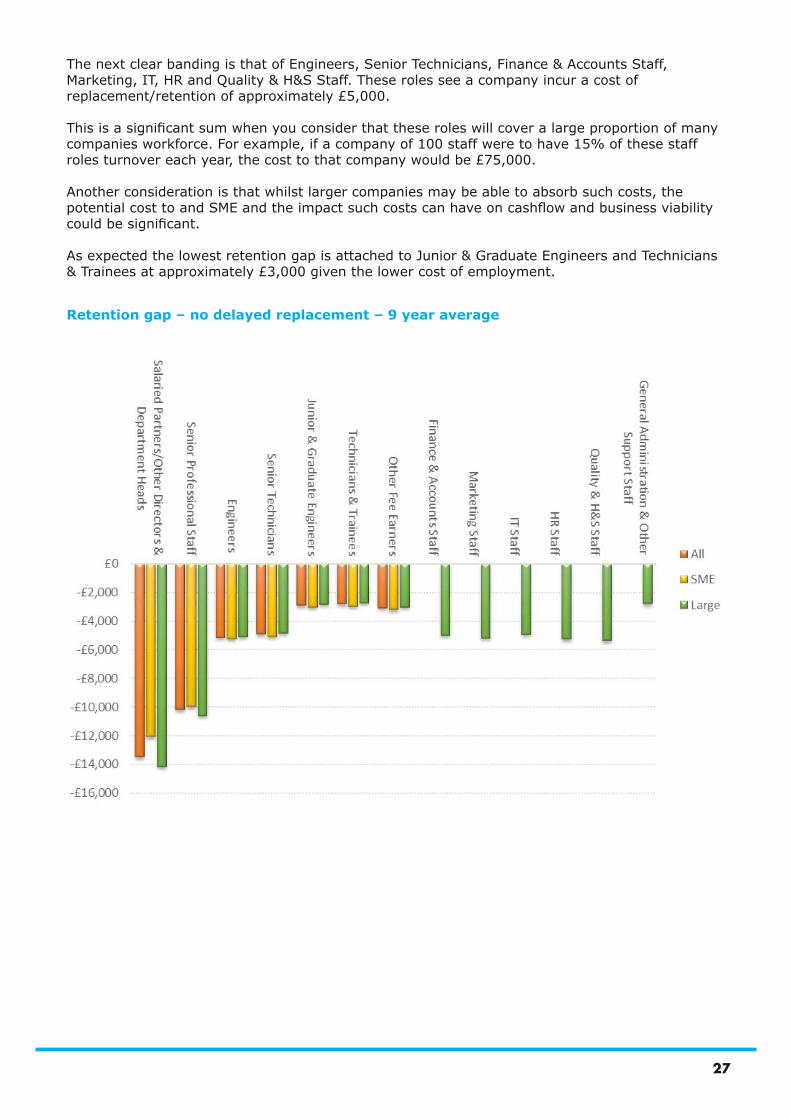
The next clear banding is that of Engineers, Senior Technicians, Finance & Accounts Staff, Marketing, IT, HR and Quality & H&S Staff. These roles see a company incur a cost of replacement/retention of approximately £5,000.
This is a significant sum when you consider that these roles will cover a large proportion of many companies workforce. For example, if a company of 100 staff were to have 15% of these staff roles turnover each year, the cost to that company would be £75,000.
Another consideration is that whilst larger companies may be able to absorb such costs, the potential cost to and SME and the impact such costs can have on cashflow and business viability could be significant.
As expected the lowest retention gap is attached to Junior & Graduate Engineers and Technicians & Trainees at approximately £3,000 given the lower cost of employment.
Retention gap – no delayed replacement – 9 year average
28
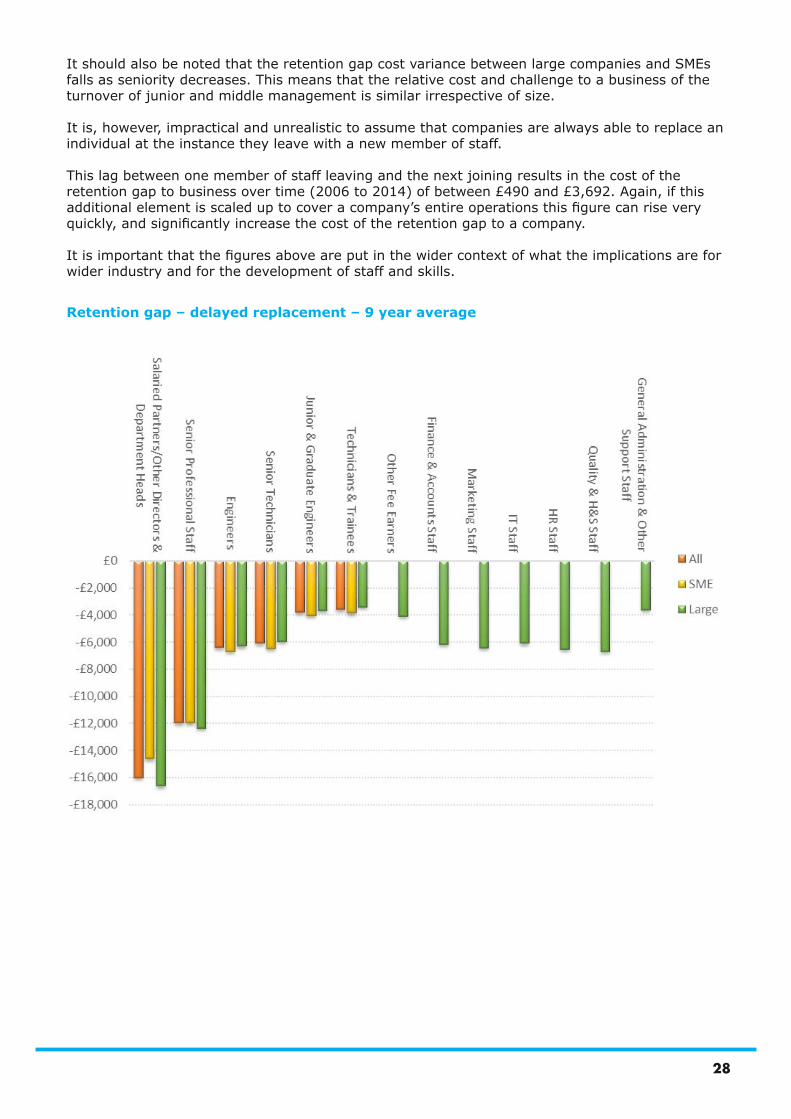
It should also be noted that the retention gap cost variance between large companies and SMEs falls as seniority decreases. This means that the relative cost and challenge to a business of the turnover of junior and middle management is similar irrespective of size.
It is, however, impractical and unrealistic to assume that companies are always able to replace an individual at the instance they leave with a new member of staff.
This lag between one member of staff leaving and the next joining results in the cost of the retention gap to business over time (2006 to 2014) of between £490 and £3,692. Again, if this additional element is scaled up to cover a company’s entire operations this figure can rise very quickly, and significantly increase the cost of the retention gap to a company.
It is important that the figures above are put in the wider context of what the implications are for wider industry and for the development of staff and skills.
Retention gap – delayed replacement – 9 year average
29
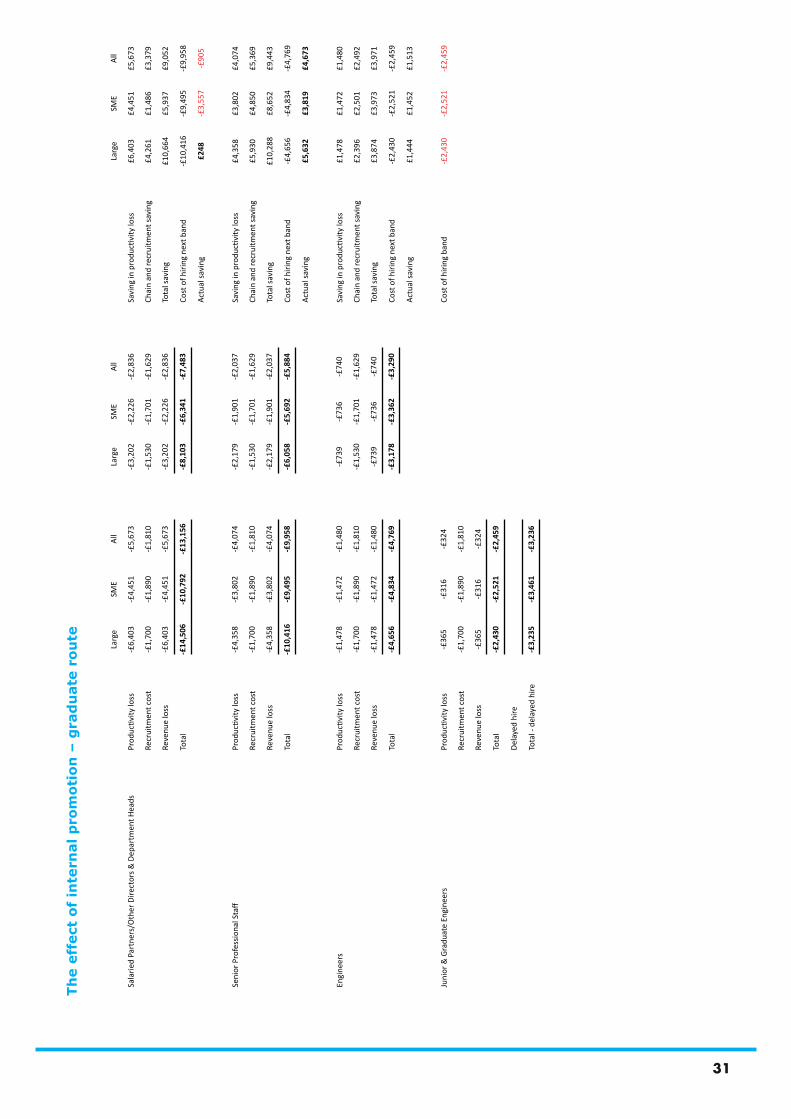
THE EFFECT OF INTERNAL PROMOTIONOne of the areas this research explore is the potential difference in cost between developing skills internally to manage and reduce productivity gains verses the option of always approaching the open market. For the purpose of this analysis the following is assumed:
ProductivityFor internal candidates it is assumed that the productivity loss of the individual leaving and the candidate joining from a more junior position is halved. The rationale behind this assumption is the senior individual is more likely to be loyal to individuals they know and so are less likely to reduce productivity as much. They are also more likely to pass on skills more freely given this loyalty. Finally the internal individual that is promoted already has adapted to the companies ethos making them more likely to learn. Alongside this there is the positive attitude and boost in an individual’s commitment to a company having been promoted.
HR costsThis report does not drastically change HR costs but does allow for a reduction of 10% to 90% of the original cost. This reduction reflects the reduced process that should be attributable to promoting internal candidates verses advertising a job on the open market. Secondly it adjusts to reflect the reduced effort that should be required to hire less senior staff as the pool of potential candidates should be larger. Reducing the likelihood of repeat costs.
How is the internal route calculatedFor the calculation of the internal route the following is accounted for:
• The saving in productivity lose by having an internal candidate promoted using the assumptions above.
• The saving in productivity cost between the two seniority levels is calculated as this would have been spent hiring a more senior role
• The reduction in HR/hiring costs due to lower internal costs using the assumption above
General InferencesThe data reveals that if a company promotes an individual through the ranks the company saves cost at the senior professional level and engineer level. At the most senior level (Salaried Partners/Other Directors & Department Heads) large companies save money when promoting individuals verses SMEs.
The reason for this is because SMEs have lower productivity loss as they generate a lower level of revenue per fee earners pound of staff input. This effectively narrows the gap between the most senior and second senior bands making the internal cost of promotion negative if you account for productivity. This could help to explain why the cost to SMEs of senior staff changes is said to have a significant effect even if they are not right at the top of the organisation.
Graduate RouteFor the graduate route internal promotion results in a positive saving across both the Engineer and Senior Professional levels. The greatest difference is between the Engineer and Senior Professional level as the productivity loss between the bands due to costs and revenue is larger.
30
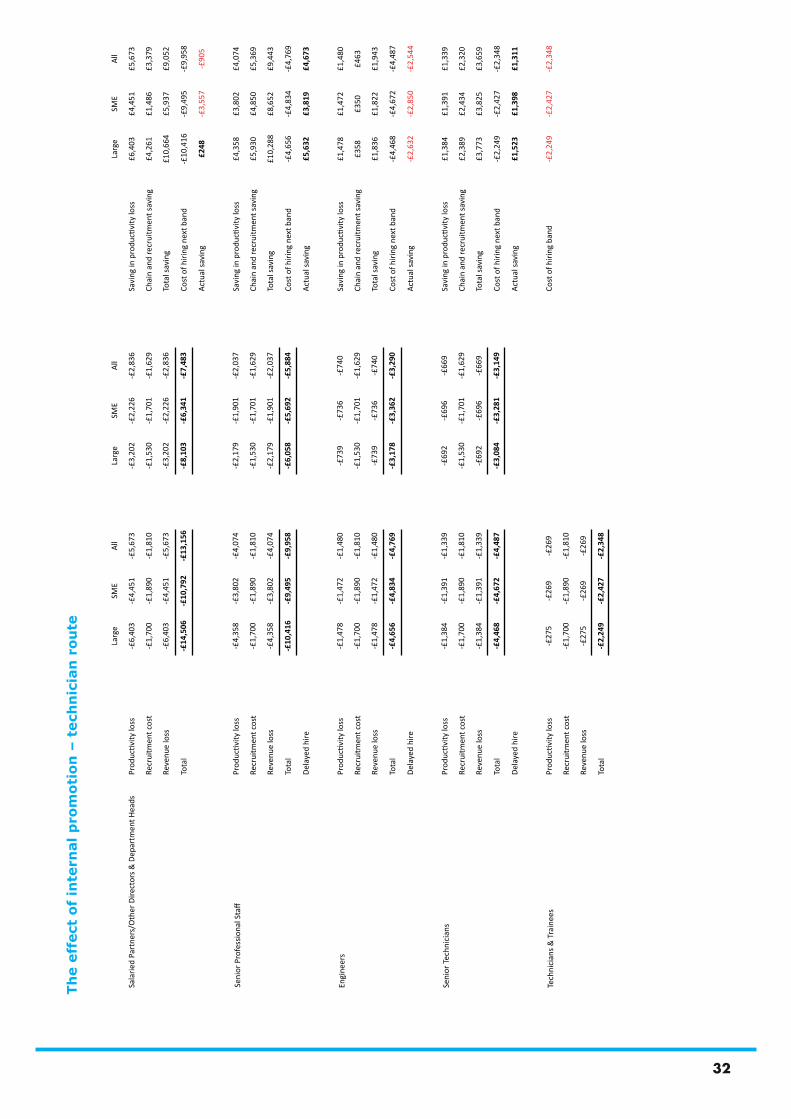
Technician RouteThe technician route yields similar results as the graduate route with one exception. There is a negative internal band between the Engineer and Senior Technician level. This is because the relative pay differential between these band is insufficient to make a significant difference to the productivity loss and cost of hiring.
This does provide an interesting inference in that there is effectively ‘a barrier’ at this level that encourages the employment of external resource rather than the development of internal ones. This could be significant for several reasons, for example:
• Does such a small differential and the likelihood of external hiring practices put off potential individuals from entering companies development schemes, limiting their potential pool of skills?
• Will this barrier encourage companies to employ individuals from competitors thus reducing their incentive to develop their own skills programme?
• This suggests that the development of a Senior Technician makes them similarly as productive as a Engineers and so the cost to business of the loss of Senior Technicians is likely to actually cost companies more than they may originally anticipate.
31
The
effe
ct o
f in
tern
al p
rom
otio
n –
gra
du
ate
rou
te
Larg
eSM
EAl
lLa
rge
SME
All
Larg
eSM
EAl
l
Sala
ried
Part
ners
/Oth
er D
irect
ors &
Dep
artm
ent H
eads
-£6,
403
-£4,
451
-£5,
673
-£3,
202
-£2,
226
-£2,
836
£6,4
03£4
,451
£5,6
73
Recr
uitm
ent c
ost
-£1,
700
-£1,
890
-£1,
810
-£1,
530
-£1,
701
-£1,
629
Chai
n an
d re
crui
tmen
t sav
ing
£4,2
61£1
,486
£3,3
79
Reve
nue
loss
-£6,
403
-£4,
451
-£5,
673
-£3,
202
-£2,
226
-£2,
836
Tota
l sav
ing
£10,
664
£5,9
37£9
,052
Tota
l-£
14,5
06-£
10,7
92-£
13,1
56-£
8,10
3-£
6,34
1-£
7,48
3Co
st o
f hiri
ng n
ext b
and
-£10
,416
-£9,
495
-£9,
958
Actu
al sa
ving
£248
-£3,
557
-£90
5
-£4,
358
-£3,
802
-£4,
074
-£2,
179
-£1,
901
-£2,
037
£4,3
58£3
,802
£4,0
74
Recr
uitm
ent c
ost
-£1,
700
-£1,
890
-£1,
810
-£1,
530
-£1,
701
-£1,
629
Chai
n an
d re
crui
tmen
t sav
ing
£5,9
30£4
,850
£5,3
69
Reve
nue
loss
-£4,
358
-£3,
802
-£4,
074
-£2,
179
-£1,
901
-£2,
037
Tota
l sav
ing
£10,
288
£8,6
52£9
,443
Tota
l-£
10,4
16-£
9,49
5-£
9,95
8-£
6,05
8-£
5,69
2-£
5,88
4Co
st o
f hiri
ng n
ext b
and
-£4,
656
-£4,
834
-£4,
769
Actu
al sa
ving
£5,6
32£3
,819
£4,6
73
Engi
neer
s -£
1,47
8-£
1,47
2-£
1,48
0-£
739
-£73
6-£
740
£1,4
78£1
,472
£1,4
80
Recr
uitm
ent c
ost
-£1,
700
-£1,
890
-£1,
810
-£1,
530
-£1,
701
-£1,
629
Chai
n an
d re
crui
tmen
t sav
ing
£2,3
96£2
,501
£2,4
92
Reve
nue
loss
-£1,
478
-£1,
472
-£1,
480
-£73
9-£
736
-£74
0To
tal s
avin
g £3
,874
£3,9
73£3
,971
Tota
l-£
4,65
6-£
4,83
4-£
4,76
9-£
3,17
8-£
3,36
2-£
3,29
0Co
st o
f hiri
ng n
ext b
and
-£2,
430
-£2,
521
-£2,
459
Actu
al sa
ving
£1,4
44£1
,452
£1,5
13
Juni
or &
Gra
duat
e En
gine
ers
-£36
5-£
316
-£32
4Co
st o
f hiri
ng b
and
-£2,
430
-£2,
521
-£2,
459
Recr
uitm
ent c
ost
-£1,
700
-£1,
890
-£1,
810
Reve
nue
loss
-£36
5-£
316
-£32
4
Tota
l-£
2,43
0-£
2,52
1-£
2,45
9
Dela
yed
hire
Tota
l - d
elay
ed h
ire-£
3,23
5-£
3,46
1-£
3,23
6
32
The
effe
ct o
f in
tern
al p
rom
otio
n –
tec
hn
icia
n r
oute
Larg
eSM
EAl
lLa
rge
SME
All
Larg
eSM
EAl
l
Sala
ried
Part
ners
/Oth
er D
irect
ors &
Dep
artm
ent H
eads
-£6,
403
-£4,
451
-£5,
673
-£3,
202
-£2,
226
-£2,
836
£6,4
03£4
,451
£5,6
73
Recr
uitm
ent c
ost
-£1,
700
-£1,
890
-£1,
810
-£1,
530
-£1,
701
-£1,
629
Chai
n an
d re
crui
tmen
t sav
ing
£4,2
61£1
,486
£3,3
79
Reve
nue
loss
-£6,
403
-£4,
451
-£5,
673
-£3,
202
-£2,
226
-£2,
836
Tota
l sav
ing
£10,
664
£5,9
37£9
,052
Tota
l-£
14,5
06-£
10,7
92-£
13,1
56-£
8,10
3-£
6,34
1-£
7,48
3Co
st o
f hiri
ng n
ext b
and
-£10
,416
-£9,
495
-£9,
958
Actu
al sa
ving
£248
-£3,
557
-£90
5
-£4,
358
-£3,
802
-£4,
074
-£2,
179
-£1,
901
-£2,
037
£4,3
58£3
,802
£4,0
74
Recr
uitm
ent c
ost
-£1,
700
-£1,
890
-£1,
810
-£1,
530
-£1,
701
-£1,
629
Chai
n an
d re
crui
tmen
t sav
ing
£5,9
30£4
,850
£5,3
69
Reve
nue
loss
-£4,
358
-£3,
802
-£4,
074
-£2,
179
-£1,
901
-£2,
037
Tota
l sav
ing
£10,
288
£8,6
52£9
,443
Tota
l-£
10,4
16-£
9,49
5-£
9,95
8-£
6,05
8-£
5,69
2-£
5,88
4Co
st o
f hiri
ng n
ext b
and
-£4,
656
-£4,
834
-£4,
769
Dela
yed
hire
Actu
al sa
ving
£5,6
32£3
,819
£4,6
73
-£1,
478
-£1,
472
-£1,
480
-£73
9-£
736
-£74
0£1
,478
£1,4
72£1
,480
Recr
uitm
ent c
ost
-£1,
700
-£1,
890
-£1,
810
-£1,
530
-£1,
701
-£1,
629
Chai
n an
d re
crui
tmen
t sav
ing
£358
£350
£463
Reve
nue
loss
-£1,
478
-£1,
472
-£1,
480
-£73
9-£
736
-£74
0To
tal s
avin
g £1
,836
£1,8
22£1
,943
Tota
l-£
4,65
6-£
4,83
4-£
4,76
9-£
3,17
8-£
3,36
2-£
3,29
0Co
st o
f hiri
ng n
ext b
and
-£4,
468
-£4,
672
-£4,
487
Dela
yed
hire
Actu
al sa
ving
-£2,
632
-£2,
850
-£2,
544
-£1,
384
-£1,
391
-£1,
339
-£69
2-£
696
-£66
9£1
,384
£1,3
91£1
,339
Recr
uitm
ent c
ost
-£1,
700
-£1,
890
-£1,
810
-£1,
530
-£1,
701
-£1,
629
Chai
n an
d re
crui
tmen
t sav
ing
£2,3
89£2
,434
£2,3
20
Reve
nue
loss
-£1,
384
-£1,
391
-£1,
339
-£69
2-£
696
-£66
9To
tal s
avin
g £3
,773
£3,8
25£3
,659
Tota
l-£
4,46
8-£
4,67
2-£
4,48
7-£
3,08
4-£
3,28
1-£
3,14
9Co
st o
f hiri
ng n
ext b
and
-£2,
249
-£2,
427
-£2,
348
Dela
yed
hire
Actu
al sa
ving
£1,5
23£1
,398
£1,3
11
-£27
5-£
269
-£26
9Co
st o
f hiri
ng b
and
-£2,
249
-£2,
427
-£2,
348
Recr
uitm
ent c
ost
-£1,
700
-£1,
890
-£1,
810
Reve
nue
loss
-£27
5-£
269
-£26
9
Tota
l-£
2,24
9-£
2,42
7-£
2,34
8
Engi
neer
s
Seni
or Te
chni
cian
s
Tech
nici
ans &
Tra
inee
s
33
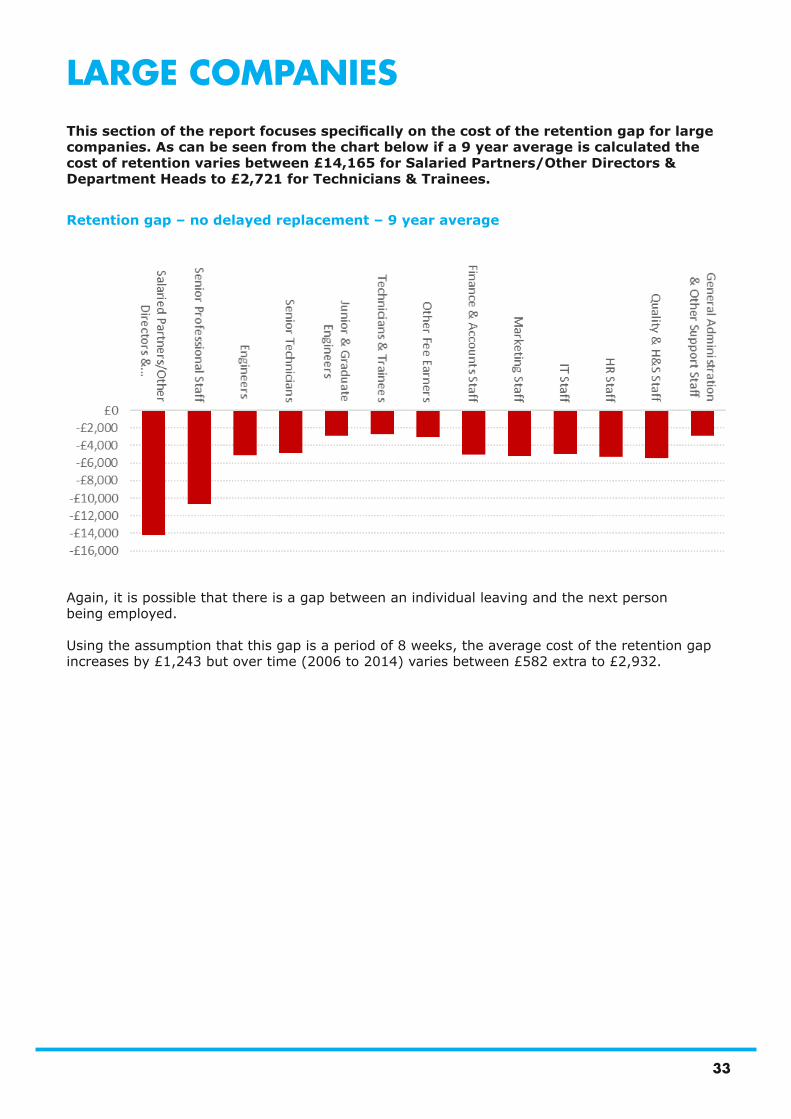
LARGE COMPANIESThis section of the report focuses specifically on the cost of the retention gap for large companies. As can be seen from the chart below if a 9 year average is calculated the cost of retention varies between £14,165 for Salaried Partners/Other Directors & Department Heads to £2,721 for Technicians & Trainees.
Retention gap – no delayed replacement – 9 year average
Again, it is possible that there is a gap between an individual leaving and the next person being employed.
Using the assumption that this gap is a period of 8 weeks, the average cost of the retention gap increases by £1,243 but over time (2006 to 2014) varies between £582 extra to £2,932.
34
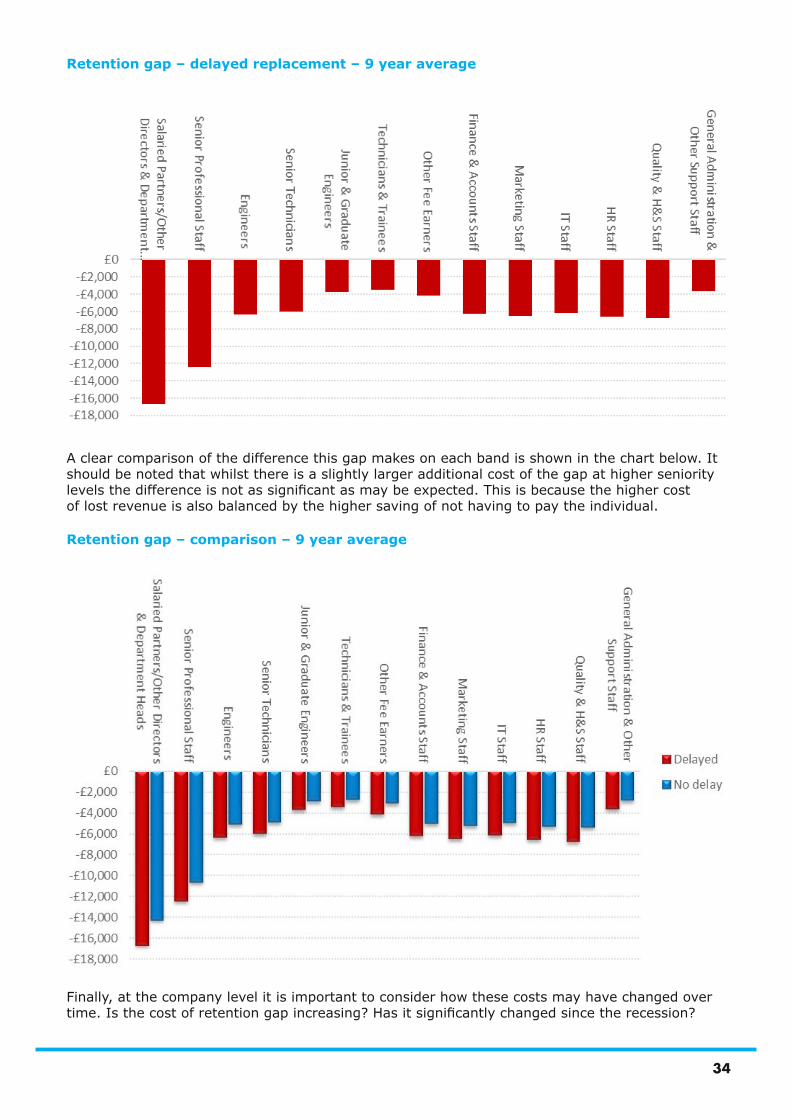
Retention gap – delayed replacement – 9 year average
Retention gap – comparison – 9 year average
A clear comparison of the difference this gap makes on each band is shown in the chart below. It should be noted that whilst there is a slightly larger additional cost of the gap at higher seniority levels the difference is not as significant as may be expected. This is because the higher cost of lost revenue is also balanced by the higher saving of not having to pay the individual.
Finally, at the company level it is important to consider how these costs may have changed over time. Is the cost of retention gap increasing? Has it significantly changed since the recession?
35
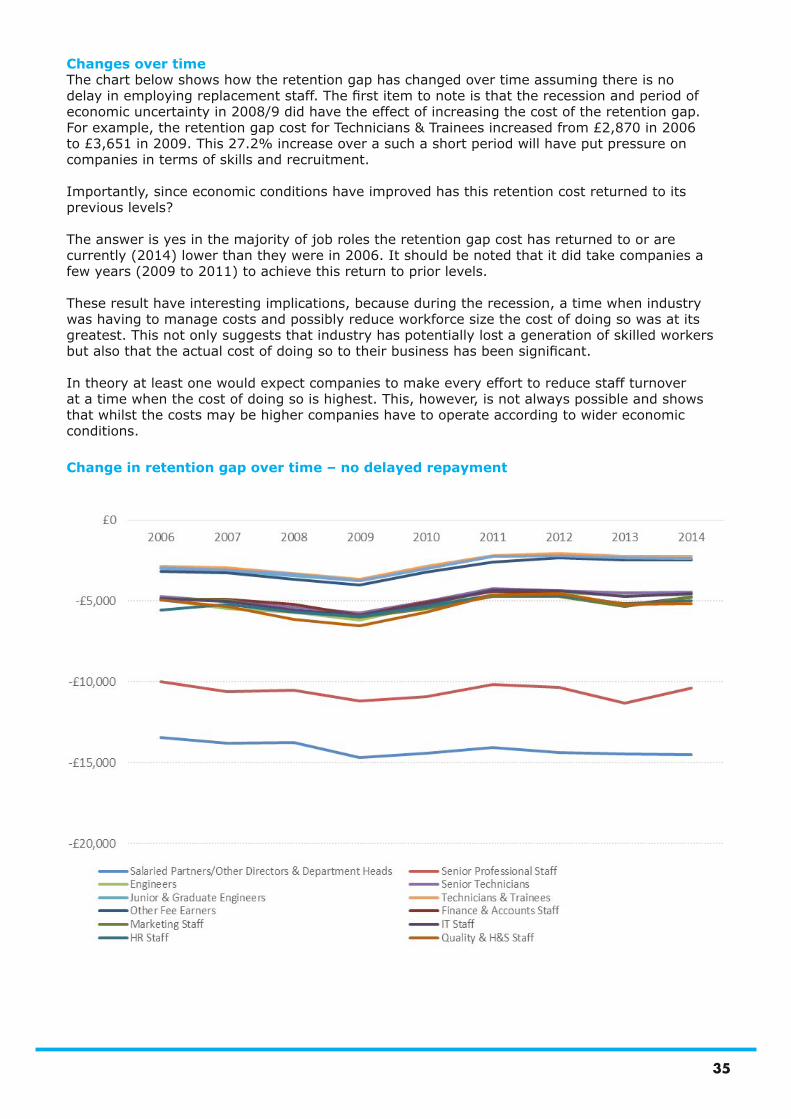
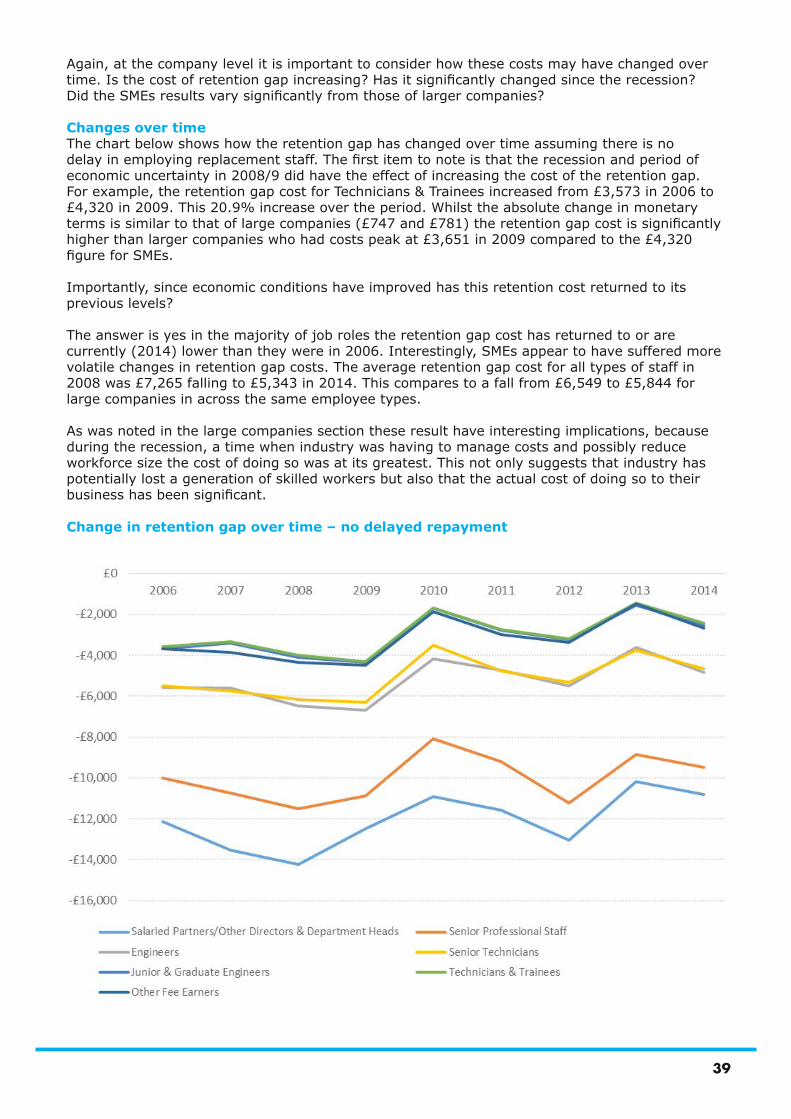
Changes over timeThe chart below shows how the retention gap has changed over time assuming there is no delay in employing replacement staff. The first item to note is that the recession and period of economic uncertainty in 2008/9 did have the effect of increasing the cost of the retention gap. For example, the retention gap cost for Technicians & Trainees increased from £2,870 in 2006 to £3,651 in 2009. This 27.2% increase over a such a short period will have put pressure on companies in terms of skills and recruitment.
Importantly, since economic conditions have improved has this retention cost returned to its previous levels?
The answer is yes in the majority of job roles the retention gap cost has returned to or are currently (2014) lower than they were in 2006. It should be noted that it did take companies a few years (2009 to 2011) to achieve this return to prior levels.
These result have interesting implications, because during the recession, a time when industry was having to manage costs and possibly reduce workforce size the cost of doing so was at its greatest. This not only suggests that industry has potentially lost a generation of skilled workers but also that the actual cost of doing so to their business has been significant.
In theory at least one would expect companies to make every effort to reduce staff turnover at a time when the cost of doing so is highest. This, however, is not always possible and shows that whilst the costs may be higher companies have to operate according to wider economic conditions.
Change in retention gap over time – no delayed repayment
36
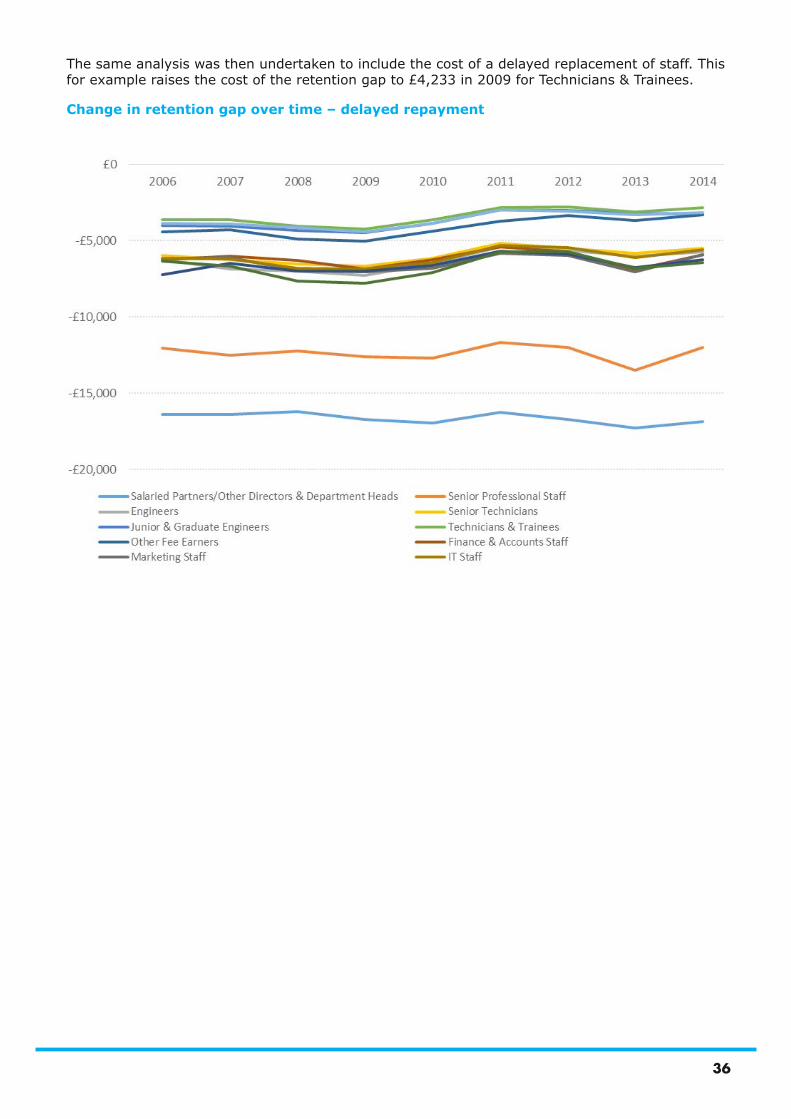
The same analysis was then undertaken to include the cost of a delayed replacement of staff. This for example raises the cost of the retention gap to £4,233 in 2009 for Technicians & Trainees.
Change in retention gap over time – delayed repayment
37
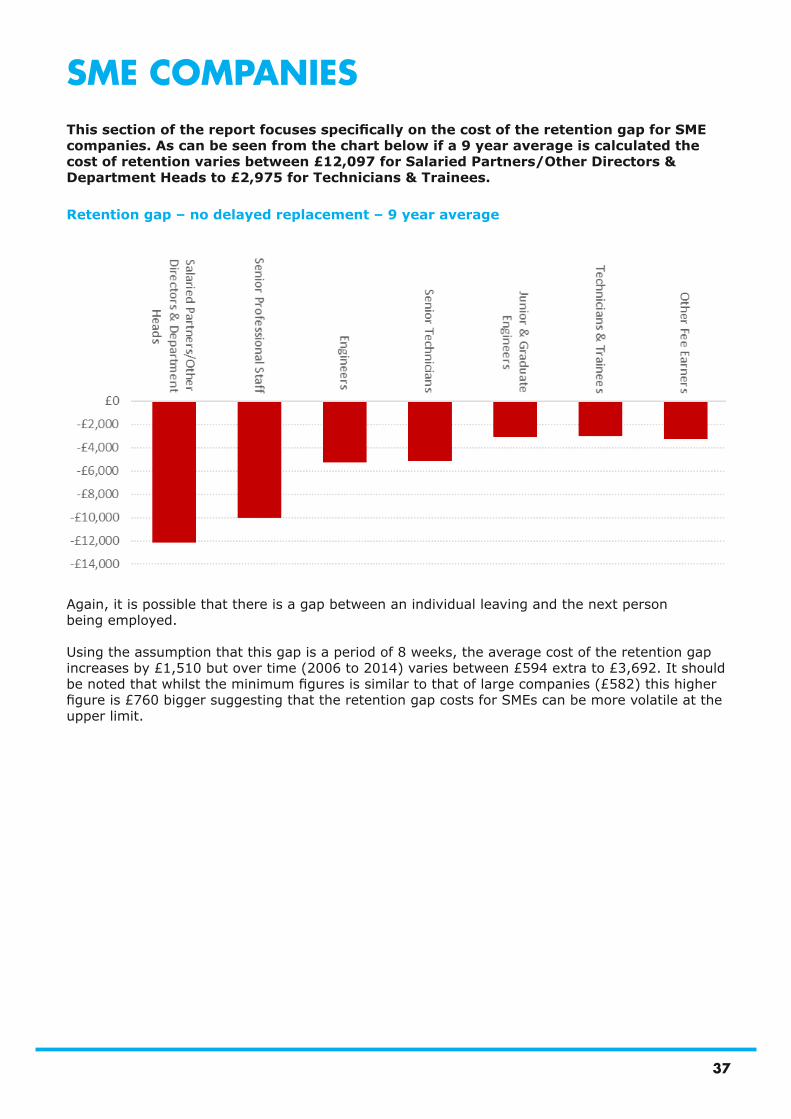
SME COMPANIESThis section of the report focuses specifically on the cost of the retention gap for SME companies. As can be seen from the chart below if a 9 year average is calculated the cost of retention varies between £12,097 for Salaried Partners/Other Directors & Department Heads to £2,975 for Technicians & Trainees.
Again, it is possible that there is a gap between an individual leaving and the next person being employed.
Using the assumption that this gap is a period of 8 weeks, the average cost of the retention gap increases by £1,510 but over time (2006 to 2014) varies between £594 extra to £3,692. It should be noted that whilst the minimum figures is similar to that of large companies (£582) this higher figure is £760 bigger suggesting that the retention gap costs for SMEs can be more volatile at the upper limit.
Retention gap – no delayed replacement – 9 year average
38
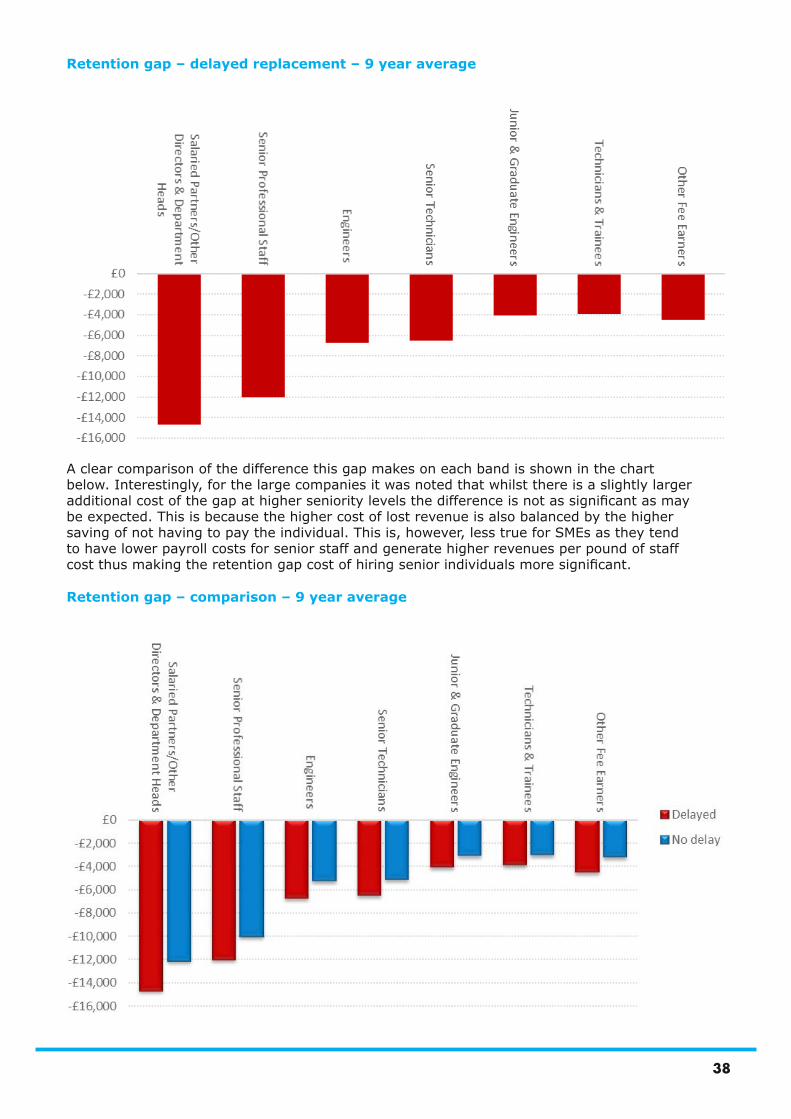
A clear comparison of the difference this gap makes on each band is shown in the chart below. Interestingly, for the large companies it was noted that whilst there is a slightly larger additional cost of the gap at higher seniority levels the difference is not as significant as may be expected. This is because the higher cost of lost revenue is also balanced by the higher saving of not having to pay the individual. This is, however, less true for SMEs as they tend to have lower payroll costs for senior staff and generate higher revenues per pound of staff cost thus making the retention gap cost of hiring senior individuals more significant.
Retention gap – delayed replacement – 9 year average
Retention gap – comparison – 9 year average
39
Again, at the company level it is important to consider how these costs may have changed over time. Is the cost of retention gap increasing? Has it significantly changed since the recession? Did the SMEs results vary significantly from those of larger companies?
Changes over timeThe chart below shows how the retention gap has changed over time assuming there is no delay in employing replacement staff. The first item to note is that the recession and period of economic uncertainty in 2008/9 did have the effect of increasing the cost of the retention gap. For example, the retention gap cost for Technicians & Trainees increased from £3,573 in 2006 to £4,320 in 2009. This 20.9% increase over the period. Whilst the absolute change in monetary terms is similar to that of large companies (£747 and £781) the retention gap cost is significantly higher than larger companies who had costs peak at £3,651 in 2009 compared to the £4,320 figure for SMEs.
Importantly, since economic conditions have improved has this retention cost returned to its previous levels?
The answer is yes in the majority of job roles the retention gap cost has returned to or are currently (2014) lower than they were in 2006. Interestingly, SMEs appear to have suffered more volatile changes in retention gap costs. The average retention gap cost for all types of staff in 2008 was £7,265 falling to £5,343 in 2014. This compares to a fall from £6,549 to £5,844 for large companies in across the same employee types.
As was noted in the large companies section these result have interesting implications, because during the recession, a time when industry was having to manage costs and possibly reduce workforce size the cost of doing so was at its greatest. This not only suggests that industry has potentially lost a generation of skilled workers but also that the actual cost of doing so to their business has been significant.
Change in retention gap over time – no delayed repayment
40
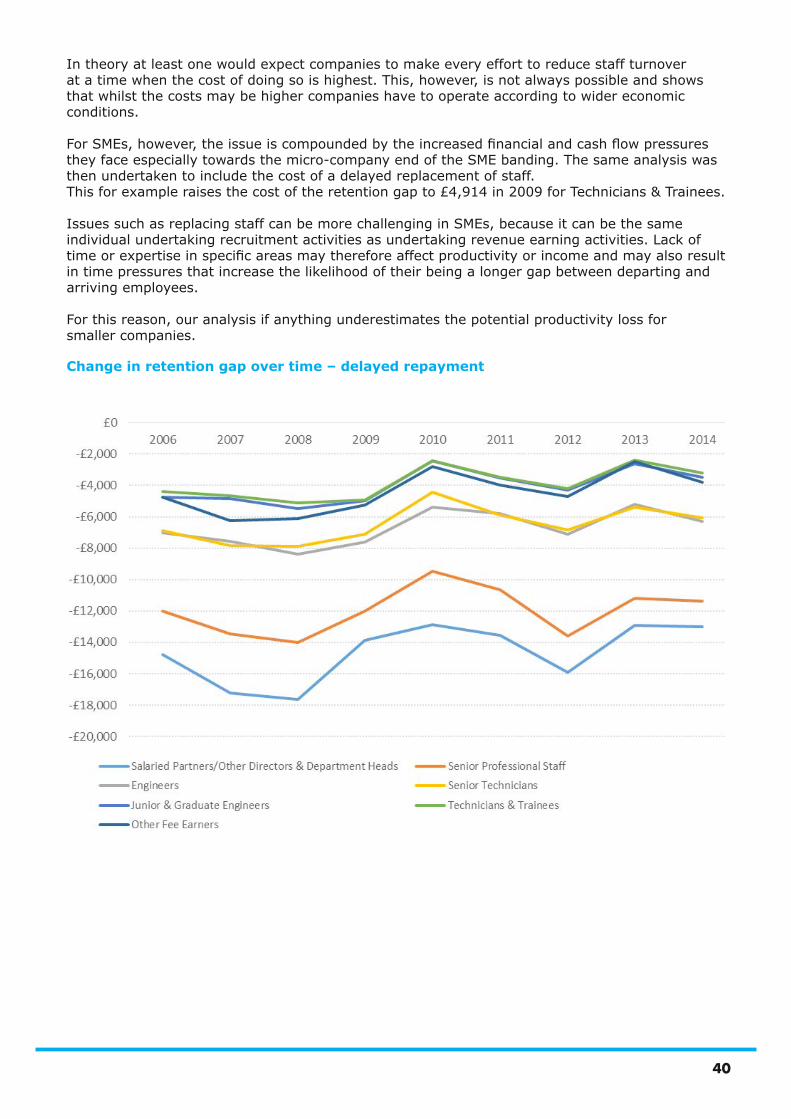
Change in retention gap over time – delayed repayment
In theory at least one would expect companies to make every effort to reduce staff turnover at a time when the cost of doing so is highest. This, however, is not always possible and shows that whilst the costs may be higher companies have to operate according to wider economic conditions.
For SMEs, however, the issue is compounded by the increased financial and cash flow pressures they face especially towards the micro-company end of the SME banding. The same analysis was then undertaken to include the cost of a delayed replacement of staff. This for example raises the cost of the retention gap to £4,914 in 2009 for Technicians & Trainees.
Issues such as replacing staff can be more challenging in SMEs, because it can be the same individual undertaking recruitment activities as undertaking revenue earning activities. Lack of time or expertise in specific areas may therefore affect productivity or income and may also result in time pressures that increase the likelihood of their being a longer gap between departing and arriving employees.
For this reason, our analysis if anything underestimates the potential productivity loss for smaller companies.
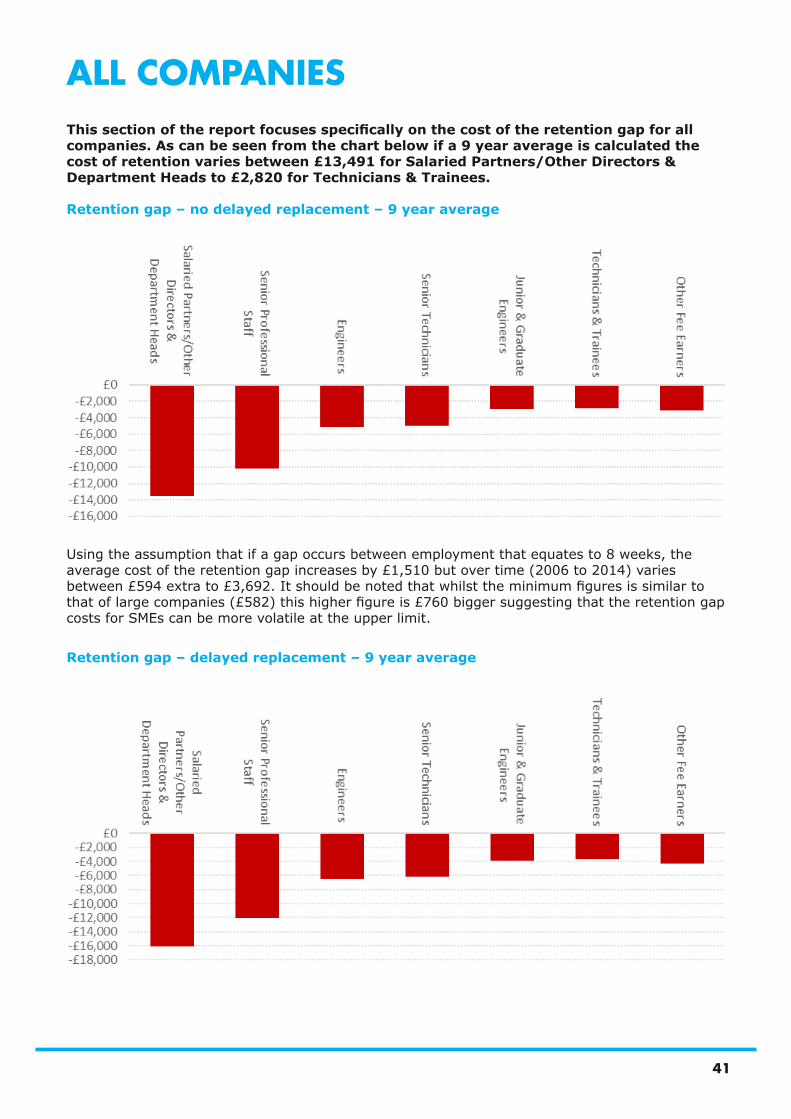
41
ALL COMPANIESThis section of the report focuses specifically on the cost of the retention gap for all companies. As can be seen from the chart below if a 9 year average is calculated the cost of retention varies between £13,491 for Salaried Partners/Other Directors & Department Heads to £2,820 for Technicians & Trainees.
Using the assumption that if a gap occurs between employment that equates to 8 weeks, the average cost of the retention gap increases by £1,510 but over time (2006 to 2014) varies between £594 extra to £3,692. It should be noted that whilst the minimum figures is similar to that of large companies (£582) this higher figure is £760 bigger suggesting that the retention gap costs for SMEs can be more volatile at the upper limit.
Retention gap – no delayed replacement – 9 year average
Retention gap – delayed replacement – 9 year average
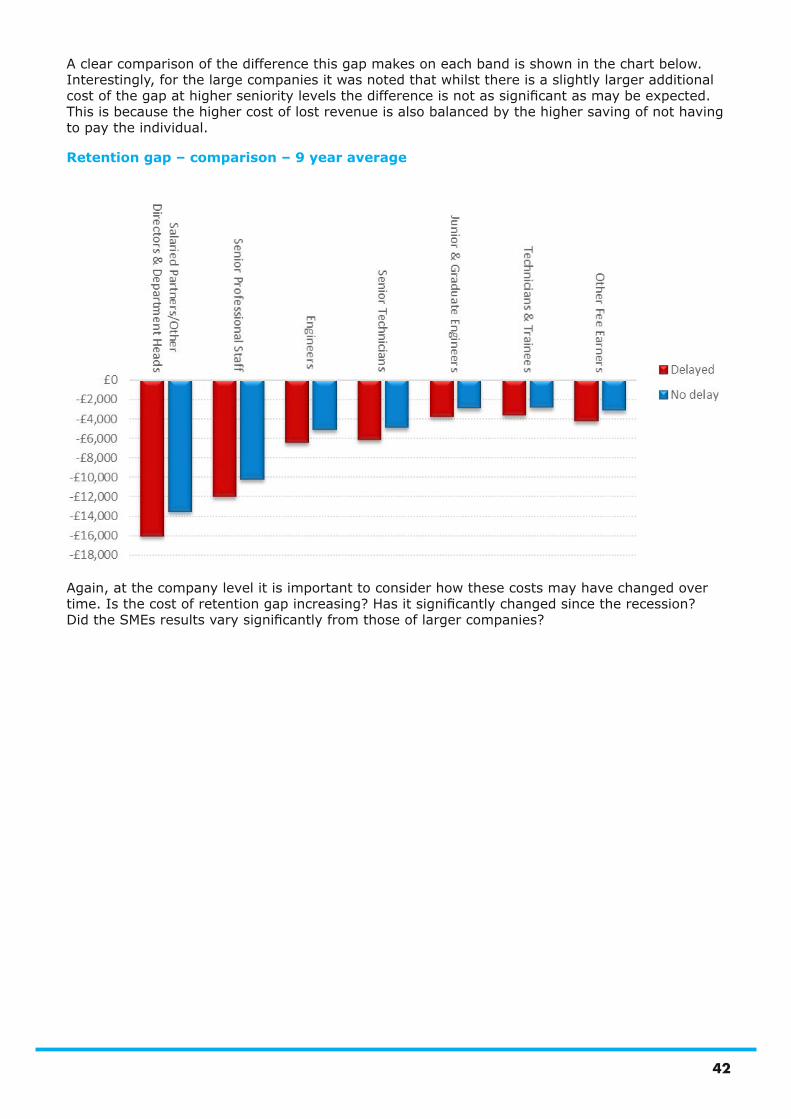
42
A clear comparison of the difference this gap makes on each band is shown in the chart below. Interestingly, for the large companies it was noted that whilst there is a slightly larger additional cost of the gap at higher seniority levels the difference is not as significant as may be expected. This is because the higher cost of lost revenue is also balanced by the higher saving of not having to pay the individual.
Retention gap – comparison – 9 year average
Again, at the company level it is important to consider how these costs may have changed over time. Is the cost of retention gap increasing? Has it significantly changed since the recession? Did the SMEs results vary significantly from those of larger companies?
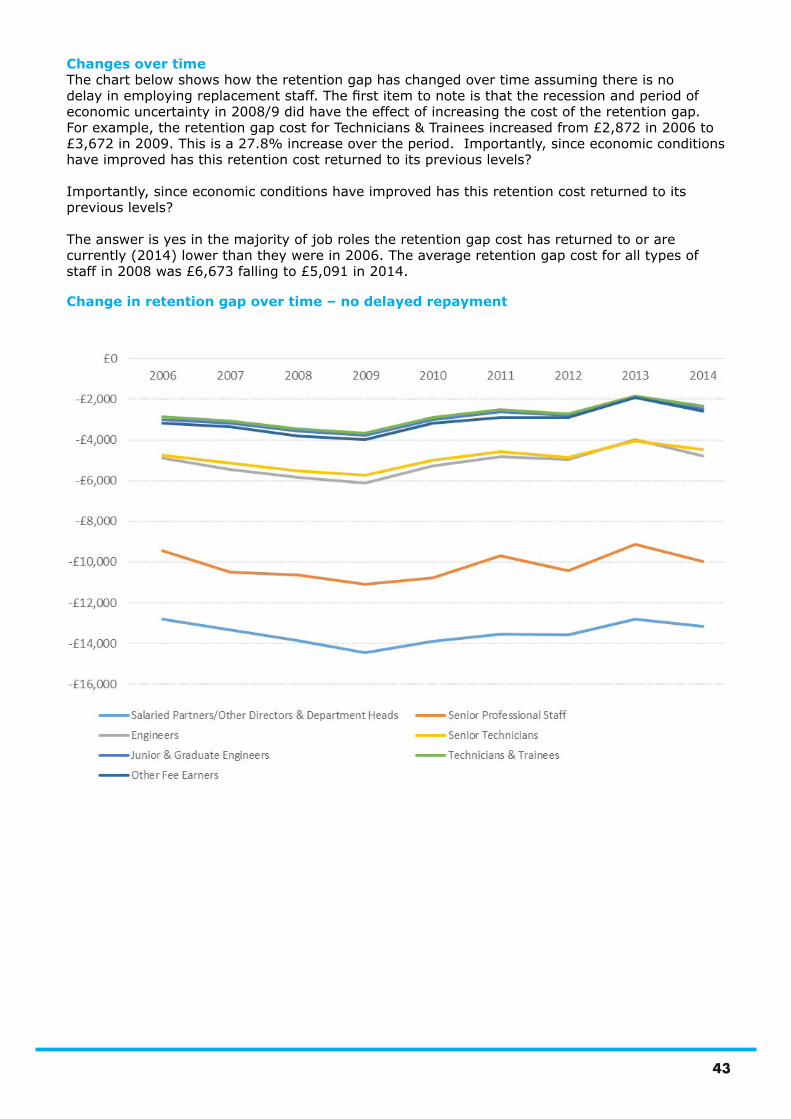
43
Changes over timeThe chart below shows how the retention gap has changed over time assuming there is no delay in employing replacement staff. The first item to note is that the recession and period of economic uncertainty in 2008/9 did have the effect of increasing the cost of the retention gap. For example, the retention gap cost for Technicians & Trainees increased from £2,872 in 2006 to £3,672 in 2009. This is a 27.8% increase over the period. Importantly, since economic conditions have improved has this retention cost returned to its previous levels?
Importantly, since economic conditions have improved has this retention cost returned to its previous levels?
The answer is yes in the majority of job roles the retention gap cost has returned to or are currently (2014) lower than they were in 2006. The average retention gap cost for all types of staff in 2008 was £6,673 falling to £5,091 in 2014.
Change in retention gap over time – no delayed repayment
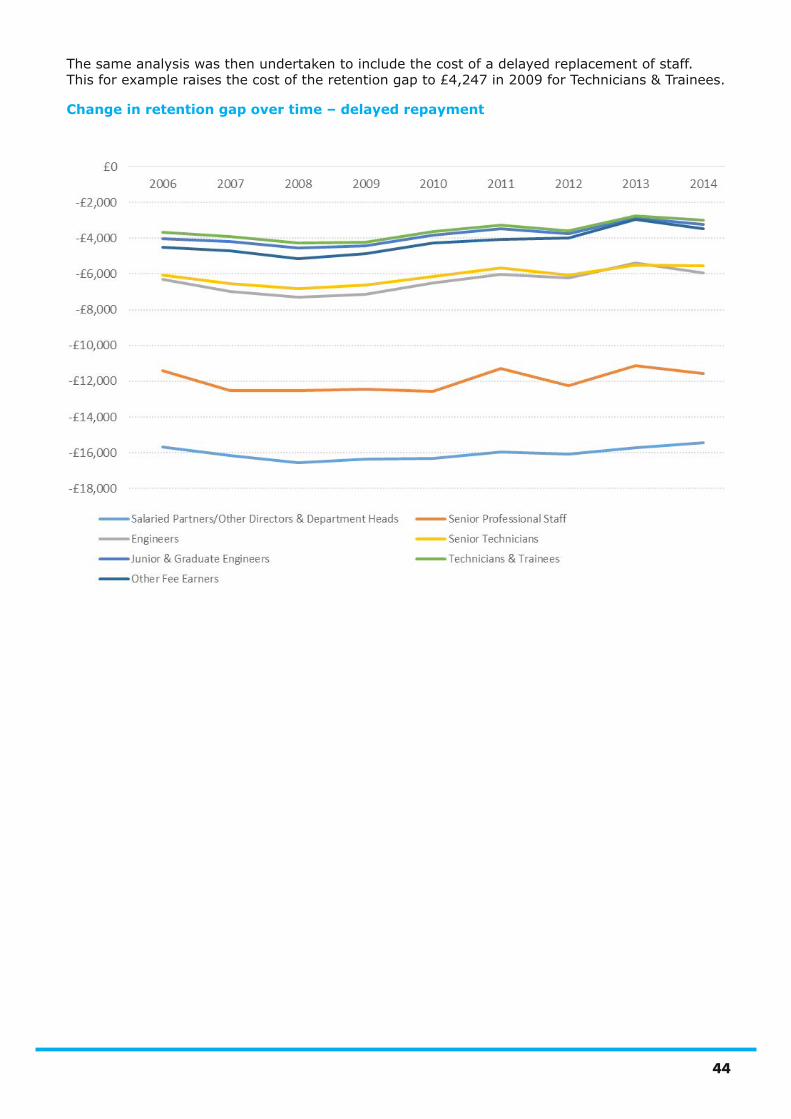
44
Change in retention gap over time – delayed repayment
The same analysis was then undertaken to include the cost of a delayed replacement of staff. This for example raises the cost of the retention gap to £4,247 in 2009 for Technicians & Trainees.

APPENDIX
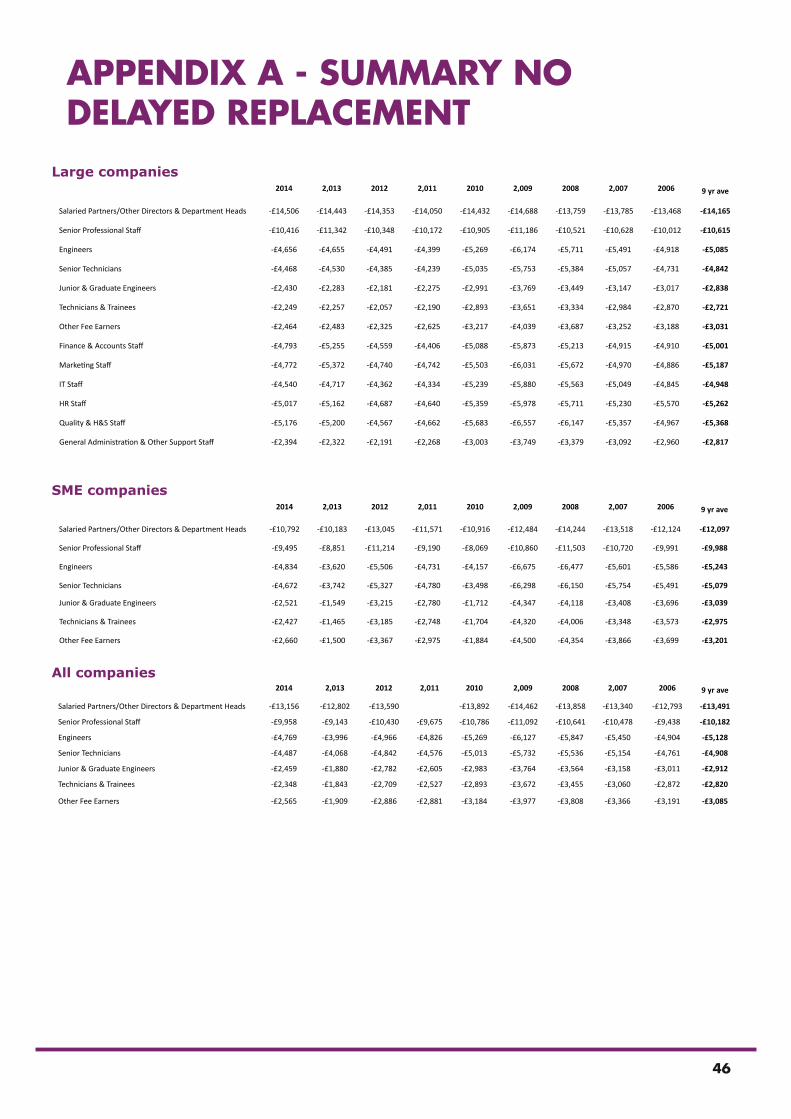
46
APPENDIX A - SUMMARY NO DELAYED REPLACEMENT
Large companies2014 2,013 2012 2,011 2010 2,009 2008 2,007 2006 9 yr ave
Salaried Partners/Other Directors & Department Heads -£14,506 -£14,443 -£14,353 -£14,050 -£14,432 -£14,688 -£13,759 -£13,785 -£13,468 -£14,165
Senior Professional Staff -£10,416 -£11,342 -£10,348 -£10,172 -£10,905 -£11,186 -£10,521 -£10,628 -£10,012 -£10,615
Engineers -£4,656 -£4,655 -£4,491 -£4,399 -£5,269 -£6,174 -£5,711 -£5,491 -£4,918 -£5,085
Senior Technicians -£4,468 -£4,530 -£4,385 -£4,239 -£5,035 -£5,753 -£5,384 -£5,057 -£4,731 -£4,842
Junior & Graduate Engineers -£2,430 -£2,283 -£2,181 -£2,275 -£2,991 -£3,769 -£3,449 -£3,147 -£3,017 -£2,838
Technicians & Trainees -£2,249 -£2,257 -£2,057 -£2,190 -£2,893 -£3,651 -£3,334 -£2,984 -£2,870 -£2,721
Other Fee Earners -£2,464 -£2,483 -£2,325 -£2,625 -£3,217 -£4,039 -£3,687 -£3,252 -£3,188 -£3,031
Finance & Accounts Staff -£4,793 -£5,255 -£4,559 -£4,406 -£5,088 -£5,873 -£5,213 -£4,915 -£4,910 -£5,001
Marketing Staff -£4,772 -£5,372 -£4,740 -£4,742 -£5,503 -£6,031 -£5,672 -£4,970 -£4,886 -£5,187
IT Staff -£4,540 -£4,717 -£4,362 -£4,334 -£5,239 -£5,880 -£5,563 -£5,049 -£4,845 -£4,948
HR Staff -£5,017 -£5,162 -£4,687 -£4,640 -£5,359 -£5,978 -£5,711 -£5,230 -£5,570 -£5,262
Quality & H&S Staff -£5,176 -£5,200 -£4,567 -£4,662 -£5,683 -£6,557 -£6,147 -£5,357 -£4,967 -£5,368
General Administration & Other Support Staff -£2,394 -£2,322 -£2,191 -£2,268 -£3,003 -£3,749 -£3,379 -£3,092 -£2,960 -£2,817
SME companies2014 2,013 2012 2,011 2010 2,009 2008 2,007 2006 9 yr ave
Salaried Partners/Other Directors & Department Heads -£10,792 -£10,183 -£13,045 -£11,571 -£10,916 -£12,484 -£14,244 -£13,518 -£12,124 -£12,097
Senior Professional Staff -£9,495 -£8,851 -£11,214 -£9,190 -£8,069 -£10,860 -£11,503 -£10,720 -£9,991 -£9,988
Engineers -£4,834 -£3,620 -£5,506 -£4,731 -£4,157 -£6,675 -£6,477 -£5,601 -£5,586 -£5,243
Senior Technicians -£4,672 -£3,742 -£5,327 -£4,780 -£3,498 -£6,298 -£6,150 -£5,754 -£5,491 -£5,079
Junior & Graduate Engineers -£2,521 -£1,549 -£3,215 -£2,780 -£1,712 -£4,347 -£4,118 -£3,408 -£3,696 -£3,039
Technicians & Trainees -£2,427 -£1,465 -£3,185 -£2,748 -£1,704 -£4,320 -£4,006 -£3,348 -£3,573 -£2,975
Other Fee Earners -£2,660 -£1,500 -£3,367 -£2,975 -£1,884 -£4,500 -£4,354 -£3,866 -£3,699 -£3,201
All companies2014 2,013 2012 2,011 2010 2,009 2008 2,007 2006 9 yr ave
Salaried Partners/Other Directors & Department Heads -£13,156 -£12,802 -£13,590 -£13,892 -£14,462 -£13,858 -£13,340 -£12,793 -£13,491
Senior Professional Staff -£9,958 -£9,143 -£10,430 -£9,675 -£10,786 -£11,092 -£10,641 -£10,478 -£9,438 -£10,182
Engineers -£4,769 -£3,996 -£4,966 -£4,826 -£5,269 -£6,127 -£5,847 -£5,450 -£4,904 -£5,128
Senior Technicians -£4,487 -£4,068 -£4,842 -£4,576 -£5,013 -£5,732 -£5,536 -£5,154 -£4,761 -£4,908
Junior & Graduate Engineers -£2,459 -£1,880 -£2,782 -£2,605 -£2,983 -£3,764 -£3,564 -£3,158 -£3,011 -£2,912
Technicians & Trainees -£2,348 -£1,843 -£2,709 -£2,527 -£2,893 -£3,672 -£3,455 -£3,060 -£2,872 -£2,820
Other Fee Earners -£2,565 -£1,909 -£2,886 -£2,881 -£3,184 -£3,977 -£3,808 -£3,366 -£3,191 -£3,085
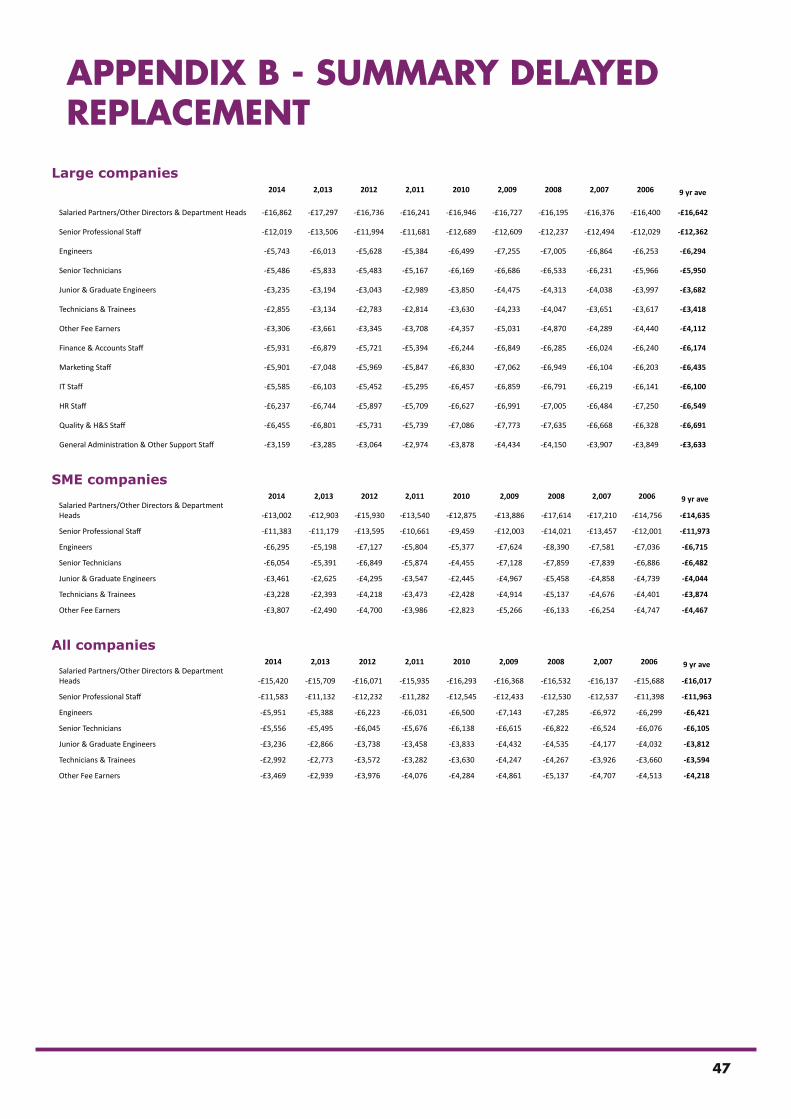
47
APPENDIX B - SUMMARY DELAYED REPLACEMENT
Large companies2014 2,013 2012 2,011 2010 2,009 2008 2,007 2006 9 yr ave
Salaried Partners/Other Directors & Department Heads -£16,862 -£17,297 -£16,736 -£16,241 -£16,946 -£16,727 -£16,195 -£16,376 -£16,400 -£16,642
Senior Professional Staff -£12,019 -£13,506 -£11,994 -£11,681 -£12,689 -£12,609 -£12,237 -£12,494 -£12,029 -£12,362
Engineers -£5,743 -£6,013 -£5,628 -£5,384 -£6,499 -£7,255 -£7,005 -£6,864 -£6,253 -£6,294
Senior Technicians -£5,486 -£5,833 -£5,483 -£5,167 -£6,169 -£6,686 -£6,533 -£6,231 -£5,966 -£5,950
Junior & Graduate Engineers -£3,235 -£3,194 -£3,043 -£2,989 -£3,850 -£4,475 -£4,313 -£4,038 -£3,997 -£3,682
Technicians & Trainees -£2,855 -£3,134 -£2,783 -£2,814 -£3,630 -£4,233 -£4,047 -£3,651 -£3,617 -£3,418
Other Fee Earners -£3,306 -£3,661 -£3,345 -£3,708 -£4,357 -£5,031 -£4,870 -£4,289 -£4,440 -£4,112
Finance & Accounts Staff -£5,931 -£6,879 -£5,721 -£5,394 -£6,244 -£6,849 -£6,285 -£6,024 -£6,240 -£6,174
Marketing Staff -£5,901 -£7,048 -£5,969 -£5,847 -£6,830 -£7,062 -£6,949 -£6,104 -£6,203 -£6,435
IT Staff -£5,585 -£6,103 -£5,452 -£5,295 -£6,457 -£6,859 -£6,791 -£6,219 -£6,141 -£6,100
HR Staff -£6,237 -£6,744 -£5,897 -£5,709 -£6,627 -£6,991 -£7,005 -£6,484 -£7,250 -£6,549
Quality & H&S Staff -£6,455 -£6,801 -£5,731 -£5,739 -£7,086 -£7,773 -£7,635 -£6,668 -£6,328 -£6,691
General Administration & Other Support Staff -£3,159 -£3,285 -£3,064 -£2,974 -£3,878 -£4,434 -£4,150 -£3,907 -£3,849 -£3,633
SME companies2014 2,013 2012 2,011 2010 2,009 2008 2,007 2006 9 yr ave
Salaried Partners/Other Directors & Department Heads -£13,002 -£12,903 -£15,930 -£13,540 -£12,875 -£13,886 -£17,614 -£17,210 -£14,756 -£14,635
Senior Professional Staff -£11,383 -£11,179 -£13,595 -£10,661 -£9,459 -£12,003 -£14,021 -£13,457 -£12,001 -£11,973
Engineers -£6,295 -£5,198 -£7,127 -£5,804 -£5,377 -£7,624 -£8,390 -£7,581 -£7,036 -£6,715
Senior Technicians -£6,054 -£5,391 -£6,849 -£5,874 -£4,455 -£7,128 -£7,859 -£7,839 -£6,886 -£6,482
Junior & Graduate Engineers -£3,461 -£2,625 -£4,295 -£3,547 -£2,445 -£4,967 -£5,458 -£4,858 -£4,739 -£4,044
Technicians & Trainees -£3,228 -£2,393 -£4,218 -£3,473 -£2,428 -£4,914 -£5,137 -£4,676 -£4,401 -£3,874
Other Fee Earners -£3,807 -£2,490 -£4,700 -£3,986 -£2,823 -£5,266 -£6,133 -£6,254 -£4,747 -£4,467
All companies2014 2,013 2012 2,011 2010 2,009 2008 2,007 2006 9 yr ave
Salaried Partners/Other Directors & Department Heads -£15,420 -£15,709 -£16,071 -£15,935 -£16,293 -£16,368 -£16,532 -£16,137 -£15,688 -£16,017
Senior Professional Staff -£11,583 -£11,132 -£12,232 -£11,282 -£12,545 -£12,433 -£12,530 -£12,537 -£11,398 -£11,963
Engineers -£5,951 -£5,388 -£6,223 -£6,031 -£6,500 -£7,143 -£7,285 -£6,972 -£6,299 -£6,421
Senior Technicians -£5,556 -£5,495 -£6,045 -£5,676 -£6,138 -£6,615 -£6,822 -£6,524 -£6,076 -£6,105
Junior & Graduate Engineers -£3,236 -£2,866 -£3,738 -£3,458 -£3,833 -£4,432 -£4,535 -£4,177 -£4,032 -£3,812
Technicians & Trainees -£2,992 -£2,773 -£3,572 -£3,282 -£3,630 -£4,247 -£4,267 -£3,926 -£3,660 -£3,594
Other Fee Earners -£3,469 -£2,939 -£3,976 -£4,076 -£4,284 -£4,861 -£5,137 -£4,707 -£4,513 -£4,218
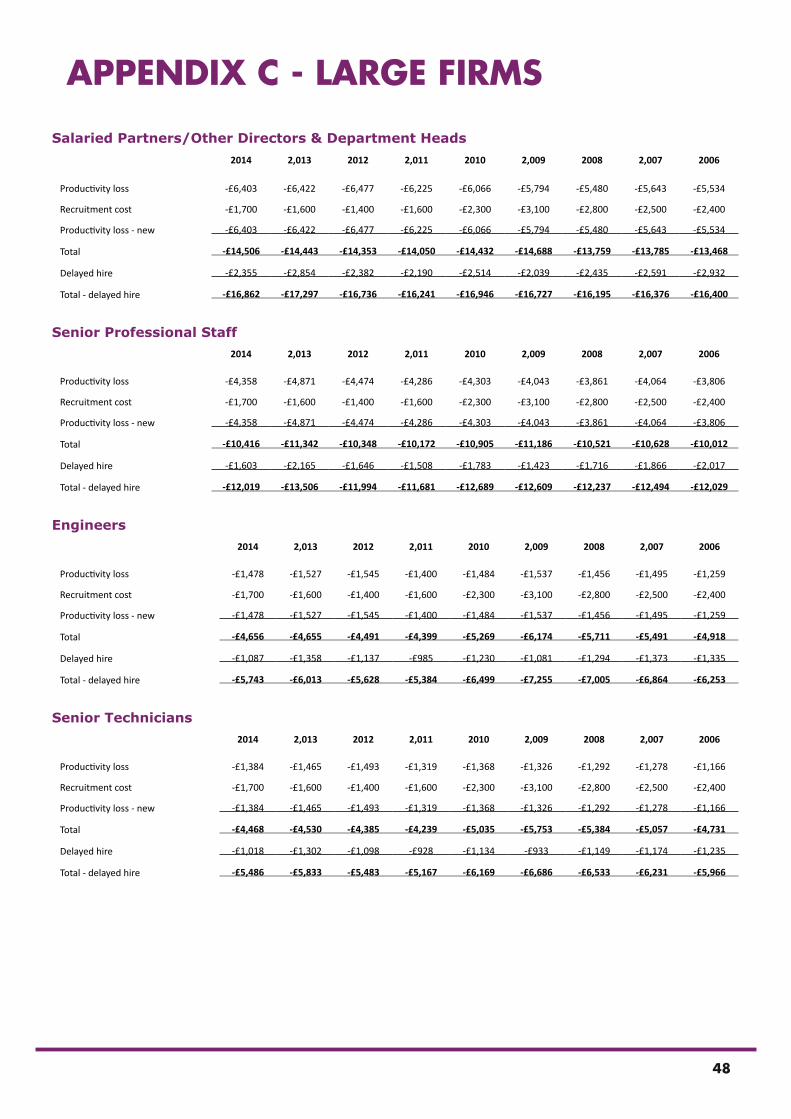
48
APPENDIX C - LARGE FIRMS
Salaried Partners/Other Directors & Department Heads2014 2,013 2012 2,011 2010 2,009 2008 2,007 2006
Productivity loss -£6,403 -£6,422 -£6,477 -£6,225 -£6,066 -£5,794 -£5,480 -£5,643 -£5,534
Recruitment cost -£1,700 -£1,600 -£1,400 -£1,600 -£2,300 -£3,100 -£2,800 -£2,500 -£2,400
Productivity loss - new -£6,403 -£6,422 -£6,477 -£6,225 -£6,066 -£5,794 -£5,480 -£5,643 -£5,534
Total -£14,506 -£14,443 -£14,353 -£14,050 -£14,432 -£14,688 -£13,759 -£13,785 -£13,468
Delayed hire -£2,355 -£2,854 -£2,382 -£2,190 -£2,514 -£2,039 -£2,435 -£2,591 -£2,932
Total - delayed hire -£16,862 -£17,297 -£16,736 -£16,241 -£16,946 -£16,727 -£16,195 -£16,376 -£16,400
Senior Professional Staff2014 2,013 2012 2,011 2010 2,009 2008 2,007 2006
Productivity loss -£4,358 -£4,871 -£4,474 -£4,286 -£4,303 -£4,043 -£3,861 -£4,064 -£3,806
Recruitment cost -£1,700 -£1,600 -£1,400 -£1,600 -£2,300 -£3,100 -£2,800 -£2,500 -£2,400
Productivity loss - new -£4,358 -£4,871 -£4,474 -£4,286 -£4,303 -£4,043 -£3,861 -£4,064 -£3,806
Total -£10,416 -£11,342 -£10,348 -£10,172 -£10,905 -£11,186 -£10,521 -£10,628 -£10,012
Delayed hire -£1,603 -£2,165 -£1,646 -£1,508 -£1,783 -£1,423 -£1,716 -£1,866 -£2,017
Total - delayed hire -£12,019 -£13,506 -£11,994 -£11,681 -£12,689 -£12,609 -£12,237 -£12,494 -£12,029
Engineers 2014 2,013 2012 2,011 2010 2,009 2008 2,007 2006
Productivity loss -£1,478 -£1,527 -£1,545 -£1,400 -£1,484 -£1,537 -£1,456 -£1,495 -£1,259
Recruitment cost -£1,700 -£1,600 -£1,400 -£1,600 -£2,300 -£3,100 -£2,800 -£2,500 -£2,400
Productivity loss - new -£1,478 -£1,527 -£1,545 -£1,400 -£1,484 -£1,537 -£1,456 -£1,495 -£1,259
Total -£4,656 -£4,655 -£4,491 -£4,399 -£5,269 -£6,174 -£5,711 -£5,491 -£4,918
Delayed hire -£1,087 -£1,358 -£1,137 -£985 -£1,230 -£1,081 -£1,294 -£1,373 -£1,335
Total - delayed hire -£5,743 -£6,013 -£5,628 -£5,384 -£6,499 -£7,255 -£7,005 -£6,864 -£6,253
Senior Technicians2014 2,013 2012 2,011 2010 2,009 2008 2,007 2006
Productivity loss -£1,384 -£1,465 -£1,493 -£1,319 -£1,368 -£1,326 -£1,292 -£1,278 -£1,166
Recruitment cost -£1,700 -£1,600 -£1,400 -£1,600 -£2,300 -£3,100 -£2,800 -£2,500 -£2,400
Productivity loss - new -£1,384 -£1,465 -£1,493 -£1,319 -£1,368 -£1,326 -£1,292 -£1,278 -£1,166
Total -£4,468 -£4,530 -£4,385 -£4,239 -£5,035 -£5,753 -£5,384 -£5,057 -£4,731
Delayed hire -£1,018 -£1,302 -£1,098 -£928 -£1,134 -£933 -£1,149 -£1,174 -£1,235
Total - delayed hire -£5,486 -£5,833 -£5,483 -£5,167 -£6,169 -£6,686 -£6,533 -£6,231 -£5,966
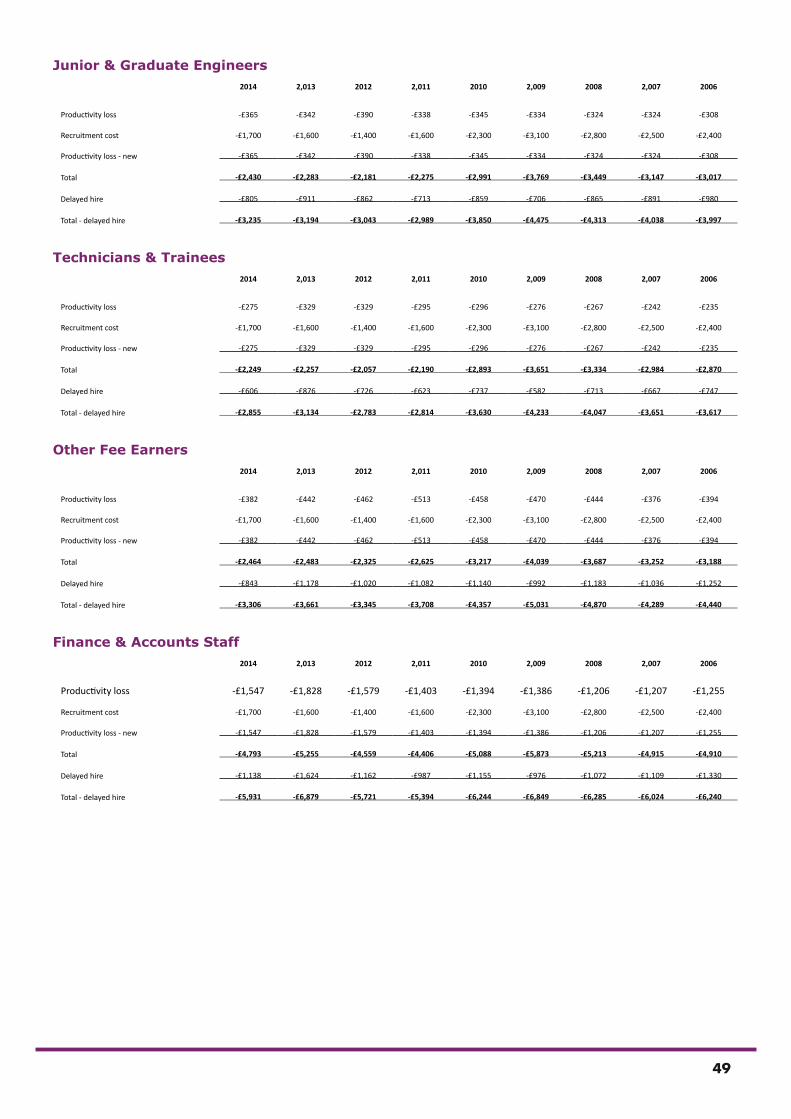
49
Junior & Graduate Engineers2014 2,013 2012 2,011 2010 2,009 2008 2,007 2006
Productivity loss -£365 -£342 -£390 -£338 -£345 -£334 -£324 -£324 -£308
Recruitment cost -£1,700 -£1,600 -£1,400 -£1,600 -£2,300 -£3,100 -£2,800 -£2,500 -£2,400
Productivity loss - new -£365 -£342 -£390 -£338 -£345 -£334 -£324 -£324 -£308
Total -£2,430 -£2,283 -£2,181 -£2,275 -£2,991 -£3,769 -£3,449 -£3,147 -£3,017
Delayed hire -£805 -£911 -£862 -£713 -£859 -£706 -£865 -£891 -£980
Total - delayed hire -£3,235 -£3,194 -£3,043 -£2,989 -£3,850 -£4,475 -£4,313 -£4,038 -£3,997
Technicians & Trainees2014 2,013 2012 2,011 2010 2,009 2008 2,007 2006
Productivity loss -£275 -£329 -£329 -£295 -£296 -£276 -£267 -£242 -£235
Recruitment cost -£1,700 -£1,600 -£1,400 -£1,600 -£2,300 -£3,100 -£2,800 -£2,500 -£2,400
Productivity loss - new -£275 -£329 -£329 -£295 -£296 -£276 -£267 -£242 -£235
Total -£2,249 -£2,257 -£2,057 -£2,190 -£2,893 -£3,651 -£3,334 -£2,984 -£2,870
Delayed hire -£606 -£876 -£726 -£623 -£737 -£582 -£713 -£667 -£747
Total - delayed hire -£2,855 -£3,134 -£2,783 -£2,814 -£3,630 -£4,233 -£4,047 -£3,651 -£3,617
Other Fee Earners2014 2,013 2012 2,011 2010 2,009 2008 2,007 2006
Productivity loss -£382 -£442 -£462 -£513 -£458 -£470 -£444 -£376 -£394
Recruitment cost -£1,700 -£1,600 -£1,400 -£1,600 -£2,300 -£3,100 -£2,800 -£2,500 -£2,400
Productivity loss - new -£382 -£442 -£462 -£513 -£458 -£470 -£444 -£376 -£394
Total -£2,464 -£2,483 -£2,325 -£2,625 -£3,217 -£4,039 -£3,687 -£3,252 -£3,188
Delayed hire -£843 -£1,178 -£1,020 -£1,082 -£1,140 -£992 -£1,183 -£1,036 -£1,252
Total - delayed hire -£3,306 -£3,661 -£3,345 -£3,708 -£4,357 -£5,031 -£4,870 -£4,289 -£4,440
Finance & Accounts Staff2014 2,013 2012 2,011 2010 2,009 2008 2,007 2006
Productivity loss -£1,547 -£1,828 -£1,579 -£1,403 -£1,394 -£1,386 -£1,206 -£1,207 -£1,255
Recruitment cost -£1,700 -£1,600 -£1,400 -£1,600 -£2,300 -£3,100 -£2,800 -£2,500 -£2,400
Productivity loss - new -£1,547 -£1,828 -£1,579 -£1,403 -£1,394 -£1,386 -£1,206 -£1,207 -£1,255
Total -£4,793 -£5,255 -£4,559 -£4,406 -£5,088 -£5,873 -£5,213 -£4,915 -£4,910
Delayed hire -£1,138 -£1,624 -£1,162 -£987 -£1,155 -£976 -£1,072 -£1,109 -£1,330
Total - delayed hire -£5,931 -£6,879 -£5,721 -£5,394 -£6,244 -£6,849 -£6,285 -£6,024 -£6,240
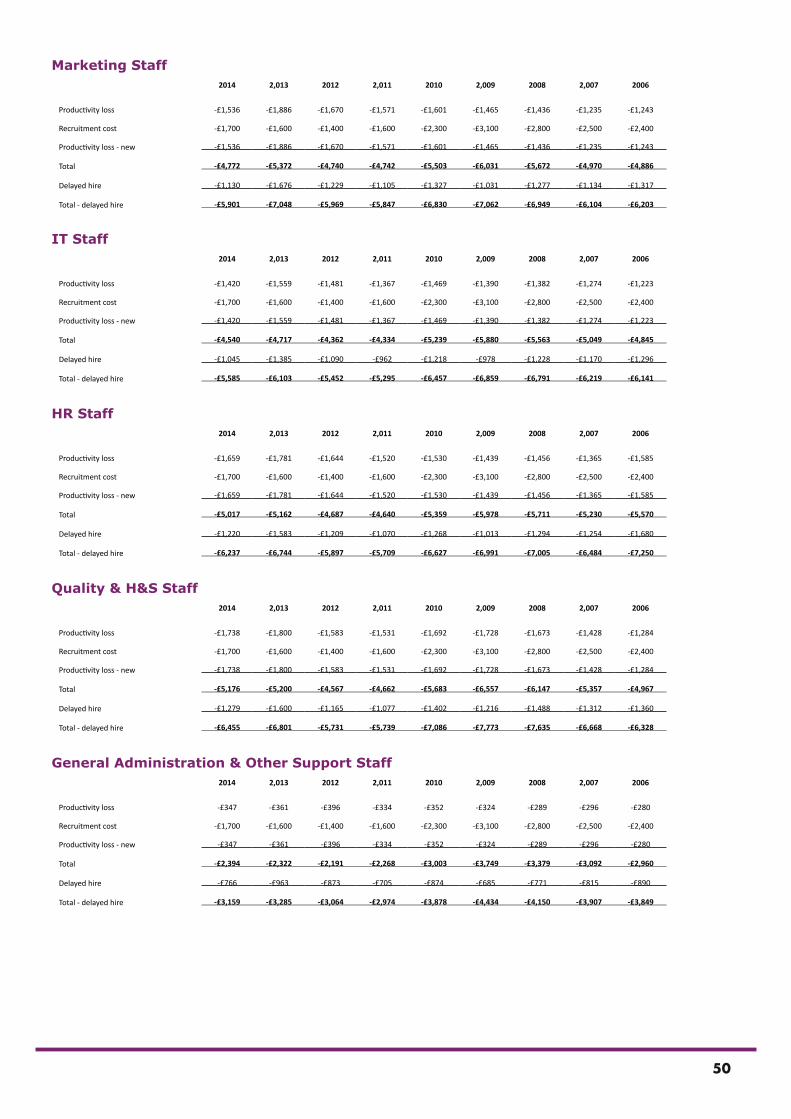
50
Marketing Staff2014 2,013 2012 2,011 2010 2,009 2008 2,007 2006
Productivity loss -£1,536 -£1,886 -£1,670 -£1,571 -£1,601 -£1,465 -£1,436 -£1,235 -£1,243
Recruitment cost -£1,700 -£1,600 -£1,400 -£1,600 -£2,300 -£3,100 -£2,800 -£2,500 -£2,400
Productivity loss - new -£1,536 -£1,886 -£1,670 -£1,571 -£1,601 -£1,465 -£1,436 -£1,235 -£1,243
Total -£4,772 -£5,372 -£4,740 -£4,742 -£5,503 -£6,031 -£5,672 -£4,970 -£4,886
Delayed hire -£1,130 -£1,676 -£1,229 -£1,105 -£1,327 -£1,031 -£1,277 -£1,134 -£1,317
Total - delayed hire -£5,901 -£7,048 -£5,969 -£5,847 -£6,830 -£7,062 -£6,949 -£6,104 -£6,203
IT Staff2014 2,013 2012 2,011 2010 2,009 2008 2,007 2006
Productivity loss -£1,420 -£1,559 -£1,481 -£1,367 -£1,469 -£1,390 -£1,382 -£1,274 -£1,223
Recruitment cost -£1,700 -£1,600 -£1,400 -£1,600 -£2,300 -£3,100 -£2,800 -£2,500 -£2,400
Productivity loss - new -£1,420 -£1,559 -£1,481 -£1,367 -£1,469 -£1,390 -£1,382 -£1,274 -£1,223
Total -£4,540 -£4,717 -£4,362 -£4,334 -£5,239 -£5,880 -£5,563 -£5,049 -£4,845
Delayed hire -£1,045 -£1,385 -£1,090 -£962 -£1,218 -£978 -£1,228 -£1,170 -£1,296
Total - delayed hire -£5,585 -£6,103 -£5,452 -£5,295 -£6,457 -£6,859 -£6,791 -£6,219 -£6,141
HR Staff2014 2,013 2012 2,011 2010 2,009 2008 2,007 2006
Productivity loss -£1,659 -£1,781 -£1,644 -£1,520 -£1,530 -£1,439 -£1,456 -£1,365 -£1,585
Recruitment cost -£1,700 -£1,600 -£1,400 -£1,600 -£2,300 -£3,100 -£2,800 -£2,500 -£2,400
Productivity loss - new -£1,659 -£1,781 -£1,644 -£1,520 -£1,530 -£1,439 -£1,456 -£1,365 -£1,585
Total -£5,017 -£5,162 -£4,687 -£4,640 -£5,359 -£5,978 -£5,711 -£5,230 -£5,570
Delayed hire -£1,220 -£1,583 -£1,209 -£1,070 -£1,268 -£1,013 -£1,294 -£1,254 -£1,680
Total - delayed hire -£6,237 -£6,744 -£5,897 -£5,709 -£6,627 -£6,991 -£7,005 -£6,484 -£7,250
Quality & H&S Staff2014 2,013 2012 2,011 2010 2,009 2008 2,007 2006
Productivity loss -£1,738 -£1,800 -£1,583 -£1,531 -£1,692 -£1,728 -£1,673 -£1,428 -£1,284
Recruitment cost -£1,700 -£1,600 -£1,400 -£1,600 -£2,300 -£3,100 -£2,800 -£2,500 -£2,400
Productivity loss - new -£1,738 -£1,800 -£1,583 -£1,531 -£1,692 -£1,728 -£1,673 -£1,428 -£1,284
Total -£5,176 -£5,200 -£4,567 -£4,662 -£5,683 -£6,557 -£6,147 -£5,357 -£4,967
Delayed hire -£1,279 -£1,600 -£1,165 -£1,077 -£1,402 -£1,216 -£1,488 -£1,312 -£1,360
Total - delayed hire -£6,455 -£6,801 -£5,731 -£5,739 -£7,086 -£7,773 -£7,635 -£6,668 -£6,328
General Administration & Other Support Staff2014 2,013 2012 2,011 2010 2,009 2008 2,007 2006
Productivity loss -£347 -£361 -£396 -£334 -£352 -£324 -£289 -£296 -£280
Recruitment cost -£1,700 -£1,600 -£1,400 -£1,600 -£2,300 -£3,100 -£2,800 -£2,500 -£2,400
Productivity loss - new -£347 -£361 -£396 -£334 -£352 -£324 -£289 -£296 -£280
Total -£2,394 -£2,322 -£2,191 -£2,268 -£3,003 -£3,749 -£3,379 -£3,092 -£2,960
Delayed hire -£766 -£963 -£873 -£705 -£874 -£685 -£771 -£815 -£890
Total - delayed hire -£3,159 -£3,285 -£3,064 -£2,974 -£3,878 -£4,434 -£4,150 -£3,907 -£3,849
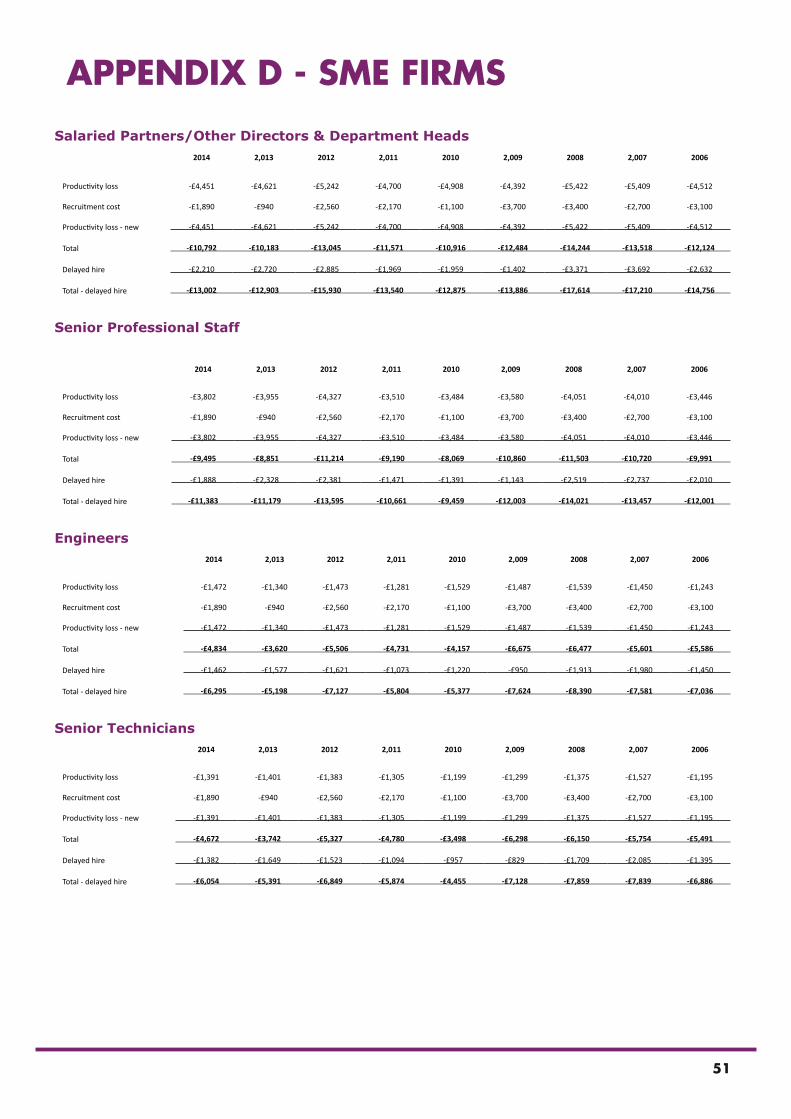
51
APPENDIX D - SME FIRMS
Salaried Partners/Other Directors & Department Heads2014 2,013 2012 2,011 2010 2,009 2008 2,007 2006
Productivity loss -£4,451 -£4,621 -£5,242 -£4,700 -£4,908 -£4,392 -£5,422 -£5,409 -£4,512
Recruitment cost -£1,890 -£940 -£2,560 -£2,170 -£1,100 -£3,700 -£3,400 -£2,700 -£3,100
Productivity loss - new -£4,451 -£4,621 -£5,242 -£4,700 -£4,908 -£4,392 -£5,422 -£5,409 -£4,512
Total -£10,792 -£10,183 -£13,045 -£11,571 -£10,916 -£12,484 -£14,244 -£13,518 -£12,124
Delayed hire -£2,210 -£2,720 -£2,885 -£1,969 -£1,959 -£1,402 -£3,371 -£3,692 -£2,632
Total - delayed hire -£13,002 -£12,903 -£15,930 -£13,540 -£12,875 -£13,886 -£17,614 -£17,210 -£14,756
Senior Professional Staff
2014 2,013 2012 2,011 2010 2,009 2008 2,007 2006
Productivity loss -£3,802 -£3,955 -£4,327 -£3,510 -£3,484 -£3,580 -£4,051 -£4,010 -£3,446
Recruitment cost -£1,890 -£940 -£2,560 -£2,170 -£1,100 -£3,700 -£3,400 -£2,700 -£3,100
Productivity loss - new -£3,802 -£3,955 -£4,327 -£3,510 -£3,484 -£3,580 -£4,051 -£4,010 -£3,446
Total -£9,495 -£8,851 -£11,214 -£9,190 -£8,069 -£10,860 -£11,503 -£10,720 -£9,991
Delayed hire -£1,888 -£2,328 -£2,381 -£1,471 -£1,391 -£1,143 -£2,519 -£2,737 -£2,010
Total - delayed hire -£11,383 -£11,179 -£13,595 -£10,661 -£9,459 -£12,003 -£14,021 -£13,457 -£12,001
Engineers 2014 2,013 2012 2,011 2010 2,009 2008 2,007 2006
Productivity loss -£1,472 -£1,340 -£1,473 -£1,281 -£1,529 -£1,487 -£1,539 -£1,450 -£1,243
Recruitment cost -£1,890 -£940 -£2,560 -£2,170 -£1,100 -£3,700 -£3,400 -£2,700 -£3,100
Productivity loss - new -£1,472 -£1,340 -£1,473 -£1,281 -£1,529 -£1,487 -£1,539 -£1,450 -£1,243
Total -£4,834 -£3,620 -£5,506 -£4,731 -£4,157 -£6,675 -£6,477 -£5,601 -£5,586
Delayed hire -£1,462 -£1,577 -£1,621 -£1,073 -£1,220 -£950 -£1,913 -£1,980 -£1,450
Total - delayed hire -£6,295 -£5,198 -£7,127 -£5,804 -£5,377 -£7,624 -£8,390 -£7,581 -£7,036
Senior Technicians2014 2,013 2012 2,011 2010 2,009 2008 2,007 2006
Productivity loss -£1,391 -£1,401 -£1,383 -£1,305 -£1,199 -£1,299 -£1,375 -£1,527 -£1,195
Recruitment cost -£1,890 -£940 -£2,560 -£2,170 -£1,100 -£3,700 -£3,400 -£2,700 -£3,100
Productivity loss - new -£1,391 -£1,401 -£1,383 -£1,305 -£1,199 -£1,299 -£1,375 -£1,527 -£1,195
Total -£4,672 -£3,742 -£5,327 -£4,780 -£3,498 -£6,298 -£6,150 -£5,754 -£5,491
Delayed hire -£1,382 -£1,649 -£1,523 -£1,094 -£957 -£829 -£1,709 -£2,085 -£1,395
Total - delayed hire -£6,054 -£5,391 -£6,849 -£5,874 -£4,455 -£7,128 -£7,859 -£7,839 -£6,886
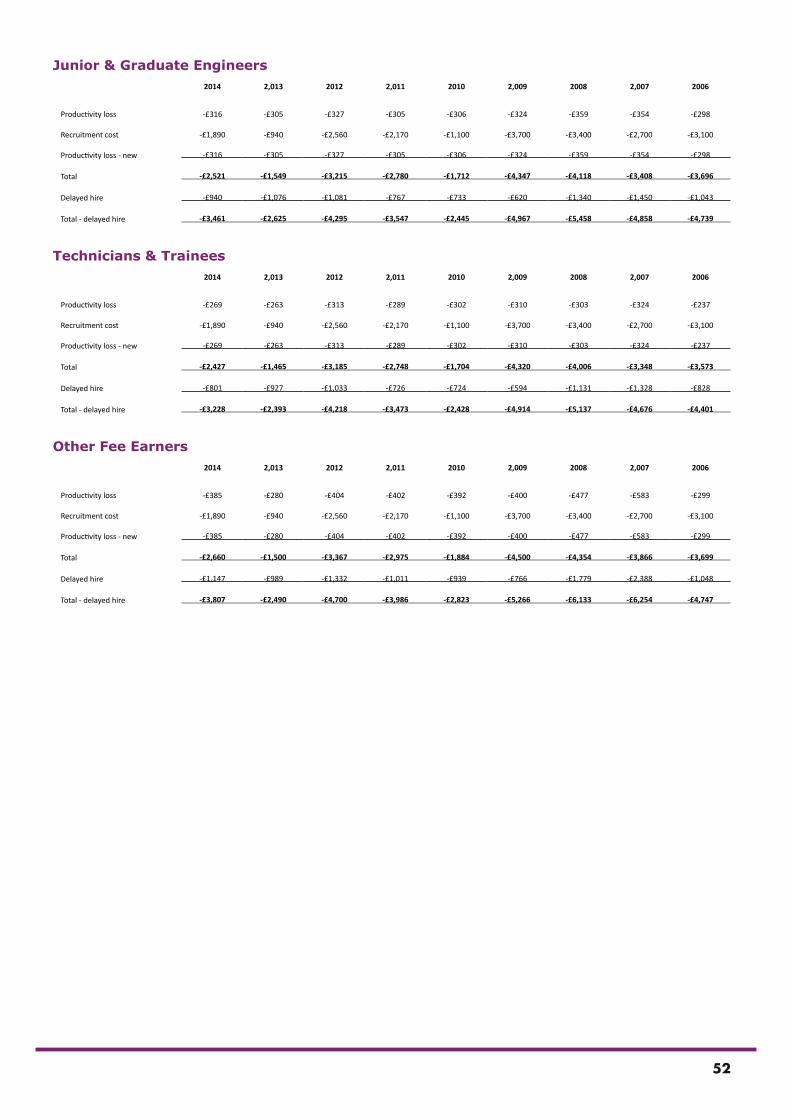
52
Junior & Graduate Engineers2014 2,013 2012 2,011 2010 2,009 2008 2,007 2006
Productivity loss -£316 -£305 -£327 -£305 -£306 -£324 -£359 -£354 -£298
Recruitment cost -£1,890 -£940 -£2,560 -£2,170 -£1,100 -£3,700 -£3,400 -£2,700 -£3,100
Productivity loss - new -£316 -£305 -£327 -£305 -£306 -£324 -£359 -£354 -£298
Total -£2,521 -£1,549 -£3,215 -£2,780 -£1,712 -£4,347 -£4,118 -£3,408 -£3,696
Delayed hire -£940 -£1,076 -£1,081 -£767 -£733 -£620 -£1,340 -£1,450 -£1,043
Total - delayed hire -£3,461 -£2,625 -£4,295 -£3,547 -£2,445 -£4,967 -£5,458 -£4,858 -£4,739
Technicians & Trainees2014 2,013 2012 2,011 2010 2,009 2008 2,007 2006
Productivity loss -£269 -£263 -£313 -£289 -£302 -£310 -£303 -£324 -£237
Recruitment cost -£1,890 -£940 -£2,560 -£2,170 -£1,100 -£3,700 -£3,400 -£2,700 -£3,100
Productivity loss - new -£269 -£263 -£313 -£289 -£302 -£310 -£303 -£324 -£237
Total -£2,427 -£1,465 -£3,185 -£2,748 -£1,704 -£4,320 -£4,006 -£3,348 -£3,573
Delayed hire -£801 -£927 -£1,033 -£726 -£724 -£594 -£1,131 -£1,328 -£828
Total - delayed hire -£3,228 -£2,393 -£4,218 -£3,473 -£2,428 -£4,914 -£5,137 -£4,676 -£4,401
Other Fee Earners2014 2,013 2012 2,011 2010 2,009 2008 2,007 2006
Productivity loss -£385 -£280 -£404 -£402 -£392 -£400 -£477 -£583 -£299
Recruitment cost -£1,890 -£940 -£2,560 -£2,170 -£1,100 -£3,700 -£3,400 -£2,700 -£3,100
Productivity loss - new -£385 -£280 -£404 -£402 -£392 -£400 -£477 -£583 -£299
Total -£2,660 -£1,500 -£3,367 -£2,975 -£1,884 -£4,500 -£4,354 -£3,866 -£3,699
Delayed hire -£1,147 -£989 -£1,332 -£1,011 -£939 -£766 -£1,779 -£2,388 -£1,048
Total - delayed hire -£3,807 -£2,490 -£4,700 -£3,986 -£2,823 -£5,266 -£6,133 -£6,254 -£4,747
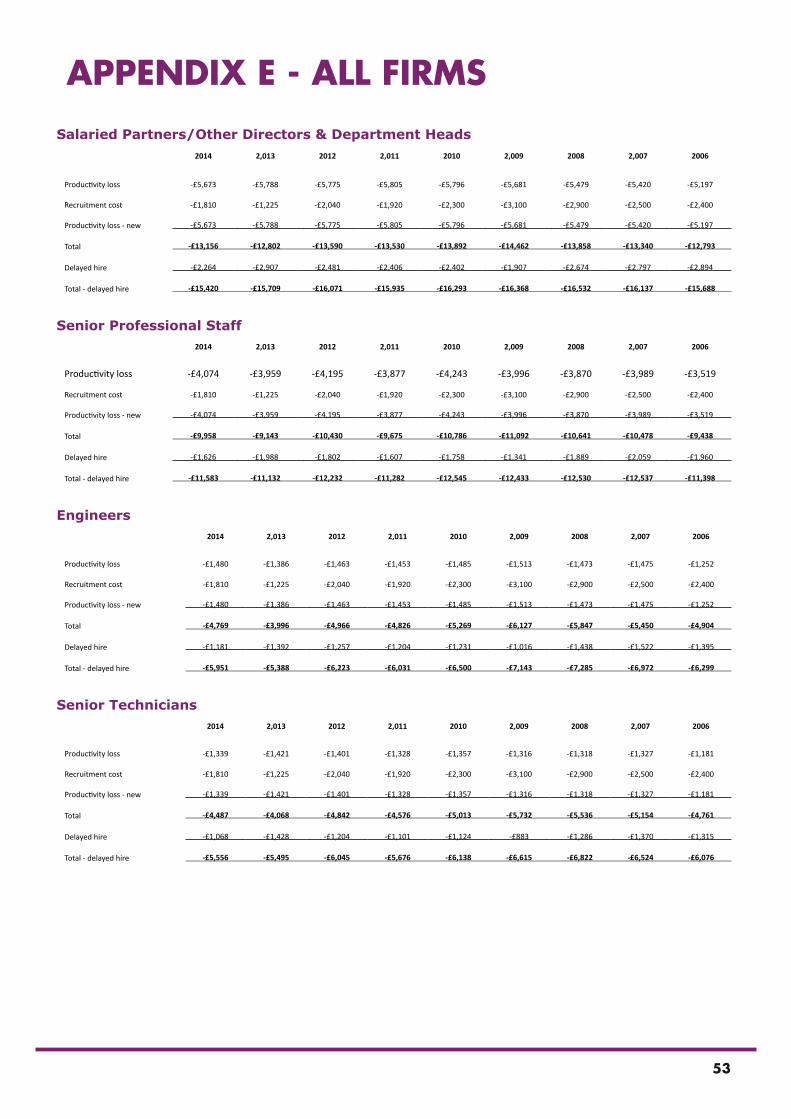
53
APPENDIX E - ALL FIRMSSalaried Partners/Other Directors & Department Heads
2014 2,013 2012 2,011 2010 2,009 2008 2,007 2006
Productivity loss -£5,673 -£5,788 -£5,775 -£5,805 -£5,796 -£5,681 -£5,479 -£5,420 -£5,197
Recruitment cost -£1,810 -£1,225 -£2,040 -£1,920 -£2,300 -£3,100 -£2,900 -£2,500 -£2,400
Productivity loss - new -£5,673 -£5,788 -£5,775 -£5,805 -£5,796 -£5,681 -£5,479 -£5,420 -£5,197
Total -£13,156 -£12,802 -£13,590 -£13,530 -£13,892 -£14,462 -£13,858 -£13,340 -£12,793
Delayed hire -£2,264 -£2,907 -£2,481 -£2,406 -£2,402 -£1,907 -£2,674 -£2,797 -£2,894
Total - delayed hire -£15,420 -£15,709 -£16,071 -£15,935 -£16,293 -£16,368 -£16,532 -£16,137 -£15,688
Senior Professional Staff2014 2,013 2012 2,011 2010 2,009 2008 2,007 2006
Productivity loss -£4,074 -£3,959 -£4,195 -£3,877 -£4,243 -£3,996 -£3,870 -£3,989 -£3,519
Recruitment cost -£1,810 -£1,225 -£2,040 -£1,920 -£2,300 -£3,100 -£2,900 -£2,500 -£2,400
Productivity loss - new -£4,074 -£3,959 -£4,195 -£3,877 -£4,243 -£3,996 -£3,870 -£3,989 -£3,519
Total -£9,958 -£9,143 -£10,430 -£9,675 -£10,786 -£11,092 -£10,641 -£10,478 -£9,438
Delayed hire -£1,626 -£1,988 -£1,802 -£1,607 -£1,758 -£1,341 -£1,889 -£2,059 -£1,960
Total - delayed hire -£11,583 -£11,132 -£12,232 -£11,282 -£12,545 -£12,433 -£12,530 -£12,537 -£11,398
Engineers 2014 2,013 2012 2,011 2010 2,009 2008 2,007 2006
Productivity loss -£1,480 -£1,386 -£1,463 -£1,453 -£1,485 -£1,513 -£1,473 -£1,475 -£1,252
Recruitment cost -£1,810 -£1,225 -£2,040 -£1,920 -£2,300 -£3,100 -£2,900 -£2,500 -£2,400
Productivity loss - new -£1,480 -£1,386 -£1,463 -£1,453 -£1,485 -£1,513 -£1,473 -£1,475 -£1,252
Total -£4,769 -£3,996 -£4,966 -£4,826 -£5,269 -£6,127 -£5,847 -£5,450 -£4,904
Delayed hire -£1,181 -£1,392 -£1,257 -£1,204 -£1,231 -£1,016 -£1,438 -£1,522 -£1,395
Total - delayed hire -£5,951 -£5,388 -£6,223 -£6,031 -£6,500 -£7,143 -£7,285 -£6,972 -£6,299
Senior Technicians2014 2,013 2012 2,011 2010 2,009 2008 2,007 2006
Productivity loss -£1,339 -£1,421 -£1,401 -£1,328 -£1,357 -£1,316 -£1,318 -£1,327 -£1,181
Recruitment cost -£1,810 -£1,225 -£2,040 -£1,920 -£2,300 -£3,100 -£2,900 -£2,500 -£2,400
Productivity loss - new -£1,339 -£1,421 -£1,401 -£1,328 -£1,357 -£1,316 -£1,318 -£1,327 -£1,181
Total -£4,487 -£4,068 -£4,842 -£4,576 -£5,013 -£5,732 -£5,536 -£5,154 -£4,761
Delayed hire -£1,068 -£1,428 -£1,204 -£1,101 -£1,124 -£883 -£1,286 -£1,370 -£1,315
Total - delayed hire -£5,556 -£5,495 -£6,045 -£5,676 -£6,138 -£6,615 -£6,822 -£6,524 -£6,076
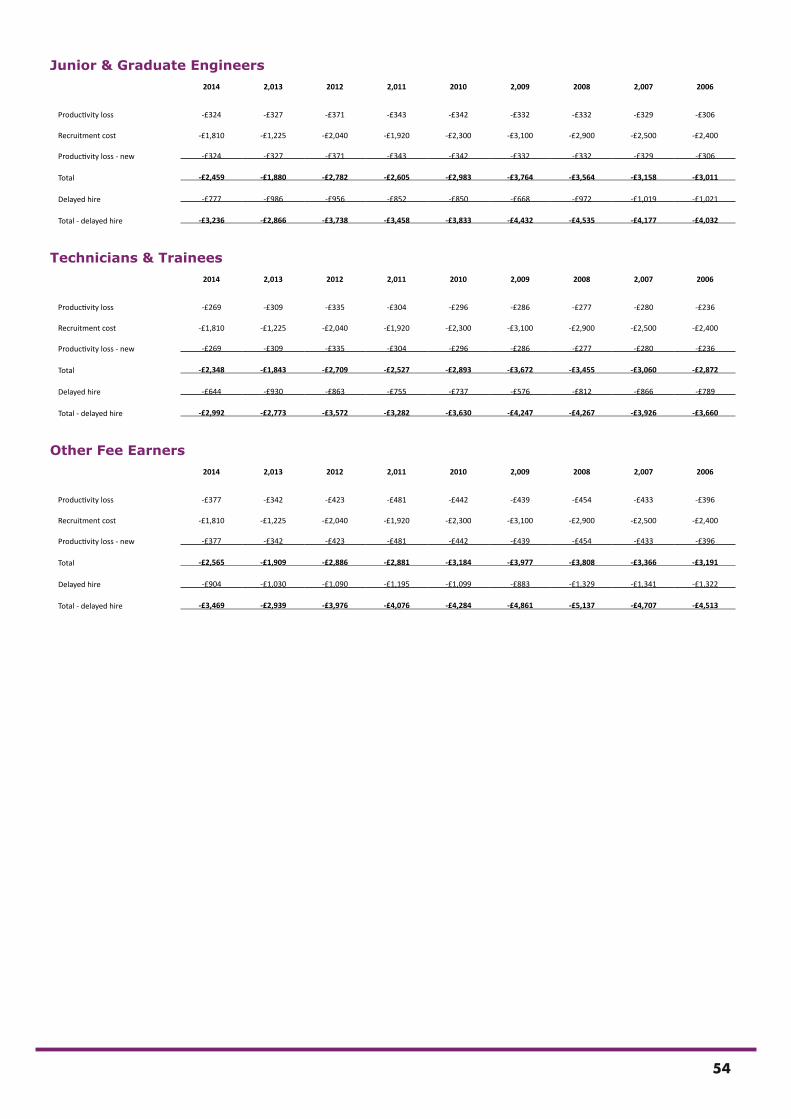
54
Junior & Graduate Engineers2014 2,013 2012 2,011 2010 2,009 2008 2,007 2006
Productivity loss -£324 -£327 -£371 -£343 -£342 -£332 -£332 -£329 -£306
Recruitment cost -£1,810 -£1,225 -£2,040 -£1,920 -£2,300 -£3,100 -£2,900 -£2,500 -£2,400
Productivity loss - new -£324 -£327 -£371 -£343 -£342 -£332 -£332 -£329 -£306
Total -£2,459 -£1,880 -£2,782 -£2,605 -£2,983 -£3,764 -£3,564 -£3,158 -£3,011
Delayed hire -£777 -£986 -£956 -£852 -£850 -£668 -£972 -£1,019 -£1,021
Total - delayed hire -£3,236 -£2,866 -£3,738 -£3,458 -£3,833 -£4,432 -£4,535 -£4,177 -£4,032
Technicians & Trainees2014 2,013 2012 2,011 2010 2,009 2008 2,007 2006
Productivity loss -£269 -£309 -£335 -£304 -£296 -£286 -£277 -£280 -£236
Recruitment cost -£1,810 -£1,225 -£2,040 -£1,920 -£2,300 -£3,100 -£2,900 -£2,500 -£2,400
Productivity loss - new -£269 -£309 -£335 -£304 -£296 -£286 -£277 -£280 -£236
Total -£2,348 -£1,843 -£2,709 -£2,527 -£2,893 -£3,672 -£3,455 -£3,060 -£2,872
Delayed hire -£644 -£930 -£863 -£755 -£737 -£576 -£812 -£866 -£789
Total - delayed hire -£2,992 -£2,773 -£3,572 -£3,282 -£3,630 -£4,247 -£4,267 -£3,926 -£3,660
Other Fee Earners2014 2,013 2012 2,011 2010 2,009 2008 2,007 2006
Productivity loss -£377 -£342 -£423 -£481 -£442 -£439 -£454 -£433 -£396
Recruitment cost -£1,810 -£1,225 -£2,040 -£1,920 -£2,300 -£3,100 -£2,900 -£2,500 -£2,400
Productivity loss - new -£377 -£342 -£423 -£481 -£442 -£439 -£454 -£433 -£396
Total -£2,565 -£1,909 -£2,886 -£2,881 -£3,184 -£3,977 -£3,808 -£3,366 -£3,191
Delayed hire -£904 -£1,030 -£1,090 -£1,195 -£1,099 -£883 -£1,329 -£1,341 -£1,322
Total - delayed hire -£3,469 -£2,939 -£3,976 -£4,076 -£4,284 -£4,861 -£5,137 -£4,707 -£4,513
55
Drawing on the expertise of the professional engineering institutions and the experience of its Champion Employers, EngTechNow supports all companies seeking to put best practice into place within their businesses and to ensure their staff and apprentices achieve EngTech status. Supported by the Gatsby Charitable Foundation, EngTechNow offers expertise in promoting Engineering Technician (EngTech) professional registration. EngtechNow Champion Employers are some of the world’s leading engineering employers and cover industries as diverse as mail services and aerospace design, energy generation and major civil engineering projects.
The UK’s long term economic ambitions will only be met by ensuring that the most valuable careers are cherished by employers, educators and the public. Through professional registration of technicians and engineers, these roles can stand out so that the UK attracts high enough numbers of the best young people into its world leading engineering sectors.
Even the largest firm can directly support its technical staff on the ground and through links with the professional engineering institutions, which are licensed by the Engineering Council to assess individuals for professional registration, EngTechNow helps its Champions to identify how they and their employees and apprentices will best benefit from the opportunities that EngTech registration offers.
As the leading business association in the sector, ACE represents the interests of professional consultancy and engineering companies large and small in the UK. Many of our member companies have gained international recognition and acclaim and employ over 250,000 staff worldwide ACE members are at the heart of delivering, maintaining and upgrading our buildings, structures and infrastructure. They provide specialist services to a diverse range of sectors including water, transportation, housing and energy.
The ACE membership acts as the bridge between consultants, engineers and the wider construction sector who make an estimated contribution of £15bn to the nation’s economy with the wider construction market contributing a further £90bn
ACE’s powerful representation and lobbying to government, major clients, the media and other key stakeholders, enables it to promote the critical contribution that engineers and consultants make to the nation’s developing infrastructure.
Through our publications, market intelligence, events and networking, business guidance and personal contact, we provide a cohesive approach and direction for our members and the wider industry. In recognising the dynamics of our industry, we support and encourage our members in all aspects of their business, helping them to optimise performance and embrace opportunity.
Our fundamental purposes are to promote the worth of our industry and to give voice to our members. We do so with passion and vision, support and commitment, integrity and professionalism.
ABOUT
www.engtechnow.com
www.acenet.co.uk
56
BENCHMARKINGThe Benchmarking Programme ACE Benchmarking is the industry’s annual peer-to-peer comparison programme, providing businesses with an in-depth analysis of operations, growth, productivity, costs, staff turnover, marketing and competitiveness.
The Benchmarking programme helps companies to identify efficiencies in their operations, improve their tendering procedures, analyse critically their revenue, costs and profit margins and demonstrate additional value for money in order to retain and acquire new clients.
It is using this data that ACE and EngTechNow have come together to produce indicative numbers as to the true cost of the transition and movement of employees not only between companies but also internally as individuals careers and skills develop.
Working with ACE
Since 2005, The Centre has worked with ACE to design and operate the benchmarking project for Engineering and Consultancy firms. Their significant experience and independence means that the ACE Benchmarking results are accurate and concise, providing an in depth analysis of companies’ performance. In addition to providing the analysis, CIFC participates in the European CEO Conference. The Benchmarking report and CIFC’s expertise being available at the event helps ACE to deliver a successful conference. Discussion covers a wide variety of topics and key metrics explored by participants from both the UK and Europe over the two days.
About CIFC
The Centre for Interfirm Comparison (CIFC) was one of the pioneers of benchmarking; it developed the concept of comparing company performance using management ratios in projects that range from a few simple measures to sophisticated analytical studies. The CIFC was set up in 1959 by the Institute of
Management with the support of the CBI and the British Productivity Council to meet the demand for a neutral specialist body to conduct interfirm comparisons and benchmarking projects on a confidential basis as a service to management. Its objectives are to enable companies to assess their performance against that of their peers and so identify areas for improvement and to implement best practice.
SOURCES
1 Shortage of engineers threaten UK growthhttp://www.ft.com/cms/s/0/3d3e3218-174c-11e4-b0d7-00144feabdc0.html#axzz3Y7qVtw34
Engineering Skill Shortages - The Factshttp://www.ems-sigma.co.uk/news/Engineering-Skill-Shortages-The-Facts
2 National Infrastructure Plan 2014https://www.gov.uk/government/uploads/system/uploads/attachment_data/file/381884/2902895_NationalInfrastructurePlan2014_acc.pdf
3 Engineering UK 2015http://www.siemens.co.uk/curiosity/pool/documents/enguk_report_2015_synopsis.pdf
4 2014 IET skills surveyhttp://www.theiet.org/factfiles/education/skills2014-page.cfm
5 Calculated based on employing technicians or graduate engineers at the entry level in terms of seniority of staff. If companies were to go above this and employee senior professionals or partners this cost would be even higher.
6 It costs over £30K to replace a staff memberhttp://www.hrreview.co.uk/hr-news/recruitment/it-costs-over-30k-to-replace-a-staff-member/50677
High staff turnover costing business £4billionhttp://www.hrgrapevine.com/markets/hr/article/2014-02-24-high-staff-turnover-costing-business-4billion
7 Why Promoting From Within Usually Beats Hiring From Outsidehttp://www.forbes.com/sites/susanadams/2012/04/05/why-promoting-from-within-usually-beats-hiring-from-outside
Talent management is crucial to recruiting leaders internallyhttp://www.apihealthcare.com/blog/healthcare-trends/talent-management-is-crucial-to-recruiting-leaders-internally
8 Navigating Ambiguity: Career Research Report 2014http://blessingwhite.com/research-report/navigating-ambiguity-career-research-report-2014
9 World Economic Forum, The Human Capital Report 2015
10 Some caution should be noted with these results given the low R2 value.
11 Young people need more support to make transition from education to workhttp://www.britishchambers.org.uk/press-office/press-releases/young-people-need-more-support-to-make-transition-from-education-to-work,-says-bcc.html
Further information
For further details about this publication please contact the authors:
Graham PontinSenior EconomistACE0207 227 [email protected]
Gavin PearsonCommunications & PR ManagerEngTechNow0207 665 [email protected] www.engtechnow.com
Disclaimer
This document was produced by ACE and EngTechNow and is provided for informative purposes only. The contents is general in nature and therefore should not be applied to the specific circumstances of individuals. Whilst we undertake every effort to ensure that the information within this document is complete and up to date, it should not be relied upon as the basis for investment, commercial, professional or legal decisions.
ACE and EngTechNow accepts no liability in respect to any direct, implied, statutory, and/or consequential loss arising from the use of this document or its contents.
No part of this report may be copied either in whole or in part without the express permission in writing of the Association for Consultancy and Engineering and EngTechNow.
© Association for Consultancy and Engineering 2015© EngTechNow 2015