THE RESPONSE OF THE … · brain glycerophosphocholine metabolism during multiple sclerosis despite...
150
THE RESPONSE OF THE GLYCEROPHOSPHOCHOLINE METABOLITE LIPIDOME TO EXPERIMENTAL AUTOIMMUNE ENCEPHALOMYELITIS & CYCLING FEMALE SEX HORMONES IN THE HIPPOCAMPUS & TEMPORAL-PARIETAL- ENTORHINAL CORTEX OF FEMALE MICE Samantha P.M. Sherman This thesis is submitted to the Faculty of Graduate and Postdoctoral Studies in partial fulfillment of the requirements for the Master’s degree in Neuroscience. Department of Cellular & Molecular Medicine Faculty of Medicine University of Ottawa © Samantha P.M. Sherman, Ottawa, Canada 2016
Transcript of THE RESPONSE OF THE … · brain glycerophosphocholine metabolism during multiple sclerosis despite...
THE RESPONSE OF THE GLYCEROPHOSPHOCHOLINE METABOLITE LIPIDOME TO EXPERIMENTAL AUTOIMMUNE ENCEPHALOMYELITIS & CYCLING FEMALE SEX HORMONES
IN THE HIPPOCAMPUS & TEMPORAL-PARIETAL-ENTORHINAL CORTEX OF FEMALE MICE
Samantha P.M. Sherman
This thesis is submitted to the Faculty of Graduate and Postdoctoral Studies in partial fulfillment of the requirements for the Master’s degree in Neuroscience.
Department of Cellular & Molecular Medicine Faculty of Medicine University of Ottawa
© Samantha P.M. Sherman, Ottawa, Canada 2016

ii
ABSTRACT
Recently, several glycerophosphocholine biomarkers for multiple sclerosis were
discovered in serum, plasma, and cerebrospinal fluid; little is known, however, about
brain glycerophosphocholine metabolism during multiple sclerosis despite evidence that
lysophosphocholines can elicit demyelination experimentally. Using a lipidomics
approach, glycerophosphocholine metabolites in the hippocampus and temporal-parietal-
entorhinal cortex of female C57BL/6J mice subjected to experimental autoimmune
encephalomyelitis (a mouse model of multiple sclerosis) were quantified and compared
to metabolite levels in healthy mice. To control for potential hormonal regulation,
glycerophosphocholine metabolites from these same regions were quantified across the
estrous cycle in healthy female N5 C57BL/6J x C3h/HeJ mice. I found that several
critical glycerophosphocholine metabolites were significantly decreased over the course
of experimental autoimmune encephalomyelitis in both brain regions, although the
hippocampus was more affected compared to the temporal-parietal-entorhinal cortex.
Similarly, hippocampal glycerophosphocholine metabolism was more responsive to
fluctuations in female sex hormones than the cortex. Overall, these results suggest that
glycerophosphocholine metabolism differs not only between brain regions, but also
between conditions, namely experimental autoimmune encephalomyelitis and the estrous
cycle.

iii
TABLE OF CONTENTS
ABSTRACT II
LIST OF ABBREVIATIONS VII
ACKOWLEDGMENTS IX
CHAPTER ONE 1 1.1 MULTIPLE SCLEROSIS 1 1.1.1 MULTIPLE SCLEROSIS IS AN AUTOIMMUNE NEURODEGENERATIVE DISEASE OF THE CENTRAL NERVOUS SYSTEM CHARACTERIZED BY DEMYELINATION AND AXONAL LOSS. 1 1.1.2 NEUROINFLAMMATION, MEDIATED BY AUTOREACTIVE T-CELLS THAT CROSS THE BLOOD-BRAIN BARRIER, IS A CONTRIBUTING FACTOR TO DEMYELINATION AND AXONAL LOSS IN MS. 3 1.1.3 IN ADDITION TO INFLAMMATION, NEURODEGENERATION ALSO CONTRIBUTES TO MS PATHOGENESIS THROUGH DYSFUNCTIONAL MITOCHONDRIA AND TOXIC CALCIUM ACCUMULATION. 9 1.1.4 MS CAN BE DIVIDED INTO DISTINCT SUBCLASSES: REMITTING MS AND PROGRESSIVE MS. 13 1.1.5 CURRENTLY AVAILABLE TREATMENTS ARE ONLY EFFECTIVE FOR RRMS PATIENTS, AND THEY TARGET ONLY THE IMMUNOLOGICAL COMPONENT OF THE DISEASE. 13 1.1.6 ALTHOUGH MS HAS TRADITIONALLY BEEN CONSIDERED AUTOIMMUNE IN NATURE, SOME ARE QUESTIONING WHETHER MS MAY TRULY BE A NEURODEGENERATIVE DISEASE WITH AN INFLAMMATORY COMPONENT. 16 1.1.7 COGNITIVE IMPAIRMENTS ARE COMMON AND APPEAR EARLY IN MS PATIENTS. 19 1.2 EXPERIMENTAL AUTOIMMUNE ENCEPHALOMYELITIS 22 1.2.1 THE BEST MODEL AVAILABLE FOR STUDYING THE IMMUNOLOGICAL COMPONENT OF MS IS EXPERIMENTAL AUTOIMMUNE ENCEPHALOMYELITIS. 22 1.2.2 MICE SUBJECTED TO EAE DEMONSTRATE COGNITIVE IMPAIRMENTS, PARTICULARLY IN MEMORY FUNCTION. 25 1.3 HORMONAL REGULATION OF DISEASE SEVERITY IN EAE AND MS 26 1.3.1 ESTROGENS MAY BE PROTECTIVE FOR EAE MICE AND MS PATIENTS. 26 1.3.2 FEMALE SEX HORMONE LEVELS IN CYCLING INDIVIDUALS FOLLOW A TYPICAL PATTERN KNOWN AS THE MENSTRUAL CYCLE IN HUMANS AND THE ESTROUS CYCLE IN MICE. 27 1.4 GLYCEROPHOSPHOLIPIDS 29 1.4.1 LIPIDS ARE DIVERSE, DYNAMIC MOLECULES THAT ARE ESPECIALLY IMPORTANT IN CELL MEMBRANES. 29 1.4.2 STRUCTURAL GLYCEROPHOSPHOCHOLINES IN THE MEMBRANE CAN BE REMODELED TO PRODUCE BIOACTIVE METABOLITES THAT PARTICIPATE IN CELL SIGNALING. 31 1.4.3 THE LAND’S CYCLE IS RESPONSIBLE FOR CONTROLLING PRODUCTION OF GPC METABOLITES. 38 1.4.4 GPC METABOLISM MAY PLAY A ROLE IN MS AND EAE PATHOLOGY. 47 1.5 OBJECTIVE AND HYPOTHESIS 50

iv
CHAPTER TWO 52 2.1 OBJECTIVE 52 2.2 STATEMENT OF AUTHOR CONTRIBUTIONS 52 2.3 INTRODUCTION 53 2.4 MATERIALS & METHODS 55 2.4.1 ANIMALS 55 2.4.2 TISSUE COLLECTION 56 2.4.3 GPC-ENRICHED LIPID EXTRACTIONS 56 2.4.4 GPC METABOLITE QUANTIFICATION 57 2.4.5 STATISTICAL ANALYSIS 59 2.5 RESULTS 60 2.5.1 THERE WERE 72 GPC METABOLITES AND 8 DIFFERENT METABOLITE FAMILIES DETECTED IN THE HIPPOCAMPUS. 60 2.5.2 EAE SIGNIFICANTLY DECREASED HIPPOCAMPAL LEVELS OF LPCS, PAFS AND PPAFS RELATIVE TO CONTROLS. 60 2.5.3 IN THE HIPPOCAMPUS, 6.94% OF THE INDIVIDUAL METABOLITE SPECIES WERE SIGNIFICANTLY DECREASED DURING EAE. 61 2.5.4 THERE WERE 80 GPC MEMBRANE METABOLITES AND 9 DIFFERENT METABOLITE FAMILIES DETECTED IN THE TPE CORTEX. 62 2.5.5 THERE WERE NO SIGNIFICANT DIFFERENCES BETWEEN EAE AND CONTROL GROUPS IN ANY OF THE 9 METABOLITE FAMILIES IN THE TPE CORTEX. 62 2.5.6 IN THE TPE CORTEX, 6.25% OF THE INDIVIDUAL METABOLITE SPECIES WERE SIGNIFICANTLY DECREASED IN EAE RELATIVE TO CONTROLS. 62 2.5.7 DESPITE SIMILARITIES IN SPECIES, ALL METABOLITE FAMILIES IN THE CONTROL GROUP WERE MORE ABUNDANT IN THE HIPPOCAMPUS THAN IN THE TPE CORTEX. 63 2.6 DISCUSSION 76 2.6.1 GPC METABOLISM IS REGIONALLY SPECIFIC BUT LARGELY UNIMPAIRED FOLLOWING EAE. 76 2.6.2 IN BOTH THE HIPPOCAMPUS AND THE TPE CORTEX DURING EAE, PLA2, LPCAT ACETYLTRANSFERASE AND NON-ENZYMATIC OXIDATION LIKELY DO NOT CONTRIBUTE TO GPC METABOLITE IMBALANCES. 77 2.6.3 LPCAT ACYLTRANSFERASE, TRANSACETYLASE AND PAF-AH ACTIVITY ARE LIKELY INCREASED DURING EAE; IN THE TPE CORTEX, PAF-AH APPEARS TO BE THE ONLY ENZYME SLIGHTLY AFFECTED BY EAE. 78 2.6.4 REGULATION OF THE GPC LIPIDOME IS REGIONALLY SPECIFIC. 81 2.6.5 FUTURE DIRECTIONS 83 2.7 CONCLUSION 86
CHAPTER THREE 87
3.1 OBJECTIVE 87 3.2 STATEMENT OF AUTHOR CONTRIBUTIONS 87 3.3 INTRODUCTION 88 3.4 MATERIALS AND METHODS 90 3.4.1 ANIMALS 90 3.4.2 ESTROUS CYCLE DETERMINATION 91 3.4.3 GPC-ENRICHED LIPID EXTRACTIONS 91
v
3.4.4 GPC METABOLITE QUANTIFICATION 92 3.4.5 STATISTICAL ANALYSIS 92 3.5 RESULTS 93 3.5.1 IN THE HIPPOCAMPUS, THERE WERE 58 INDIVIDUAL GPC METABOLITES DETECTED AND 6 DIFFERENT METABOLITE FAMILIES. 93 3.5.2 OF THE 6 METABOLITE FAMILIES DETECTED IN THE HIPPOCAMPUS, 4 WERE FOUND TO FLUCTUATE SIGNIFICANTLY WITH THE ESTROUS CYCLE. 94 3.5.3 THERE WERE 12 INDIVIDUAL SPECIES THAT VARIED SIGNIFICANTLY WITH THE ESTROUS CYCLE, ACCOUNTING FOR 20.69% OF THE HIPPOCAMPAL GPC METABOLITE LIPIDOME. 94 3.5.4 IN THE TPE CORTEX, THERE WERE 76 INDIVIDUAL METABOLITE SPECIES DETECTED AND 9 DIFFERENT METABOLITE FAMILIES. 95 3.5.5 THERE WERE NO SIGNIFICANT DIFFERENCES WITHIN THE METABOLITE FAMILIES IN THE TPE CORTEX ACROSS THE ESTROUS CYCLE. 96 3.5.6 THERE WAS ONLY 1 SPECIES THAT FLUCTUATED SIGNIFICANTLY WITH THE ESTROUS CYCLE, ACCOUNTING FOR 1.32% OF THE GPC METABOLITE LIPIDOME IN THE TPE CORTEX. 96 3.5.7 THE HIPPOCAMPUS AND TPE CORTEX SHARE THE MAJORITY OF THE SPECIES FOUND IN THEIR GPC METABOLITE LIPIDOME. 97 3.6 DISCUSSION 106 3.7 CONCLUSION 113
CHAPTER FOUR 114
4.1 SUMMARY OF RESULTS 114 4.2 DIFFERENCES IN GPC METABOLISM BETWEEN THE HIPPOCAMPUS AND TPE CORTEX ARE LIKELY DUE TO DIFFERENCES IN ENZYMATIC REGULATION 115 4.3 SUMMARY: EFFECTS OF PATHOLOGICAL AND NON-PATHOLOGICAL CONDITIONS ON GPC METABOLISM ARE NOT GENERALIZABLE BETWEEN BRAIN REGIONS 122
REFERENCES 128

vi
LIST OF FIGURES Figure 1.1 Model of neuroinflammation in MS. ............................................................. 7 Figure 1.2 Model of neurodegeneration in MS. ........................................................... 11 Figure 1.3 The GPC remodeling pathway (Land’s cycle) and non-enzymatic oxidation. .......................................................................................................................... 40 Figure 2.1 The effect of EAE on the metabolite families detected in the hippocampus. ................................................................................................................... 64 Figure 2.2 Log2 fold change of all the species detected in the hippocampus ............ 66 Figure 2.3 Examples of how EAE affected individual metabolite species in the hippocampus .................................................................................................................... 68 Figure 2.4 The effect of EAE on the metabolite families detected in the TPE cortex. ........................................................................................................................................... 70 Figure 2.5 Log2 fold change of all the species detected in the TPE cortex ................ 72 Figure 2.6 Examples of how EAE affected individual metabolite species in the TPE cortex. ............................................................................................................................... 74 Figure Figure 2.7 Proposed model for the metabolite changes in the hippocampus during EAE ..................................................................................................................... 84 Figure 3.1 The effect of the estrous cycle on the metabolite families detected in the hippocampus ................................................................................................................... 98 Figure 3.2 An overview of how individual species change over the estrous cycle in the hippocampus .......................................................................................................... 100 Figure 3.3 The effect of the estrous cycle on the metabolite families detected in the TPE cortex ..................................................................................................................... 102 Figure 3.4 An overview of how individual species change over the estrous cycle in the TPE cortex .............................................................................................................. 104 Figure 3.5 Proposed model of hormonal regulation of GPC metabolite levels in the hippocampus .................................................................................................................. 111 Figure 4.1 Comparison of GPC metabolism in the hippocampus and TPE cortex under pathological and non-pathological conditions ................................................. 126

vii
LIST OF ABBREVIATIONS MS multiple sclerosis CNS central nervous system Na+ sodium CSF cerebrospinal fluid BBB blood-brain barrier GL glia limitans PVS perivascular space BCSFB blood-cerebrospinal fluid barrier VLA-4 very late antigen-4 IL-17 interleukin-17 IL-22 interleukin-22 IFN- γ interferon-gamma ICAM-1 intercellular adhesion molecule-1 IL-23 interleukin-23 IL-1β interleukin-1 beta ATP adenosine triphosphate ROS reactive oxygen species RNS reactive nitrogen species K+ potassium Ca2+ calcium RRMS relapsing-remitting multiple sclerosis SPMS secondary progressive multiple sclerosis PPMS primary progressive multiple sclerosis GA glatiramer acetate IFN interferon MBP myelin basic protein DMF dimethyl fumarate IL-2 interleukin-2 MRI magnetic resonance imaging NFκ-B nuclear factor kappa-light-chain-enhancer of activated B-cells WM white matter GM grey matter CIS clinically-isolated syndrome suggestive of multiple sclerosis CA1 cornu ammonis 1 fMRI functional magnetic resonance imaging EAE experimental autoimmune encephalomyelitis MOG myelin oligodendrocyte glycoprotein CFA complete Freund’s adjuvant PTX pertussis toxin RR-EAE relapsing-remitting experimental autoimmune encephalomyelitis CH-EAE chronic experimental autoimmune encephalomyelitis GABA gamma-aminobutyric acid TNF- α tumor necrosis factor alpha GnRH gonadotropin-releasing hormone

viii
LH luteinizing hormone FSH follicle-stimulating hormone GPC glycerophosphocholine LPC lysophosphatidylcholine LPAF lyso platelet-activating factor PLPAF plasmenyl lyso platelet-activating factor APAF acyl platelet-activating factor PAF platelet-activating factor PPAF plasmenyl platelet-activating factor PAFR platelet-activating factor receptor LTP long-term potentiation WT wild-type NMDA N-methyl D-aspartate IL-6 interleukin-6 PUFA polyunsaturated fatty acid APAFX acyl platelet-activating factor-like PAFX platelet-activating factor-like PPAFX plasmenyl platelet-activating factor-like PLA2 phospholipase A2 LPCAT lysophosphatidlycholine acyltransferases PAF-AH platelet-activating factor acetyl hydrolase iPLA2 calcium-independent phospholipase A2 cPLA2 calcium-dependent phospholipase A2 sPLA2 secreted phospholipase A2 AGPAT 1-acylglycerol-3-phosphate O-acyltransferase MBOAT membrane bound O-acyltransferase TPE temporal-parietal-entorhinal MSp mass spectrometry LC-ESI-MSp liquid-chromatography electrospray ionization mass spectrometry HPLC high performance liquid chromatography m/z mass-to-charge MRM multiple reaction monitoring MQ MultiQuant FDR false detection rate OVX ovarectomized OVA ovalbumin

ix
ACKOWLEDGMENTS
Where have these past two and half years gone? I came to the Bennett lab as a
wide-eyed undergraduate with a love of science, and I now leave as a seasoned graduate
student with not only the same love of science, but a deep appreciation for the years of
work behind every scientific fact our world is built upon…and a thesis to prove it! I could
not have reached this point though, without all of the amazing support from the people in
my world. I would like to take a moment to express my sincere gratitude.
First, thank you to my incredibly talented supervisor, Steffany Bennett, for giving
me this opportunity to learn about the world of research. Your obvious passion for all
things lipids is inspiring, and I am very happy to have chosen to study this particularly
underappreciated macromolecule. Thank-you for everything that you have done for me!!
To all members of the Bennett lab, past and present—Steffany Bennett, Hongbin
Xu, Mark Akins, Graeme Taylor, Alexandra Pettit, Mike Kennedy, Yun Wang, Carolina
Cieniak, Fida Ahmed, Alexandre P Blanchard, Stephanie Fowler, Matthew Granger,
Graeme McDowell, Matthew Taylor, Bettina Franko, Thao Nguyen, Caitlin Fowler and
Jenna Letvi—you have been like a second family to me. Thank you for all the laughs and
all the fun times, and thank you for all of your support over the past few years. I will miss
working and hanging out with you all!!!!
A special shout-out also to my two official senior mentors, Alex and Grange, for
your incredible patience, guidance and advice throughout this degree. I was very
fortunate to have had you two looking out for me!!
A further big thank you goes to Yun Wang and Rui Chen for giving me a place to
stay and for letting me part of the family for the past few months. You guys have been

x
absolutely amazing—very generous, very kind and very accommodating—and I
appreciate everything you and your family have done for me!! A big hug also to little
Nathan Chen, for making me smile even on the hardest days.
A big thank you also to my friends and my extended family for all of your interest
and encouragement over the years. Having the support of all of you has made a huge
difference, and I appreciate each and every one of you!! I would especially like to thank
Krista Sherman, Yllka Dugolli and Stephen Sparkham—you guys have been my rock
over the past few most difficult months, and you have gone above and beyond to
unconditionally support and encourage me, even from the other side of the world. Thank
you for everything.
Lastly, thank you to my family—my parents, Dave and Pauline Sherman, and my
siblings, Krista Sherman and Wesley Sherman. You guys have always, always supported
me in everything that I have done. You helped me get through all the tough times, and
you shared in all of my successes. Always. I couldn’t ask for a better, more amazing
family than you!!! Thank-you, thank-you, thank-you!!! A big hug also to my nephew,
baby Ulrich Chepeka (‘Boo’), for making me smile with baby babbles over the phone and
for reminding me about the beautiful little treasures of life.

1
CHAPTER ONE
1.1 MULTIPLE SCLEROSIS
1.1.1 Multiple sclerosis is an autoimmune neurodegenerative disease of the central nervous system characterized by demyelination and axonal loss.
Multiple sclerosis (MS) is a chronic autoimmune neurodegenerative disease of the
central nervous system (CNS). This debilitating disease first strikes between the ages of
20 and 40 (Constantinescu, 2011, Rahn et al., 2014, Ksiazek-Winiarek et al., 2015), and
affects over 2 million people worldwide (Constantinescu, 2011, Rahn et al., 2014). It is
more prevalent in the female population, as approximately two thirds of MS patients are
women (Rahn et al., 2014). Although the disease is very variable from patient to patient
(Ksiazek-Winiarek et al., 2015), common symptoms include chronic pain, fatigue, limb
weakness, paralysis (Rahn et al., 2014), vision problems and cognitive impairments
(Ksiazek-Winiarek et al., 2015). These various neurological deficits suffered by MS
patients are believed to result from two pathological hallmarks of MS: demyelination
with limited remyelination (Compston and Coles, 2002) and axonal loss (Compston and
Coles, 2002, Constantinescu, 2011, Ellwardt and Zipp, 2014).
Demyelination refers to the loss of myelin surrounding the axons of neurons in
the CNS. Myelin is produced by oligodendrocytes, and provides an insulating, protective
cover that concentrically wraps around the axons of neurons (Compston and Coles, 2002,
Stirling and Stys, 2010). The vast majority of the axon is covered with myelin (Stirling
and Stys, 2010), with the exception of the unmyelinated nodes of Ranvier (Compston and
Coles, 2002). It is at these nodes of Ranvier that sodium (Na+) channels are clustered

2
(Compston and Coles, 2002, Stirling and Stys, 2010, Ellwardt and Zipp, 2014) in order to
regenerate a depolarization (Compston and Coles, 2002, Stirling and Stys, 2010) and thus
facilitate the propagation of action potentials from node to node along the axon; this is a
process known as saltatory conduction (Compston and Coles, 2002). Myelin prevents the
loss of electrical signal and increases the conduction speed along the neuron’s axon, thus
making saltatory conduction more effective and more efficient than in unmyelinated
axons (Compston and Coles, 2002, Stirling and Stys, 2010). Without its insulating
myelin, axonal signal propagation slows considerably or stops completely (Compston and
Coles, 2002).
In response to this demyelination, the CNS attempts to repair itself through
remyelination. Remyelination is the process of myelin regrowth around demyelinated
axons. This process requires that oligodendrocyte precursor cells differentiate into
mature, myelinating oligodendrocytes (Boulanger and Messier, 2014). Although the
capacity for remyelination does exist (Ellwardt and Zipp, 2014), this repair process is
often incomplete and becomes increasingly less efficient with further immune attacks
(Constantinescu, 2011) and with increasing age, until it fails completely (Boulanger and
Messier, 2014).
This failure of remyelination is one of the factors contributing to axonal loss in
MS (Boulanger and Messier, 2014). Without the protective myelin covering, axons are
less protected and rendered more susceptible to damage (Compston and Coles, 2002,
Constantinescu, 2011, Boulanger and Messier, 2014). If an axon is damaged too severely
either through loss of myelin or other demyelination-independent processes, it may be
completely severed (Ellwardt and Zipp, 2014). This permanently prevents signal
3
conduction along the axon, and is thought to contribute to long-term disability in MS
patients (Compston and Coles, 2002, Ellwardt and Zipp, 2014).
1.1.2 Neuroinflammation, mediated by autoreactive T-cells that cross the blood-brain barrier, is a contributing factor to demyelination and axonal loss in MS.
Inflammation in the brain contributes to demyelination and axonal loss through
autoreactive T-cells that infiltrate the CNS (Compston and Coles, 2002, Ransohoff and
Brown, 2012, Rangachari, 2013). The first step of this inflammatory process is the
activation of naïve T-cells in the lymph nodes (Harris and Fabry, 2012, Ransohoff and
Brown, 2012).
In order for an adaptive immune response to occur, naïve T-cells must first be
presented with their specific antigen (Harris and Fabry, 2012). CNS antigens are
monitored by immune cells present in the cervical lymph nodes (Harris and Fabry, 2012,
Louveau et al., 2015). Antigen-rich interstitial fluid from the CNS drains into the
cerebrospinal fluid (CSF), and is carried to the lymph nodes via lymphatic vessels. The
vessels believed to be primarily responsible for connecting the CSF-filled spaces of the
CNS to the cervical lymph nodes are the newly discovered meningeal lymphatic vessels,
located just under the dural sinuses (Louveau et al., 2015). Should one of these naïve T-
cells recognize its antigen, it will begin to differentiate and proliferate. The newly primed
T-cells then enter the circulation in search of their antigen in order to mount a full-scale
immune attack (Compston and Coles, 2002, Ransohoff and Brown, 2012).
These immune-surveilling T-cells, however, are not able to cross directly into the
parenchyma of the CNS in search of their antigen. Owing to the presence of delicate post-
mitotic neural cells that require a very particular extracellular environment for proper
functioning (Ransohoff and Brown, 2012), the CNS is protected from the immune system
4
by a structure known as the blood-brain barrier (BBB). This barrier consists of several
different ‘layers’ that work together to allow selective passage of cells and solutes into
the parenchyma of the CNS (Bechmann et al., 2007). All possible locations where
peripheral blood could come into contact with the CNS parenchyma are protected by the
BBB. For blood vessels entering the brain, the BBB consists of the blood vessel
endothelial cells, astrocytic endfeet that surround the basement membrane of the
endothelial cells known as the glia limitans (GL), and the gap between the endothelial
cells and the GL known as the perivascular space (PVS) (Harris and Fabry, 2012).
Similarly the choroid plexus, which produces cerebrospinal fluid (CSF) and is found on
the roof of all the ventricles (Murugesan, 2012), forms the blood-CSF barrier (BCSFB)
(Harris and Fabry, 2012, Murugesan, 2012). In the BCSFB, the capillary core of the
choroid plexus is surrounded by tightly-linked endothelial cells that separate the plexus
capillaries from the CSF in the ventricles (Murugesan, 2012).
Despite this restricted CNS parenchymal access afforded by the BBB, the CSF is
subject to the same immunological monitoring and access as the periphery (Galea et al.,
2007, Harris and Fabry, 2012). Thus immune-surveilling T-cells can pass through the
endothelial cells at post-capillary venules (Bechmann et al., 2007, Harris and Fabry,
2012) and the epithelial cells of the choroid plexus. Within the non-inflamed CNS, T-
cells may be found only in the PVS, the subarachnoid space (a CSF-filled gap extending
from the arachnoid mater to the pia mater that the PVS drains into), and the ventricles
(Harris and Fabry, 2012).
If the immune-surveilling T-cells encounter their antigen in the CSF or the PVS,
they will become reactivated and are capable of crossing the GL into the delicate CNS

5
parenchyma (Compston and Coles, 2002, Ransohoff and Brown, 2012). This is
accomplished through upregulation of T-cell integrins, such as very late antigen (VLA)-4
(Constantinescu, 2011, McCarthy et al., 2012). Once in the CNS parenchyma, the T-cells
release cytokines to further destabilize the BBB (Harris and Fabry, 2012, McCarthy et al.,
2012, Ransohoff and Brown, 2012).
This destabilization of the BBB is thought to be accomplished by cytokines
interleukin (IL)-17, IL-22, and interferon (IFN)-γ, all of which can be produced by a
subset of CD4+ T-cells known as Th17 cells. An in vitro BBB model (which utilizes
human endothelial cells) suggests that exposure to these cytokines induces the expression
of IL-17 and IL-22 receptors on the endothelial cells. This in turn increases the BBB
crossing of CD4+ T-cells (Kebir et al., 2007), which are believed to be key players in MS
pathology (Leuenberger et al., 2013). Further destabilization of the BBB may occur
through a specific subset of Th17 cells that produce IFN-γ. Using the same BBB model,
IFN-γ upregulated the expression of the adhesion molecule known as intercellular
adhesion molecule (ICAM)-1 on the human endothelial cells. ICAM-1 is thought to play
an important role in aiding T-cells to cross the BBB (Kebir et al., 2009).
In addition to enhancing immune cell infiltration, cytokines released by
reactivated T-cells in the CNS parenchyma attract more immune cells, such as
macrophages, into the CNS (Harris and Fabry, 2012, McCarthy et al., 2012, Ransohoff
and Brown, 2012) and also activate nearby microglia (Compston and Coles, 2002, Harris
and Fabry, 2012, Ransohoff and Brown, 2012). Microglia are known to produce a strong
innate immune response (Harris and Fabry, 2012, Ransohoff and Brown, 2012). In
addition to phagocytosing debris and presenting antigens to incoming T-cells (Ellwardt

6
and Zipp, 2014), microglia also produce cytokines IL-23 and IL-1β, which promote T-
cell survival (Ransohoff and Brown, 2012). The end result of this entire inflammatory
process is a myelin-directed immune response in the CNS that culminates in axon
demyelination (Compston and Coles, 2002, Constantinescu, 2011, McCarthy et al.,
2012). This process of neuroinflammation is exemplified in Figure 1.1.

7
Figure 1.1 Model of neuroinflammation in MS. As part of normal immunosurveillance, CNS antigens in the CSF are carried through the lymphatic vessels to cervical lymph nodes, where they are monitored by T-cells for any foreign materials. For unknown reasons, naïve T-cells in MS patients recognize myelin antigens as foreign; this triggers differentiation and proliferation of these myelin-specific T-cells. The newly primed, autoreactive T-cells are then released into the circulation in order to surveil the body for their particular myelin antigen. Some of these primed T-cells can enter the blood vessels in the brain, where they will cross into the PVS. Should they encounter their myelin antigen again, the T-cells become fully activated and cross the GL into the CNS parenchyma. Here, the activated T-cells release cytokines that activate nearby microglia, and attract macrophages and more T-cells into the CNS. The resulting myelin-directed inflammation leads to myelin damage and demyelination of the axons. Clinically, this demyelination correlates with the various symptoms MS patients experience.

Bennett
Typewritten Text
8

9
1.1.3 In addition to inflammation, neurodegeneration also contributes to MS pathogenesis through dysfunctional mitochondria and toxic calcium accumulation.
Inflammation, however, is only one pathological process involved in MS. The
second process is neurodegeneration, which refers to the loss of neurons and the resulting
atrophy in the CNS (van Munster et al., 2015). This process appears to stem from
malfunctioning mitochondria in the axon that are not able to provide enough energy, in
the form of adenosine triphosphate (ATP), to maintain the proper environment for action
potential generation (Stirling and Stys, 2010, Ellwardt and Zipp, 2014, van Munster et al.,
2015).
Mitochondrial dysfunction may arise from an increased concentration of the free
radicals reactive oxygen species (ROS) and reactive nitrogen species (RNS). ROS and
RNS are produced by activated microglia and macrophages (Nikic et al., 2011, van
Munster et al., 2015), which have been shown to spend a sizable amount of time in close
proximity to the axon in acute lesions (Nikic et al., 2011). The free radicals released by
the microglia and macrophages are believed to damage the enzymes involved in oxidative
phosphorylation (Stirling and Stys, 2010), a key process in energy generation in the
mitochondria. As a result, mitochondria cannot produce ATP as effectively as usual, thus
making it difficult to keep up with the energy-demanding task of axonal conduction
(Stirling and Stys, 2010, Ellwardt and Zipp, 2014, van Munster et al., 2015).
This ischemic environment in the axon leads to an inability to maintain the
precise ionic gradients required for action potential propagation (Stirling and Stys, 2010,
Ellwardt and Zipp, 2014). In order for conduction of action potentials to proceed as usual,
Na+ must be removed from the cell, which can be accomplished using the Na+ /potassium
(K+) exchanger, Na+/K+ ATPase. This enzyme requires ATP to function (Ellwardt and

10
Zipp, 2014). With a high requirement for ATP and damaged mitochondria however, the
energy demand is not effectively supplied (Stirling and Stys, 2010, Ellwardt and Zipp,
2014, van Munster et al., 2015). Instead, the Na+/calcium (Ca2+) exchanger removes the
extra Na+ from the cell by taking in more Ca2+. This leads to a toxic increase in Ca2+
within the axon (Stirling and Stys, 2010, Ellwardt and Zipp, 2014). Furthermore,
intracellular Ca2+ stores also release Ca2+ in response to inflammation (Ellwardt and Zipp,
2014). The resulting high Ca2+ concentration affects several Ca2+-dependent enzymes
(Stirling and Stys, 2010), and triggers various cell death pathways, ultimately resulting in
axonal loss and neuronal death (van Munster et al., 2015).
Demyelination further contributes to axonal ischemia and the resulting ionic
imbalances. In an effort to restore conduction, sections of the axon that are demyelinated
express Na+ channels (Ellwardt and Zipp, 2014), which are additional to the Na+ channels
already expressed at the nodes of Ranvier (Compston and Coles, 2002, Ellwardt and
Zipp, 2014). The increased number of Na+ channels results in more Na+ influx (Stirling
and Stys, 2010) and an even higher requirement for ATP to remove the excess Na+. This
leads to more Ca2+ influx via the Na+/Ca2+ exchanger, and therefore further contributes to
the cytotoxic effects associated with high Ca2+ (Ellwardt and Zipp, 2014). This
neurodegenerative process is illustrated in Figure 1.2.

11
Figure 1.2 Model of neurodegeneration in MS. In a normally functioning axon, the mitochondria produce energy in the form of ATP, which drives the Na+/K+ ATPase. This enzyme helps to maintain the proper environment for action potential propagation by removing Na+ from the axon and bringing in K+. During MS, ROS and RNS are released by activated microglia and macrophages; these free radicals cause mitochondrial swelling and dysfunction. As a result, the mitochondria can no longer produce adequate ATP to drive the Na+/K+ ATPase. In an effort to continue maintaining proper ionic gradients, the Na+/Ca2+ exchanger is used to remove the excess Na+ from the axon by bringing in Ca2+. The resulting Ca2+ accumulation may be further increased by release of Ca2+ into the cytosol from intracellular stores in response to inflammation. This Ca2+ buildup is toxic to the neuron, and eventually leads to death of the cell.

Bennett
Typewritten Text
12

13
1.1.4 MS can be divided into distinct subclasses: remitting MS and progressive MS.
The balance between neuroinflammation and neurodegeneration leads to the
classification of MS into two types: relapsing-remitting and progressive. Relapsing-
remitting MS (RRMS) is found in approximately 85% of MS patients (Rangachari, 2013,
Ellwardt and Zipp, 2014). It is characterized by periods of relapse where patients
experience the various symptoms of MS, followed by distinctive periods of remission
where patients often experience a full symptomatic recovery (Constantinescu, 2011,
Ellwardt and Zipp, 2014). Relapses are thought to correspond to periods of BBB
breakdown and immune cell infiltration (Constantinescu, 2011).
In comparison, progressive MS patients experience a steady neurological decline
without any remission periods, which is thought to correlate with irreversible axonal loss
(Constantinescu, 2011). There are two types of progressive MS; the first type, secondary
progressive MS (SPMS), develops from RRMS. In approximately half of RRMS patients
(Rangachari, 2013), the remission period between symptomatic periods becomes less and
less well-defined. When the patients no longer experience recovery from relapses but
instead experience constant neurological decline, their disease is classified as SPMS
(Constantinescu, 2011, Ellwardt and Zipp, 2014). The other type of progressive MS,
primary progressive MS (PPMS), occurs in 15% of the MS population (Constantinescu,
2011). PPMS patients never experience periods of remission nor relapse; instead they
experience constant neurological decline from the very beginning of the disease
(Constantinescu, 2011, Rangachari, 2013, Ellwardt and Zipp, 2014).
1.1.5 Currently available treatments are only effective for RRMS patients, and they target only the immunological component of the disease.
14
Although there are two main pathological processes involved in MS and two
distinct disease classifications, current MS treatments only target the immunological
component of the disease and are only effective for RRMS patients. There are currently
eight approved treatments available for MS patients that all reduce relapse rates in RRMS
(Farjam et al., 2015). The two oldest treatments are glatiramer acetate (GA) and beta-
IFN. GA mimics myelin basic protein (MBP) and causes a shift in the T-cell population
(Compston and Coles, 2002, Cross and Naismith, 2014) towards a more anti-
inflammatory profile (Cross and Naismith, 2014). The beta-IFNs, on the other hand,
hinder T-cell functions by interfering with IFN-γ production, antigen presentation and
adhesion molecule expression (Cross and Naismith, 2014). Other approved treatments
include mitoxantrone, natalizumab, alemtuzumab, fingolimod, teriflunomide, and
dimethyl fumarate (DMF) (Cross and Naismith, 2014, Farjam et al., 2015). Mitoxantrone
is a chemotherapeutic agent that inhibits DNA synthesis and repair, thus leading to a
decrease in activated and proliferating B- and T-cells (Compston and Coles, 2002, Cross
and Naismith, 2014). Natalizumab and alemtuzumab are both IV-administered.
Natalizumab is a monoclonal antibody directed against VLA-4, preventing lymphocytes
from crossing the BBB (Cross and Naismith, 2014, Ellwardt and Zipp, 2014, Ziemssen et
al., 2015). Alemtuzumab targets CD52, which is selectively expressed on mature immune
cells (Cross and Naismith, 2014, Farjam et al., 2015, Ziemssen et al., 2015), and results
in the depletion of B-and T-cells (Ziemssen et al., 2015). Fingolimod, triflunomide and
DMF are all orally administered. Fingolimod antagonizes sphingosine-1-phosphate,
which prevents lymphocytes from leaving the lymph nodes (Cross and Naismith, 2014,
Ziemssen et al., 2015). Teriflunomide treatment results in decreased proliferation of B-

15
and T-cells by selectively inhibiting the mitochondrial enzyme dihydroorotate
dehydrogenase, which is involved in pyrimidine synthesis (Cross and Naismith, 2014,
Ziemssen et al., 2015). Lastly, DMF is believed to counter harmful oxidative stress,
though its exact mechanism of action is unknown (Cross and Naismith, 2014, Ziemssen
et al., 2015).
There are also several promising therapies under investigation, all of which also
target the immune system, and most of which have no effect on progressive MS.
Secukinumab (AIN457), which neutralizes IL-17 released by Th17 cells (Ellwardt and
Zipp, 2014) and daclizumab, which blocks the IL-2 receptor (Cross and Naismith, 2014,
Farjam et al., 2015) and prevents IL-2 mediated tropic effects on T-cells (Farjam et al.,
2015), both appear to decrease relapse rates and magnetic resonance imaging (MRI)
lesions (Cross and Naismith, 2014, Ellwardt and Zipp, 2014, Farjam et al., 2015).
Laquinimod has also been shown to decrease relapse rates, likely by suppression of the
nuclear factor kappa-light-chain-enhancer of activated B-cells (NFκ-B) pathway (Cross
and Naismith, 2014). Corticosteroids such as methylprednisolone inhibit pro-
inflammatory cytokine and protein transcription, and reduce the duration of relapses
(Compston and Coles, 2002). In pilot studies, sex hormones testosterone and estriol
(given to male and female patients, respectively) improve cognitive function (Sicotte et
al., 2002, Sicotte et al., 2007). Additionally, testosterone decreases rates of brain atrophy
(Sicotte et al., 2007), and estriol decreases MRI lesion volumes (Sicotte et al., 2002). The
three types of monoclonal antibodies under investigation, rituximab (Cross and Naismith,
2014, Ellwardt and Zipp, 2014, Farjam et al., 2015), ocrelizumab and ofatumumab (Cross
and Naismith, 2014) target the B-cell specific CD20 antigen, which leads to B-cell lysis

16
(Cross and Naismith, 2014, Ellwardt and Zipp, 2014, Farjam et al., 2015). All of these
monoclonal antibodies cause a reduction in MRI lesion load in RRMS patients (Cross
and Naismith, 2014, Ellwardt and Zipp, 2014, Farjam et al., 2015). Rituximab is the only
therapy found to be effective in SPMS, but only in patients younger than 51 years with
inflammatory lesions present (Farjam et al., 2015). Other options include T-cell
vaccinations, both against the pathogenic T-cells themselves and against the highly
expressed T-cell receptors (Farjam et al., 2015), and mesenchymal stem cell therapies
such as stem cell transplants (Cross and Naismith, 2014, Farjam et al., 2015) Both of
these treatments show some promise, but require further clinical trials to fully
characterize their effects (Cross and Naismith, 2014, Farjam et al., 2015).
Despite the eight approved treatments and the numerous therapies currently under
investigation, treatments for MS patients are limited. Available therapies are only
beneficial for treating relapses in RRMS patients, as they do not prevent the more long-
term disability accumulation that plagues SPMS and PPMS patients (Farjam et al., 2015).
Future therapies are focused on promoting remyelination in hopes of being more effective
(Cross and Naismith, 2014). Stys (2013) also suggests that focusing on treatments from
the perspective of neurodegeneration rather than inflammation may be beneficial.
1.1.6 Although MS has traditionally been considered autoimmune in nature, some are questioning whether MS may truly be a neurodegenerative disease with an inflammatory component.
Despite clear evidence that autoimmune attack is part of MS etiology, many
scientists have begun to question whether MS is truly an autoimmune disease, or whether
it would be better classified as a neurodegenerative disease. Traditionally, MS has been
considered an autoimmune disease that specifically targets the CNS (Stys et al., 2012). In

17
this model, the myelin-focused inflammation eventually leads to neurodegeneration.
Although it is not known exactly how this myelin-specific autoimmune response is
triggered, one plausible theory is molecular mimicry. Molecular mimicry in the context
of MS would occur when a pathogen with a similar structure to a myelin antigen is
recognized by T-cells, and the pathogen-activated T-cells then cross-react with myelin
antigens. This would prompt an autoimmune response against myelin that could result in
demyelination and eventually lead to axonal loss (Compston and Coles, 2002,
Constantinescu, 2011).
This traditional view of inflammation precipitating neurodegeneration, however,
is being challenged by the growing evidence that neurodegeneration is present at every
stage of MS. There are reports of significantly decreased white matter (WM) and grey
matter (GM) volumes in both RRMS (Sacco et al., 2015) and PPMS (Ruggieri et al.,
2015) patients relative to healthy controls. Similarly, GM atrophy and overall brain
atrophy were found in all forms of MS and at increasing rates as the disease progressed
from RRMS to SPMS (Fisher et al., 2008). Even in patients with the lowest disability
scores and in patients with the shortest disease duration, there was still an observable,
significant loss in neurons (via N-acetylaspartate:creatine ratios) relative to healthy
controls (De Stefano et al., 2001). Similarly, axonal transection was observed in all 47
lesions examined in post-mortem brains of 11 MS patients ranging from ages 18-62 and
disease duration 2 weeks to 27 years (Trapp et al., 1998). Furthermore, there is
documented evidence that mitochondrial and axonal pathologies can occur in the absence
of demyelination. Nikic et al. (2011) documented the existence of focal axonal
degeneration, which has three stages of axon damage: normal (stage 0), swollen (stage 1)

18
and transected (stage 2). Stage 1 and stage 2 axons were found even when the axon was
still normally myelinated. In addition, mitochondrial swelling, indicative of dysfunction,
was found in stage 0 and stage 1 myelinated axons in areas of immune infiltration. These
results were found both in an animal model of MS and in tissue from MS biopsies (Nikic
et al., 2011).
Contributing to this argument, Stys et al. (2012) outline further support for this
‘inside out’ model of MS. They note that myelin pathology, often occurring on the
innermost myelin layer (which is not readily accessible to the immune cells), has been
found early in the disease. Early MS brain examination also suggested more debris
clearance rather than inflammation due to the higher concentration of microglia and
macrophages rather than lymphocytes (Stys et al., 2012) . A genome wide association
study pertaining to MS revealed that there were many genes related to RRMS that were
immune-related, whereas the genes associated with PPMS were not immunologically
relevant (International Multiple Sclerosis Genetics et al., 2011, Stys et al., 2012). This is
similar to how the available immune-modulating treatments for MS are effective for
RRMS patients, but have no effect on the progressive disease course. In summary, the
authors suggest that the ‘true’ MS is PPMS, and that the neurodegenerative process leads
to the release of highly immunogenic myelin antigens that stimulate an inflammatory
response, which differs across patients depending on the reactivity of their immune
system. The resulting inflammation then further feeds neurodegeneration, creating a
vicious destructive cycle (Stys et al., 2012).
Stys (2013) also stresses that one process is not more important than the other, nor
does he refute the large body of research that has been advancing understanding of

19
neuroinflammation in MS. He merely suggests that knowing what process is the initial
trigger in MS could be very important. There may be a very prominent neurodegenerative
component of MS that is being overlooked, and thus viewing MS from the perspective of
neurodegeneration may prove to be beneficial for all MS patients (Stys, 2013).
1.1.7 Cognitive impairments are common and appear early in MS patients.
One element that many MS patients have in common is cognitive impairment.
Despite the popular belief that cognitive symptoms are a rare, late-stage event in MS, 40-
65% of the MS population experiences cognitive deficits (Amato et al., 2006). In fact,
there is evidence that the cognitive dysfunction occurs very early in the disease process.
Ranjeva et al. (2006) detected subtle cognitive impairments in working memory and
attention in patients diagnosed with clinically-isolated syndrome suggestive of MS (CIS).
(CIS is the diagnosis given to patients before they meet the full criteria for an official MS
diagnosis (Constantinescu, 2011)). Using tests of cognitive function, numerous studies
have also found cognitive impairments in RRMS patients (Amato et al., 2006, Portaccio
et al., 2006, Kern et al., 2012, Yu, 2012, Sacco et al., 2015). Some of the most common
cognitive impairments suffered by MS patients include memory dysfunctions, attention
deficits, and slowed information processing (Amato et al., 2006).
Although there are numerous accounts of WM damage, there is also documented
evidence of GM damage, which seems to correlate better with cognitive impairments
(van Munster et al., 2015). In the CIS patients with subtle cognitive impairments,
Ranjeva et al. (2006) found that there were diffuse tissue abnormalities both in normal-
appearing WM and in GM. Supporting this finding, Fisher et al. (2008) found that there
was a 3-fold increase in the rate of WM volume loss across all stages of MS, relative to

20
healthy controls. They also found, however, that the overall brain atrophy rate tended to
follow that of GM atrophy. This rate of GM loss began in patients transitioning from CIS
to RRMS, who had a 3.4-fold rate increase, and progressively increased such that the
SPMS patients had a 14-fold increase in the rate of GM volume loss. This GM atrophy
rate also correlated with the clinical disability scores, whereas the WM atrophy rate did
not (Fisher et al., 2008). It has thus been suggested that examining grey matter atrophy
may provide a clinical marker for monitoring mild cognitive impairment progression in
MS patients (Amato et al., 2006, Fisher et al., 2008).
The cortex also presents with signs of damage over the course of MS. PPMS
patients were found to have a significantly lower normalized neocortical volume relative
to healthy controls (Ruggieri et al., 2015). Cognitively-impaired RRMS patients were
found also to have a significantly lower normalized cortical volume relative to
cognitively-preserved RRMS patients, and this cortical atrophy correlated with scores on
verbal memory, verbal fluency and attention/concentration (Portaccio et al., 2006).
Calabrese et al. (2015) also found that in CIS and early RRMS patients, the development
of new cortical lesions led to increased cortical thinning, a correlation which was only
seen in these early stages of MS. This suggests that early in the disease, there is a link
between focal damage and global atrophy in the cortex (Calabrese et al., 2015).
Damage was also found in the hippocampus. In the same study, Calabrese et al.
(2015) found that the focal and diffuse GM damage seemed to preferentially affect the
hippocampus and the parahippocampal gyrus, among other brain regions. Sacco et al.
(2015) also found a significant decrease in right and left hippocampi volumes in RRMS
patients relative to controls. Interestingly, this hippocampal atrophy was found not only

21
in cognitively-impaired RRMS patients, but also cognitively-preserved MS patients. This
finding suggests that hippocampal atrophy is occurring very early in the disease, even in
patients where cognitive impairments are not detected (Sacco et al., 2015). A thorough
post-mortem analysis of hippocampi from progressive MS patients by Papadopoulos et
al. (2009) found significant demyelination and atrophy in this structure. In approximately
half of the MS cases analyzed, the hippocampus was affected by demyelination, with an
average demyelinated area of 30.4% ± 22%. The most frequently affected area was the
cornu ammonis (CA)1 region, which also had a 27.0% and 17.4% decrease in neuronal
number and neuronal size, respectively. These neuronal abnormalities in the CA1 region
correlated with the 22.3% decrease in overall cross-sectional area of the entire
hippocampus, suggesting a possible relationship between neuronal loss and overall
hippocampal atrophy (Papadopoulos et al., 2009).
Although these studies provide compelling evidence for cognitive deficits very
early in MS, these impairments are often difficult to detect in the initial disease stages.
Extensive neuropsychological tests are required to reveal their presence, which is
something that the average physician does not have time to administer (Amato et al.,
2006, Yu, 2012). This difficulty in detection may also be explained by neuroplasticity, a
broad term that includes the process of cortical reorganization to compensate for damage
(Audoin, 2006, Ksiazek-Winiarek et al., 2015, van Munster et al., 2015).
Studies using functional MRI (fMRI) have demonstrated that deficits in
connectivity can be compensated for by this cortical reorganization (Audoin, 2006). In
rats with an animal model of MS, somatosensory stimulation of their forepaw elicited
more widespread and bilateral brain activation in the cortex than before the disease

22
(Tambalo et al., 2015). Similarly in RRMS patients, there was more bilateral activation in
more regions of the hippocampus than in healthy controls when tasked with the same
memory test (Kern et al., 2012). Even in CIS patients there was evidence of
reorganization in the prefrontal cortices, as fMRI revealed more widespread and bilateral
activation in CIS patients relative to controls during a working memory task (Ranjeva et
al., 2006).
Compensation for neurological damage by neuroplasticity, however, is not a
permanent solution. In response to their finding that RRMS patients with fornix damage
tended to perform worse and have less bilateral activation relative to RRMS patients
without this damage, Kern (2012) suggested that if there is damage to connected brain
areas, reorganization is impaired and symptoms become more evident. In addition to
increased damage, increasing disease duration and increasing age also decrease the
capacity for neuroplasticity (Ksiazek-Winiarek et al., 2015). Often by the time
neuroplasticity fails and these cognitive impairments become obvious, the process of
damage has already been occurring since the very earliest stages of MS (Calabrese et al.,
2015). Moreover, this damage to cognitively relevant brain areas is very difficult to
rectify, as it is often irreversible and progressive (Amato et al., 2006).
1.2 EXPERIMENTAL AUTOIMMUNE ENCEPHALOMYELITIS
1.2.1 The best model available for studying the immunological component of MS is experimental autoimmune encephalomyelitis.
Currently the best characterized animal model for studying MS is experimental
autoimmune encephalomyelitis (EAE) (Kuerten and Angelov, 2008). In this model, the
investigator induces a myelin-specific autoimmune response in animals that results in

23
neuroinflammation, demyelination (Berard et al., 2010, Robinson et al., 2014) and axonal
loss (Berard et al., 2010), similar to pathologies found in MS (Novkovic et al., 2015).
EAE owes its discovery to the rabies vaccination (Kuerten and Angelov, 2008, Ben-Nun
et al., 2014) developed by Pasteur in the late 1800s (Kuerten and Angelov, 2008).
Approximately 0.1% of people who were given the vaccine developed paralysis and
neurological dysfunctions (Kuerten and Angelov, 2008, Ben-Nun et al., 2014). This
condition was traced back to the rabbit spinal cord tissue used in the vaccine, and further
investigations specifically implicated myelin as the causative agent (Laatsch et al., 1962,
Ben-Nun et al., 2014). After further studies in animals, scientists also found that addition
of immune adjuvants to the myelin further enhanced this response (Kuerten and Angelov,
2008). Murine EAE was first successfully induced in 1949 (Kuerten and Angelov, 2008,
Robinson et al., 2014). Since then, mouse models of EAE have become the most popular,
likely due to the ease and availability of genetic manipulations (Robinson et al., 2014).
Although today there are many mouse models of EAE using different mouse
strains and different myelin antigens, the gold standard in murine EAE uses C57BL/6
mice and myelin oligodendrocytes glycoprotein (MOG), specifically peptide 35-55 (Ben-
Nun et al., 2014, Bittner et al., 2014). C57BL/6 mice are of particular interest because of
the comparative ease of genetic manipulation in this strain (Rangachari, 2013). MOG35-55
is popular because it is highly encephalitogenic (Ben-Nun et al., 2014) and is found on
the outer layers of the myelin sheath, thus making it easily accessible to the immune
system (Kuerten and Angelov, 2008). MOG35-55 is emulsified in complete Freund’s
adjuvant (CFA), which contains Mycobacterium tuberculosis, and is injected into the
animal (Berard et al., 2010, Bittner et al., 2014). The CFA helps to elicit an initial

24
immune response at the area of injection by activating macrophages, which cause release
of cytokines, enhanced phagocytosis of the myelin antigen and improved antigen
transportation to the lymph nodes (Bittner et al., 2014). At the same time and two days
later, mice are also injected with Pertussis toxin (PTX) (Berard et al., 2010, Bittner et al.,
2014). PTX is responsible for further enhancing the immune response (Rangachari, 2013,
Bittner et al., 2014), but also for permeabilizing the BBB for relative ease of T-cell
infiltration (Bechmann et al., 2007, Bittner et al., 2014). PTX has been shown to elicit
swelling and immune-related gene expression in the choroid plexus, which is thought to
be one of entry points for T-cells infiltrating the CNS (Murugesan, 2012).
The end result of this immunization procedure is a myelin-specific autoimmune
response in the CNS, similar to what is found in MS, that causes progressive peripheral
paralysis (Robinson et al., 2014). Clinically, the progression of EAE in the animals can
be tracked by monitoring the degree of paralysis, which starts at the tail and moves up the
body. The onset of the disease corresponds to grade one paralysis, where only the tail is
paralyzed. The peak of the disease is at grade four, where the animal is completely
paralyzed from the hind limbs down (Berard et al., 2010). In relapsing-remitting (RR)-
EAE, elicited using lower dosages of myelin antigen and immune adjuvants (Berard et
al., 2010, Ben-Nun et al., 2014), the peak of the disease is followed by a remission period
with less severe paralysis (Berard et al., 2010). Mice with chronic (CH)-EAE (using
higher myelin and adjuvant dosages (Berard et al., 2010, Ben-Nun et al., 2014)),
however, have a continuous high level of paralysis after the peak of the disease (Berard et
al., 2010).

25
1.2.2 Mice subjected to EAE demonstrate cognitive impairments, particularly in memory function. In addition to this obvious motoric impairment, EAE mice also suffer from
cognitive impairments. Spatial memory in late EAE was tested in mice at days 40-45
post-injection using the Barnes Maze test and the cookie finding test. The Barnes maze is
a circular table with 20 holes surrounded by visual cues. The mice were motivated by
light and metronome ticking to locate the escape route hidden under one of the holes.
Successful mice made fewer errors when locating their escape route (Ziehn et al., 2010).
The cookie finding test entails hiding a treat in the bedding of a cage, and training the
mice to find the treat. On the test day, the treat was removed and experimenters analyzed
the mouse’s proximity to the treat location in their attempt to find it (Novkovic et al.,
2015). In both cases, the controls performed better than the EAE mice, indicating spatial
learning and memory impairments in late EAE (Ziehn et al., 2010, Novkovic et al.,
2015).
Moreover, Acharjee et al. (2013) were able to detect cognitive impairments in
EAE mice before the onset of EAE paralysis using the Morris water maze and fear
conditioning tests. In the Morris water maze test, mice were taught to find a hidden
platform in a pool of water using visual cues present in the room. On testing day, the
platform was moved, and the amount of time the mouse spent searching in the quadrant
of the pool where the platform had been hidden was assessed. The fear conditioning test
paired a tone and an electric shock on the first training day. The next day, the tone alone
was applied in a new environment and the freezing behaviour of the mice in response to
the tone alone was assessed. Overall the EAE mice spent less time in the correct platform
quadrant of the pool and exhibited less freezing behaviour, which indicates memory
26
impairment (Acharjee et al., 2013). Dutra et al. (2013) also demonstrated pre-motoric
cognitive impairments using the Morris Water Maze and an object location memory test
in female C57BL/6 mice induced with EAE.
In accordance with these memory impairment findings, there is also evidence of
hippocampal damage in EAE mice. Ziehn et al. (2010) found that there was a decrease in
both CA1 volume and in the number of γ-aminobutyric acid (GABA)-ergic interneurons
in the CA1 region in male EAE mice from day 13 post-injection (the first day of
assessment) and continuing throughout the duration of EAE (up to day 55 post-injection).
They also observed more activated microglia/macrophages than lymphocytes, and high
levels of apoptotic cells (mostly neurons, interneurons and astrocytes) relative to controls
(Ziehn et al., 2010). Similarly in female mice, there was a decline in the volume of the
CA1 region (Ziehn et al., 2012), a reduction in the number of GABAergic interneurons
(Nistico et al., 2013), and an increase in the number of activated microglia in the EAE
mice relative to controls (Ziehn et al., 2012, Nistico et al., 2013). Novkovic et al. (2015)
also noted that long-term potentiation (LTP), an important process in hippocampal
synaptic plasticity and memory formation, was impaired in late EAE (day 40-45 post-
injection).
1.3 HORMONAL REGULATION OF DISEASE SEVERITY IN EAE AND MS
1.3.1 Estrogens may be protective for EAE mice and MS patients.
Interestingly, there is evidence that estrogen may be protective in EAE and MS.
When tested for various sensory and motoric impairments, EAE mice were found to
suffer fewer neurological deficits during periods of high estrogen (when mice are in
proestrus) in comparison to other points in their hormonal cycle (Rahn et al., 2014).

27
Similarly in MS, relapses are more numerous in periods of low estrogen, such as before
menstruation or after giving birth (Foroughipour et al., 2012). In contrast, MS patients
who are pregnant and thus have high levels of the pregnancy estrogen estriol tend to have
fewer relapses (Sicotte et al., 2002, Foroughipour et al., 2012, Gaby, 2013, Trenova et al.,
2013, Rahn et al., 2014). A pilot study using estriol to treat 6 RRMS patients found that
the hormone decreased the number and volume of lesions in the CNS, as measured by
MRI. This evidence points towards the possibility that sex hormones, at least in female
MS patients, may help to ameliorate the disease (Sicotte et al., 2002), perhaps through
suppression of inflammatory cytokines such as IFN-γ or tumor necrosis factor (TNF)-α
(Trenova et al., 2013). Many MS patients, however, have low plasma levels of estrogen
and progesterone (Lombardi et al., 2011, Trenova et al., 2013), which may hinder the
supposed anti-inflammatory affects of the female sex hormones (Trenova et al., 2013).
1.3.2 Female sex hormone levels in cycling individuals follow a typical pattern known as the menstrual cycle in humans and the estrous cycle in mice. In regularly cycling females, estrogen and progesterone levels follow a cyclic
pattern, known as the menstrual cycle in humans and the estrous cycle in mice. Complex
cyclic hormonal interplay between the CNS and the ovaries controls reproductive
function through key hormones including not only estrogen and progesterone, but also
gonadotropin-releasing hormone (GnRH), luteinizing hormone (LH), and follicle
stimulating hormone (FSH).
The follicular phase, or the time of oocyte maturation, is characterized by a steady
increase in estrogen produced by the ovaries (Goldman et al., 2007, Caligioni, 2009,
McLean et al., 2012, Andersson et al., 2013). The high estrogen levels stimulate neurons
in the hypothalamus and septal area of the brain to release GnRH into the median

28
eminence. Released GnRH enters the portal vessel system and travels to the anterior
pituitary (Goldman et al., 2007, Caligioni, 2009, McLean et al., 2012), triggering the
release of gonadotropins LH and FSH into the peripheral circulation. The high levels of
LH and FSH finalize the phase of follicular development, leading to ovulation (Goldman
et al., 2007, Caligioni, 2009, McLean et al., 2012, Andersson et al., 2013). The ruptured
follicle is luteinized (Goldman et al., 2007, Andersson et al., 2013), forming the
progesterone-producing corpus luteum (McLean et al., 2012, Andersson et al., 2013);
estrogen, FSH and LH levels drop back to baseline (Caligioni, 2009, McLean et al.,
2012), and progesterone levels increase (McLean et al., 2012). If fertilization does not
take place, the corpus luteum lyses (McLean et al., 2012, Andersson et al., 2013), the
progesterone levels drop (McLean et al., 2012), and the estrogen begins to increase once
again (Caligioni, 2009, McLean et al., 2012), starting a new cycle of follicular
development (Andersson et al., 2013).
In mature mice, this reproductive cycle typically takes approximately 4-5 days,
compared to the 28 days required for the human cycle (Caligioni, 2009). Sexual maturity
in mice requires two events: the opening of the vagina (which occurs around 1 month of
age) and the first ovulation (which may occur days or weeks after the vaginal opening)
(Goldman et al., 2007). After this first ovulation, however, the mice may not have a
regular, relatively consistent 4-5 day cycle until up to 5 months of age; this is very
variable however, as some mice are already consistently cyclic before 3 months of age.
Regular cyclicity is observed until 7 or 8 months (Nelson et al., 1982); after this, cycle
regularity declines until 11 to 16 months of age, at which time the mice become
completely acyclic (Felicio et al., 1984).

29
1.4 GLYCEROPHOSPHOLIPIDS
1.4.1 Lipids are diverse, dynamic molecules that are especially important in cell membranes.
The process of demyelination in MS requires significant lipid remodeling, yet few
studies have examined lipid composition in the context of MS. Lipidomics is an emerging
field in systems biology that encompasses the study of all the lipids present in a
biological system (Shevchenko and Simons, 2010) in an attempt to understand both
normal and pathogenic lipid composition and function (Adibhatla et al., 2008). Lipids
themselves are extremely diverse macromolecules. There are many different lipid
families, and these families can be broken down into many different subfamilies. For
example, glycerophospholipids have a glycerol phosphate backbone with a polar head
group attached to the phosphate and two fatty acids attached to the glycerol. Subfamilies
can then be identified based on the type of head group attached to the backbone, and
these subfamilies can be further broken down based on the types of linkages used to
attach the fatty acids to the glycerol (Bou Khalil et al., 2010, Xu et al., 2013). Specific
species can be identified based upon differences in their hydrocarbon chain length and
degree of unsaturation (Klose et al., 2013, Xu et al., 2013). Within just one family, there
are hundreds of possible lipid species; when accounting for all the different lipid families,
there could be as many as 100 000 individual lipid species (Shevchenko and Simons,
2010).
The most abundant type of lipid in the body is the glycerophospholipid (Bennett
et al., 2013). The primary function of glycerophospholipids is the formation of cellular
membranes (Bou Khalil et al., 2010, Klose et al., 2013, Xu et al., 2013). Cellular
membranes are protective semi-permeable barriers between the cell and its environment,

30
or between different spaces within the cell (Bou Khalil et al., 2010, Bennett et al., 2013).
Glycerophospholipids are amphipathic, (Farooqui et al., 2000, Bou Khalil et al., 2010,
Bennett et al., 2013, Klose et al., 2013) making them an ideal candidate for forming these
membranes. The glycerol, with its two attached fatty acid chains at the sn-1 and sn-2
positions, is hydrophobic, while the phosphate head group (attached at the sn-3 position
of the glycerol) is hydrophilic (Bennett et al., 2013). Thus these lipids form a bilayer
(Bennett et al., 2013, Klose et al., 2013) such that the hydrophilic portions are oriented
outwards towards the environment, while the hydrophobic tails are oriented towards each
other, away from the aqueous space (Bou Khalil et al., 2010, Bennett et al., 2013).
This lipid bilayer, however, is not a fixed structure. It is extremely dynamic
(Farooqui et al., 2000, Farooqui et al., 2004, Bou Khalil et al., 2010, Bennett et al., 2013),
and can be remodeled very rapidly in response to environmental cues (Frisardi et al.,
2011, Bennett et al., 2013, Morimoto et al., 2014). For example, if the membrane needs
to be more rigid, enzymatic remodeling can exchange unsaturated fatty acids, whose
double bond composition interferes with their packing and makes the membrane more
fluid, for saturated fatty acid moieties, whose flexible hydrocarbon chains can form a
more tightly packed, rigid membrane (Bou Khalil et al., 2010, Klose et al., 2013).
Another example of dynamic lipid remodeling is synaptic transmission. Synaptic
transmission is made possible by the rapid changes in membrane lipids that allow not
only the release of vesicles, but also the return back to a normal resting state in
preparation for the next action potential. The speed of this process indicates that neural
membranes can be remodeled very quickly and very effectively in response to their
environment (Bennett et al., 2013).

31
1.4.2 Structural glycerophosphocholines in the membrane can be remodeled to produce bioactive metabolites that participate in cell signaling.
The most common type of glycerophospholipid in eukaryotic membranes is
glycerophosphocholine (GPC) (Adibhatla et al., 2008, Bou Khalil et al., 2010). GPCs
have a choline group attached to the phosphate, as well as the usual fatty acid chains
attached to the glycerol (Xu et al., 2013). This GPC structure is highlighted in Figure
1.3A. Found mostly on the outer leaflet of the plasma membrane (Farooqui et al., 2000,
Adibhatla et al., 2008, Adibhatla and Hatcher, 2008, Shevchenko and Simons, 2010),
these GPCs not only contribute to membrane properties such as fluidity, but they can also
be metabolized to produce bioactive metabolites that play roles in cell signaling
(Adibhatla et al., 2008).
The type of metabolite formed depends on the types of linkages in the parent
structural GPC. There are three types of linkages used to attach the fatty acid chain to the
glycerol backbone. The sn-1 fatty acid, usually saturated (Choy et al., 1997, Balsinde and
Balboa, 2005, Jackson et al., 2008, Shindou et al., 2009) can be linked using an acyl
(ester) linkage, an alkyl (ether) linkage, or an alkenyl (vinyl ether) linkage (Xu et al.,
2013). The sn-2 fatty acid, usually unsaturated (Choy et al., 1997, Balsinde and Balboa,
2005, Jackson et al., 2008, Shindou et al., 2009), is canonically attached using an acyl
linkage (Shindou et al., 2009, Xu et al., 2013). A diacyl GPC is the most common type of
structural GPC (Choy et al., 1997, Prescott et al., 2000), while the least common is the
alkylacyl GPC (Prescott et al., 2000).
Each of these structural GPCs can be remodeled to a lyso-GPC metabolite
through the removal of the sn-2 acyl chain, leaving behind a hydroxyl group at the sn-2
position. Removal of the sn-2 chain of a diacyl GPC produces a lysophosphatidylcholine
32
(LPC) (Stanca et al., 2013, Xu et al., 2013). If the sn-2 chain is removed from an
alkylacyl GPC, the resulting metabolite is known as a lyso platelet-activating factor
(LPAF) (Farooqui et al., 2000, Stanca et al., 2013, Xu et al., 2013). Similarly, remodeling
of a vinyl ether acyl GPC (known also as a plasmalogen or a plasmenyl GPC) (Xu et al.,
2013) by removing the sn-2 chain results in a plasmenyl lyso platelet-activating factor
(PLPAF) (Meyer and McHowat, 2007).
These lyso-GPCs can be used in signaling pathways, reacylated with a fatty acid
to reproduce a structural GPC, or further remodeled through addition of an acetyl group
at the sn-2 position. If an acetyl group is added to an LPC, an acyl platelet-activating
factor (APAF) is produced (Karasawa et al., 1999, Baker, 2000, Balestrieri and Lee,
2000, Marathe et al., 2000, Balestrieri et al., 2003). A platelet-activating factor (PAF) is
created through addition of an acetyl group to an LPAF (Farooqui et al., 2000, Stanca et
al., 2013, Xu et al., 2013), while adding an acetyl group to a PLPAF results in a
plasmenyl platelet-activating factor (PPAF) (Karasawa et al., 1999, Meyer and McHowat,
2007). Like their lyso-GPC precursors, these acetylated metabolites can be used in
various signaling pathways.
LPCs, a well-known GPC metabolite family, are involved in many different
signaling pathways throughout the body. Not only do they help maintain homeostatic
Ca2+ levels and cytoskeleton structure, but LPCs also play a role in regulating cell
proliferation, survival and migration (Bou Khalil et al., 2010, Xu et al., 2013). For
example, LPCs can induce expression of growth factors and adhesion molecules in
endothelial cells (Farooqui et al., 2007). Based on behavioural studies involving cerebral

33
injection of LPCs in mice with acute and chronic inflammatory pain, LPCs also appear to
play a role in nociception (Frisardi et al., 2011).
Furthermore, LPCs also have known roles in inflammation. Release of the LPCs
PC(16:0/0:0) and PC(18:0/0:0) from peripheral cells undergoing apoptosis was found to
be a potent chemoattractant for macrophages (Farooqui et al., 2004). Using released
LPCs, macrophages are able to efficiently locate and phagocytose dying cells (Balsinde
et al., 2006). These small signaling molecules also activate other peripheral immune cells,
allowing the cells to cross the BBB (Farooqui et al., 2007). Within the CNS, LPCs have
likewise been found to induce microglial activation; when exposed to LPCs, resting
microglia were converted to active microglia (Farooqui et al., 2007, Frisardi et al., 2011).
LPCs are also known to promote myelin destruction (Farooqui et al., 2007). In fact,
injection of LPCs into rodent brains induces a very potent, rapid demyelination reaction;
this demyelination model is often used in demyelination/remyelination studies, especially
pertaining to MS (Nathoo et al., 2014).
Similar to LPCs, PAFs are also well-known for their diverse signaling roles,
mostly through the binding of PAF to its G-protein coupled receptor, PAF-receptor
(PAFR) (Prescott et al., 2000). One prominent role of the PAF family is contributing to
synaptic plasticity (Farooqui et al., 2000). Heusler and Boehmer (2007) used high
frequency stimulation to test LTP in the somatosensory cortex of rats in the presence of a
PAFR antagonist and agonist. They found that LTP was weaker when the antagonist was
present, and stronger when the agonist was present (Heusler and Boehmer, 2007).
Similarly, hippocampi from PAFR-deficient and wild-type (WT) mice were subjected to
high frequency stimulation and then monitored for LTP; LTP was weaker in the PAFR-

34
deficient mice in comparison to the WT mice (Chen et al., 2001). Application of a non-
hydrolysable PAF analog to hippocampus neurons increased glutamatergic excitatory
responses, but had no effect on GABAergic synaptic transmission (Bazan et al., 1997).
Additionally, injection of PAFs directly into the hippocampus of rats both before and
after training for a memory-related task resulted in better performance on the test day 24
hours after training (Bazan et al., 1997). These studies suggest that PAF, mediated by
PAFR, increases LTP both in the somatosensory cortex and the hippocampus.
PAF is thought to contribute to LTP in the capacity of a retrograde messenger.
Action potential-induced depolarizing currents result in glutamate release from the
presynaptic neuron. The glutamate diffuses across the synaptic cleft and binds to post-
synaptic N-methyl D-aspartate (NMDA) receptors, which elicits an increase in Ca2+ in
the cytosol. This is thought to result in an increase in PAF production. When PAF
reaches high enough concentrations, it diffuses back across the cleft to the presynaptic
membrane, where it binds to PAFR and induces the release of more glutamate from the
presynaptic neuron. More released glutamate further promotes PAF production,
ultimately resulting in a strengthened synapse (Bazan et al., 1997, Mazereeuw et al.,
2013).
In addition to their involvement in synaptic plasticity, PAFs are important
signaling molecules under inflammatory conditions. As implied by the name, PAFs are
involved in platelet activation (Adibhatla and Hatcher, 2008, Mazereeuw et al., 2013, Xu
et al., 2013) and aggregation (Mazereeuw et al., 2013, Xu et al., 2013). They elicit this
platelet aggregation by binding to PAFR, which induces the release of various platelet
activity mediators and pro-inflammatory mediators (Mazereeuw et al., 2013). For

35
example, pro-inflammatory cytokines such as IL-6 and TNF-α can be released by PAF
binding to PAFR on leukocytes (Mazereeuw et al., 2013). Additionally, PAF can activate
lymphocytes and other inflammatory cells (Callea et al., 1999) including monocytes and
macrophages (Adibhatla et al., 2008, Adibhatla and Hatcher, 2008), further contributing
to inflammatory cascades (Callea et al., 1999).
PAFs also play a role in neurodegeneration (Farooqui et al., 2000, Mazereeuw et
al., 2013, Xu et al., 2013), especially when the PAF concentration is elevated in the CNS
or under conditions of cerebral ischemia (Mazereeuw et al., 2013). High concentrations
of PAF can lead to glutamate excitotoxicity in neurons; PAFs can also interact with ROS
and RNS mediators (Mazereeuw et al., 2013). Another method of neurodegeneration is
through caspase-dependent neuronal death (Ryan et al., 2008, Ryan et al., 2009), or
through other pro-apoptotic cell signaling (Ryan et al., 2008). For example, PC(O-
16:0/2:0) (independent of PAFR) and PC(O-18:0/2:0)-PAFR signaled cell death through
caspase activation, while PC(O-18:0/2:0) (independent of PAFR) signaled caspase-
independent cell death (Ryan et al., 2008).
Another group of GPC metabolites that contribute to PAF inflammatory signaling
pathways are the PAF-like metabolites, produced through non-enzymatic oxidation. This
non-enzymatic oxidation occurs most abundantly during times of oxidative stress, where
free radicals, such as ROS, react with structural GPCs (Marathe et al., 2000, Prescott et
al., 2000). These radical reactions often target polyunsaturated fatty acyl residues
(PUFAs) at the sn-2 position (Farooqui et al., 2000, Marathe et al., 2000, Prescott et al.,
2000) to produce ‘PAF-like’ metabolites. PAF-like metabolites have shortened sn-2 acyl-
linked hydrocarbon chains and can be produced from diacyl GPCs, alkylacyl GPCs

36
(Marathe et al., 2000) and plasmenyl GPCs (Khaselev and Murphy, 2000, Marathe et al.,
2000, Zemski Berry and Murphy, 2005). In this thesis, metabolites with 1, 4, 6 or 8
carbons at the sn-2 position belong to this category of metabolites. Within this category,
metabolites with an acyl linkage at the sn-1 position will be referred to as APAF-like
(APAFX), while metabolites with an alkyl linkage at the sn-1 will be referred to as PAF-
like (PAFX). Similarly, metabolites with a vinyl ether linkage at the sn-1 will be called
PPAF-like (PPAFX).
These molecules are classified as ‘PAF-like’ because they are capable of binding
to PAFR, and can thus induce the same signaling pathways as PAFs (Marathe et al.,
2000, Prescott et al., 2000). Interestingly, PAFX is about 800-fold more potent than
APAFX in terms of biological activity, echoing the relationship between PAF and APAF
(Marathe et al., 2000). Unlike PAFs, however, PAF-like metabolite production is not
controlled (Marathe et al., 2000, Prescott et al., 2000); thus PAF signaling pathways may
be inappropriately induced, contributing to pathological increases in inflammation during
times of oxidative stress (Marathe et al., 2000). This is of particular concern in the brain
due to the high oxygen consumption (which can contribute to free radical production,
such as ROS), the high PUFA levels (providing susceptible substrates for the free
radicals), and the comparatively low levels of free-radical-destroying anti-oxidant
molecules (Adibhatla and Hatcher, 2008, Guglielmotto et al., 2009).
PAF signaling, however, can be mediated by the production of other GPC
metabolites. LPAF production is the most direct method for curbing the effects of PAF,
as LPAFs are the biologically inactive form of PAFs (Baker, 2000, Servillo et al., 2006).
Thus the conversion of PAF to LPAF is one way to control PAF signaling. Similarly, the

37
production of APAFs also provides a moderating influence for PAF signaling. APAFs
have been known to compete with PAFs (Balestrieri and Lee, 2000, Balestrieri et al.,
2003), and are approximately 1000-fold less biologically active than PAFs (Marathe et
al., 2000). Interestingly, APAFs are more abundant than PAFs in activated endothelial
cells and neutrophils (Balestrieri and Lee, 2000, Marathe et al., 2000, Balestrieri et al.,
2003). In fact, in endothelial cells pretreated with anti-oxidants and then exposed to
hydrogen peroxide (to stimulate oxidative stress), APAF was preferentially produced
over PAF, suggesting that the less bioactive APAF is the primary GPC metabolite
produced by endothelial cells during inflammation (Balestrieri et al., 2003).
In addition, plasmalogens are thought to be beneficial in terms of protecting
against excessive oxidative damage. Plasmalogens are believed to play an anti-oxidant
role in cells (Farooqui et al., 2000, Khaselev and Murphy, 2000). The vinyl ether at the
sn-1 position (Xu et al., 2013) and the PUFA at the sn-2 (Farooqui et al., 2000, Zemski
Berry and Murphy, 2005), most commonly arachidonic acid (Khaselev and Murphy,
2000) or docosahexaenoic acid (Zemski Berry and Murphy, 2005), are thought to make
plasmalogens an excellent target for free radicals (Farooqui et al., 2000, Khaselev and
Murphy, 2000, Marathe et al., 2000, Zemski Berry and Murphy, 2005). The free radicals
can thus react with the plasmalogen, forming a more stable radical metabolite that is less
likely to propagate the free radical damage (Khaselev and Murphy, 2000), and is thus
protective for the cell (Farooqui and Horrocks, 2001).
In addition to an anti-oxidant role, plasmalogens can also be hydrolyzed to
PLPAFs. An increase in PLPAFs may result in a change in membrane properties, such as
increased fluidity and increased permeability to Ca2+. This increase in Ca2+ can
38
potentially lead to the production of other GPC metabolites by activating enzymes
responsible for their production (Farooqui and Horrocks, 2001). A pathological increase
in plasmalogen hydrolysis to PLPAF, however, may alter membrane fluidity and
permeability to such a degree that the membrane becomes unstable, which may
contribute to neurodegeneration (Farooqui and Horrocks, 2001). PLPAF accumulation
may also be associated with inflammation, as studies using human platelets (Beckett et
al., 2007) and human endothelial cells (Creer and McHowat, 1998) found increases in
PLPAF upon activation with thrombin. Interestingly, plasmalogens are enriched in the
brain (Farooqui et al., 2000, Farooqui and Horrocks, 2001, Zemski Berry and Murphy,
2005), and especially in myelin (Farooqui et al., 2000, Farooqui and Horrocks, 2001);
thus inappropriate plasmalogen metabolism may play a role in neuroinflammatory and
neurodegenerative diseases.
1.4.3 The Land’s cycle is responsible for controlling production of GPC metabolites.
An enzymatic process known as Land’s cycle accomplishes GPC remodeling to
generate these potent metabolites. The Land’s cycle is completely reversible; the
direction of the cycle, towards either signaling metabolites or structural GPCs (Xu et al.,
2013), depends on environmental cues (Frisardi et al., 2011). This cycle is also very
important for maintaining both GPC homeostasis (Farooqui et al., 2000, Farooqui et al.,
2004, Adibhatla et al., 2008) and the proper balance of lipid species in the membrane and
in the cell (Adibhatla et al., 2008). Too much GPC hydrolysis could lead to an overall
loss in membrane lipids; even a 10% loss is enough to negatively impact the cell’s
viability (Farooqui et al., 2004, Adibhatla et al., 2008). Too many free fatty acids can also
further destabilize the neural membrane, potentially leading to cell death (Farooqui et al.,

39
2004). Thus the Land’s cycle helps to maintain this delicate balancing act between
hydrolysis and synthesis required for proper cell functioning (Farooqui et al., 2004,
Adibhatla et al., 2008).
Phospholipase A2 (or PLA2) enzymes are responsible for hydrolyzing bonds,
while lysophosphatidlycholine acyltransferases (LPCATs) are responsible for bond
formations (Kalyvas et al., 2009, Bou Khalil et al., 2010, Xu et al., 2013). PLA2s form
lyso-GPCs through hydrolysis of the sn-2 hydrocarbon chain of structural GPCs (Choy et
al., 1997, Creer and McHowat, 1998, Harayama et al., 2008, Farooqui, 2009, Shindou et
al., 2013, Stanca et al., 2013, Xu et al., 2013). These lyso-GPCs can be processed back to
membrane lipids by addition of a fatty acid at the sn-2 position using LPCAT
acyltransferase activity (Harayama et al., 2008, Shindou et al., 2013, Stanca et al., 2013,
Xu et al., 2013); or they can be further processed to sn-2 acetylated signaling molecules
using LPCAT acetyltransferase activity (Meyer and McHowat, 2007, Harayama et al.,
2008, Shindou et al., 2013, Stanca et al., 2013, Xu et al., 2013). Acetylated metabolites
can be converted back to lyso-GPCs using lipoprotein-associated PLA2, which is also
known as PAF-acetyl hydrolase (PAF-AH) (Prescott et al., 2000, Servillo et al., 2006,
Adibhatla and Hatcher, 2008, Stafforini, 2009, Mazereeuw et al., 2013, Xu et al., 2013).
This process of remodeling is illustrated in Figure 1.3B.

40
Figure 1.3 The GPC remodeling pathway (Land’s cycle) and non-enzymatic oxidation. A. GPCs are composed of a glycerol backbone (blue) with a phosphocholine head group
(green) attached at the sn-3 position. Hydrocarbon chains (black) of varying lengths and linkages are attached at the sn-1 and sn-2 positions of the glycerol. Here, an alkyl (ether) linkage is depicted at the sn-1 position and an acyl (ester) linkage is depicted at the sn-2 position.
B. The Land’s cycle is a reversible cycle that controls GPC metabolism. Structural GPCs can be converted to signaling metabolites using the enzyme PLA2, which hydrolyzes the hydrocarbon chain at the sn-2 position and produces lyso-GPC metabolites. Sn-2 hydrolysis of diacyl GPCs yields LPCs, hydrolysis of alkylacyl GPCs yields LPAFs, and hydrolysis of vinyl ether acyl GPCs yields PLPAFs. These lyso-GPC metabolites can be reacylated back to structural GPCs using the acyltransferase activity of LPCAT. Lyso-GPCs can also be further remodeled to sn-2 acetylated metabolites using the acetyltransferase activity of LPCAT. Acetylation of LPCs results in APAFs, acetylation of LPAFs results in PAFs, and acetylation of PLPAFs results in PPAFs. The reverse reaction of converting sn-2 acetylated metabolites back to lyso-GPCs is accomplished using PAF-AH.
A subset of PAF-like lipids can also be produced through non-enzymatic oxidation of structural GPCs (shown in red). Through this process, diacyl GPCs yield APAFX metabolites, alkylacyl GPCs yield PAFX metabolites, and vinyl ether acyl GPCs yields PPAFX metabolite. These PAF-like metabolites can be hydrolyzed back to their respective lyso-GPCs using PAF-AH. In these PAF-like metabolites, the hydrocarbon chain at the sn-2 position (depicted as R’) may be 1, 4, 6, or 8 carbons long.
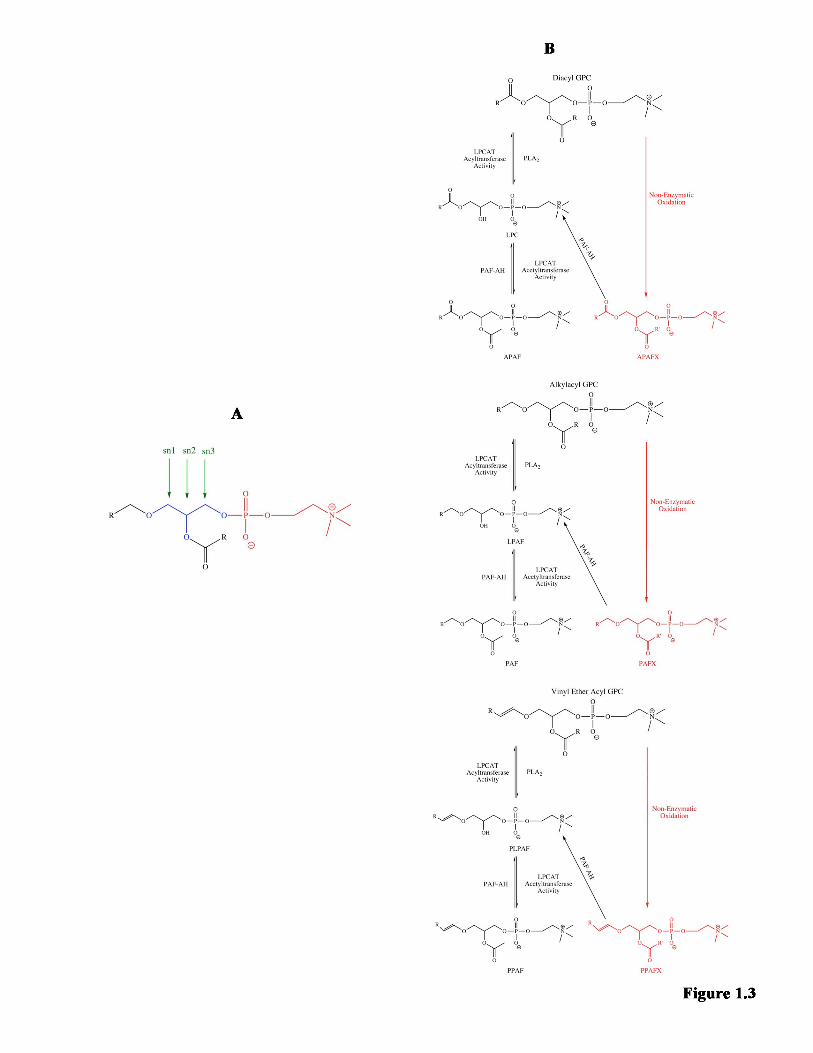
Bennett
Typewritten Text
41

42
There are several different isoforms of PLA2 found throughout the body. These
include calcium-independent PLA2 (iPLA2), calcium-dependent PLA2 (cPLA2) and
secreted PLA2 (sPLA2); each of these isoforms also has several sub-isoforms. iPLA2 and
cPLA2 are found within the cytosol, while sPLA2 is found extracellularly (Kalyvas et al.,
2009, Ong et al., 2010, Xu et al., 2013). Though the NFκB pathway mediates expression
of all the isoforms (Farooqui et al., 2007), each PLA2 is thought to have its own unique
function and to regulate slightly different pools of substrates (Ong et al., 2010). In
general however, they do follow a similar route of activation. Agonists such as cytokines,
neurotransmitters, growth factors or hormones bind to receptors that are linked to the
activity of a PLA2 enzyme (Farooqui et al., 2000, Farooqui et al., 2004). This then
triggers a series of events that results in activation of the PLA2 (Farooqui et al., 2000),
and/or in relocation of the enzyme to the membrane (Farooqui et al., 2000, Farooqui et
al., 2004, Farooqui, 2009). From there, PLA2 hydrolyzes membrane lipids to release
bioactive metabolites, which are responsible for activities such as mediating receptor
crosstalk (Ong et al., 2010), or promoting expression of specific genes of interest
(Farooqui, 2009, Frisardi et al., 2011).
Under normal physiological conditions, the most commonly used PLA2 is iPLA2
(Ong et al., 2010), which does not require Ca2+ for activation (Kalyvas et al., 2009, Ong
et al., 2010, Xu et al., 2013). iPLA2 is heavily expressed in most regions of the brain
under normal conditions, including the cerebral cortex and the hippocampus (Ong et al.,
2010). It is considered to be the primary remodeling PLA2 (Adibhatla et al., 2008),
contributing to functions such as neurite outgrowth, learning and memory, and signal
transduction (Ong et al., 2010).
Bennett
Typewritten Text
43
In contrast to iPLA2, cPLA2 is activated when there is an increase in Ca2+ in the
cell (Kalyvas et al., 2009, Ong et al., 2010, Xu et al., 2013). Though the Ca2+ does not
play a catalytic role, the ion is required for cPLA2 translocation to the membrane
(Farooqui et al., 2000, Farooqui et al., 2004) and interaction with structural GPCs (Ong et
al., 2010). cPLA2 is not as common as iPLA2 in the brain, but under physiological
conditions, it is weakly expressed in cerebral neocortex, hippocampus, striatum and most
parts of the forebrain (Ong et al., 2010). It is particularly responsible for producing low
baseline levels of lipid metabolites required for neural cell survival (Farooqui et al., 2004,
Ong et al., 2010).
sPLA2 is another type of PLA2 requiring Ca2+ for activation. In contrast to
cPLA2, however, it is capable of functioning both within the cell and in the extracellular
space (Ong et al., 2010). It is synthesized intracellularly and secreted outside the cell
(Ong et al., 2010), hydrolyzing GPCs on the outer leaflet of the plasma membrane. The
metabolites released by sPLA2 may act as signaling molecules, or they may be
reincorporated on the outer leaflet (Xu et al., 2013). The highest sPLA2 activity is found
in the medulla oblongata, pons and hippocampus; it is moderately active in the thalamus,
hypothalamus and cerebral cortex (Ong et al., 2010). sPLA2 is thought to play a role in
proper synaptic functioning (Ong et al., 2010).
Under normal physiological conditions, the activity of these enzymes is regulated
such that there is more reacylation than deacylation and thus no net increase in lipid
metabolites (Ong et al., 2010). Under conditions such as neuroinflammation or
neurodegeneration however, there is a pathological increase in PLA2 activity (Farooqui
et al., 2004, Bou Khalil et al., 2010, Ong et al., 2010), which is believed to be triggered at

44
least in part by cytokines such as TNF-α (Farooqui et al., 2004, Farooqui et al., 2007,
Adibhatla and Hatcher, 2008) and IL-1β (Farooqui et al., 2007). This ultimately leads to
abnormally high degradation of GPCs (Adibhatla et al., 2008, Ong et al., 2010). Not only
does enhanced GPC degradation increase the production of pro-inflammatory mediators
(Bou Khalil et al., 2010), but it also modifies membrane fluidity and permeability (Ong et
al., 2010). More hydrolysis of structural GPCs results in a less close-knit lipid membrane
(Farooqui et al., 2004), which allows more Ca2+ to traverse the membrane and enter the
cell (Farooqui et al., 2004, Ong et al., 2010). If the concentration of Ca2+ increases
enough, sPLA2 will become activated and further contribute to GPC metabolite
generation and membrane damage (Ong et al., 2010).
PAF-AH is a lipoprotein-associated PLA2 that can be found both intracellularly
(Prescott et al., 2000) and in the circulation (plasma PAF-AH) (Prescott et al., 2000,
Stafforini, 2009, Mazereeuw et al., 2013). Plasma PAF-AH is released into the
bloodstream by endothelial and haematopoeitic cells (Mazereeuw et al., 2013), as well as
immune cells such as monocytes, macrophages (Stafforini, 2009), T-cells and mast cells
(Adibhatla et al., 2008, Adibhatla and Hatcher, 2008). This calcium-independent PAF-
AH is constitutively active upon its release into the circulation, though its activity can be
modified as required (Stafforini, 2009). Although PAF-AH is best known for its
hydrolysis of PAF, the enzyme is able to hydrolyze GPCs with sn-2 chains up to nine
carbons long (Stafforini, 2009), depending on the PAF-AH isoform (Prescott et al.,
2000).
Similar to other PLA2 enzymes, pro-inflammatory environments also increase
PAF-AH activity (Stafforini, 2009). Increased PAF-AH activity, however, results in more

45
hydrolysis of sn-2 acetylated metabolites (Prescott et al., 2000, Servillo et al., 2006,
Farooqui et al., 2007, Adibhatla et al., 2008, Adibhatla and Hatcher, 2008) and PAF-like
metabolites (produced by non-enzymatic oxidation) (Marathe et al., 2000, Prescott et al.,
2000, Servillo et al., 2006, Adibhatla and Hatcher, 2008, Stafforini, 2009); thus PAF-AH
is thought to contribute to anti-inflammatory rather than pro-inflammatory activities
(Farooqui et al., 2007, Adibhatla et al., 2008, Adibhatla and Hatcher, 2008). For example,
increasing PC(O-16:0/2:0) hydrolysis by PAF-AH in human hNT cultures was
neuroprotective, as it prevented neuronal death (Ryan et al., 2009).
Interestingly, some isoforms of PAF-AH also possesses transacetylase activity
(Servillo et al., 2006, Xu et al., 2013). The transacetylase portion of the enzyme can be
specifically activated by ATP (Balestrieri and Lee, 2000), and upon activation, the
enzyme is translocated from the cytosol to the membrane (Balestrieri and Lee, 2000,
Servillo et al., 2006). There, it can remove an acetyl group from one acetylated
metabolite and transfer it to another lyso-GPC (Choy et al., 1997, Karasawa et al., 1999,
Servillo et al., 2006). For example, the transacetylase can remove the acetyl group from
PAF and transfer it to an LPC, generating LPAF and APAF (Balestrieri et al., 2003). This
reaction has been found in activated endothelial cells in response to anti-oxidants and
hydrogen peroxide (an inflammatory stimuli), likely as a method to decrease PAF levels
during inflammation (Balestrieri et al., 2003). Thus this transacetylase activity provides
another means for mediating PAF signaling (Baker, 2000).
With such a wide variety of PLA2 enzymes, it is no surprise that there are several
different types of LPCAT enzymes as well. LPCAT1 and LPCAT2 belong to the AGPAT
(1-acylglycerol-3-phosphate O-acyltransferase) family (Shindou et al., 2009) and possess

46
two types of enzymatic activity (Shindou et al., 2009, Shindou et al., 2013, Morimoto et
al., 2014). These enzymes use their acyltransferase activity to catalyze the reacylation of
lyso-GPCs back to structural GPCs (Shindou et al., 2009, Shindou et al., 2013), and their
acetyltransferase activity to convert lyso-GPCs to sn-2 acetylated metabolites (Choy et
al., 1997, Meyer and McHowat, 2007, Shindou et al., 2009, Shindou et al., 2013). Both
enzymes are found in the cell’s endoplasmic reticulum (Shindou et al., 2007, Shindou et
al., 2013, Morimoto et al., 2014) and on the surface of lipid droplets (Shindou et al.,
2013). LPCAT1 however, is enriched in the lungs, specifically in the alveolar type II
cells. Its main function appears to be the production of pulmonary surfactant, which is
important for respiration (Shindou et al., 2009, Shindou et al., 2013). LPCAT1 is
calcium-independent (Harayama et al., 2008, Shindou et al., 2009) and is constitutively
active (Harayama et al., 2008, Shindou et al., 2009, Shindou et al., 2013), thus
contributing to homeostatic metabolite production (Harayama et al., 2008).
In contrast to LPCAT1, LPCAT2 activity is induced in times of inflammation by
extracellular stimuli such as lipopolysaccharide (LPS) (Shindou et al., 2009, Shindou et
al., 2013, Morimoto et al., 2014). In fact, the acetyltransferase activity of LPCAT2 has
been shown to produce PAF within 30 seconds of LPS stimulation, which may be
extremely significant in early inflammatory events (Morimoto et al., 2014). This does not
affect the acyltransferase activity (Shindou et al., 2007), nor does it affect LPCAT1
activity (Morimoto et al., 2014). Further contributing to its pro-inflammatory profile,
LPCAT2 is localized primarily to cells involved in inflammation, such as macrophages
(Shindou et al., 2007, Shindou et al., 2009). Thus periods of acute inflammation lead to
activation of the acetyltransferase activity of LPCAT2, and an increase in PAF

47
production (Shindou et al., 2007). Under resting conditions, this calcium-dependent
enzyme prefers acyl-CoA substrates for its acyltransferase activity (Shindou et al., 2007).
Exposure to pathogenic concentrations of amyloid-beta42 , however, can alter LPCAT
substrate preference toward acetyl-CoA, preferentially generating PAF (Ryan et al.,
2009). Interestingly, it is possible to selectively target LPCAT2 activity without
negatively impacting LPCAT1 function (Tarui et al., 2014).
LPCAT3 and LPCAT4 belong to the MBOAT (membrane bound O-
acyltransferase) family (Shindou et al., 2009). Neither LPCAT3 (Kazachkov et al., 2008,
Shindou et al., 2009, Shindou et al., 2013) nor LPCAT4 contribute to sn-2 acetylated
GPC metabolite biosynthesis, as they possess only acyltransferase activity (Shindou et
al., 2009, Shindou et al., 2013). LPCAT3 was found to be expressed throughout the body,
with no particular specialized location (Kazachkov et al., 2008, Shindou et al., 2009,
Shindou et al., 2013), whereas LPCAT4 is localized to the brain, epididymis, testis and
ovaries (Shindou et al., 2009, Shindou et al., 2013). Interestingly, LPCAT3 is thought to
have anti-inflammatory properties, as knockdown of LPCAT3 results in M1 pro-
inflammatory macrophage morphology (Taniguchi et al., 2015).
1.4.4 GPC metabolism may play a role in MS and EAE pathology.
Unsurprisingly, there are several studies that report involvement of the Land’s
cycle in MS and in EAE. A study by Callea et al. (1999) found that compared to healthy
controls, there were elevated PAF levels in the plasma and CSF of MS patients. Within
MS patient subsets, PAF levels in RRMS patients were higher than in SPMS patients.
The study specifically documents the presence of PC(O-16:0/2:0) and PC(O-18:0/2:0) in
MS patients, where PC(O-16:0/2:0) was more abundant in plasma, and PC(O-18:0/2:0)

48
was more abundant in CSF (Callea et al., 1999). Similarly, several LPC species,
including PC(18:1/0:0) and PC(18:0/0:0), were increased in the CSF of MS patients
relative to subjects with other neurological diseases (Pieragostino et al., 2015).
Studies using PAFR knockout mice induced with EAE documented less severe
EAE in the knockouts compared to the wild-type mice (Kihara et al., 2005, Rodrigues et
al., 2011). Relative to WT controls, PAFR knockout-EAE mice experienced less
inflammation and demyelination in the spinal cord (Kihara et al., 2005); decreased pro-
inflammatory cytokine mRNA (Kihara et al., 2005) and protein (Rodrigues et al., 2011)
expression; fewer CD4+ T-cells; a decreased number of cells producing IL-17 (Rodrigues
et al., 2011); and fewer phagocytic macrophages (Kihara et al., 2005). These PAFR
studies suggest that PAF signaling through PAFR plays an important role in EAE
development.
There are also numerous studies documenting an instrumental role of PLA2
enzymes in EAE disease course. cPLA2 knockout mice were found to be resistant to
EAE induction, displaying very few lesions in the CNS, if any (Marusic et al., 2005).
Similarly, treatment of EAE mice with cPLA2 inhibitors resulted in delayed disease onset
(Kalyvas and David, 2004), decreased pro-inflammatory cytokine production (Marusic et
al., 2008, Kalyvas et al., 2009, Thakker et al., 2011), less neuroinflammation (Kalyvas
and David, 2004), and fewer relapses (Thakker et al., 2011). Administration of cPLA2
inhibitors at any point during the disease — from the day of induction (Kalyvas and
David, 2004, Marusic et al., 2008), after disease onset (Marusic et al., 2008), at the peak
of disease (Kalyvas and David, 2004, Thakker et al., 2011), or during remission (Thakker
et al., 2011) — was found to be beneficial. iPLA2 inhibitors were also found to be

49
effective at decreasing the severity of EAE, whether administered before or after the
onset of symptoms (Kalyvas et al., 2009). Finally, administration of sPLA2 inhibitors to
rats induced with EAE resulted in a decrease in sPLA2 activity as measured in the urine,
a 60% decrease in activated microglia and macrophages in the spinal cord, and fewer rats
succumbing to EAE (Cunningham et al., 2006). Interestingly, analysis of urine samples
from MS patients also revealed an increased sPLA2 activity in MS patients relative to
controls (Cunningham et al., 2006).
A study by Kihara et al. (2008) examined the entire PLA2-LPCAT-PAF axis and
found that increased PAF biosynthesis in EAE was not balanced by increased
degradation. Mice with EAE were found to have elevated PAF levels in the spinal cord in
the acute phase of the disease, which correlated with the clinical EAE score of the
animal. This PAF increase could be explained by the increase in mRNA for cPLA2,
sPLA2 and LPCAT2 in the acute phase of the disease. There was also an increased
protein level of LPCAT2 in microglia, and the acetyltransferase activity of LPCAT2
positively correlated with not only the clinical EAE score of the animal, but also the
PLA2 activity. Finally, the researchers also found that there was no change in PAF-AH
activity across the disease course, thus indicating no change in PAF catabolism (Kihara et
al., 2008). Together, these results suggest that in MS/EAE, there is a shift in GPC
metabolism that promotes increased production of GPC metabolites (Ong et al., 2010).
There are, however, a few studies that question this conclusion. In a serum
biomarker study by Dickens et al. (2014), phosphocholine levels were found to be
decreased in MS patients relative to healthy controls. These phosphocholine levels were
also decreased in SPMS patients relative to RRMS, suggesting the possibility of differing
50
GPC metabolism between not only MS patients and healthy individuals, but also between
different types of MS. Similarly, Del Boccio et al. (2011) also found several decreased
LPC species in the serum of MS patients relative to both healthy controls and patients
with other neurological diseases. These species included PC(16:0/0:0), PC(18:0/0:0) and
PC(18:1/0:0). Furthermore, there was also a decreased LPC:GPC ratio in the serum of
these MS patients relative to the two control groups.
The results from these biomarker studies using serum from Dickens et al. (2014)
and Del Boccio et al. (2011) conflict with the studies showing increased PAFs in the CSF
and plasma (Callea et al., 1999) and increased LPCs in the CSF (Pieragostino et al.,
2015) in MS patients. This then prompts the question of what is truly happening in the
brains of MS patients in terms of GPC metabolism. This question is best addressed using
a mouse model of MS to examine these GPC metabolites in the brain directly.
1.5 OBJECTIVE AND HYPOTHESIS
The overarching goal of this thesis was to determine whether GPC metabolite
concentrations are affected by EAE in the hippocampus and temporal-parietal-entorhinal
(TPE) cortex of female mice. The use of a female EAE model, however, necessitated that
the female hormonal cycle be taken into account. Thus in addition to examining the
metabolite species in the EAE model, these metabolite levels were also evaluated across
the estrous cycle, with the goal of identifying any GPC metabolites affected by cyclical
changes in circulating female sex steroids. After accounting for possible hormonal
control, I hypothesized that there would be an increase in GPC metabolites in mice
induced with EAE relative to healthy uninjured controls, based on plasma and CSF

51
studies from MS patients and overwhelming evidence of PLA2 activity increases in
response to inflammation. To test this hypothesis, two aims were devised:
1. To quantify GPC metabolite lipidomes at EAE onset, peak and remission in the
hippocampus and TPE cortex of female C57BL/6 mice, and compare to healthy,
uninjured controls.
2. To determine whether GPC metabolites present in the hippocampus and TPE
cortex in healthy N5 C57BL/6J x C3h/HeJ female mice are under hormonal control.
The results from Aim 1 describing how EAE affects the GPC metabolites across
the disease in the hippocampus and TPE cortex are found in Chapter Two. The Aim 2
results documenting GPC metabolite lipidome changes across the estrous cycle in these
same brain regions are found in Chapter Three.
52
CHAPTER TWO
THE IMPACT OF EXPERIMENTAL AUTOIMMUNE ENCEPHALOMYELITIS ON THE GLYCEROPHOSPHOCHOLINE
METABOLITE LIPID PROFILE IN FEMALE C57BL/6 MICE
2.1 OBJECTIVE
The objective of this study was to determine whether GPC metabolites in the
hippocampus and TPE cortex of female C57BL/6J mice change across the onset, peak
and remission of EAE when compared to uninjured controls.
2.2 STATEMENT OF AUTHOR CONTRIBUTIONS The members of Dr. Samuel David’s lab at McGill University were responsible
for the EAE protocol, including EAE induction, clinical scoring, perfusions and
dissections. The dissections and perfusions, however, were performed under the guidance
of Dr. Alexandre P Blanchard of Dr. Steffany Bennett’s lab to ensure inter-laboratory
consistency. Controls animals were provided by Dr. Steffany Bennett’s lab; for these
animals, Samantha Sherman was responsible for the perfusions and removal of the brain,
while Dr. Yun Wang performed the tissue dissection. Mass spectrometry guidance,
including training and troubleshooting, was provided as required to Samantha Sherman
by Matthew Granger and Dr. Hongbin Xu. Matthew Granger and Dr. Steffany Bennett
developed the pmol equivalents-normalization method used in this study, and Dr.
Steffany Bennett determined the identities of all the lipid species. All lipid extractions,
mass spectrometry operations, lipid quantification and data analyses were performed by
Samantha Sherman.

53
2.3 INTRODUCTION
MS is a female-biased inflammatory neurodegenerative disease that affects over 2
million worldwide (Constantinescu, 2011, Rahn et al., 2014) and is often diagnosed
between the ages of 20 and 40 (Kuerten and Angelov, 2008, Constantinescu, 2011, Rahn
et al., 2014, Ksiazek-Winiarek et al., 2015). This T-cell mediated autoimmune disease
specifically targets myelin in the CNS (Compston and Coles, 2002, Ransohoff and
Brown, 2012, Rangachari, 2013) and is characterized by demyelination and axonal loss
(Compston and Coles, 2002, Constantinescu, 2011, Ellwardt and Zipp, 2014). The
majority of patients present with RRMS, where symptomatic periods are separated by
distinct remissions (Constantinescu, 2011, Ellwardt and Zipp, 2014); patients diagnosed
with progressive MS, however, do not experience periods of remission but a steady
neurological decline (Constantinescu, 2011). Although progressive MS can be present
from the onset of the disease (known as PPMS) (Constantinescu, 2011, Rangachari, 2013,
Ellwardt and Zipp, 2014), approximately half of the RRMS patients also eventually
transition to a progressive disease course, known as SPMS (Rangachari, 2013) .
Despite the common perception that MS is primarily a motor disease, 40-65% of
MS patients experience cognitive deficits (Amato et al., 2006). There are several reports
of damage in the hippocampus (Papadopoulos et al., 2009, Calabrese et al., 2015, Sacco
et al., 2015) and the cortex (Portaccio et al., 2006, Calabrese et al., 2015, Ruggieri et al.,
2015) of MS patients. In experimental models, memory impairments have been detected
in EAE mice before the onset of motoric paralysis (Acharjee et al., 2013, Dutra et al.,
2013) as well as later in symptomatic progression (Ziehn et al., 2010, Novkovic et al.,
2015). Hippocampal damage was also reported early in EAE (Ziehn et al., 2010).

54
It is possible, however, that development of cognitive deficits in MS and indeed
other aspects of MS progression may be represented by changes in the neurolipidome.
GPC metabolites have been particularly implicated. Structural GPCs, which consist of a
glycerol backbone with a fatty acid chain attached at both the sn-1 and sn-2 position and
a phosphocholine head group at the sn-2 position (Xu et al., 2013), can be remodeled to
produce lyso-GPCs. Hydrolysis of the sn-2 fatty acid chain of diacyl GPC produces LPCs
(Stanca et al., 2013, Xu et al., 2013); sn-2 hydrolysis of an alkylacyl GPC produces
LPAFs (Farooqui et al., 2000, Stanca et al., 2013, Xu et al., 2013); and hydrolysis of a
vinyl ether acyl GPC (known as a plasmalogen or plasmenyl GPC (Xu et al., 2013))
produces PLPAFs (Meyer and McHowat, 2007). These lyso-GPCs can be further
processed to acetylated metabolites through addition of an acetyl group to the sn-2
position. Thus LPCs can be converted to APAFs (Karasawa et al., 1999, Baker, 2000,
Balestrieri and Lee, 2000, Marathe et al., 2000, Balestrieri et al., 2003), LPAFs to PAFs
(Farooqui et al., 2000, Stanca et al., 2013, Xu et al., 2013), and PLPAFs to PPAFs
(Karasawa et al., 1999, Meyer and McHowat, 2007).
Interestingly, several LPC and PAF species have been implicated in biomarker
studies of MS. Callea et al. (1999) found an increase in PC(O-16:0/2:0) and PC(O-
18:0/2:0) in both the plasma and the CSF of RRMS patients, where PC(O-16:0/2:0) was
more abundant in the plasma and PC(O-18:0/2:0) was more abundant in the CSF.
Pieragostino et al. (2015) also found an increase in several LPC species in the CSF of MS
patients, including PC(18:0/0:0) and PC(18:1/0:0). In contrast to these studies, two
studies examining biomarkers in serum found decreases in phosphocholine (Dickens et

55
al., 2014), PC(16:0/0:0), PC(18:0/0:0) and PC(18:1/0:0) (Del Boccio et al., 2011) in MS
patients relative to control groups.
To my knowledge, no study has investigated GPC metabolism in the brain in an
experimental MS model. To address this question, I profiled the GPC metabolite
lipidome in the hippocampus and TPE cortex of female mice induced with EAE,
specifically at symptomatic onset, peak, and remission; these lipidomes were then
compared to healthy controls. The data indicates that the vast majority of metabolites
were not significantly affected by EAE in the TPE cortex, while levels of three
hippocampal metabolite families were significantly reduced over the symptomatic
progression of EAE. Regional differences in critical metabolite changes were also
detected; five specific species in the hippocampus and five different species in the TPE
cortex were significantly decreased during EAE. Taken together, these data provide
evidence of an intriguing regional specificity with regards to metabolic dysregulation of
GPC metabolism in memory-related brain regions over the course of EAE.
2.4 MATERIALS & METHODS
2.4.1 Animals Our collaborator, Dr. Samuel David at McGill University, provided the EAE
tissue used in this study. Six-week-old female C57BL/6J mice were purchased from
Jackson and allowed two weeks for acclimatization before beginning experiments. The
mice were group-housed during the acclimatization period and single-housed for the
duration of the experiments. When the mice were eight weeks old, they were induced
with EAE (day 0) through injection of 50 µg of myelin oligodendrocyte glycoprotein35-55
(MOG) (MEVGWYRSPFSRVVH- LYRNGK; Sheldon Biotechnology Centre, Montreal,

56
Quebec) emulsified in Complete Freund’s Adjuvant (CFA), containing 0.5-1.0 mg/mL of
Mycobacterium tuberculosis (Fisher Scientific Canada). On the same day, a second
injection containing 200 ng of Pertussis toxin (PTX) (Sigma-Aldrich, Oakville, Ontario)
was given. On day 2, the mice were again injected with PTX. Mice were scored daily on
their degree of paralysis using the following clinical grading scale from Berard et al.
(2010): grade 0, normal; grade one, tail paralysis; grade two, mild hindlimb weakness
(fast righting reflex); grade 3, severe hindlimb weakness (slow righting reflex); grade 4,
hindlimb paralysis; grade 5, hindlimb paralysis and partial forelimb weakness (Berard,
2010). The procedures were approved by the McGill University Animal Care Committee
and followed guidelines of the Canadian Council on Animal Care.
2.4.2 Tissue Collection
Three mice were sacrificed at EAE onset (grade 1, corresponding to days 6-8),
four at peak (grade 4, corresponding to days 10-14), and five at remission (decreased
paralysis, corresponding to days 21-26), while three completely uninjured controls were
sacrificed at ten weeks of age. Mice were anaesthetized with 0.05 mL ketamine: xylazine:
acepromazine (50:5:1 mg/kg) or 0.15 mL euthanyl (Bimeda-MTC Animal Health Ins, 65
mg/mL 1EUS001), and perfused intracardially using 20-40 mL of phosphate buffered
saline. The hippocampus and the TPE cortex were dissected from the brain, weighed to
obtain the tissue wet weight, snap frozen in liquid nitrogen, and stored at -80°C until time
of extraction.
2.4.3 GPC-Enriched Lipid Extractions
Lipids were extracted from the hippocampus and the TPE cortex using an
acidified Bligh and Dyer method, which has been optimized for GPC extraction (Xu et

57
al., 2013). Homogenized tissue, along with four exogenous standards PC(13:0/0:0) (187.5
ng Avanti Polar Lipids, 855476, Alabaster, Alabama), PC(12:0/13:0) (500 ng Avanti
Polar Lipids, LM-1300), PS(12:0/13:0) (200 ng Avanti Polar Lipids, LM-1100), and PE
(12:0/13:0) (500 ng Avanti Polar Lipids, LM-1000), was extracted using 4.0 mL acidified
methanol (2% glacial acetic acid (Fisher Scientific Company, 351271-212, Ottawa,
Ontario) in methanol (Fisher Scientific Company, A412P-4)), 3.2 mL 0.1M sodium
acetate (BioShop, SAA304, Burlington, Ontario) and 3.8 mL chloroform (Fisher
Chemical, C298-4, Fair Lawn, New Jersey). The organic phase (containing lipids and
chloroform) was collected and dried under nitrogen gas. The drying step eliminated the
chloroform, leaving only the lipid extract. This extract was resuspended in 300 uL of
100% ethanol and stored in the -80°C freezer until time of mass spectrometry (MSp)
quantification.
2.4.4 GPC Metabolite Quantification
The GPC metabolites were quantified using liquid-chromatography electrospray
ionization mass spectrometry (LC-ESI-MSp). In our lab, we accomplished this by
coupling an Agilent 1100 high performance liquid chromatography (HPLC) column
(Agilent Technologies, Santa Clara, California) to a QTRAP5500 MSp (AB Sciex,
Concord, Ontario). Each MSp run required 5 µL of lipid sample pipetted into a well with
16 µL of aqueous solvent (MSp grade water (J.T. Baker, Avantor, 9831-03 Center
Valley, Pennsylvania) + 0.1% formic acid (Sigma-Aldrich, 56302, St Louis, Missouri) +
10 mM ammonium acetate (EMD Millipore, 2145-OP, Etobicoke, Ontario)), and 2.5 µL
of deuterated MSp standards (d4 PC(O-16:0/0:0) (2.5 ng Cayman Chemical Company,
lyso-PAF C-16-d4, 360906, Ann Arbor, Michigan), d4 PC(O-16:0/2:0) (1.25ng Cayman

58
Chemical Company, PAF C-16-d4, 360900), d4 PC(O-18:0/0:0) (2.5ng Cayman
Chemical Company, lyso-PAF C-18-d4, 10010228), and d4 PC(O-18:0/2:0) (1.25 ng
Cayman Chemical Company, PAF-C18-d4, 10010229)). The autosampler loaded the
sample onto the HPLC column, and the sample was eluted using increasing
concentrations of organic solvent (5:2 acetonitrile (J.T. Baker, Avantor, 9839-03):
isopropanol (Fisher Scientific, A416-4) + 0.1% formic acid (Sigma-Aldrich, 56302) + 10
mM ammonium acetate (EMD Millipore, 2145-OP)). As the sample was eluted, it was
injected into the MSp and ionized using electrospray ionization. The ionized sample was
then sent through three quadropoles: the first selected for the specific mass-to-charge
(m/z) being quantified; the second fragmented the phosphocholine head group from the
glycerol backbone; and the third detected the m/z of the phosphocholine head group (184
m/z). The end readouts were mass spectra indicating the abundance of GPCs at each m/z.
We specifically used multiple reaction monitoring (MRM) scans, which means that the
MSp was programmed to scan for a predetermined set of m/z ratios between 450-650
m/z, which is the m/z range for GPC metabolites.
Lipid abundance was then determined from the mass spectra using MultiQuant
(MQ) (3.0.2, AB Sciex). MQ allows the user to select specific peaks for each m/z and
obtain information regarding such parameters as peak area, retention time and signal-to-
noise ratio. Each peak for each m/z of interest in each sample had to be manually selected
in order to obtain the aforementioned parameters. After finishing the collection of raw
data from MQ, the datasets from this study were run through a program known as
RTStaR (Blanchard, 2015). RTStaR, developed in-house by A. P Blanchard, has two
parts. The first, RTCalibrate, used the retention times of the standards to identify outliers

59
within the datasets. The second, RTRegister, used retention times to align the species in
the cleaned RTCalibrate dataset to corresponding species from a different dataset.
The cleaned, aligned data were then normalized and converted to pmol
equivalents based on the abundance of the d4 PC(O-16:0/2:0) standard (Cayman
Chemical Company, PAF C-16-d4, 360900) spiked in at time of MSp. This required that
the raw peak area of each endogenous species be divided by the raw peak area of the d4
PC(O-16:0/2:0) from the same sample. These peak area ratios were then multiplied by a
constant to determine the pmol equivalents of each particular endogenous species in the
total 300 uL of lipid extract collected for that sample. Finally, this calculated pmol
equivalent was divided by the tissue wet weight for the corresponding sample to obtain a
final value expressed as pmol equivalents per mg tissue wet weight.
2.4.5 Statistical Analysis
The pmol equivalents per mg tissue wet weight for each endogenous species were
separated into control, EAE onset, EAE peak and EAE remission groups. Each species
was sorted into its corresponding metabolite family. The pmol equivalents per mg tissue
wet weight for the species in each family were summed to obtain the total abundance of
each particular family in control animals and during onset, peak and remission of EAE.
To determine if there were significant fluctuations in the GPC metabolite levels within
families during EAE, a one-way ANOVA was applied to generate p-values, followed by
a Tukey’s post-hoc for significantly changing families (p < 0.05) to determine the
relationship between the groups.
Individual metabolites were also analyzed to determine which, if any, specific
species were changing across EAE. One-way ANOVAs were used to generate p-values,

60
and these p-values were entered into a classic-one stage FDR (false detection rate) in
order to eliminate false positives. The q-values obtained from the FDR were used to
calculate the likely number of false positives in the dataset. FDR values were set to
ensure that the probability of obtaining a false positive comparison was less than one.
Lastly, a Tukey’s post-hoc was applied to the significantly changing species (p-value <
0.05, FDR < 0.5) to determine the relationships between groups.
2.5 RESULTS
2.5.1 There were 72 GPC metabolites and 8 different metabolite families detected in the hippocampus. Analysis of GPC-enriched lipid samples from the hippocampus using LC-ESI-
MSp yielded 110 species. Of these, 38 were found to have more than 10 carbons at the
sn-2 position and were considered to be short-chain structural lipids rather than
metabolites. Focus was placed on identifying and analyzing the 72 species with 8 carbons
or less at the sn-2 position in order to obtain a readout of membrane catabolism and
remodeling. Within these 72 metabolites, 8 distinct metabolite families were detected.
The most abundant families were the LPCs and PAFs, accounting for 31.94% (23) and
26.39% (19) of the species, respectively. PAFXs accounted for 12.50% (9) of the species,
LPAFs for 11.11% (8) and PLPAFs for 8.33% (6) of the species. The least abundant
families were APAFXs and PPAFs, which each accounted for 4.17% (3) of the species,
and the APAFs, accounting for 1.39% (1) of the species.
2.5.2 EAE significantly decreased hippocampal levels of LPCs, PAFs and PPAFs relative to controls. Metabolites were grouped into their respective families to give overall metabolite
family abundances. The total pmol equivalents for each metabolite family were then

61
analyzed across EAE; this is shown in Figure 2.1. After a one-way ANOVA, three
families showed a significant change during EAE (p-value < 0.05): LPCs, PAFs and
PPAFs. A Tukey’s post-hoc analysis revealed that there was a significant decrease when
comparing onset and peak levels to controls in the LPC and PAF families; though not
significantly lower, remission metabolite levels were also decreased relative to controls.
There were no significant comparisons between EAE stages and controls in the PPAF
family, though there was a trend towards a similar pattern to the LPCs and PAFs.
2.5.3 In the hippocampus, 6.94% of the individual metabolite species were significantly decreased during EAE. Each of the 72 species was examined individually across EAE. The vast majority
of the species showed a trend towards a decreased abundance at EAE onset, with the
levels returning closer to, if not the same as, control levels by remission. Data are
represented as a log2 fold change relative to the control group in Figure 2.2. The 72
species are listed according to their respective family.
Although there was a trend towards a decrease in metabolite levels during EAE,
the majority of the detected species were not found to be significantly different between
groups. A representative example of a species unaffected by EAE is illustrated in Figure
2.3A. Of all the species detected, 6.94% (5) were significantly affected by EAE (p-value
< 0.05, FDR < 0.5, Tukey’s post-hoc). These species included the four following LPCs
and one PPAF: PC(18:1/0:0) at m/z 522.4b, PC(18:0/0:0) at m/z 524.4b, PC(20:1/0:0) at
m/z 550.4c, PC(22:0/0:0) at m/z 580.4h and PC(P-20:0/2:0) at m/z 578.4g. All of these
species were significantly decreased across the three EAE states relative to controls,
although PC(18:1/0:0) only showed a non-statistically significant trend towards a
62
decrease during remission. The abundances of each of these 5 species across EAE are
shown in Figure 2.3B.
2.5.4 There were 80 GPC membrane metabolites and 9 different metabolite families detected in the TPE cortex. Similar to the hippocampus, there were 106 species detected by LC-ESI-MSp in
GPC-enriched lipid extracts from the TPE cortex. Of these 106, 26 were short-chain
structural GPCs and were thus not further identified nor analyzed. The remaining 80
membrane metabolites were grouped into nine families. The two most abundant families,
once again, were the LPCs, accounting for 31.25% (25) of the species, and the PAFs,
accounting for 26.25% (21) of all species. PAFXs and LPAFs accounted for 12.5% (10)
and 11.25% (9) of all the species, respectively, and PLPAFs accounted for 7.5% (6) of
the species. 3.75% (3) of the species belonged to the PPAF family, whereas APAFs,
APAFXs and PPAFXs each constituted 2.5% (2) of all species.
2.5.5 There were no significant differences between EAE and control groups in any of the 9 metabolite families in the TPE cortex. As in the hippocampus, metabolites were also analyzed at the family level. Pmol
equivalences for each metabolite family were determined by summing the abundance of
the families’ species. There were no significant differences found between controls,
onset, peak or remission for each of the nine families (p-value < 0.05), as shown in
Figure 2.4.
2.5.6 In the TPE cortex, 6.25% of the individual metabolite species were significantly decreased in EAE relative to controls. An overview of the 80 metabolites, grouped according to family, is shown in
Figure 2.5. Expressed as log2 fold change relative to controls, most species changed very

63
little from control levels in the TPE cortex during EAE. Examining each species
individually found that most species did not change during EAE. A representative
example of one of these species is shown in Figure 2.6A. There were, however, 6.25%
(5) of the metabolites that were significantly decreased during EAE (p-value < 0.05, FDR
< 0.5, Tukey’s post-hoc), which are illustrated in Figure 2.6B. These metabolites
included two LPCs, two PAFs and one PPAF: PC(14:0/0:0) at m/z 468.4b, PC(22:5/0:0)
at m/z 570.4a, PC(O-18:3/2:0) at m/z 546.4a, PC(O-20:5/2:0) at m/z 570.4 and PC(P-
16:2/2:0) at m/z 518.4c. All except PC(14:0/0:0) were significantly decreased in all three
EAE states relative to controls, though remission levels showed a trend towards slightly
higher levels than peak and onset. For PC(14:0/0:0) however, there was no statistically
significant difference between control and peak levels, though there was a trend towards
a decrease during peak EAE. Similar to the other 4 species, PC(14:0/0:0) levels during
onset and remission were both significantly lower than control levels.
2.5.7 Despite similarities in species, all metabolite families in the control group were more abundant in the hippocampus than in the TPE cortex. Comparing the control levels of each metabolite family between the TPE cortex
and hippocampus found that there were differences in abundances of 8 families found in
both regions, with the oxidized PPAFX metabolites only detected in the TPE cortex. All
8 families were more abundant in the hippocampus than the cortex. This can clearly be
seen when comparing Figure 2.1 and Figure 2.4, which share the same y-axis. Of the 72
hippocampal species, 12 were unique to the hippocampus; in the TPE cortex, 20 of the 80
metabolite species were unique. There were thus 60 species shared between the two
regions, which accounted for 83.33% of the hippocampal species and 75.00% of the
cortical species.
64
Figure 2.1 The effect of EAE on the metabolite families detected in the hippocampus. GPC metabolite families are listed according to the type of metabolite in rows (lyso-GPC, sn-2 acetylated, and oxidized PAF-like metabolite), and structurally related families in columns (acyl sn-1 linkage, alkyl sn-1 linkage, and vinyl ether sn-1 linkage). To determine overall family abundance, the pmol equivalents for the metabolites in each family were summed to obtain an overall abundance. GPC metabolite levels were analyzed using a one-way ANOVA (p < 0.05) and a Tukey’s post-hoc. Data are represented as mean ± SEM. *p-value < 0.05; **p-value < 0.01; ____*____ significantly different according to the one-way ANOVA but no significant difference between groups with Tukey’s post-hoc

Bennett
Typewritten Text
65

66
Figure 2.2 Log2 fold change of all the species detected in the hippocampus. Species are listed according to family, and include both their name and m/z. The pmol equivalent per mg tissue wet weight for each species for each EAE state are expressed as a log2 fold change relative to the control group. The control group is in grey, onset is in dark blue, peak is in bright red, and remission is in pink.
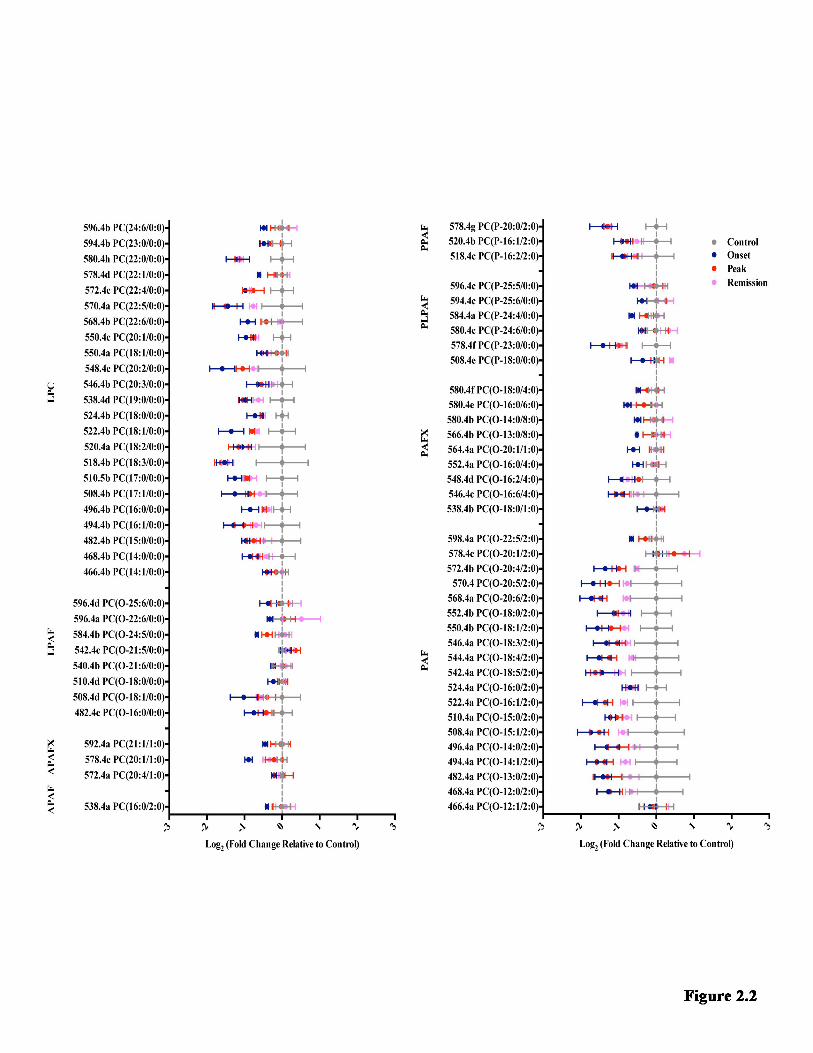
Bennett
Typewritten Text
67
Bennett
Typewritten Text
68
Figure 2.3 Examples of how EAE affected individual metabolite species in the hippocampus.
A. This is a representative example of a species not significantly altered by EAE. The pmol equivalent per mg tissue wet weight for each species was analyzed using a one-way ANOVA (p-value < 0.05), an FDR (FDR < 0.5) and a Tukey’s post-hoc. Data are represented as mean ± SEM.
B. These are the 5 species significantly affected by EAE in the hippocampus. The pmol equivalent per mg tissue wet weight for each species was analyzed using a one-way ANOVA (p-value < 0.05), an FDR (FDR < 0.5) and a Tukey’s post-hoc. All significant differences are relative to the control group. Data are represented as mean ± SEM. *p-value < 0.05; **p-value < 0.01

Bennett
Typewritten Text
69
Bennett
Typewritten Text

70
Figure 2.4 The effect of EAE on the metabolite families detected in the TPE cortex. GPC metabolite families are listed according to the type of metabolite in rows (lyso-GPC, sn-2 acetylated, and oxidized PAF-like metabolite), and structurally related families in columns (acyl sn-1 linkage, alkyl sn-1 linkage, and vinyl ether sn-1 linkage). To determine overall family abundance, the pmol equivalents for the metabolites in each family were summed to obtain an overall abundance. The y-axis for each family is the same as the y-axis in the corresponding hippocampal family in Figure 2.1. GPC metabolite levels were analyzed using a one-way ANOVA (p < 0.05) and a Tukey’s post-hoc. Data are represented as mean ± SEM.

Bennett
Typewritten Text
71
Bennett
Typewritten Text

72
Figure 2.5 Log2 fold change of all the species detected in the TPE cortex. Species are listed according to family, and include both their name and m/z. The pmol equivalent per mg tissue wet weight for each species for each EAE state are expressed as a log2 fold change relative to the control group. The control group is in grey, onset is in dark blue, peak is in bright red, and remission is in pink.

Bennett
Typewritten Text
73
Bennett
Typewritten Text

74
Figure 2.6 Examples of how EAE affected individual metabolite species in the TPE cortex.
A. This is a representative example of a species not significantly altered by EAE. The pmol equivalent per mg tissue wet weight for each species was analyzed using a one-way ANOVA (p-value < 0.05), an FDR (FDR < 0.5) and a Tukey’s post-hoc. Data are represented as mean ± SEM.
B. These are the 5 species significantly affected by EAE in the TPE cortex. The pmol equivalent per mg tissue wet weight for each species was analyzed using a one-way ANOVA (p-value < 0.05), an FDR (FDR < 0.5) and a Tukey’s post-hoc. All significant differences are relative to the control group. Data are represented as mean ± SEM. *p-value < 0.05; **p-value < 0.01

Bennett
Typewritten Text
75
Bennett
Typewritten Text

76
2.6 DISCUSSION
2.6.1 GPC metabolism is regionally specific but largely unimpaired following EAE. The relatively new, vast field of lipidomics encompasses the study of all classes
of lipids in a biological system (Shevchenko and Simons, 2010), including numerous
families and subfamilies with nearly limitless structural possibilities (Bou Khalil et al.,
2010, Xu et al., 2013). These lipids perform functions as diverse as maintaining cellular
structure (Farooqui et al., 2004, Bou Khalil et al., 2010, Shevchenko and Simons, 2010),
acting as signaling molecules (Adibhatla and Hatcher, 2008, Bou Khalil et al., 2010,
Shevchenko and Simons, 2010) and storing energy (Shevchenko and Simons, 2010) . Of
the overwhelmingly enormous field of lipidomics, this study focused on the GPC
metabolites present in the hippocampus and TPE cortex of female mice induced with
EAE.
In the family analysis, 3 of the 8 detected GPC metabolite families in the
hippocampus—LPCs, PAFs and PPAFs—were significantly decreased in EAE relative to
controls, while there were no significant changes in the abundances of GPC metabolite
families during EAE in the TPE cortex. Examining the species individually, it was found
that the vast majority of these metabolites did not differ from control levels during the
onset, peak and remission states of EAE. Only 6.94% (5) of the 72 metabolite species in
the hippocampus (PC(18:1/0:0), PC(18:0/0:0), PC(20:1/0:0), PC(22:0/0:0) and PC(P-
20:0/2:0)) and 6.25% (5) of the 80 species in the TPE cortex (PC(14:0/0:0),
(PC(22:5/0:0), PC(O-18:3/2:0), PC(O-20:5/2:0) and PC(P-16:2/2:0)) were significantly
decreased during EAE relative to control levels. Despite these differences between the
EAE hippocampus and cortex however, they shared 8 of the same families and 60 of the

77
same species. All of the shared metabolite families, however, were more abundant in the
hippocampus than in the TPE cortex in the uninjured controls.
2.6.2 In both the hippocampus and the TPE cortex during EAE, PLA2, LPCAT acetyltransferase and non-enzymatic oxidation likely do not contribute to GPC metabolite imbalances. Examining the results of this study, there was no evidence of an increase in
activity of PLA2 or LPCAT acetyltransferase during EAE in either the hippocampus or
the TPE cortex. Increased activity of PLA2 would have resulted in higher lyso-GPC
production (Choy et al., 1997, Creer and McHowat, 1998, Harayama et al., 2008,
Farooqui, 2009, Shindou et al., 2013, Stanca et al., 2013, Xu et al., 2013), and increased
LPCAT acetyltransferase activity would have lead to increases in sn-2 acetylated
metabolites (Meyer and McHowat, 2007, Harayama et al., 2008, Shindou et al., 2013,
Stanca et al., 2013, Xu et al., 2013); however, there was no increase in either of these
metabolite families during EAE. These results were very surprising, as studies using
cPLA2 knock out mice (Marusic et al., 2005) and various PLA2 inhibitors (Kalyvas and
David, 2004, Cunningham et al., 2006, Marusic et al., 2008, Kalyvas et al., 2009,
Thakker et al., 2011) have demonstrated a role for PLA2 activity in EAE progression in
the spinal cord. In fact, Kihara et al. (2008) found an increase in the PLA2-LPCAT
acetyltransferase axis in the spinal cord that significantly contributed to increasing PAF
levels during EAE. Furthermore, PAFs (Adibhatla et al., 2008, Adibhatla and Hatcher,
2008, Mazereeuw et al., 2013) and LPCs (Farooqui et al., 2004, Farooqui et al., 2007,
Frisardi et al., 2011, Sevastou et al., 2013) have been implicated in processes of
inflammation; PAFs have also been associated with neurodegenerative processes
(Farooqui et al., 2000, Mazereeuw et al., 2013, Xu et al., 2013). It would therefore be

78
expected that GPC metabolites would be abundant in MS, a disease characterized by both
neuroinflammation and neurodegeneration at lesion sites.
Another surprising result found in both the hippocampus and TPE cortex was the
lack of change in the PAF-like metabolites. As these metabolites are produced through a
non-enzymatic pathway of oxidative modification often found during times of oxidative
stress (such as during inflammation) (Marathe et al., 2000, Prescott et al., 2000), one
would have expected an increase in these metabolites during EAE. However, both brain
regions showed very little change in the levels of these metabolites. This suggests that
non-enzymatic oxidation is not a major source of GPC metabolite imbalances, at least
during the first immune attack of EAE.
2.6.3 In the hippocampus, LPCAT acyltransferase, transacetylase and PAF-AH activity are likely increased during EAE; in the TPE cortex, PAF-AH appears to be the only enzyme slightly affected by EAE.
In the hippocampus, the PAF, LPC and PPAF families were surprisingly
significantly decreased during EAE. The decrease in PAFs and PPAFs but not their
parent lyso-GPCs suggests that there was increased hydrolysis of these acetylated
metabolites by PAF-AH. The lack of increase in LPAFs and PLPAFs during EAE
suggests that there may also have been an increase in lyso-GPC hydrolysis by LPCAT
acyltransferase. The significant decrease in LPCs suggests that the LPCs may have been
selectively reacylated, as the membrane generally has a higher concentration of diacyl
GPCs than any other linkage type (Prescott et al., 2000).
A further contributor to decreases in LPC levels may have been the transacetylase
activity of PAF-AH (Servillo et al., 2006, Xu et al., 2013). Transacetylase, documented in
activated endothelial cells as a regulator for PAF signaling, is known to remove the acetyl

79
group from PAF, producing LPAF, and transfer it to LPC, producing APAF (Balestrieri
et al., 2003). If transacetylase activity was activated in addition to the increased LPCAT
acyltransferase activity during EAE, this may help explain not only the decrease in PAFs
and LPCs, but also the relatively constant level of APAFs. Should LPCAT
acyltransferase and transacetylase both be activated and using LPCs as substrates, LPC
levels would be expected to be low during EAE. Similarly, the hydrolysis of PAF by both
PAF-AH and transacetylase could also explain the large decrease in PAF levels during
EAE. The APAFs, which remained relatively constant throughout EAE, may have had
their production by transacetylase balanced by the increase in PAF-AH activity. Though
this increased activity of PAF-AH would produce LPCs, the rate of LPC hydrolysis by
transacetylase and LPCAT acyltransferase was likely higher, causing an overall net loss
of LPCs during the disease.
Interestingly, all of the 8 detected GPC families in the hippocampus showed a
decrease (very slight in some families) at the onset of EAE. This could suggest an
increase in LPCAT acyltransferase activity at the onset of EAE, perhaps in response to
earlier, preclinical EAE events. For example, a study by Starossom et al. (2015)
examining platelet activity in MS patients and in EAE mice found that many
inflammatory activities occur before the visible onset of EAE. Actively degranulating
platelets identified by Annexin V expression, which release pro-inflammatory factors
including PAF, were most abundant in EAE mice before the onset of EAE. By the time
the animals reached the clinical disease onset, Annexin V levels had returned to the levels
found in uninjured controls, indicating that platelets were no longer releasing pro-
inflammatory factors. Similar to the EAE results, platelets in the peripheral blood of MS

80
patients who exhibited few neurological symptoms, if any, were found to have high
Annexin V staining as well (Starossom et al., 2015). Thus it may be possible that PLA2
activity may have been increased during preclinical EAE, such that by the clinical onset
of EAE, LPCAT acyltransferase had already been activated in an attempt to regenerate
structural GPCs and protect the structural integrity of the cell membrane (Farooqui et al.,
2000, Farooqui et al., 2004, Adibhatla et al., 2008).
In further support of this theory, LPCAT acyltransferase activity has been
positively correlated to levels of the pro-inflammatory cytokine IFN-γ. An experiment by
Neville et al. (2005) demonstrated an increase in LPCAT acyltransferase activity in
monocytic cells within 12 hours of being exposed to IFN-γ, and this activity was
increased by 132% relative to untreated controls by 24 hours (Neville et al., 2005). This
increased acyltransferase activity would result in higher production of structural GPCs
through reacylation of the metabolites generated by PLA2 (Stanca et al., 2013).
Interestingly, the degranulating platelets documented during early MS and EAE were
found to be stimulating CD4+ T-cell differentiation towards Th1, Th17 or IL-17/IFN-γ
phenotypes. These types of T-cells are thought to play an important role in EAE and MS
pathogenesis, and they have also been shown to release IFN-γ, among other cytokines
(Starossom et al., 2015). This CD4+ T-cell phenotype manipulation by the platelets could
thus provide an explanation for early increases in IFN-γ levels, which could then lead to
increased LPCAT acyltransferase activity.
Together, these results suggest that there are early, preclinical events in the
hippocampus during EAE that may contribute to a possible preclinical increase in GPC
metabolite levels, which is then balanced by a corresponding increase in LPCAT
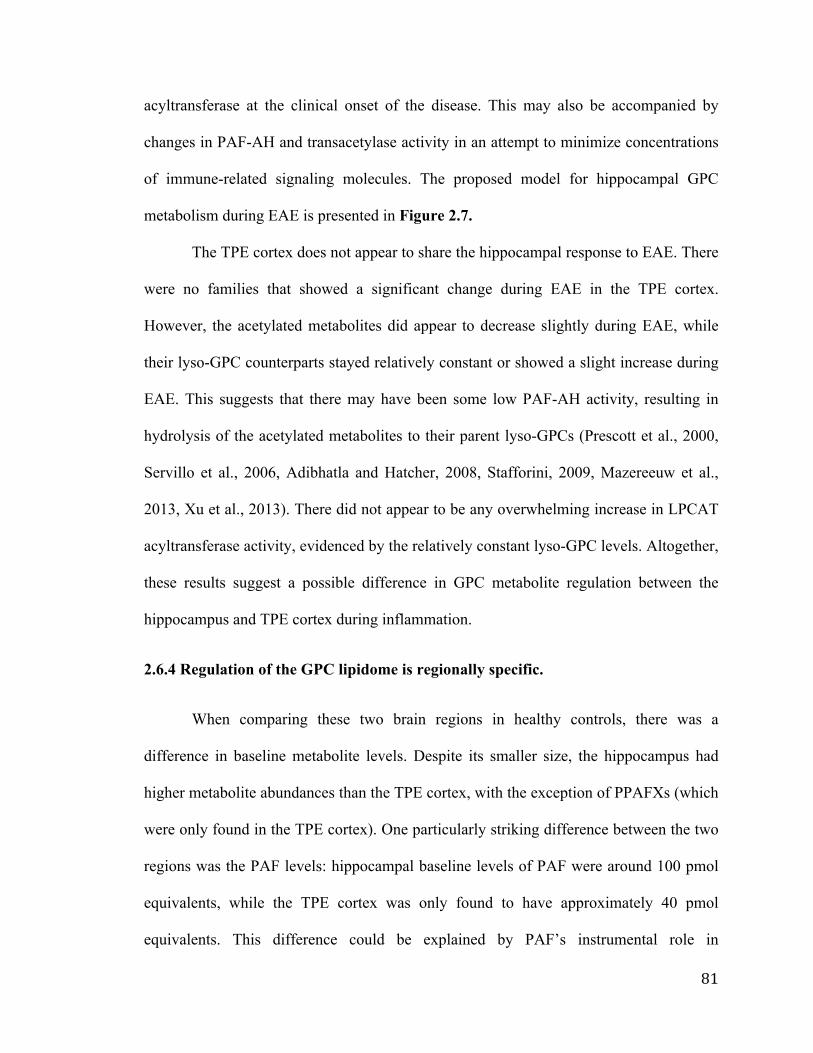
81
acyltransferase at the clinical onset of the disease. This may also be accompanied by
changes in PAF-AH and transacetylase activity in an attempt to minimize concentrations
of immune-related signaling molecules. The proposed model for hippocampal GPC
metabolism during EAE is presented in Figure 2.7.
The TPE cortex does not appear to share the hippocampal response to EAE. There
were no families that showed a significant change during EAE in the TPE cortex.
However, the acetylated metabolites did appear to decrease slightly during EAE, while
their lyso-GPC counterparts stayed relatively constant or showed a slight increase during
EAE. This suggests that there may have been some low PAF-AH activity, resulting in
hydrolysis of the acetylated metabolites to their parent lyso-GPCs (Prescott et al., 2000,
Servillo et al., 2006, Adibhatla and Hatcher, 2008, Stafforini, 2009, Mazereeuw et al.,
2013, Xu et al., 2013). There did not appear to be any overwhelming increase in LPCAT
acyltransferase activity, evidenced by the relatively constant lyso-GPC levels. Altogether,
these results suggest a possible difference in GPC metabolite regulation between the
hippocampus and TPE cortex during inflammation.
2.6.4 Regulation of the GPC lipidome is regionally specific.
When comparing these two brain regions in healthy controls, there was a
difference in baseline metabolite levels. Despite its smaller size, the hippocampus had
higher metabolite abundances than the TPE cortex, with the exception of PPAFXs (which
were only found in the TPE cortex). One particularly striking difference between the two
regions was the PAF levels: hippocampal baseline levels of PAF were around 100 pmol
equivalents, while the TPE cortex was only found to have approximately 40 pmol
equivalents. This difference could be explained by PAF’s instrumental role in

82
hippocampal function, particularly as it pertains to LTP (Bazan et al., 1997, Chen et al.,
2001). Ca2+-triggered PAF production occurs in response to binding of pre-synaptic
glutamate to its post-synaptic membrane receptor; the released PAF then binds to PAFR
at the presynaptic membrane, which leads to even more glutamate release from the
presynaptic neuron and a strengthened synapse (Bazan et al., 1997, Mazereeuw et al.,
2013).
During EAE however, PAF levels in the hippocampus dropped to approximately
cortical levels at the onset of EAE, and remained similar to TPE cortex PAF levels
through peak and remission. Interestingly, MS patients (Portaccio et al., 2006, Ranjeva et
al., 2006, Kern et al., 2012, Yu, 2012) and EAE mice (Ziehn et al., 2010, Acharjee et al.,
2013, Dutra et al., 2013, Novkovic et al., 2015) both have documented impairments in
memory function. It is possible that these memory impairments in MS and EAE may be
caused at least in part by the huge reduction in PAF production in the hippocampus
during EAE.
The differences in how metabolite families were affected by EAE in the
hippocampus and TPE cortex suggests that there may be a difference in lipid metabolism
regulation between these two regions. This idea is further fortified by the high degree of
overlap between the two regions in terms of individual GPC metabolite species. The five
decreased species in the hippocampus were found in the TPE cortex but were unaffected
by EAE; similarly, the five decreased cortical species were also found unchanged during
EAE in the hippocampus. Additionally, though these two regions do appear to share the
same Land’s cycle enzymes (as predicted by mRNA expression), there are some regional
differences in mRNA abundances of these enzymes (Allen Institute for Brain Science,

83
2015). In the hippocampus, PLA2 groups IIF (sPLA2 (Rosa and Rapoport, 2009,
Schaeffer et al., 2009)), V (sPLA2 (Ghosh et al., 2006, Rosa and Rapoport, 2009,
Schaeffer et al., 2009)), VII (plasma PAF-AH (Schaeffer et al., 2009)), and XV
(lysosomal PLA2 (Shayman et al., 2011)) transcripts are more abundant, while LPCAT4
(which lacks acetyltransferase activity (Shindou et al., 2009, Shindou et al., 2013)) and
PLA2 group IVE (cPLA2 (Ghosh et al., 2006, Rosa and Rapoport, 2009, Schaeffer et al.,
2009, Leslie, 2015)) transcripts are more highly expressed in the cortex (Allen Institute
for Brain Science, 2015). Thus the different mRNA abundances may also help explain
the differences in GPC metabolism between these two regions.
2.6.5 Future Directions
Further future work should focus on determining if there are any preclinical
changes occurring in the GPC lipidome in the hippocampus and the TPE cortex of EAE
mice, and linking these changes to the reported phosphocholine and GPC biomarkers
(Callea et al., 1999, Del Boccio et al., 2011, Dickens et al., 2014, Pieragostino et al.,
2015). If changes in the brain lipidome can be detected in the serum, plasma, or CSF of
patients before the clinical onset of the immune attack, this may provide not only a way
to predict the clinical course of MS, but also the possibility of potential therapeutic
targets. It may also be interesting to repeat this study using mice with chronic EAE (CH-
EAE), which models PPMS (Berard et al., 2010). Any commonalities discovered
between RR-EAE and CH-EAE lipidomes may increase understanding of the disease
process in terms of lipidomic changes, and potentially provide an effective therapeutic
option for both relapsing-remitting and progressive MS.

84
Figure 2.7 Proposed model for the metabolite changes in the hippocampus during EAE.
It is hypothesized that preclinically, before any signs of motoric impairment in the EAE animals, there is an increase in PLA2 activity in response to pro-inflammatory signals. This would lead to an increase in lyso-GPC metabolites. By the time the animals reach the clinical onset of EAE, it is possible that a surge in IFN-γ release may have triggered an increase in LPCAT acyltransferase activity; this would result in regeneration of structural GPCs using the lyso-GPCs produced by PLA2. PAF-AH activity is also known to be triggered by pro-inflammatory conditions. This enzyme is thus likely to be active during EAE, hydrolyzing sn-2 acetylated metabolites in order to deactivate PAF signaling molecules, but also to replace the lyso-GPCs being used by LPCAT acyltransferase. This would lead to a decrease in sn-2 acetylated metabolites. The pro-inflammatory environment may also activate transacetylase activity; this enzyme is known to use LPCs and PAFs to generate APAFs and LPAFs. Overall, the interactions of the different enzyme activities result in some families being decreased and some families maintaining homeostatic metabolite levels. Production of lyso-GPCs by PAF-AH (and transacetylase) is likely occurring at the same rate that LPCAT acyltransferase is converting them to structural GPCs, leading to no overall change in lyso-GPC levels. The exception is the LPC family, which is potentially being consumed by both transacetylase and LPCAT acyltransferase and thus decreased during EAE. Additionally, LPCs may also be selectively decreased because diacyl linkages are the most common among structural GPCs. The PAFs and PPAFs may have been decreased in EAE due to the increase in PAF-AH activity; transacetylase may also be consuming PAF. The other sn-2 acetylated metabolite, APAF, is not decreasing because it is likely being generated by transacetylase at the same rate that it is being used by PAF-AH.
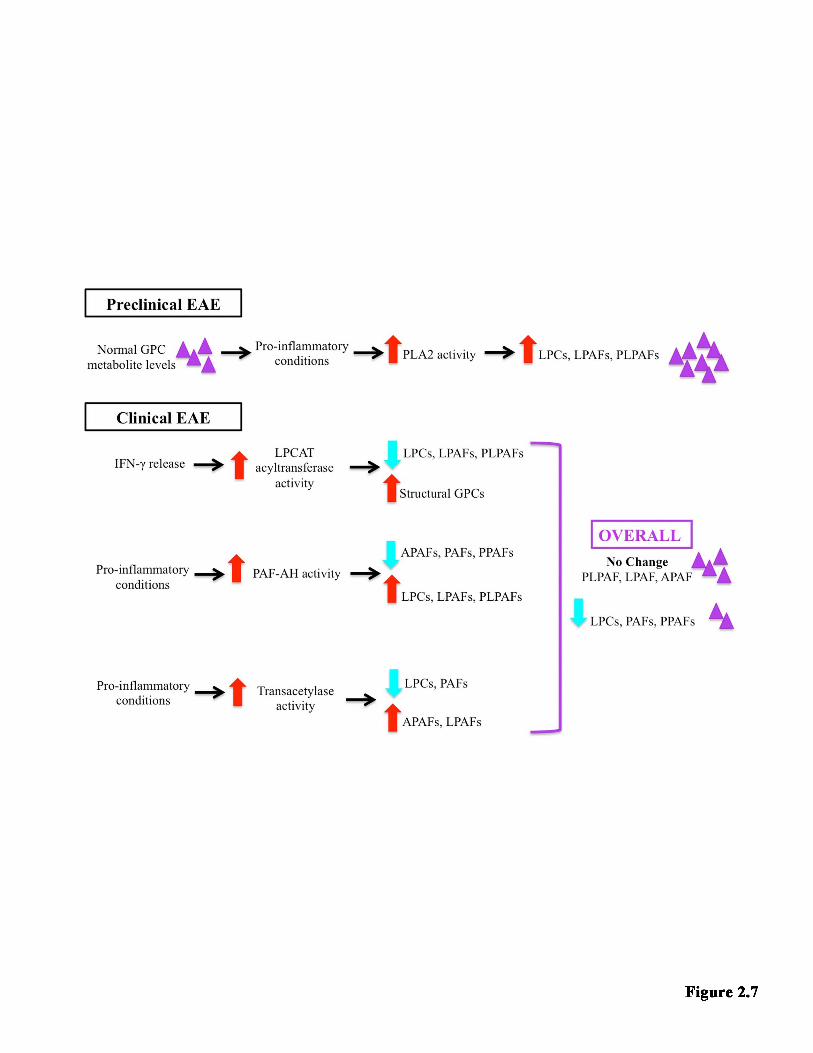
Bennett
Typewritten Text
85
86
2.7 CONCLUSION Lipidomic analysis was used to examine the GPC metabolite levels in the
hippocampus and TPE cortex in female C57BL/6J mice relative to uninjured controls.
Although the disease did not alter the vast majority of detected metabolites, 3 families of
metabolites and 5 specific species in the hippocampus, as well as 5 different species in
the TPE cortex, were found to decrease across the three EAE states examined—onset,
peak and remission—relative to healthy uninjured controls. Although there are several
biomarker studies reporting associations between MS and GPC metabolites in the serum,
plasma and CSF, further research is required to clarify the relationship between these
biomarkers and the brain.
Bennett
Typewritten Text

87
CHAPTER THREE
DIFFERENTIAL HORMONAL REGULATION OF GLYCEROPHOSPHOCHOLINE MEMBRANE REMODELING OVER
THE ESTROUS CYCLE IN THE HIPPOCAMPUS-ENTORHINAL CIRCUIT OF FEMALE C57BL/6J X C3H/HEJ MICE
3.1 OBJECTIVE Although the previous chapter’s EAE study found that the majority of the GPC
metabolites were not changing in mice induced with EAE, the mice used in the study
were all female. To address possible concerns that the results may be due to cyclic
hormonal fluctuations that nullified changes in GPC metabolism, the study in this chapter
was undertaken to control for the possibility of hormonal control. Thus the primary
objective of this study was to determine whether GPC metabolite levels fluctuate with the
estrous cycle in the hippocampus and TPE cortex of female C57BL/6J x C3h/HeJ mice.
3.2 STATEMENT OF AUTHOR CONTRIBUTIONS
Dr. Alexandre P Blanchard collected vaginal smears for 12 of the mice; these 12
mice were also dissected by Dr. Alexandre P Blanchard. Vaginal smears for the
remaining 6 mice were collected by Samantha Sherman, with dissections by Dr. Yun
Wang and Matthew Granger. Dr. Alexandre P Blanchard was responsible for lipid
extractions of 12 temporal-parietal-entorhinal cortices; Dr. Hongbin Xu extracted 12
hippocampi; and Samantha Sherman extracted lipids from the remaining 6 hippocampi
and 6 cortices. All vaginal smear staining and estrous staging was performed by
Samantha Sherman after training provided by Dr. Alexandre P Blanchard. Mass
spectrometry guidance, including training and troubleshooting, was provided as required
to Samantha Sherman by Matthew Granger and Dr. Hongbin Xu. Matthew Granger and

88
Dr. Steffany Bennett developed the pmol equivalents-normalization method used in this
study. All lipid extractions, mass spectrometry operations, lipid quantification and data
analyses were performed by Samantha Sherman.
3.3 INTRODUCTION
Lyso-GPCs and sn-2 acetylated GPC metabolites are produced during the Land’s
cycle, which is a cycle of reversible membrane remodeling controlled by two classes of
enzymes (Xu et al., 2013). PLA2 hydrolyzes ester linkages at the sn-2 position of the
GPC backbone, while LPCAT esterifies hydrocarbon chains at the sn-2 position (Kalyvas
et al., 2009, Bou Khalil et al., 2010, Xu et al., 2013). Interestingly, female sex hormones
appear to affect several components of the Land’s cycle. A study by Alecozay et al.
(1989) using cultures derived from human endometrial tissue found that PAF levels rose
with increasing application of progesterone. Similarly, a study examining acrosomal
exocytosis in sperm from guinea pigs found that incubation with progesterone led to
increases in both PLA2 activity and LPC levels, and decreases in GPC levels (Chen et al.,
2005). Using a HEC-1A line derived from endometrial cells, Seo et al. (2004) also found
an upsurge in both PAF levels and PLA2 expression in response to estrogen treatments.
Similarly, Burlando et al. (2002) found that administration of estradiol led to an increase
in calcium-dependent PLA2 (cPLA2) activity and a resulting membrane destabilization in
lysosomes of mussel red blood cells.
Female sex hormones also modify enzymes involved in the lyso-GPC/sn-2
acetylated GPC pathway. A decrease in PAF-AH activity was found in plasma from
women who were preparing for in vitro fertilization and thus had high 17-β estradiol
levels (Miyaura et al., 1991). In experimental models, plasma PAF-AH activity was
89
decreased in rats injected with 17-α-ethynylestradiol (Miyaura et al., 1991, Yasuda and
Johnston, 1992, Ihara et al., 1993), estrone, 17-β estradiol and estriol (Yasuda and
Johnston, 1992). Injection with progesterone derivative medroxyprogesterone however,
increased PAF-AH activity (Yasuda and Johnston, 1992, Ihara et al., 1993). When 17-α-
ethynylestradiol and medroxyprogesterone were injected together, the estradiol was
found to be the dominant hormone, as the PAF-AH activity decreased overall (Yasuda
and Johnston, 1992). Similarly in HepG2 cells, PAF-AH secretion in response to
treatment with both 17-α-ethynylestradiol and 17-β estradiol was decreased (Satoh et al.,
1993). In contrast to PAF-AH, LPCAT acetyltransferase activity in the liver has been
shown to decrease in response to medroxyprogesterone, but was not affected by estradiol
treatment (Ihara et al., 1993).
Progesterone and estrogen are both involved in the female hormonal cycle, known
as the estrous cycle in mice. Developing follicles in the ovaries produce steadily
increasing levels of estradiol (Goldman et al., 2007, Caligioni, 2009, McLean et al., 2012,
Andersson et al., 2013), which travels through the circulation to the brain and triggers the
release of GnRH from the hypothalamus. GnRH travels to the anterior pituitary
(Goldman et al., 2007, Caligioni, 2009, McLean et al., 2012), where it stimulates the
release of LH and FSH into the circulation. The LH and FSH surge triggers the release of
the mature ovum from its follicle in the ovary, an event known as ovulation (Goldman et
al., 2007, Caligioni, 2009, McLean et al., 2012, Andersson et al., 2013). Upon ovulation,
estrogen levels begin to drop, and the follicle is luteinized to become a corpus luteum
(Goldman et al., 2007, McLean et al., 2012, Andersson et al., 2013). The corpus luteum
produces progesterone (McLean et al., 2012, Andersson et al., 2013), thus leading to an
90
increase in circulating progesterone levels (McLean et al., 2012). If there is no
fertilization of the ovum, the corpus luteum degenerates (McLean et al., 2012, Andersson
et al., 2013), progesterone levels decrease (McLean et al., 2012), and a new follicle
begins to develop (Andersson et al., 2013). This leads to an increase in estrogen levels
and the cycle restarts (Goldman et al., 2007, Caligioni, 2009, McLean et al., 2012,
Andersson et al., 2013).
For studies using female subjects, particularly those examining structures
involved in memory formation, the estrous cycle is an important consideration to take
into account. Hormonal regulation of the various components of the Land’s cycle also
implies that this estrous cycle consideration may be very relevant in the study of
membrane lipids, particularly GPCs. To date, there are no studies examining the
relationship between GPC metabolism and the estrous cycle in the female brain. The aim
of this present study was to determine whether the estrous cycle affects GPC metabolite
levels in the hippocampus and TPE cortex of female mice. Interestingly, it was found that
GPC metabolism in these two brain regions was differentially affected by fluctuations in
circulating female sex hormones.
3.4 MATERIALS AND METHODS
3.4.1 Animals
The mice used were our in-house wild type strain, a C57BL/6J x C3h/HeJ hybrid
strain backbred for five generations to a C57BL/6Crl lineage. This hybrid strain was
chosen as it represents a genetic background common to multiple Alzheimer’s disease
mouse models (Chishti et al., 2001, Savonenko et al., 2005, Garcia-Alloza et al., 2006,
Wang et al., 2013). Female mice between 2 and 8 months of age were sacrificed by lethal

91
injection of 0.15 mL euthanyl (Bimeda-MTC Animal Health Ins, 65 mg/mL 1EUS001),
followed by decapitation. Vaginal smears for estrous staging were collected for at least
two consecutive days prior to and including the day of sacrifice. Upon sacrifice,
hippocampus and TPE cortex were dissected from the brain, weighed to obtain the tissue
wet weight, snap frozen in liquid nitrogen, and stored at -80°C until time of extraction.
The procedures used were approved by the University of Ottawa Animal Care Committee
and followed guidelines of the Canadian Council on Animal Care.
3.4.2 Estrous cycle determination
Estrous staging was performed using a minimally invasive method described in
our laboratory by McLean et al. (2012). Briefly, a 200 µL pipette tip with a bulb attached
was used to draw up approximately 100 µL of double distilled water, which was then
aspirated in and out of the vaginal opening at least five times. Care was taken to keep the
tip outside of the mouse’s body. After aspirating the water multiple times, the droplet
containing vaginal cells was deposited onto a clean slide. After the smear was completely
dry, it was stained using 0.1% crystal violet stain (Fisher Scientific Company, 783596,
New Lawn, New Jersey) and coverslipped using glycerol. Immediately upon staining and
coverslipping, the slide was examined under bright field microscopy to identify the cell
types present in the smear. In this study, there were 6 animals in the proestrus group, 7 in
the estrus group and 5 in the met/diestrus group. In the hippocampal dataset however, two
of the met/diestrus animals had to be excluded based on MSp outlier criteria. Thus, there
were 16 mice in the hippocampus dataset and 18 mice in the TPE cortex dataset.
3.4.3 GPC-Enriched Lipid Extractions
92
Lipids were extracted from the hippocampus and the TPE cortex using an
acidified Bligh and Dyer method, optimized for GPC extraction (Xu et al., 2013).
Homogenized tissue, along with the exogenous standard PC(13:0/0:0) (187.5 ng Avanti
Polar Lipids, 855476, Alabaster, Alabama), was extracted using 4.0 mL acidified
methanol (2% glacial acetic acid (Fisher Scientific Company, 351271-212, Ottawa,
Ontario) in methanol (Fisher Scientific Company, A412P-4)), 3.2 mL 0.1M sodium
acetate (BioShop, SAA304, Burlington, Ontatio) and 3.8 mL chloroform (Fisher
Chemical, C298-4, Fair Lawn, New Jersey). The organic phase (containing lipids and
chloroform) was collected and dried under nitrogen gas. The drying step eliminated the
chloroform, leaving only the lipid extract. This extract was resuspended in 100% ethanol
and stored in the -80°C freezer until time of MSp quantification.
3.4.4 GPC Metabolite Quantification
GPC metabolites were profiled as described in Chapter 2 with the following
modification. The lipid extractions were performed using only one exogenous standard.
This affected both MSp quality control, as there was one less standard to use as an
indicator of spectra quality, and RTStaR, as there was one less standard to use for outlier
analysis and dataset alignments. Additionally in this study, two of the hippocampus MSp
runs in the met/diestrus group had to be excluded after RTCalibrate found outliers in the
standards, thus making alignment for these runs impossible.
3.4.5 Statistical Analysis
The pmol equivalents per mg tissue wet weight for each endogenous species were
separated into proestrus, estrus and met/diestrus groups. Each species was also sorted into

93
its corresponding metabolite family. The pmol equivalents per mg tissue wet weight for
the species in each family were summed to obtain the total abundance of each particular
family during proestrus, estrus and met/diestrus. To determine if there were significant
fluctuations in the GPC metabolite levels within families across the estrous cycle, a one-
way ANOVA was applied to generate p-values, followed by a Tukey’s post-hoc for
significantly changing families (p < 0.05) to determine the relationship between the lipid
abundance and the estrous stage.
Individual species were analyzed to determine which, if any, specific species were
changing across the estrous cycle. One-way ANOVAs were used to generate p-values,
and these p-values were entered into a classic-one stage FDR in order to eliminate false
positives. The q-values obtained from the FDR were used to calculate the likely number
of false positives in the dataset. FDR values were set to ensure that the probability of
obtaining a false positive comparison was less than one. Lastly, a Tukey’s post-hoc was
applied to the significantly changing species (p-value < 0.05, FDR < 0.5) to determine the
relationship between lipid abundance and the estrous cycle stage.
3.5 RESULTS
3.5.1 In the hippocampus, there were 58 individual GPC metabolites detected and 6 different metabolite families.
Using LC-ESI-MSp, there were 87 species in total detected in the hippocampus
between 450 and 650 m/z. However, 29 of these were found to have 10 or more carbons
at the sn-2 position and were thus classified as short-chain structural GPCs rather than
metabolites. The remaining 58 metabolites were identified and further analyzed. These 58
species were divided into their specific metabolite families, of which there were six in the

94
hippocampus. The most abundant family was the LPCs, constituting 36.21% (21) of the
species, followed by the PAFs, constituting 29.31% (17) of all the species. The PAFX
family accounted for 15.52% (9) of the species, while the LPAFs accounted for 10.34%
(6) of the species. The least abundant species were the PLPAFs, contributing 5.17% (3)
of the species, and PPAFs, accounting for 3.45% (2) of the species. APAFs, APAFXs and
PPAFXs were not detected in the hippocampus.
3.5.2 Of the 6 metabolite families detected in the hippocampus, 4 were found to fluctuate significantly with the estrous cycle. Metabolites were grouped into their respective families to determine if the family
as a whole was under hormonal control. Analysis of the total pmol equivalents for each
metabolite family found that 4 of the 6 families detected in the hippocampus were
significantly altered according to the estrous cycle (p-value < 0.05, Tukey’s post-hoc).
The metabolite levels across the estrous cycle for each family are illustrated in Figure
3.1. The LPAF, PLPAF and PAFX families were significantly decreased in proestrus
relative to estrus. LPCs and PAFs showed a similar, non-significant trend towards a
decrease in proestrus relative to estrus. In each of these five families, met/diestrus levels
were intermediate to proestrus and estrus, though not significantly different. The PPAFs
showed a slightly different pattern from the other families; PPAF levels were slightly
higher during met/diestrus than estrus, though estrus levels were still higher than
proestrus. Statistically, there was a significant decrease in proestrus relative to
met/diestrus in the PPAF family.
3.5.3 There were 12 individual species that varied significantly with the estrous cycle, accounting for 20.69% of the hippocampal GPC metabolite lipidome.

95
Overall there was a pattern towards decreased GPC metabolism during proestrus;
this is illustrated in the heat map in Figure 3.2A, where the estrous stages and GPC
metabolite species are clustered according to similarities in metabolite abundances. This
hierarchical clustering suggests that GPC metabolism is dependent on the estrous cycle.
Examining the levels of each metabolite individually over the course of the estrous cycle
found that 20.69% (12) of the species in the hippocampus significantly changed across
the estrous cycle (p-value < 0.05, FDR < 0.5, Tukey’s post-hoc). Five of the significantly
fluctuating species were PAFXs: PC(O-18:0/1:0) at m/z 538.4b, PC(O-16:0/4:0) at m/z
552.4a, PC(O-20:1/1:0) at m/z 564.4a, PC(O-13:0/8:0) at m/z 566.4b and PC(O-16:0/6:0)
at m/z 580.4e. Four of these species were LPCs: PC(17:1/0:0) at m/z 508.4b;
PC(23:6/0:0) at m/z 582.4b; PC(23:0/0:0) at m/z 594.4b; and PC(24:6/0:0) at m/z 596.4b.
There was one each of PLPAF, PAF and LPAF: PC(P-24:6/0:0) at m/z 580.4c, PC(O-
21:6/2:0) at m/z 582.4a, and PC(O-22:6/0:0) at m/z 596.4a, respectively. Each of these
metabolites was significantly decreased in proestrus relative to estrus. Additionally, two
of the species, PC(O-18:0/1:0) and PC(24:6/0:0), were also significantly decreased in
proestrus relative to met/diestrus. Figure 3.2B shows an example of a species unaffected
by the estrous cycle (PC(O-20:6/2:0)), as well as one of the hormonally controlled
species (PC (P-24:6/0:0)).
3.5.4 In the TPE cortex, there were 76 individual metabolite species detected and 9 different metabolite families. Analysis of LC-ESI-MSp data yielded a total of 112 species in the TPE cortex
between 450 and 650 m/z. However, only 76 of these species were identified as GPC
metabolites and further analyzed. The other 36 species were found to be short-chain
structural GPCs, and were thus removed from the dataset. The 76 GPC metabolites

96
belonged to 9 different metabolite families. The most abundant families in the TPE cortex
were the LPCs and PAFs, constituting 31.58% (24) and 25.00% (19) of the all the
species. LPAFs accounted for 13.16% (10) of the species; PAFXs accounted for 10.53%
(8); and PLPAFs accounted for 9.21% (7). APAFs, APAFXs, PPAF and PPAFXs each
accounted for 2.63% (2) of all the species.
3.5.5 There were no significant differences within the metabolite families in the TPE cortex across the estrous cycle. Abundances of GPC metabolite families at each estrous stage are illustrated in
Figure 3.3. There were no significant changes in any of the 9 metabolite families across
the estrous cycle (p-value < 0.05, Tukey’s post-hoc). Several of the families, however,
showed a similar pattern to the hippocampus. In the LPAFs, APAFs, PAFXs, PLPAFs and
PPAFXs, there was a slight, non-significant decrease in metabolite levels at proestrus,
followed by an increase at estrus.
3.5.6 There was only 1 species that fluctuated significantly with the estrous cycle, accounting for 1.32% of the GPC metabolite lipidome in the TPE cortex. Hierarchical clustering in Figure 3.4A did not isolate relationships between GPC
metabolites and the estrous cycle in the TPE cortex, especially when compared to
hierarchical clustering in the hippocampus (Figure 3.2A). Unsurprisingly, analysis of
each individual metabolite found that of the 76 species detected in the TPE cortex, only 1
was under hormonal control (p-value < 0.05, FDR < 0.5, Tukey’s post-hoc). This one
species was the PAF PC(O-12:1/2:0), at m/z 466.4a. As illustrated in Figure 3.4B, PC(O-
12:1/2:0) was significantly decreased in proestrus relative to both estrus and met/diestrus,
which is similar to the pattern found in the hippocampus. A metabolite unaffected by the

97
estrous cycle (representative of the other 75 species in the TPE cortex) was also included
in Figure 3.4B.
3.5.7 The hippocampus and TPE cortex share the majority of the species found in their GPC metabolite lipidome. In order to determine whether the differences in hippocampus and TPE cortex
GPC metabolism could be due to different complements of GPC metabolites, the two
datasets were aligned to directly compare the regional lipidomes. It was found that the
hippocampus and TPE cortex shared 54 species, which accounts for 93.10% of the
hippocampal lipidome and 71.05% of the cortical lipidome. There were 4 unique species
in the hippocampus, and 22 unique species in the TPE cortex. Interestingly, 2 of the 12
metabolites fluctuating with the hormonal cycle were unique to the hippocampus (PC(O-
21:6/2:0) and PC(23:6/0:0)), while the 1 fluctuating cortical species (PC(O-12:1/2:0))
was unique to the TPE cortex.

98
Figure 3.1 The effect of the estrous cycle on the metabolite families detected in the hippocampus. GPC metabolite families are listed according to the type of metabolite in rows (lyso-GPC, sn-2 acetylated, and oxidized PAF-like metabolite), and structurally-related families in columns (acyl sn-1 linkage, alkyl sn-1 linkage, and vinyl ether sn-1 linkage). To determine overall family abundance, the pmol equivalents for the metabolites in each family were summed to obtain an overall abundance. GPC metabolite levels were analyzed using a one-way ANOVA (p < 0.05) and a Tukey’s post-hoc. Data are represented as mean ± SEM. *p-value < 0.05; **p-value < 0.01; ***p-value < 0.001
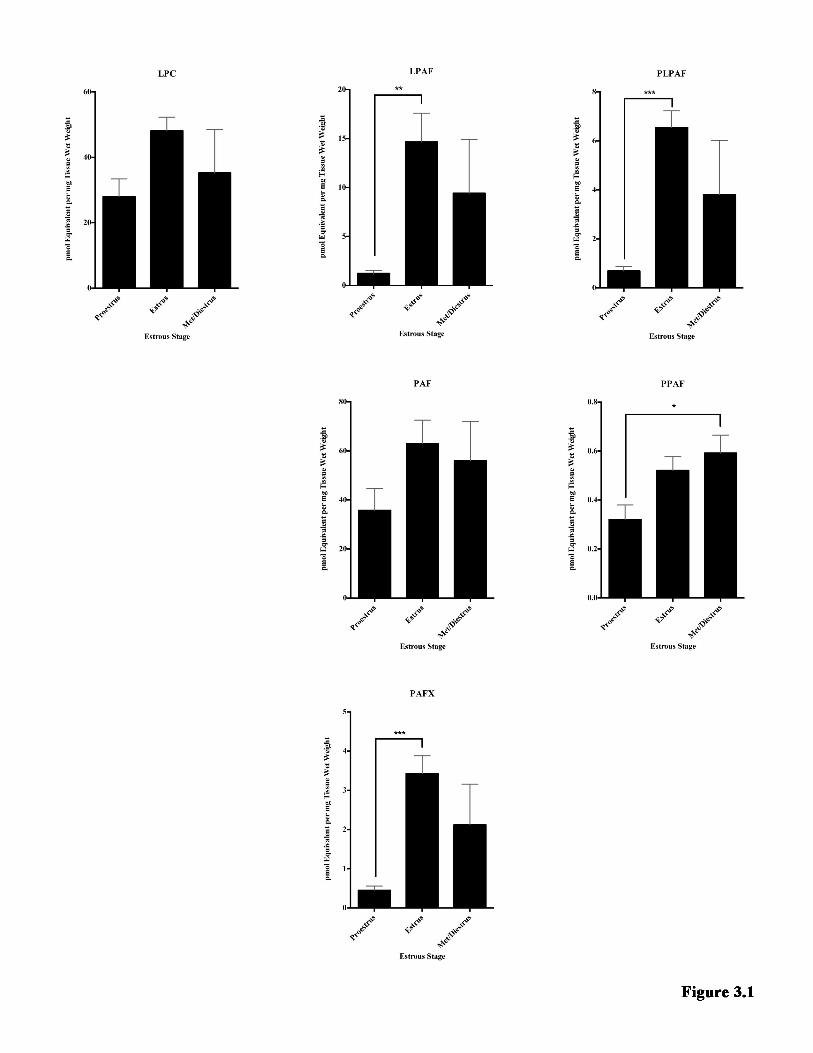
Bennett
Typewritten Text
99
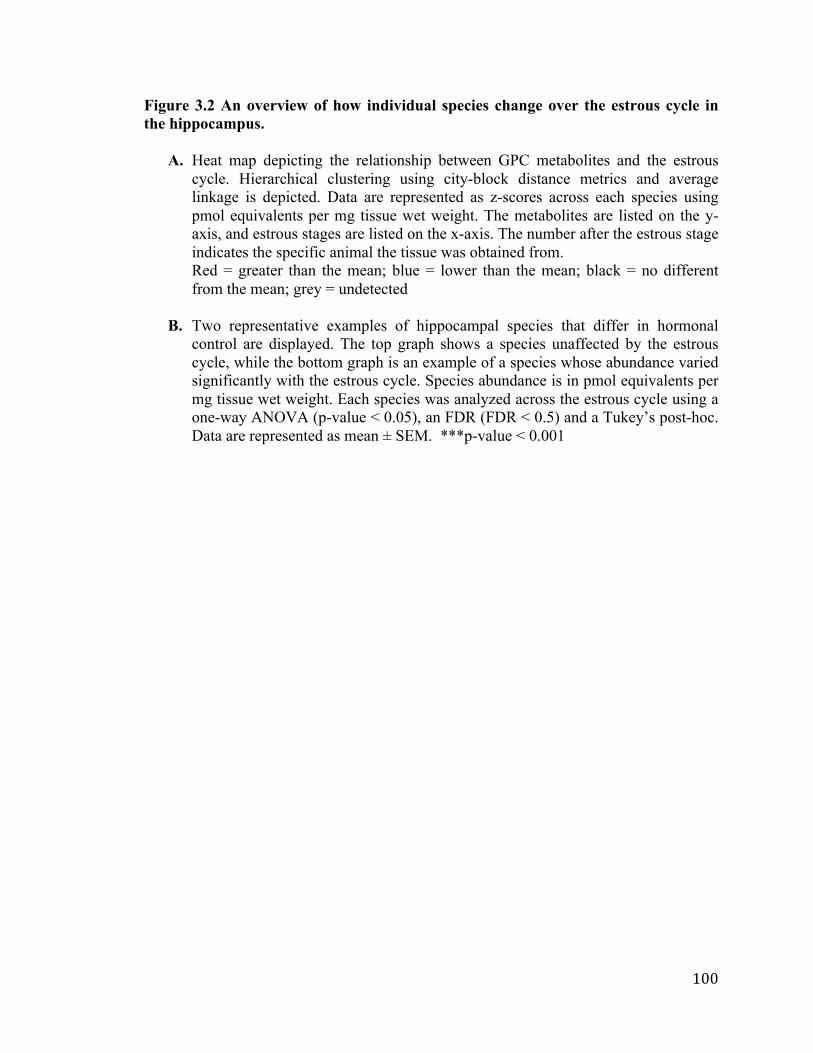
100
Figure 3.2 An overview of how individual species change over the estrous cycle in the hippocampus.
A. Heat map depicting the relationship between GPC metabolites and the estrous cycle. Hierarchical clustering using city-block distance metrics and average linkage is depicted. Data are represented as z-scores across each species using pmol equivalents per mg tissue wet weight. The metabolites are listed on the y-axis, and estrous stages are listed on the x-axis. The number after the estrous stage indicates the specific animal the tissue was obtained from. Red = greater than the mean; blue = lower than the mean; black = no different from the mean; grey = undetected
B. Two representative examples of hippocampal species that differ in hormonal control are displayed. The top graph shows a species unaffected by the estrous cycle, while the bottom graph is an example of a species whose abundance varied significantly with the estrous cycle. Species abundance is in pmol equivalents per mg tissue wet weight. Each species was analyzed across the estrous cycle using a one-way ANOVA (p-value < 0.05), an FDR (FDR < 0.5) and a Tukey’s post-hoc. Data are represented as mean ± SEM. ***p-value < 0.001
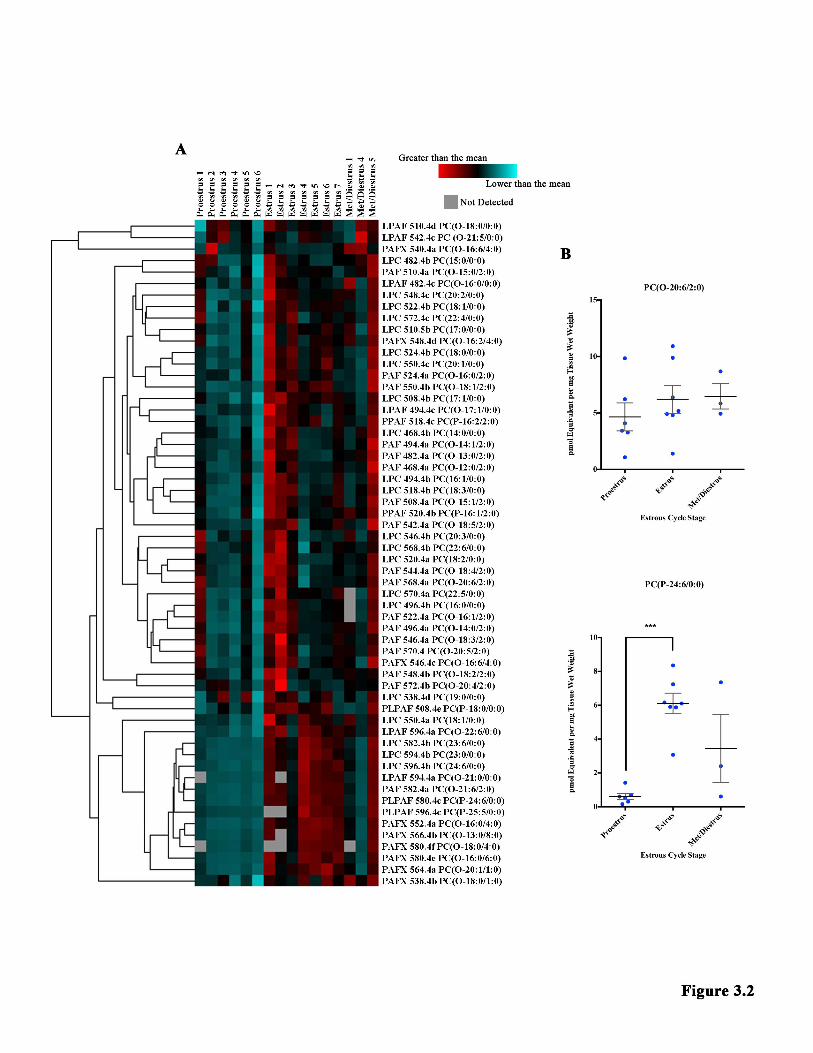
Bennett
Typewritten Text
101

102
Figure 3.3 The effect of the estrous cycle on the metabolite families detected in the TPE cortex. GPC metabolite families are listed according to the type of metabolite in rows (lyso-GPC, sn-2 acetylated, and oxidized PAF-like metabolite), and structurally-related families in columns (acyl sn-1 linkage, alkyl sn-1 linkage, and vinyl ether sn-1 linkage). To determine overall family abundance, the pmol equivalents for the metabolites in each family were summed to obtain an overall abundance. The y-axis for each family is the same as the y-axis in the corresponding hippocampal family in Figure 3.1. GPC metabolite levels were analyzed using a one-way ANOVA (p < 0.05) and a Tukey’s post-hoc. Data are represented as mean ± SEM.

Bennett
Typewritten Text
103

104
Figure 3.4 An overview of how individual species change over the estrous cycle in the TPE cortex.
A. Heat map depicting the relationship between GPC metabolites and the estrous cycle. Hierarchical clustering using city-block distance metrics and average linkage is depicted. Data are represented as z-scores across each species using pmol equivalents per mg tissue wet weight. The metabolites are listed on the y-axis, and estrous stages are listed on the x-axis. The number after the estrous stage indicates the specific animal the tissue was obtained from. Red = greater than the mean; blue = lower than the mean; black = no different from the mean; grey = undetected
A. Two representative examples of TPE cortex species that differ in hormonal control are displayed. The top graph provides a representative example of a species unaffected by the estrous cycle, while the bottom graph shows the one species whose abundance varied significantly with the estrous cycle. Species abundance is in pmol equivalents per mg tissue wet weight. Each species was analyzed across the estrous cycle using a one-way ANOVA (p-value < 0.05), an FDR (FDR < 0.5) and a Tukey’s post-hoc. Data are represented as mean ± SEM. *p-value < 0.05; **p-value < 0.01

Bennett
Typewritten Text
105

106
3.6 DISCUSSION Using female subjects in scientific research is often daunting due to the
overwhelming complexity of the female hormonal cycle. The cyclic changes in
circulating hormones may make it difficult at times to be confident that the results of a
study are not confounded by differences in the hormone levels between female subjects.
This barrier to female studies, however, is a major problem, as the majority of patients
affected by Alzheimer’s Disease (Zhao et al., 2015), autoimmune diseases (Rubtsova et
al., 2015) and anxiety-related disorders (McDermott et al., 2015) are female.
In an attempt remove at least one small part of this female hormonal barrier, the
present study examined how GPC metabolites changed over the course of the estrous
cycle in female mice, specifically in the hippocampus and TPE cortex. In the
hippocampus, abundances in 4 of the 6 detected metabolite families and approximately
one fifth (20.69%) of the metabolite species fluctuated with the estrous cycle, such that
proestrus was significantly decreased relative to estrus. In the TPE cortex however, the
abundances of the 9 detected GPC families did not fluctuate significantly with the estrous
cycle, and there was only 1 individual GPC metabolite whose abundance correlated with
the estrous cycle. Despite the differences in hormonal control, the majority of the species
detected were shared between these two brain regions; 93.10% of the hippocampal
species were also found in the TPE cortex, while 71.05% of the cortical species were also
found in the hippocampus.
The larger number of hormonally-regulated species in the hippocampus is not
altogether surprising, as the hippocampus is well known for cyclic alterations that
correspond to changes in the estrous cycle. Changes in dendritic spine density in

107
accordance with the estrous cycle stage have been well-documented in the literature, as
have changing levels of de novo estradiol synthesis. Dendritic spine density and de novo
estradiol levels were both found to be at their highest during proestrus (Kato et al., 2013),
and both correlated with GnRH levels (Fester et al., 2012, Brandt et al., 2013, Prange-
Kiel et al., 2013). GnRH release from hypothalamic neurons is triggered when serum
estradiol levels are high (Goldman et al., 2007, Caligioni, 2009, McLean et al., 2012,
Brandt et al., 2013, Prange-Kiel et al., 2013). The released GnRH travels to the
hippocampus, potentially through the CSF (Brandt et al., 2013, Prange-Kiel et al., 2013),
where it binds to GnRH receptors. The GnRH-GnRH receptor binding triggers de novo
estradiol synthesis and leads to an increase in dendritic spine density (Fester et al., 2012,
Brandt et al., 2013, Prange-Kiel et al., 2013).
This process appears to be unique to the hippocampus. The cortex has been found
to have relatively consistent dendritic spine densities (Fester et al., 2012), which could be
attributed to the lower density of GnRH receptors in comparison to the hippocampus
(Fester et al., 2012, Brandt et al., 2013, Prange-Kiel et al., 2013). Additionally, GnRH
receptor expression changes across the estrous cycle in the hippocampus, but it remains
consistent in the cortex; this could further explain the lack of change in dendritic spine
density in the cortex (Fester et al., 2012).
I propose that the increase in metabolite levels in the hippocampus during estrus
actually reflects the change in dendritic spine density. Dendritic spines are most
numerous during proestrus, and their density decreases during estrus (Kato et al., 2013);
meanwhile, GPC metabolites are low during proestrus and increase substantially during
estrus. Decreasing the number of dendritic spines would likely require hydrolyzing
Bennett
Typewritten Text
108
structural membrane lipids to reduce the size of the lipid membrane. Thus the increase in
GPC metabolites in estrus may actually reflect the loss of structural GPCs that had
formed the dendritic spine membranes. Furthermore PLA2 activity, responsible for GPC
hydrolysis (Kalyvas et al., 2009, Bou Khalil et al., 2010, Xu et al., 2013), is known to
increase as estradiol concentrations increase (Burlando et al., 2002, Seo et al., 2004), and
estradiol levels in the hippocampus have been documented to be highest during proestrus
(Kato et al., 2013). Thus during proestrus, when estradiol levels reach their peak and
dendritic spine numbers are at their maximum, PLA2 enzymes are likely to be activated.
This would lead to an increase in structural GPC hydrolysis of dendritic spines such that
during estrus, there would be increased GPC metabolite levels and a reduced number of
dendritic spines. This process is illustrated in Figure 3.5.
Based on this explanation, one might expect that all of the metabolites present in
the hippocampus should be increasing during estrus to reflect this significant remodeling.
The metabolites that do change, however, may actually represent the structural GPC
species that are enriched in dendritic spines. This enrichment is not unheard of in neural
membranes. Within synaptosomes, it has been found that there are enrichments of
particular lipids within different microdomains of the synapses (Bennett et al., 2013). It is
also well documented that lipid species in the membrane are often remodeled to reflect
the requirements of their environment (Frisardi et al., 2011, Bennett et al., 2013,
Morimoto et al., 2014). For example, membranes can be made less fluid and more rigid
by replacing unsaturated fatty acid chains with saturated fatty acid chains, thus allowing
for tighter packing of phospholipids (Bou Khalil et al., 2010, Klose et al., 2013).

109
Interestingly, there was also a significant change in the PAFX metabolites from
proestrus to estrus, where PAFX levels were higher during estrus. This cannot be
explained by the increase in PLA2 activity, as PAFXs are produced through the non-
enzymatic oxidative pathway (Marathe et al., 2000, Prescott et al., 2000). According to
the fluctuations in the levels of PAFX, it would appear that more of these oxidative
radical reactions were occurring during periods of low estrogen. This is not entirely
surprising, as estrogens are known to have antioxidant properties (Manolagas, 2010).
Treatment with 17-β estradiol was shown to reduce oxygen-mediated cell death in
primary oligodendrocyte cultures exposed to high oxygen levels (Gerstner et al., 2007).
Similarly, brain endothelial cells exposed to an ischemic insult (oxygen glucose
deprivation/reperfusion) sustained less cellular damage if they were pretreated with 17-β
estradiol (Shin et al., 2016). In OVX rats, which normally show higher levels of ROS in
the rostral ventrolateral medulla compared to control animals, injection of estrogen
returned ROS levels back to normal (Hao et al., 2016). Additionally, bone loss (such as in
osteoporosis) is believed to be caused at least in part by reduced levels of protective
estrogens and therefore an increase in ROS-mediated effects (Manolagas, 2010).
Altogether, this suggests that the non-enzymatic pathway is most active in the
hippocampus during periods of lower estrogen (such as estrus), when this anti-oxidant
hormone does not hamper ROS activity.
The results of this study demonstrate how important it is to take the female
hormonal cycle into account, especially in studies using the hippocampus. This region,
well-known for its instrumental role in memory formation, is used in studies examining
memory formation processes such as LTP, and in studies of memory-related neurological
110
disorders such as Alzheimer’s Disease. Although the present study examined only one
small aspect of lipid metabolism, it would be logical to expect a multitude of other
changes correlated with the female hormonal cycle to be occurring in the hippocampus.
Future research should thus focus on furthering our understanding of these estrous-related
changes in the hippocampus. Structural GPC levels should be examined, as should other
structural membrane lipid families as well as their metabolites. These studies would
further enhance our understanding of lipid metabolism across the estrous cycle, and may
illuminate other species that are enriched in dendritic spines. Conclusions about lipid
membrane metabolism could also be further fortified by examining PLA2 activity in the
hippocampus throughout the estrous cycle.

111
Figure 3.5 Proposed model of hormonal regulation of GPC metabolite levels in the hippocampus. During proestrus, serum and hippocampal estradiol levels peak. This is accomplished through GnRH receptors, which are more numerous in the hippocampus than the cortex. High serum estradiol triggers the release of GnRH, which can travel to the hippocampus and bind its GnRH receptor. GnRH receptor stimulation then triggers de novo estradiol synthesis, boosting estradiol levels in the hippocampus to their maximum and increasing dendritic spine density to its maximum. During estrus, however, dendritic spine density declines. It is possible that the high estradiol during proestrus may activate PLA2, which may then hydrolyze structural GPCs in the membranes of dendritic spines. Thus the surge in GPC metabolites during estrus may directly correspond to the decrease in dendritic spine density.

Bennett
Typewritten Text
112

113
3.7 CONCLUSION
Using lipidomic analysis, GPC metabolite levels were examined across the
estrous cycle in the hippocampus and TPE cortex of female C57BL/6J x C3h/HeJ mice.
Hormonally-regulated GPC remodeling was found in two thirds of the metabolite
families and one fifth of the individual species in the hippocampus. In the TPE cortex,
however, there was little cyclic remodeling that correlated with the estrous cycle. This
selective hippocampal remodeling may reflect the cyclic changes in hippocampal
dendritic spine densities that occur in response to cycling estrogen levels. Any studies
using hippocampal tissue from female subjects should thus take the female hormonal
cycle into account when interpreting their results.
Bennett
Typewritten Text

114
CHAPTER FOUR
4.1 SUMMARY OF RESULTS
In this thesis, I investigated whether GPC metabolites changed over the course of
EAE in the hippocampus and TPE cortex of female C57BL/6J mice, and controlled for
possible effects of the estrous cycle in these same brain regions using healthy C57BL/6J
x C3h/HeJ female mice. Based on literature findings documenting PLA2 activity during
EAE and various pathways that GPC metabolites are involved in, I hypothesized that
there would be an increase in GPC metabolites during EAE. To test this hypothesis,
GPCs were extracted from the hippocampus and the TPE cortex of mice using an
acidified Bligh and Dyer method, and GPC metabolites were quantified using LC-ESI-
MSp. Contrary to my hypothesis, 3 of the 8 metabolite families in the hippocampus and
6.94% of the individual species were significantly decreased during EAE relative to
healthy, uninjured controls. In the TPE cortex, there were no significant changes in the 9
metabolite families detected, but there was a decrease in 6.25% of the species during
EAE. In the hippocampus of the estrous-staged mice, two thirds of the metabolite
families and 20.69% of the GPC metabolite species cyclically changed over the course of
the estrous cycle, such that the levels were significantly lower during proestrus compared
to estrus. There was little cyclic remodelling in the TPE cortex, with no changes in
metabolite families and only one species significantly altered across the estrous cycle.
115
4.2 DIFFERENCES IN GPC METABOLISM BETWEEN THE HIPPOCAMPUS AND TPE CORTEX ARE LIKELY DUE TO DIFFERENCES IN ENZYMATIC REGULATION In both of the studies presented in this thesis, there was a clear difference between
hippocampus and TPE cortex GPC remodeling. Though both hippocampus (72 species in
total) and TPE cortex (80 species in total) had five species that varied significantly during
EAE relative to healthy controls, the five species modified in each region were not the
same. This is very interesting, as 60 species were shared between the two regions
(including the 5 species modified in each region). Similarly, the estrous cycle affected the
hippocampus (58 species in total) to a much greater degree than the TPE cortex (76
species in total), despite 54 species being shared between the two regions. In the healthy
animals in both studies, the hippocampus in general had higher abundances of
metabolites. Thus despite the hippocampus and TPE cortex possessing many of the same
metabolite species, the GPC metabolism between the regions differed in healthy
conditions and in response to inflammation.
These regionally distinct brain lipidomes are likely indicative of regionally
specific metabolic pathways. There are at least four unique LPCAT enzymes (Shindou et
al., 2009, Shindou et al., 2013) and at least 24 mammalian genes encoding PLA2
enzymes (Schaeffer et al., 2009) as well as a multitude of PLA2 splice variants (Ghosh et
al., 2006). In the brain specifically, the Allen Brain Atlas (Allen Institute for Brain
Science, 2015) has documented the presence of several different mRNA transcripts of
LPCAT and PLA2 isoforms in male C57BL/6J mice. Expression of LPCAT2 and
LPCAT3 are lowest in both the hippocampal formation (including the hippocampus and
the entorhinal cortex) and the isocortex (including the temporal and parietal association

116
areas) to approximately the same degree. The most abundant LPCAT in these regions by
far is LPCAT4, which is more abundant in the isocortex than the hippocampal formation
(Allen Institute for Brain Science, 2015). For PLA2, isoforms from group IIF (sPLA2
(Rosa and Rapoport, 2009, Schaeffer et al., 2009)), IVE (cPLA2 (Ghosh et al., 2006,
Rosa and Rapoport, 2009, Schaeffer et al., 2009, Leslie, 2015)), V (sPLA2 (Ghosh et al.,
2006, Rosa and Rapoport, 2009, Schaeffer et al., 2009)), VII (PAF-AH (Schaeffer et al.,
2009)), XV (lysosomal PLA2 (Shayman et al., 2011)), and XVI (adipose-specific PLA2
(Duncan et al., 2008, Pang et al., 2012)) are reported in the isocortex and hippocampal
formation (Allen Institute for Brain Science, 2015). PLA2-IIF and PLA2-XVI are
approximately equally expressed in the hippocampal formation and the isocortex. PLA2-
IVE is only slightly higher in the isocortex, while PLA2-V is only slightly higher in the
hippocampal formation. PLA2-XV and PLA2-VII transcripts are both more abundant in
the hippocampal formation. Of these PLA2s, the most highly expressed enzymes in both
regions are PLA2-IVE, followed by PLA2-V (Allen Institute for Brain Science, 2015).
Thus, expression levels vary between brain regions studied in this thesis yet no enzymes
are unique to one region in particular. The question arising is whether these mRNA
levels reflect protein levels, and then whether protein levels are indicative of regionally
specific enzymatic activity. Clearly activity and substrate affinity in each brain region
will require assessment.
Critical to discussions of sex differences, the Allen Brain Atlas uses only male
C57BL/6J mice (Allen Institute for Brain Science, 2015), while both studies in this thesis
analyzed female mice. This may be an issue, as there are documented sexual
dimorphisms in the brain (Cerghet et al., 2006). The Land’s cycle itself may be affected
117
by sex, as PAF levels (Alecozay et al., 1989, Seo et al., 2004), LPC levels (Chen et al.,
2005), PLA2 activity (Burlando et al., 2002, Seo et al., 2004, Chen et al., 2005), PAF-AH
activity (Miyaura et al., 1991, Yasuda and Johnston, 1992, Ihara et al., 1993, Satoh et al.,
1993), and LPCAT acetyltransferase activity (Ihara et al., 1993) have been shown to be
responsive to female sex hormones. It is thus possible that GPC metabolism and therefore
Land’s cycle enzyme transcripts may differ between males and females.
Mouse strain may also influence GPC metabolism. Here, I used C57BL/6J mice,
compared enzymatic patterns in the same strain to the Allen Brain Atlas (Allen Institute
for Brain Science, 2015), yet used C57BL/6J x C3h/HeJ mice in the estrous study simply
due to exigencies of mouse availability in our colonies. However, there was a large
degree of overlap found between the strains in this thesis. The female C57BL/6J and
female C57BL/6J x C3h/HeJ hippocampi shared 52 species, accounting for 72.22% of the
C57BL/6J and 89.66% of the C57BL/6J x C3h/HeJ hippocampal lipidomes. The TPE
cortices shared 62 species, accounting for 77.50% of the C57BL/6J and 81.58% of the
C57BL/6J x C3h/HeJ TPE cortex lipidomes. The distribution of species within metabolite
families was also very similar between the regions in the two studies. These comparisons
suggest that the GPC lipidome is comparable between the two strains.
There are precedents that support my hypothesis that Land’s cycle metabolism is
regulated differently from region to region. Literature for PLA2 activity in the spinal cord
during EAE, for example, suggests that increases in cPLA2 (Kalyvas and David, 2004,
Marusic et al., 2005, Kihara et al., 2008, Marusic et al., 2008, Kalyvas et al., 2009,
Thakker et al., 2011) and sPLA2 activity (Cunningham et al., 2006, Kihara et al., 2008,
Kalyvas et al., 2009) are associated with EAE. The results in this thesis, however, do not
118
agree with the spinal cord-EAE literature. There were no increases in any of the detected
GPC metabolites or their families during EAE in the hippocampus or the TPE cortex,
which would have implied an increase in PLA2 activity. This discrepancy between the
hippocampus/TPE cortex results and the spinal cord literature further builds on the
regional dichotomy between the hippocampus and TPE cortex documented in this thesis,
implying that there are regional differences in Land’s cycle enzyme activity within the
CNS, and that the anatomical structure being studied is an important factor in GPC
metabolism studies.
There is another possible explanation for the discrepancy between spinal cord and
predicted hippocampus/TPE cortex PLA2 activity during EAE. It is conceivable that the
inflammation induced by EAE did not affect the brain regions studied in this thesis.
Ziehn et al. (2010) did document the presence of hippocampal damage early on in EAE;
notably, they found activated microglia/macrophages in the hippocampus. To ensure that
the hippocampus and TPE cortex in this thesis were affected by EAE, it would be prudent
to examine both regions at onset, peak and remission for the presence of Iba-1, which is a
marker of activated microglia and macrophages (Ziehn et al., 2012).
Furthermore, the cytokine IFN-γ, which plays a role in activating LPCAT
acyltransferase activity in monocytic cells (Neville et al., 2005) and permeabilizing the
BBB for further immune cell infiltration (Kebir et al., 2007, Kebir et al., 2009), is
released by infiltrating Th1, Th17 and Il-17/IFN-γ T-cells. These CD4+ T-cells are
thought to play a role in EAE pathogenesis and are differentiated early in the disease in
response to factors released by degranulating platelets (Starossom et al., 2015). IFN-γ
levels in the hippocampus of female C57BL/6J mice with EAE were increased just prior

119
to clinical EAE onset (Dutra et al., 2013). Similarly, hippocampal extracts from Lewis
rats with EAE were also found to have significantly increased IFN-γ when their
hindlimbs were completely paralyzed (Aguado-Llera et al., 2011). Thus assessing the
hippocampus and TPE cortex at onset, peak and remission for IFN-γ as well as Iba-1 may
allow us to determine whether these brain regions were exposed to immunological insults
over the course of EAE, and thus whether the changes in GPC metabolites in EAE mice
(relative to controls) could be due to inflammation.
Another possible concern with the EAE study is the use of completely uninjured
controls rather than CFA-injected controls, as CFA is a potent immune adjuvant that
could potentially affect GPC metabolism. Based on literature results however, this seems
unlikely. Acharjee et al. (2013) and Dutra et al. (2013) both performed Morris water
maze testing on female C57BL/6 mice induced with EAE. Acharjee et al. (2013)
however, used CFA-injected controls, while Dutra et al. (2013) used saline-injected
controls. In both cases, the EAE mice were more impaired than the controls. Similarly,
Novkovic et al. (2015) used a cookie finding test and detected impairments in spatial
memory in late phase EAE compared to ovalbumin (OVA)-CFA-PTX injected controls.
They also examined late-phase LTP and action potential firing rates in the hippocampus
of not only the EAE animals and the OVA-CFA-PTX controls, but also OVA-CFA
injected controls. There was a significant decrease in LTP and impaired action potential
firing in the EAE group relative to both control groups, but there was no significant
difference between the control groups (Novkovic et al., 2015).
Biochemically, there are also several studies that suggest that CFA does not
change brain function on its own. When examining synapse markers in the hippocampus

120
of early EAE animals, Ziehn et al. (2010) found that there was a significant decrease in
Syn-1 in EAE animals relative to both healthy controls and CFA-injected controls. In an
experiment assessing the permeability of the BBB in EAE mice, Seo et al. (2015) injected
Evan’s blue dye into EAE mice and CFA-PTX injected controls. There was significantly
higher dye leakage into the EAE brain than the control brain, suggesting that CFA and
PTX on their own do not vastly alter BBB permeability. Similarly, Murugesan (2012)
examined the choroid plexus in EAE animals, CFA-PTX controls and uninjured controls.
Preclinically, the CFA-PTX controls were more similar to the EAE group in terms of
expression of immune-related genes; by EAE onset however, the CFA-PTX choroid
plexus was less inflamed and more similar to the uninjured controls. In comparison, there
was further inflammatory gene expression and T-cell markers present in the EAE choroid
plexus at EAE onset. These results suggest that CFA and PTX play a critical role in
priming the BBB for EAE, but that the myelin antigen is critical in actually triggering
EAE (Murugesan, 2012). Another interesting study by Radu et al. (2007) examined
glycolysis in the spinal cord of EAE animals. They used not only uninjured controls, but
also CFA-MOG injected controls. Although the CFA-MOG group demonstrated a
prominent peripheral immune reaction, glycolysis in the spinal cord was not affected in
this control group (whereas it was modified in the EAE animals). Together, all of these
studies suggest that although CFA is important for the induction of EAE, it does not
affect the CNS unless it is paired with both PTX and MOG. Therefore in studies
examining EAE tissue from the periphery, CFA-injected controls would be critical.
However, as this study only deals with CNS tissue, CFA is very likely not a confounding

121
factor in the obtained results. Thus the more critical question is still whether there was
inflammatory damage in the hippocampus and TPE cortex during EAE.
Even should it be found that the EAE paradigm did not result in immunological
invasion of the hippocampus or TPE cortex, there is still evidence that the hippocampus
and TPE cortex are differentially regulated. Pathologically, there are examples in the
literature of differing hippocampus-cortex responses to the same stimulus. For example,
exposure to sepsis resulted in inhibition of Na+/K+ ATPase activity in the hippocampus
after 24 hours, and the enzyme remained inactive even when treated with anti-oxidants.
In the cortex, however, the enzyme was inhibited only 6 hours post-sepsis exposure, but
its activity was preserved when anti-oxidants were administered (Jeremias et al., 2012).
In another study examining hypoxia-ischemia, microglia activation differed between the
hippocampus and cortex in rat pups; hippocampal microglial activation was strongest 24
and 48 hours post hypoxia-ischemia, while cortical microglial activation was strongest at
48 and 72 hours post hypoxia-ischemia (Furukawa et al., 2014). In non-pathological
conditions, the healthy control animals in the EAE study and the animals in the estrous
study showed that shared metabolite families were more abundant in the hippocampus
than the TPE cortex. Furthermore, GPC remodelling in the hippocampus was more
extensive than in the TPE cortex; this was especially true in response to the estrous cycle,
where differences in GnRH receptor expression (Fester et al., 2012, Brandt et al., 2013,
Prange-Kiel et al., 2013) may play a role in regulating PLA2 activity.
To fully understand how the Land’s cycle differs between the hippocampus and
TPE cortex, future work should focus on understanding regulation of the enzymes
involved in the Land’s cycle under pathological and non-pathological conditions. In the

122
female hippocampus and TPE cortex specifically, it would be prudent to examine activity
of the most abundant PLA2 and LPCAT isoforms in these regions (LPCAT4, PLA2-IVE
and PLA2-V (Allen Institute for Brain Science, 2015)) during each stage of the estrous
cycle as well as during inflammation. It would also be worthwhile to examine both
LPCAT2, whose activity increases under inflammatory conditions (Shindou et al., 2009,
Shindou et al., 2013, Morimoto et al., 2014), and PLA2-VII (PAF-AH), which is also
increased during inflammation (Stafforini, 2009) and possesses transacetylase activity
(Servillo et al., 2006).
4.3 SUMMARY: EFFECTS OF PATHOLOGICAL AND NON-PATHOLOGICAL CONDITIONS ON GPC METABOLISM ARE NOT GENERALIZABLE BETWEEN BRAIN REGIONS
The results from the EAE and estrous studies presented in this thesis along with
literature findings together suggest that the cortex and hippocampus have differential
regulation of GPC metabolites, despite having similar GPC lipidomes and likely similar
PLA2 and LPCAT expression profiles. Interestingly, the hippocampus-TPE cortex
patterns are similar between the two different mouse strains used in this thesis. The
C57BL/6J and C57BL/6J x C3h/HeJ strains were found to be comparable in terms of
their metabolite lipidomes, suggesting that results regarding hormonal control of GPC
metabolites from the estrous study are applicable to the EAE study, effectively
controlling for the hormonal control of GPC metabolites.
In the hippocampus, the hormonal cycle is likely not responsible for the
metabolite decreases found during EAE. Of the 5 decreased species, 2 were unique to the
C57BL/6J hippocampus; the other 3 were found to be unaffected by the estrous cycle. As
an entire family, the LPCs and PAFs, which were decreased during EAE, were not under

123
hormonal control. The PPAFs, however, were decreased during EAE and modified
according to the estrous cycle. This could be due to the fact that the species PC(P-
20:0/2:0), which was significantly decreased during EAE, was unique to the C57BL/6J
hippocampus; the other two PPAFs, which were common to both strains, were not
significantly altered by EAE. Furthermore, of the 12 species and 4 families under
hormonal control in the C57BL/6J x C3h/HeJ hippocampus, 10 of the species and 3 of
the families (excluding the PPAFs) were also found in the C57BL/6J hippocampus, but
were not affected by EAE.
Similarly in the TPE cortex, the hormonal cycle cannot explain the decreases
found during EAE. The one species found to be under hormonal control and the 5 species
that were decreased significantly during EAE were found in both the C57BL/6J and
C57BL/6J x C3h/HeJ TPE cortices. There were no metabolite families significantly
altered by the estrous cycle or by EAE in this brain region.
Together, these results suggest that the hippocampus is more susceptible to GPC
remodeling than the TPE cortex. This would not be surprising, as the hippocampus is
heavily involved in processes of LTP, which requires PAF (Bazan et al., 1997, Chen et
al., 2001) as a retrograde messenger (Bazan et al., 1997, Mazereeuw et al., 2013).
Additionally, there are changes in hippocampal dendritic spine density on a regular basis
according to the estrous cycle, a process which is not found in the cortex (Fester et al.,
2012, Brandt et al., 2013, Prange-Kiel et al., 2013). This difference in susceptibility is
likely linked to how Land’s cycle enzymes are regulated, which appears to be different
between the hippocampus and the TPE cortex. For example, GnRH receptor expression
and the resulting de novo estradiol production (Fester et al., 2012, Brandt et al., 2013,

124
Prange-Kiel et al., 2013) appears to be key in regulating PLA2 (Burlando et al., 2002,
Seo et al., 2004) activity during the estrous cycle, and may explain why the same
hormonal fluctuations have drastically different effects on the hippocampus and TPE
cortex.
These results also suggest that inflammation induces the activity of a different
subset of Land’s cycle enzymes in comparison to the enzymes that are active in a
normally cycling, healthy animal. Inflammation is hypothesized then to result in
activation of different enzymes that create different metabolites, rather than merely
increasing the production of the ‘regular’ metabolites. For example, the acetyltransferase
activity of LPCAT2 is induced by inflammatory signals (Shindou et al., 2009, Shindou et
al., 2013, Morimoto et al., 2014), while LPCAT1 acetyltransferase is constitutively active
(Shindou et al., 2009, Shindou et al., 2013). Similarly, the transacetylase activity of PAF-
AH is often induced in activated endothelial cells (Balestrieri et al., 2003). This increased
transacetylase activity was found to selectively result in more APAF production
(Balestrieri and Lee, 2000, Balestrieri et al., 2003) and lowered PAF levels (Balestrieri et
al., 2003, Servillo et al., 2006).
Assuming that there is inflammatory damage incurred by EAE in the
hippocampus and TPE cortex, this thesis provides evidence that GPC remodelling is
regulated differently under pathological and non-pathological conditions. There is also
evidence that this regulation differs between brain regions within the same condition,
suggesting that GPC metabolism is not homologous across the entire brain, or even
across regions that are in close proximity to each other. These results are summarized in
Figure 4.1. Future studies examining GPC metabolism should thus consider that

125
remodelling enzymes may be differentially regulated in different regions of the CNS, and
that regulation of GPC metabolism under various physiological conditions cannot
necessarily be generalized from one region to the next, especially when considering the
effects of inflammation or fluctuating hormone levels.

126
Figure 4.1 Comparison of GPC metabolism in the hippocampus and TPE cortex under pathological and non-pathological conditions. Different aspects pertaining to GPC metabolism are compared in the same brain region under different conditions, and in different brain regions under the same conditions. An example of a non-pathological condition is the estrous cycle, and an example of a pathological condition is EAE, particularly the EAE-induced inflammation. Based on analysis of GPC metabolites present in different brain regions under varying conditions, the GPC metabolites and the Land’s cycle enzymes appear to stay approximately the same, regardless of the brain region or the condition the tissue is exposed to. However, the regulation of these enzymes is hypothesized to fluctuate depending on the condition and the brain region, as evidenced by the differing abundances of GPC metabolites detected in each scenario. Overall, GPC metabolism is not generalizable between conditions or between brain regions.

Bennett
Typewritten Text
127

128
REFERENCES (2015) Allen developing mouse brain atlas [internet]. http://developingmousebrain-
map.org: Allen Institute for Brain Science. Acharjee S, Nayani N, Tsutsui M, Hill MN, Ousman SS, Pittman QJ (2013) Altered
cognitive-emotional behavior in early experimental autoimmune encephalitis--cytokine and hormonal correlates. Brain, behavior, and immunity 33:164-172.
Adibhatla RM, Dempsy R, Hatcher JF (2008) Integration of cytokine biology and lipid metabolism in stroke. Frontiers in bioscience : a journal and virtual library 13:1250-1270.
Adibhatla RM, Hatcher JF (2008) Altered lipid metabolism in brain injury and disorders. Sub-cellular biochemistry 49:241-268.
Aguado-Llera D, Puebla-Jimenez L, Barrios V, Hernandez-Pinto A, Arilla-Ferreiro E (2011) Role of ethanolamine phosphate in the hippocampus of rats with acute experimental autoimmune encephalomyelitis. Neurochemistry international 58:22-34.
Alecozay AA, Casslen BG, Riehl RM, Deleon FD, Harper MJ, Silva M, Nouchi TA, Hanahan DJ (1989) Platelet-activating factor in human luteal phase endometrium. Biology of reproduction 41:578-586.
Amato MP, Zipoli V, Portaccio E (2006) Multiple sclerosis-related cognitive changes: a review of cross-sectional and longitudinal studies. Journal of the neurological sciences 245:41-46.
Andersson H, Rehm S, Stanislaus D, Wood CE (2013) Scientific and regulatory policy committee (SRPC) paper: assessment of circulating hormones in nonclinical toxicity studies III. female reproductive hormones. Toxicologic pathology 41:921-934.
Audoin BD, M., V., A.; Malikova, I.; Confort-Gouny, S.; Ibarrola, D.; Cozzone, P., J.; Pelletier, J.; Ranjeva, J. (2006) Functional magnetic resonance imaging and cognition at the very early stage of MS. Journal of the neurological sciences 245:87-91.
Baker RR (2000) Lipid acetylation reactions and the metabolism of platelet-activating factor. Neurochemical research 25:677-683.
Balestrieri ML, Castaldo D, Balestrieri C, Quagliuolo L, Giovane A, Servillo L (2003) Modulation by flavonoids of PAF and related phospholipids in endothelial cells during oxidative stress. Journal of lipid research 44:380-387.
Balestrieri ML, Lee T (2000) Regulation of the biosynthesis of acyl analogs of platelet-activating factor by purinergic agonist in endothlial cells. FEBS letters 479:63-66.
Balsinde J, Balboa MA (2005) Cellular regulation and proposed biological functions of group VIA calcium-independent phospholipase A2 in activated cells. Cellular signalling 17:1052-1062.
Balsinde J, Perez R, Balboa MA (2006) Calcium-independent phospholipase A2 and apoptosis. Biochimica et biophysica acta 1761:1344-1350.
Bazan NG, Packard MG, Teather L, Allan G (1997) Bioactive lipids in excitatory neurotransmission and neuronal plasticity. Neurochemistry international 30:225-231.
Bennett
Typewritten Text
129
Bechmann I, Galea I, Perry VH (2007) What is the blood-brain barrier (not)? Trends in immunology 28:5-11.
Beckett CS, Kell PJ, Creer MH, McHowat J (2007) Phospholipase A2-catalyzed hydrolysis of plasmalogen phospholipids in thrombin-stimulated human platelets. Thrombosis research 120:259-268.
Ben-Nun A, Kaushansky N, Kawakami N, Krishnamoorthy G, Berer K, Liblau R, Hohlfeld R, Wekerle H (2014) From classic to spontaneous and humanized models of multiple sclerosis: impact on understanding pathogenesis and drug development. J Autoimmun 54:33-50.
Bennett SA, Valenzuela N, Xu H, Franko B, Fai S, Figeys D (2013) Using neurolipidomics to identify phospholipid mediators of synaptic (dys)function in Alzheimer's Disease. Frontiers in physiology 4:168.
Berard JL, Wolak K, Fournier S, David S (2010) Characterization of relapsing-remitting and chronic forms of experimental autoimmune encephalomyelitis in C57BL/6 mice. Glia 58:434-445.
Berard JLW, K.; Fournier, S.; David, S. (2010) Characterization of relapsing-remitting and chronic forms of experimental autoimmune encephalomyelitis in C57BL/6 mice. Glia 58:434-445.
Bittner S, Afzali AM, Wiendl H, Meuth SG (2014) Myelin oligodendrocyte glycoprotein (MOG35-55) induced experimental autoimmune encephalomyelitis (EAE) in C57BL/6 mice. Journal of visualized experiments : JoVE.
Blanchard A, P.; Wang, Y.; Taylor, G., P.; Granger, M., W.; Fai, S.; Figeys, D.; Paus, T.; SYS Consortium; Xu, H.; Pausova, Z.; Bennett, S., A., L. (2015) Retention time standardization and registration (RTStaR): A simple algorithm that matches corresponding and identifies unique species in liquid chromatography-electrospray ionization-mass spectrometry lipidomic datasets. Under review
Bou Khalil M, Hou W, Zhou H, Elisma F, Swayne LA, Blanchard AP, Yao Z, Bennett SA, Figeys D (2010) Lipidomics era: accomplishments and challenges. Mass spectrometry reviews 29:877-929.
Boulanger JJ, Messier C (2014) From precursors to myelinating oligodendrocytes: contribution of intrinsic and extrinsic factors to white matter plasticity in the adult brain. Neuroscience 269:343-366.
Brandt N, Vierk R, Rune GM (2013) Sexual dimorphism in estrogen-induced synaptogenesis in the adult hippocampus. The International journal of developmental biology 57:351-356.
Burlando B, Marchi B, Panfoli I, Viarengo A (2002) Essential role of Ca2+ -dependent phospholipase A2 in estradiol-induced lysosome activation. American journal of physiology Cell physiology 283:C1461-1468.
Calabrese M, Reynolds R, Magliozzi R, Castellaro M, Morra A, Scalfari A, Farina G, Romualdi C, Gajofatto A, Pitteri M, Benedetti MD, Monaco S (2015) Regional Distribution and Evolution of Gray Matter Damage in Different Populations of Multiple Sclerosis Patients. PloS one 10:e0135428.
Caligioni CS (2009) Assessing reproductive status/stages in mice. Current protocols in neuroscience / editorial board, Jacqueline N Crawley [et al] Appendix 4:Appendix 4I.
130
Callea L, Arese M, Orlandini A, Bargnani C, Priori A, Bussolino F (1999) Platelet activating factor is elevated in cerebral spinal fluid and plasma of patients with relapsing-remitting multiple sclerosis. Journal of neuroimmunology 94:212-221.
Cerghet M, Skoff RP, Bessert D, Zhang Z, Mullins C, Ghandour MS (2006) Proliferation and death of oligodendrocytes and myelin proteins are differentially regulated in male and female rodents. The Journal of neuroscience : the official journal of the Society for Neuroscience 26:1439-1447.
Chen C, Magee JC, Marcheselli V, Hardy M, Bazan NG (2001) Attenuated LTP in hippocampal dentate gyrus neurons of mice deficient in the PAF receptor. Journal of neurophysiology 85:384-390.
Chen WY, Ni Y, Pan YM, Shi QX, Yuan YY, Chen AJ, Mao LZ, Yu SQ, Roldan ER (2005) GABA, progesterone and zona pellucida activation of PLA2 and regulation by MEK-ERK1/2 during acrosomal exocytosis in guinea pig spermatozoa. FEBS letters 579:4692-4700.
Chishti MA, Yang DS, Janus C, Phinney AL, Horne P, Pearson J, Strome R, Zuker N, Loukides J, French J, Turner S, Lozza G, Grilli M, Kunicki S, Morissette C, Paquette J, Gervais F, Bergeron C, Fraser PE, Carlson GA, George-Hyslop PS, Westaway D (2001) Early-onset amyloid deposition and cognitive deficits in transgenic mice expressing a double mutant form of amyloid precursor protein 695. J Biol Chem 276:21562-21570.
Choy PC, Skrzypczak M, Lee D, Jay FT (1997) Acyl-GPC and alkenyl/alkyl-GPC:acyl-CoA acyltransferases. Biochimica et biophysica acta 1348:124-133.
Compston A, Coles A (2002) Multiple sclerosis. Lancet 359:1221-1231. Constantinescu CSF, N.; O'Brien, K.; Gran, B. (2011) Experimental autoimmune
encephalomyelitis (EAE) as a model for multiple sclerosis (MS). Br J Pharmacol 164:1079-1106.
Creer MH, McHowat J (1998) Selective hydrolysis of plasmalogens in endothelial cells following thrombin stimulation. The American journal of physiology 275:C1498-1507.
Cross AH, Naismith RT (2014) Established and novel disease-modifying treatments in multiple sclerosis. Journal of internal medicine 275:350-363.
Cunningham TJ, Yao L, Oetinger M, Cort L, Blankenhorn EP, Greenstein JI (2006) Secreted phospholipase A2 activity in experimental autoimmune encephalomyelitis and multiple sclerosis. Journal of neuroinflammation 3:26.
De Stefano N, Narayanan S, Francis GS, Arnaoutelis R, Tartaglia MC, Antel JP, Matthews PM, Arnold DL (2001) Evidence of axonal damage in the early stages of multiple sclerosis and its relevance to disability. Archives of neurology 58:65-70.
Del Boccio P, Pieragostino D, Di Ioia M, Petrucci F, Lugaresi A, De Luca G, Gambi D, Onofrj M, Di Ilio C, Sacchetta P, Urbani A (2011) Lipidomic investigations for the characterization of circulating serum lipids in multiple sclerosis. Journal of proteomics 74:2826-2836.
Dickens AM, Larkin JR, Griffin JL, Cavey A, Matthews L, Turner MR, Wilcock GK, Davis BG, Claridge TD, Palace J, Anthony DC, Sibson NR (2014) A type 2 biomarker separates relapsing-remitting from secondary progressive multiple sclerosis. Neurology 83:1492-1499.
131
Duncan RE, Sarkadi-Nagy E, Jaworski K, Ahmadian M, Sul HS (2008) Identification and functional characterization of adipose-specific phospholipase A2 (AdPLA). The Journal of biological chemistry 283:25428-25436.
Dutra RC, Moreira EL, Alberti TB, Marcon R, Prediger RD, Calixto JB (2013) Spatial reference memory deficits precede motor dysfunction in an experimental autoimmune encephalomyelitis model: the role of kallikrein-kinin system. Brain, behavior, and immunity 33:90-101.
Ellwardt E, Zipp F (2014) Molecular mechanisms linking neuroinflammation and neurodegeneration in MS. Experimental neurology 262 Pt A:8-17.
Farjam M, Zhang GX, Ciric B, Rostami A (2015) Emerging immunopharmacological targets in multiple sclerosis. Journal of the neurological sciences.
Farooqui AA (2009) Lipid mediators in the neural cell nucleus: their metabolism, signaling, and association with neurological disorders. The Neuroscientist : a review journal bringing neurobiology, neurology and psychiatry 15:392-407.
Farooqui AA, Horrocks LA (2001) Plasmalogens, phospholipase A2, and docosahexaenoic acid turnover in brain tissue. Journal of molecular neuroscience : MN 16:263-272; discussion 279-284.
Farooqui AA, Horrocks LA, Farooqui T (2000) Glycerophospholipids in brain: their metabolism, incorporation into membranes, functions, and involvement in neurological disorders. Chemistry and physics of lipids 106:1-29.
Farooqui AA, Horrocks LA, Farooqui T (2007) Modulation of inflammation in brain: a matter of fat. Journal of neurochemistry 101:577-599.
Farooqui AA, Ong WY, Horrocks LA (2004) Biochemical aspects of neurodegeneration in human brain: involvement of neural membrane phospholipids and phospholipases A2. Neurochemical research 29:1961-1977.
Felicio LS, Nelson JF, Finch CE (1984) Longitudinal studies of estrous cyclicity in aging C57BL/6J mice: II. Cessation of cyclicity and the duration of persistent vaginal cornification. Biology of reproduction 31:446-453.
Fester L, Prange-Kiel J, Zhou L, Blittersdorf BV, Bohm J, Jarry H, Schumacher M, Rune GM (2012) Estrogen-regulated synaptogenesis in the hippocampus: sexual dimorphism in vivo but not in vitro. The Journal of steroid biochemistry and molecular biology 131:24-29.
Fisher E, Lee JC, Nakamura K, Rudick RA (2008) Gray matter atrophy in multiple sclerosis: a longitudinal study. Annals of neurology 64:255-265.
Foroughipour A, Norbakhsh V, Najafabadi SH, Meamar R (2012) Evaluating sex hormone levels in reproductive age women with multiple sclerosis and their relationship with disease severity. Journal of research in medical sciences : the official journal of Isfahan University of Medical Sciences 17:882-885.
Frisardi V, Panza F, Seripa D, Farooqui T, Farooqui AA (2011) Glycerophospholipids and glycerophospholipid-derived lipid mediators: a complex meshwork in Alzheimer's disease pathology. Progress in lipid research 50:313-330.
Furukawa S, Sameshima H, Yang L, Harishkumar M, Ikenoue T (2014) Regional differences of microglial accumulation within 72 hours of hypoxia-ischemia and the effect of acetylcholine receptor agonist on brain damage and microglial activation in newborn rats. Brain research 1562:52-58.

132
Gaby A (2013) Multiple sclerosis. Global advances in health and medicine : improving healthcare outcomes worldwide 2:50-56.
Galea I, Bechmann I, Perry VH (2007) What is immune privilege (not)? Trends in immunology 28:12-18.
Garcia-Alloza M, Robbins EM, Zhang-Nunes SX, Purcell SM, Betensky RA, Raju S, Prada C, Greenberg SM, Bacskai BJ, Frosch MP (2006) Characterization of amyloid deposition in the APPswe/PS1dE9 mouse model of Alzheimer disease. Neurobiol Dis 24:516-524.
Gerstner B, Sifringer M, Dzietko M, Schuller A, Lee J, Simons S, Obladen M, Volpe JJ, Rosenberg PA, Felderhoff-Mueser U (2007) Estradiol attenuates hyperoxia-induced cell death in the developing white matter. Annals of neurology 61:562-573.
Ghosh M, Tucker DE, Burchett SA, Leslie CC (2006) Properties of the Group IV phospholipase A2 family. Progress in lipid research 45:487-510.
Goldman JM, Murr AS, Cooper RL (2007) The rodent estrous cycle: characterization of vaginal cytology and its utility in toxicological studies. Birth defects research Part B, Developmental and reproductive toxicology 80:84-97.
Guglielmotto M, Tamagno E, Danni O (2009) Oxidative stress and hypoxia contribute to Alzheimer's disease pathogenesis: two sides of the same coin. TheScientificWorldJournal 9:781-791.
Hao F, Gu Y, Tan X, Deng Y, Wu ZT, Xu MJ, Wang WZ (2016) Estrogen Replacement Reduces Oxidative Stress in the Rostral Ventrolateral Medulla of Ovariectomized Rats. Oxidative medicine and cellular longevity 2016:2158971.
Harayama T, Shindou H, Ogasawara R, Suwabe A, Shimizu T (2008) Identification of a novel noninflammatory biosynthetic pathway of platelet-activating factor. The Journal of biological chemistry 283:11097-11106.
Harris MG, Fabry Z (2012) Initiation and regulation of CNS autoimmunity: balancing immune surveillance and inflammation in the CNS. Neuroscience & Medicine 3:203-224.
Heusler P, Boehmer G (2007) Platelet-activating factor contributes to the induction of long-term potentiation in the rat somatosensory cortex in vitro. Brain research 1135:85-91.
Ihara Y, Frenkel RA, Johnston JM (1993) Hormonal regulation of platelet-activating factor-acetyltransferase activity in rat tissues. Archives of biochemistry and biophysics 304:503-507.
International Multiple Sclerosis Genetics C, Wellcome Trust Case Control C, Sawcer S, Hellenthal G, Pirinen M, Spencer CC, Patsopoulos NA, Moutsianas L, Dilthey A, Su Z, Freeman C, Hunt SE, Edkins S, Gray E, Booth DR, Potter SC, Goris A, Band G, Oturai AB, Strange A, Saarela J, Bellenguez C, Fontaine B, Gillman M, Hemmer B, Gwilliam R, Zipp F, Jayakumar A, Martin R, Leslie S, Hawkins S, Giannoulatou E, D'Alfonso S, Blackburn H, Martinelli Boneschi F, Liddle J, Harbo HF, Perez ML, Spurkland A, Waller MJ, Mycko MP, Ricketts M, Comabella M, Hammond N, Kockum I, McCann OT, Ban M, Whittaker P, Kemppinen A, Weston P, Hawkins C, Widaa S, Zajicek J, Dronov S, Robertson N, Bumpstead SJ, Barcellos LF, Ravindrarajah R, Abraham R, Alfredsson L, Ardlie K, Aubin C, Baker A, Baker K, Baranzini SE, Bergamaschi L,

133
Bergamaschi R, Bernstein A, Berthele A, Boggild M, Bradfield JP, Brassat D, Broadley SA, Buck D, Butzkueven H, Capra R, Carroll WM, Cavalla P, Celius EG, Cepok S, Chiavacci R, Clerget-Darpoux F, Clysters K, Comi G, Cossburn M, Cournu-Rebeix I, Cox MB, Cozen W, Cree BA, Cross AH, Cusi D, Daly MJ, Davis E, de Bakker PI, Debouverie M, D'Hooghe M B, Dixon K, Dobosi R, Dubois B, Ellinghaus D, Elovaara I, Esposito F, Fontenille C, Foote S, Franke A, Galimberti D, Ghezzi A, Glessner J, Gomez R, Gout O, Graham C, Grant SF, Guerini FR, Hakonarson H, Hall P, Hamsten A, Hartung HP, Heard RN, Heath S, Hobart J, Hoshi M, Infante-Duarte C, Ingram G, Ingram W, Islam T, Jagodic M, Kabesch M, Kermode AG, Kilpatrick TJ, Kim C, Klopp N, Koivisto K, Larsson M, Lathrop M, Lechner-Scott JS, Leone MA, Leppa V, Liljedahl U, Bomfim IL, Lincoln RR, Link J, Liu J, Lorentzen AR, Lupoli S, Macciardi F, Mack T, Marriott M, Martinelli V, Mason D, McCauley JL, Mentch F, Mero IL, Mihalova T, Montalban X, Mottershead J, Myhr KM, Naldi P, Ollier W, Page A, Palotie A, Pelletier J, Piccio L, Pickersgill T, Piehl F, Pobywajlo S, Quach HL, Ramsay PP, Reunanen M, Reynolds R, Rioux JD, Rodegher M, Roesner S, Rubio JP, Ruckert IM, Salvetti M, Salvi E, Santaniello A, Schaefer CA, Schreiber S, Schulze C, Scott RJ, Sellebjerg F, Selmaj KW, Sexton D, Shen L, Simms-Acuna B, Skidmore S, Sleiman PM, Smestad C, Sorensen PS, Sondergaard HB, Stankovich J, Strange RC, Sulonen AM, Sundqvist E, Syvanen AC, Taddeo F, Taylor B, Blackwell JM, Tienari P, Bramon E, Tourbah A, Brown MA, Tronczynska E, Casas JP, Tubridy N, Corvin A, Vickery J, Jankowski J, Villoslada P, Markus HS, Wang K, Mathew CG, Wason J, Palmer CN, Wichmann HE, Plomin R, Willoughby E, Rautanen A, Winkelmann J, Wittig M, Trembath RC, Yaouanq J, Viswanathan AC, Zhang H, Wood NW, Zuvich R, Deloukas P, Langford C, Duncanson A, Oksenberg JR, Pericak-Vance MA, Haines JL, Olsson T, Hillert J, Ivinson AJ, De Jager PL, Peltonen L, Stewart GJ, Hafler DA, Hauser SL, McVean G, Donnelly P, Compston A (2011) Genetic risk and a primary role for cell-mediated immune mechanisms in multiple sclerosis. Nature 476:214-219.
Jackson SK, Abate W, Tonks AJ (2008) Lysophospholipid acyltransferases: novel potential regulators of the inflammatory response and target for new drug discovery. Pharmacology & therapeutics 119:104-114.
Jeremias IC, Scaini G, Constantino L, Vuolo F, Ferreira AK, Scherer EB, Kolling J, da Silva Dornelles A, de Souza Wyse AT, Bogo MR, Dal-Pizzol F, Streck EL (2012) The decrease on Na(+), K(+)-ATPase activity in the cortex, but not in hippocampus, is reverted by antioxidants in an animal model of sepsis. Molecular neurobiology 46:467-474.
Kalyvas A, Baskakis C, Magrioti V, Constantinou-Kokotou V, Stephens D, Lopez-Vales R, Lu JQ, Yong VW, Dennis EA, Kokotos G, David S (2009) Differing roles for members of the phospholipase A2 superfamily in experimental autoimmune encephalomyelitis. Brain : a journal of neurology 132:1221-1235.
Kalyvas A, David S (2004) Cytosolic phospholipase A2 plays a key role in the pathogenesis of multiple sclerosis-like disease. Neuron 41:323-335.
Karasawa K, Qiu X, Lee T (1999) Purification and characterization from rat kidney membranes of a novel platelet-activating factor (PAF)-dependent transacetylase

134
that catalyzes the hydrolysis of PAF, formation of PAF analogs, and C2-ceramide. The Journal of biological chemistry 274:8655-8661.
Kato A, Hojo Y, Higo S, Komatsuzaki Y, Murakami G, Yoshino H, Uebayashi M, Kawato S (2013) Female hippocampal estrogens have a significant correlation with cyclic fluctuation of hippocampal spines. Frontiers in neural circuits 7:149.
Kazachkov M, Chen Q, Wang L, Zou J (2008) Substrate preferences of a lysophosphatidylcholine acyltransferase highlight its role in phospholipid remodeling. Lipids 43:895-902.
Kebir H, Ifergan I, Alvarez JI, Bernard M, Poirier J, Arbour N, Duquette P, Prat A (2009) Preferential recruitment of interferon-gamma-expressing TH17 cells in multiple sclerosis. Annals of neurology 66:390-402.
Kebir H, Kreymborg K, Ifergan I, Dodelet-Devillers A, Cayrol R, Bernard M, Giuliani F, Arbour N, Becher B, Prat A (2007) Human TH17 lymphocytes promote blood-brain barrier disruption and central nervous system inflammation. Nature medicine 13:1173-1175.
Kern KC, Ekstrom AD, Suthana NA, Giesser BS, Montag M, Arshanapalli A, Bookheimer SY, Sicotte NL (2012) Fornix damage limits verbal memory functional compensation in multiple sclerosis. Neuroimage 59:2932-2940.
Khaselev N, Murphy RC (2000) Structural characterization of oxidized phospholipid products derived from arachidonate-containing plasmenyl glycerophosphocholine. Journal of lipid research 41:564-572.
Kihara Y, Ishii S, Kita Y, Toda A, Shimada A, Shimizu T (2005) Dual phase regulation of experimental allergic encephalomyelitis by platelet-activating factor. The Journal of experimental medicine 202:853-863.
Kihara Y, Yanagida K, Masago K, Kita Y, Hishikawa D, Shindou H, Ishii S, Shimizu T (2008) Platelet-activating factor production in the spinal cord of experimental allergic encephalomyelitis mice via the group IVA cytosolic phospholipase A2-lyso-PAFAT axis. Journal of immunology 181:5008-5014.
Klose C, Surma MA, Simons K (2013) Organellar lipidomics--background and perspectives. Current opinion in cell biology 25:406-413.
Ksiazek-Winiarek DJ, Szpakowski P, Glabinski A (2015) Neural Plasticity in Multiple Sclerosis: The Functional and Molecular Background. Neural plasticity 2015:307175.
Kuerten S, Angelov DN (2008) Comparing the CNS morphology and immunobiology of different EAE models in C57BL/6 mice - a step towards understanding the complexity of multiple sclerosis. Annals of anatomy = Anatomischer Anzeiger : official organ of the Anatomische Gesellschaft 190:1-15.
Laatsch RH, Kies MW, Gordon S, Alvord EC, Jr. (1962) The encephalomyelitic activity of myelin isolated by ultracentrifugation. The Journal of experimental medicine 115:777-788.
Leslie CC (2015) Cytosolic phospholipase A(2): physiological function and role in disease. Journal of lipid research 56:1386-1402.
Leuenberger T, Paterka M, Reuter E, Herz J, Niesner RA, Radbruch H, Bopp T, Zipp F, Siffrin V (2013) The role of CD8+ T cells and their local interaction with CD4+ T cells in myelin oligodendrocyte glycoprotein35-55-induced experimental autoimmune encephalomyelitis. Journal of immunology 191:4960-4968.

135
Lombardi G, Celso M, Bartelli M, Cilotti A, Del Popolo G (2011) Female sexual dysfunction and hormonal status in multiple sclerosis patients. The journal of sexual medicine 8:1138-1146.
Louveau A, Smirnov I, Keyes TJ, Eccles JD, Rouhani SJ, Peske JD, Derecki NC, Castle D, Mandell JW, Lee KS, Harris TH, Kipnis J (2015) Structural and functional features of central nervous system lymphatic vessels. Nature 523:337-341.
Manolagas SC (2010) From estrogen-centric to aging and oxidative stress: a revised perspective of the pathogenesis of osteoporosis. Endocrine reviews 31:266-300.
Marathe GK, Harrison KA, Murphy RC, Prescott SM, Zimmerman GA, McIntyre TM (2000) Bioactive phospholipid oxidation products. Free radical biology & medicine 28:1762-1770.
Marusic S, Leach MW, Pelker JW, Azoitei ML, Uozumi N, Cui J, Shen MW, DeClercq CM, Miyashiro JS, Carito BA, Thakker P, Simmons DL, Leonard JP, Shimizu T, Clark JD (2005) Cytosolic phospholipase A2 alpha-deficient mice are resistant to experimental autoimmune encephalomyelitis. The Journal of experimental medicine 202:841-851.
Marusic S, Thakker P, Pelker JW, Stedman NL, Lee KL, McKew JC, Han L, Xu X, Wolf SF, Borey AJ, Cui J, Shen MW, Donahue F, Hassan-Zahraee M, Leach MW, Shimizu T, Clark JD (2008) Blockade of cytosolic phospholipase A2 alpha prevents experimental autoimmune encephalomyelitis and diminishes development of Th1 and Th17 responses. Journal of neuroimmunology 204:29-37.
Mazereeuw G, Herrmann N, Bennett SA, Swardfager W, Xu H, Valenzuela N, Fai S, Lanctot KL (2013) Platelet activating factors in depression and coronary artery disease: a potential biomarker related to inflammatory mechanisms and neurodegeneration. Neuroscience and biobehavioral reviews 37:1611-1621.
McCarthy DP, Richards MH, Miller SD (2012) Mouse models of multiple sclerosis: experimental autoimmune encephalomyelitis and Theiler's virus-induced demyelinating disease. Methods in molecular biology 900:381-401.
McDermott CM, Liu D, Ade C, Schrader LA (2015) Estradiol replacement enhances fear memory formation, impairs extinction and reduces COMT expression levels in the hippocampus of ovariectomized female mice. Neurobiology of learning and memory 118:167-177.
McLean AC, Valenzuela N, Fai S, Bennett SA (2012) Performing vaginal lavage, crystal violet staining, and vaginal cytological evaluation for mouse estrous cycle staging identification. Journal of visualized experiments : JoVE e4389.
Meyer MC, McHowat J (2007) Calcium-independent phospholipase A2-catalyzed plasmalogen hydrolysis in hypoxic human coronary artery endothelial cells. American journal of physiology Cell physiology 292:C251-258.
Miyaura S, Maki N, Byrd W, Johnston JM (1991) The hormonal regulation of platelet-activating factor acetylhydrolase activity in plasma. Lipids 26:1015-1020.
Morimoto R, Shindou H, Tarui M, Shimizu T (2014) Rapid production of platelet-activating factor is induced by protein kinase Calpha-mediated phosphorylation of lysophosphatidylcholine acyltransferase 2 protein. The Journal of biological chemistry 289:15566-15576.
136
Murugesan NP, D.; Lemire, Y.; Shrestha, B.; Ge, S.; Pachter, J. S. (2012) Active induction of experimental autoimmune encephalomyelitis by MOG 35-55 peptide immunization is associated with differential responses in separate compartments of the choroid plexus. Fluids Barriers CNS 9.
Nathoo N, Yong VW, Dunn JF (2014) Understanding disease processes in multiple sclerosis through magnetic resonance imaging studies in animal models. NeuroImage Clinical 4:743-756.
Nelson JF, Felicio LS, Randall PK, Sims C, Finch CE (1982) A longitudinal study of estrous cyclicity in aging C57BL/6J mice: I. Cycle frequency, length and vaginal cytology. Biology of reproduction 27:327-339.
Neville NT, Parton J, Harwood JL, Jackson SK (2005) The activities of monocyte lysophosphatidylcholine acyltransferase and coenzyme A-independent transacylase are changed by the inflammatory cytokines tumor necrosis factor alpha and interferon gamma. Biochimica et biophysica acta 1733:232-238.
Nikic I, Merkler D, Sorbara C, Brinkoetter M, Kreutzfeldt M, Bareyre FM, Bruck W, Bishop D, Misgeld T, Kerschensteiner M (2011) A reversible form of axon damage in experimental autoimmune encephalomyelitis and multiple sclerosis. Nature medicine 17:495-499.
Nistico R, Mango D, Mandolesi G, Piccinin S, Berretta N, Pignatelli M, Feligioni M, Musella A, Gentile A, Mori F, Bernardi G, Nicoletti F, Mercuri NB, Centonze D (2013) Inflammation subverts hippocampal synaptic plasticity in experimental multiple sclerosis. PloS one 8:e54666.
Novkovic T, Shchyglo O, Gold R, Manahan-Vaughan D (2015) Hippocampal function is compromised in an animal model of multiple sclerosis. Neuroscience.
Ong WY, Farooqui T, Farooqui AA (2010) Involvement of cytosolic phospholipase A(2), calcium independent phospholipase A(2) and plasmalogen selective phospholipase A(2) in neurodegenerative and neuropsychiatric conditions. Current medicinal chemistry 17:2746-2763.
Pang XY, Cao J, Addington L, Lovell S, Battaile KP, Zhang N, Rao JL, Dennis EA, Moise AR (2012) Structure/function relationships of adipose phospholipase A2 containing a cys-his-his catalytic triad. The Journal of biological chemistry 287:35260-35274.
Papadopoulos D, Dukes S, Patel R, Nicholas R, Vora A, Reynolds R (2009) Substantial archaeocortical atrophy and neuronal loss in multiple sclerosis. Brain pathology 19:238-253.
Pieragostino D, D'Alessandro M, di Ioia M, Rossi C, Zucchelli M, Urbani A, Di Ilio C, Lugaresi A, Sacchetta P, Del Boccio P (2015) An integrated metabolomics approach for the research of new cerebrospinal fluid biomarkers of multiple sclerosis. Molecular bioSystems 11:1563-1572.
Portaccio E, Amato MP, Bartolozzi ML, Zipoli V, Mortilla M, Guidi L, Siracusa G, Sorbi S, Federico A, De Stefano N (2006) Neocortical volume decrease in relapsing-remitting multiple sclerosis with mild cognitive impairment. Journal of the neurological sciences 245:195-199.
Prange-Kiel J, Schmutterer T, Fester L, Zhou L, Imholz P, Brandt N, Vierk R, Jarry H, Rune GM (2013) Endocrine regulation of estrogen synthesis in the hippocampus? Progress in histochemistry and cytochemistry 48:49-64.

137
Prescott SM, Zimmerman GA, Stafforini DM, McIntyre TM (2000) Platelet-activating factor and related lipid mediators. Annual review of biochemistry 69:419-445.
Radu CG, Shu CJ, Shelly SM, Phelps ME, Witte ON (2007) Positron emission tomography with computed tomography imaging of neuroinflammation in experimental autoimmune encephalomyelitis. Proceedings of the National Academy of Sciences of the United States of America 104:1937-1942.
Rahn EJ, Iannitti T, Donahue RR, Taylor BK (2014) Sex differences in a mouse model of multiple sclerosis: neuropathic pain behavior in females but not males and protection from neurological deficits during proestrus. Biology of sex differences 5:4.
Rangachari MK, V., K. (2013) Using EAE to better understand principles of immune function and autoimmune pathology. J Autoimmun 45:31-39.
Ranjeva JP, Audoin B, Au Duong MV, Confort-Gouny S, Malikova I, Viout P, Soulier E, Pelletier J, Cozzone PJ (2006) Structural and functional surrogates of cognitive impairment at the very early stage of multiple sclerosis. Journal of the neurological sciences 245:161-167.
Ransohoff RM, Brown MA (2012) Innate immunity in the central nervous system. The Journal of clinical investigation 122:1164-1171.
Robinson AP, Harp CT, Noronha A, Miller SD (2014) The experimental autoimmune encephalomyelitis (EAE) model of MS: utility for understanding disease pathophysiology and treatment. Handbook of clinical neurology 122:173-189.
Rodrigues DH, Lacerda-Queiroz N, de Miranda AS, Fagundes CT, Campos RD, Arantes RE, Vilela Mde C, Rachid MA, Teixeira MM, Teixeira AL (2011) Absence of PAF receptor alters cellular infiltrate but not rolling and adhesion of leukocytes in experimental autoimmune encephalomyelitis. Brain research 1385:298-306.
Rosa AO, Rapoport SI (2009) Intracellular- and extracellular-derived Ca(2+) influence phospholipase A(2)-mediated fatty acid release from brain phospholipids. Biochimica et biophysica acta 1791:697-705.
Rubtsova K, Marrack P, Rubtsov AV (2015) Sexual dimorphism in autoimmunity. The Journal of clinical investigation 125:2187-2193.
Ruggieri S, Petracca M, Miller A, Krieger S, Ghassemi R, Bencosme Y, Riley C, Howard J, Lublin F, Inglese M (2015) Association of Deep Gray Matter Damage With Cortical and Spinal Cord Degeneration in Primary Progressive Multiple Sclerosis. JAMA neurology 1-9.
Ryan SD, Harris CS, Carswell CL, Baenziger JE, Bennett SA (2008) Heterogeneity in the sn-1 carbon chain of platelet-activating factor glycerophospholipids determines pro- or anti-apoptotic signaling in primary neurons. Journal of lipid research 49:2250-2258.
Ryan SD, Whitehead SN, Swayne LA, Moffat TC, Hou W, Ethier M, Bourgeois AJ, Rashidian J, Blanchard AP, Fraser PE, Park DS, Figeys D, Bennett SA (2009) Amyloid-beta42 signals tau hyperphosphorylation and compromises neuronal viability by disrupting alkylacylglycerophosphocholine metabolism. Proceedings of the National Academy of Sciences of the United States of America 106:20936-20941.
Sacco R, Bisecco A, Corbo D, Della Corte M, d'Ambrosio A, Docimo R, Gallo A, Esposito F, Esposito S, Cirillo M, Lavorgna L, Tedeschi G, Bonavita S (2015)
138
Cognitive impairment and memory disorders in relapsing-remitting multiple sclerosis: the role of white matter, gray matter and hippocampus. Journal of neurology 262:1691-1697.
Satoh K, Imaizumi T, Yoshida H, Takamatsu S (1993) Effect of 17 beta-estradiol on secretion of platelet-activating factor acetylhydrolase by HepG2 cells. Metabolism: clinical and experimental 42:672-677.
Savonenko A, Xu GM, Melnikova T, Morton JL, Gonzales V, Wong MP, Price DL, Tang F, Markowska AL, Borchelt DR (2005) Episodic-like memory deficits in the APPswe/PS1dE9 mouse model of Alzheimer's disease: relationships to beta-amyloid deposition and neurotransmitter abnormalities. Neurobiol Dis 18:602-617.
Schaeffer EL, Forlenza OV, Gattaz WF (2009) Phospholipase A2 activation as a therapeutic approach for cognitive enhancement in early-stage Alzheimer disease. Psychopharmacology 202:37-51.
Seo JE, Hasan M, Han JS, Kang MJ, Jung BH, Kwok SK, Kim HY, Kwon OS (2015) Experimental autoimmune encephalomyelitis and age-related correlations of NADPH oxidase, MMP-9, and cell adhesion molecules: The increased disease severity and blood-brain barrier permeability in middle-aged mice. Journal of neuroimmunology 287:43-53.
Seo KH, Lee HS, Jung B, Ko HM, Choi JH, Park SJ, Choi IH, Lee HK, Im SY (2004) Estrogen enhances angiogenesis through a pathway involving platelet-activating factor-mediated nuclear factor-kappaB activation. Cancer research 64:6482-6488.
Servillo L, Balestrieri C, Giovane A, Pari P, Palma D, Giannattasio G, Triggiani M, Balestrieri ML (2006) Lysophospholipid transacetylase in the regulation of PAF levels in human monocytes and macrophages. FASEB journal : official publication of the Federation of American Societies for Experimental Biology 20:1015-1017.
Sevastou I, Kaffe E, Mouratis MA, Aidinis V (2013) Lysoglycerophospholipids in chronic inflammatory disorders: the PLA(2)/LPC and ATX/LPA axes. Biochimica et biophysica acta 1831:42-60.
Shayman JA, Kelly R, Kollmeyer J, He Y, Abe A (2011) Group XV phospholipase A(2), a lysosomal phospholipase A(2). Progress in lipid research 50:1-13.
Shevchenko A, Simons K (2010) Lipidomics: coming to grips with lipid diversity. Nature reviews Molecular cell biology 11:593-598.
Shin JA, Yoon JC, Kim MS, Park EM (2016) Activation of classical estrogen receptor subtypes reduces tight junction disruption of brain endothelial cells under ischemia/reperfusion injury. Free radical biology & medicine.
Shindou H, Hishikawa D, Harayama T, Eto M, Shimizu T (2013) Generation of membrane diversity by lysophospholipid acyltransferases. Journal of biochemistry 154:21-28.
Shindou H, Hishikawa D, Harayama T, Yuki K, Shimizu T (2009) Recent progress on acyl CoA: lysophospholipid acyltransferase research. Journal of lipid research 50 Suppl:S46-51.
Shindou H, Hishikawa D, Nakanishi H, Harayama T, Ishii S, Taguchi R, Shimizu T (2007) A single enzyme catalyzes both platelet-activating factor production and membrane biogenesis of inflammatory cells. Cloning and characterization of

139
acetyl-CoA:LYSO-PAF acetyltransferase. The Journal of biological chemistry 282:6532-6539.
Sicotte NL, Giesser BS, Tandon V, Klutch R, Steiner B, Drain AE, Shattuck DW, Hull L, Wang HJ, Elashoff RM, Swerdloff RS, Voskuhl RR (2007) Testosterone treatment in multiple sclerosis: a pilot study. Archives of neurology 64:683-688.
Sicotte NL, Liva SM, Klutch R, Pfeiffer P, Bouvier S, Odesa S, Wu TC, Voskuhl RR (2002) Treatment of multiple sclerosis with the pregnancy hormone estriol. Annals of neurology 52:421-428.
Stafforini DM (2009) Biology of platelet-activating factor acetylhydrolase (PAF-AH, lipoprotein associated phospholipase A2). Cardiovascular drugs and therapy / sponsored by the International Society of Cardiovascular Pharmacotherapy 23:73-83.
Stanca E, Serviddio G, Bellanti F, Vendemiale G, Siculella L, Giudetti AM (2013) Down-regulation of LPCAT expression increases platelet-activating factor level in cirrhotic rat liver: potential antiinflammatory effect of silybin. Biochimica et biophysica acta 1832:2019-2026.
Starossom SS, Veremeyko T, Yung AW, Dukhinova M, Au C, Lau AY, Weiner H, Ponomarev ED (2015) Platelets Play Differential Role During the Initiation and Progression of Autoimmune Neuroinflammation. Circulation research.
Stirling DP, Stys PK (2010) Mechanisms of axonal injury: internodal nanocomplexes and calcium deregulation. Trends in molecular medicine 16:160-170.
Stys PK (2013) Pathoetiology of multiple sclerosis: are we barking up the wrong tree? F1000prime reports 5:20.
Stys PK, Zamponi GW, van Minnen J, Geurts JJ (2012) Will the real multiple sclerosis please stand up? Nature reviews Neuroscience 13:507-514.
Tambalo S, Peruzzotti-Jametti L, Rigolio R, Fiorini S, Bontempi P, Mallucci G, Balzarotti B, Marmiroli P, Sbarbati A, Cavaletti G, Pluchino S, Marzola P (2015) Functional Magnetic Resonance Imaging of Rats with Experimental Autoimmune Encephalomyelitis Reveals Brain Cortex Remodeling. The Journal of neuroscience : the official journal of the Society for Neuroscience 35:10088-10100.
Taniguchi K, Hikiji H, Okinaga T, Hashidate-Yoshida T, Shindou H, Ariyoshi W, Shimizu T, Tominaga K, Nishihara T (2015) Essential Role of Lysophosphatidylcholine Acyltransferase 3 in the Induction of Macrophage Polarization in PMA-Treated U937 Cells. Journal of cellular biochemistry 116:2840-2848.
Tarui M, Shindou H, Kumagai K, Morimoto R, Harayama T, Hashidate T, Kojima H, Okabe T, Nagano T, Nagase T, Shimizu T (2014) Selective inhibitors of a PAF biosynthetic enzyme lysophosphatidylcholine acyltransferase 2. Journal of lipid research 55:1386-1396.
Thakker P, Marusic S, Stedman NL, Lee KL, McKew JC, Wood A, Goldman SJ, Leach MW, Collins M, Kuchroo VK, Wolf SF, Clark JD, Hassan-Zahraee M (2011) Cytosolic phospholipase A2alpha blockade abrogates disease during the tissue-damage effector phase of experimental autoimmune encephalomyelitis by its action on APCs. Journal of immunology 187:1986-1997.

140
Trapp BD, Peterson J, Ransohoff RM, Rudick R, Mork S, Bo L (1998) Axonal transection in the lesions of multiple sclerosis. The New England journal of medicine 338:278-285.
Trenova AG, Slavov GS, Manova MG, Kostadinova, II, Vasileva TV (2013) Female sex hormones and cytokine secretion in women with multiple sclerosis. Neurological research 35:95-99.
van Munster CE, Jonkman LE, Weinstein HC, Uitdehaag BM, Geurts JJ (2015) Gray matter damage in multiple sclerosis: Impact on clinical symptoms. Neuroscience 303:446-461.
Wang F, Blanchard AP, Elisma F, Granger M, Xu H, Bennett SAL, Figeys D, Zou H (2013) Phosphoproteome analysis of an early onset mouse model (TgCRND8) of Alzheimer's disease reveals temporal changes in neuronal and glia signaling pathways. Proteomics 13:1292-1305.
Xu H, Valenzuela N, Fai S, Figeys D, Bennett SA (2013) Targeted lipidomics - advances in profiling lysophosphocholine and platelet-activating factor second messengers. The FEBS journal 280:5652-5667.
Yasuda K, Johnston JM (1992) The hormonal regulation of platelet-activating factor-acetylhydrolase in the rat. Endocrinology 130:708-716.
Yu H, J.; Christodoulou, C.; Bhise, V.; Greenblatt, D.; Patel, Y.; Serafin, D.; Maletic-Savatic, M.; Krupp, L., B.; Wagshul, M., E. (2012) Multiple white matter tract abnormalities underlie cognitive impairment in RRMS. Neuroimage 59:3713-3722.
Zemski Berry KA, Murphy RC (2005) Free radical oxidation of plasmalogen glycerophosphocholine containing esterified docosahexaenoic acid: structure determination by mass spectrometry. Antioxidants & redox signaling 7:157-169.
Zhao L, Woody SK, Chhibber A (2015) Estrogen receptor beta in Alzheimer's disease: From mechanisms to therapeutics. Ageing research reviews 24:178-190.
Ziehn MO, Avedisian AA, Dervin SM, O'Dell TJ, Voskuhl RR (2012) Estriol preserves synaptic transmission in the hippocampus during autoimmune demyelinating disease. Laboratory investigation; a journal of technical methods and pathology 92:1234-1245.
Ziehn MO, Avedisian AA, Tiwari-Woodruff S, Voskuhl RR (2010) Hippocampal CA1 atrophy and synaptic loss during experimental autoimmune encephalomyelitis, EAE. Laboratory investigation; a journal of technical methods and pathology 90:774-786.
Ziemssen T, De Stefano N, Pia Sormani M, Van Wijmeersch B, Wiendl H, Kieseier BC (2015) Optimizing therapy early in multiple sclerosis: An evidence-based view. Multiple sclerosis and related disorders 4:460-469.