The Resource Curse Paradox: natural resources and economic ...
70
The Resource Curse Paradox: natural resources and economic development in the former Soviet countries Thesis submitted for a M.Sc. degree in forest sciences and business University of Helsinki Department of Forest Sciences 2014 Maria Zagozina
Transcript of The Resource Curse Paradox: natural resources and economic ...

The Resource Curse Paradox: natural
resources and economic development in the
former Soviet countries
Thesis submitted for a M.Sc. degree in forest sciences and business
University of Helsinki
Department of Forest Sciences
2014
Maria Zagozina

2
Tiedekunta/Osasto Fakultet/Sektion Faculty
Faculty of Agriculture and Forestry
Laitos Institution Department
Department of Forest Sciences
Tekijä Författare Author
Maria Zagozina
Työn nimi Arbetets titel Title
The Resource Curse Paradox: natural resources and economic development in the former Soviet countries
Oppiaine Läroämne Subject
Forest resource and environmental economics
Työn laji Arbetets art Level
Master’s Thesis
Aika Datum Month and year
October, 2014
Sivumäärä Sidoantal Number of pages
70 pages
Tiivistelmä Referat Abstract
The curse of natural resources is broadly addressed in the literature on economic development and growth. It is
generally believed that resource abundant economies tend to grow more slowly than economies of low resource
endowment. In the former Soviet countries, resource dependence determines country economic strategy in many
aspects. Due to old Soviet legacies, the countries struggle to build a truly civil society, with a developed industrial
production sector.
This paper investigates the existence of the resource curse in the post-Soviet states, analyzing the main economic,
social, and political issues and problems emerging from high resource endowment. The research objective of the
current study is to examine the economic dependence of natural resource exports in the post-Soviet states, as well as
to test the effect of high resource endowment on economic growth. In this paper, a review of resource curse
literature and further empirical panel analysis based on chosen econometric model and methods (OLS, TSLS) are
carried out. Natural resources in the model were divided into two main categories, i.e. point-source (oil, gas,
minerals, metals) and diffuse (agriculture, forest) resources.
The former Soviet economies that are highly dependent on natural resources tend to develop rather slowly due to
inefficient resource management, rent-seeking behavior, high level of corruption, lack of political freedom, and poor
performance in non-resource sector. However, the main finding from the empirical testing indicates a highly
significant positive effect of resource exports on economic growth, for both point-source and diffuse resources.
Upon further analysis, it is concluded that agriculture exports in GDP provide the highest positive effect on
economic growth. Institutional quality provides little impact on economic growth, although theoretically its
importance is detected. Thus, in the post-Soviet countries high resource abundance tend to have a positive direct
association with economic growth; nevertheless, economic growth in this case does not lead to country
development.
Avainsanat Nyckelord Keywords
Natural resources, resource curse paradox, former Soviet states, economic development
Säilytyspaikka Förvaringsställe Where deposited
Viikki Science Library, University of Helsinki, Helsinki, Finland
Muita tietoja Övriga uppgifter Further information

3
LIST OF TABLES
Table 1: Summary of major findings in resource curse analysis
Table 2: Natural resources production in Russia, 2012-2013
Table 3: Ambivalent assessment of key indicators of Russian economic development
Table 4: Political stability, Worldwide Governance Indicators
Table 5: Gini coefficient for former Soviet countries
Table 6: Data description
Table 7: Descriptive statistics of major indicators
Table 8: The Levin-Lin-Chu panel unit root test for GDP growth, Eviews
Table 9: OLS regressions, values calculated in Eviews
Table 10: TSLS regressions, values calculated in Eviews
Table 11: OLS regression with inclusion of extra control variables, values calculated
in Eviews
LIST OF FIGURES
Figure 1: Connection between economic growth and natural resource abundance,
1970-1989
Figure 2: Oil and transitions to democracy, 1960-2006
Figure 3: Major resources exported by a country
Figure 4: Fuel exports as % of merchandise exports; natural gas and oil rents as % of
GDP, Azerbaijan 1998-2010
Figure 5: Major areas of concern among Azerbaijan’s citizens
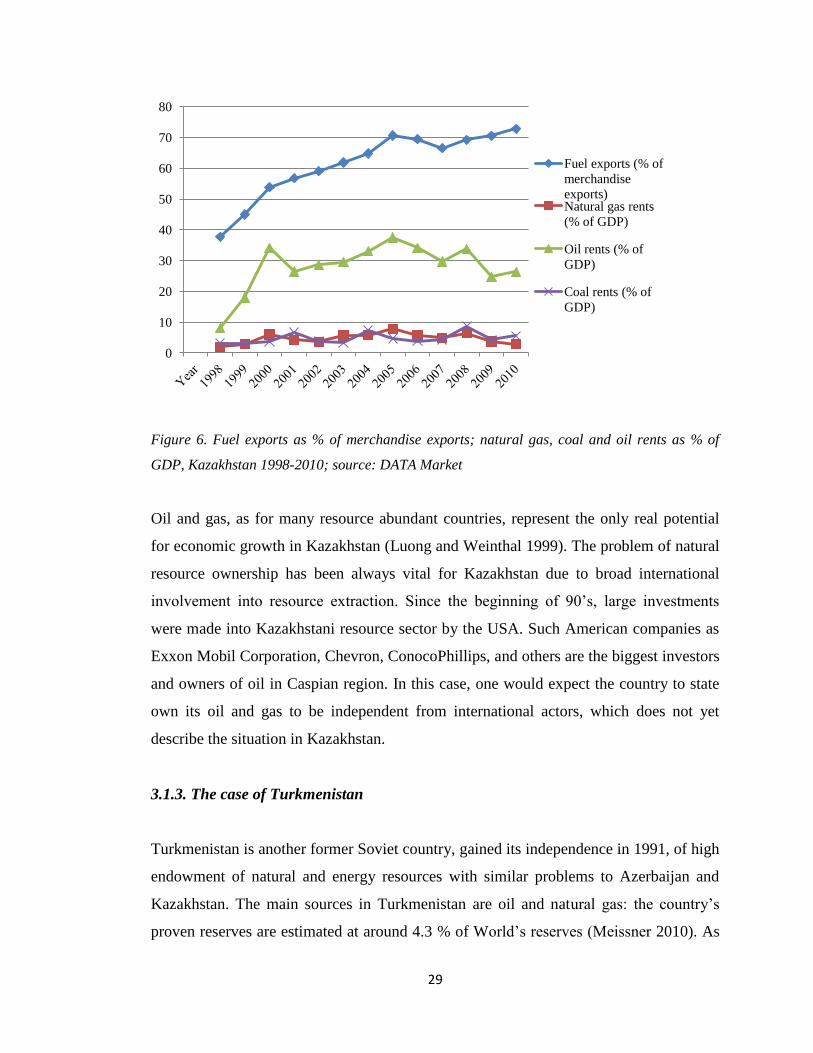
Figure 6: Fuel exports as % of merchandise exports; natural gas, coal and oil rents as
% of GDP, Kazakhstan 1998-2010
Figure 7: Shares of manufactured and fuel exports as % of merchandise exports,
Russia 1996-2012
Figure 8: Aggregate amount of the Stabilization Fund of the Russian Federation,
2006-2008
Figure 9: Individual cross sections for 12 countries, data on GDP growth and total
resource abundance

4
Table of contents
List of tables.......................................................................................................................... 3
List of figures ........................................................................................................................ 3
1. INTRODUCTION ............................................................................................... 6
1.1. Background ............................................................................................................ 6
1.2. Aims and research questions ................................................................................ 7
2. LITERATURE REVIEW.................................................................................. 8
2.1. History of the paradox: reasons & consequences ............................................. 8
2.2. Modeling, methodologies, datasets ................................................................... 14
3. COUNTRY CASES .......................................................................................... 18
3.1. Economy, policy and society in the former Soviet states .............................. 18
3.1.1. The case of Azerbaijan ....................................................................................... 21
3.1.2. The case of Kazakhstan ...................................................................................... 27
3.1.3. The case of Turkmenistan .................................................................................. 29
3.1.4. The case of Russia ............................................................................................... 31
3.2. Similarities and differences ................................................................................ 40
4. DATA AND METHODOLOGY .................................................................... 46
4.1. Econometric model ............................................................................................. 46
4.2. Data description ................................................................................................... 49
4.3. Basic panel analysis: data testing ...................................................................... 50
5. EMPIRICAL TESTING .................................................................................. 53

5
5.1. Ordinary least squares regressions .................................................................... 53
5.2. Two-stages least squares regressions ................................................................ 56
5.3. Robustness of the results .................................................................................... 58
6. DISCUSSION ..................................................................................................... 60
7. CONCLUSIONS ................................................................................................ 62
References ........................................................................................................................... 63
Appendix ............................................................................................................................. 70

6
1. INTRODUCTION
1.1. Background
The paradox of plenty, or “resource curse” has been a subject under discussion for more
than 30 years with a variety of theoretical approaches and scientific opinions. The
resource curse paradox explains the situation when countries with an abundance of
natural resources reach slow economic growth in comparison with those with no primary
resource abundance. In other words, countries that possess much natural resource do not
develop in accordance with classical growth theory. Following simple logic, resource
abundance must lead to higher economic development and country’s wealth by using
increased revenues from higher exports. In reality, it often leads to greater corruption
and inefficient bureaucracies (Sachs, Warner 1997), provides no incentives for the
government to develop other sectors of the economy, and finally becomes a reason for
poor economic performance. Resource abundance creates inequality in society, caused
by revenue mismanagement and corruption, and thus becomes harmful for the economy.
Natural resources such as oil, minerals, timber, and others tend to be “wasted” by the
government to receive easy money (Ascher 1999, Rutland 2008).
Considering the type of natural resources, there are certain ones (e.g. gas, oil, minerals,
precious metals) that seem to be more valuable and provide a higher negative influence
to the economy. On the contrary, resources which are difficult to store and transport (e.g.
agriculture, forest) theoretically less affect the economy. There are tools like good
institutions, entrepreneurship, and strong governmental policies that may “cure” the
curse, if applied smartly. At the same time, the majority of countries have not overcome
the resource curse yet, which means that the tools remain good only in theory. There are
several main aspects noticed by majority of authors that have a strong influence upon
economies: price volatility, trends in world commodity prices of resources, crowding out
effect, poor institutional system, corruption, property rights, and the Dutch Disease.
Empirical testing of how resource abundance affects economic performance went into
several main directions, with various methodologies and data. Much critique of the
initial idea of negative influence of resource abundance appeared, and the explanation of

7
the paradox became more complex. Generally, it is a common belief that not resources
themselves cause problems, but the way they are managed by governments and those in
power. Such new understanding alters the definition of the curse: now resource abundant
countries are cursed due to the mismanagement of their resources. Much empirical
research has been carried out in relation to African, Asian and European countries: in
particular, the majority of authors have been using the cross-sectional dataset collected
by Sachs and Warner (1995), applying certain estimation methods and/or extending it by
new variables. Due to the efficiency of panel data estimation, new datasets and
methodologies were introduced, which led to new findings in resource curse analysis.
1.2. Aims and research questions
A particular innovation of the current research is related to a set of countries chosen for
the analysis. There is a gap in resource curse studies in relation to the former Soviet
countries: these countries are poorly presented in empirical analysis. Due to the lack of
respective data, testing the curse is not an easy task. However, much literature exists on
the paradox in the former Soviet states: commonalities, similarities and differences have
been broadly studied. The main objective of the current thesis is to examine the reasons
and major consequences of the resource curse in the former Soviet states, as well as to
estimate empirically the influence of resource endowment on economic growth. The
main research question can be described as following: how dependence from natural
resources affects economies of the former Soviet states? Theoretical overview here plays
a significant role; analyzing existing literature and investigating particular country cases
will provide a basis for further econometric analysis.
The current thesis will be organized as follows. In Chapter 1 the most important
literature on the resource curse paradox will be reviewed, including the modern research
outcomes. Chapter 2 will be devoted to the case former Soviet Union countries,
investigating similarities and differences in relation to their resource policies. Chapter 3
will present the data and methodology, as well as a specified hypothesis and a model.
Chapter 4 will test the hypothesis using a number of commonly-used econometric
methods (i.e. OLS, TSLS). In Chapter 5 the discussion of the results and conclusion will
be presented.

8
2. LITERATURE REVIEW
2.1. History of the paradox: reasons & consequences
The finding of a negative effect of resource abundance on economic growth was
supported by a large number of cross-section studies. A great number of scholars
including the “pioneers” Sachs and Warner (1995) and later on Auty and Mikesell
(1998) with, largely observed the existence of the paradox. Almost none of the countries
with high natural resources abundance experienced high economic growth over a 20-
year period (Fig.1). It has been concluded that there are many negative consequences of
resource abundance for a country. Ranis (1991) in his work summarized the main points
of the curse existence, including income inequality, weak competitiveness of non-
resource sectors, increase of rent-seeking activity, no incentives for the government to
develop human resources, with further corruption and authoritarianism.
Figure 1. Connection between economic growth and natural resource abundance, 1970-1989,
source: Sachs and Warner (2001)
One of the most harmful effects to the economy is related to the extinction of non-
resource sector. In relation to this, the so-called Dutch Disease concept is widely used to
explain a situation when manufacturing sector is crowded out by resource sector.

9
Manufacturing is one of the most important causes of economic development as it brings
the innovations and creates global trade. Manufacturing provides a complex division of
labor (Ross 1999) and a higher standard of living (Sachs and Warner 2001): thereby,
boom in resource sector leads to a decline in the amount of manufactured goods, causing
higher unemployment and crowding out working places. “The expansion of the natural-
resource sector is not enough to offset the negative effect of deindustrialization on
economic growth” (Torres et al. 2013), that is to say, a development of manufacturing
sector is essential for the economy. Moreover, a boom of natural resource sector might
be harmful for public and private investments in human capital and education (Gylfason
2001), and entrepreneurship (Sachs and Warner 2001). In a resource abundant economy,
innovation and technology are usually far behind the resource sector, which slows down
a transition towards market-based economy (Goorha 2006).
Another important problem associated with resource abundance is caused by rent-
seeking activities. The problem is mostly observed in less developed countries where
large rents can be obtained by people in power. “Resource rents are easily appropriable
by an established elite, triggering bribes, and distorted policies” (Damania and Bulte
2003). A rentier state is one that receives substantial rents from foreign actors, be they
individuals, enterprises or governments (Mahdavy 1970).The models of so-called rentier
state are crucial in understanding and analyzing the resource curse paradox. Rent-
seeking models are explained as following: power and resources are “channeled
primarily through state leaders”, thus there is a high “level of state discretion in
allocating resources and regulating the economy” (John 2010). Economies in such
rentier states are dominated by external rents and usually governments are the ones to
receive these rents. The country’s population has to wait for the rent distribution. Rentier
states are dependent from other than domestic income which makes them provide the
country with little organizational or political effort (Moore 2004). Entrepreneurial
activity lessens rent-seeking as it “destroys existing rents” (Baland 1999), therefore
entrepreneurship is one way to stabilize the economy. However, there are some
critiques on rent-seeking theory due to the lack of explanatory power. Such theory seems
to not be applicable to every country case. For example, economies with no significant
resource abundance do not seem to be less corrupted than those rich in natural resources.
10
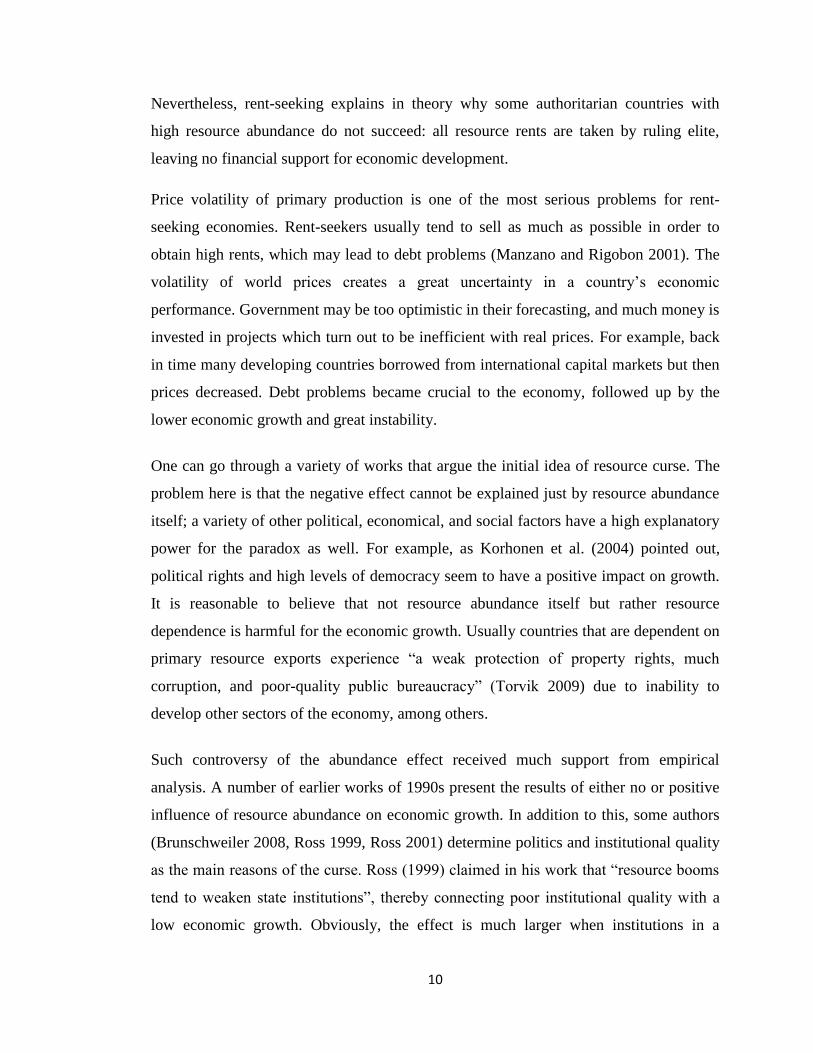
Nevertheless, rent-seeking explains in theory why some authoritarian countries with
high resource abundance do not succeed: all resource rents are taken by ruling elite,
leaving no financial support for economic development.
Price volatility of primary production is one of the most serious problems for rent-
seeking economies. Rent-seekers usually tend to sell as much as possible in order to
obtain high rents, which may lead to debt problems (Manzano and Rigobon 2001). The
volatility of world prices creates a great uncertainty in a country’s economic
performance. Government may be too optimistic in their forecasting, and much money is
invested in projects which turn out to be inefficient with real prices. For example, back
in time many developing countries borrowed from international capital markets but then
prices decreased. Debt problems became crucial to the economy, followed up by the
lower economic growth and great instability.
One can go through a variety of works that argue the initial idea of resource curse. The
problem here is that the negative effect cannot be explained just by resource abundance
itself; a variety of other political, economical, and social factors have a high explanatory
power for the paradox as well. For example, as Korhonen et al. (2004) pointed out,
political rights and high levels of democracy seem to have a positive impact on growth.
It is reasonable to believe that not resource abundance itself but rather resource
dependence is harmful for the economic growth. Usually countries that are dependent on
primary resource exports experience “a weak protection of property rights, much
corruption, and poor-quality public bureaucracy” (Torvik 2009) due to inability to
develop other sectors of the economy, among others.
Such controversy of the abundance effect received much support from empirical
analysis. A number of earlier works of 1990s present the results of either no or positive
influence of resource abundance on economic growth. In addition to this, some authors
(Brunschweiler 2008, Ross 1999, Ross 2001) determine politics and institutional quality
as the main reasons of the curse. Ross (1999) claimed in his work that “resource booms
tend to weaken state institutions”, thereby connecting poor institutional quality with a
low economic growth. Obviously, the effect is much larger when institutions in a

11
country have never been good and stable. Another finding by Ross (1999) is related to
resources ownership. The main focus was on the state’s ownership of the resources
which happens mostly in developing countries. “A state’s inability to enforce property
rights may directly or indirectly lead to a resource curse” (Ross 1999), and this is one
explanation of a country’s poor economic performance. At the same time most
governments fail to take corrective actions; they become lazy due to resource
abundance. In this case competition for rents becomes more attractive and profitable
than investing in others areas of the economy (Korhonen et al. 2004).
Along with critique of the paradox, the indicator of institutional quality has become
widely discussed in modern research. Mehlum and Torvik (2006) in their article
investigated the effect of institutional quality on resource curse, arguing the results of
earlier works (Sachs and Warner 1997, Sachs and Warner 2001, Lane and Tornell 1996,
Torvik 2002). The idea was to research how “growth winners and growth losers differ”
according to what type of institutions a country possesses. In particular, there are two
types of institutions, grabber friendly and producer friendly, that lead to pushing the
aggregate income down or up, respectively. For grabber friendly institutions, “rent-
seeking and production are competing activities”; focusing on rent-seeking will lead to a
lower economic growth. Moreover, a share of entrepreneurial activity in production
sector or unproductive rent-seeking may be harmful for the economy. The work
concludes that “institutions are decisive for the resource curse”, thus their quality has to
be considered in the resource curse analysis.
Other interesting findings were covered in the work of Boschini et al. (2005): they
studied the effect of institutional quality and natural resource type on the economic
growth. Some resources are not easily transportable (e.g. precious metals, diamonds)
which more likely might cause problems. Nevertheless, having a high institutional
quality leads to a positive economic development even with such “difficult” type of
natural resources. The quality of institutions is crucial in this sense because it might
either prevent the dramatic recession or assist in its acceleration. The authors extended
the standard hypothesis with an assumption that abundance is harmful for the economy
only if poor institutional quality is observed; for a high institutional quality, resource

12
abundance has no direct impact on growth. Their conclusions are supported by the
results of other authors (Auty 1997, Isham et al. 2003).
Not only institutional quality affects economic growth, but corruption and political
choices play an important role in defining the paradox of resource curse. Corruption
negatively affects economic growth (Mauro 1995), while at the same time the extent of
corruption depends on natural resource abundance (Leite and Weidmann 1999). In most
countries of a high resource abundance corruption is one of the factors preventing
growth. Corrupted resource-rich countries usually have “bad policies” which do not tend
to diversify the economy (Damania and Bulte 2003).
The problem of resource curse paradox is strongly connected with a current policy
regime and ownership rights in a particular country. Oil dependency exists in a broad
range of political systems; however, it is more likely to overcome resource curse in “a
stable democracy rather than in a traditional monarchy” (Rutland 2006). A country
appears to be less democratic as it possesses large amount of primary resource (Fig. 2).
Ross (2014) claims that “the greater a country’s oil income, the less likely it has been to
transition to democracy”.
Figure 2. Oil and transitions to democracy, 1960-2006, source: Ross, 2014

13
A right of ownership becomes an obstacle to economic growth, especially in countries
with poor institutional quality. For example, in new democracies with no established
traditions resource abundance may lead to the loss of property rights. At the same time,
natural resources can be either distributed chaotically (dispersed) or concentrated in one
place which affects their use (Tambovtcev and Valitova 2007). It will be more difficult
for authorities or those in power to keep the property right only for them if resources are
dispersed. Jones Luong and Weinthal (2010) similarly point out the importance of the
ownership structure of the mineral wealth. According to their study, there are four
possible ownership structures: state ownership with control, state ownership without
control, private domestic ownership, and private foreign ownership. Thus, for example,
they investigated that states with private domestic ownership are best in avoiding the
curse. The way of how authorities are elected is another thing which influences the law
of property. For example, democratic legitimacy prevents concentrating the rent from
natural resources use by authorities or ruling groups. In this case the existing order of
things is evaluated as "right" not to be changed, and the actions of authorities do not
meet resistance.
Countries rich in natural resources are not represented only by growth “losers”. There
are countries that managed to avoid the curse (e.g. Norway, Botswana, and South
Africa) and succeeded due to accurate policies and strong institutions, among other
factors. For example, per capita GDP growth in Botswana for the period 1970 - 2001
reached on average 6.4 % yearly, and about 2.8 % was a yearly growth in Norway for
the same period (Korhonen et al. 2004). This fact points out a certain ambiguity in
resource curse theory as for some countries the paradox remains while for others does
not. Therefore, the initial idea of a negative influence of resource abundance on the
economy is not beyond doubt anymore. Nowadays the resource curse paradox is defined
not being related to resource abundance but to poor institutional and then overall
economic performance of a country. The fact that a country exports much of its primary
resource may often mean an inability to process it into a final product, meaning lack of
technology and professionals. In general, underdeveloped economies of high primary
resource endowment export only raw materials, while its processing will lead to
economic development (e.g. more working places, product differentiation, and

14
technology development). Low economic growth is often an indicator of undeveloped
economy, and the main challenge is to ascertain why such economy suffers from
resource abundance even more.
2.2. Modeling, methodologies, datasets
Differences in empirical testing and methodology are crucial in relation to the paradox
research because this provides an approach based more on statistics rather than pure
theory. It is important to consider that not all empirical evidence include the same
variables and data. Findings from Sachs and Warner do not remain robust after some
changes in econometric procedure (Manzano and Rigobon 2001), as well as using panel
data brings quite opposite results to resources curse analysis. One problem under a broad
discussion is referred to resource proxies. Usually an annual growth rate is accepted as
an indicator of economic growth (Auty 1998, Sachs and Warner 1995, 1997, 1999,
Manzano and Rigobon 2001). Resource abundance indicator is diverse in some works;
however, it is usually taken to be a share of primary exports as a percentage of GDP. In
this case, “resource-based exports are defined as agriculture, minerals, and fuels” (Sachs
and Warner 1997). In many recent works resource abundance has been divided into
several types to analyze which has the most effect on growth. For example, Perälä
(2003) in her work examined different types of raw materials: countries that mostly
export fuels and minerals experience slower economic growth comparing to those
exporting mainly raw materials. As an important finding, weaker political cohesion
deteriorates the situation due to her analysis. In relation to this, Korhonen et al. (2004)
found out two important issues: first, non-fuel industries have the largest negative effect
on economic growth, in contrast with the common theory. Second, fuel exports are
anyway negatively correlated with a level of democracy and civil liberties. However,
such division does not always support the resource curse hypothesis. For example, in a
work of Lederman and Maloney (2003) once the resource division is presented to
empirical analysis, the curse seems to disappear.
Sachs and Warner (1995, 1997, 1999, and 2001) discovered the existence of the resource
curse with further testing by controlling a number of explanatory variables. The idea was

15
to take a ratio of natural resource exports to GDP in the base year and observe economic
growth during the subsequent 20-year period. The main result from the work concluded
that “economies abundant in natural resources have tended to grow slower that
economies without substantial natural resources” (Sachs and Warner 1997). However,
the authors noted that even though there is a negative relation between the resource
abundance and economic growth, some precise policy for resource abundant countries is
a topic for further analysis.
A number of resource proxies have been observed by other authors. Among others,
Brunnschweiler (2008) reviewed the work of Sachs and Warner with further comments:
first, per capita mineral wealth is more appropriate due to endogeneity of the resource
share in GDP measure. Second, agricultural export should not be included in the
regression so it might be better to classify it separately or exclude. Interestingly, Jensen
and Wantchekon (2004) and Smith (2012) measured oil abundance by a share of oil
export of total exports: this measure is used in a number of other works. Nevertheless, it
remains still challenging to find the most suitable indicator. Torvik (2009) in his work
brings up an essential question related to finding a truly exogenous measure of natural
resource abundance. He claims that most of resource measurements are not exogenous
and thus might bias the estimates.
Indeed, choosing correct proxies of resource abundance play a decisive role in a model’s
outcome. The division between point-source and diffuse resources in a model best
explains their respective effects on economic growth. Here it is important to consider the
type of resources that most likely may bring the curse to an economy. Usually some
particular types of resources like oil, gas or minerals become problematic for an
economy; however, this greatly depends on what resources a country exports and to
which extent the dependence on them appears.
In the earlier literature on resource curse paradox a cross-sectional analysis was usually
held. In cross-sectional analysis a regression is estimated for a number of subjects during
a period of time or at one specific point in time, thus the estimation is based on one-
dimensional dataset regardless any differences in time. One common problem in this

16
case is to control for all relevant country-specific effects as cross-sectional studies might
be inconsistent. A logical solution for the problem would be to estimate panel data with
country fixed effects. As opposed to cross-sectional data, panel data is two- or multi-
dimensional, and used for estimating multiple phenomena over time. With such data it is
possible to observe the change within each of countries in a dataset. This helps in
removing the effect of omitted variables bias. Fixed effects in a model are assumed to be
time independent and correlated with the independent variables (regressors). If after
considering fixed country-specific effects the correlation between resource abundance
and economic growth still exists, it is obviously a good sign for further analysis (Torvik
2009). Regarding the results of panel data analysis, a relationship between resource
abundance and economic growth differs from study to study: some authors find the
evidence of resource curse while others do not. For example, the results from the work
of Sachs and Warner do not remain the same using panel estimation (Korhonen et al.
2004).
The resource curse literature covers a variety of methods, theories, explanations and
approaches. However, it becomes more difficult to find the unified way for researchers.
Interestingly, the existing studies present truly controversial results of the empirical
analysis of the paradox, nevertheless based on same or similar model assumptions.
However, a positive step can be seen in overall explanation of the paradox by modern
scholars. As Torvik (2009) mentioned in his article, the institutional quality and
country’s policy seem to explain the paradox more accurate, which generally
corresponds to the modern perception of resource curse theory. One may claim that not
resources themselves, but enormous dependence on them creates a basis for resource
curse; bad governmental policy and low quality of institutions supplement the negative
effect greatly. It is essential to understand to what extent political and governmental
components affect economic growth.
Not only theoretical explanation matters in studying the paradox, but methodology plays
a key role. There is a number of weaknesses of a cross-sectional analysis (e.g.
endogeneity, dismissing meaningful variables), while most authors agree on the
strongest sides of using panel data. Results of panel analysis usually differ due to

17
complexity of their comparison: some authors control for particular variables while
others do not. A number of resource proxies are used to explain the paradox from
different angles. All in all, panel analysis appears to be the best so far to consider all
unobserved effects. In addition, not only institutional quality but a quality of policies
should be added to the estimation because they “provide more variability” (Torvik
2009).
Table 1 summarizes most important findings for the current analysis, including
examples of using cross-sectional versus panel data. The major outcomes presented in
the table reflect the importance of choosing relevant data and methodology for the
analysis.
Table 1. Summary of major findings in resource curse analysis
Data type CROSS - SECTIONAL PANEL
Year 1995, 1997 2005 2008 2001 2013
Authors Sachs, Warner Boschini et al. Brunnschweiler Manzano, Rigobon Oskenbayev,
Karimov
Effect on
growth
Negative
relationship
Depends on the
institutional
quality and
resources type
Positive direct
empirical
relationship
No effect or a positive
effect once fixed
effects are introduced
into a model
Negative
relationship
RC*
variables
Ratio of
natural
resources
exports to
GDP
Share of natural
resources / ores
and metals
exports in GDP,
share of mineral
production in
GNP
Fuel and non-
fuel mineral
production
(separate and
aggregate)
shares in GDP
Share on agricultural
and non-agricultural
exports in GNP;
shares of fuel and
mineral exports in
GNP
Point-source
and diffuse
source resources
production
Comments
Institutions
play either no
or little role;
negative
relationship
remains even
after
controlling for
other variables
Poor institutional
quality along
with problematic
types of
resources cause
stronger negative
effect
Strong positive
effect for sub-
oil wealth; no
negative effects
of resources
through the
institutional
channel
Degree of
development and the
institutional quality
are important
determinants,
although they do not
directly cause the
“curse
“Commodity
price volatility
interaction with
institutional
quality are
introduced”
* The proxies used for measuring the resource abundance in a model

18
3. COUNTRY CASES
3.1. Economy, policy, and society in the former Soviet states
There is a general belief that resource abundance raises the rate of investments and
imports, which should lead to diversification of economy, strengthening social security,
and a decrease of unemployment (Franke et al. 2009). Nevertheless, resource wealth
tends to provide inequality in society, political instability, and bad performance of a
resource-abundant country. Resource-related wealth builds a social structure that does
not support democratic approach (Franke et al. 2009). As it was discussed earlier, there
are many issues that affect economic growth in resource-abundant countries. One of the
key elements to facilitate country’s development is high institutional quality. In
countries like Former Soviet Union states with lack of proper institutional system an
abundance of natural resources is likely to harm the economy. Political system of a
country always influences its economic situation; countries of a weak policy do not
provide suitable conditions for avoiding the curse. “Well-designed state policies can
mitigate its most damaging effects” (Rutland 2006), thus domestic policies have to be
taken seriously for better understanding of the resource curse. Although it is important to
remember that resource abundance may not have a direct impact on the economic
growth.
In particular, oil and gas are the ones that tend to produce the most “harm” to the
economy as well as to become its main power. Interestingly that despite the fact that
some former Soviet countries entered the European Union (e.g. Estonia, Latvia,
Lithuania), they seem to develop rather slowly. This can be mainly caused by old Soviet
heritage and its wide influence over the countries of former USSR. Post-communist
society is still highly affected by old Soviet legacies, which “may prevent democratic
consolidation” (Kopstein 2003).
The main area of interest in this thesis covers the resource abundant countries of the
former Soviet Union and the way resource abundance has been affecting them after the
collapse of the Soviet Union. In terms of exports, countries of a high natural resource

19
endowment are Azerbaijan, Kazakhstan, Russia, Turkmenistan, and Uzbekistan. These
countries export large amounts of oil and natural gas, as well as some amounts of
mineral, agricultural, wood, and other resources (Fig. 1). The distribution of main
exports in the former Soviet countries is listed in Appendix.
Figure 3. Major resources exported by a country, the map made by the author
In transitional post-Soviet states the resource curse was observed by a variety of authors
who paid their attention to the negative aspects of resource abundance: such countries as
Russia, Azerbaijan, and Kazakhstan experience slower growth and less efficient political
actions towards building legitimacy, policy, and control (Auty 2000). It is essential to
remember that a majority of post-Soviet countries experience generally low institutional
quality and relatively poor governmental performance. In addition to this, in resource-
abundant countries a centralization of state control takes place, which does not help to
avoid resource conflict. Political leaders in resource abundant countries are usually
engaged in “corruption, self-enrichment and rent-seeking” (Meissner 2010). Main issues
characterizing resource abundance in developing countries can be described as following

20
(O’Lear 2007): there is a lack of economic diversification and investments in other
export industries; social welfare is in low priority; income inequality is evident; political
control is usually centralized. Economic diversification is the key element of success:
countries investing in other sectors are able to compete globally (e.g. Malaysia, Turkey,
South Korea), and avoid sectoral shocks (Amineh 2006). Majority of the former Soviet
states struggle to bring political rights and civil freedoms to their policies in order to
build a liberal democratic society. Azerbaijan, Kazakhstan, Kyrgyzstan, Turkmenistan,
Uzbekistan, and Tajikistan are all authoritarian states, “hostile to democracy and the
rights of citizens” (Starr 2006). Moreover, they still experience post-Soviet effects of
corruption, authoritarian political regimes, and social inequality (Meissner 2010).
There is a big difference between economic development and economic growth. Even
though a country might have reached relatively high economic growth rate, it might be
quite underdeveloped in regards to its real economy. Often resource earnings do not go
anywhere but to the same sector in order to develop it and gain more revenues next time.
At the same time, much of the resource rents are still received “in the form of taxes from
the private magnates” (Treisman 2010). Economic growth may not be reflected in other
areas of the economy. Such difference clearly explains why even though some countries
are performing very well in regard to their economic growth rates, they are still suffering
from overall poor economic development.
Azerbaijan and Kazakhstan are among the biggest producers and exporters of oil and
natural gas: however, during the Soviet time these countries were poorly developed
economically. The fact that Azerbaijan and Kazakhstan used to export about 211.000
and 997.000 barrels of oil per day respectively even in the beginning of 2000’s (Amineh
2006), provides the biggest ambiguity in the question of high resource endowment. May
the paradox seem any more obvious? Due to autocratic presidentialism and low
economic diversification, these two countries did not succeed in overcoming resource
curse (Franke et al. 2009). In addition, Russia, Azerbaijan and Kazakhstan were under
authoritarian rule rather than a democratic one: opposition is repressed by the state,
elections are manipulated, human rights and society development are not in the highest

21
priority (Amineh 2006). Old communist rules and post-Soviet political culture and
habits still remain strong, and any changes happen in a very slow pace. Amineh (2006)
indicated that authoritarian rule in former Soviet states is running by the same elites
staying in power during the Soviet times. The rent-seeking orientated policy supports
national elites with privileged access to resource rents which becomes the main factor
for accumulating centralized power (Franke et al. 2009). In general, such resource boom
tends to increase regional imbalances, instead of correcting them (Meissner 2010). Thus,
the ability to recover using resource exports income and not to get trapped into resource
curse is the key question for countries suffering from authoritarian rule nowadays.
The interaction between natural resource abundance and the state will be investigated in
greater detail: in particular, better theoretical explanations of the paradox within country
cases will be studied. The main research purpose is to investigate the possible paradox in
the countries of the former Soviet Union, and how they manage to struggle with the
curse. The country cases including Azerbaijan, Russia, Kazakhstan, and Turkmenistan
will be analyzed due to their high endowment of natural resources and expected
similarities in economy, governmental policies, and society. In addition, it is essential to
see how countries have been performing after the collapse of the Soviet Union, and how
resource abundance affected their development.
3.1.1. The case of Azerbaijan
Republic of Azerbaijan is a country that attracts much interest of international
community due to its abundance of natural resources (two thirds of the country is rich in
oil and natural gas) and geographic location along the Caspian Sea. The total country’s
area is 86.800 square km with around 8.9 million of population (by 2010). Apart from
oil and gas, the country has rich deposits of minerals such as ferrous and non-ferrous
ores, nonferrous metals, semi-precious stones, bauxite, and a variety of thermal, mineral,
and natural spring water (Shekinski 1995).

22
Azerbaijan is one of the most valuable spots in the world in terms of oil exploration. The
current structure of the Azerbaijan’s economy has been influenced a lot by foreign
investments, since the end of 1990s (Franke et al. 2009). Starting from 1998, oil rents,
production and exports have increased (Fig. 4). The current economic development of
the country is highly dependent on the export of oil and gas: about 50% of GDP is taken
by the share of oil rents, and about 7 % by natural gas rents on average. A share of fuel
exports in merchandise exports remains extremely high over the whole period since
1998. This indicates a huge dependence of the country’s economy on natural resources;
such exports distribution indicates a basis for resource curse in Azerbaijan as is known
from the literature. About 94% of the country’s exports are taken by a petroleum share.
Only few non-oil categories of exports have shown an increase since 1999 (e.g.
machinery), while the majority have changed little; exports in Azerbaijan “have
remained concentrated on oil and have not diversified” (O’Lear 2007).
Figure 4. Fuel exports as % of merchandise exports; natural gas and oil rents as % of GDP,
Azerbaijan 1998-2010; source: DATA Market
The process towards being a democratic state started in 1992; however, democratization
in the country faced many challenges. Azerbaijan was not yet ready to follow the
Western style of democratic reforms (Mastro and Christensen 2006), and thus was far
from building a respective society. In 1993, a new President Heydar Aliyev was elected
which became a great step for the country: Aliyev remained one of the most influential
0
10
20
30
40
50
60
70
80
90
100
Year 1999 2001 2003 2005 2007 2009
Fuel exports (% of
merchandise
exports)
Natural gas rents
(% of GDP)

23
figures during 1980s and 90s and was the one to start the process of democratization.
However, Aliyev’s success in keeping his promises is controversial. During Aliyev’s
rule there was a will to gain power and wealth by elites, using nationalism and
aggressive foreign policies (Rasizade 2002), creating a dictatorship rather than a
democratic society. Having democratic institutions, the country’s government could not
provide enough law and rights to support them. Therefore, Azerbaijan’s political system
includes both elements of democracy and authoritarianism (Mastro and Christensen
2006). Azerbaijan is a unitary state which means all its administrative divisions are
under the rule of the central government. In practice, the real power is taken by
executive authorities that are not interested in developing and financing local
governments (Heinrich 2010). This clearly refers to a lack of institutional quality and
local development in the country. Being an Islamic society, Azerbaijan’s support for
secularism is high (Cornell 2006), and the country has a very traditional approach in all
spheres of life. It is important to consider that religion became a unifying mean in order
to lessen the frustration from the conflict with Armenia, and somehow overcome the
post-Soviet identity crisis.
Azerbaijan has the highest per capita number of war refugees in the world, still suffering
from the effects of the conflict on Nagorno-Karabakh (Heinrich 2010). Such conditions
provide economic difficulties, social conflicts, and demoralized society. Inefficient
public administration along with corruption is an obstacle on a way to running essential
agricultural and trade policy reforms. In Azerbaijan, families, clans and patronage are
more influential in terms of society than formal legal institutions (Franke et al. 2009);
politics is no doubt an elite matter. Clan leaders often became national leaders
presenting the paradox of Soviet system (Starr 2006). Most influential elite group has an
access to oil and gas rents which makes people not to try changing the political system,
but attempt to become a part of it themselves (Heinrich 2010).
O’Lear (2007) in her work analyzes to what extent the resource curse paradox appears in
Azerbaijan after the collapse of the Soviet Union. Since 1990s, “oil production and
exports have increased” which increased much the overall national wealth.

24
Unfortunately, income from oil exports did not seem to be invested in other sectors of
the country’s economy; manufacturing and light industry sectors have been poorly
performing. However, the construction and communication sectors benefited from the
expanding oil sector, but only due to their necessity in the process of oil production and
export. Thus, export wasn’t diversified, and the main focus remained on oil sector:
government spending on social welfare generally increased after late 1990s but still not
to be compared with oil revenue rates. According to O’Lear, the percentage of total
government spending in areas such as public order and justice, housing and community
affairs, health, and public works has declined over time. Azerbaijan’s infrastructure and
education receive little funding which affects the whole economic situation of the
country. Inequality remains one of the biggest problems, in spite of a relatively steady
increase of average monthly wages. However, this increase is caused mostly by the
growth in wages of oil industry employees, while those involved in social sectors and
agriculture do not earn more over time.
In 1999, the State Oil Fund of the Republic of Azerbaijan (SOFAZ) was established to
accumulate oil and gas revenues in order to lessen the effect of resource curse and
provide stability. Among others, the main objectives of SOFAZ are to decrease oil
dependence for future generations, provide generational equality and allocate funding
for essential socio-economic projects within the country. The Fund financed
improvement of social conditions of refugees (O’Lear 2007), Baku-Tbilisi-Kars railway
construction, youth educational program; from 2013 the Fund started investing in a
variety of projects (e.g. oil refinery construction, construction of broadband internet
access network, construction of new drilling rigs in the Caspian Sea). Such system of
financing various areas of the economy and society from resource rents represents
positive steps towards avoiding the resource curse and turn it rather to a blessing.
As it has been mentioned before, centralization of political control is harmful for a
“resource cursed” economy. Officially, oil was described as the main source of national
wealth in Azerbaijan by President Heydar Aliyev. In 1994, Aliyev signed the contract on
the expansion of oil production financed by foreign investors which made a country

25
undoubtedly oil-dependent. Aliyev was the one to centralize power which became a
great obstacle to build the democracy: moreover, his own son became the next President
of the country. National elections of 2003 were criticized by the Organization for
Security and Cooperation in Europe and the Council of Europe; however, this criticism
was followed by imprisonment of the opposition which raised further dissatisfaction
with ruling regime.
It is important to understand how Azerbaijan’s citizens perceive the country’s policy and
governmental actions as these indicators are useful in presenting internal legitimacy.
O’Lear (2007) presents a survey study of 2004 with a broad range of people from
different ages, geographic zones, and ethnic groups. Main citizens’ concerns were
analyzed, as well as their expectations for changes, reliance on the governments,
perceptions of governmental policy, and their progress assessment. The results from her
work are presented in Figure 5.
Figure 5. Major areas of concern among Azerbaijan’s citizens, O’Lear, 2007
As one can see from the picture, citizens were mostly concerned about material well-
being, the high unemployment, and other social problems. This finding is crucial
because the issues people are concerned about seem to show up all over the country, and

26
not in one particular region. Despite the high resource endowment and rents, Azerbaijani
people still face such basic problems as a lack of heath care and gas supply.
Other main issues from O’Lear’s work were referred to overall dissatisfaction of the
country’s economy: even though people are aware about the boom in oil export in recent
years, a family’s economic situation remains the same or becomes even worse. A little
optimism was shown by the respondents about future changes; however, about 87% of
the people indicated that national government is to dictate their well-being significantly.
The international image of Azerbaijan was positively noticed by the majority of
respondents: governmental attempts over time succeeded in bringing an image of
political legitimacy in the eyes of international community. Nevertheless, people still
struggle to achieve at least some stability in their day-to-day life. Assessments of
political freedom, the level of corruption and transparency results in a slow development
of the country’s policy towards political legitimacy and democracy.
A number of different polls were run in Azerbaijan in 2009, where citizens were asked
to assess their perceptions towards democracy, opinion freedom, media freedom, and
some others policy-related issues. For example, about 50% of respondents found it “very
important” to live in a democratic society; approximately the same amount of people
believe that the country needs a strong leader to make a meaningful change (Heinrich
2010). Free media and freedom of speech were desired by the majority of respondents as
well. Thus, people in Azerbaijan show a pro-democratic attitude in general; regardless
policy’s and economy’s disadvantages, the country wishes to follow a democratic way.
There is a strong need in establishing law and order in the country, which in future might
lead to a democratic regime (Heinrich 2010).
An interesting conclusion made by Giragosian and Welt (2003) makes one to reconsider
resource abundance as the main factor of running Azerbaijan’s economy. They observed
that the country can no longer rely on its energy reserves as they are losing their
strategic importance due to Iraqi oil resources. At the same time, the authors see a good
point of necessary diversification of the economy and more responsible economic

27
actions due to limited investments. Such a decrease of oil and gas production can
become a cure on the way to develop other industries.
3.1.2. The case of Kazakhstan
Similarly to Azerbaijan, Kazakhstan is a state rich in oil and natural gas reserves:
however, natural resources provide many challenges on the way to reach economic,
political and social stability, and development. Revenues from oil and gas resulted in
high economic growth after 1990s, which did not provide much development of other
sectors of the economy. Lack of investments in non-resource sectors and overall
passivity to change are among the factors that are pushing back the Kazakhstani
economy, allowing the elite rule the situation (Smit 2008).
Economic situation in Kazakhstan experienced a number of positive changes over time:
a substantial shifting of assets to the private sector, the expansion of banking sector,
liberalization policies, increased foreign investments become the main indicators of the
country’s economic development and rapid growth (Amineh 2006, Smit 2008).
Similarly to SOFAZ in Azerbaijan, the National Fund for the Republic of Kazakhstan
(NFRK) was established in 2000, having its main goals to save funds and stabilize the
economy. The NFRK accumulates a portion of oil, gas, and mining rents on the
Kazakhstani government account in the National Bank (Kalyuzhnova 2011). The
strategy of running the fund worked out over time: regardless the drop in oil prices, the
NFRK was used to stabilize the economy during the 2007-2009 financial recession. In
2010, a new concept of using and forming assets in NRFK was adopted by the
government, which showed a strong understanding of the fund’s key role in the
country’s economic development (Kalyuzhnova 2011).
However, Kazakhstani communist past still affects the present time: a limitation of basic
political rights and general power-seeking mechanisms remain strong (Franke et al.
2009). The political elite in Kazakhstan usually consist of people of strong family and
clan connections in power (Heinrich 2010). Kazakhstan is an autocratic state, and any

28
development towards democratic standards is slow and unstable. Autocracy often leads
to a rentier system of a state, with high dependence on natural resources.
The first President of the Republic of Kazakhstan, Nursultan Nazarbaev was elected in
1991, following with Kazakhstan’s independence from the Soviet Union. In 1995, due to
the change of the constitution, the country has become a presidential autocracy with an
even more increased power of the President. In 1998, a five-year presidency term was
changed to a seven-year one, and finally in 2007 it turned back to a five-year once again
regarding the only exception of Nazarbaev’s continuance in office with no limits.
Nazarbaev centralized the power in the executive branch (Heinrich 2010) after the
elections, reorganizing the structure of the parliament and administration over years.
Political parties and other social organizations are allowed to exist in Kazakhstan,
however, they tend to have a weak organization “with centralized decision-making
structure” (Heinrich 2010).
Analyzing Kazakhstani economy, the country is among the richest in oil, natural gas,
and coal reserves and production. Kazakhstan still remains since the Soviet times an
important energy exporter to the CIS (the Commonwealth of Independent States) with
about 42% of energy share in total output and 30% in Kazakhstani GDP (Oskenbayev
and Karimov 2013). Oil rents cover the largest percentage of the country’s GDP (around
30% on average); gas and coal rents are similar in percentage numbers (Fig. 6). A high
share of merchandise exports is taken by fuel: increasing over time, it is around 60% on
average which again indicated Kazakhstan’s dependence on natural resources.
29
Figure 6. Fuel exports as % of merchandise exports; natural gas, coal and oil rents as % of
GDP, Kazakhstan 1998-2010; source: DATA Market
Oil and gas, as for many resource abundant countries, represent the only real potential
for economic growth in Kazakhstan (Luong and Weinthal 1999). The problem of natural
resource ownership has been always vital for Kazakhstan due to broad international
involvement into resource extraction. Since the beginning of 90’s, large investments
were made into Kazakhstani resource sector by the USA. Such American companies as
Exxon Mobil Corporation, Chevron, ConocoPhillips, and others are the biggest investors
and owners of oil in Caspian region. In this case, one would expect the country to state
own its oil and gas to be independent from international actors, which does not yet
describe the situation in Kazakhstan.
3.1.3. The case of Turkmenistan
Turkmenistan is another former Soviet country, gained its independence in 1991, of high
endowment of natural and energy resources with similar problems to Azerbaijan and
Kazakhstan. The main sources in Turkmenistan are oil and natural gas: the country’s
proven reserves are estimated at around 4.3 % of World’s reserves (Meissner 2010). As
0
10
20
30
40
50
60
70
80
Fuel exports (% of
merchandise
exports) Natural gas rents
(% of GDP)
Oil rents (% of
GDP)
Coal rents (% of
GDP)

30
in many resource abundant countries, Turkmenistan’s government has been always too
optimistic about future resource rents: nevertheless, the country is absolutely dependent
on its natural reserves. The country has a huge stock of mining and raw chemicals, and it
possesses large deposits of raw materials for production industry. Since gas is the only
real export commodity, it simply equals power for the government. However, the
situation there tends to be even more controversial towards political and social
freedoms: the government restricts and controls almost every area of life. In addition to
this, resource exploitation became the main focus of the country’s economic policy
which affects development in many directions.
According to the World Report 2013, Turkmenistan nowadays remains one of the
world’s most repressive countries. Media, religious and even travel freedoms are
restricted, and internet access is limited; no place left for any social activism and human
rights defenders. Even though the country is expanding its relationships with foreign
countries, it neglects any changes towards human rights development. Everything exists
under the control of ruling elite, providing extremely repressive atmosphere. President
Berdymukhamedov was first elected in 2007: his cult of personality became enormous,
and in 2012 he was re-elected with about 97% of vote. There is a lack of competitive
vote in Turkmenistan, with a high level of imprisonment among popular activists or
those criticizing government. International society is concerned about human rights issue
in the country. The United Nations Human Rights Committee in 2012 issued a highly
critical assessment of freedom level, civil society activism, and the lack of an
independent judiciary in the country, among others. The state of women in
Turkmenistan has also been criticized with a concern on women’s unequal status and the
absence of specific legislation on any related issues.
Turkmenistan is a good example of a country that perceives natural resource abundance
as a cure against economic and developmental failures. However, the negative
consequences of relying on such exports have been neglected (Wigdortz 1996).
Turkmenistan’s economic reforms mostly suffer from slow-paced approach that makes
them impossible to come to life (Amineh 2006). The ruling elite in the country controls

31
resource rent streams, basically keeping it in secret from its own population and global
actors; at the same time, much money is wasted on numerous monuments and projects
that do not anyhow facilitate the economic development (Meissner 2010). Turkmen
economy, similarly to other “cursed” countries, suffers from the lack of linkages
between the gas sector and the all the rest (Wigdortz 1996). It has been a relatively low
economic growth in non-oil sectors of the country’s economy.
3.1.4. The case of Russia
Russia is the world’s leading gas and oil producer and commonly referred as being an
“energy superpower” (Rutland 2008). A variety of economists see Russia as a classic
example of the resource curse paradox as resources there seem to undermine democracy.
Oil and gas revenues account for more than 50% of the country’s budget; coal
production is relatively modest, regardless the amount of respective resources. The
country possesses also a massive metals industry, including iron, steel, and non-ferrous
and precious metals. Official statistics shows that Russia is undoubtedly a heavily
resource-based economy, and other alternative calculations with even higher figures
support these results. Russia has always benefitted from “cheap and accessible oil”, and
its future economic prosperity is largely based on current situation (Bradshaw 2006). In
2005, about 60% of Russia’s export earnings were accounted for oil and natural gas.
According to the country’s Energy Ministry website, in 2013 Russia reached the amount
of about 10.48 million barrels of crude oil output per day, which was close to Soviet
record; natural gas is the second biggest area of resource production in the country (Tab.
2).
Table 2. Natural resources production in Russia, 2012-2013, source: EIA, U.S. Energy
Information Administration
Resource type 2012 2013
Petroleum (thousand barrels per day) – total oil production 10239.16 10396.97
Natural gas (billion cubic feet) – total gas production 22213.23 21658.27
Coal (million short tons) – total coal production 367.986 387.121

32
Russian oil is exported to many countries in Europe and Asia. Being a single supplier for
some countries, e.g. Belarus and Ukraine (until 2014), makes the situation in those
countries vulnerable due to unstable resource prices and political situation. The gas
industry in Russia is more stable and less volatile with heavily regulated prices
comparing to oil sector (Rutland 2006). Russian company Gazprom is the world’s
largest gas company producing about 95% of the country’s natural gas and controlling
more than 25% of the world’s gas reserves (Wood 2007).
Russia is a country where some theories or paradoxes may or may not be applicable.
Being always perceived as a country doomed with the resource curse paradox, the
specifics of Russian case broadens the discussion with some interesting dimensions
(Bradshaw 2006). The country’s trajectory for future is still not very clear, therefore it is
extremely interesting to explore whether Russia is desperately falling victim to resource
curse or it has its own path in relation to resource abundance. Many economists see
Russia as a country that seeks power and influence (Wood 2007). The resource curse
paradox seems quite relevant to Russian reality as it creates political, social, and
economic risks for the country’s development (Goorha 2006). Auty (2004) concludes
that Russia is a good example of his staple-trap model, possessing all the characteristics
from being a non-developmental political state and performing poor economic reforms
to showing a high risk of growth collapse. In addition, such countries as Ukraine,
Belarus, Poland, and the Caspian States seem to be greatly influenced and controlled by
Russian oil as the country tends to reach its political and commercial goals. For some
countries Russia is simply “too politically unstable to be a reliable partner” (Rutland
2008).
Russia has a unique political history that starts from the authoritarian rule and imperial
legacy of tsar times, followed up by the world’s first proletarian dictatorship system
after 1917 and chaotic privatization process in 1990s with extreme volatility and the
collapse of ruble, finally leading to transitional democratic state nowadays. In this
context, the abundance of natural resources is crucial for framing the existing political
system due to its large influence in the past. Fish (2005) in his book discusses the

33
Russian path through resource curse and democracy: in general, resource abundance
neither affected the country’s modernization nor caused a rentier state situation. Not
everything related to natural resources in Russia is necessarily negative, even though the
majority might say so. Some of the energy rents are used to support domestic sector
through lower prices of gas and electricity within the country. Gazprom, for example,
spends some part of its revenues to subsidize domestic consumers (Rutland 2006).
Nevertheless, oil and gas wealth is the key element to intensify already existing
corruption and lack of economic liberalization. Regardless some good signs of avoiding
resource curse, Russia faces a number of negative “consequences” of the curse, namely
an over-valued exchange rate, high corruption level, poor infrastructure in most regions,
among others. Oil and gas provides higher corruption, according to various scholars. In
this case, “Russia perceived to be somewhat more corrupt than one would expect”
(Treisman 2010). Often decisions are made such that they support the enrichment of
individuals (e.g. oligarchs, state officials) but do not make much commercial sense
(Wood 2007). Generally speaking, resource abundance mixed with weak public
institutions and authoritarian politics lead to less freedom in the country, according to
close analysis and common perceptions. It is important to understand the nature of
Russia’s natural resource economy and how mechanisms of rent distributing operate
(Bradshaw 2006).
The largest Russian oil company is Rosneft, followed by Lukoil, Gazprom,
Surgutneftegaz, Tatneft, and some others. There are the problems in Russian energy
governance related to re-nationalism of the oil sector: natural resources belong mostly to
state-owned large corporations that are controlled by government officials, thus the state
remains a major player (Rutland 2008, Goorha 2006). Federal Government is the one to
control resource rents and redistribute them via formal taxation; much of these revenues
are received by the Government itself. However, the privatization process created a
large number of small independent companies that entered a competition which is
unusual in international perspective on oil industry (Rutland 2006). Both small and big
oil companies were struggling for control over assets so that politics and media became
the tools in this war. Thus, the state at that time wasn’t the one to get oil and gas rents,

34
which is common for resource curse countries. In the context of current situation,
resource rents are usually centralized geographically: most oil and gas companies have
their headquarters in big cities like Moscow or St. Petersburg, thus the distribution of
those revenues is far from equal (Bradshaw 2006). Other regions usually are quite
underdeveloped; to some extent resource companies invest money in supporting the
regions where they operate. Such strategy leaves little opportunity to develop new
sectors of the economy. Most economists conclude that Russia is lacking right reforms
“needed to promote diversification”, while running a tax regime preventing any
investments “needed to sustain production” (Bradshaw 2006). Regardless the country’s
resource wealth, the problem of resource curse arises due to bureaucratic approach, high
corruption, lack of incentives for creation democracy, and poor management (Rutland
2008). However, Rutland states that Russia is likely to overcome the curse due to its
strong manufacturing sector, “a modern society and a strong state tradition” which was
difficult to see during the transition years of the 1990s. Such sectors of the economy as
services, transport, and public ones are quite underdeveloped, but all “fairly immune to
Dutch disease”.
It would be erroneous to claim that resource abundance became the main factor for
slowing down the country’s democratic development: Russia has never experienced a
strong state of democracy due to its historical conditions (Rutland 2006). Such factors as
ethnic heterogeneity, social inequality, religion, and overall lack of democratic approach
over time are the first ones to blame rather than to accuse resource wealth itself. Rutland
(2006) provides an explanation for a positive change towards democratic society in
Russia, being the one to argue an undoubtedly cursed state of the country’s economy.
Starting from 1998, Russia has been involved in a strong recovery process with
significant improvements of the economy, including rising prices for oil and gas exports.
Rutland claims that President Vladimir Putin is far from being an ultimate dictator as
political freedoms along with press and personal ones exist to a certain extent. Judicial
system has been significantly improved, and the overall personal life of citizens is “quite
free”. Putin’s public image experienced both trust and distrust over time, but he is
generally perceived as a strong defender of Russia’s interests. He is not closing off the

35
Russian economy from the rest of the world, which results into stronger cooperation
with international partners. The raw data represents many improvements, including
doubling of living standards, large GDP increase, paying down foreign debts, among
others (Rutland 2008). At the same time, due to oil and gas abundance and their export
abroad, Russia is engaged politically and economically with the rest of the world, which
is important for a country being quite closed recently. The centralized economy that was
strong during the Soviet period was destroyed and successfully replaced by a market
economy after the collapse of the Soviet Union. Few measures are taken in order to
avoid “Dutch disease”, in particular, increasing the amount of imports and decreasing
exports, and making domestic manufactured goods less competitive (Wood 2007).
Nevertheless, a totally competitive market economy was not realized because of market
centralization: about 30% or the whole economy by 2001 was controlled by a very
limited number of firms (Rutland 2006), which shows a clear picture of wealth and
power concentration. Russia did not manage to develop “a progressive and stable”
taxation system and restrain “nationalistic instincts to appropriate assets”, so resource
abundance generally creates little opportunities to benefit a society (Wood 2007).
Regarding global integration, Russia became more integrated into global economy
comparing to Soviet times (Rutland 2006). Trade went from about 22% of GDP in the
beginning of 1990s to about 60% in 2004. Rutland claims that such rapid global
integration became one of the most successful aspects of the country’s market transition.
Nevertheless, such economic progress is mostly caused by developing energy-intensive
industries: the percentage of fuel exports has been increased dramatically since the mid
of 1990s. Manufacturing sector, despite its huge domestic share, has been decreasing
over the time in terms of exports (Fig. 7). Russian developed manufacturing industry
requires a high proportion of energy output domestically, which is not absolutely related
to resource cursed economy (Rutland 2006).

36
Figure 7. Shares of manufactured and fuel exports as % of merchandise exports, Russia, 1996-
2012, source: World Bank
Goorha (2006) discussed the relationship between fundamental natural resources and
politico-economic development of the country. In addition to general belief, natural
resources tend to facilitate market concentration and creating a monopoly; those in
power do not aim at any political or social changes to keep status quo. Another
important note is related to developing governmental management and functioning due
to its essential role in processing natural resources; public and private sectors’
collaboration “results in efficient market forces”. At the same time, resource abundance
usually holding back economic growth due to slow development of other sectors.
However, Goorha claims that in developing countries fundamental natural resources is
the key factor for economic growth; it happens mostly due to foreign direct investments.
In Russia, economic growth is truly related to the global oil prices but not to
technological development. Russian exports are dominated by natural resources, with
lower overall competitiveness of other sectors of the economy. The author’s suggestions
for Russia’s development are strongly related to a good regulation and operation policies
in resource sector, better integration with manufacturing industry, and modernization of
other manufacturing sectors.
0
10
20
30
40
50
60
70
80
1996 1998 2000 2002 2004 2006 2008 2010 2012
Manufactured exports (%
of merchandise exports)
Fuel exports (% of
merchandise exports)

37
Ahrend (2008) reviewed the economic evolution in Russia since 1999, arguing whether
Russia can follow successful examples of Australia or Norway, establishing strong
economic and political environment. After the financial crisis and the devaluation in
1998 the resource sector started to expand noticeably with an overall rapid recovery of
the economy, followed by oil-extraction boom in 2001-2004. At that time, natural
resource sectors accounted for around 70% of the growth of industrial production, with
45% for oil sector (Ahrend 2008). From 2004, a consumption boom became an
important driver of the economy and stimulated the service sector along with
construction boom and investments in other sectors. Thus, domestic manufacturing
sector received a relatively strong basis for further development. Ahrend (2008)
discusses what the potential advantages and challenges for Russia being a resource-
based economy exist in future. First, he claims that despite general beliefs, natural
resource abundance does not lead to the low technological level, especially in resource
extraction process. Second, poor economic performance may be caused not by resource
abundance itself but state ownership of large shares in key resource sectors. State
ownership can restrict the development, providing stagnation to a particular sector. The
author went through some main challenges of resource-based economy, namely
vulnerability to external shocks, institutional pathologies, among others. He believes like
a variety of economists that such problems can be overcome with appropriate
institutions and state policies, therefore “efficient structures with correct incentives will
become a key issue”. In regard to Russia’s growth prospects, Ahrend points out that
natural resource and service sectors are likely to remain the most important drivers of
the economy.
Treisman (2010) shows that such a large scale of resource-related problems in Russia is
quite exaggerated. The author questions the idea that political development in Russia is
doomed by oil and gas; in particular, he tends to find out the actual way the resource
curse operates in the country, providing strong evidence. It is questionable that less
resource endowment leads to more democratic state: cross-national data analysis
presents a relatively minor impact of large resource revenues. A country’s type is an
important thing to consider when claiming the curse existence. However, a general

38
worldwide belief is referred to the idea that “Russia would be more democratic today
with no oil and gas”. According to Treisman’s result, the effect of Russian oil and gas
revenues on economics and politics is surprisingly small. Thus, resource abundance
cannot explain the political changes over the years. Similar findings were observed from
different studies; natural resources seem at least not to lessen the democracy, while
increasing economic growth. An important conclusion made by Treisman (2010) is
referred to instability of resource rents: resource dependence along with price volatility
create a non-stable political environment.
In countries of high resource endowment, an essential question is related to revenues
management. Due to resource prices volatility, “fiscal volatility and economic
instability” are the ones to appear in resource-rich economies (Sugawara 2014).
Countries often introduce state-owned investment funds as fiscal instruments to stabilize
the economy and prevent its volatility, saving a certain amount of revenues for the
future. Such funds operate in many resource-rich countries (e.g. UAE, China, Norway,
Kuwait, Libya, and Russia). At the formal level, an important move in Russia to
diversify and develop the economy was to establish a Stabilization Fund in 2004
(Bradshaw 2006). Such tool was created to balance the federal budget, absorb excessive
liquidity, reduce inflation, and to protect Russian economy from any volatilities. In
2008, the Stabilization Fund was divided into the Reserve Fund, having a short-term
focus, and National Wealth Fund with a long-term focus (Caner et al. 2011). Until the
split, the aggregate amount of the Fund was constantly rising for over 3 years (Fig. 8).
Figure 8. Aggregate amount of the Stabilization Fund of the Russian Federation, 2006-2008,
source: The Ministry of Finance of the Russian Federation
0
50
100
150
200
8.1.2006 12.1.2006 4.1.2007 8.1.2007 12.1.2007

39
Nevertheless, a key issue is whether or not the Fund operates well in practice, mitigating
volatility. Caner et al. (2011) analyzed the performance of the Russian Stabilization
Fund during the crisis of 2008-2009, comparing it to the one in Norway. Sorrowfully,
but the Fund in Russia has been more unstable and not well operated in the long run.
However, economic fluctuations caused by oil price shocks were generally mitigated
during the crisis. The Fund has been criticized quite a lot over years by economists and
opposition: in particular, due to experts’ estimations, the Stabilization Fund has not been
operating efficiently, loosing large sums of money. Thus, it is not easy to claim whether
economic instability has been really reduced or it was just a temporal act.
Freedom of media in Russia has been always questioned by national and international
society. It is not a secret that major Russian media groups are controlled by large
companies and the state. Interestingly, Egorov et al. (2006) demonstrated that larger oil
reserves correlate with lower media freedom; such result appeared in both cross-section
and panel data analysis. As an example, the gas industry conglomerate Gazprom has
acquired many news media through its subsidiary Gazprom Media: such actions create
an environment where only a single view of Russian reality exists.
Not only media freedom is open to question. Official statistics in Russia is not always
trustworthy, and generally people expect the figures to be somehow exaggerated. Former
director of the Russian Statistical Research Institute, Vasiliy Simchera presented
information on, as he states, real statistical data of the period 2001-2010: clearly, the
estimates are far from reality (Tab. 3). Such ambivalence of key indicators of Russian
economic development may seem quite hopeless.

40
Table 3. Ambivalent assessment of key indicators of Russian economic development
Indicator OFFICIAL REAL
National wealth (trillions of $) 4 40
Intellectual capital (trillions of $) 1.5 25
Investments share in GDP, % 18.5 12.2
GDP growth rate, % 6 4
Average yearly inflation rate 6-8 18.27
Income gap (between 10% of rich and 10% of
poor), times 16 28-36
GDP gap among regions, times 14 42
Socially marginalized, % of total 1,5 45
Share of unprofitable entreprises 8 40
Tax evasion, % of income 30 80
Share of foreign capital, % 20 75
Modernization efficiency 25 2.5
Difference between producer and retail prices 1.5 3.2
Unemployment level, % to employment 2-3 10-12
Source:http://www.km.ru/v-rossii/2011/11/14/ekonomicheskaya-situatsiya-v-
rossii/obnarodovana-shokiruyushchaya-pravda-ob-isti
In Table 3 it is clearly seen that the values of main economic indicators are different for
official statistical reports and in reality. For example, the official share of investments in
GDP, estimated one and a half times larger than the real one, creates a picture of a false
prosperity. GDP gap among region is 3 times larger in reality: some provincial regions
are too poor comparing to those of a high budget.
3.2. Similarities and differences
It has been said a lot in regards to resource curse consequences that the former Soviet
countries tend to face with; yet there are many questions that should be addressed in this
context. It is essential to undermine not only consequences, but the reasons or the factors
facilitating the curse. In general, all resource abundant countries seem to follow

41
particular ways of governance and economic development: naturally, some of them due
to their size and initial economic conditions perform poorer than the rest. Nevertheless,
it is crucial to find out how countries decide to operate when they own vast natural
resources. Jones Luong and Weinthal (1999) rose very relevant to this issue questions: in
fact, what conditions affect a decision either to nationalize or to privatize resources?
How might the right of ownership affect the situation? Should the international
community be involved directly or not? These and other questions are the ones to be
asked when analyzing the extent of resource curse in a particular country. Having such a
historical happening as a collapse of the Soviet Union created a great basis for
researching these issues. Due to common Soviet legacies, the countries struggle to build
a truly civil society, with a developed industrial production sector, and gain a strong
national identity.
The question of resource ownership is absolutely crucial in investigating the curse
paradox. After the collapse, the countries started following “notably distinct strategies
toward developing their energy economy” (Luong and Weinthal 1999). Energy
development strategies highly affect political and economic conditions in both short and
long run, thus choosing the right strategy cannot be underestimated. Uzbekistan and
Turkmenistan continued operating under the state ownership of natural resources, while
Kazakhstan privatized its energy sector. Similar trends appeared in regard to attracting
international actors. Luong and Weinthal (1999) give an explanation for choosing a
particular energy policy by a leader: in short, the availability of alternative sources of
rent and the level of political contestation are the factors to shape policies. According to
their outcome, if a state leader has an access to alternative rents and a low level of
contestation, they can afford to retain state ownership and minimize international
involvement. When the situation reverses, it leads to the privatization of energy sector
and involvement of international actors. As one can observe from the country cases, not
much alternative rent sources appear in the former Soviet countries of high resource
abundance. For example, in Azerbaijan primary production takes about 90% of exports,
and this leaves no place for other sectors to develop. Thus, ruling elites are most likely
to concentrate their attention on already existing oil and gas rents.

42
It is interesting to see how similarly the former Soviet Union states perform in terms of
economic development. Azerbaijan, Kazakhstan, Turkmenistan, and Uzbekistan tend to
have a lot in common regarding their economy, society, and political approach, if to
compare with the other states. More importantly, these countries have almost identical
starting point when they took control over natural reserves (Luong and Weithal 1999).
As Amineh (2006) claims in his article, “it is unlikely that diversification and
industrialization will succeed” in Azerbaijan, Kazakhstan, and Turkmenistan. In their
cases, resource abundance leads to high inequality among citizens, corruption, and
sidedness of the economy. The very first problem to solve has to be centralization of
power: it brings inefficiency and authoritarianism. Second, Amineh affirms that raising
domestic demand for fossil fuels and decreasing supply will lead to less revenue from
resource exports, and overall economy will become more stable. In the Caspian states, it
is essential to strengthen institutions, to mitigate poverty issues and negative
macroeconomic effects, and to use resource rents wisely for further economic
development (Meissner 2010). Regarding the issue of political stability, its modification
over time can be observed from the Table 4. Here, the higher scores of the coefficient
correspond to better outcomes, meaning higher political stability. It can be seen that
Russia, for example, is far from being a good example of politically stable, as well as
Georgia. This indicator is often used in empirical estimation of resource curse paradox,
and it should affect positively economic growth.
Table 4. Political stability, Worldwide Governance Indicators, source: Heinrich, 2010
Country 1996 1998 2000 2002 2003 2004 2005 2006 2007 2008
Armenia 0.26 -0.87 -1.23 -0.81 -0.31 -0,56 -0,21 -0.28 -0.08 0.01
Azerbaijan 0.64 0.71 0.91 1.27 1.4 1.37 1.25 1.01 0.69 -0.48
Belarus -0.11 -0.11 -0.14 -0.02 0.16 -0.21 0.1 0.14 0.2 -0.45
Georgia -0.93 -1.59 -1.46 -1.47 -1.61 -1.03 -0.69 -0.9 -0.7 0.56
Kazakhstan -0.31 0.09 0.05 0.09 0.08 -0.15 -0.01 0.13 0.37 0.51
Kyrgyzstan 0.57 0.01 -0.48 -1.17 -1.25 -1.16 -1.14 -1.28 1.11 -0.68
Russia -1.02 -0.81 -0.69 -0.6 -0.85 -1.04 -0.98 -0.8 -0.75 -0.62
Tajikistan -2.59 -2.26 -1.86 -1.41 -1.41 -1.41 -1.33 -1.35 -0.87 -0.74
Turkmenistan 0.21 0.12 -0.01 -0.41 -0.6 -0.68 -0.23 -0.3 -0.08 0.93
Ukraine -0.23 -0.22 -0.37 -0.2 -0.31 -0.39 -0.37 -0.06 0.16 0.23
Uzbekistan -0.19 -0.48 -1.3 -1.3 -1.5 -1.59 -1.95 -1.7 -1.42 -0.91
43
Franke et al. (2009) investigate the cases of Azerbaijan and Kazakhstan as post-Soviet
rentier states. In particular, the focus of attention was a relationship between resource
income of the countries and resource policies. The post-Soviet states in the Caspian
region show very high level of external resource rent income. One can observe
similarities and parallels between these two countries in political systems, society
structures, geographical locations, and national identification, caused by communistic
era. The authors studied the differences and peculiarities of both countries’ natural
resource exploitation, and development of the whole economy.
In rentier states, government usually has no need to finance the budget with income of
the domestic economy or taxes as main funds are received from unearned income
(Moore 2004). Thus, citizens are not involved in government decisions as they do not
support them with taxes. Corruption, patronage, and nepotism are characteristic
problems of rentier states: elites are the one to receive and use resource rents. The same
situation could be observed in Soviet society that consisted of two main classes:
bureaucracy that manages the means of production, and the class of subordinates
possessing no means of production (Layenov 1992).
Regarding the cases of Azerbaijan and Kazakhstan, an old Soviet culture and new
network relations are mixed together. One problem refers to a “transformation from a
state-directed to market-oriented economy”. However, authoritarian approach is strong,
leaving no place for creating Western-style democratic society (Franke et al. 2009).
These countries represent a good example of post-Soviet rentierism: about 50% of GDP
is covered by resource rents.
Bayulgen (2005) in his study examines the effects or resource abundance on economy
and policy in Azerbaijan, Kazakhstan, and Turkmenistan. Crowding out the agricultural
and non-resource sectors is one of the major problems for resource-abundant countries,
along with weak governance, corruption, inequality, and undeveloped education and
health care spheres. President and ruling elites have almost a total control of resource
rents allocation and political system. Soviet legacy is one factor to blame as it created
weak society that needs to find its own path to develop a country.

44
There is a number of ways to see how equal resource rents are distributed in a society.
For example, Gini index is a good indicator to measure “how equitably a resource is
distributed in a population” (Farris 2010) of a particular country. Mathematically it is
based on the Lorenz curve that plots the cumulative percentage of received income
against the number of recipients. The line at 45 degrees represents the case of perfect
income equality. Thus, a value of Gini index may vary from 0 to 100, where 100 implies
perfect inequality. Usually, Gini coefficient is used to examine inequality among
country’s population based on income distribution. For majority of countries Gini
coefficient was last calculated in 2009: in Table 5 it is shown for majority of former
Soviet countries. In Turkmenistan, Uzbekistan, Russia, and Azerbaijan the value of
coefficient is relatively high, which reflects a certain level of inequality.
Table 5. Gini coefficient for former Soviet countries
Country 2009
Armenia 30.86 (2008)
Azerbaijan 33.71 (2008)
Belarus 27.67
Georgia 41.73
Kazakhstan 29.04
Kyrgyz Republic 36.19
Moldova 34.02
Russian Federation 40.11
Tajikistan 30.83
Turkmenistan 40.77 (1998)
Ukraine 26,44
Uzbekistan 36.72 (2003)
All in all, countries have different goals and approaches when it comes to resource
abundance: some of them strive for economy development and its diversity, while the
others tend to receive an instant profit. In Russia, politics is the one to define goals
related to resource sector development: in particular, natural resource endowment helps
to achieve geopolitical objectives and domestic political stability (Domjan and Stone
2010). By contrast, Kazakhstan resource policy is motivated mostly by economic goals:

45
the country is aiming at dispersing its economy. Even though resource nationalism might
look similar in Russia and Kazakhstan, it has different approach and characterized due to
the countries’ specifics.
In general, the former Soviet Union countries with high resource abundance tend to
perform and develop quite poorly in accordance with their background. Obtaining high
primary resource rents, economies do not grow as fast as they are supposed to, with a
general lack of development in non-resource sector. On the other hand, these countries
might have relatively high economic growth rates due to resource exports. It is essential
to understand that high economic growth rate does not lead to high population well-
being and economy development.

46
4. DATA AND METHODOLOGY
4.1. Econometric model
The econometric model used in this thesis is the extended version of two models: one
developed by Sachs and Warner (1997) and one taken from the work of Brunnschweiler
(2008). Sachs and Warner took primary exports over GDP as a resource abundance
indicator, being followed by many authors from this point onwards. However, not to
forget, this indicator has been criticized in many ways: in particular, there are counter-
examples like Germany or Australia, the rich counties of low primary exports. Secondly,
it is doubtful to claim that direct primary resource endowment provides harm to
economies; the way a country performs and relates to natural resources possibly causes
most troubles. Nevertheless, currently this indicator seems to be the best comparing to
the others due to its relative simplicity to obtain and much of previous analysis based on
it. Additionally, it is crucial to investigate the importance of institutions and other
explanatory variables in the model. Among those variables, some are expected to
explain the effect of resource abundance; however, it is a question of specific data and
methodology. The analysis will be based on the recent work of Oskenbayev and
Karimov (2013) and their econometric estimation due to possible similarities in the
analysis.
The study utilizes panel data to investigate the influence of natural resources on
economic growth. As it has been already said, panel data analysis provides consistency
to estimation and the use of it helps in controlling for country-specific effects. However,
usually using panel data does contradict the theory in regards to an effect of resource
abundance: in almost all cases the resource curse exists in the cross-sectional.
Nevertheless, in the current study the utilization of panel data is essential. Thus, the
econometric model has been identified as follows:
(1)
where is a natural logarithm of real average GDP growth rate, is initial income
per person employed (basic control variable), is a measure of point-source
resources exports in GDP, is a measure of diffuse resources exports in GDP,

47
is an indicator of institutional quality, and is a vector of other covariates (i.e.
openness, fixed investments).
The indicator of institutional quality was calculated as an unweighted average of five
indexes based on data from World Bank: a rule of law index, a control of corruption
index, a political stability index, a government effectiveness index, and a voice and
accountability index. The idea of institutional quality indicator was taken from the work
of Mehlum and Torvik (2006) with a correction to existing data. All these indicators are
positively correlated amongst each other. When the index approaches zero, institutional
quality is low and institutions are considered as grabber-friendly. According to the
recent theory, institutional quality is of high importance for economic development,
being counted as one of the main reasons for the curse. However, empirically it does not
yet have much support: institutional quality indicator, included into a model, often
appears to be non-significant.
Other explanatory variables are: openness – an index of a country’s openness and fixed
investments – the ratio of real gross domestic investments over real GDP. In relation to
resource abundance indicator, two main components of natural resources will be
analyzed: the point-source resources and the non-point source or diffuse resources. The
point-source resources are the ones of localized extraction and intensive production (e.g.
oil, gas, minerals), while the diffuse resources are characterized by more intensive
production (e.g. agriculture, food). In the model, the point-source resources indicator
will be presented as the share of fuel and ores and metals exports in GDP (fuels
comprise SITC section 3; ores and metals exports comprise SITC divisions 27, 28, and
68). The non-point source resources indicator covers the share of agriculture sector
exports (including livestock and food products) and wood exports in GDP (agriculture
exports including wood comprise SITC section 2 excluding divisions 22, 27, and 28).
Thus, the natural resources are divided into two main components, and the goal is to see
how each of them affects economic growth. In addition, the more detailed division
including all the above mentioned exports (fuel, ores and metals, agriculture) will be
studied in order to investigate the effects of each of them separately.

48
Ordinary least squares (OLS) method with fixed effects is commonly used for panel data
estimation. In panel data analysis, such effects are time independent. However, OLS
does not provide optimal model estimates if the model is not a standard linear
regression. For example, one serious problem of panel data estimation is related to serial
correlation between right hand side variables; serial correlation provides biased and
inconsistent estimates (Oskenbayev and Karimov 2013). Additionally, natural resource
abundance itself may be negatively interlinked with institutional quality with causality
running in both directions, which outweighs the positive direct growth influence
(Brunnschweiler 2008). This might be an over-identified simultaneous system, which
will turn into simultaneous bias and inconsistent estimates. To solve these problems, it is
rationally to use two-stage least squares (TSLS) method for estimation.
TSLS is applied in order to avoid simultaneous bias and inconsistency for estimated
coefficients caused by the model over identification. In particular, it solves the problem
of possible endogeneity of an explanatory variable. The method includes two main steps:
first, an estimated value of an explanatory variable is computed using instrumental
variables that are not correlated with the error term. Second, a linear regression model of
the dependent variable is estimated using the estimated value of the explanatory variable
obtained in the first stage. This provides the optimality of the estimation results.
The hypothesis for the current analysis is defined as following: dependence from high
point-source resources exports is harmful for a country, especially with a low quality of
institutions; diffuse resources are expected to influence the economy positively. Based
on the country analysis, the former Soviet states are most likely to experience slower
growth with higher point-source resource exports share, while dependence from
agriculture and forest resources exports seems to develop the economy due to its
diversification. However, it is important to understand that institutions along with
natural resource abundance may provide certain ambiguity to the estimation. For
example, it might be so a negative effect of resource abundance only appears with a low
institutional quality. Also, it is important to remember that higher economic growth does
not provide higher well-being for a country. Thus, the results should be interpreted
rather specifically. Both OLS and TSLS methods will be applied in order to estimate the
regressions, with further explanations on their efficiency and results.

49
4.2. Data description
The dataset employed in the current study contains panel data on 12 former Soviet
Union states, for a 13-year period from 1999 to 2011 (Table 6). The time-span was
chosen due to data availability; for a majority of countries it was not possible to collect
data for a longer time period. There are total 156 observations of each variable in the
model. The data was collected from World Bank, FAO, UN Database, and Gapminder
Foundation.
Table 6. Data description
Variable Abbreviation Description
Real GDP per capita annual
growth rate
GDP_GROWTH
Difference between current and previous
GDP levels per capita based on constant
local currencies, annual measure
Institutional quality
INST_QUAL
Unweighted annual average of five indexes
(a rule of law index, a control of corruption
index, a political stability index, a
government effectiveness index, and a
voice and accountability index)
Openness of the economy OPEN Sum of exports plus imports to the
country’s GDP, annual measure
Gross fixed capital formation
(investment) as % of GDP
INVEST
Annual measure of grow net investment in
foxed capital assets by enterprises,
government and households within the
domestic economy
Fuel exports FUEL Share of fuel exports in GDP, %
Ores and metals exports ORE_MET Share or ores and metals exports as a % of
GDP
Agriculture exports AGRI Share of agriculture exports as a % of GDP
Point-source resources
exports
POINT Sum of fuel and ores and metals exports as
a % of GDP
Non-point (diffuse) resources
exports
NON_POINT Agriculture exports as a % GDP

50
In Table 7 the descriptive statistics (i.e. number of observations, mean value, maximum
and minimum values, standard deviation value) of major variables is presented. The
calculations were made in Eviews econometric package. As it can be seen, point-source
resources standard deviation (14.74) is high in comparison to non-point source resources
(1.79), which points out a high volatility of point-source production.
Table 7. Descriptive statistics of major indicators
Variable Observations Mean Maximum Minimum Std. Dev.
GDP_GROWTH 156 6.20 33.03 -16.58 6.28
INST_QUAL 156 -0.35 0.99 -1.12 0.61
INVEST 156 24.49 57.70 13.51 6.85
NON_POINT 156 1.58 7.28 0.01 1.79
POINT 156 13.62 68.32 0.45 14.74
OPEN 156 1.02 1.77 0.48 0.29
4. 3. Basic panel analysis: data testing
Before estimating the model, some important tests to check for heteroskedasticity,
autocorrelation and multicollinearity problems of existing data will be running. Also, it
is essential to check whether the correlation among right hand side variables is high or
not. In our case, only institutional quality and initial income are positively and rather
highly correlated (corr = 0.74). This might turn into further negative effect of
institutional quality on economic growth. Due to a panel type of the existing data, the
problem of heteroskedasticity is not relevant. In order to detect serial correlation
(autocorrelation) in the model, Durbin-Watson statistics is utilized. In our case, it equals
1.47 and is not far from the required value of 2. Thus, the non-existence of serial
correlation in the model is detected.
In order to show graphically the behavior of GDP growth and total resource abundance
values for each country, a set of individual cross-sections is displayed (Fig. 9). From the
graphs it can be seen that resource abundance and economic growth generally follow the
same trends. Such behavior tells us that it might be rather positive effect of resource
abundance on economic growth.

51
Figure 9. Individual cross sections for 12 countries, data on GDP growth and total resource
abundance (point and non-point resources exports as a share of GDP)
-20
-10
0
10
20
99 00 01 02 03 04 05 06 07 08 09 10 11
arm
-20
0
20
40
60
80
99 00 01 02 03 04 05 06 07 08 09 10 11
azer
0
4
8
12
16
20
24
28
99 00 01 02 03 04 05 06 07 08 09 10 11
bel
-20
-10
0
10
20
99 00 01 02 03 04 05 06 07 08 09 10 11
est
-5
0
5
10
15
99 00 01 02 03 04 05 06 07 08 09 10 11
geor
-20
0
20
40
60
99 00 01 02 03 04 05 06 07 08 09 10 11
kaz
-5
0
5
10
15
20
25
99 00 01 02 03 04 05 06 07 08 09 10 11
kyr
-20
-10
0
10
20
99 00 01 02 03 04 05 06 07 08 09 10 11
lat
-20
-10
0
10
20
30
99 00 01 02 03 04 05 06 07 08 09 10 11
lit
-8
-4
0
4
8
12
99 00 01 02 03 04 05 06 07 08 09 10 11
mol
-10
0
10
20
30
99 00 01 02 03 04 05 06 07 08 09 10 11
rus
-15
-10
-5
0
5
10
15
99 00 01 02 03 04 05 06 07 08 09 10 11
GDP_GROWTH TOTAL_RES
ukr

52
In order to check the stationarity in the current dataset, a panel unit root test is utilized.
There is a variety of tests for analyzing the stationarity in panel datasets. Since the
existing data does not include a large number of panels, the Levin-Lin-Chu* (2002) test
is chosen to check the stationarity of the series (Tab. 8). The null hypothesis is that the
series has a unit root test, thus it is a non-stationary. The alternative hypothesis supports
the stationarity of the series.
Table 8. The Levin-Lin-Chu panel unit root test for GDP growth, Eviews
Panel unit root test: Summary
Series: GDP_GROWTH
Sample: 1999 2011
Exogenous variables: Individual effects
Cross-
Method Statistic Prob.** sections Obs
Null: Unit root (assumes common unit root process)
Levin, Lin & Chu t* -6.57314 0.0000 12 140
Null: Unit root (assumes individual unit root process)
Im, Pesaran and Shin W-stat -4.34378 0.0000 12 140
ADF - Fisher Chi-square 58.9925 0.0001 12 140
PP - Fisher Chi-square 52.3183 0.0007 12 144
** Probabilities for Fisher tests are computed using an asymptotic Chi
-square distribution. All other tests assume asymptotic normality.
Since p-value is smaller than 0.05% level (0.00<0.05), the null hypothesis of a unit root
can be rejected at this conventional size of 0.05. In other words, the GDP growth does
not have a unit root, and thus it is stationary. Additionally, other methods were applied
(e.g. Fisher tests) in order to check for stationarity. As it can be seen, all tests reject the
null hypothesis of unit root existence. Similarly, stationarity of other series in the current
dataset was checked. According to this, all series are stationary. Since all series in the
dataset are stationary, a panel cointegration test cannot be running.

53
5. EMPIRICAL TESTING
5.1. Ordinary least squares regressions
The results of the OLS regressions with fixed effects are reported in Table 9.
Institutional quality is included in the model due to its high importance. Since it is likely
that some relevant time-invariant control variables can be missing from the analysis,
fixed effects are included in order to eliminate omitted variable bias.
Table 9. OLS regressions, values calculated in Eviews
Dependent variable: GDP growth
Method: Panel least squares (Fixed effects)
Sample: 1999 2011
Reg. 1 Reg. 2 Reg. 3 Reg. 4
INITIAL_INCOME -0.0005* -0.0006* -0.0007* -0.0006*
(-4.01) (-4.07) (-6.11) (-4.01)
OPEN
12.47* 11.89* 10.49* 12.76*
(3.66) (3.44) (3.2) (3.75)
INVEST
0.26* 0.28* 0.29* 0.27*
(3.47) (3.61) (3.72) (3.54)
INST_QUAL
- 3.03 3.56 2.9
- (1.05) (1.24) (1.00)
POINT
0.39* 0.4* - -
(4.19) (4.28) - -
NON_POINT
1.31* 1.22 - -
(2.11) (1.95) - -
TOTAL_RES
- - 0.45* -
- - (5.11) -
AGRI
- - - 1.33*
- - - (2.15)
FUEL
- - - 0.4*
- - - (4.20)
(*) indicates that the estimate is significant at the 5% level

54
As it can be observed from the results, the signs of major variables do not contradict
theory. For example, country’s openness and investments have a positive significant
effect on economic growth, while initial income affects it negatively. Point-source and
diffuse resources indicators have a positive significant effect on economic growth when
institutional quality is not introduced into the model (Reg. 1). Once it is included,
agricultural exports variable become non-significant. This illustrates that point-source
resources have a positive effect on economic growth in combination with good
institutions. If to look at the signs of the coefficients, the effect of non-point resources is
about four times higher comparing to one from point resources. The obtained results
from Regression 2 determine that on average a 1%-increase in point-source resources
exports in GDP increases average economic growth by up to 0,4% over the period, and a
1%-increase in diffuse resources exports in GDP increases average economic growth by
up to 1.22% over the period. This shows the high dependence of economic growth from
agricultural resources in the former Soviet countries. This has indeed strong evidence
behind: the former Soviet countries still have mostly agrarian economies, thus their
exports is highly dependent from agriculture production. Importantly, the impact of
resource abundance appears only once fixed effects are included into the model, which
points out a certain correlation between resource abundance variables and some
unobservable characteristics. In Regression 3, total natural resources share in GDP is
utilized instead of resources division, following the idea of Sachs and Warner (1995). It
can be seen that after the resource indicator replacement, all variables except
institutional quality in the model remain significant at the 5%-level. In regards to
resource abundance effect, the results show that the 1%-increase in total resources
exports in GDP increases average economic growth by up to 0.45%. Institutional quality
has a positive significant effect on economic growth all regressions which supports
theory. Thus, it is possible to say that economic growth increases as institutional quality
improves. Institutional quality and total resources exports are negatively correlated,
meaning that in general when the quality of institutions is high for a country, the share of
total resources exports in GDP is low. At the same time, institutional quality is
negatively correlated with point-source resource, and positively correlated with non-
point resources. Therefore, when the quality of institutions is high for a country, the

55
share of point-source resources exports in GDP is low. This comes another way round
for non-point resources: when the institutional quality in a country is high, a share of
agricultural exports in GDP is also high. This fact simply explains the data obtained
from the former Soviet countries: usually, institutional quality is high when a country
does not possess much of primary resource such as oil and natural gas (e.g.
Turkmenistani, Uzbekistani, Russian economies). However, agricultural economies
usually come along with a bit higher institutional quality (e.g. in Belarus, Ukraine,
Latvia).
In order to observe the effects of different types of resources on economic growth,
resources were divided into three main categories, i.e. fuel, ores and metals, and
agricultural resources, and included in the model accordingly (Reg. 4). The signs of
main variables do not contradict theory, with a positive significant effect of fuel and
agriculture exports indicators on economic growth. As it was expected, a share of ores
and metals exports in GDP does not provide any significant effect on growth. Thus, this
variable was excluded from the further estimation.
There is a question whether GDP growth defines institutional quality or it comes another
way round. Such a situation brings up a possible problem of a double causality. Indeed,
high resources rents facilitate in rent-seeking behavior, diminishing the quality of
institutions; the resource abundance then may be negatively correlated with institutional
quality and outweigh the positive growth influence, as also concluded by
Brunnschweiler (2008) and later on by Oskenbayev and Karimov (2013). In order to
solve these problems, two-stages least squares method will be applied.

56
5.2. Two-stages least squares regressions
For running a TSLS regression, it is essential to identify a reduced-equation
simultaneous system. The equation (2) has been already identified in the beginning of
Chapter 3. Institutional quality is expected to be endogenous to the model. First, a
system of two simultaneous equations should be identified:
(2)
(3)
where is an instrumental variable for institutional quality. The instruments chosen are
country’s polity and latitude, as suggested by Brunnschweiler (2008). The polity index is
taken from the Polity IV Project (Gapminder Foundation), providing a range from -10
(institutionalized autocracy) to 10 (institutionalized democracy). Latitude alone explains
up to 40% of the institutional quality variation, while polity alone accounts for
approximately the same percentage. These instruments were chosen due to their high
correlation with the endogenous explanatory variable, i.e. institutional quality. The
instruments are utilized to compute the predicted values for the institutional quality
measure in the first stage. It is essential to have a number of instrumental variables to be
at least as many as the number of explanatory variables in the model.
Table 10 presents the results from TSLS estimation with the use of country’s latitude
and polity index as main instruments. The results confirm those obtained from OLS
regressions: in particular, the signs of all major coefficients do not contradict the theory,
presenting significance at 5%-level. Both point and non-point resources have a positive
effect on economic growth. In the same manner, point-source resources have smaller
effect on economic growth in comparison with agriculture resources. The effect of
institutional quality is positive but non-significant.

57
Table 10. TSLS regressions, values calculated in Eviews
Dependent variable: GDP growth
Method: Panel two stage least squares (Fixed effects)
Sample: 1999 2011
Reg. 1 Reg. 2 Reg. 3
-0.0008* INITIAL_INCOME -0.0008* -0.0008*
(-4.65) (-6.87) (-4.63)
OPEN
9.85* 8.69* 10.86*
(2.69) (2.56) (3.02)
INVEST
0.31* 0.31* 0.3*
(3.8) (3.93) (3.76)
INST_QUAL
4.65 5.57 4.17
(1.05) (1.32) (0.95)
- POINT
0.52* -
(4.71) - -
NON_POINT
1.13 - -
-
(1.68) -
TOTAL_RES
- 0.56* -
-
- (5.47)
AGRI
- - 1.27
- - (1.91)
FUEL
- - 0.54*
(4.71) - -
(*) indicates that the estimate is significant at the 5% level
Total resource exports in GDP have a positive significant effect on growth (Reg. 2).
Similarly, a division of resources by type was included (Reg. 3): both shares of fuel and
agricultural exports have a positive effect on economic growth, while a share of ores and
metals in GDP does not have any significant effect on economic growth.
The results obtained from both OLS and TSLS regressions argue the common findings
from resource curse literature. None of the resource abundance measures provide a
negative effect on economic growth; in turn, they provide a significantly positive robust
effect on growth. Institutional quality seems to provide no possible explanation for the
resource curse, even though theoretically it matters.
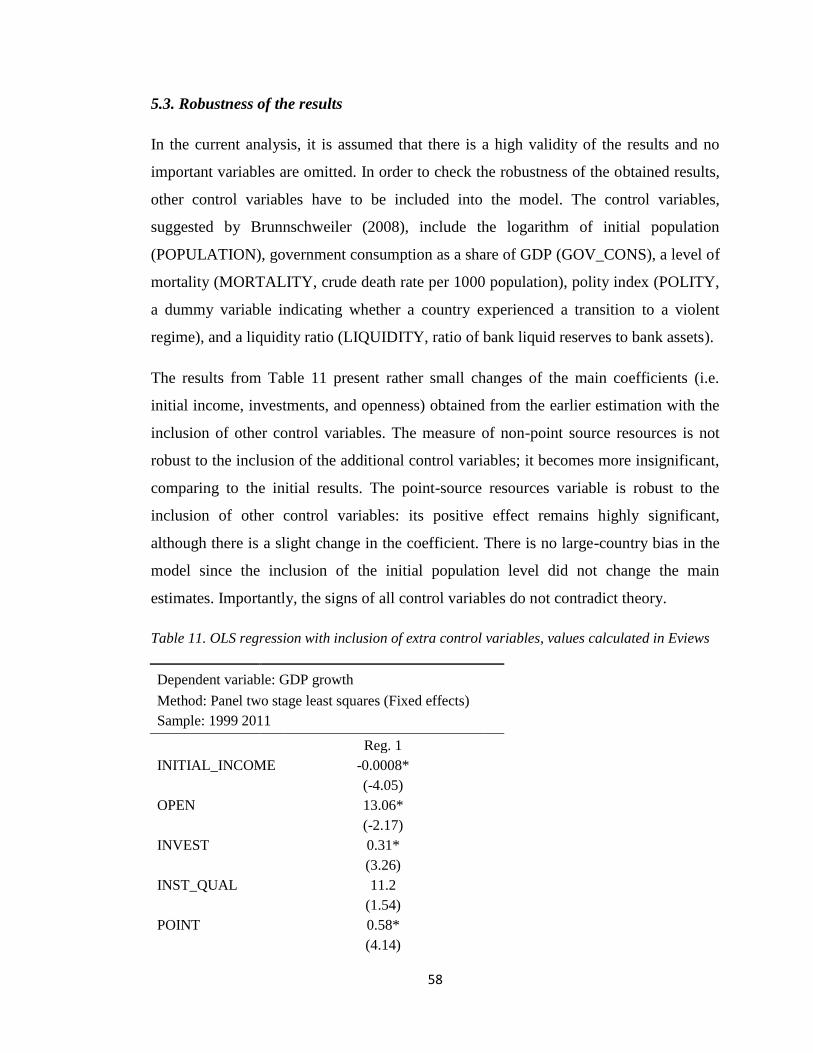
58
5.3. Robustness of the results
In the current analysis, it is assumed that there is a high validity of the results and no
important variables are omitted. In order to check the robustness of the obtained results,
other control variables have to be included into the model. The control variables,
suggested by Brunnschweiler (2008), include the logarithm of initial population
(POPULATION), government consumption as a share of GDP (GOV_CONS), a level of
mortality (MORTALITY, crude death rate per 1000 population), polity index (POLITY,
a dummy variable indicating whether a country experienced a transition to a violent
regime), and a liquidity ratio (LIQUIDITY, ratio of bank liquid reserves to bank assets).
The results from Table 11 present rather small changes of the main coefficients (i.e.
initial income, investments, and openness) obtained from the earlier estimation with the
inclusion of other control variables. The measure of non-point source resources is not
robust to the inclusion of the additional control variables; it becomes more insignificant,
comparing to the initial results. The point-source resources variable is robust to the
inclusion of other control variables: its positive effect remains highly significant,
although there is a slight change in the coefficient. There is no large-country bias in the
model since the inclusion of the initial population level did not change the main
estimates. Importantly, the signs of all control variables do not contradict theory.
Table 11. OLS regression with inclusion of extra control variables, values calculated in Eviews
Dependent variable: GDP growth
Method: Panel two stage least squares (Fixed effects)
Sample: 1999 2011
Reg. 1
INITIAL_INCOME -0.0008*
(-4.05)
OPEN
13.06*
(-2.17)
INVEST
0.31*
(3.26)
INST_QUAL
11.2
(1.54)
POINT
0.58*
(4.14)
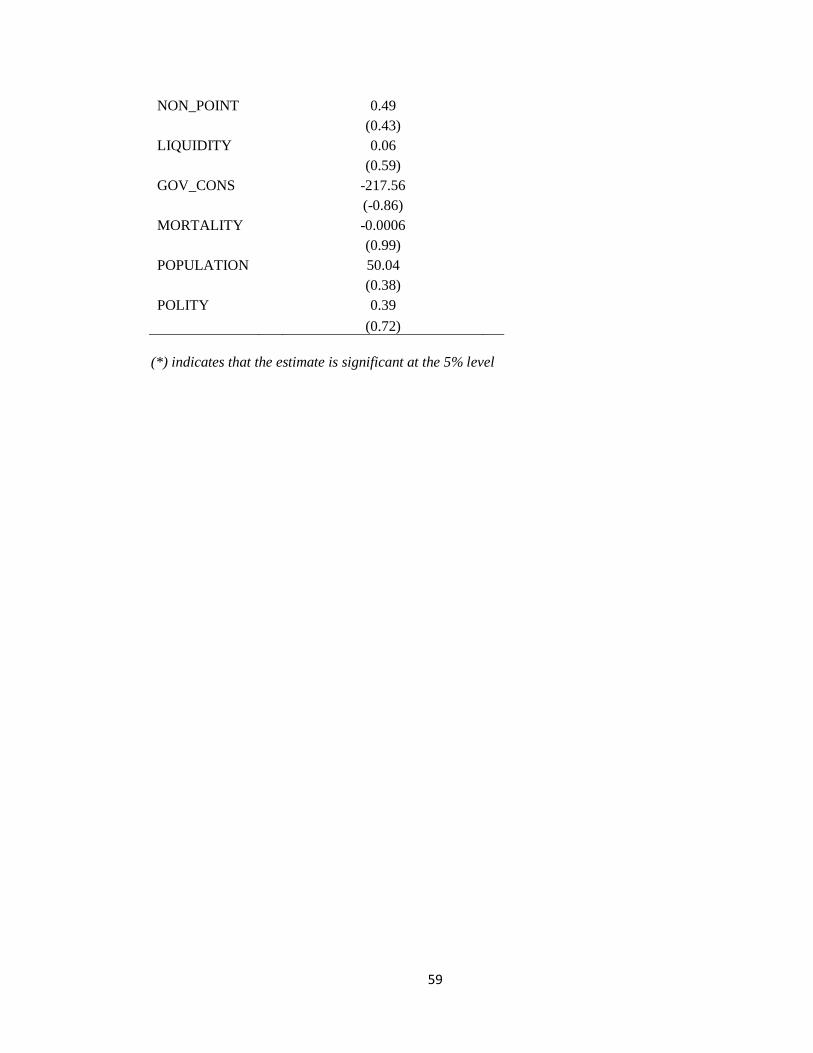
59
NON_POINT
0.49
(0.43)
LIQUIDITY
0.06
(0.59)
GOV_CONS
-217.56
(-0.86)
MORTALITY
-0.0006
(0.99)
POPULATION 50.04
(0.38)
POLITY
0.39
(0.72)
(*) indicates that the estimate is significant at the 5% level

60
6. DISCUSSION
The current study involves a wide theoretical and empirical analysis on the resource
curse paradox in the former Soviet Union counties. Arguing the initial idea of primary
resource’s effect on growth, the current explanation of the paradox in these countries
covers much discussion on resource management, the types of natural resources,
property rights, the quality of institutions, and political regime as the main reasons for
the curse. The research was based on two essential questions: how the countries have
been developing after the collapse of the Soviet Union in accordance with political,
social, and economical background, and how and to what extent primary resource
abundance affected their economic growth. The novelty of the current study involves
rather broad discussion on particular country cases and further empirical testing of the
econometric model based on data collected for the former Soviet countries.
The econometric model utilized in the current research was developed in accordance
with some earlier studies on the resource curse paradox. The research was based on
rather modern understanding of the paradox, considering the importance of institutional
quality and primary resources categorization. Similarly to the works of Brunnschweiler
(2008) and Oskenbayev and Karimov (2013), the resources were divided into two main
categories, i.e. point-source and non-point source resources; further on, more detailed
division of resources was studied, following Manzano and Rigobon (2001) and Boschini
et al. (2005).
In most of the earlier works, the resource curse was observed only by using cross-
sectional analysis, with a broad application of various methodologies. In the current
analysis, panel type of data was utilized due to a number of important characteristics,
following modern research of the paradox. In particular, panel data provides consistent
and unbiased estimates, which highly developed the utilized methodology and respective
outcomes. Also, a lack of respective data for former Soviet countries supported the
decision of using a panel type of data for a 13-year period in order to reach higher
number of observations.

61
The main results of the current study support some of earlier panel data research,
although there is much controversy in their interpretation. One common finding is
related to a highly significant positive effect of resource abundance on economic growth,
especially in regards to oil and natural gas exports. Such effect appears once country
fixed effects are introduced into the model. In these terms, institutional quality seems to
provide either no or little impact on economic growth, which rather contradicts the
general theory. Institutional quality seems to have no direct impact on economic growth,
although theoretically its importance was detected. However, the obtained results meet
certain support from some earlier studies, e.g. Manzano and Rigobon (2001), who also
found a positive influence of resource abundance on growth. In regards to institutional
quality, there are only certain former Soviet countries that possess much point-source
resource, while the rest have rather agriculture-based economies. For such economies,
grabber-friendly behavior is less likely to appear since agricultural resources are hardly
appropriable; in general, institutional quality has no effect on such economies.
Institutional quality and fuel exports are negatively correlated with each other, which
provides a certain evidence of a link between high oil and gas endowment and low
quality of institutions. In turn, agriculture exports are usually higher in the countries of
high institutional quality.
There is a question whether the paradox may only work for particular countries with a
certain background, and never appear for other countries. The current analysis is limited
to a particular dataset; however the analysis is not supported only by its empirical part
but also by presenting economic, social, and political background of the countries. All in
all, it can be seen that the current research obtains a certain support from earlier studies,
even though the scale is rather different.

62
7. CONCLUSIONS
This paper examines the existence of the resource curse paradox in the former Soviet
states since the late 1990s. As old Soviet legacies still remain strong, the countries are in
search of their own political, economic, and social paths. According to the main findings
from the literature, former Soviet economies that are highly dependent on natural
resources tend to develop rather slowly due to inefficient resource management, rent-
seeking behavior, high level of corruption, lack of political freedom, and poor
performance in non-resource sector. At the same time, while population well-being and
overall economy remain poorly developed, the growth rates of such economies are high.
This fact contributes to the ongoing discussion about the inequality of resource rents
distribution in society.
The empirical analysis in the current study was based on modern understanding of the
paradox, considering the quality of institutions as a main reason of the curse. The results
obtained from panel estimations support a number of earlier studies, indicating a positive
effect of fuel and agriculture exports on economic growth. It was shown that the type of
natural resources is of crucial importance: in the former Soviet states, agricultural
resources exports have the highest positive effect on growth. Mineral and fuel exports
affect economic growth positively as well; however, the effect is much lower. The
results are robust with inclusion of additional control variables. Generally, there is
evidence from the data that countries that possess much of primary point-source
resource usually have bad institutions; however, institutional quality appeared not to be
decisive for the curse.
Arguing the general idea of the resource curse paradox, high resource dependence tends
to have a positive direct association with economic growth in the former Soviet
economies. There still remain many questions for further analysis. Even though some
resource abundant Soviet states struggle with problems emerging from resource
dependence, the existence of the curse in them is not unambiguous.

63
References
Ahrend, R. 2008. Can Russia sustain strong growth as a resource based economy?
CESifo Forum 2/2008.
Amineh, M. P. 2006. The resource curse: oil-based development in Central Asia. IIAS
Newsletter № 42: 1 p. Available at:
Ascher, W. 1999. Why Governments Waste Natural Resources: Policy Failure in
Developing Countries. Baltimore: Johns Hopkins University Press.
Auty, R. 1998. Resource abundance and economic development. Improving the
performance of resource-rich countries. UNU-Wider: 73 p. ISBN 952-9520-73-5.
Auty, R. 2000. How natural resources affect economic development. Development Policy
Review 18(4): 347-364.
Baland, J. M. 1999. Rent-seeking and resource booms. Journal of development
economics 61(2): 527-542.
Bayulgen, O. 2005. Foreign investment, oil curse, and democratization: a comparison of
Azerbaijan and Russia. Business and politics 7(1): 39 p.
Boschini, A., Pettersson, J. & Roine, J. 2005. Resource curse or not: a question of
appropriability. The Scandinavian Journal of Economics 109(3): 593–617.
Bradshaw, M. 2006. Observations on the geographical dimensions of Russia’s resource
abundance. Eurasian Geography and Economics 47(6): 724-747.
Brunnschweiler, C. 2008. Cursing the blessings? Natural resource abundance,
institutions, and economic growth. World Development 36(3): 399–419.
Caner, M., Grennes, T. & Tuzova, Y. 2011. Tale of two funds: Norwegian and Russian
sovereign wealth funds during the crisis of 2008-2009. Available at:
http://www.cgu.edu/PDFFiles/SPE/workingpapers/econ/RNSWFNov14v7%5B1%5D.pdf
.

64
Cornell, S. E. 2006. The politicization of Islam in Azerbaijan. CACI-SRSP Silk Road
Papers. ISBN: 91-85493-20-0.
Damania, R. & Bulte, E. 2003. Resources for sale: corruption, democracy, and the
natural resource curse. University of Adelaide. Working paper № 0320: 41 p.
Domjan, P. & Stone, M. 2010. A comparative study of resource nationalism in Russia
and Kazakhstan 2004-2008. Europe-Asia studies 62(1): 35-62.
Economist Intelligence Unit. 2012. Country report: Azerbaijan. ISSN 1366-4077.
Egorov, G., Guriev, S. & Sonin, K. 2006. Media freedom, bureaucratic incentives, and
the resource curse. CEDI Working paper № 06-10.
Farris, F. A. 2010. The Gini index and measures of inequality. The mathematical
Association of America 117(12): 851-864.
Fish, S. M. 2005. Democracy Derailed in Russia. New York: Cambridge University
Press.
Franke, A., Gawrich, A. & Alakbarov, G. 2009. Kazakhstan and Azerbaijan as post-
Soviet rentier states: resource incomes and autocracy as a double “curse” in post-
Soviet regimes. Europe-Asia studies 61(1): 109-140.
Giragosian, R. & Welt, C. 2003. The South Caucasus: after the 2003 elections. CSIS
Russia and Eurasian Program. Available at:
http://csis.org/files/media/csis/events/031112_election.pdf.
Goorha, P. 2006. The political economy of the resource curse in Russia.
Demokratizatsiya 14(4): 601-611.
Gylfason, T. 2001. Natural Resources, Education and Economic Development.
European Economic Review 45 (46): 847 – 859.
Heinrich, A. 2010. The formal political system in Azerbaijan and Kazakhstan. A
background study. Arbeitspapiere und Materialien – Forschungsstelle Osteuropa №
107. ISSN 1616-7384.

65
Isham, J., Woodcock, M., Pritchett, L., & Busby, G. 2003. The varieties of resource
experience: How natural resource export structures affect the political economy of
economic growth. Middlebury College Economics Discussion. Paper 03-08.
Jensen, N. & Wantchekon, L. 2004. Resource Wealth and Political Regimes in Africa.
Comparative Political Studies 37(7): 816–841.
John, J. D. 2010. The “resource curse”: theory and evidence (ARI). ARI 172/2010.
Kalyuzhnova, Y. 2011. The national fund of the Republic of Kazakhstan (NFRK): from
accumulation to stress-test to global future. Energy policy 39(10): 6650-6657.
Kopstein, J. 2003. Postcommunist democracy: legacies and outcomes. Comparative
Politics 35(2): 231-250.
Korhonen, I. 2004. Does democracy cure a resource curse? BOFIT: 38 p. ISBN 051-
686-979-3.
Lane, P.R. & Tornell, A. 1996. Power, growth and the voracity effect. Journal of
Economic Growth 1: 213–241.
Layenov, V., Majewski, J. & Sokoloff, K. 1992. Bureaucrats, subordinates, and the
failure of Soviet Marxism. UCLA Dept. of Economics. Working paper № 670: 21 p.
Lederman, D. & Maloney, W. F. 2003. R&D and Development. World Bank Policy
Research Working Paper No. 3024. Available at: http://ssrn.com/abstract=402480.
Leite, C. & Weidmann, J. 1999. Does Mother Nature corrupt? Natural resources,
corruption, and economic growth. IMF Working paper: 34 p.
Luong, P. & Weinthal, E. 1999. Prelude to the Resource Curse: Oil and Gas
Development Strategies in Central Asia and Beyond. Comparative Political Studies
34(4): 367-399.
Luong, P. & Weinthal, E. 2010. Oil is not a curse: ownership structure and institutions
in Soviet successor states. 444 p.

66
Mahdavy, H. 1970. Patterns and Problems of Economic Development in Rentier States:
The Case of Iran.” In M.A. Cook, ed. Studies in the Economic History of the Middle-
East: 37 – 61. Oxford University Press.
Manzano, O. & Rigobon, R. 2001. Resource curse or debt overhang? Working Paper
8390, NBER, Cambridge.
Mastro, D. & Christensen, K. 2006. Power and policy making: the case of Azerbaijan.
Paper prepared for the annual meeting of the Canadian Political Science Association,
Toronto, ON, Canada. 10 p.
Mehlum, H., Moene, K. & Torvik, R. 2006. Institutions and the resource curse. The
Economic Journal 116(508): 1-20.
Meissner, H. 2010. The resource curse and rentier states in the Caspian region: a need
for context analysis. GIGA Working paper № 133: 43 p.
Moore, M. 2004. Revenues, state formation, and the quality of governance in developing
countries. International Political Science Review 25(3): 297-319.
Nosko, V. 2002. Econometrics: introduction to regression analysis of time
series. Moscow Institute of Physics and Technology. 273 p.
O’Lear, S. 2007. Azerbaijan’s resource wealth: political legitimacy and public opinion.
The Geographical Journal 173(3): 207-223.
Oskenbayev, Y. & Karimov, A. 2013. Is Kazakhstan vulnerable to natural resource
curse? UNU-Wider: 17 p. ISBN 978-92-9230-707-3.
Perälä, M. 2003. Does the type of natural resource endowment matter? UN University.
WIDER Discussion Paper No. 2003/37. ISBN 92-9190-456-2. 37 p.
Ranis, G. 1991. Towards a Model of Development. Liberalization in the Process of
Economic Development. Berkeley, CA: University of California Press: 59 - 101.
Rasizade, A. 2002. The Specter of a New “Great Game” in Central Asia. Foreign
Service Journal. Available at: http://www.afsa.org/fsj/nov02/greatgame.pdf.
67
Reporters without borders. Press freedom in Russia. Available at: http://en.rsf.org.
Ross, M. 1999. The political economy of the resource curse. World politics 51(1): 297-
322.
Ross, M. 2001. Does Oil Hinder Democracy? World Politics 53 (3): 325-361.
Ross, M. 2014. What have we learned about the resource curse? University of
California: 28 p.
Rutland, P. 2006. Oil and politics in Russia. Wesleyan University. Available at:
http://prutland.web.wesleyan.edu/Documents/apsa1.pdf.
Rutland, P. 2008. Putin’s economic record: is the oil boom sustainable? Europe-Asia
Studies 60(6): 21 p.
Rutland, P. 2008. Russia as an energy superpower. New Political Economy 13(2): 203-
210.
Sachs, J. & Warner, A. 1995. Natural resource abundance and economic growth. NBER
Working paper № 5398.
Sachs, J. & Warner, A. 1997. Natural resource abundance and economic growth –
revised version. Working paper, Harvard University.
Sachs, J. & Warner, A. 1999. The big push, natural resource booms and growth. Journal
of Development Economics 59: 43 – 76.
Sachs, J. & Warner, A. 2001. The curse of natural resources. European Economic
Review 45(1): 827 – 838.
Shekinski, A. 1995. The natural mineral resources of Azerbaijan. Azerbaijan
International. Available at:
Smit, P. 2008. Natural resource abundance and the resource curse. The case of
Kazakhstan. University of Amsterdam. Available at: http://epa.iias.asia/files/Pieter-
Smit-Natural-Resource-Abundance-and-The-Resource-Curse.pdf.

68
Smith, B. 2012. Measuring the resource curse: revisiting the politics of oil wealth.
University of Florida: 36 p.
Starr, S. F. 2006. Clans, authoritarian rulers, and parliaments in Central Asia. CACI-
SRSP Silk Road Papers. ISBN 91-85473-15-4.
Startz, R. 2013. EViews Illustrated for Version 8. University of California. ISBN: 978-1-
880411-19-3.
Sugawara, N. 2014. From volatility to stability in expenditure: stabilization funds in
resource-rich countries. IMF Working paper 14/43.
Tambovtsev, V & Valitova, L. 2007. Resursnaya obespechennost' strany i ee politiko-
ekonomicheskie posledstviya. Ekonomicheskaya politika 3 (7): 18-31.
Torres, N., Afonso, O. & Soares, I. 2013. A survey of literature on the resource curse:
critical analysis of the main explanations, empirical tests and resource proxies. CEFUP
Working Paper No 2013-02. University of Porto.
Torvik, R. 2002. Natural resources, rent seeking and welfare. Journal of Development
Economics Vol. 67 (2002): 455–470.
Torvik, R. 2009. Why do some resource-abundant countries succeed while others do
not? Oxford Review of Economic Policy 25(2): 241-256
Treisman, D. 2010. Oil and Democracy in Russia. NBER Working Paper No. 15667.
Wigdortz, B. 1996. The natural resource curse: the application for Turkmenistan.
Available at: http://wigdortz.tripod.com/naturalresource.html.
Wood, D. 2007. Part 1: Russia seeks global influence by exploiting energy geopolitics.
Oil & Gas journal 105(6): 20-24.
https://openaccess.leidenuniv.nl/bitstream/handle/1887/12773/IIAS_NL42_27.pdf?seque
nce=1
http://www.azer.com/aiweb/categories/magazine/32_folder/32_articles/32_minerals.htm
l

69
http://www.hrw.org/
http://www.km.ru/v-rossii/2011/11/14/ekonomicheskaya-situatsiya-v-
rossii/obnarodovana-shokiruyushchaya-pravda-ob-isti
http://www.minfin.ru/en/
http://www.oilfund.az/
http://www.worldbank.org/

70
APPENDIX
Natural resource exports by country
Source: http://www.indexmundi.com/trade/exports/
Armenia pig iron, unwrought copper, nonferrous metals, diamonds,
mineral products, foodstuffs, energy
Azerbaijan oil and gas 90%, machinery, cotton, foodstuffs
Belarus machinery and equipment, mineral products, chemicals,
metals, textiles, foodstuffs
Estonia
machinery and electrical equipment, wood and wood
products, metals, furniture, vehicles and parts, food
products and beverages, textiles, plastics
Georgia vehicles, ferroalloys, fertilizers, nuts, scrap metal, gold,
copper ores
Kazakhstan oil and oil products, natural gas, ferrous metals,
chemicals, machinery, grain, wool, meat, coal
Kyrgyzstan gold, cotton, wool, garments, meat, tobacco; mercury,
uranium, electricity; machinery; shoes
Latvia food products, wood and wood products, metals,
machinery and equipment, textiles
Lithuania mineral products, machinery and equipment, chemicals,
textiles , foodstuffs, plastics
Moldova foodstuffs, textiles, machinery
Russia
petroleum and petroleum products, natural gas, metals,
wood and wood products, chemicals, and a wide variety
of civilian and military manufactures
Tajikistan aluminum, electricity, cotton, fruits, vegetable oil, textiles
Turkmenistan gas, crude oil, petrochemicals, textiles, cotton fiber
Ukraine
ferrous and nonferrous metals, fuel and petroleum
products, chemicals, machinery and transport equipment,
food products
Uzbekistan
energy products, cotton, gold, mineral fertilizers, ferrous
and nonferrous metals, textiles, food products, machinery,
automobiles