strathprints.strath.ac.ukstrathprints.strath.ac.uk/36071/1/eprc_euroreg_cohe_rep_2010_p1.pdf · The...
122
THE OBJECTIVE OF ECONOMIC AND SOCIAL COHESION IN THE ECONOMIC POLICIES OF MEMBER STATES (No. 2009 CE 16 0 AT 018 / 2009 CE 16 CAT 014) FINAL REPORT PART I: MAIN REPORT EPRC and Euroreg November 2010
Transcript of strathprints.strath.ac.ukstrathprints.strath.ac.uk/36071/1/eprc_euroreg_cohe_rep_2010_p1.pdf · The...

THE OBJECTIVE OF ECONOMIC AND SOCIAL COHESION IN THE ECONOMIC POLICIES OF MEMBER STATES
(No. 2009 CE 16 0 AT 018 / 2009 CE 16 CAT 014)
FINAL REPORT
PART I: MAIN REPORT
EPRC and Euroreg
November 2010
European Policies Research Centre University of Strathclyde
Graham Hills Building 40 George Street Glasgow G1 1QE United Kingdom
Tel: +44-141-548 3222 Fax: +44-141-548 4898
E-mail: [email protected]
http://www.eprc.strath.ac.uk/eprc/
The University of Strathclyde is a charitable body, registered in Scotland, number SC015263.

Economic & Social Cohesion in the Economic Policies of Member States: Final Report
Preface
This is the Final Report of a study of the objective of economic and social cohesion in the
economic policies of the Member States, commissioned by DG REGIO and submitted by the
European Policies Research Centre (University of Strathclyde, Glasgow) and Euroreg
(University of Warsaw) under European Commission contract no: 2009 CE 16 0 AT 018 / 2009
CE 16 CAT 014.
The Report has been drafted by Fiona Wishlade, Frederike Gross and Professor Douglas Yuill
with significant contributions from Dr Martin Ferry, Stefan Kah, Carlos Mendez, Dr Katja
Mirwaldt, all of EPRC, and by Professor Grzegorz Gorzelak and Dr Marek Kozak of Euroreg.
This Report draws on, analyses and synthesises national reports produced in cooperation
with National Experts from each of the EU Member States. Their research contributions are
gratefully acknowledged:
AUSTRIA Hildegard Oraze Metis GmbH BELGIUM Luc Broos, Nienke Pilkes ERAC BULGARIA Julia Spiridinova ProInfraConsult Ltd CYPRUS Dimitrios Lianos, Victoria Chorafa LKN Analysis CZECH REP Jiri Blazek, Marie Maceskova Charles University DENMARK Henrik Halkier Aalborg University ESTONIA Kristiina Tonnisson Tartu University FINLAND Kaisa Lahteenmaki-Smith, Petri Uusikyla Net Effect FRANCE Georges Mercier ADT Consult GERMANY Helmut Karl Ruhr University GREECE Dimitrios Lianos, Victoria Chorafa LKN Analysis HUNGARY Hildegard Oraze Metis GmbH IRELAND Irene McMaster EPRC ITALY Manuela Crescini, Eleonora Carnevali RESCO LATVIA Tatjana Muravska University of Latvia LITHUANIA Jonas Jatkauskas, Inga Bartkeviciute,
Edvinas Belevicius BGI Consulting Ltd
LUXEMBOURG Luc Broos, Nienke Pilkes ERAC MALTA Lino Briguglio, Stephanie Vella Malta University NETHERLANDS Luc Broos, Nienke Pilkes ERAC POLAND Grzegorz Gorzelak, Marek Kozak EUROREG PORTUGAL José Lúcio, Regina Salvador New University of Lisbon ROMANIA Daniela-Luminita Constantin Academy of Economic
Studies, Bucharest SLOVAKIA Martin Obuch Consulting Associates SLOVENIA Damjan Kavas Institute for Economic
Research, Ljubljana SPAIN Jaime del Castillo Hermosa, Silke
Haarich Infyde
SWEDEN Kai Boehme SWECO EuroFutures UK Martin Ferry EPRC
Further, EPRC and Euroreg would like to record their appreciation to Angel Catalina-
Rubianes and Magdalena Zaleska of DG Regio for their constructive cooperation, support
and good working relationship during the study.
European Policies Research Centre Euroreg i

Economic & Social Cohesion in the Economic Policies of Member States: Final Report
European Policies Research Centre Euroreg ii
The authors would also like to thank other research colleagues in EPRC who assisted with
the research at various stages – Dr Sara Davies, Dr Irene McMaster, Rona Michie, Mark
Penman, Laura Polverari and Heidi Vironen. Moreover, the timely and effective
management of this project would not have been possible without the excellent
administrative and secretarial support of Lynn Ogilvie and Alyson Ross.
Notwithstanding the above acknowledgements, the contents and views expressed in this
Report are those of the authors in EPRC and Euroreg, and they do not necessarily reflect
the opinions or policies of the European Commission. Any errors or omissions remain the
responsibility of the authors.
Glasgow/Warsaw, November 2010

Economic & Social Cohesion in the Economic Policies of Member States: Final Report
CONTENTS
1. INTRODUCTION ..............................................................................1
2. ECONOMIC, SOCIAL AND TERRITORIAL COHESION – CONCEPTS AND OBJECTIVES .................................................................................................5
2.1 Introduction ..................................................................................... 5 2.2 EU perspectives................................................................................. 5 2.3 Academic and broader perspectives ........................................................ 9 2.4 National policy perspectives.................................................................14 2.5 Concluding points .............................................................................21
3. THE SCALE OF NATIONAL POLICIES TO PROMOTE COHESION .................... 23 3.1 Introduction ....................................................................................23 3.2 Scale and shape of public expenditure ....................................................23 3.3 National expenditure on economic and social cohesion ................................30 3.4 The relative importance of national cofinancing of EU Cohesion policy .............39 3.5 Concluding points .............................................................................43
4. NATIONAL POLICY INSTRUMENTS TO PROMOTE COHESION....................... 47 4.1 Introduction ....................................................................................47 4.2 Narrow regional policies with an explicit cohesion dimension.........................47 4.3 Broad regional policies with a cohesion dimension ......................................52 4.4 The cohesion role of sectoral policies .....................................................56 4.5 Concluding points .............................................................................61
5. THE IMPLEMENTATION OF NATIONAL POLICIES TO PROMOTE COHESION ..... 63 5.1 Introduction ....................................................................................63 5.2 The regional delivery of policy..............................................................63 5.3 Rescaling regional policy implementation: current trends .............................66 5.4 The coordination of policy...................................................................69 5.5 Ensuring efficient policy delivery...........................................................74 5.6 Concluding points .............................................................................77
6. THE IMPORTANCE OF EU COHESION POLICY......................................... 79 6.1 Introduction ....................................................................................79 6.2 Competitiveness - convergence dimension................................................80 6.3 Influence on strategic objectives and priorities..........................................81 6.4 Influence on financing........................................................................83 6.5 Interrelationships..............................................................................86 6.6 Influence on governance .....................................................................89
7. THE CRISIS AND ITS IMPACT ON COHESION POLICY ................................ 95 7.1 Introduction ....................................................................................95 7.2 The effects of the crisis on regional development.......................................96 7.3 The effects of the crisis on the regional policy response...............................98 7.4 Concluding points ........................................................................... 101
8. A TYPOLOGY OF NATIONAL APPROACHES TO COHESION ........................103
9. CONCLUSIONS.............................................................................107
REFERENCES ............................................................................................111
European Policies Research Centre Euroreg iii

Economic & Social Cohesion in the Economic Policies of Member States: Final Report
European Policies Research Centre Euroreg iv

Economic & Social Cohesion in the Economic Policies of Member States: Final Report
1. INTRODUCTION
This study is set within the broader context of Articles 174 and 175 of the Treaty of the
European Union. The overall aim of the study is to identify which Member State economic
policies (both national and sub-national) are of most relevance to the Community’s
economic, social and territorial cohesion objectives as set out in Article 174; and to
describe how such policies are designed and implemented with a view to determining how
and to what extent they contribute to the achievement of these objectives.
More specifically, the purpose of the study, as set out in the terms of reference, is:
first, to identify which of the economic policies of the Member States are most
relevant to the issue of economic and social cohesion;
second, to determine the degree to which economic and social cohesion is an
explicit objective of such policies and how such policies are conducted and
coordinated to achieve this objective;
third, to evaluate the relative importance of EU Cohesion policy (both
quantitatively and qualitatively) in the design and implementation of these Member
State policies to achieve economic and social cohesion;
and finally, to develop a general typology of the existing approaches of the Member
States to the attainment of economic and social cohesion.
The study is presented in two parts: a General Report which provides a comparative
overview of policies reflecting the key tasks outlined above (Part I); and a series of 27
Country Reports (Part II).
Following this introductory chapter, Part I comprises eight further chapters, as follows:
A discussion of the concepts and objectives of economic, social and territorial
cohesion. This considers European perspectives on the notion of cohesion, as well
as the wider background literature, before exploring Member State interpretations
of the concept.
An analysis of the scale of Member State spending on cohesion. By way of
background, this chapter begins with a brief overview of the magnitude and
patterns of total public expenditure in the Member States; it goes on to examine
national spending on economic and social cohesion and the relative size of national
cofinancing of EU Cohesion policy.
An overview of national policy instruments to promote economic and social
cohesion. This distinguishes three main types of instrument: narrow regional policy;
broad regional policy; and sectoral policies with a cohesion dimension.
European Policies Research Centre Euroreg 1

Economic & Social Cohesion in the Economic Policies of Member States: Final Report
European Policies Research Centre Euroreg 2
A review of the implementation of national policies to promote cohesion. This
considers to what extent and how policy is delivered in the regions; issues of policy
coordination; and the mechanisms for ensuring efficient policy delivery.
An assessment of the importance of EU Cohesion policy. This chapter explores the
role of EU Cohesion policies in national policies in relation to a number of key
dimensions, notably strategic objectives and priorities, financing and governance.
An appraisal of the impact of the crisis on national policies to promote
cohesion. Not originally envisaged in the call for tenders, this chapter aims to
provide a preliminary assessment of the effect of the crisis on regional problems
and on regional policy.
A typology of Member State policies to promote cohesion. This chapter draws
together the main strands of the report and seeks to group countries according to
their approaches to promoting cohesion.
Conclusions. The main messages to emerge from the report.
Part II of the report is delivered under separate cover and comprises information on the
regional problems and national policy responses for each of the 27 Member States. The
country-level information was produced by the National Experts in response to a detailed
checklist developed by the project team and agreed with the Commission services. This
national information was subsequently supplemented by additional insights and expertise
provided by EPRC staff1 on the basis of the Centre’s long-standing comparative regional
policy work for the EoRPA regional policy research consortium.2 This has been
complemented by comparative and national statistical data and maps, where available. The
final outcome takes the form of a series of country reports, one for each of the Member
States. These are set out in two parts:
First, a statistical overview comprising a series of tables and maps, specifically:
o Basic data on population, population density, surface area, GDP, GDP(PPS)
per head (Figure 1)
o A time series (1999-2007) of regional dispersion of GDP per head,
unemployment and employment at NUTS 2 and 3 (depending on availability
and applicability)3 (Figure 2)
1 Sara Davies, Martin Ferry, Frederike Gross, Stefan Kah, Carlos Mendez, Rona Michie, Katja Mirvaldt, Irene McMaster, Laura Polverari, Heidi Vironen and Douglas Yuill. 2 See http://www.eprc.strath.ac.uk/eorpa/default.cfm 3 Clearly data are more limited in countries with no NUTS 2 or 3 breakdown beyond the national level, as is the case for Cyprus and Luxembourg, for example.

Economic & Social Cohesion in the Economic Policies of Member States: Final Report
o A time series (1999-2007) of regional disparities in GDP, unemployment,
employment and household income at NUTS 2 and 3 (depending on
availability and applicability) (Figure 3)
o A map of regional disparities in GDP per head (2005-7) in relation to the
national average, generally at NUTS 2, but for some countries at NUTS 3
o A map of designated areas for regional aid 2007-13 (where available)
o A time series (2003-8) of cohesion-related expenditure expressed as a
proportion of GDP (Figure 4)
o Cohesion policy indicative allocations at current prices for 2007-13 (Figure
5)
o An overview of the scale of EU cohesion policy and related national
commitments for 2007-13 (Figure 6)
o Key areas of national spend on cohesion as identified in the national
expert’s report (Figure 7).
Second, a review of policy comprising the following elements:
o a brief overview of domestic Member State policies aimed at economic,
social and territorial cohesion; their legal basis, form and importance and
their relationship to EU Cohesion policy;
o a description of their objectives, including where those objectives are
found (constitutions, laws, White Papers, government statements etc.);
o a review of the regional problem, its nature and intensity and how it is
perceived within the Member State;
o a discussion of the policy response, covering three main potential
components of domestic economic development policies aimed at cohesion:
narrow regional policies (such as regional aids, but also policies targeted at
specific spatial characteristics); broader regional development policies
(reflecting all-region approaches to regional development); and sectoral
measures which either fall within the ambit of regional policies or which
have explicit economic cohesion objectives;
o a description of the main policy features of such economic policies aimed
at cohesion and how they impact on cohesion: the policy frameworks within
which they operate; the objectives of the different components of such
policies; the implementation of these policies and whether policy delivery
mechanisms help to support cohesion; and the degree of policy
coordination to cohesion ends;
European Policies Research Centre Euroreg 3

Economic & Social Cohesion in the Economic Policies of Member States: Final Report
European Policies Research Centre Euroreg 4
o a consideration of the relative importance of EU Cohesion policy in the
design of economic policies aimed at promoting cohesion, covering the
strategic objectives of policy as well as policy funding, governance and
impact;
o last a brief discussion of the impact of the economic crisis on regional
development and policy.
The country reports in Part II are complemented by an Annex which provides the statistical
data in a comparative format.

Economic & Social Cohesion in the Economic Policies of Member States: Final Report
European Policies Research Centre Euroreg 5
2. ECONOMIC, SOCIAL AND TERRITORIAL COHESION – CONCEPTS AND OBJECTIVES
2.1 Introduction
‘Cohesion is an ideal towards which societies have to strive continually. It is a goal to which they aspire, but never fully achieve. This makes precise definition elusive.’
This quote from the Council of Europe (2000) captures the difficulties associated with
pinning down the concept of cohesion. The literature on cohesion policy typically begins by
highlighting definitional problems. Begg et al (2003: 23), for example, note that “Cohesion
is not an easy notion to define and, although there is often a tacit understanding of what it
means, it is open to a variety of interpretations”. The aim of this chapter is to explore the
diversity of these interpretations and the evolution of the concept of cohesion over time.
The discussion begins with a review of how the concept is perceived at the European level,
especially by the European Commission. It goes on to consider broader academic thinking
on the economic, social and territorial aspects of cohesion. Last, it examines how Member
States have interpreted the concept of cohesion, focussing in particular on the geographical
dimension.
2.2 EU perspectives
A starting point for analysing the notion of cohesion is to review how it is defined and
explained at the EU level. The objective of economic and social cohesion was first
enshrined in the EU Treaty under a specific title through the Single European Act of 1986;
the territorial dimension was added under the Lisbon Treaty which came into force on 1
December 2009.4 A number of Treaty articles highlight the importance of economic, social
and territorial cohesion to the Union. Thus:
under Article 3 of the Treaty of European Union (TEU): the Union shall promote
economic, social and territorial cohesion, and solidarity among Member States;
under Article 4 of the Treaty on the Functioning of the European Union (FTEU) :
economic, social and territorial cohesion is a shared competence between the
Union and the Member States;
and under Article 14 (FTEU): without prejudice to Article 4 (TEU), Article 93 (FTEU)
regarding transport, Article 106 (FTEU) regarding undertakings with special or
exclusive rights, Article 107 (FTEU) regarding State aid, and given the place
occupied by services of general economic interest in the shared values of the Union
and their role in promoting social and territorial cohesion, the Union and the
4 Although the term cohesion did not appear in the Treaty of Rome, in its preamble the Member States did declare themselves ‘anxious to strengthen the unity of their economies and to ensure their harmonious development by reducing the differences existing among the various regions and the backwardness of the less-favoured regions.’

Economic & Social Cohesion in the Economic Policies of Member States: Final Report
Member States….shall take care that such services….fulfil their missions. (Emphasis
added).
More specifically, Article 174 (FTEU) reiterates the Treaty objective of promoting “overall
harmonious development” in the Union through the pursuit of “actions leading to the
strengthening of its economic, social and territorial cohesion”. The aim of these actions is
then stated as “reducing disparities between the levels of development of the various
regions and the backwardness of the least favoured regions” with particular attention given
to “rural areas, areas affected by industrial transition, and regions which suffer from severe
and permanent natural or demographic handicaps such as the northernmost regions with
very low population density and island, cross-border and mountain regions”.
The policy instruments assigned to the cohesion objective and their aims are specified in
Article 175 (FTEU):
the economic policies of the Member States should be conducted and coordinated
with a view to attaining EU cohesion
EU policies (including the implementation of the internal market) should contribute
to EU cohesion
and the Structural Funds (European Agricultural Guidance and Guarantee Fund,
Guidance Section; European Social Fund; European Regional Development Fund),
the European Investment Bank and the other existing Financial Instruments should
support the achievement of EU cohesion.
Title XVIII also includes an article on the European Regional Development Fund which aims
to help “redress the main regional imbalances in the Union through participation in the
development and structural adjustment of regions whose development is lagging behind and
in the conversion of declining industrial regions” (Article 176, FTEU). By contrast, the
Cohesion Fund is described as an instrument that is set up to “provide a financial
contribution” to transport and environment projects (Article 177, FTEU).
One final point of interest with respect to the Treaty is the Protocol No 26 on services of
general interest in context of Article 14 (FTEU), which notes:
the essential role and the wide discretion of national, regional and local authorities
in providing, commissioning and organising services of general economic interest as
closely as possible to the needs of the users;
the diversity between various services of general economic interest and the
differences in the needs and preferences of users that may result from different
geographical, social or cultural situations; and
a high level of quality, safety and affordability, equal treatment and the promotion
of universal access and of user rights.
European Policies Research Centre Euroreg 6

Economic & Social Cohesion in the Economic Policies of Member States: Final Report
Indications of European Commission thinking on the concept of cohesion can be drawn from
the Cohesion Reports, which have been published every three years since 1996. The First
Cohesion Report (European Commission, 1996) provided the first and most explicit attempt
by the Commission to define and operationalise the concept. At a normative level, the
report begins by linking the concept of cohesion to models of society in EU countries and
especially the values of ‘internal solidarity’ and ‘mutual support’ which aim to ensure equal
opportunities for all citizens to services of general benefit and protection. Moving towards
more operational and measurable cohesion targets, the report emphasised the geographical
dimension of ‘reducing disparities between the levels of development of the various regions
and the backwardness of the least favoured regions, including rural areas’, as stated in the
EU Treaty. In economic terms, the reduction of geographical disparities was interpreted as
meaning ‘convergence of basic incomes through higher GDP growth, of competitiveness and
employment’ (European Commission, 1996: 13).
The social dimension of cohesion was regarded as being more difficult to operationalise,
being more closely tied to the above-mentioned social market economy values. Key
systemic policies which contribute to social cohesion include universal systems of social
protection, regulation to correct market failure and systems of social dialogue. From a
dynamic perspective, the First Cohesion Report notes that the promotion of social cohesion
requires ‘the reduction of the disparities which arise from unequal access to employment
opportunities and to the rewards in the form of income’ (European Commission, 1996: 14).
Unlike the geographical approach informing the economic dimension of cohesion, specific
social groups are mentioned in the conceptual discussion - the long-term unemployed, the
young unemployed and the poor – and interpersonal equality (at an individual level) is
regarded as a key feature of social cohesion.
Three further points on the conceptualisation of cohesion are made in the report. First a
distinction is made between absolute and relative change in the dynamics of cohesion.
Although ‘convergence’ and the ‘narrowing’ of disparities between poorer regions and
between disadvantaged groups is mentioned as a core objective, the report also notes that
cohesion does not necessarily imply a reduction in either growth or jobs for other regions or
groups. Second, and related to this, cohesion is seen as being compatible with diversity in
the sense that the aim is not necessarily to achieve harmonisation, but rather greater
equality in economic and social opportunities. Third, a concern with long-term and
environmentally-friendly (sustainable) development should also form part of the concept of
cohesion.
Notwithstanding these latter observations, the report’s empirical analysis of cohesion
focuses on indicators relating to income (GDP per head), productivity (GDP per person
employed), the labour market (unemployment, employment) and poverty (indices at the
household level). In addition, trends are measured in terms of convergence at various
geographical levels (both national and regional, the latter including NUTS I, II and III) and
across social groups (youth unemployment, long-term unemployment, female employment
participation and poverty).
The Second Cohesion Report (European Commission, 2001) did not re-examine cohesion
from a conceptual perspective. The socio-economic analysis largely updated the previous
European Policies Research Centre Euroreg 7

Economic & Social Cohesion in the Economic Policies of Member States: Final Report
analysis of trends in economic and social cohesion disparities employing similar types of
indicators, but including a more detailed and disaggregated analysis at the sectoral level.
The report did, however, introduce the notion of ‘territorial’ cohesion, reflecting the EU
agreement on the European Spatial Development Perspective during 1999 which focused on
bringing about more balanced and sustainable polycentric development, while
acknowledging the close link with the Treaty’s commitment to ‘harmonious development of
the Union as a whole’ and the similar rationale underpinning territorial cooperation
programmes funded by the ERDF. The empirical analysis of the territorial dimension of
cohesion focused on centre-periphery patterns of development and spatial development
patters in urban areas, rural areas, border regions and areas with specific geographical
features (mountainous areas, coastal and maritime areas and islands).
The Third Cohesion Report (European Commission, 2004) followed the same approach as the
second report, updating the previous analysis on the basis of similar indicators for economic
and social cohesion, while also analysing projected growth and convergence dynamics in
the new Member States and the implications of an ageing population across the EU. More
importantly from a conceptual perspective, the Commission outlined some further thinking
on the concept of territorial cohesion. In particular, territorial cohesion was regarded as
being anchored in fundamental values embodied in the EU’s Treaty, especially the right for
citizens not to “be disadvantaged by wherever they happen to live or work in the Union”
and that “citizens should have access to essential services, basic infrastructure and
knowledge” highlighting the importance of services of general economic interest for
promoting ‘social’ and ‘territorial’ cohesion. Moreover, it defined the policy objectives of
territorial cohesion as supporting the achievement of “a more balanced development by
reducing existing disparities, avoiding territorial imbalances and by making both sectoral
policies which have a spatial impact and regional policy more coherent.” The indicators
used for the analysis of territorial cohesion were more sophisticated than in previous
reports, profiting from the work of the European Spatial Planning Observatory Network and
the Urban Audits undertaken by DG REGIO. The EU-wide empirical analysis considered a
range of broader development challenges than in previous reports (such as demographic
patterns, accessibility, public services provision, congestion and pollution etc.) and
additional spatial levels (such as metropolitan areas, cities and towns).
Progress reports on Cohesion have since been published on an annual basis. The first two
did not provide any further discussion of the conceptual underpinning of cohesion or
detailed analysis of trends in cohesion (European Commission, 2005; 2006). The same is
true of the latest Cohesion Report (European Commission, 2007) on the conceptual side,
although it did provide a thorough and detailed empirical analysis of economic, social and
territorial disparities, including in relation to Lisbon agenda themes.
Following the consultation on the Green Paper on Territorial Cohesion, the Sixth Progress
Report on Cohesion provided a summary of the responses and the current state of thinking
on territorial cohesion. It noted that there is no commonly agreed definition, but that there
is broad agreement on the goal and some basic policy implications. The goal is ‘to
encourage the harmonious and sustainable development of all territories by building on
their territorial characteristics and resources.’ With respect to policy implications, three
general and broadly agreed elements required to achieve the goal include:
European Policies Research Centre Euroreg 8

Economic & Social Cohesion in the Economic Policies of Member States: Final Report
Concentration: achieving critical mass while addressing negative externalities
Connection: reinforcing the importance of efficient connections of lagging areas
with growth centres through infrastructure and access to service
Cooperation: working together across administrative boundaries to achieve
synergies
The background document ‘Territorial cohesion: unleashing the territorial potential’ further
defined territorial cohesion proposes four dimensions of territorial cohesion (European
Commission 2009):
Territorial cooperation: besides cross-border, transnational and interregional
cooperation, other forms of cooperation are also deemed to promote territorial
cohesion, including macro-regions, European Groupings of Territorial Cooperation
(EGTC) or cooperation across external borders.
Fostering liveable urban and rural communities and strengthening ‘territorial
programming’ in Cohesion Policy, i.e. using local development methodology that
builds development strategies from the bottom-up as well as providing support for
urban-rural linkages.
Coordination and integration of Community policies for achieving greater policy
coherence: as differential sectoral policies often have unintended territorial
impacts, sectoral coordination is intended to promote synergies and thus promote
territorial cohesion. Territorial impact assessment and coordination in macro-
regions are seen as crucial to this end.
Territorial analysis and data collection for evidence-based policy-making: to
enhance the knowledge base for territorial development policies, a range of audits
and data collections are planned, including the ongoing urban audit, several ESPON
projects and data collection on cross-border and transnational regions.
2.3 Academic and broader perspectives
Academic commentary on cohesion tends to highlight the elusive nature of the concept,
while seeking measures or indicators that aim to concretise to notion. Begg et al (2003: 23)
suggests that cohesion “embraces inequalities, whether in income, living standards,
employment or environmental conditions, and also has to be seen in terms of opportunities
as well as outcomes.” Molle (2007: 5) contends that “Cohesion is a concept that has been
introduced in the EU policy without a precise definition” but that Cohesion is now
“understood as the degree to which disparities in social and economic welfare between the
different regions or groups within the EU are politically or socially tolerable”. While
Rumford (2000: 20) focuses more directly on the spatial dimension arguing that “the
‘problem of cohesion’ should be understood as the persistence or widening of economic
disparities between member states and/or their regions, despite attempts by the EU to
ameliorate the problem.”
European Policies Research Centre Euroreg 9

Economic & Social Cohesion in the Economic Policies of Member States: Final Report
While economic, social and territorial cohesion are seen as complementary aspects that
should not be separated in the EU policy discourse, the academic literature tends to
distinguish between the three concepts. In what follows, therefore, academic thinking on
economic, social and territorial cohesion is presented separately, while bearing in mind
that the three aspects of cohesion should not be separated in policy terms.
The academic literature on economic cohesion and the effectiveness of policy in attaining
its objectives has been dominated by studies of economic impact and convergence – see,
for example, Bradley (2006), Cappellen et al (2003), Ederveen et al (2002), Cuadraro-Roura
et al (2004). The underlying economic conceptualisation and disciplinary focus of these
studies has meant that their emphasis has been largely on macro-economic indicators
relating to income, productivity and employment as proxies for measuring cohesion, with a
view to analysing the contribution of Cohesion policy to convergence across countries
and/or regions at various NUTS levels. One important criticism of this approach is that
convergence is an inappropriate proxy for measuring cohesion (Barca, 2009: 39), as already
noted in the First Cohesion Report. Moreover, these studies only address the economic
dimension of cohesion, ignoring, for instance, the social dimension (De Michelis and
Monfort, 2008).
The concept of social cohesion has a long historical lineage dating back to Emile Durkheim
who is said to have coined the term at the end of the 19th century. In reviewing the
contemporary literature by academics, government bodies and international organisations,
a number of key characteristics of social cohesion have been highlighted (Jenson, 2002).
First, the term describes a process rather than a condition or end state. Second, it involves
a definition of who is “in” the Community and who is not, to whom members of society owe
solidarity, and to whom they do not. Third, social cohesion requires shared values. Fourth,
there is a tendency in the literature to devote little attention to the conflicts inherent in
pluralist societies and to conflict resolution mechanisms. On the basis of these
characteristics, five conceptual dimensions have been highlighted in relation to social
cohesion (Jenson, 1998: 15-17; 2002: 144):
Belonging–isolation: in terms of shared values, identity and feelings of commitment;
Inclusion–exclusion: in terms of equal opportunities of access in a market society;
Participation–non-involvement: in terms of engagement through governance
practices;
Recognition–rejection: in terms of respect for and toleration of differences in a
pluralistic society;
Legitimacy–illegitimacy: in terms of respect for institutions.
Among international institutions, the Council of Europe has been particularly active in the
promotion of social cohesion, in advancing conceptual thinking and in the development of
indicators. Its latest ‘Revised Strategy for Social Cohesion’ was approved in 2004, and was
followed by a detailed methodological guide on social cohesion indicators (Council of
Europe, 2005: 23). In the guide, the social cohesion of a modern society is defined as:
European Policies Research Centre Euroreg 10

Economic & Social Cohesion in the Economic Policies of Member States: Final Report
European Policies Research Centre Euroreg 11
‘…society’s ability to secure the long term well-being of all its members, including equitable access to available resources, respect for human dignity with due regard for diversity and personal and collective autonomy.’
The underlying assumption and policy objective of social cohesion is a social commitment
to reduce disparities to a minimum and avoid polarisation. In unpacking the concept, four
constituent dimensions of human well-being are emphasised that are seen as being
fundamental to the functioning of societies and which recognise human rights and
democracy as underpinning the way they are organised: fair and equal access; individual
(and collective) dignity; the autonomy of the individual; and participation in community
life.
A central purpose of the methodological guide was to develop indicators for analysing the
degree of social cohesion in the Member States of the Council for Europe. A series of 26 key
indicators were identified that focus on three main aspects of social life (equity, dignity,
participation), along with wide-range of sub-indicators to measure these different aspects
in greater detail. The indicators are listed in Box 2.1 along with other social cohesion
indicator sets developed by the OECD5 and EU.6
5 ‘Society at a Glance 2009’ is the fifth edition of the biennial compendium of social indicators by the OECD. It provides an overview of social trends and policy developments in OECD countries using indicators from OECD studies and other sources. 6 There are currently 21 Laeken indicators, 18 of which date from 2001. The indicators are classified in order of priority, dividing them into primary and secondary categories. See also the statistical portrait of the EU in relation to combating poverty and social exclusion (Eurostat 2010).

Economic & Social Cohesion in the Economic Policies of Member States: Final Report
Box 2.1: Social Cohesion Indicators
Council of Europe (2005). Equity in the enjoyment of rights: 1. Inequality of income distribution. 2. Long-term unemployment rate. 3. Life expectancy at birth. 4a. Proportion of homeless people in the population. 4b. Population without access to quality housing. Dignity/recognition: 5. Assumption of senior responsibilities for women. 6. Ethnic or religious ghettos. 7. Elderly people who receive a minimum old age allowance. Autonomy/occupational, family and personal development: 8a Proportion of over-indebted households. 8b Proportion of households below the poverty threshold in spite of both parents working. 9. Dropout rate at the minimum school-leaving age without qualifications. 10. Ability of children from disadvantaged social backgrounds to succeed at school. Participation/commitment: 11. Participation in elections by 18-34 year-olds. 12. Proportion of the budget reserved for social issues. 13. Workers with disabilities in the public and private sector. 14. Proportion of jobs in the voluntary sector. 15. Elderly people living with their families. 16. Confidence in public institutions. 17. Suicide rate. 18. Awareness of human rights and of the right to justice. 19. Subjective perception of health. 20. Murder rate.
OECD, DEELSA/ELSA (1999). 1. Divorce rate. 2. Fertility rates. 3. Incidence of lone parent families. 4. Group membership. 5. Election participation rates. 6. Foreign-born population. 7. Mixed marriages. 8. Asylum seekers. 9. Suicide rates. 10. Age of women at first childbirth. 11. Working mothers with children. 12. Crime rates. 13. Death rates from drug usage. 14. Work stoppages. 15. People in correctional facilities. 16. Acquisition of nationality.
OECD (2009). 1. Degree to which people are satisfied with their lives 2. Share of all employees reporting that they felt ‘completely’, ‘very’ or ‘fairly’ satisfied in their main job. 3. Share of people who have been victims of a criminal offence. 4. Suicide rate. 5. Rates of school bullying and being bullied. 6. Risky behaviour rates of teenagers such as drinking alcohol, smoking or having unprotected sex.
European Union ‘Laeken Indicators’. Primary indicators - Income: 1. Low income rate after transfers (threshold set at 60% of median national equivalized income). 2. Low income threshold (illustrative values). 3. Distribution of income (quintile 5/quintile 1). 4. Persistence of low income (based on threshold of 60% of median national equivalized income). 5. Relative median low income gap (difference between the median income of persons below the low income threshold and the threshold of 60% of median national equivalized income). Employment: 6. Regional cohesion (dispersion of regional employment rates). 7. Long-term unemployment rate (percentage of EAP that has been unemployed for at least 12 months). 8a. Children (ages 0-17) living in jobless households; 8b. Adults (ages 18-59) living in jobless households. Education: 9. Early school leavers not in education or training. 10. Fifteen-year-old students with low-reading literacy scores. Health: 11. Life expectancy at birth. Employment: 12. Immigrant employment gap. Secondary indicators – Income: 13. Dispersion around the low income threshold. 14. Low income rate anchored at a moment in time; 15. Low income rate before transfers, by sex. 16. Gini coefficient. 17. Persistence of low income (below 50% of median income). 18. Workers at risk of poverty. Employment: 19. Long-term unemployment share. 20. Very-long-term unemployment rate (at least 24 months; as a percentage of the working population). Education: 21. Persons with low educational attainment.
With a more specific focus on EU Cohesion policy, the Barca Report reflected on the
concept of social cohesion as informed by the EU’s social inclusion agenda. The report
defines social inclusion as:
‘…the extent to which, with reference to multidimensional outcomes, all individuals (and groups) can enjoy essential standards and the disparities between individuals (and groups) are socially acceptable, the process through which these results are achieved being participatory and fair.’
There are several key features to this definition. First, it captures ‘threshold’ and
‘interpersonal’ aspects of inequality, the former in terms of guaranteeing essential
standards and the latter in terms of ensuring that disparities between individuals (but also
groups) are socially acceptable. Second, the reference to a participatory and fair process
encapsulates the idea that both the dimensions and the thresholds used in defining social
inclusion must be established through democratic means. Third, the reference to multi-
European Policies Research Centre Euroreg 12

Economic & Social Cohesion in the Economic Policies of Member States: Final Report
European Policies Research Centre Euroreg 13
dimensional outcomes reflects the multi-faceted nature of people’s values and choices in
overcoming their circumstances.
Although territorial cohesion formally became a shared competence only with the
ratification of the Lisbon Treaty, academic and policy discourse has long been preoccupied
with the concept. One can distinguish between two debates around territorial cohesion that
took place in the late 1990s and the 2000s and that feed into each other: the spatial
planning debate and Cohesion policy debate.
The spatial planning debate originated from the perception that many EU policies had
unintended territorial impacts that had to be assessed and coordinated at EU level (AER,
undated; Husson, 2002). It was not clear exactly how it would be defined but territorial
cohesion developed from long-established concepts in the planning literature. In particular,
it was linked to the concept of polycentric development that has been prominent in the
recent literature on the development and operation of functional relationships in clusters
of cities (eg. Dieleman and Faludi, 1998; Kloosterman and Musterd, 2001; Davoudi, 2003;
Priemus et al, 2004). The key objectives underlying the concept of polycentrism are the
balanced spatial distribution of urban centres and the dispersion and deconcentration of
economic activity (Davoudi, 2003; Molle, 2007). The idea that territorial cohesion was
linked to the polycentric spatial distribution of economic activity was embraced in various
European policy initiatives such as the European Spatial Development Perspective (ESDP) of
1999 and much ESPON research into European spatial trends.
Another major spatial planning concept that has been linked to territorial cohesion, above
all in the ESDP, is the notion of accessibility. This refers to the ambition for citizens to have
equal access to facilities, services and knowledge regardless of where they live. It is usually
defined in terms of traffic infrastructure, communications networks and, as a more recent
concern, energy supply networks.
Building on the spatial planning debate that took place largely between the member states,
the Commission – or, more precisely, the Directorate General Regional Policy – began to
present territorial cohesion as a natural component of Cohesion policy in its second
Cohesion Report. Successive Cohesion Reports increasingly referred to ‘economic, social
and territorial cohesion’.
There was still no commonly agreed definition but, in the context of the Cohesion policy
debate, territorial cohesion was often linked with balancing regional disparities and
exploiting regions’ distinctive development potentials (Doucet, 2007; Jouen, 2008).7
Particular emphasis was placed on geographically-distinct territories, notably mountainous,
coastal and island regions but also special types of regions such as border regions or
sparsely populated areas (Monfort, 2009).
7 In this sense, it was also linked to the Lisbon agenda, competitiveness, innovation and full employment (European Commission, 2009).

Economic & Social Cohesion in the Economic Policies of Member States: Final Report
The Commission’s long-awaited Green Paper on Territorial Cohesion was published in
autumn 2008. Based on Member State responses to a Commission questionnaire, the Green
Paper identifies three main components of territorial cohesion:
Balanced and harmonious development, to be achieved by connecting different
territories, through infrastructure and by providing access to services and
communications networks.
Overcoming divisions and territorial inequalities through cooperation at all
geographical scales and across borders.
Regions with specific geographical challenges should be assisted in dealing with the
disadvantages of peripherality and limited accessibility.
Social, economic and territorial cohesion was established as a joint Commission and
member state responsibility. While, the debate on the meaning of territorial cohesion has
not been concluded, there is a sense that insistence on a precise definition would cause
needless delays. In general, it is worth noting that the spatial planning and cohesion policy
aspects of the debate have gradually been consolidated. In particular, recent thinking on
‘place-based’ policy approaches is based on the realisation that regions have different
natural resources, growth potentials and vulnerabilities, while balancing disparities and
ensuring access for all citizens regardless of where they live is also seen as important
(Barca 2009). Accordingly, the two main dimensions of territorial cohesion as defined in the
Green Paper are: first, balanced development for the integration of poorer regions; and
second, accessibility and integration of geographically remote regions and those facing
particular challenges. The main avenues for achieving these goals include spatial planning
coordination and promoting polycentric development, exploiting territorial potential,
improving infrastructure links and enhancing remote regions’ access to services, as well as
territorial cooperation (Mirwaldt et al, 2009).
2.4 National policy perspectives
Turning more specifically to national perspectives on concepts of cohesion, an important
first point to note is that the notion of ‘economic cohesion’ is not generally found in
domestic policy vocabularies – except insofar as it refers to the co-financing of EU Cohesion
policy; territorial cohesion finds still less resonance among national policymakers, although
the term ‘cohesion’ is widely used in the field of social policy.
The emphasis in the discussion that follows is on economic cohesion. Nevertheless, the role
of social policy in mitigating regional inequalities should not be overlooked and is an
important dimension to economic and social cohesion in many of the more prosperous
Member States.
2.4.1 Cohesion objectives in Member State policies
The absence of a concrete and agreed definition of cohesion means that quite diverse
policy objectives are pursued by the Member States ‘in the name of cohesion’. Four main
objectives can be identified in domestic policies in this context. However, it is important to
European Policies Research Centre Euroreg 14

Economic & Social Cohesion in the Economic Policies of Member States: Final Report
stress that these are neither necessarily mutually exclusive (ie. Member States may pursue
more than one), nor self-contained – ie. to some extent they reflect a spectrum of
approaches as opposed to watertight categories. In addition, it is commonplace to find a
commitment to addressing the needs of areas with specific characteristics or
disadvantages.
A first objective is the reduction of regional inequalities. In some countries, there is a
clear commitment to reducing the disparities found between regions. In Germany, for
example, the Basic Law refers to the creation of equivalent living conditions throughout the
country and federal legislation includes the goal of reducing regional economic disparities
by supporting regions where development is below the national average. In Italy too there
is a constitutional commitment to reducing disparities between the regions through
additional resources to promote economic development and social cohesion. Similarly in
Spain, the constitution includes the objective of promoting ‘a more equitable distribution
of income’ and ‘a fair and adequate economic balance between the different parts of the
Spanish territory’. In Finland, the 2009 Regional Development Act has the explicit aim of
reducing regional disparities and Sweden has a similar focus on the northern territories –
importantly, however, in both these countries there is an important regional
competitiveness orientation to policy which runs alongside essentially equity-motivated
objectives. In a number of other countries (for example, Greece, Bulgaria) there are
explicit constitutional references to regional or social inequalities or to the needs of
specific areas, but these commitments tend not to have been translated into policies that
are actually implemented. More generally, it is true to say that, in the last decade or so,
among several of the larger and more prosperous Member States, there has been a shift
away from policies which aim explicitly to reduce disparities in favour of an all-region,
competitiveness-oriented approach.
This leads on the second main objective found in the Member States, the promotion of
regional competitiveness. This has become increasingly prominent in the last decade. It
differs from the first objective insofar as the focus is not on the reduction of disparities
between regions (though this would clearly be welcome too), but on the exploitation of
regional potential as a contributor to national growth. This approach is typified in the
United Kingdom objective of providing ‘the environment for businesses and communities to
maximise their potential by tackling market failures in national, regional and local markets
to strengthen the key drivers of productivity’ (Treasury et al, 2003: 3), and where an
emphatically all-region approach is pursued. Similarly in France, there has been a growing
orientation towards regional competitiveness and the promotion of the attractiveness of
regions. Finland and Sweden also focus on regional competitiveness, while operating
special measures for sparsely-populated areas in parallel; in Italy there is an increasing
regional competitiveness orientation under the new unitary regional policy.
The third main objective is concerned with national competitiveness. This is principally
found in small prosperous Member States with comparatively minor internal disparities. In
these countries, the emphasis is on maintaining or enhancing the competitive advantage of
the national economy; these countries are also characterised by high levels of social
protection – although it is an open question as to whether, and if so in what way, national
competitiveness and high levels of social protection are connected. For example, the prime
European Policies Research Centre Euroreg 15

Economic & Social Cohesion in the Economic Policies of Member States: Final Report
objective of regional policy in Denmark is ‘to ensure that Danish citizens enjoy good and
equal conditions no matter in which part of the country they live’ (Indenrigs- og
Socialministeriet, 2009). In the Netherlands, the absence of significant disparities is
acknowledged and policy emphasises the objective of exploiting opportunities of national
significance, wherever they happen to be located. In Luxembourg and Austria policy is
oriented to national competitiveness, although in Austria there is arguably more emphasis
on regionally-differentiated approaches, largely reflecting the federal structure of the
country since disparities are limited. The focus on national competitiveness represents a
different dimension to the promotion of cohesion insofar as the aim is to maintain levels of
prosperity to enable a high level of social protection to operate; to this extent, the
emphasis is essentially on the promotion of social (and to some extent territorial) cohesion
rather than economic cohesion. Ireland arguably also shares the objective of national
competitiveness, although there are significant internal disparities (notably owing to the
dominance of Dublin); moreover, levels of social protection are not as high as other
countries cited here and, while still prosperous in GDP per capita terms, it is fair to say
that the national economy has recently exhibited a degree of fragility.
The fourth main objective is concerned with national development. Here, the primary
consideration is with narrowing the development gap between national prosperity and the
EU average. This objective dominates the policy agenda in most of the EU12, as well as
Greece and Portugal. In this sense, economic disparities are related to the EU as a
benchmark and the impact of attaining this objective on internal disparities is secondary.
Moreover, in many of these countries, levels of social protection are relatively low.
Nevertheless, it would be mistaken to view countries where the main policy aim is to
converge with EU levels of prosperity as a homogenous group. In Poland, for example,
there is a commitment to a ‘place based’ regional policy that concentrates on the
endogenous potentials of all regions and an emerging strategy for ‘polarisation-diffusion’
which prioritises the most competitive sectors, but which provides for the diffusion of the
benefits. In Estonia, in spite of the focus on closing the gap with the EU average, one of
the objectives of policy is to halt the concentration of people and activities in the capital
region. Also, a number of other countries explicitly cite balanced regional development
amongst their objectives – such as the Czech Republic and Bulgaria, for instance - while
countries such as Hungary, Slovenia, Latvia and Lithuania include the reduction of
regional disparities among their broad policy aims. In practice, given the weight of EU
Cohesion policy spending and influence in these countries, it is not clear to what extent
these are genuinely national objectives to be met by national initiatives. Moreover, given
broader funding constraints, there is anyway some doubt about the extent to which they
are translated into national (as opposed to EU) policies.
Running alongside these four main objectives, are aims related to specific territorial
needs. These are frequently concerned with addressing issues arising from geography or
topography, but are sometimes also targeted at social or ethnic groups. Finland and
Sweden are obvious members of this group, given the development challenges facing their
sparsely-populated and often difficult-to-access northern regions. In addition, in France, a
large number of spatially-differentiated policies operate to address the specific needs of
rural and upland areas; in Cyprus although policy is essentially national, reflecting the
European Policies Research Centre Euroreg 16

Economic & Social Cohesion in the Economic Policies of Member States: Final Report
European Policies Research Centre Euroreg 17
small size of the country, a significant strand of policy aims to address the
underdevelopment of rural areas; in Greece, there is a constitutional commitment to
develop the economy of mountain, border and island regions; in Malta, there is a specific
focus on the double insularity of the island of Gozo; and in Portugal special measures apply
to the autonomous regions of Madeira and the Açores.
2.4.2 National perspectives on cohesion – explaining the differences
This brief consideration of national perspectives reveals considerable diversity in approach.
In part, this is explained by wide differences in the nature and scale of disparities within
countries, and the relationship between national prosperity and the EU average (and in
consequence the role of EU as opposed to strictly national approaches to cohesion); in
addition, and partly as a consequence, different countries attribute different degrees of
priority to addressing internal disparities.8
(i) The nature of the regional problem
In practice, views of the regional problem tend to reflect a range of indicators at different
spatial scales, as well as geographical and topographical characteristics that are not readily
captured by statistical analyses. The focus in this section is on how national authorities
perceive regional disparities from a domestic perspective, rather than on a comparative
analysis of regional disparities at a European level, this being extensively covered in the
European Commission’s regular Cohesion Reports. A consideration of these perceptions
suggests that the nature of the regional problem varies widely between countries and that
several different groups can be distinguished.
A first group consists of four countries where the regional problem is perceived to be
extremely limited. All four are small, wealthy Member States: Austria, Denmark,
Luxembourg and the Netherlands. In each, regional disparities are considered to be minor,
leading to a muted policy response. This is self-evidently the case in Luxembourg, given its
small size, and is also true of the Netherlands where the last major review of regional
policy (IBO, 2004) noted that there was only a ‘relatively modest prosperity gap’ and
concluded that a disparity-oriented regional policy could not be justified – the regional
dispersion of GDP at NUTS 2 in the Netherlands is just 11.7 percent (2006), the lowest in
the EU;9 instead, the focus shifted from the traditional problem regions to an all-region
policy in support of regional strengths (Ministry of Economic Affairs, 2004). Regional policy
has a similar orientation in Denmark where the aim of central government is to maintain
Denmark’s ‘leading position within Europe as one of the countries with the smallest
differences between regions’ through ‘specific initiatives ... that target peripheral areas so
that they are not cut off from the growth occurring in other parts of the country.’
(Regeringen, 2003). As in the Netherlands, this perception is confirmed by low levels of GDP
dispersion (15.7 percent in 2006). There thus continues to be specific regional policy
8 Furthermore, and as will be emphasised elsewhere in this report, the role of EU cohesion policy varies very considerably between countries not only in relation to the scale of the financial contribution, but also in its impact on the objectives, instruments and governance of domestic policies. 9 See Part II Country Reports for a more extensive statistical overview of regional disparities.

Economic & Social Cohesion in the Economic Policies of Member States: Final Report
provision for the peripheral areas in the North and the South of the country, but combined
with an all-region competitiveness orientation. Finally, in Austria, the regional problem is
also viewed as low-key, in part reflecting the federal nature of the country (with significant
fiscal equalisation), but also the steady reduction in domestic regional disparities following
the economic integration of Central and Eastern Europe. This is also reflected GDP
dispersion trends which have fallen from 18.5 percent in 1999 to 16.1 percent in 2006.
In a second group, regional problems are seen less in terms of economic disparities and
more as specific geographic challenges. For instance, in Sweden, geography and climate
lead to an uneven distribution of cities and population, while low population densities
across most of the country – 22.3 inhabitants per km2 on average (and very low densities in
large parts of the north – as low as 2.6 inhabitants per km2 at NUTS 2) create significant
demographic, accessibility, service delivery and rural challenges. Finland faces similar
problems arising from areas of sparse population in the north and east, with demographic
trends putting service provision under pressure and raising questions about the
sustainability of the regional spatial structure; population density averages 17.4 inhabitants
per km2 across the country, falling to 2 inhabitants per km2 in the least populated NUTS 2
region. There are, in addition, more general challenges relating to the industrial and
economic structure in certain areas. The two island Member States, Cyprus and Malta, also
face specific development issues which are not appropriately reflected in any disparity
analysis.
In a third group of countries, regional disparities are relatively limited but a range of
regional and sub-regional issues ensure that regional policy remains important, with a long-
history in the countries concerned; these disparities are not necessarily easily captured in
statistical terms, not least because of the different scales at which disparities manifest
themselves (regional, local, intra-urban…) but also because of their nature and the
tendency for transfers to mitigate differences in income levels. This is the case, for
instance, in France, where historically there has been a dichotomy between the capital and
the periphery (though easing over time), but where, in addition, there are diverse concerns
related to geography (mountains and coastal areas), old industrial areas, rural regions and
urban centres; on the other hand, the regional dispersion of GDP in France is relatively
modest (20.4 percent at NUTS 2 in 2006) but would be extremely small were the capital
region excluded. The United Kingdom also faces varied challenges, as encapsulated in its
regional productivity agenda which focuses on deficiencies in skills, innovation, investment,
enterprise and competition, often at the sub-regional level. Regional issues in the United
Kingdom are magnified by the Devolved Administrations, which is obviously also the case,
writ large, in Belgium. Not only is there a clear distinction between Flanders and Wallonia
(and, less so, Brussels), but sub-regional concerns are diverse, ranging from congestion
challenges and industrial restructuring to low income rural areas and migration problems.
However, the absence of a national appraisal of, or responsibility for, regional problems
per se means that there is no relevant ‘domestic’ perception of regional disparities beyond
that expressed by the Brussels, Flemish and Walloon authorities. Finally, Spain faces a
variety of regional challenges, including border areas, mountains, sparsely-populated
regions, old industrial centres and island regions, contrasting with advanced metropolitan
areas; however, the regional dispersion of GDP is more limited than might be expected
European Policies Research Centre Euroreg 18

Economic & Social Cohesion in the Economic Policies of Member States: Final Report
(18.4 percent at NUTS 2 in 2006), probably reflecting the complex range of factors
contributing to the regional challenge. Combined with the role and powers of the
autonomous communities, it is unsurprising that, as with the other countries in this group,
the main regional policy measures are well-embedded and long-standing.
The penultimate group is by far the largest, including almost half of the Member States –
Ireland, Portugal, Greece, Poland, Czech Republic, Slovakia, Hungary, Slovenia, Estonia,
Latvia, Lithuania, Bulgaria and Romania. While in no sense uniform as a group, all exhibit
significant regional disparities – in Bulgaria, Hungary and Slovakia, for example, the
regional dispersion of GDP exceeds 30 percent at NUTS 2 - most have a dominant capital
city region where GDP per head massively exceeds the national average (as in Ireland,
Portugal, Czech Republic and Greece, for example) and, at the other end of the spectrum,
many have poor and often difficult-to-access rural regions. Outside of their capital city
regions, most regions in these countries are poor by EU standards, falling below the 75
percent cut-off for Convergence region status.
Finally, both Germany and Italy face very significant regional challenges, which, historically
at least, have been presented in terms of east-west and north-south dichotomies,
respectively. In Germany, there is ongoing structural weakness in the eastern Länder
(though differentiation among them is emerging, with a number of urban areas progressing
well) and there are also persistent disparities in the western Länder, especially rural-urban
but also north-south. In Italy, the long-standing duality between the Centre-North and the
Mezzogiorno remains, though regional challenges in the Mezzogiorno are becoming more
diverse, while the development performance of the Centre-North has also been varied and,
for the region as a whole, disappointing in recent years.
(ii) The profile and importance of national regional policy
As far as national regional policy is concerned, the perceived need to address internal
economic, social and territorial disparities and the priority given to it varies between
countries. At a very basic level, the importance attached to addressing regional disparities
can be partly related to the size and relative prosperity of the country: large countries are
more likely to contain significant internal disparities (of various types) than small ones;
more prosperous countries are more likely to have the capacity to address them. Of course,
it goes without saying that this analysis is rather crude; a range of other factors are also at
work, including constitutional and institutional arrangements, domestic policy traditions
and the role of EU Cohesion policy. Moreover, many smaller countries are characterised by
significant internal disparities, although it is also true to say that these are often related to
aspects of physical geography such as insularity, peripherality and accessibility or to the
dominance of a single city. Furthermore, while many less prosperous countries are largely
preoccupied with national development (in the sense of attaining EU average GDP per head,
for example), this does not necessarily preclude the operation of purely nationally-driven
initiatives to address specific regional challenges.
Nevertheless, it can be argued that the general picture holds and it is possible to
distinguish between four groups of countries in terms of the importance given to regional
policy. These groups cover all EU countries, except Belgium, where there is no national
European Policies Research Centre Euroreg 19

Economic & Social Cohesion in the Economic Policies of Member States: Final Report
regional policy and responsibility for economic development is devolved to the regional
level (Brussels, Flanders and Wallonia).
In some countries the importance attached to national policies to reduce regional
disparities is limited, national policy has little profile and limited expenditure:
Small prosperous countries with limited internal disparities, where the emphasis is
on national competitiveness policies which promote the maintenance or
enhancement of advantage: Luxembourg, Netherlands, Denmark, Austria;
Less prosperous small, peripheral, essentially unitary, countries with some internal
disparities, but a limited recent tradition of regional policy, where the emphasis is
on national development in an EU context: Greece, Portugal, Slovak Republic,
Ireland, Bulgaria, Czech Republic, Estonia, Hungary, Latvia, Lithuania;
Large less prosperous countries with wide internal disparities, but limited recent
tradition of regional policy and where the focus is on promoting the EU
competitiveness of key agglomerations: Poland, Romania.
In a second group, the importance attached to regional policy is relatively modest. There
are identifiable problem regions at which some policy instruments are targeted, but
although policy has some profile it is not a significant aspect of economic development
generally:
Large relatively prosperous countries with diverse regional challenges: France, the
United Kingdom;
Smaller, less prosperous countries facing a range of diverse internal disparities and
where (albeit limited) policies to address those disparities either predate EU
accession or persist independently of EU Cohesion policy: Malta, Slovenia, Cyprus.
In a third group of countries regional development policy is significant:
In the Nordic Member States the broad and integrated nature of policy, which cuts
across and involves coordination with sectoral policy has significant profile and
expenditure: Sweden, Finland.
Last, there are countries in which regional policy can be classified as essential. The
requirement to address regional inequalities in enshrined in the constitution; policy has a
significant profile and is considered an important component of national economic policy:
These are large countries, with internal economic disparities that are perceived to
be significant: Spain, Italy, Germany.
While these categorisations have been relatively stable in recent years, the economic crisis
and the changing role of and significance of EU Cohesion policy may change this. In some
countries, the economic crisis is raising considerable uncertainties about the role and
European Policies Research Centre Euroreg 20

Economic & Social Cohesion in the Economic Policies of Member States: Final Report
European Policies Research Centre Euroreg 21
profile of domestic policy interventions, while in others regional policy is being reinforced.
The impact of the crisis on regional problems and policies is discussed further in Chapter 7.
2.5 Concluding points
This chapter began with a discussion of the concepts of economic, social and territorial
cohesion and argues that precise definitions remain elusive; neither EU policymakers nor
commentators appear to have arrived at concrete definitions of these concepts that are
easy to operationalise. Even so, at the European level at least, it is reasonable to conclude
that: economic cohesion is primarily concerned with narrowing disparities in output and
employment; social cohesion focuses on interpersonal inequalities, and especially the
elimination of poverty and social exclusion and the creation of employment opportunities;
and territorial cohesion aims at a sustainable and equitable spatial distribution of activities
and services. Importantly, however, although academic analyses have tended to consider
the three different dimensions of cohesion (typically coming from different disciplinary
perspectives), in practice, and for policy purposes, economic, social and territorial
cohesion cannot readily be separated.
At this level, the tentative definitions outlined above remain rather nebulous. Moreover, a
key issue is the question of an appropriate benchmark – cohesion in relation to what? In the
context of economic cohesion, even using a simple indicator such as GDP per head, it is
unclear whether cohesion refers to: (i) the narrowing of disparities between regions within
a Member State; (ii) between regions within the EU as a whole; or (iii) between Member
States. This is an important question since Member States can only directly or actively
contribute to cohesion within national frontiers – ie. (i) above; the impact on (ii) and (iii)
will depend also on the actions of other Member States and the EU level. Similar issues
apply for social cohesion (although existing benchmarks, such as the poverty thresholds
refer to national, not EU median income levels) and, perhaps to a lesser extent, territorial
cohesion, given the potential importance of border regions. These considerations have
potential implications for the respective roles and coordination of national and EU policies
and, specifically, the strategic role of EU Cohesion policy in contributing to economic,
social and territorial cohesion at the EU level.
An important point to note in the national policy context is that the term ‘cohesion’ is
rarely found in the domestic regional policy vocabularies of the Member States, except
insofar as it refers to the cofinancing of EU policy. The absence of a concrete and agreed
definition of cohesion means that quite diverse policy objectives may be seen to be pursued
by the Member States ‘in the name of cohesion’.


Economic & Social Cohesion in the Economic Policies of Member States: Final Report
European Policies Research Centre Euroreg 23
3. THE SCALE OF NATIONAL POLICIES TO PROMOTE COHESION
3.1 Introduction
The aim of this chapter is to provide some context for the discussion of policy instruments
and implementation which follows. The chapter is in three main parts. The first part sets
out the main features of public expenditure across the EU in relation to the scale of
spending, its distribution by function and by tier of government. The second part focuses on
national expenditures related to economic and social cohesion. The third considers the
relative importance, in expenditure terms, of EU and national spending on cohesion policy
and in particular the scale of national commitments to co-funding EU Cohesion policy.
3.2 Scale and shape of public expenditure
Government expenditure is not straightforward to analyse, not least in a comparative
sense. Nevertheless, in the present context, it is important to have some sense of the
scale, shape and pattern of government spending in general, before focussing in on
spending and instruments that specifically address the various dimensions of cohesion.
This section focuses on public expenditure at a general level and aims to provide an
overview of the scale of spending in the EU Member States.10 It also highlights variations
between countries in the broad patterns of expenditure, focusing particularly on the
importance of different functional areas in different countries and on differences in the
extent to which expenditure is committed at central or sub-national levels. For these
purposes, total general government expenditure data, as available from Eurostat, is used as
the basis for the discussion.11
3.2.1 The scale of spending
For 2008, Eurostat estimates that total government expenditure amounted to some €5,861
billion or 46.8 percent of EU GDP. However, these aggregates are scarcely meaningful given
the very different populations of the Member States. This is reflected in the fact that 2008
expenditures range from just €2.6 billion in Malta to €1,091 billion in Germany.
10 Note, however, that Eurostat has issued a reservation on Greek data which means that GDP and expenditure data are provisional, for further information on the impact of the reservation, see http://epp.eurostat.ec.europa.eu/portal/page/portal/government_finance_statistics/documents/Reservations%20on%20reported%20data.pdf. 11 The data relate to 2008, the latest year for which a largely complete dataset is available. Clearly, the focus on a single year has some drawbacks. However, the aim at this juncture is simply to provide a snapshot of the situation in order to provide some feel for the relative situations of the Member States, rather than a focus on trends. Nevertheless, it should be noted that the differential impact of the recession has had implications for public spending as a proportion of GDP with spend rising by more than three percentage points between 2006 and 2008 in the UK, Lithuania, Greece (provisional figures), Estonia and Ireland and falling by over two percentage points in Hungary and Slovakia.

Economic & Social Cohesion in the Economic Policies of Member States: Final Report
European Policies Research Centre Euroreg 24
A somewhat more meaningful, albeit not flawless,12 basis for comparison is to consider
total government expenditure as a proportion of national GDP. This is reflected in Figure
3.1 which shows a significant variation between countries. At one end of the spectrum,
spend is less than 41 percent of GDP (Slovakia 34.8 percent; Luxembourg 37.2 percent;
Lithuania 37.4 percent) while, at the other extreme, spending is well in excess of 50
percent of GDP (Denmark – 51.8 percent; France – 52.7 percent; and Sweden 53.0 percent).
As noted above, across the EU as a whole, total government spending amounts to 46.8
percent of EU GDP.
Figure 3.1: Total government spending as a percentage of GDP (2008)
Total government spending% of GDP (2008)
51 to 53 (3)48 to 51 (6)44 to 48 (5)41 to 44 (6)up to 41 (7)
Source: Eurostat.
Spending as a proportion of GDP gives only a partial view of the scale of government
expenditure, not least because national economies vary significantly in size. An alternative
view is to consider total government spending in per capita terms and to adjust for
purchasing power standards (PPS) in the different Member States. This shows a rather
different perspective, which is illustrated in Figure 3.2.
12 For example, the large difference between GNP and GDP in Ireland arguably artificially reduces the apparent spend for this country.

Economic & Social Cohesion in the Economic Policies of Member States: Final Report
Figure 3.2: Total government spending in PPS per head (2008)
Total government spendingPPS per head (2008)
over 15,000 (5)12,000 to 15,000 (7)9,000 to 12,000 (4)5,000 to 9,000 (9)
up to 5,000 (2)
Source: Own calculations from Eurostat data.
The scale of the differences is striking: per capita expenditure in Sweden (almost 16,000
PPS per head) is over four times that in Bulgaria. More generally, Figure 3.2 suggests five
broad country groupings:
Bulgaria and Romania, where spending is well under 5,000 PPS per head;
the Czech Republic, Estonia, Hungary, Latvia, Lithuania, Malta, Poland, Portugal
and Slovakia, where spending is in the range 5,000 to 9000 PPS per head;
Cyprus, Greece, Slovenia and Spain, which all spend in the range 9,000 to 12,000
PPS per head;
Belgium, Germany, Finland, France, Ireland, Italy and the United Kingdom where
spending exceeds the EU average and is the range 12,000 to 15,000 PPS;
Last, Austria, Denmark, Sweden and the Netherlands with spending between
15,000 PPS and 16,000 PPS per head and Luxembourg, which appears as something
of an outlier with expenditure exceeding 25,000 PPS per head.
European Policies Research Centre Euroreg 25

Economic & Social Cohesion in the Economic Policies of Member States: Final Report
European Policies Research Centre Euroreg 26
There is some correlation between levels of spend as a proportion of GDP and prosperity
insofar as most poorer countries do spend a smaller proportion of GDP than more
prosperous countries; however, the correlation is much stronger in per capita spending
terms. Figure 3.3 shows that per capita levels of spend tend to be lower in poorer
countries, even expressed in PPS terms.
Figure 3.3: Total government spending (PPS per head) and national GDP (EU=100), 2008
UK
SE
FI
SK
SI
RO
PT
PL
ATNL
MT
HU
LTLV
CY
IT
FR
ES
GR
IE
EE
DE
DK
CZ
BU
BE
EU
3000
5000
7000
9000
11000
13000
15000
17000
40 50 60 70 80 90 100 110 120 130 140
GDP(PPS) per head EU=100
Go
vern
men
t ex
pen
dit
ure
PP
S p
er h
ead
Note: Luxembourg is excluded for reasons of scale – GDP(PPS) is equivalent to 278 percent of the EU average and public spending is over 25,000 PPS per head. Source: Own calculations from Eurostat data.
3.2.2 Patterns of public spending by function
Eurostat data uses the COFOG classification of government expenditure devised by the
OECD and published by the UN Statistical Division (Eurostat, 2007). This provides a
breakdown into 10 Divisions (level 1), which can be viewed as the broad objectives of
government.13
By way of context for the later discussion, it is worth considering the overall breakdown of
expenditure between government functions. Taking, first, the proportion of the total spent
on each function, Figure 3.4 shows the importance accorded to social protection; it is the
single biggest category of government spending in every country, accounting for almost 39
percent of the total in the EU, even though the range is relatively large – from over 45
percent of government spending in Germany to around 23 percent in Cyprus. Health and
education are the next most significant categories, accounting for almost 15 percent and 11
percent of total spending respectively – leaving aside the general public services category
13 These are further broken down into Groups (level 2) and Classes (level 3) which essentially detail the means by which the broad (level 1) objectives are achieved. At present, Member States are only obliged to supply data to level 1, although some data below these levels is available.

Economic & Social Cohesion in the Economic Policies of Member States: Final Report
European Policies Research Centre Euroreg 27
where comparisons for policy purposes are complicated by the inclusion of public debt
transactions and transfers between different levels of government.
Figure 3.4: Government expenditure by function, percent of total (2008)
0%
20%
40%
60%
80%
100%
EU BE BU CZ DK DE EE IE GR ES FR IT CY LV LT LU HU MT NL AT PL PT RO SI SK FI SE UK
General public services Defence Public order & safety Economic affairs
Environment protection Housing & community amenities Health Recreation, culture & religion
Education Social protection
Source: Eurostat.
Comparing expenditure by function on the basis of the share of expenditure within a
country gives some measure of the importance accorded to that function within public
spending as a whole. However, as seen earlier, total government expenditure varies quite
widely as a proportion of GDP. As a result, it is worth considering the breakdown of
expenditure in relation to GDP, which gives some indication of cross-country spending in
real terms. This is illustrated in Figure 3.5.
At the EU level, expenditure on social protection amounts to around 18.2 percent of GDP,
but ranges from 22.4 percent of GDP in Denmark to just 9.5 percent of GDP in Latvia.
Denmark, Germany, France, Finland, Italy, Austria and Sweden all spend more than the EU
average on social protection expressed as a proportion of GDP; the remaining countries
spend less.14 Importantly, however, expenditure on social protection accounts for a
significant proportion of the differences in overall government spending expressed as a
proportion of GDP. As noted earlier (see 3.2.1), public expenditure ranges from 34.8
percent of GDP in Slovakia to 53 percent of GDP in Sweden. However, the range narrows
when expenditure on social protection is excluded, running from 21.6 percent
(Luxembourg) to 32.6 percent (Cyprus).
14 Greece also spends more than the average, but as noted earlier (see footnote 10 a reservation applies to the Greek data.

Economic & Social Cohesion in the Economic Policies of Member States: Final Report
Figure 3.5: Government expenditure by function, percent of GDP (2008)
0
10
20
30
40
50
60
EU BE BU CZ DK DE EE IE GR ES FR IT CY LV LT LU HU MT NL AT PL PT RO SI SK FI SE UK
General public services Defence Public order and safety Economic affairs
Environment protection Housing and community amenities Health Recreation, culture and religion
Education Social protection
Source: Eurostat.
Moreover, it is important to recall that, as noted above, the economies concerned vary
considerably in prosperity, as well as size, with implications for spending in real terms.
Calculating the values of expenditure by function in PPS per head terms gives a more
accurate perspective by factoring in differences in the cost of living and population – this is
shown in Figure 3.6.
Figure 3.6: Government expenditure by function in PPS per head (2008)
0
5000
10000
15000
20000
25000
30000
EU BE BU CZ DK DE EE IE GR ES FR IT CY LV LT LU HU MT NL AT PL PT RO SI SK FI SE UK
General public services Defence Public order & safety Economic affairs
Environment protection Housing & community amenities Health Recreation, culture & religion
Education Social protection
Source: Own calculations from Eurostat.
European Policies Research Centre Euroreg 28

Economic & Social Cohesion in the Economic Policies of Member States: Final Report
Although, self-evidently, the overall ranking of categories in terms of spend (social
protection, health, education, economic affairs) is the same as on the basis of the
indicators in Figure 3.4 and Figure 3.5, there are much wider disparities in levels of spend
when expressed in per capita terms. For example:
the amount spent on social protection in Luxembourg is almost nine times that
spent in Bulgaria;
spending on health in Austria is almost five times that of Romania;
spending on education in Denmark is almost five times that of Bulgaria; and,
spending on economic affairs in the Netherlands is more than double that of
Poland.
These figures are striking because of their magnitude in a context where price differences
have been factored in. In addition, however, these disparities have implications for the
scale of the budgetary transfer mechanisms which are implicit in the interplay of tax and
social security systems and in the capacity of poorer Member States to contribute to
cohesion either domestically or at the European level.
3.2.3 Patterns of public spending by tier of government.
This study extends beyond policies conducted by national authorities to consider also those
prosecuted at the subnational level which are relevant to economic, social and territorial
cohesion. In expenditure terms, assessing the importance of the subnational level is not
straightforward. This partly owes to the significance of transfers between different tiers
(central, state, local and social security funds), with the result that, because of elements
of double-counting, it is not possible readily to attribute a percentage of total government
expenditure to each tier. Nevertheless, by rebasing total expenditure, it is possible to gain
some insight into the relative importance of different institutional levels.
Figure 3.7 shows that there are considerable differences between countries in overall
responsibilities for government spending. In four countries, Belgium, Spain, Germany and
Austria, the so-called State level – the Belgian regions, the German and Austria Länder and
the Spanish comunidades autónomas – plays a significant role; in other words this tier of
spending only applies to federal states. In most countries, but excluding Malta and the
United Kingdom, a considerable proportion of spending is channelled through social security
funds. These include autonomous pension funds, where these are required by law or
regulation and if government is responsible for the management of the institution with
respect to the approval of contributions and benefits; it also includes schemes established
by governments to fund healthcare and social benefits where there are separate
institutional units administering contributions and benefits.
European Policies Research Centre Euroreg 29

Economic & Social Cohesion in the Economic Policies of Member States: Final Report
Figure 3.7: Government expenditure by tier, standardised to 100 percent (2008)
0%
20%
40%
60%
80%
100%
EU BE BU CZ DK DE EE IE GR ES FR IT CY LV LT LU HU MT NL AT PL PT RO SI SK FI SE UK
Central government State government Local government Social security funds
Source: Eurostat.
3.3 National expenditure on economic and social cohesion
The overall aim of this study is to consider the contribution of Member States’ policies to
cohesion. Against the background of the general picture of public expenditure presented in
Section 3.2, the aim of this section is to assess the scale of expenditure on cohesion.
However, any analysis of cohesion spending is complicated by several factors. First, and as
discussed earlier in this report (see Chapter 1) there is no agreed nor concrete definition of
what is meant by ‘cohesion’; second, and partly related, there is no comparative source of
statistical information on spending related to cohesion; and third, it is not straightforward
to disentangle national from EU expenditure. Nevertheless, the discussion that follows
provides some perspective on spending: first in relation to economic cohesion, partly by
drawing on recent work undertaken for the Commission; and second, in relation to social
cohesion, by considering social protection expenditure collated by Eurostat. These data are
very much at a ‘macro’ level and offer broad orders of magnitude, but complement the
‘bottom up’ data on individual instruments contained in Part II of this study.
3.3.1 Economic cohesion – ‘expenditure for development’
This section partly builds on recent work by Ismeri and Applica (2010) which sought to
provide an assessment of national ‘Expenditure for Development’ (EfD), a concept designed
to be consistent with spending under EU Cohesion policy. It is important to note that
Cohesion policy is not a concept that is recognised for purely domestic policy purposes in
the Member States, and EfD is not equivalent to regional policy or regional economic
development policy; nevertheless, the use of EfD provides a standardised basis on which to
compare and contrast development expenditures in the Member States. The data in COFOG
used as the basis for calculating EfD do not distinguish between national and EU monies;
however, as will be seen, the Ismeri and Applica work provides an estimate of the EU
European Policies Research Centre Euroreg 30

Economic & Social Cohesion in the Economic Policies of Member States: Final Report
European Policies Research Centre Euroreg 31
contribution, enabling a measure of the cohesion expenditures of the Member States to be
derived.15
Figure 3.8 illustrates the scale of EfD as a percentage of GDP over the period 2004-6.16 It
suggests that countries fall into four main spending bands, although most in countries
spending is between two and five percent of GDP, while Denmark (1.5 percent) and the
Czech Republic (6.3 percent) appear as outliers. EU average spend for the period was 2.9
percent of GDP; those that spent less than the EU average on EfD in this period were
Finland, Sweden, Germany, Slovakia, United Kingdom, Belgium, Austria, Cyprus, France and
the Netherlands.
Figure 3.8: Expenditure for development 2004-6 (% of GDP) Expenditure for Development 2004-6av
Total as % of GDP
4.5 to 6.5 (1)3.5 to 4.5 (10)2.5 to 3.5 (8)1.5 to 2.5 (6)
Source: Own calculations from Eurostat data using Ismeri-Applica definition of EfD.
15 In this section, data cover 2004-6 only since this relates to the period for which the Ismeri-Applica study calculated the EU contribution to expenditure for development (see Figure 35 of the Ismeri-Applica study), enabling a comparison of EfD with and without EU monies. 16 Note that the nature of the data is such that ‘expenditure’ can fluctuate widely from year to year, hence the use of average amounts. This occurs because COFOG data are prepared on an accruals basis, meaning that ‘expenditure’ occurs during the year in which the obligation to pay arises; this is distinct from actual payments (or commitments).

Economic & Social Cohesion in the Economic Policies of Member States: Final Report
The Czech Republic aside, the main groupings that emerge are:
those with spending in the range 1.5 to 2.5 percent of GDP (Denmark, Finland,
Germany, Slovakia, Sweden, UK);
those with spending in the range 2.5 to 3.5 percent of GDP (Belgium, Cyprus,
Estonia, France, Netherlands, Poland, Portugal, Slovenia);
the remaining ten countries (Austria, Estonia, Greece, Hungary, Ireland, Italy,
Latvia, Luxembourg, Malta, Spain) where spending is between 3.5 and 4.5 percent
of GDP.
In Figure 3.9, data on EfD are set against national prosperity, expressed in terms of
GDP(PPS) per head.
Figure 3.9: Expenditure for development (% of GDP) and prosperity (GDP(PPS)) 2004-6
AT
BEBU CY
CZ
DE
DK
EE
ES
FI
FR
GRHU IE
IT
LT
LULV
MT
NL
PL PT
RO
SE
SI
SK
UK
0
300
0 50 100 150 200 250 300
GDP(PPS) per head EU27=100
EfD
as
% o
f G
DP
- E
U27
=10
0
Below average GDP,above average spend
Above average GDP,above average spend
Above average GDP,below average spend
Below average GDP,below average spend
Source: Own calculations from Eurostat data using Ismeri-Applica definition of EfD.
This shows that countries are mainly clustered in three quadrants:
those with below EU average levels of prosperity, but EU average or above average
levels of expenditure for development: Bulgaria, Cyprus, Czech Republic, Estonia,
Greece, Hungary, Latvia, Lithuania, Malta, Poland, Portugal, Romania and
Slovenia;
those with above EU average levels of prosperity, and EU average or above average
levels of expenditure for development: Austria, Belgium, France, Ireland, Italy,
Luxembourg, Netherlands and Spain;
European Policies Research Centre Euroreg 32

Economic & Social Cohesion in the Economic Policies of Member States: Final Report
those with above EU average levels of prosperity, but below average levels of
expenditure for development: Denmark, Finland, Germany, Sweden and the
United Kingdom.
Slovakia is alone in having both below EU average GDP and below EU average expenditure
for development. Importantly, and as mentioned earlier, a key point to note about the data
in Figure 3.8 and Figure 3.9 is that they include both national and EU monies. In their
recent report, Ismeri-Applica estimated the contribution of EU Cohesion policy to EfD. This
is illustrated in Figure 3.10, which shows the relative shares of EU Cohesion policy in EfD as
a proportion of GDP; countries are ranked in order of national expenditure.
Figure 3.10: National and EU funding of EfD as a % of GDP (2004-6)
0
1
2
3
4
5
6
7
LT LV SK DK PT EE PLUK FI
SE DE SIGR CY
HU FR NL BE IT AT ES LU MT IE CZ
EU25
% o
f G
DP
EdF EU contribution
EdF National contribution
Note: No information is available for Bulgaria and Romania. Source: Own calculations from Ismeri-Applica (Exhibit 35) and Eurostat GDP and COFOG data.
Figure 3.10 illustrates not only wide variations in the contribution of EU expenditure to EfD
(from under one percent of EfD in Luxembourg to over 81 percent in Latvia), but also a
significant shift in patterns of expenditure if EU Cohesion policy spending is excluded.
Taking account only of national expenditure, Denmark no longer appears as an outlier at
the ‘bottom’ of the rankings – Latvia, Lithuania and Slovakia all spend less. Strikingly, the
Czech Republic remains at the ‘top’ of the league with national expenditure outstripping
that of other Member States by a wide margin. The impact of ‘stripping out’ the EU
contribution is reflected in Figure 3.11, which may usefully be contrasted with Figure 3.8.
European Policies Research Centre Euroreg 33
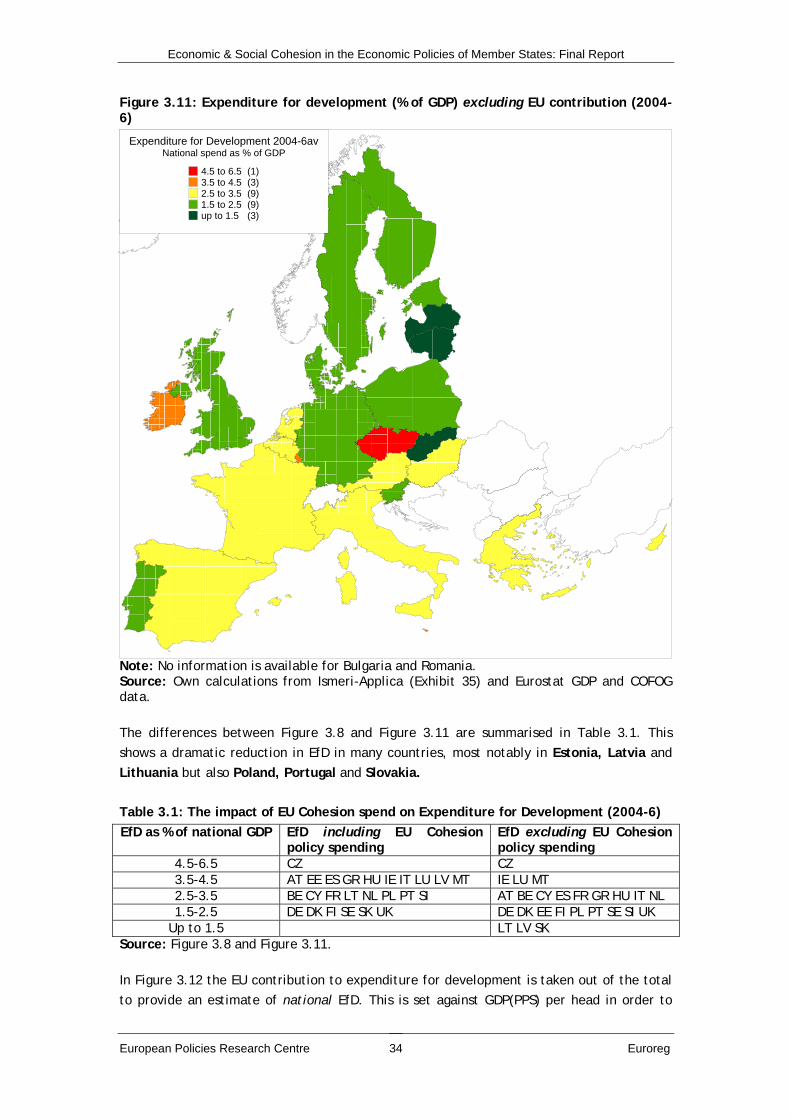
Economic & Social Cohesion in the Economic Policies of Member States: Final Report
Figure 3.11: Expenditure for development (% of GDP) excluding EU contribution (2004-6)
Expenditure for Development 2004-6avNational spend as % of GDP
4.5 to 6.5 (1)3.5 to 4.5 (3)2.5 to 3.5 (9)1.5 to 2.5 (9)up to 1.5 (3)
Note: No information is available for Bulgaria and Romania. Source: Own calculations from Ismeri-Applica (Exhibit 35) and Eurostat GDP and COFOG data.
The differences between Figure 3.8 and Figure 3.11 are summarised in Table 3.1. This
shows a dramatic reduction in EfD in many countries, most notably in Estonia, Latvia and
Lithuania but also Poland, Portugal and Slovakia.
Table 3.1: The impact of EU Cohesion spend on Expenditure for Development (2004-6)
EfD as % of national GDP EfD including EU Cohesion policy spending
EfD excluding EU Cohesion policy spending
4.5-6.5 CZ CZ 3.5-4.5 AT EE ES GR HU IE IT LU LV MT IE LU MT 2.5-3.5 BE CY FR LT NL PL PT SI AT BE CY ES FR GR HU IT NL 1.5-2.5 DE DK FI SE SK UK DE DK EE FI PL PT SE SI UK
Up to 1.5 LT LV SK Source: Figure 3.8 and Figure 3.11.
In Figure 3.12 the EU contribution to expenditure for development is taken out of the total
to provide an estimate of national EfD. This is set against GDP(PPS) per head in order to
European Policies Research Centre Euroreg 34

Economic & Social Cohesion in the Economic Policies of Member States: Final Report
provide a contrast with Figure 3.9, which includes the EU contribution. Figure 3.12 shows
countries falling into four groups:
those with above average GDP and above average national EfD: Austria, Belgium,
France, Ireland, Italy, Luxembourg, Netherlands, Spain;
those with above average GDP, but below average national EfD: Denmark, Finland,
Germany, Sweden, the United Kingdom;
those with below average GDP, but above average national EfD: Cyprus, Czech
Republic, Hungary, Malta;
those with below average GDP and below average national EfD: Estonia, Greece,
Latvia, Lithuania, Portugal, Poland, Slovakia, Slovenia.
Figure 3.12: National EfD (% of GDP) and prosperity (GDP(PPS)) 2004-6
CZ
IEMT LUES AT
ITBE NLFRHU
CY
GRSI DE SE
FI UKPL EE PTDK
SKLV
LT
0
300
0 300
GDP(PPS) per head EU27=100
Ed
F %
of
GD
P E
U25
=10
0
Above average GDP, above average spend
Below average GDP, above average spend
Above average GDP, below average spend
Below average GDP, below average spend
Note: Bulgaria and Romania are not covered; the Y axis uses the EU25 average so care should be taking in comparing Figure 3.9 and Figure 3.12. Source: Own calculations from Ismeri-Applica (Exhibit 35) and Eurostat GDP and COFOG data.
The key point to note in considering Figure 3.9 and Figure 3.12 is the relative importance of
the EU contribution for many countries with below average EU GDP per head; this is
particularly so for Estonia, Latvia, Lithuania, Poland, Portugal and Slovakia, where the EU
contribution to EfD exceeds 50 percent.
3.3.2 Social cohesion – social protection expenditure
The discussion of economic cohesion above drew on the work of Ismeri-Applica which has
devised a COFOG-based definition of ‘expenditure for development’. In practice, this
includes many elements that are relevant also to social cohesion – such as gross fixed
European Policies Research Centre Euroreg 35

Economic & Social Cohesion in the Economic Policies of Member States: Final Report
capital formation in relation to housing and community amenities, health, recreation,
culture and religion and education – largely reflecting the permeability of the terms
‘economic’ and ‘social’ cohesion. The focus of this section is more explicitly on the social
dimension of government spending, in the form of social protection expenditure. However,
it is important to stress, as elsewhere in this report, that there is no sharp distinction
between the concepts of economic and social, and indeed territorial cohesion. Moreover,
while social protection is used here as an indicator of the scale of spending on social
cohesion, it is important to note that other areas of spend, such as that on healthcare and
education are also crucial elements of social cohesion.
As discussed earlier, for all Member States, social protection constitutes the single largest
category of government expenditure; however, the scale of spending varies widely between
countries.
Figure 3.13: Expenditure on Social Protection as % of GDP (2004-6)
Social Protection including 'in kind' benefits2004-6 spend as % of GDP
26.5 to 30.8 (6)23.5 to 26.5 (6)19.3 to 23.5 (5)16.9 to 19.3 (4)12 to 16.9 (6)
Note: This figure uses 2004-6 data to facilitate comparison with Figure 3.11; the most recent data available are for 2007 (see Figure 3.14). Source: Eurostat.
European Policies Research Centre Euroreg 36
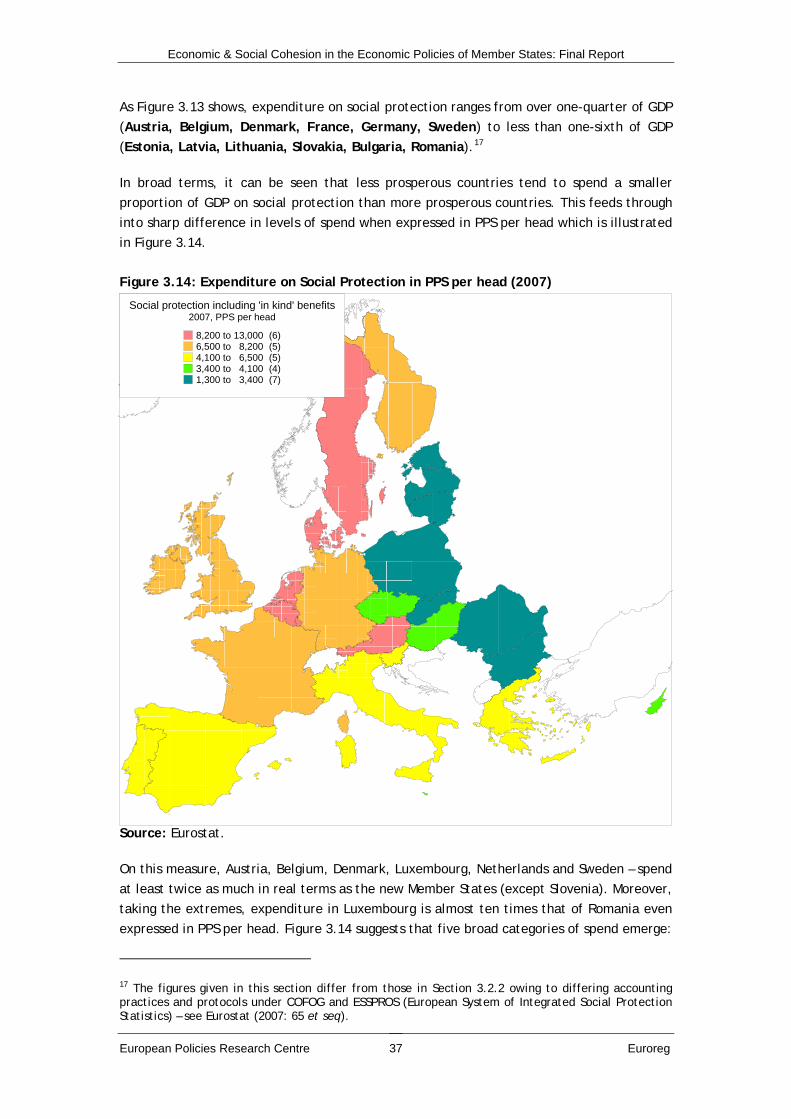
Economic & Social Cohesion in the Economic Policies of Member States: Final Report
European Policies Research Centre Euroreg 37
As Figure 3.13 shows, expenditure on social protection ranges from over one-quarter of GDP
(Austria, Belgium, Denmark, France, Germany, Sweden) to less than one-sixth of GDP
(Estonia, Latvia, Lithuania, Slovakia, Bulgaria, Romania).17
In broad terms, it can be seen that less prosperous countries tend to spend a smaller
proportion of GDP on social protection than more prosperous countries. This feeds through
into sharp difference in levels of spend when expressed in PPS per head which is illustrated
in Figure 3.14.
Figure 3.14: Expenditure on Social Protection in PPS per head (2007)
Social protection including 'in kind' benefits2007, PPS per head
8,200 to 13,000 (6)6,500 to 8,200 (5)4,100 to 6,500 (5)3,400 to 4,100 (4)1,300 to 3,400 (7)
Source: Eurostat.
On this measure, Austria, Belgium, Denmark, Luxembourg, Netherlands and Sweden – spend
at least twice as much in real terms as the new Member States (except Slovenia). Moreover,
taking the extremes, expenditure in Luxembourg is almost ten times that of Romania even
expressed in PPS per head. Figure 3.14 suggests that five broad categories of spend emerge:
17 The figures given in this section differ from those in Section 3.2.2 owing to differing accounting practices and protocols under COFOG and ESSPROS (European System of Integrated Social Protection Statistics) – see Eurostat (2007: 65 et seq).

Economic & Social Cohesion in the Economic Policies of Member States: Final Report
Countries which spend in the range 8,200 to 13,000 PPS per head: Austria,
Belgium, Denmark, Luxembourg, Netherlands and Sweden;
those which spend in the range 6,500 to 8,200 PPS per head: Finland, France,
Germany, Ireland, United Kingdom;
those which spend in the range 4,100 to 6,500 PPS: Greece, Italy, Portugal, Spain,
Slovenia;
those which spend in the range 3,400 to 4,100 PPS: Cyprus, Czech Republic,
Hungary, Malta;
and the remainder, which spend less than 3,400 PPS per head: Bulgaria, Estonia, Latvia,
Lithuania, Poland, Romania, Slovakia.
There are clear risks in simply considering levels of spend across countries on an apparently
comparable basis. The absence of a qualitative or contextual dimension aside, these data
ignore the fact many contributions and benefits are subject to tax so that net expenditure
may be significantly lower than gross figures; across the EU as a whole a pilot study by
Eurostat estimates that around seven percent of benefits were clawed back through the
fiscal system, but the actual rate may very from zero (in Romania, Bulgaria, Czech Republic
and Slovakia) to around 18 percent in the Netherlands (Eurostat, 2009).
In addition, systems of social protection vary widely between countries, being as they are a
product of history, institutional and cultural norms as well as political and economic
choices. Following the seminal work of Esping-Andersen (1990) on models of State welfare,
various authors (for a review see Arts and Gelissen, 2002) have sought to refine and develop
the original three-way classification of welfare systems, which comprised liberal welfare
systems, social democratic welfare systems and corporatist welfare systems. While the
exact classification remains contested, it is perhaps fair to conclude that a degree of
consensus exists around the following four categories (CPB/SCB, 2003):
Liberal welfare states where support is limited and the emphasis is on safety net
provisions for those whose needs cannot be met in other ways. Ireland the UK fall
into this category.
Social democratic welfare states where the reduction of income differentials is a
prime objective and all inhabitants are entitled to collective provisions for a large
number of risks. Denmark, Sweden and Finland are in this group.
Corporatist welfare states, which are characterised by schemes aimed at different
occupational groups, and a more direct relationship between benefits and
contributions than in social democratic and liberal systems. Austria, France and
Belgium are the main examples of this.
Mediterranean systems (see Ferrera, 1996), which have no clear safety net in the
form of subsistence benefits, but relatively high pensions.
European Policies Research Centre Euroreg 38

Economic & Social Cohesion in the Economic Policies of Member States: Final Report
European Policies Research Centre Euroreg 39
Policies in the new Member States are not explicitly classified here, although it has been
noted that, in those belonging to the eastern bloc until 1989, social provisions made no
distinction according to employment history or occupational status, but thereafter, the
affordability of such schemes came under considerable pressure. In consequence, these
social regimes have been overhauled and the benefits under them have been described as
‘meagre’ (CPB/SCB, 2003). In consequence, it has been argued that a distinctive eastern
European welfare regime has emerged through the fusion of Bismarck social insurance,
communist (universalism, corporatism, egalitarianism) and post-communist (market-based)
features (Cerami, 2006). However, it has also been suggested that there is no real
consensus on the classification of eastern European systems of social protection (Bohle,
2007).
3.4 The relative importance of national cofinancing of EU Cohesion policy
The discussion of national policies in subsequent sections of this report focuses on current
objectives and instruments, so a consideration of the current EU Cohesion policy planning
period is relevant, since this directly affects national expenditure commitments and the
capacity for discretionary spend not tied to EU Cohesion policy. This is especially pertinent
in the case of the new Member States where the 2007-13 programming period involved a
substantial upgrading of the EU funding contribution.
A measure of the overall scale of EU Cohesion policy spending commitments is given in
Figure 3.15. These figures include both national and EU cofinancing of EU Cohesion policy
(but exclude private sector contributions). For ease of comparison, figures are on an annual
average basis.18 As is well-known, commitment appropriations vary widely among the
Member States, largely reflecting the interaction of national prosperity with the effects of
the absorption cap.
Figure 3.15 suggests that countries fall into six broad groups:
those where Cohesion policy commitments are well under 0.5 percent of GDP
(ranging from 0.06 percent in Denmark to 0.3 percent in Finland) and below 100 PPS
per head (from 17 in Denmark to 77 in Finland); as well as Denmark and Finland,
this grouping comprises Austria, Belgium, France, Germany, Ireland,
Luxembourg, the Netherlands, Sweden and the United Kingdom;
those where Cohesion policy commitments lie between 0.5 and 1 percent 0.5
percent of GDP and per capita allocations are in the range 100-200 PPS per annum,
namely Cyprus, Italy and Spain;
those where Cohesion policy commitments are between 1.5 and 3 percent of GDP
and per capita commitments are in the range 350 to 500 PPS: Greece, Malta,
Slovenia and Portugal;
18 Clearly, the actual profile of spending over the period in any given country varies widely, depending on transitional provisions and the impact of the absorption cap on transfers.

Economic & Social Cohesion in the Economic Policies of Member States: Final Report
those where Cohesion policy commitments lie in the range 4 to 5 percent of GDP:
Czech Republic, Hungary and Romania; Note, however, that in PPS per capita
terms expenditure in Romania is below 400 PPS, while that in Czech Republic and
Hungary exceeds 600 PPS per head;
those where Cohesion policy commitments lie in the range 5 to 6 percent of GDP
and are around 600 PPS per head: Slovakia, Poland, Bulgaria, Estonia and
Lithuania;
Latvia, where expenditure exceeds 6 percent of GDP, although the per capita
annual amount remains at around 600 PPS.
Figure 3.15: National and EU Cofinancing of Cohesion Policy 2007-13 (% of GDP)
National and EU Funding of Cohesion Policy 2007-13Annual av. as % of 2004 GDP
over 6.0 (1)5 to 6 (5)4 to 5 (3)1.5 to 3 (4)0.5 to 1 (3)up to 0.5 (11)
Source: Own calculations from Com decisions, Eurostat and Inforegio data.
The level of EU co-financing of Cohesion policy varies widely between the Member States,
with national public contributions ranging from over 50 percent of the total budgeted for
(Ireland, Finland, Belgium, Italy) to less than 15 percent (Hungary, Czech Republic,
Slovakia, Slovenia, Estonia, Latvia and Lithuania) – see Table 3.2.
European Policies Research Centre Euroreg 40

Economic & Social Cohesion in the Economic Policies of Member States: Final Report
Table 3.2: National Cofinancing of EU Cohesion Policy
Share of total PPS per head per annum 2004 prices
Annual allocation as % of 2004 GDP (€)
Belgium 52.1 28.5 0.11 Bulgaria 16.9 63.1 0.79 Czech Republic 14.7 107.3 0.57 Denmark 29.1 4.8 0.02 Germany 28.4 15.8 0.07 Estonia 11.5 72.5 0.19 Ireland 63.2 42.5 0.13 Greece 21.8 80.0 0.22 Spain 29.4 51.2 0.19 France 41.0 21.4 0.10 Italy 52.1 67.1 0.28 Cyprus 15.5 24.0 0.10 Latvia 13.6 81.2 0.85 Lithuania 11.9 70.7 0.64 Luxembourg 45.3 15.7 0.03 Hungary 14.8 92.0 0.56 Malta 15.5 74.3 0.34 Netherlands 38.1 9.7 0.04 Austria 43.9 17.3 0.06 Poland 16.9 93.2 0.69 Portugal 23.5 98.7 0.55 Romania 16.9 60.1 0.68 Slovenia 14.3 61.3 0.23 Slovakia 14.6 90.7 0.63 Finland 52.8 40.5 0.16 Sweden 48.6 21.5 0.08 United Kingdom 44.2 16.9 0.06
Source: Own calculations from Com decisions, Eurostat and Inforegio data.
The significance of national cofinancing cannot just be measured in terms of overall share,
but should also take account of the value of that contribution in real terms (expressed in
PPS per capita in Table 3.2) and the scale of that contribution in relation to the national
economy. In per capita PPS terms, national cofinancing ranges from less than 20 PPS per
head per annum (Denmark, Netherlands, Luxembourg, Germany, United Kingdom and
Austria) to over 80 PPS (Greece, Latvia, Slovakia, Hungary, Poland, Portugal and the
Czech Republic).
Figure 3.16 shows the relative contributions of the EU and national budgets as a proportion
of GDP. This shows that while the overall Cohesion policy budget is substantial in most of
the new Member States, so too is their cofinancing of Cohesion policy as a proportion of
GDP.
European Policies Research Centre Euroreg 41

Economic & Social Cohesion in the Economic Policies of Member States: Final Report
Figure 3.16: EU and national funding of EU Cohesion policy 2007-13 – annual average commitment appropriations (% of GDP 2004)
0
1
2
3
4
5
6
7
EU27EU25
EU15 DK LU NLUK AT SE BE IE FR DE FI IT ES CY
GR SIPT
MT CZ
HU RO SK PL EE BU LT LV
Annual Commitment Appropriations as % of GDP (2004) National contribution to Cohesion policy % of GDP
Source: Own calculations from Com decisions; Eurostat and Inforegio.
In this context, national cofinancing varies widely – from under 0.08 percent of GDP
(Denmark, Luxembourg, Netherlands, United Kingdom, Austria, Germany, Sweden) to over
0.5 percent of GDP (Portugal, Hungary, Czech Republic, Slovakia, Lithuania, Romania,
Poland, Bulgaria and Latvia). To set this in some perspective, the relative contribution of
Latvia to Cohesion policy is 40 times that of Denmark.
Figure 3.17 suggests six broad groupings of country based on national cofinancing of EU
Cohesion policy expressed as a percentage of GDP:
Bulgaria and Latvia where national cofinancing amounts to over 0.7 percent of
GDP;
Lithuania, Poland, Romania and Slovak Republic where national cofinancing is
between 0.6 and 07 percent of GDP;
Czech Republic, Portugal and Hungary where national cofinancing is between 0.4
and 0.6 percent of GDP;
Italy, Greece, Malta and Slovenia where national cofinancing is between 0.2 and
0.4 percent of GDP;
Belgium, Cyprus, Estonia, Finland, France, Ireland, Spain where national
cofinancing is between 0.1 and 0.2 percent of GDP;
and the remaining countries: Austria, Denmark, Germany, Luxembourg,
Netherlands, Sweden, United Kingdom, where cofinancing amounts to less than
0.1 percent of GDP.
European Policies Research Centre Euroreg 42

Economic & Social Cohesion in the Economic Policies of Member States: Final Report
Figure 3.17: National cofinancing of EU Cohesion policy 2007-13 (% of GDP)
National funding of Cohesion Policy 2007-13Annual av. as % of 2004 GDP
0.7 to 0.9 (2)0.6 to 0.7 (4)0.4 to 0.6 (3)0.2 to 0.4 (4)0.1 to 0.2 (7)0 to 0.1 (7)
Source: Own calculations from Com decisions, Eurostat and Inforegio data.
Of course, differences in these relative contributions are partly a function of national policy
choices about which policy instruments and initiatives best fit with EU Cohesion policy
priorities – this is particularly so in the more prosperous countries where there is
considerably more scope for discretionary national spend unconnected with EU Cohesion
policy. However, in the less prosperous countries, national cofinancing of Cohesion policy
not only has significant budgetary implications, but also reduces the scope to design and
fund purely domestic measures aimed at cohesion.
3.5 Concluding points
The aim of this chapter has been to provide some context for the more detailed discussion
of national cohesion policies which follows. Three key dimensions have been considered:
(i) the overall scale of public spending and its breakdown by function and tier of
government; (ii) national spending on economic and social cohesion; and (iii) the relative
importance of national and EU spending on EU cohesion policy in the current planning
period.
European Policies Research Centre Euroreg 43

Economic & Social Cohesion in the Economic Policies of Member States: Final Report
European Policies Research Centre Euroreg 44
(i) Scale and patterns of total government spending
The scale of public spending overall varies widely between countries, ranging from under 35
percent of GDP in 2006 (Estonia, Ireland, Lithuania) to over 50 percent (Denmark,
Hungary, France, Sweden), with less prosperous countries tending to have lower spending
as a proportion of GDP than more prosperous one. In PPS per capita terms, the correlation
between prosperity and levels of spend is marked, with PPS per capita spending tending to
increase with prosperity. From a cohesion perspective, the implications of this are
considerable, given the role that public transfers play in reducing regional income
inequalities (European Commission, 1998).
Patterns of public spending function also vary between countries. However, in all Member
States, social protection is the single largest item of expenditure; in practice, the
differences between countries in public expenditure as a proportion of GDP are largely
accounted for by differences in spend on social protection.
Analysis of spending by tier of government reveals some significant differences between
countries. In particular, in Belgium, Germany, Spain and Austria a significant share of
government expenditure is accounted for by the so-called ‘state’ level, referring to the
regions, Länder and Autonomous Communities in the countries concerned. The involvement
of this tier is, in turn, reflected in the policy implementation mechanisms discussed in
Chapter 5.
(ii) National spending on economic and social cohesion
The overall aim of the study is to consider the contribution of Member State policies to
cohesion. This task is complicated by the absence of a concrete or agreed definition of
cohesion. Nevertheless, the concept of Expenditure for Development (EfD) is a useful tool
in estimating spend on economic cohesion; at the same time, the analyses of social
protection data under ESSPROS offer a proxy for social cohesion spending.
Spending on economic development, including both national and EU contributions, typically
accounts for between two and five percent of GDP. In terms of overall EfD, countries can
be divided into broad two groups:
those that spend more than the EU average: Austria, Belgium, Bulgaria, Cyprus,
Czech Republic, Estonia, France, Greece, Hungary, Ireland, Italy, Latvia,
Lithuania, Luxembourg, Malta, Netherlands, Poland, Portugal, Romania,
Slovenia, Spain; and
those that spend less: Denmark, Finland, Germany, Slovakia, Sweden and the
United Kingdom
However, there are wide variations in national levels of spend ie. excluding the EU
contribution through Cohesion policy. Once this is deducted, the groups are:19
19 No information is available for Bulgaria and Romania.

Economic & Social Cohesion in the Economic Policies of Member States: Final Report
above average spending on EfD: Austria, Belgium, Cyprus, Czech Republic,
France, Hungary, Ireland, Italy, Luxembourg, Malta, Netherlands, and Spain; and
below average spending on EfD: Denmark, Estonia, Greece, Finland, Germany,
Latvia, Lithuania, Poland, Portugal, Slovakia, Slovenia, Sweden, and the United
Kingdom.
The key point to note here is the relative importance of the EU contribution to EfD for
many less prosperous Member States; this is particularly so for the Baltic countries, Poland,
Portugal and Slovakia, where the EU contribution to EfD exceeds 50 percent. In short, EfD
generally appears to be higher as a percentage of GDP in poorer countries than in richer
ones; on the other hand, for most poorer countries this ceases to be the case when the EU
contribution to EfD is removed.
Spending on social protection constitutes the single largest item of public expenditure in all
countries; it dwarfs EfD. However, it varies widely as a proportion of GDP from over one-
quarter (Austria, Belgium, Denmark, France, Germany, Sweden) to less than one-sixth (the
Baltic countries, Slovakia, Bulgaria and Romania), with more prosperous countries tending
to spend more than less prosperous ones. This is illustrated in Figure 3.18.
Figure 3.18: Social protection expenditure and GDP (2007)
UK
SE
FI
SK
SI
RO
PT
PL
AT
NL
MT
HULT
LV
CY
IT
FRES
GR
IE
EE
DE
DK
CZ
BU
BE
30
50
70
90
110
130
150
0 1000 2000 3000 4000 5000 6000 7000 8000 9000
Social protection expenditure PPS per head
GD
P(P
PS
) p
er h
ead
EU
27=
100
Note: Luxembourg is excluded for reasons of scale – GDP(PPS) is equivalent to 275 percent of the EU average and spend on social protection amounted to almost 13,000 PPS per head in 2007. Source: Own calculations from Eurostat data.
(iii) National co-financing of Cohesion policy 2007-13
As is well-known, the scale of EU Cohesion policy funding (national and EU combined) varies
widely between countries – from less than 0.1 percent of GDP for example, in, Denmark,
Luxembourg and the Netherlands – rising to over five percent in countries such as Poland,
European Policies Research Centre Euroreg 45

Economic & Social Cohesion in the Economic Policies of Member States: Final Report
Bulgaria and the Baltic countries. However, a fact that is less frequently remarked upon
concerns the wide differences in the scale of national co-financing of EU Cohesion policy.
This ranges from around 0.020 percent of GDP in Denmark, to almost 0.9 percent of GDP in
Latvia; in other words, the relative contribution to cofinancing EU Cohesion policy in
Latvia is 40 times that required in Denmark. In general, as Figure 3.19 shows, national
cofinancing of EU Cohesion policy is inversely correlated with prosperity – poorer countries
commit a significantly greater proportion of GDP to cofinancing Cohesion policy than do
richer countries.
Figure 3.19: National cofinancing of EU Cohesion policy 2007-13 (annual av as % of GDP 2004)
UK
SE
FI
SK
SI
RO
PT
PL
AT
NL
MT
HULT
LV
CY
ITFR
ES
GR
IE
EE
DE
DK
CZ
BU
BE
30
50
70
90
110
130
150
0.0 0.1 0.2 0.3 0.4 0.5 0.6 0.7 0.8 0.9
National cofinancing of Cohesion policy (% of GDP)
GD
P(P
PS
) p
er h
ead
EU
27=
100
Note: Luxembourg is excluded for reasons of scale – GDP(PPS) is equivalent to 275 percent of the EU average and national cofinancing of EU Cohesion policy is an annual average of 0.03 percent of GDP. Source: Own calculations from Com decisions; Eurostat and Inforegio.
In sum, EU Cohesion policy funding varies widely between Member States, with poorer
countries receiving substantially higher allocations; that said, national co-financing of EU
programmes represents a significant proportion of GDP in the poorer Member States. EU
Cohesion policy co-financing is not a significant drain on public finances in the more
prosperous Member States, where funding is often used to ‘top up’ existing domestic
programmes, which are themselves driven by domestic priorities. Moreover, EfD in the
more prosperous countries includes much expenditure that is not co-funded – in other
words, in such countries, EU Cohesion policy is the ‘tip of the iceberg’ of public
investment. The reverse is true in many of the less prosperous Member States. Here,
Cohesion policy pervades many aspects of public investment and Commission priorities may
dominate the agenda. Given the volume of funding involved, national policymakers
generally have to tailor programmes to meet Commission demands. Moreover, the co-
financing of EU Cohesion policy is a significant item of national expenditure, leaving little
scope for purely domestically-driven initiatives.
European Policies Research Centre Euroreg 46

Economic & Social Cohesion in the Economic Policies of Member States: Final Report
European Policies Research Centre Euroreg 47
4. NATIONAL POLICY INSTRUMENTS TO PROMOTE COHESION
4.1 Introduction
Member State policies aimed at promoting economic and social cohesion have undergone a
profound shift over the past two to three decades, a process which has been frequently
described as a change in the paradigm of territorial development. These policies have been
subject to extensive country-specific analysis (see, for example: Adams et al, 2003; Ancien,
2005; Devos et al, 2005; Fabbrini and Brunazzo, 2003; Fothergill, 2005; Fürst, 2006; Gren,
2002; Halkier, 2001; Kunnunen, 2004; Oscarsson, 2000; and Priemus, 2004) and comparative
research20 on which this study builds. Such research suggests that the main economic
policies aimed at promoting economic and social cohesion are three-fold: narrow regional
policies, often targeted at designated aid areas or locations with specific characteristics;
broader policies for territorial development which, while generally available across all
regions, take a region-specific approach, often via regional strategies and programmes; and
those sectoral policies which have an explicit or implicit economic cohesion dimension.
These different policy approaches are discussed further in the sections which follow.
4.2 Narrow regional policies with an explicit cohesion dimension
There are a number of policy instruments that fall under narrow regional policies, most
notably regional incentive schemes, but also targeted development programmes and
support provided to areas facing specific development issues. Looking across countries (see
Figure 4.1), virtually all Member States operate regional aid measures. In addition, around
half of them implement regional development programmes targeted at specific regional
issues. A limited number provide further support in situations of economic restructuring, for
language and ethnic minorities, or through targeted solidarity transfers. With regard to
spending patterns, apart from regional aid, it is difficult to provide a comparative picture
of Member State’s expenditure on policy instruments and, in the discussion that follows,
data estimates gathered in the country reports are used principally for illustrative
purposes.21 What can be said is that in some countries, such as Germany or Spain, regional
policy expenditure is very targeted and concentrated in geographical terms on a few main
policy instruments, while in other cases, such as France, funding is spread across a wide
variety of support mechanisms. In part, this reflects the nature of the regional problem and
the importance of national regional policy (see Section 2.4.2).
20 An annual survey and assessment of national regional policies in Europe is undertaken by EPRC under its EoRPA research programme http://www.eprc.strath.ac.uk/eorpa/default.cfm. Comparative European research has also been conducted under the EPRC ‘benchmarking regional policies’ project http://www.eprc.strath.ac.uk/benchmarking2/login.cfm?accessdenied=%2Fbenchmarking2%2Fdefault%2Ecfm. Further comparative information on regional policies is available from OECD reports and country studies. Other comparative regional policy research has tended to focus on groups of countries (e.g. the periodic surveys of Nordic regional policies by Nordregio or the EUROREG studies of the regional policies of Visegrad states). 21 In Part II of this report, available expenditure data on policy instruments are provided for all Member States (see Figure 6 in each country report). However, it should be noted that the degree of comparability between countries is relatively low.

Economic & Social Cohesion in the Economic Policies of Member States: Final Report
European Policies Research Centre Euroreg 48
As discussed in Section 2.4.1, there is an interesting mix of cohesion objectives pursued in
the different Member States. Figure 4.1 and the discussion that follows gives an overview
over the various narrow regional policy instruments alongside relevant Member State
examples.22
Figure 4.1: Overview of narrow regional policy instruments
Instrument type
Regional aid
Regional development programmes
Economic restructuring
Language/ ethnic
minorities
Solidarity transfers
Member State
examples ALL MS
(except DK)
BU CZ CY DE FI FR GR HU LV NL SI MT
CZ FI FR PL FI IE SE SI DE ES PT
Source: Own elaboration based on Part II country reports.
4.2.1 Regional aid schemes
Regional aid for firms, which can take various forms (eg. investment aid, tax allowances),
mainly contributes to economic cohesion. The degree to which aid schemes are actually
conducive to cohesion varies, notably in line with aid map coverage and differentials in
award rates. In most EU15 countries, the aid map restricts government support for large
firms and therefore explicitly encourages investment in problem regions. Here, the spatial
impact of support depends on whether the focus of the aid map is on a limited number of
problem regions (eg. Germany), or whether assisted areas are spread thinly across the
country (eg. France). The situation is different in most of the EU12, since they are entirely
covered by the aid map with usually only minor differentials in award rates between
regions. In some cases, it is therefore unclear to what extent such measures actually favour
problem regions in practice (e.g. Poland, Romania, Slovenia).
However, there are Member States, where the capital city is excluded from the aid map
(Czech Republic, Portugal, Slovakia), or where it falls under Article 107(3)(c) coverage,23
thus receiving much lower award rates than the rest of the country (Hungary). Another
example of differentiated support is Cyprus, with the aid map covering only 50 percent of
the population in ‘c’ areas. There are also cases, where the aid intensity takes account of
socio-economic development levels, such as in the Czech Republic, where new investments
in regions with high unemployment can qualify for higher award rates.
Regional aid can also contribute to territorial cohesion, notably concerning aid targeted at
sparsely-populated areas, where the policy aim is to retain population and to maintain
balanced settlement structures (Finland, Sweden). A territorial dimension is also visible in
countries where the regional aid map provides for the entire coverage of, or higher award
22 Please note that only those instruments and initiatives are considered which are actually operational. 23 Hereafter referred to as ‘c’ areas.
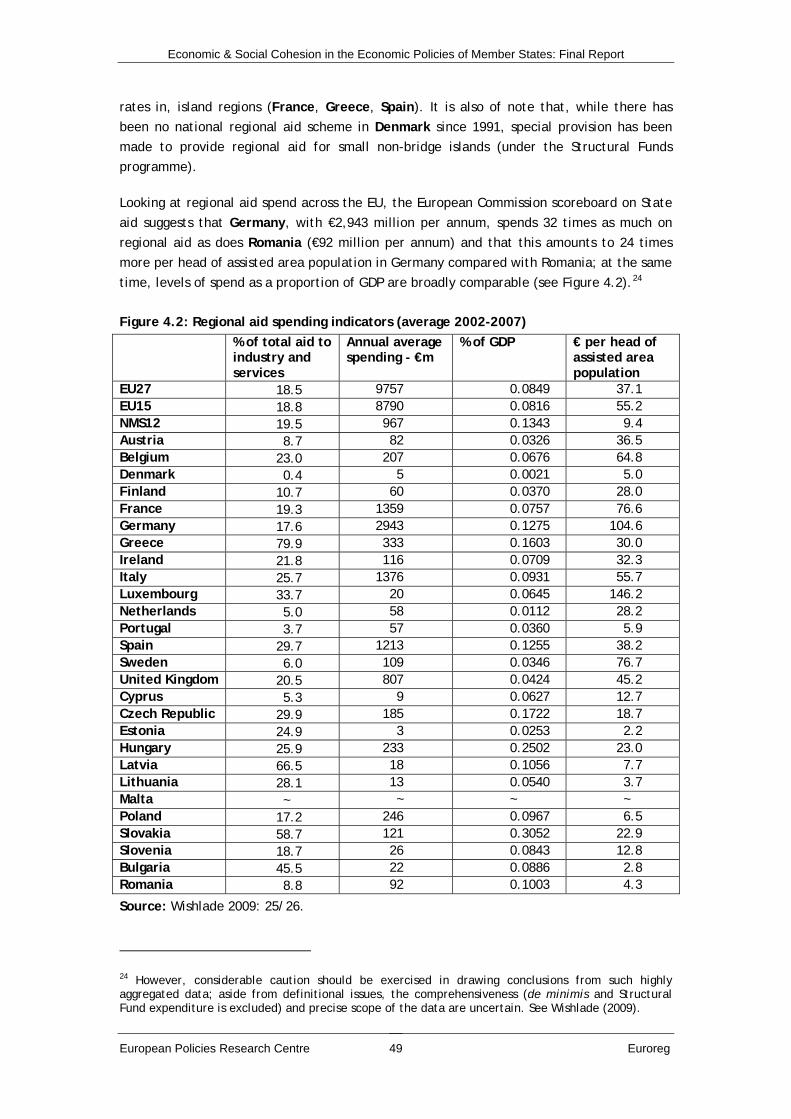
Economic & Social Cohesion in the Economic Policies of Member States: Final Report
European Policies Research Centre Euroreg 49
rates in, island regions (France, Greece, Spain). It is also of note that, while there has
been no national regional aid scheme in Denmark since 1991, special provision has been
made to provide regional aid for small non-bridge islands (under the Structural Funds
programme).
Looking at regional aid spend across the EU, the European Commission scoreboard on State
aid suggests that Germany, with €2,943 million per annum, spends 32 times as much on
regional aid as does Romania (€92 million per annum) and that this amounts to 24 times
more per head of assisted area population in Germany compared with Romania; at the same
time, levels of spend as a proportion of GDP are broadly comparable (see Figure 4.2).24
Figure 4.2: Regional aid spending indicators (average 2002-2007)
% of total aid to industry and services
Annual average spending - €m
% of GDP € per head of assisted area population
EU27 18.5 9757 0.0849 37.1 EU15 18.8 8790 0.0816 55.2 NMS12 19.5 967 0.1343 9.4 Austria 8.7 82 0.0326 36.5 Belgium 23.0 207 0.0676 64.8 Denmark 0.4 5 0.0021 5.0 Finland 10.7 60 0.0370 28.0 France 19.3 1359 0.0757 76.6 Germany 17.6 2943 0.1275 104.6 Greece 79.9 333 0.1603 30.0 Ireland 21.8 116 0.0709 32.3 Italy 25.7 1376 0.0931 55.7 Luxembourg 33.7 20 0.0645 146.2 Netherlands 5.0 58 0.0112 28.2 Portugal 3.7 57 0.0360 5.9 Spain 29.7 1213 0.1255 38.2 Sweden 6.0 109 0.0346 76.7 United Kingdom 20.5 807 0.0424 45.2 Cyprus 5.3 9 0.0627 12.7 Czech Republic 29.9 185 0.1722 18.7 Estonia 24.9 3 0.0253 2.2 Hungary 25.9 233 0.2502 23.0 Latvia 66.5 18 0.1056 7.7 Lithuania 28.1 13 0.0540 3.7 Malta ~ ~ ~ ~ Poland 17.2 246 0.0967 6.5 Slovakia 58.7 121 0.3052 22.9 Slovenia 18.7 26 0.0843 12.8 Bulgaria 45.5 22 0.0886 2.8 Romania 8.8 92 0.1003 4.3
Source: Wishlade 2009: 25/26.
24 However, considerable caution should be exercised in drawing conclusions from such highly aggregated data; aside from definitional issues, the comprehensiveness (de minimis and Structural Fund expenditure is excluded) and precise scope of the data are uncertain. See Wishlade (2009).

Economic & Social Cohesion in the Economic Policies of Member States: Final Report
This is in line with the earlier observation on the higher capacity of more prosperous
Member States to address regional problems (see Section 2.4.2(ii)). Based on scoreboard
data, countries appear to fall into the following two groups:
countries with average regional aid expenditure as a percentage of GDP (Bulgaria,
Slovenia) or above (from highest to lowest: Slovakia, Hungary, Czech Republic,
Greece, Germany, Spain, Latvia, Romania, Poland, Italy); and
Member States with lower than average regional aid expenditure as a percentage of
GDP; most of which are part of EU15 (from lowest to highest: Denmark,
Netherlands, Austria, Sweden, Portugal, Finland, UK, Luxemburg, Belgium,
Ireland, France), but there are also examples from the EU12 (Estonia, Lithuania,
Cyprus).
It appears, however, problematic to relate scoreboard data to the country groupings
identified in Section 3.3.1, since there is no strong correlation between overall levels of EfD
and expenditure on regional aid. This is perhaps not surprising given the generally very
small commitments on regional aid, set against EfD; at the same time, EfD comprises a
range of public expenditures and, as noted earlier, while the concept has been designed to
be broadly comparable with EU Cohesion policy expenditure, it does not in any meaningful
sense equate to national regional policy expenditure.
4.2.2 Targeted regional development programmes
In addition to regional aid measures, targeted development initiatives (often in the form of
specific regional programmes) are in place in a number of Member States, frequently
promoting more than one cohesion dimension. The areas covered by such measures often
overlap to a considerable degree with designated aid areas (eg. France, Germany,
Netherlands). Economic cohesion is the main objective for most of these programmes,
which often consist of a combination of instruments (eg. investment aid, infrastructure
support). There is also a strong social component, notably regarding initiatives with a more
or less explicit solidarity objective in countries with major internal disparities (Germany,
Spain). In the case of Germany, a ‘Solidarity Pact’ is in place. This is a large scale
instrument and part of the funding (one third) is aimed at improving competitiveness,
employment and infrastructure in the new Länder (the other two thirds are transferred
directly to the Länder governments, see Section 4.2.5). This funds a range of federal
programmes, notably in the fields of transport infrastructure and business aid. A social
dimension is furthermore integrated in some of the smaller-scale development programmes
(Greece, Finland, Malta, Slovenia). There are also examples of programmes with a
territorial cohesion component, for example concerning the support programme of Corsica
in France. In Hungary, support is provided to a number of ‘seeded areas’ across the
country, which are considered to be of strategic importance. These have to be homogenous
economically, socially or environmentally, justifying uniform development and thus
contributing to several cohesion dimensions.
European Policies Research Centre Euroreg 50
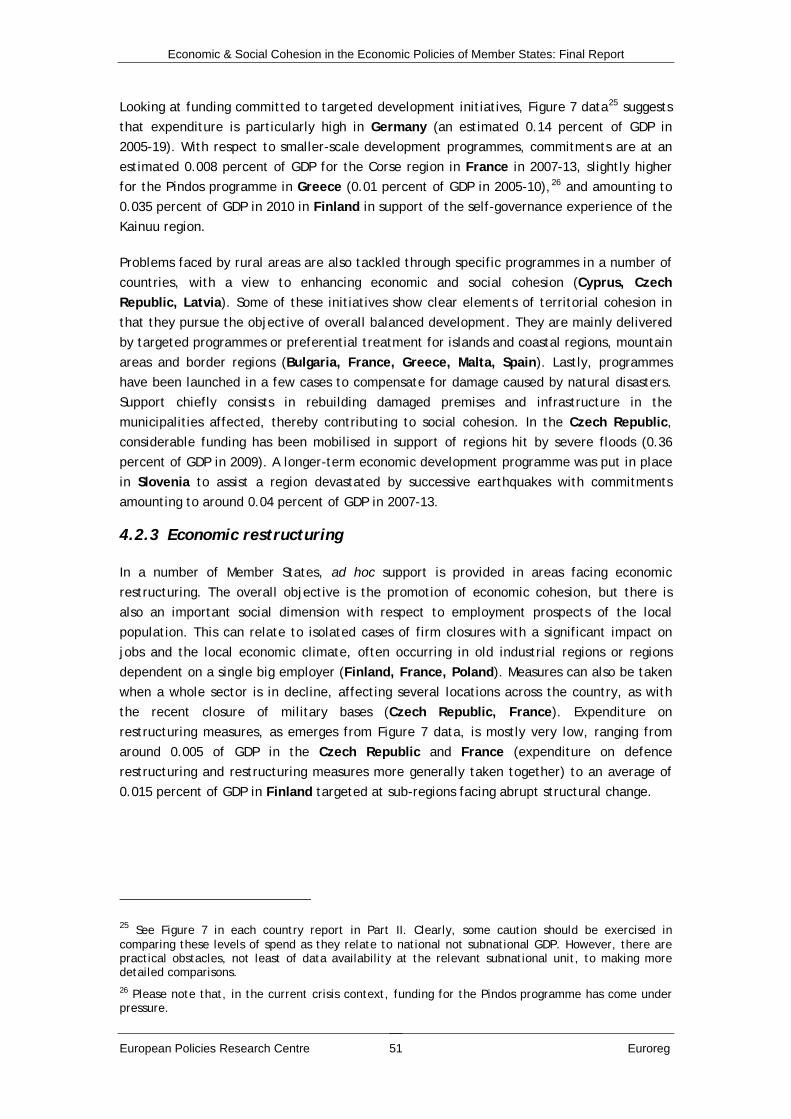
Economic & Social Cohesion in the Economic Policies of Member States: Final Report
European Policies Research Centre Euroreg 51
Looking at funding committed to targeted development initiatives, Figure 7 data25 suggests
that expenditure is particularly high in Germany (an estimated 0.14 percent of GDP in
2005-19). With respect to smaller-scale development programmes, commitments are at an
estimated 0.008 percent of GDP for the Corse region in France in 2007-13, slightly higher
for the Pindos programme in Greece (0.01 percent of GDP in 2005-10),26 and amounting to
0.035 percent of GDP in 2010 in Finland in support of the self-governance experience of the
Kainuu region.
Problems faced by rural areas are also tackled through specific programmes in a number of
countries, with a view to enhancing economic and social cohesion (Cyprus, Czech
Republic, Latvia). Some of these initiatives show clear elements of territorial cohesion in
that they pursue the objective of overall balanced development. They are mainly delivered
by targeted programmes or preferential treatment for islands and coastal regions, mountain
areas and border regions (Bulgaria, France, Greece, Malta, Spain). Lastly, programmes
have been launched in a few cases to compensate for damage caused by natural disasters.
Support chiefly consists in rebuilding damaged premises and infrastructure in the
municipalities affected, thereby contributing to social cohesion. In the Czech Republic,
considerable funding has been mobilised in support of regions hit by severe floods (0.36
percent of GDP in 2009). A longer-term economic development programme was put in place
in Slovenia to assist a region devastated by successive earthquakes with commitments
amounting to around 0.04 percent of GDP in 2007-13.
4.2.3 Economic restructuring
In a number of Member States, ad hoc support is provided in areas facing economic
restructuring. The overall objective is the promotion of economic cohesion, but there is
also an important social dimension with respect to employment prospects of the local
population. This can relate to isolated cases of firm closures with a significant impact on
jobs and the local economic climate, often occurring in old industrial regions or regions
dependent on a single big employer (Finland, France, Poland). Measures can also be taken
when a whole sector is in decline, affecting several locations across the country, as with
the recent closure of military bases (Czech Republic, France). Expenditure on
restructuring measures, as emerges from Figure 7 data, is mostly very low, ranging from
around 0.005 of GDP in the Czech Republic and France (expenditure on defence
restructuring and restructuring measures more generally taken together) to an average of
0.015 percent of GDP in Finland targeted at sub-regions facing abrupt structural change.
25 See Figure 7 in each country report in Part II. Clearly, some caution should be exercised in comparing these levels of spend as they relate to national not subnational GDP. However, there are practical obstacles, not least of data availability at the relevant subnational unit, to making more detailed comparisons. 26 Please note that, in the current crisis context, funding for the Pindos programme has come under pressure.

Economic & Social Cohesion in the Economic Policies of Member States: Final Report
4.2.4 Language and ethnic minorities
In a few Member States, policy support is oriented towards target groups in addition to
target territories. Such policies have both an economic and a social dimension. In Ireland,
for example, the language community of Gaelic speakers receives specific attention based
on dedicated business support measures. Other Member States choose to provide particular
support to minority groups, eg. through local infrastructure and job creation (Finland,
Sweden, Slovenia). Support is typically quite low, amounting to around 0.01 percent of
GDP in Slovenia in support of Roma and indigenous populations and slightly more in Ireland
(0.018 percent of GDP in 2009).
4.2.5 Solidarity transfers
In addition to the above instruments, a few countries operate significant solidarity transfers
with explicit development dimensions. In contrast to targeted initiatives mentioned under
Section 4.2.2, funding is allocated to selected local authorities who can use it for regional
development more broadly. These transfers complement standard fiscal equalisation
systems operating across the country (see Section 4.3.4).
In Spain, the ‘Inter-Territorial Compensation Fund’ (ICF) is allocated to regional
governments in 11 out of 17 regions for public investment expenditure and, specifically, for
the realisation of projects of a local, comarcal (grouping of municipalities), provincial or
regional nature that contribute to the reduction of interregional disparities in income and
wealth. Expenditure amounted to 0.12 percent of GDP in the 2005-09 period. The country’s
fiscal equalisation system is also designed so that it explicitly addresses regional
disparities. In addition to a basic Guarantee Fund, two ‘Convergence Funds’ are in place
which aim to promote convergence between regions in terms of per capita GDP and
funding: first, the Cooperation Fund, which is targeted at less-developed regions (with GDP
per capita below 90 percent of the national average) and those with unfavourable
population dynamics (in terms of low growth and density); second the Competitiveness
Fund, which aims to raise increase the resources to those regions that receive relatively
less funding per capita through the system (ie. the more developed regions).
In Germany, as part of the ‘Solidarity Pact’, additional federal transfers take place to
increase the budgets of the eastern Länder governments, mainly focused on infrastructure
(an estimated 0.29 percent of GDP in 2005-19). Also, the eastern Länder are favoured under
the standard fiscal equalisation system (the poorer Länder received between 0.12 and 0.16
percent of annual GDP in 1995-2009).
In both Spain and Germany, instruments have an economic as well as a social dimension. In
addition to this, mechanisms in Portugal and Spain have a clear focus on territorial
cohesion, with island regions receiving special treatment.
4.3 Broad regional policies with a cohesion dimension
Broad, ‘all-region’ policies, which are not driven by EU Cohesion policy, have chiefly
developed in the more prosperous EU15 Member States (see Figure 4.3). They mainly focus
on economic cohesion, in the sense of providing support for the business environment and
European Policies Research Centre Euroreg 52

Economic & Social Cohesion in the Economic Policies of Member States: Final Report
European Policies Research Centre Euroreg 53
cluster development (although clearly there is a social dimension to this in so far as the
creation of employment opportunities is also an important policy aspect). Objectives of
regional and local development programmes, another broad policy instrument, are more
varied. In some countries, they are used to implement measures in the field of business and
cluster support (Finland, Netherlands), whereas in others, notably in EU12 Member States
and Cohesion countries, there is a greater focus on social cohesion, notably in terms of
balanced infrastructure and service provision. Regarding the issue of whether the all-region
nature of such measures contributes to or detracts from cohesion, the role of cohesion
considerations in allocating funding is significant. According to a recent study,27 such
policies tend to favour weaker regions. Furthermore, it needs to be noted that, in countries
with federal or highly-devolved systems (Austria, Belgium, Germany, Spain), the regions
operate their own economic development strategies and business support policies in
addition to any central initiatives.
Figure 4.3: Overview of broad regional policy instruments
Instrument type Business environment
Strategic clusters and
sectors
Regional/ local
development programmes
Fiscal equalisation
Member State
examples AT DK IE LU NL UK FI FR NL
EE FI FR GR HU IT LV NL PL SE SI
ALL MS
Source: Own elaboration based on Part II country reports.
4.3.1 Support for the business environment
In a number of cases, support for the business environment is mostly provided without an
explicit cohesion objective (Austria, Belgium (Flanders), Luxembourg, Netherlands).
However, there are also examples of approaches with in-built provisions in favour of
disadvantaged areas. In Ireland, for example, development agencies are required to
achieve the best possible regional balance in their investments, and some target specific
regions (such as Údarás na Gaeltachta, Shannon Development and the Western
Development Commission). In the United Kingdom, resources to English Regional
Development Agencies have, before their abolition following the May 2010 general election,
been allocated based on a complex formula containing nine domains which have a pro-
equity weighting; in Scotland, a dedicated development agency is in place for the Highlands
and Islands. Similarly, in Denmark, policy areas and funding mechanisms favour peripheral
areas and thus territorial cohesion in that at least 35 percent of programme-based
expenditure must benefit designated peripheral areas (which hold 10 percent of the
national population).
27 Yuill, D., Ferry, M. and Vironen, H. (2008) New Policy Frameworks, New Policy Approaches: Recent Regional Policy Developments in the EU and Norway, EoRPA Paper 08/1, University of Strathclyde, Glasgow.

Economic & Social Cohesion in the Economic Policies of Member States: Final Report
Available expenditure data (see Figure 7 data in Part II country reports) suggests that, even
in Member States with a generally low profile of regional policy, central-level business aid
expenditure outside regional aid is not very prominent (eg. in Denmark, national
expenditure on business development was 0.016 percent of GDP in 2008, and in Austria,
centrally-provided SME aid amounted to 0.084 percent of GDP in 2009). This may be due to
the nature of instruments, which are often ‘soft’ measures (eg. in the field of services and
advice) as opposed to ‘hard’ infrastructure measures. In some cases, it can also be linked to
the complementary role of the central level, with sub-national authorities providing the
bulk of the funding in this field (in Denmark, regional and local authorities spent 0.028
percent of GDP on business development in 2008, while the Länder in Austria mobilised
0.361 percent of GDP in 2009 for economic development more broadly.
4.3.2 Development of strategic clusters and sectors
The development and support of clusters in strategic areas is a policy feature in a few
countries. While these initiatives do not explicitly pursue cohesion objectives but rather
the country’s overall competitiveness, they may indirectly contribute to cohesion by
promoting regional strengths and capacity-building. Targeted support is provided to firms in
the context of the ‘Centre of Expertise’ programme in Finland and to firms participating in
‘Competitiveness Poles’ in France and Wallonie in Belgium. Under the ‘Peaks in the Delta’
initiative in the Netherlands there has been a slightly higher degree of territorial targeting
with 27 percent of the budget flowing to the north over the 2006-10 period.
Budgets, as reflected in the Part II country reports, vary, and it is important to take
account of the overall number of clusters supported when looking at expenditure data. In
Finland, funding committed to 21 Centres of Expertise amounts to 0.005 percent of GDP in
2010, in the Netherlands, funding of 0.014 percent of GDP is channelled to 22 ‘Peaks’ in
2007-13 to foster and take advantage of specific regional development opportunities,
whereas in France, 72 Competitiveness Poles are supported by an estimated 0.026 percent
of GDP in 2009-11.
4.3.3 Regional and local development programmes
Overarching programmes targeted at enhancing regional development across the country
are a common feature in a number of Member States. They are initiated by the central
State and involve the regions to different degrees depending on their competences (see
also Section 5.4). Such programmes can be rather narrowly defined, as is the case in
Finland, where annual regional development funding is allocated to the regional councils in
support of a number of initiatives in the field of business support (eg. the Centre for
Expertise programme, the improvement of regional competitiveness and networking). The
Netherlands’ Peaks in the Delta are implemented through six regional programmes, with
funding pooled from the national level, the provinces and big cities. These initiatives are
geared mostly towards ensuring economic cohesion.
In other cases, broader regional programmes and/or plans are implemented which cover a
variety of policy fields (and potentially all cohesion dimensions), mobilising funding from
different sectoral ministries (France, Sweden, see also Section 4.4.3(ii)). In the case of
European Policies Research Centre Euroreg 54

Economic & Social Cohesion in the Economic Policies of Member States: Final Report
Sweden, the four northernmost regions received some 44 percent of programme-based
funding in 2007 compared to their 11 percent population coverage. In Italy, while support
under the ‘unitary regional policy’ is available to all regions, it is intended to be
concentrated on the Mezzogiorno, which has one-third of the population but more than
four-fifths of the available funding. It is interesting to note that development programmes
are increasingly aligned with EU Cohesion policy programmes in a range of countries,
including funding arrangements. This is undertaken to simplify the implementation of the
Structural Funds and to enhance the overall impact of regional policy. These programmes
arguably contribute to cohesion in a wider sense of the term (Finland, France, Hungary,
Italy, Netherlands (North), Poland, Sweden).
There are also cases, notably in some of the less prosperous Member States, where support
for infrastructure and capacity-building is made available to local authorities across the
country, aiming at greater social cohesion (Greece, Latvia, Poland, Slovenia). In the case
of Poland, both domestic support and EU funding via regional OPs are allocated according
to an equity-related formula which favours sub-regions with low GDP per head and high
unemployment.
Expenditure allocated to broad development programmes partly depends on their scope.
Figure 7 data suggests that targeted funding committed to the regional councils in Finland
amounts to an average of 0.018 percent of GDP per annum. In Estonia, 0.058 percent of
GDP was allocated under regional grants in 2009. Funding involved in multi-sector
programmes is more important. In Sweden, programme-based support to regional projects
was 0.062 of GDP in 2008. In France, where the State-region contracts have a very wide,
cross-sectoral remit, central-level commitments amount to 0.095 percent of GDP in 2007-13
(complemented by 0.123 percent of GDP by regional and local authorities). Domestic
operational programmes in Hungary mobilise an estimated 0.396 percent of GDP over the
2009-10 period. In Italy, programmes funded by the ‘Fund for Underutilised Areas’ (FAS)
benefit from 0.596 percent of GDP in 2007-13. There are also examples of allocation
systems favouring disadvantaged regions. This is the case of Sweden, where the
northernmost regions receive a greater share in relation to their low population density. In
Italy, 85 percent of FAS resources are reserved for the Mezzogiorno.
4.3.4 Fiscal equalisation
Fiscal equalisation mechanisms operate in all Member States at different territorial levels.
They are based on vertical, and often also horizontal, transfers benefitting poorer areas
across the country without, however, targeting specific territories. While not explicitly
pursuing an economic cohesion objective, they significantly contribute to cohesion more
widely, and particularly to its social dimension. In comparison to regional policy
expenditure, related funding transfers are considerable, with around 2.3 percent of GDP
across OECD countries. By channelling funding towards less developed areas, such
mechanisms aim to ensure acceptable service provision across Member States and lead to a
significant reduction of disparities in fiscal capacities (OECD, 2007). More generally, they
help levelling out living standards and thus make a vital contribution to a country’s overall
cohesion.
European Policies Research Centre Euroreg 55

Economic & Social Cohesion in the Economic Policies of Member States: Final Report
European Policies Research Centre Euroreg 56
4.4 The cohesion role of sectoral policies
As a consequence of the general move away from purely narrowly-defined regional policies
and the increasing breadth of policy interventions, attention is shifting to the cohesion role
of related sectoral policies. At the same time, coordination with regional policy strategies
and instruments is becoming increasingly important. There are a number of sectoral
policies which have a considerable impact on cohesion within a country, although cohesion-
related objectives are rarely made explicit and impacts are often unintended.28 The
following sections first provide a brief description of the main sectoral policy fields
highlighted in the Part II country reports. This is followed by an overview of the
organisation of sectoral policies, and a discussion of horizontal coordination mechanisms
between sectoral and regional policies.29
4.4.1 Key sectoral policies with an impact on cohesion
One of the main policy fields with cohesion implications is infrastructure development,
particularly concerning the accessibility for households and businesses, as well as the
mobility of people living in peripheral areas. A number of activities fall under this heading,
with different Member States focusing on different aspects. In Ireland, there continues to
be a strong focus on investment in ‘hard’ infrastructure in order to improve overall
competitiveness in the regions and support the business environment. Infrastructural
deficits are tackled under the 2007-13 National Development Plan in order to provide each
region with the ‘critical infrastructure needed to develop the self-sustaining growth that
will ensure balanced regional development’ (McDowell, 2007). Similarly, in Cyprus, efforts
are made to improve transport provision in rural and urban areas through incentives to
public providers. Regionally-targeted support is provided in other cases, such as in the
Netherlands, where – as compensation for the cancellation of the high-speed rail link to
Groningen - the north will receive funding to upgrade its regional infrastructure. Other
infrastructure-related projects concern the port of Rotterdam and Schiphol airport, as well
as specific infrastructure improvements to enhance accessibility to prime urban centres and
growth points. The Vlaanderen region in Belgium similarly puts a major focus on the
logistics sector with the identification and development of multi-modal ‘hot spots’. An on-
going issue for France is broadband provision which is seen as ‘an important factor of social
and territorial cohesion’ (Premier Ministre, 2009), notably in isolated rural areas in the
absence of private suppliers. A National Fund for Digital Territorial Development has been
set up to support the provision of accessible and open infrastructures and networks.
Another cohesion-related field is tourism policy which, by its nature, is focused on specific
types of area and has both economic and territorial cohesion dimensions. National examples
can be found in Cyprus, where a number of initiatives aim to help diversify the rural
economy, for example through the promotion of agrotourism. In Denmark, tourism policy
28 It has been argued that public policies inevitably have spatial implications. However, they can be designed and implemented in a way that shows more or less ‘awareness’ of spatial repercussions, ranging from ‘spatially aware’ to ‘spatially blind’ policies; see Barca F (2009). 29 Given the potential scale and variety of policies that could be implicated here, the scope of the discussion has been limited to some key examples.

Economic & Social Cohesion in the Economic Policies of Member States: Final Report
has obvious implications for the designated peripheral areas despite the absence of explicit
cohesion objectives.
The same applies to rural policies, in a broad sense, which can indirectly support
disadvantaged areas due to their inherent focus on rural and peripheral regions. However,
the level of economic prosperity or employment is often not considered in policy
implementation (eg. as under the Joint Task for the Improvement of Agricultural Structures
and Coastal Protection in Germany). In Poland, funding transfers operated under
agriculture and rural development policies have strong implicit social cohesion effects.
Potential effects on cohesion can also be seen in the field of R&D and innovation policy. In
Austria, the federal level has a steering role in RTDI policies, promoting sustainable
economic competitiveness across the country through support for continuous innovation and
technological development. Innovation policy in the Netherlands also includes region-
specific aspects. In the case of Ireland, the government agency ‘Enterprise Ireland’ works
with local industry and research organisations to stimulate high potential start-ups through
a variety of knowledge sharing and networking initiatives. Other activities include providing
access to finance for the promotion of business development and innovation, through
venture and seed capital. Efforts are made in France to tackle regional imbalances in R&D
expenditure, patenting and human resources support. Research and higher education
clusters are promoted in order to enhance their ‘territorial coherence’ and international
visibility.
Employment policies are mainly implemented with a social cohesion dimension. In Austria,
related initiatives also include elements of territorial and economic cohesion, notably
regarding old-industrial regions. Support to firms is provided in areas with particularly high
unemployment rates or structural unemployment, with a focus on job creation, training,
specific local labour market challenges and equal opportunities. In Poland, there is an
indirect cohesion dimension to employment policies, in that longer-term unemployment
benefits (including social security) are provided over a longer time period in counties with
structural unemployment (ie. a rate above 150 percent of the national average). More
generally, unemployment benefits and other social protection measures obviously
contribute to social cohesion, and related budgets may be considerable, notably in some
countries with low key regional policies (see Section 3.3.2).
Finally, it is important to note the importance of spatial planning policies in some Member
States. These are often closely connected to regional development, but involve a different
sectoral mix. Related instruments are of particular importance in countries where the lack
of space is an issue, notably regarding the development of quality industrial estates and the
renewal of brownfield sites (Belgium, Luxembourg, Netherlands). In highly-urbanised
Member States, urban development policies are also relevant. In the Netherlands, there is
a dedicated urban economy policy framework which views cities and urban networks as the
driving force behind economic development. In the Vlaanderen region of Belgium, support
is made available to 13 ‘centre’ towns and cities. In France and Finland, efforts are being
made to enhance the network of urban centres to balance out the predominance of the
capital city.
European Policies Research Centre Euroreg 57

Economic & Social Cohesion in the Economic Policies of Member States: Final Report
Looking at the EU12, there are generally few sectoral policies which are not mainly driven
by EU Cohesion policy. However, there are cases, where domestic co-financing dominates
over EU funds. This applies notably to transport policy in the Czech Republic, which has
the stated objective to ensure the balanced development of transport networks to enhance
interregional cohesion. The same is true of Slovakia, where transport policies also involve
substantial domestic resources, while EU Cohesion policy remains strategically important.
Finally, there were plans for enhanced domestic infrastructure investment in Latvia,
notably under the State Motorway Fund. However, financial support from the fund had to
be suspended in 2009 and 2010 in response to low budget revenues due to the financial and
economic crisis.
4.4.2 Organisation of sectoral policies
Sectoral policies are organised and implemented in different ways, depending on the
institutional set-up and the division of competences across levels of government (see also
Section 5.2). In Member States with a strong central State, line ministries mainly
implement policies with the help of representatives at the sub-national level. This is, for
example, the case of France, where State representatives are in place at the regional and
sub-regional levels. They are directly responsible to their ministry, while the regional
préfets are in charge of ensuring coherent State intervention across the territory. They
oversee the implementation of the main delivery mechanism of sectoral policies in the
regions, the State-region project contracts. Similar arrangements can be found in Greece,
Portugal, Sweden, and in most of the EU12. In Finland, a reform of State authorities at the
regional level took place in 2010 through the creation of an agency for regional
administration and centres for business, traffic and the environment, which are organised
on the basis of regional offices. Sectoral policies are implemented under regional
development plans by a range of ministries, including the Ministry of Employment and the
Economy, the Ministry of Transport and Communications, the Ministry of Agriculture and
Forestry, the Ministry of Justice, the Ministry of Defence, the Ministry of the Interior, the
Ministry of Social Affairs and Health, the Ministry of Finance, and the Ministry of
Environment.
In countries with stronger sub-national authorities, such as Austria and Germany, many
sectoral policies can be seen to incorporate certain cohesion objectives, either because
they contribute to nationally-balanced economic development, or because they are
designed, financed and implemented by Land or local authorities. This also applies to Italy
where the regions actively implement economic development policies. Vertical
coordination is an important element in Member States, where the regional level enjoys a
relatively high level of autonomy. In Germany, dedicated bodies composed of ministries
from federal and Land levels have been set up in relevant policy fields, such as spatial
planning or science and research. In Austria, employment policy is implemented in a
coordinated approach steered by the Ministry of Labour, Social Affairs and Consumer
Protection and implemented together with the Land Departments for Economy. RTDI
policies are also implemented in cooperation between federal and Land ministries and
dedicated agencies. In Spain, the key inter-governmental mechanism is the so-called
‘sectoral conference’ which brings together national and regional ministers responsible for
specific policies (eg. economy, transport, employment). National policy interventions are
European Policies Research Centre Euroreg 58

Economic & Social Cohesion in the Economic Policies of Member States: Final Report
implemented under State-Region Agreements in the regions. In the case of Denmark, where
the regions have recently been given a stronger role in economic development, the regional
dimension has been strengthened, notably by the creation of regional tourism boards.
4.4.3 Coordination of regional and sectoral policies
There has been an increasing focus on enhanced cross-sectoral coordination and
cooperation between spatially-relevant policy fields (OECD, 2006). The coordination of
regional and sectoral policies can take various forms and come in at different stages of the
policy process. It may play a role during policy design with a focus on strategic
coordination, or at the operational level, through specific coordination mechanisms.
(i) Strategic coordination
In some Member States, coordination arrangements are historically rooted, such as in the
Nordic countries. Here, sectoral policies with territorial implications and impacts are
required to integrate strategic regional development priorities already at the policy design
stage. This may mean that ministries have to draw up regional development strategies,
such as in Finland, where shorter and longer-term regional development priorities provide
a framework for the operation of sectoral policies. Guidance and coordination regarding
policy objectives is provided at the central level. So far, strategies have been produced by
the Ministries for Employment and the Economy; Agriculture and Forestry; Finance; Social
Affairs and Health; and the Environment. In other cases, there are more general
coordination commitments, such as in Sweden. Here, a strong cross-sectoral orientation
emerges from strategic regional policy documents, notably the National Strategy for
Regional Competitiveness, Entrepreneurship and Employment. It focuses on four strategic
priorities - innovation and renewal; skills supply and improved labour supply; accessibility;
and strategic cross-border cooperation – each adapted to regional and local conditions. The
concerned sectors are trade and industry policy, labour market policy, education policy,
transport policy, innovation policy, rural development policy and cultural policy. In
Denmark, coordination more broadly is achieved via the Business Development Act. This
framework improves links between regional development initiatives and national policies
(including sectoral policies, such as tourism) as it ranges across virtually all policy areas
covered by the Danish Growth Council; this helps ensure that regional policy is integrated
into the broader framework for economic development and globalisation.
Another aspect worth noting is the role of spatial planning frameworks for cross-sectoral
coordination. In Ireland, for example, policies across the board take account of the
objectives set out in the National Spatial Strategy and the National Development Plan.
Under the ‘Peaks’ approach pursued in the Netherlands, regional policy is closely related
to other sectoral policies through its alignment with the National Spatial Strategy
(development of industrial estates, infrastructure, innovation, urban policy, tourism).
Moreover, the National Spatial Policy Programme of Portugal includes guidelines and
principles for the coordination of sectoral policies with a territorial impact. It is
implemented via plans and committees at different levels. A further example is
Luxembourg, where recent years have witnessed much high-level coordination between
different Ministries in the drawing-up of spatial planning documents. This can be seen, for
European Policies Research Centre Euroreg 59

Economic & Social Cohesion in the Economic Policies of Member States: Final Report
example, in the National Spatial Planning Programme, which combines territorial and
sectoral dimensions.
(ii) Coordination mechanisms at an operational level
In some Member States, policy coordination is put into practice with the help of dedicated
coordination bodies. A prominent example is France, where the ‘Inter-ministerial
Delegation for Territorial Development and Regional Attractiveness’ (DATAR) is in charge of
cross-sectoral coordination. In line with the cross-cutting nature of regional policy
(covering, among others, aspects of industrial, rural, urban, tourism, and health policies),
most policy instruments (and notably the State-region contracts) are implemented in a
cross-sectoral approach, involving a number of ministries and specialist agencies. In
Finland, a regional development negotiation committee has recently been set up to
coordinate the preparation and monitoring of ministries’ regional budgets, to summarise
budget proposals, and to organise negotiations between the central-level and the regional
councils, as well as overseeing any other coordination tasks with respect to regional
development. Moreover, efforts to enhance coordination are being made in Sweden via a
new national forum for regional competitiveness, entrepreneurship and employment. This
provides a platform for national and regional representatives to discuss regional
development issues as well as joint initiatives to achieve national and regional objectives
and priorities.
A further option, which is sometimes related to the above, is policy coordination through
integrated programming and enhanced alignment of sectoral budgets. Such an approach is
found mainly in the context of multi-annual development programmes (see Section 4.3.3),
but can also apply to annual budget agreements, increasing the commitment towards
regional development activities. The role of regional development programmes in Sweden
is to provide a longer-term view of regional objectives, facilitate coordination across
sectors and between local, regional and national initiatives, and establish a basis for other
programmes and measures at the regional level. Also in Ireland, multi-annual, multi-
sectoral programming lies at the heart of policy-making, requiring a coordinated policy
approach across government departments, levels of government and partner organisations.
In the case of Finland, cross-sectoral as well as regional-level coordination has improved
through regional strategic programming. This has encouraged key regional development
actors (the regional council, State bodies in the regions and social partners) to jointly
decide on policy priorities, implementation, and related funding. In France, multi-annual
State-region contracts are drawn up between the State representatives in the regions and
the regional councils. DATAR is mainly responsible for coordinating ministerial budget
allocations and ensuring the smooth implementation of the contracts. In England, the use,
up to now, of Single Pot budgets by Regional Development Agencies has facilitated
coordination between contributing departments (HM Treasury, Department for Communities
and Local Government, Department for Business Innovation and Skills, Department for Work
and Pensions, Department for Transport and Department for Environment, Food and Rural
Affairs). Also in Denmark, annual partnership agreements between the central government
and the Regional Growth Fora help create a degree of commitment to regional
development activities by departments other than the Ministry of Economic and Business
Affairs.
European Policies Research Centre Euroreg 60

Economic & Social Cohesion in the Economic Policies of Member States: Final Report
(iii) Sectoral policy coordination via EU Cohesion policy
It is interesting to note that EU Cohesion policy seems to be a driver in cross-sectoral
coordination in a number of cases. It can, in fact, be argued that the strategic framework
in place for EU Cohesion policy can serve as a basis for the coordination of regional and
sectoral interventions more widely (Barca, 2009). In Portugal, for instance, an important
change for 2007-13 was the reduction in the number of national sectoral OPs with the
objective to ensure that different ministries work towards the overarching objectives of the
NSRF rather than following a narrow sectoral approach. Similarly, one of the main
influences of EU Cohesion policy in Spain has been enhanced inter-governmental
coordination. In Greece, a newly set up Inter-ministerial Committee of Development
Programmes fulfils a coordinating and monitoring role.
In many EU12 countries, there is typically little or no coordination between regional and
sectoral policies outside EU Cohesion policy. This is the case, for example, in Slovenia,
though more recently there have been signs for emerging cross-sectoral cooperation in
response to the crisis. Also in Bulgaria, the active coordination of regional and sectoral
policies is often achieved in the context of EU Cohesion policy (eg. regarding the
development of European transport corridors and labour market policy). A more explicit
approach to policy coordination is taken in Hungary where the National Development Policy
Concept promotes a territorial approach to sectoral policies through place-based concepts.
Sectoral ministries are required by law to promote spatial development and regional policy
objectives. The National Spatial Development Council helps ensure that cohesion objectives
are taken into consideration in sectoral policies. Similarly, in Estonia, ministries are
required to analyse the regional effects of their actions and to inform the Minister for
Regional Affairs about decisions and actions in sectoral policies that have a significant
regional impact.
4.5 Concluding points
Summing up, the cohesion dimension of regional and sectoral policy instruments is variable
and not always easy to identify. Narrow policy instruments often focus on more than one
cohesion dimension. With regard to regional aid, the potential influence on cohesion
depends on the overall aid framework, including aid coverage and ceilings. While related
instruments mainly focus on economic cohesion there are cases where territorial cohesion is
also an issue, eg. regarding island regions. Targeted regional development programmes are
very varied in their nature and scale, both in terms of the targeted area and the funding
mobilised. The provision of ad hoc support to help with situations of economic restructuring
pursues both economic and social cohesion objectives, but is generally rather low-key. The
situation is similar for instruments targeted at language and ethnic minorities. In addition,
solidarity transfers play a crucial role in Germany and Spain, where they have a significant
impact on economic and social cohesion.
Broad policy initiatives that apply across the country can display a considerable cohesion
dimension based on the targeting of funding allocations to specific regions. Whereas
support for the business environment is often devised in a spatially-blind way, in a number
of countries provisions are made in favour of disadvantaged areas. Targeted support to
European Policies Research Centre Euroreg 61

Economic & Social Cohesion in the Economic Policies of Member States: Final Report
cluster development provided in some Member States may indirectly contribute to cohesion
by promoting regional strengths and capacity. The cohesion dimension of regional and local
development programmes, which are often aligned with EU Structural Funds programmes,
depends on the thematic orientation which can be more business-oriented or include a
number of different sectors. They may also favour certain territories via targeted allocation
mechanisms. The wider the scope of such programmes, the higher the funding levels
involved and, in some countries, related co-financing arrangements (see also Section 5.4.2)
are a substantial part of the vertical transfers operated between levels of government. In
addition, fiscal equalisation mechanisms significantly contribute to cohesion more widely,
and particularly to its social dimension.
For sectoral policies, the cohesion orientation is mostly implicit. It clearly depends on the
thematic orientation which cohesion type is concerned, whether economic (eg.
infrastructure, R&D and innovation, rural policies, tourism), territorial (eg. infrastructure,
tourism, spatial planning), or social cohesion (eg. employment policies, rural policies).
Sectoral policies are mostly organised and implemented in the same way as regional
policies, ie. either steered by the central level or giving more prominence to sub-national
authorities. In recent years, coordination arrangements between sectoral and regional
policies have become increasingly important. They can be of a more strategic or more
operational nature or a combination of the two. Finally, EU Cohesion policy has been
driving cross-sectoral coordination, notably in the EU12 and other countries where EU
Cohesion policy spending is significant. .
Reviewing the main messages emerging from the above discussion, the following categories
can be identified together with relevant country examples:
Cohesion-oriented policies are implemented through a limited number of
important, rather targeted instruments that are endowed with sizable levels of
funding; levels of regional aid spend as a percentage of GDP are important and, in
some cases, specific solidarity transfers are in place (eg. Germany, Italy, Spain).
Cohesion-oriented policies operate based on a number of low-key measures, often
complemented by broad development programmes which are more or less aligned
with EU Cohesion policy programming (eg. France); programming approaches are
furthermore important in Finland and Sweden, alongside considerations of
territorial cohesion; regional aid spend as a percentage of GDP is rather low.
Purely domestic policy initiatives are of minor importance due to the
predominance of EU Cohesion policy; they mainly consist in small-scale initiatives
often targeted at local authorities or specific localities (EU12, Greece, Portugal);
levels of regional aid spend as a percentage of GDP are high in many cases; there
are examples of broad development programmes alongside efforts to distinguish
them from EU Cohesion policy programming (Hungary, Poland).
The role of cohesion-oriented instruments is limited, with low regional aid spend,
and the main policy focus is on broad support to the business environment (e.g.
Austria, Denmark, Netherlands).
European Policies Research Centre Euroreg 62

Economic & Social Cohesion in the Economic Policies of Member States: Final Report
5. THE IMPLEMENTATION OF NATIONAL POLICIES TO PROMOTE COHESION
5.1 Introduction
An important issue with respect to the impact of Member State policies on cohesion is to
consider the implementation of policy. To what extent do policy delivery mechanisms help
to support economic and social cohesion? It can be argued that a more decentralised or
regionalised approach to regional policy implementation is conducive to overall cohesion,
since policy is delivered closely in line with territorial needs. However, there are others
who think that an enhanced role of sub-national authorities may lead to sub-optimal policy
choices and increase competition between territorial entities rather than stimulating
improved policy solutions (e.g. in the context of the debate about cooperative versus
competitive federalism). Against this background, this section considers four key
dimensions of policy implementation: the regional delivery of policy (Section 5.2); recent
trends regarding the rescaling of policy implementation (Section 5.3); policy co-ordination
(Section 5.4); and mechanisms to ensure efficiency (Section 5.5).
5.2 The regional delivery of policy
Regarding the regional delivery of policy, regional (aid) policy was initially a central
government concern and was implemented ‘top-down’. As regional aid provision developed,
its administration became more decentralised, especially with respect to support for
smaller firms and projects. In this period, too, there were broader decentralisation trends
across the EU, shifting the delivery of policy closer to policy recipients to improve policy
efficiency and/or accountability (Rhodes, 1997). The introduction of regional programming
was part of this trend, using the regional level to develop appropriate regional strategies
and to help coordinate the now more broadly based approaches to regional development.
Several arguments underpin increased sub-national participation in regional policy
administration with a view to strengthening cohesion. First, regional and local
administrations can draw on detailed information on their respective territories in order to
design appropriate, innovative implementation approaches that can draw together a range
of policy strands. Second, the dispersion of delivery responsibilities across levels is seen to
be more flexible and efficient and can respond to challenges at various territorial scales.
Third, this approach brings together a wider range of sub-national interests, including
elected authorities, in the process of administration, potentially creating a stronger sense
of regional accountability or ‘ownership’ of policies (Jones et al, 2006). In a range of
countries, a final driver of a more regionalised policy approach has been EU Cohesion policy
which has affected policy relationships between actors situated at different territorial
levels. A classification of key approaches is provided in Figure 5.1, which distinguishes four
principal approaches to regional policy delivery.
European Policies Research Centre Euroreg 63

Economic & Social Cohesion in the Economic Policies of Member States: Final Report
Figure 5.1: National approaches to regional policy delivery
COUNTRY NATIONAL RESPONSIBILITY FOR REGIONAL POLICY SUB-NATIONAL ACTORS
Federal systems. Wide-ranging sub-national powers: elected parliament; budgetary powers; legislative powers; right to levy taxes Austria Federal Chancellery, ÖROK (Austrian
Conference on Regional Planning 9 self-governing states - Länder (NUTS 2)
Germany Federal Ministry for Economics and Technology 16 self-governing states - Länder (NUTS 1)
Belgium 3 self-governing territorial Regions and 3 language-based Communities
Regionalised unitary systems. Advanced sub-national powers: elected parliament; some budgetary powers, limited right to levy taxes
Italy Ministry for Regional Affairs, Ministry of Economic Development
20 regions with elected regional councils (assemblies) and Presidents/Governors (head of the regional governments).
Spain Ministry of Economy and Finance (Directorate General for Community Funds)
17 directly-elected regions
UK Scottish Government, Welsh Assembly, Northern Ireland Assembly
3 directly-elected regions (Scotland, Wales, Northern Ireland)
Decentralised unitary systems. Limited sub-national powers: regional decentralisation; some elected parliaments but limited budgetary powers; major financial transfers from central government; limited right to levy taxes. Czech Rep Ministry for Regional Development 14 directly-elected regions
Denmark Regional policy Ministerial Committee, Danish Growth Council
5 directly-elected regional councils, 6 regional growth fora (partnership bodies)
Finland Ministry of Employment and the Economy 20 regional councils, one directly-elected the rest elected by municipal councils.
France Ministry for Rural Areas and Territorial Development, DATAR as key agency
26 regions
Hungary Ministry for National Development Policy and Economy and National Spatial Development Council
9 statistical regions, each with a regional development agency
Netherlands Ministry of Economic Affairs 12 provinces Poland Ministry of Regional Development 16 directly-elected regions Slovakia Ministry for Construction and Regional
Development 8 directly-elected regions
Sweden Ministry of Enterprise, Energy and Communications
21 provinces, 2 directly-elected regions
Centralised unitary systems. No sub-national powers: regionalisation without regional government: no elected parliament, right to levy taxes or budgetary powers; all powers and resources controlled by central government Bulgaria Ministry of Regional Development and Public
Works (MRDPW) 6 statistical planning regions
Cyprus Planning Bureau, Ministry of Finance Non-regionalised
Estonia Ministry of Interior (within this, Minister of Regional Affairs)
Non-regionalised state, 15 counties
Greece Ministry of Regional Development and Competitiveness
13 regions (state appointed)
Ireland Department for Enterprise, Trade and Employment
Non-regionalised state, 2 regional planning authorities
Latvia Ministry of Regional Development Non-regionalised state, 26 districts Lithuania Ministry of the Interior Non-regionalised state, 10 counties Luxembourg Ministry of Interior and Spatial Planning Non-regionalised Malta Office of the Prime Minister Non-regionalised state Portugal Ministry of Environment and Spatial Planning 18 districts, 2 autonomous regions Romania Ministry of Regional Development 42 counties Slovenia Government Office for Local Self-Government
and Regional Policy Non-regionalised
United Kingdom
Department for Business, Innovation and Skills (BIS) and Department for Communities and Local Government (CLG) (England only)
Devolved Administrations for Scotland, Wales and Northern Ireland. In England, 9 statistical regions each with an RDA (abolished following the May 2010 general election)
Source: Based on Ferry (2003), updated to the current position.
European Policies Research Centre Euroreg 64

Economic & Social Cohesion in the Economic Policies of Member States: Final Report
5.2.1 Federal countries with highly regionalised approaches
As a federal country, regional policy delivery in Austria is generally in the hands of the
Länder (i.e. Land departments of economic development and Land business agencies).
However, the sub-Land level also plays a role, with regional management offices
(Regionalmanagements) acting as a bridge to the local level. The national contribution is
limited to the (informal) coordination functions of the Federal Chancellery and ÖROK
(Austrian Conference on Regional Planning). Belgium also adopts a highly-regionalised
approach. Flanders and Wallonia (and Brussels) have the key delivery functions, with an
extremely restricted national role (e.g. coordination of aid area designation outcomes). In
Wallonia, policy delivery is in the hands of a government department (the Regional
Economy Unit (DPE, Direction de la politique économique), while in Flanders, delivery is
through the Enterprise Agency (VLAO, Agentschap Ondernemen). Finally, in Germany, the
federal structure ensures that Land and local authorities have the main decision-making
and implementation responsibilities, albeit (for narrow regional aid policies) operating
within a joint Federal-Land coordination framework, the Gemeinschaftsaufgabe
‘Verbesserung der regionalen Wirtschaftsstruktur’. This was introduced originally in 1969
to control potential competitive out-bidding between the Länder for mobile investment.
5.2.2 Regionalised unitary states, with significant devolution of regional policy functions
In Spain, the highly devolved system means that the autonomous communities have
significant decision-making and implementation responsibilities with respect to economic
development. The high degree of regional autonomy explains why the Inter-Territorial
Compensation Fund (ICF) is implemented on a devolved basis by regional governments. The
regions also have important decision-making functions under the regional investment grant
(RIG), although final project approval is formally granted at the national level. The United
Kingdom approach is also highly devolved. For more than a decade, the UK government has
been committed to the devolved delivery of regional policy, with the Devolved
Administrations in Scotland, Wales and Northern Ireland having both design and
implementation responsibilities, while policy delivery in England was with the Regional
Development Agencies until their abolition in the aftermath of the May 2010 general
election. Lastly, in Italy, the programme-based unitary regional policy has both regional
and multi-regional elements, with policy implementation largely delegated to regional
authorities (albeit subject to supervision and coordination by the national Ministry of
Economic Development, Department for Development and Economic Cohesion (MISE-DPS)).
5.2.3 Decentralised unitary states, involving a high degree of regional-level implementation
In France, despite broader decentralisation trends, the division of responsibilities is still
favourable to the central State, particularly in the context of the State-Region Planning
Contracts (CPER, contrats de plan Etat-région), where the regional State services (préfets)
play a central role in aligning national and regional priorities. In Finland, responsibility for
regional policy delivery is formally shared between the State and the municipalities (acting
through the regional councils). Policy goals are set at the national level and provide the
European Policies Research Centre Euroreg 65

Economic & Social Cohesion in the Economic Policies of Member States: Final Report
context for regional-level strategies and implementation (by both the regional councils –
which have overall responsibility - and State bodies in the regions). In the Netherlands,
there are broader pressures towards decentralised policy approaches (including the
government slogan “centralised if necessary, decentralised if possible”). However,
notwithstanding the regionalised approach to Peaks in the Delta, the national level still
plays a significant role in policy implementation, having regionalised its own policy role. In
Sweden, regions have increased their regional development role as county competencies
have grown. There is significant regional responsibility for state regional development
measures though overall responsibility for the regional growth policy coordination and
supervision continues to lie with the Ministry of Enterprise, Energy and Communications. In
Poland, the regional role in policy delivery is developing, with the introduction of domestic
framework agreements between central government and self-governing authorities
(regions). These contracts are based on the French CPER model and focus mainly on social
cohesion, though they have recently been used in the context of Cohesion policy. In the
Czech Republic, regions are also directly elected, but their role is less prominent than in
the Polish case. Finally, in Denmark, policy is implemented at the regional level under the
Business Development Act. The Act instituted a dual-key control system whereby the
elected regional council and the partnership-based regional growth fora (RGF)) can veto
each other’s initiatives. This enhanced the status of the RGFs, as did the fact that they
were subsequently given the central role in Structural Funds administration.
5.2.4 Unitary countries with limited or no regional-level implementation
Most of the remaining 16 Member States take a national-level approach to the delivery of
domestic regional policy. For some countries, including Cyprus, Malta and Luxembourg,
this reflects their small size. For others – Greece, Portugal, Slovenia, Estonia, Latvia and
Romania – it is attributable to the traditionally centralised delivery of policy. There are,
however, a few countries where there is an element of regional-level implementation. This
is perhaps most extensive in Hungary where six regional development funds involve a
significant degree of regional-level implementation. In Lithuania, regional policy is planned
and implemented at the regional (county) level, with regional development councils
contributing to the design of regional development plans and to project selection. In
Ireland, there has traditionally been a strong national-level approach, with policy delivered
either through national ministries or agencies; however, some agencies have a specific
regional orientation (like Údarás na Gaeltachta), while others operate through regional
offices (such as Enterprise Ireland). Finally, in Bulgaria, there has been a growing emphasis
on decentralisation, with a revived interest in local governance in the context of economic
development. Municipalities are now playing a role in policy implementation, albeit
hampered by limited financial resources.
5.3 Rescaling regional policy implementation: current trends
It is important to note that across Europe, implementation arrangements for regional policy
are in a state of flux. Existing modes of regional policy design and delivery are being
complemented – or even supplanted – by new ways of organising regional development
intervention. Reforms are responding to a range of factors: broad processes of institutional
European Policies Research Centre Euroreg 66

Economic & Social Cohesion in the Economic Policies of Member States: Final Report
change, new regional policy concepts, the influence of EU Cohesion policy and, latterly, the
onset of the global economic crisis.
5.3.1 Regionalisation
Over the past two decades, there has been a general trend towards the regionalisation of
administrative responsibilities in regional policy. However, there is wide variation in the
direction and pace of regionalisation processes. Political regionalisation has been occurring
in some countries in recent years, establishing or strengthening elected regional authorities
in order to increase their power in public decision-making. In Denmark, five new regions
were established in 2007 with statutory regional policy responsibilities under the 2005
Business Development Act. In Sweden, a reform programme establishing a new
intermediate level of governance alongside the national level and the municipality level has
been piloted in two regions over the past decade. Here, elected regional governments are
responsible for implementing and coordinating state regional development measures at the
regional level and their roles have been strengthened in recent years. In 2009, it was
agreed that these elected governments were to be made permanent, and that similar
responsibilities were to be given also to other regions (Regeringens skrivelse, 2010). In
Spain, reform of the regions’ statutes of autonomy, which foresees further devolution of
powers to the regions, has progressed further during 2009. In Belgium, the Flanders region
continues to push for the further regionalisation of competences, notably in the field of
labour market policies.
Processes of administrative regionalisation are apparent in some countries. Short of
institutional change, these reforms seek to regionalise authority, responsibility and
financial resources for providing some public services and delivering some policies. In the
Netherlands, for instance, a recent issue has been the overall allocation of administrative
roles and responsibilities between the national and regional levels. The 2007 coalition
agreement strongly favoured decentralisation to the provinces and municipalities
(Government of the Netherlands, 2007). While a more decentralised approach was part of
the 2007-11 government programme (Ministerie van Algemene Zaken, 2007). The practical
impact on regional policy has not so far been major, though both urban economic policy
and aspects of industrial estates policy were recently decentralised. In France, debate on
the allocation of administrative tasks between national and sub-national authorities is
ongoing.
Cohesion policy implementation is influencing administrative regionalisation in some cases.
In Portugal, the governance architecture for Cohesion policy has prompted decentralisation
by increasing the share of funding managed through regional programmes and establishing
global grants for associations of municipalities. In some new Member States, arrangements
for the administration of Cohesion policy have contributed to the establishment of new
regional-level administrative structures. In Latvia, five planning regions were established as
public bodies in 2006, took on planning responsibilities in 2007 (and became a focus for EU
funds) and completed the reform process in July 2009, with the election of new regional
councils. In Hungary seven NUTS 2 statistical planning regions have been in operation since
1998. Each region has its own Regional Development Council that prepares medium-term
strategic development concepts in line with the objectives of the National Spatial
European Policies Research Centre Euroreg 67

Economic & Social Cohesion in the Economic Policies of Member States: Final Report
Development Concept. These operational programmes correspond with the action plans of
the EU cohesion policy programmes but they are independent - also financially - from the
Regional Operational Programmes under EU cohesion policy.
Fiscal regionalisation has been part of the policy debate in some Member States for several
years, but proves to be more challenging to implement than other forms of regionalisation.
In the Netherlands, the 2007 coalition agreement argued for expanding local taxation while
limiting state taxes. However, this has not been implemented as yet. In Italy, Law no. 42 of
5 May 2009 on fiscal federalism has been approved by parliament (although a general
development, this has consequences for future regional policy). However, the
implementation of this law is still pending, due to the lack of implementation legislation. In
Belgium, the Flemish government is pushing for increased fiscal and financial autonomy.
5.3.2 The local agenda
Currently, the regional policy turn towards ‘place-based’ economic development policy and
the impact of the global economic crisis are driving debates on whether economic
development policy is best administered at the regional level. The current focus on
‘functional’ spaces, based for instance on ‘travel-to-work-areas’, labour market areas,
transport corridors, trans-border regions etc, indicates a shifting perspective beyond
regional structures and regional administrative boundaries, focussing on different
configurations such as multi and local area agreements or associations, metropolitan zones,
‘city-regions’, intra-regional strategies etc. The ‘local agenda’ is coming to prominence in
some countries through processes of administrative reform but also as part of the response
to the economic crisis.
Reform of sub-regional administration is on the agenda in a range of countries, with
implications for regional policy delivery. In France, a process of improving public policy
delivery led to the 2009 Balladur report on the reform of local authorities which aims to
clarify competences between levels, limit cross-financing and enhance the status of large
municipalities (métropoles). Territorial reorganisation, including moves towards greater
inter-municipal co-ordination is taking place at least in part to reduce overhead costs. In
Finland, local governance reform (under the PARAS project), has progressed. This has
focused particularly on stronger municipal and services structure, new delivery mechanisms
and organisation for these services, reform for municipal funding and State co-funding, and
on the division of responsibilities between municipalities and the State. The project has
been implemented largely through municipal mergers, which has resulted in a reduction of
the number of municipalities by nearly one hundred. Responding to the crisis at the local
level
The financial crisis has also increased the focus on the sub-regional level. In several cases,
the overriding priority is to protect essential local public services by making local
government expenditure as productive as possible. Arguments have also been put forward
for replacing expensive, centrally-steered, demand side policies by micro-economic, supply
side policies, decided locally. Within the United Kingdom, supporting entrepreneurship in
England was one of the key responsibilities of the Regional Development Agencies abolished
following the May 2010 general election. The new government has argued that business
European Policies Research Centre Euroreg 68

Economic & Social Cohesion in the Economic Policies of Member States: Final Report
support is best administered nationally, notably through the new Regional Growth Fund.
However, it has included support for small business start-ups among potential tasks of the
new Local Enterprise Partnerships.
5.3.3 Towards re-centralisation
The growing responsibilities of the regional and local levels in policy delivery do not mean
that there has been a corresponding decrease in central government inputs. The role of the
centre is being redefined rather than diminished. Central government remains a significant
source of funding for regional development and, thus, inevitably has a strong interest in
policy delivery and accountability. With a view to promoting policy efficiency, it is also
keen to enhance national-level coordination. At the same time, the crisis has emphasised
the role of central governments in policy administration. In some cases, recentralisation has
been an inevitable consequence of the changing use of policy instruments. For example,
increases in the use of compensatory grants targeting specific territories, at the expense of
‘all regional’ instruments can prompt recentralisation of administrative tasks. In the United
Kingdom, the new government in England has abolished the Regional Development
Agencies’ budgets based on global grants and is replacing them with a centrally-
administered Regional Growth Fund.
Recentralisation is also occurring in some countries through general processes of cost
cutting in the public sector. This can involve the rationalisation of sub-national structures
and increased centralisation either in the name of efficiency improvements or merely as an
unavoidable shift to basic essentials in a context of constrained funding. For example, in
Ireland the role and functions of the public administration have been assessed, with a view
to cutting costs, efficiency-savings and improving effectiveness and coordination. One
recommendation is to merge the regional offices of the economic development agency, the
inward investment agency and the employment agency.
5.4 The coordination of policy
In recent years, increasing policy weight has been attached to vertical (national-regional)
coordination of regional development activities, not least on grounds of policy efficiency.
Coordination arrangements between levels of government are unavoidable in a regional
development context characterised by complex interactions and incentives between supra-
national, national and sub-national actors (Keating, 2003). Since regional policy uses
national funding, it is incumbent on national regional policy departments to justify the
value-for-money and appropriateness of their regional development spend, even where (as
is increasingly the case) policy delivery is a regional responsibility. The expansion of the
regional policy agenda to incorporate a broader range of sectors (see Section 4.4.3), issues
and objectives has provided further impetus for addressing coordination arrangements.
Moreover, in a number of countries, ongoing moves to improve the coordination of limited
resources and maximise synergies have been reinforced by the economic crisis. As a result,
considerable regional policy attention is now paid to national-regional coordination, aiming
to align regional spending with national priorities (which in turn are related to broader EU
goals, including cohesion goals).
European Policies Research Centre Euroreg 69

Economic & Social Cohesion in the Economic Policies of Member States: Final Report
Research on policy coordination has identified different typologies applicable to regional
economic development policy. Coordination arrangements can vary in intensity from
completely independent decision making and information exchange to formal commitment
to strategic goals (Héritier, 2002). Coordination arrangements can also be categorised
according to voluntary or compulsory organising principles and different combinations of
conditionalities, target-setting and monitoring (Alexander, 1993). Before considering such
coordination in more detail, the relatively obvious point must be made that, where policy is
by and large implemented at the national level, there is no case for developing a formal
system of national-regional coordination. This is the position for countries such as Cyprus,
Czech Republic, Estonia, Greece, Latvia, Malta, Portugal, Romania, and the Slovak
Republic. While Bulgaria has, through the planning process, an interactive mechanism for
consultation, coordination and the balancing of national, regional and local interests,
administrative capacity remains an issue. In Lithuania, the Ministry of the Interior is
responsible for the coordination of regional policy implementation and also provides
technical assistance to counties and regional development councils.
5.4.1 Programmes, targets and guidelines.
A first category of (formal) coordination involves the use of programmes, targets and
guidelines. This involves sub-national authorities drawing up regional or local plans in line
with national objectives, the setting of targets by national authorities to govern the use of
central funding, or more general guidelines providing an indication of how central
government expects funding to be used or measures implemented. For instance, in Finland
the new cohesion and competitiveness programme (KOKO) has merged the former regional
centre programme, the regional component of the rural programme, and the local and
regional implementation of the island programme. A recent review has praised the
programme for promoting commitment to joint objectives by changing the relationship
between the State and the local and regional administration. The preparation of the new
National Strategy for Regional Development in Poland is another example. Part of the
strategy involves the development of several strategic programmes that link sectoral and
horizontal issues to regional development. In Luxembourg, recent years have seen
increased high-level coordination between different Ministries in the development of spatial
planning documents. There is a conviction that an integrated approach to territorial
development, which combines spatial and sectoral aspects, is necessary.
5.4.2 Contracts and co-financing agreements
In several Member States, there is a growing emphasis on the coordination of various
funding streams through national-regional contracts or co-financing arrangements. These
are used to ensure that national and regional level funding and priorities are coherent,
including provisions to negotiate the integration of sectoral and regional development
funding (see also Section 4.4.3(ii)). Increasingly, funding packages for regional projects
involve multiple sources of finance with co-funding arrangements being used to coordinate
national and regional interventions. This gives national authorities the opportunity to
ensure that national priorities are appropriately reflected in the projects in receipt of
support. In Germany, the GRW (regional policy) co-funds regional-level activities based on
a framework plan and nationally-agreed eligibility and award criteria. This is also the
European Policies Research Centre Euroreg 70

Economic & Social Cohesion in the Economic Policies of Member States: Final Report
approach adopted in the Netherlands, where there has been discussion of the concept of
‘shared responsibility’ between the national, provincial and big city levels as part of a
broader triple helix model, with the three levels of government committing regional
development funding ‘up-front’ for the full programme period.
Co-financing is increasingly important in a context of reduced funding and a growing
emphasis on the territorial impact of sectoral policies. At the national level, this approach
is evident in efforts to identify and coordinate those funding streams in sectoral ministries
and departments that have a territorial impact. For instance, the (recently revoked)
Regional Economic Performance Public Service Agreement in the United Kingdom (England)
pooled relevant funding from central departments for disbursal by RDAs (abolished
following the May 2010 general election). At sub-national levels, there is increasing
emphasis on public authorities, particularly local authorities, coordinating funding in order
to improve capacity (e.g. in Finland and Sweden).
Where significant resources are being shared, contractual mechanisms provide a binding
legal basis for coordination. An example of this is the operation of State-region contracts in
France. Overall, the state agency DATAR is in charge of ensuring a coordinated approach to
implementing the contracts. The Inter-Ministerial Study and Monitoring Group (GESPER) is a
coordination platform for ministries where a regular overview of progress with contract
implementation is provided. In Poland the new National Strategy for Regional Development
envisages territorial contracts as a crucial coordination instrument. These will replace the
current regional contracts (which in reality serve only as co-financing instruments for
Cohesion policy interventions). They will be based on legal agreements between national
government and regions.
In Denmark, vertical coordination between the national and regional levels has increased,
through the establishment of partnership agreements between central government and
each of the six regional growth fora. These documents contain a general political
commitment to shared goals and also specific undertakings that the two sides will attempt
to progress. The official purpose of the political commitments is to secure compatibility
between the globalisation strategy of central government and regional strategies for
economic development. However, an important implication of the vertical partnership
agreements is that they create a degree of commitment to regional development activities
by departments of central government other than the Ministry of Economic and Business
Affairs. The partnership agreements are revised on an annual basis, and the current round
of negotiations has widened the focus and increased national-regional coordination, notably
between the Ministry of Employment, the Regional Employment Councils and tripartite
labour market partnerships. In Greece, the regions and the ministries involved in the
implementation of Cohesion policy programmes are now being asked to sign an Operational
Programme Agreement with the Ministry of Economy, Competitiveness and Shipping.
Financial resources will only be released after the signature of this agreement.
Contractual arrangements offer several benefits. They can strengthen linkages between
regional and local policies to national priorities. By increasing policy-making responsibility,
they may also contribute to the development of local capacities. Contracting also performs
a legitimising function: giving governments the opportunity to submit their policies to the
European Policies Research Centre Euroreg 71

Economic & Social Cohesion in the Economic Policies of Member States: Final Report
agreement and compliance of other authorities can spread responsibility and
accountability. More challenging aspects of contracting include high transaction costs in
terms of negotiation and administration. There is also a danger that contracts are
dominated by one side, often central government, with the consequence that national
priority actions dominate and contracts do not differ significantly from one region to
another.
5.4.3 Institutional coordination
Formal and informal institutional arrangements are often used to facilitate coordination. In
terms of formal arrangements, central government authorities have an important steering
and coordination function vis-à-vis the regions. Increasingly common are institutional
mechanisms where one department of a national government department or agency
coordinates the activities of different central units that are involved in policies with a
territorial dimension. Three recent examples are Italy, France and Finland. In Italy,
responsibility for the coordination and supervision of the unitary regional policy has fallen
to the Department for Development and Economic Cohesion (MISE-DPS) in the Ministry for
Economic Development. The status of the Department is likely to be strengthened as it will
now report to a new leading body for regional policy, the Ministry of Regional Affairs (a
Ministry without portfolio operating within the Presidency of the Council of Ministers).
Similarly, in 2009 DATAR, the main body in charge of coordination of territorial
development policies in France, changed its affiliation when responsibilities for regional
development were moved from the Ministry of Ecology, Energy, Sustainable Development
and Territorial Development to the newly created Ministry for Rural Areas and Territorial
Development. It is anticipated that DATAR’s move to a ministry dedicated to territorial
development will strengthen its coordinating role among central government departments.
In Finland, a new committee for regional and structural policy is an amalgamation of the
regional development negotiation committee and the Structural Funds negotiation
committee. The new committee is intended to: support the Ministry of Employment and the
Economy in its coordination and monitoring tasks; coordinate sectoral regional development
strategies and their objectives; monitor the implementation of the national regional
development objectives and the sectoral regional development strategies, and the related
steering of the State’s regional administration; and make suggestions for the coordination
and development of national regional development and Structural Funds activities
(Government of Finland, 2009). In some cases, central governments have established new
institutional arrangements to boost their coordination role at sub-national level. In the
Netherlands, the Spatial Economic Development Directorate of the Ministry of Economic
Affairs has had ‘regional teams’ of officials for several years. The Ministry provides the
secretariat for the regional Peaks programmes and government staff work in ‘their’
respective regions each week. At the same time, the regional Programme Commissions
bring together regional views whilst recognising national priorities (through the presence of
a senior Ministry official on each Commission).
The role of central-level coordination bodies is prominent in several EU12 countries due in
large part to the rapid expansion of the regional policy system under Cohesion policy. In
many cases, coordination arrangements are still evolving against a background where
European Policies Research Centre Euroreg 72

Economic & Social Cohesion in the Economic Policies of Member States: Final Report
sectoral ministries have proved resistant to the idea of their activities being ‘coordinated’
by an external committee or managing authority, since they are used to having their own
distinct sphere of activity. However, there is an increasing focus on coordination at the
national level. In Slovakia, new inter-ministerial coordination committees have been
created. A Government council for regional policy and supervision of structural operations
is now responsible for efforts to coordinate activities between ministries. In Poland, as well
as the coordination role played by the Ministry of Regional Development, the current
reform process foresees a stronger role for the Development Policy Coordination Committee
(Komitet Koordynacyjny do Spraw Polityki Rozwoju). This has high-level representation
from the main ministries and is organised under the auspices of the Chancellery of the
Prime Minister. The Committee will act as the strategic forum for governmental debates on
development policy, including regional policy.
Less formal approaches to national-regional coordination include the establishment of
networks, conferences or other fora that bring representatives of different administrative
tiers together on a regular basis. A good example of an informal (but still effective)
approach to national-regional coordination is that adopted in Austria. The two key actors
at the federal level - a division of the Federal Chancellery charged with the coordination of
regional policies and spatial development (Division IV/4) and the Austrian Conference on
Spatial Planning (ÖROK) – have important coordination roles which, interestingly, are not
based on their specific competences but rather on the willingness of institutional actors at
different levels to cooperate. In this context, the development of the 2007-13 NSRF
(STRAT.AT) has been useful in helping to strengthen coordination opportunities, not least
through the ongoing STRAT.AT process. In Sweden, a national forum for regional
competitiveness, entrepreneurship and employment was set up in 2007 to engage the
regional political representatives in a long-term and strategic dialogue. The discussions
were organised into four themes (covering the four priorities of the Swedish NSRF:
innovation and renewal; skills development and labour force supply; accessibility; and,
strategic cross-border cooperation). According to a recent review (Näringsdepartementet,
2009a), there has been exchange of experience and learning between the regional
politicians and between the regions and the Government, but there are also
recommendations for smaller working groups and a focus on competence and labour market
development, the EU Baltic Sea Strategy, culture and creativity, and regional innovation
environments (Näringsdepartementet, 2009b). In Italy, a vertical coordination forum, the
State-Region Conference, continues to promote dialogue between regions and central State
on issues affecting the regions. A more thematic approach to coordination is exemplified by
the management of Cohesion policy in Spain. At the end of 2009 three thematic networks
were launched to discuss management and implementation issues and provide a forum for
exchanging experiences, covering the environment, equal opportunities and urban
issues/housing. The creation of a similar R&D and innovation network was scheduled for
September 2010.
European Policies Research Centre Euroreg 73

Economic & Social Cohesion in the Economic Policies of Member States: Final Report
European Policies Research Centre Euroreg 74
5.5 Ensuring efficient policy delivery30
Ensuring the efficient administration of regional policy is regarded by policymakers as
increasingly important, especially in the context of the crisis and reduced funding, and the
need to optimise (and make visible) policy performance. Mechanisms to measure and
support policy efficiency can be divided into two basic headings: policy design and policy
delivery.
5.5.1 Designing efficient policy delivery systems
The first heading concerns ex-ante efforts to improve efficiency when designing or
reforming policy delivery systems. One of the European Commission’s responses to the crisis
was to allow Member States to introduce reforms to accelerate or streamline the delivery
of Cohesion policy. For instance, in 2009 Spain standardised project application forms and
procedures were introduced across all Spanish regions to increase efficiency. In Portugal,
measures to support the business environment were reformed in July 2010 through the
announcement of a ‘Strategy for Accelerating the Implementation of Business Projects’.
One management measure allows the adaptation of projects to take account of the
economic context by simplifying procedures, particularly in terms of reporting during
implementation and project closure.
Similar initiatives have been introduced in national regional development policies. Two
examples come from the regions of Belgium. In Flanders, an efficient and effective
administration is one of the main priorities of the ‘Pact 2020’ initiative. Progress is
overseen by a think-tank, the Commission for Efficient and Effective Government (CEEO,
Commissie Efficiënte en Effectieve Overheid) set up in May 2008. A multi-annual
programme for a ‘vigorous administration’ was submitted by the Flemish administration to
the government in May 2010. Important elements of the approach are learning from past
experience, involving civil servants and politicians, creating synergies between levels of
government, and governance issues (Vlaamse Overheid, 2009). In Wallonia, administrative
simplification is also on the agenda, through the new ‘Plan for Administrative Simplification
and e-Government’ published in February 2010 (Gouvernement Wallon et Communauté
Française, 2010). The report lays down six priorities: simplifying and improving regulation;
simplifying and harmonising procedures; expanding virtual procedures; managing
administrative documents electronically; streamlining and computerising data collection
and data-sharing; and, improving communication with target audiences.
In several countries, conditionalities are being built into policy delivery systems to support
efficient performance. This can involve setting ex-ante conditionalities that must be met
before funding is released. For example, in Italy, several measures to increase the
efficiency of policy delivery are contained in the ERDF funded Governance and Technical
Assistance NOP Convergence (ERDF funded). This includes a condition for funding that the
administrative units involved must complete an organisational plan validated by the
Department for the Public Function. Incentives or sanctions can be built into policy delivery
30 This section draws on recent discussions in the framework of the EoRPA regional policy research consortium (http://www.eprc.strath.ac.uk/eorpa/default.cfm).

Economic & Social Cohesion in the Economic Policies of Member States: Final Report
frameworks to improve efficiency. A performance reserve, totalling around €3 billion, is
also operated (Gruppo tecnico, 2010). Under Cohesion policy, Poland has a reserve fund for
its regional operational programmes (ROPs). It is divided in annual tranches among the five
ROPs with the highest level of ERDF spending (as a percentage of the total allocated to the
programme). Poland’s new national regional policy framework is adopting this instrument,
but there are concerns that this may lead to a focus on quick rather than strategic spending
and a focus on competition rather than cooperation among regions.
Several options to improve efficient administration are being considered in France. The
government’s General Revision of Public Policies (RGPP), was launched in 2007 to increase
the efficiency of public administration and reduce public expenditure. As a first step,
simplifications were introduced regarding deconcentrated State services, which saw
mergers at the level of the regions and départements, as well as in the field of service
provision. The second phase, announced in June 2010, includes continuing staff cuts in the
public sector, a reduction of operating costs, simplification of administrative procedures
(notably via ICT). The introduction of incentives, rewarding good management with
increased transfers, is currently discussed, but there are concerns about the practicality of
such incentives as well as the definition of ‘good management’. The introduction of
benchmarking procedures to compare costs and expenditures between different local
authorities is also being considered.
5.5.2 Supporting efficiency through monitoring and evaluation
The second heading concerns the role of ongoing monitoring and evaluation in improving
the efficiency of regional instruments as they are rolled out. Monitoring and evaluation may
take on increased importance in the context of the crisis. In Spain the 2009 Cohesion policy
Strategic Report makes the point:
‘strong financial and budget constraints will most probably diminish the capacity to reinforce the strengths and mitigate the weaknesses of the Spanish economy. Therefore, the different policies will have to be concisely evaluated in order to achieve the most efficient allocation of resources possible, whilst taking into account their scarcity.’
In this context, it is worth noting that, in several countries, the capacity for sub-national
monitoring and evaluation has increased considerably in recent years. This reflects the
importance of capturing the territorial impact of socio-economic processes, and the
performance of policy responses. In France and the United Kingdom (England), recent
years have seen the establishment of regional statistical observatories in order to gather
comprehensive, standardised data at different levels. Regional policy in Denmark involves
national targets for training, entrepreneurship, innovation, and R&D. For each of these
areas, the performance of every region is measured, and the Danish Enterprise &
Construction Authority (DECA) is working with Statistics Denmark to devise additional
indicators with regard to framework measures and the performance of firms/individuals.
The standardised collection of data on regional economic performance orchestrated by
DECA should allow the regional growth fora to base their policies on up-to-date analyses of
regional development trends, while facilitating evaluation within and across regions with
regard to both policy programmes and individual projects. Moreover, in Portugal, the
European Policies Research Centre Euroreg 75

Economic & Social Cohesion in the Economic Policies of Member States: Final Report
standardisation of core indicator concepts, methodologies and data collection approaches
across programmes have been strengthened over the past year. However, in some of these
cases, there have been challenges in aligning these indicators with targets. As a result, the
consequences of persistent underperformance can be unclear.
Ongoing evaluation can also be used to improve the performance of policy instruments and
programmes as they are rolled out. Across the EU12 Member States, expanding evaluation
systems are focusing on delivery issues (e.g. selection criteria, indicators etc) for the
current generation of Cohesion policy programmes. However, spill over effects into
domestic policymaking are increasingly apparent. For instance, in the Czech Republic there
are already examples when the EU evaluation methodologies have been applied outside the
programmes co-financed by the EU policy (e.g. a form of ex-ante evaluations of regional
innovation strategies for several Czech regions. In Latvia, a transfer of knowledge and skills
has facilitated the development of local expertise in monitoring and evaluation capacities.
There is an increasing focus on ‘impact’ rather than ‘process’ evaluation as a means of
assessing the effectiveness of interventions. Regional development support instruments in
Austria have recently been evaluated from this perspective. In Germany, an evaluation of
the impact of GRW business aid has found that it is effective in stimulating private
investment. It took a counter-factual approach, comparing businesses that received aid
with similar businesses that did not receive aid (via a ‘matching study’) and found that the
development of assisted businesses was considerably stronger in terms of employment and
earnings. In the Netherlands, evaluation is regarded as key to policy efficiency. The impact
of each component of policy is evaluated at the end of each policy phase. In this context, it
is of note that industrial estates provision and the Investment Premium (BSRI) were
evaluated in 2009 while Peaks in the Delta and the regional development companies (ROMs)
were reviewed in 2010. Numerous studies are underway at national and regional levels in
Poland. An ex-post evaluation of the Polish National Development Plan (2004-2006), is due
to be finalised in 2010. This amounts to a substantial work programme and one of the most
comprehensive carried out at Member State level. It has already produced some interesting
studies and conclusions (eg. on the macroeconomic influence of Cohesion policy at national
and regional level). Another evaluation has found a significant positive impact of Cohesion
policy spending in Poland on the economies of EU15 Member States.
Despite this trend towards more monitoring and evaluation, is it possible that the crisis
(and associated rationalisation of government intervention and administration) will lead to
some activities being reconsidered. On the one hand, it can be argued that reductions in
regional policy funding place greater emphasis on monitoring and evaluating how efficiently
money is invested. Equally, it is valid to contend that decreasing amounts of funding do not
justify the construction of comprehensive systems of monitoring and evaluation. For
instance, the successor to the sophisticated framework set up for the English RDAs (which
are being abolished) in the United Kingdom is unlikely to be on the same scale.
Further, in some cases the impact of the crisis and the implementation of anti-crisis
measures have skewed data to such an extent that it is difficult to draw robust conclusions
and make long-term recommendations on the basis of evaluation. Lastly, the extent to
which public authorities can respond to evaluation recommendations is constrained by the
European Policies Research Centre Euroreg 76

Economic & Social Cohesion in the Economic Policies of Member States: Final Report
European Policies Research Centre Euroreg 77
new financial context. In Ireland, responses to evaluation recommendations have been
constrained by the crisis: the public sector has already been subject to major changes and
cuts, creating resistance to further upheaval. Moreover, short-term costs are involved in
restructuring and institutional change that could be difficult to sustain in the present
economic climate. In France, an evaluation of the Regional Economic Development
Schemes (SRDE) is currently underway, but it is likely that all recommendations will be
implemented due to limited capacities of local authorities (Zapalski, 2010).
5.6 Concluding points
Policy delivery varies considerably across EU Member States in line with the distribution of
competences and resources at different levels. Countries’ approaches can be placed on a
continuum from the quasi-absence of the central state in regional policy-making (eg.
Belgium), to an oversight role of a central ministry over the actions of relatively
independent regions (eg. Italy, Spain, United Kingdom), to important coordination and
budgetary powers retained by the central level (eg. France, Poland), to a predominance of
the central state over sub-national entities which exist mostly for planning purposes (eg.
most of the EU12, Greece, Portugal). However, the mapping of countries is not always
clear-cut, and there are elements in some of the more regionalised or federal Member
States which reflect quite strong historical commitments by the central state to regional
development issues (eg. Germany). Moreover, positions of the Member States on this
continuum are not stable with on-going decentralisation and regionalisation processes in a
number of countries. Vertical coordination is essential in the different institutional
arrangement, although it is less of an issue in centralised unitary systems. There are
increasing efforts to ensure the coherence of national and regional-level funding and
priorities, sometimes also including sectoral funding commitments, through national-
regional contracts or co-financing arrangements. Progress has also been made with respect
to institutional coordination arrangements, including in some of the EU12.


Economic & Social Cohesion in the Economic Policies of Member States: Final Report
European Policies Research Centre Euroreg 79
6. THE IMPORTANCE OF EU COHESION POLICY31
6.1 Introduction
There is a complex relationship between EU Cohesion policy and Member State policies for
economic, social and territorial cohesion. This does not mean that the character and
intensity of that relationship is similar in all Member States. Differences can be seen in
almost every dimension of the relationship which was subject to research. However, some
general features can be noted, and these will be presented in the course of this chapter.
In order to understand better the situation in Member States, the following dimensions of
potential importance to EU Cohesion Policy were taken into account:
the influence of the Cohesion policy on strategic objectives and priorities;
the role of the Cohesion policy in implementing and financing these policy
objectives; and
the impact of Cohesion Policy on governance (including management,
implementation and evaluation).
Before beginning the discussion of the relationship between the two first policy dimensions
(the sphere of governance seems to constitute a separate aspect, not so strongly related to
the first two), a reflection on the meaning of the Cohesion policy itself, as understood by
the national experts, is necessary since particular countries define it in very different ways.
In general, the interpretations of the Cohesion policy relate to the widely conceived
framework of the Lisbon agenda, and recently to the strategy Europe 2020, and the
objectives of the policies specified in these documents. Thus, the notion of Cohesion policy
seems to be as wide as this framework. Therefore, there are countries which state that
“competitiveness”, “growth” and “innovation” on national or on regional scale (or on both)
are the objectives of Cohesion policy. These, usually, are the countries which are embraced
by the “competitiveness” objective. At the other extreme, there are countries falling under
the “convergence” objective which – at least in their official strategic documents interpret
“cohesion” as equalisation of interregional differences in GDP per inhabitant. Obviously,
there are also countries which try to combine (in different ways and proportions) these two
dimensions of Cohesion policy and which partially support growth and jobs (i.e. which
follow the orientation of the Lisbon agenda) and, at the same time, try to alleviate regional
disparities. These are, in general, the countries that have considerable historically rooted
interregional differentiation or in which the territorial dimension of development plays an
important role due to their geopolitical situation (like the Nordic countries).
31 This section has been written by Grzegorz Gorzelak and Marek W. Kozak of Euroreg, University of Warsaw.

Economic & Social Cohesion in the Economic Policies of Member States: Final Report
6.2 Competitiveness - convergence dimension
As already indicated, the Cohesion policy has a wide and often unclear – as is still the case
with “territporial cohesion” - meaning which covers a wide array of objectives, from
“competitiveness” to “convergence”. Though these two notions themselves are also rather
vague, their interpretation is not too difficult. Increasing territorial (national or regional)
competitiveness means improving the business environment for the firms located in a given
area through delivering to them qualitative factors like skilled labour, business support
institutions, transport and ICT infrastructure, proximity of R&D facilities, improving the
living conditions for the most demanding (i.e. creative, best educated and occupying top
positions) employees and employers. On the other hand, “convergence” means attempting
to improve the standard of living of inhabitants of the lagging regions, which is assumed to
be achieved through accelerated growth in these regions and improving their infrastructure
provision with facilities necessary for both businesses and households.
The discussion of these two orientations is the essence of the debate on regional
development and policies for regional development. The “efficiency-equity dilemma” is
often denounced as irrelevant in terms of the contemporary development paradigm.
However, closer examination of the policies adopted in particular Member States clearly
indicates that the choice between these two orientations is not a trivial one and that
attempts aiming to avoid this choice are more nominal than real.
Taking into account the policy strategic documents, three groups of countries can be
distinguished according to their location on the competitiveness-convergence axis.
First, Luxemburg, Denmark, the Netherlands and Austria clearly indicate national and
regional competitiveness as the main orientation of their Cohesion policy. The existence of
such a goal within EU Cohesion policy allows their national development policies to be
related to EU goals and objectives. National preferences for competitiveness are, in this
context, the most important ones; the pro-competitive elements of the Lisbon agenda (and
in the future Europe 2020 strategy) enable these countries to benefit from the (limited)
funds available under the competitiveness objective of EU Cohesion policy.
Second, a wider group of countries try to combine the competitiveness and convergence
orientations. These are the United Kingdom, France, Sweden, Finland, Ireland, Cyprus and
Malta, as well as Flanders and Brussels in Belgium (where the provinces have the right to
formulate their own development goals). As competitiveness goals seem to be of utmost
importance, the traditional goals of regional polices do find their place in the set of
adopted objectives and are combined in a policy mix which has a “compromise”
character”. In some countries, convergence objectives may be a result of their geopolitical
setting (as in Sweden and Finland) where is had been assumed that some territories
(northern) should not remain depopulated, and the policies tend to attract people and
business to relatively unattractive locations. In other countries (France and the UK), the
tradition of assisting less developed peripheral regions co-exists with policies aiming at
enhancing innovativeness and productivity in the regions.
European Policies Research Centre Euroreg 80

Economic & Social Cohesion in the Economic Policies of Member States: Final Report
Third, there is a group of countries that clearly places most weight on the convergence
orientation of Cohesion policy. This includes all of the southern European countries (Spain,
Italy, Greece and Portugal) and those in Central-Eastern Europe (Bulgaria, Czech Republic,
Estonia Hungary, Latvia, Lithuania, Poland, Romania, Slovakia and Slovenia). Germany, with
the regional problem of the eastern Länder, is also a member of this group. The depth and
persistence of regional disparities and traditional approaches to regional policies are the
most important factors shaping Cohesion policy for this group, though – as will be seen later
in this report – not the only ones.
6.3 Influence on strategic objectives and priorities
The relative importance of EU Cohesion policy turned out to depend on at least two
criteria. One is the level of development of the Member State and the amount of funds that
can be spent on pro-development projects. The second relates to the EU (framework)
regulation for the financial perspective 2007-2013 and the relation of the national to EU
funds available for strategic investment. In practice these two elements are quite strongly
connected, as the regulation, in the paragraphs important for this study, differentiates
between territories (regions) below and above the threshold of 75 percent of average EU
GDP per capita. However, it seems that the level of development is a primary factor. To a
large extent, the impact may differ also due to the changing role of Cohesion policy in
various policy areas. Despite the complexity of factors and relations, Member States can be
grouped along a continuum ranging from “insignificant” to “very strong” importance
(influence) of EU funds and strategic orientation on national policies.
Among the countries that tend to concentrate at the “very strong” end of spectrum is a
group of mostly New Member States. It is important to stress that this group is not fully
homogeneous. An example of the most significant influence of Cohesion policy is reported
in Bulgaria and Romania, where policy objectives are deeply based/derived from the
Cohesion policy. Similarly, in Hungary and Poland, there is a widespread belief that
Cohesion policy has recently had a significant influence on national policies and, in
particular, regional development policy is dominated by EU Cohesion policy co-financed
programmes. In Slovakia, Cohesion policy influenced a number of policies, with regional
policy developed from scratch under EU influence during accession. Slovenia, Lithuania,
Latvia and Estonia underline influence of the EU Cohesion policy on strategic objectives.
Poland expresses similar views, in particular emphasising the importance of Cohesion policy
for the Lisbonisation process. Also Malta considers the influence of Cohesion policy on
strategic objectives to have been strong.
The position of the Czech Republic is interesting. It suggests that the importance of
Cohesion policy is relatively small in comparison with the Lisbon strategy. What is more,
the Cohesion policy-related Czech strategic documents are played-down and, therefore,
their role is marginalized due to some skepticism about value-added of these documents. It
is stressed that the increase of innovativeness should become the main priority of Czech
policies. The Czech case can be seen as sharing some features with the next group of
countries.
European Policies Research Centre Euroreg 81

Economic & Social Cohesion in the Economic Policies of Member States: Final Report
The situation of countries which suggest that Cohesion policy has been of modest
importance to their strategic objectives and priorities is very interesting. Here, in the case
of Germany, influence is admitted, but stress is placed on its own lengthy experience in
policy development and differences in, for instance, its approach to area designation. When
assessing the German position, one has to bear in mind the dual character of its
development policy and objectives (significantly different in the new Länder than in the
western regions). In the Netherlands, the national experts stress the importance of
Cohesion policy on strategic objectives rather than on implementation or financing, as the
main public instruments aimed at delivering the objectives are national programmes. In
Sweden, the importance of the policy in question is considered “rather strong”
simultaneously emphasising that EU Cohesion policy is integrated into the national regional
development policy rather than steering it. Luxembourg, the EU’s richest Member State,
seems to take similar position.
The other end of the proposed continuum is taken by countries that see EU Cohesion policy
as being of limited importance. This is not only due to limited access to EU financing. In
most cases, main reason for this view is the deep belief that those countries defined and
introduced the objectives and instruments which are known today as typical for Lisbon
driven Cohesion policy long before this policy was developed. In Austria, with development
policy objectives oriented towards entrepreneurship, innovation and R&D, EU funds are
seen pragmatically as nothing else than a financing instrument. A very similar approach is
found in Denmark where Lisbonisation is seen as an idea in line with existing strategies.
Finland, a relatively new Member State (since 1995), puts stress on the fact that its
development policy was “Lisbonised” already before accession. Similarly, Ireland stresses
that sound macroeconomic policies were adopted at the end of the 1990s when emphasis
was put on the new development paradigm. At present, Ireland’s response to EU Cohesion
policy is seen domestically as “pragmatic adaptation”. In the period 2007-2013 it means de
facto separating out Cohesion policy from the mainstream national development policies
(one should remember that in the past the use of the EU funds in Ireland was exceptionally
strongly development-oriented, even at the expense of interregional convergence in this
country). The position of Cyprus has to be noted: it also stresses that development policies
had been developed before accession and Cohesion policy does not play significant role in
policy design (though it admits that in certain areas the influence is visible).
The role of the Lisbon strategy in formulation of national policies may be summarized in
two distinctive situations: the richer and more technologically advanced countries, with
stronger innovation capacities, the more willingly they do really implement the “core” of
the Lisbon strategy, i.e. support R&D and enhance innovativeness, and in this way the
Cohesion policy fits into their own polices. The other pole is composed of relatively less
developed countries (the New Member states in particular) which use “Lisbonisation” as a
key word in order to fulfill the format requirements, and try to prove (mostly on paper)
that their policies do follow the Lisbon strategy and its principles. Of course, this is a two-
polar simplification, and real situations of particular countries can be placed somewhere in
between of these two “ideal” descriptions.
European Policies Research Centre Euroreg 82

Economic & Social Cohesion in the Economic Policies of Member States: Final Report
6.4 Influence on financing
A recently published evaluation report on 2000-2006 Cohesion policy clearly shows that,
even in allegedly homogeneous groups of Member States (such as the EU10 or the EU15) the
strategic use of, for instance ERDF, in various policy areas differed from one country to
another (Ismeri et al, 2010). Table 6.1 shows the scale of payments under ERDF to the
main recipient countries.
Table 6.1: The scale of payments from the Structural Funds and Cohesion Fund to the main recipient countries, 2000-2009.
€bn 2000 2001 2002 2003 2004 2005 2006 2007 2008 2009 2000-9 PT 1.34 1.66 2.80 3.11 3.20 2.68 2.37 2.12 2.93 0.29 22.50
GR 0.00 2.24 1.45 1.41 2.55 2.43 3.43 4.68 5.45 0.16 23.80
MZ* 1.30 0.24 1.20 2.68 2.63 2.94 3.37 3.31 3.24 0.48 21.40
GE* 0.68 2.24 2.50 2.43 2.92 3.03 2.85 2.61 2.10 0.02 21.39
ES 0.30 5.33 7.93 8.22 8.10 7.63 5.51 5.46 5.44 0.40 54.30
IE 0.21 0.46 0.61 0.55 0.54 0.43 0.41 0.24 0.30 0.01 3.76
Total 3.38 12.17 16.49 18.39 19.93 19.14 17.95 18.42 19.47 1.36 147.16
LV 0.01 0.02 0.02 0.09 0.17 0.17 0.39 0.26 0.01 1.14
LT 0.01 0.03 0.03 0.11 0.19 0.23 0.39 0.48 0.03 1.49
EE 0.01 0.01 0.02 0.06 0.10 0.16 0.16 0.15 0.00 0.66
PL 0.05 0.16 0.17 1.06 1.00 2.13 3.37 3.15 0.29 11.37
SK 0.00 0.02 0.03 0.15 0.20 0.30 0.43 0.51 0.00 1.65
HU 0.03 0.04 0.05 0.24 0.40 0.75 0.85 0.42 0.04 2.82
CZ 0.01 0.03 0.05 0.23 0.20 0.51 0.61 0.69 0.03 2.37
MT 0.01 0.01 0.02 0.03 0.02 0.00 0.08
SI 0.00 0.01 0.01 0.03 0.06 0.10 0.08 0.11 0.01 0.40
CY 0.01 0.01 0.01 0.02 0.03 0.00 0.08
EU10 0.12 0.32 0.38 1.99 2.33 4.37 6.33 5.82 0.41 22.06
% GDP 2000 2001 2002 2003 2004 2005 2006 2007 2008 2009 2000-9 PT 1.10 1.28 2.07 2.24 2.22 1.80 1.53 1.30 1.76 0.18 1.53
GR 0.00 1.53 0.92 0.82 1.37 1.24 1.63 2.07 2.28 0.07 1.25
MZ* 0.90 0.16 0.74 1.58 1.49 1.60 1.77 1.66 1.56 0.21 1.18
GE* 0.22 0.73 0.79 0.77 0.90 0.93 0.85 0.75 0.58 0.01 0.65
ES 0.05 0.78 1.09 1.05 0.96 0.84 0.56 0.52 0.50 0.04 0.62
IE 0.20 0.39 0.47 0.40 0.36 0.27 0.23 0.13 0.16 0.01 0.25
Total 0.26 0.79 1.01 1.07 1.09 0.99 0.87 0.85 0.87 0.06 0.78
LV 0.11 0.18 0.23 0.79 1.28 1.09 1.83 1.14 0.06 0.81
LT 0.09 0.20 0.17 0.60 0.89 0.94 1.36 1.50 0.10 0.72
EE 0.11 0.13 0.18 0.63 0.90 1.20 1.04 0.91 0.00 0.61
PL 0.02 0.07 0.09 0.52 0.41 0.78 1.08 0.87 0.09 0.45
SK 0.02 0.09 0.11 0.45 0.52 0.67 0.78 0.78 0.00 0.41
HU 0.05 0.06 0.06 0.29 0.45 0.83 0.84 0.40 0.05 0.35
CZ 0.01 0.03 0.07 0.26 0.20 0.45 0.48 0.47 0.02 0.24
MT 0.14 0.11 0.32 0.60 0.36 0.00 0.17
SI 0.01 0.04 0.03 0.12 0.21 0.31 0.23 0.29 0.02 0.14
CY 0.04 0.07 0.10 0.14 0.17 0.01 0.06
EU10 0.03 0.07 0.08 0.40 0.41 0.70 0.88 0.72 0.06 0.39
Note: Countries ordered by overall payments 2000-09 relative to GDP; *MZ, GE refer to the Mezzogiorno and the Eastern German Länder, respectively. Source: Bradley and Untiedt. An analysis of cohesion policy, 2000-2006, using the CSHM.
European Policies Research Centre Euroreg 83

Economic & Social Cohesion in the Economic Policies of Member States: Final Report
With the passage of time, the relative importance of Cohesion policy tends to increase
during the period 2000-2006. This process is particularly visible in new Member States.
Except for Latvia and Estonia, none of the new Member States reached a level of Cohesion
policy funding above 1 percent of GDP. Although the data in Table 6.1 and Table 6.2 give an
overall picture of aggregated relative importance of Cohesion policy to Member States
(main beneficiaries only), an assessment of relative importance to domestic economic
policies aimed at economic, social and territorial cohesion requires an analysis of both
quantitative and qualitative information. In many cases, due to lack of precise data, the
information presented is, to a large extent, based on estimations by experts.
Table 6.2: Cumulative effect of Structural Funds on GDP in major recipient economies, 2000-2015
GDP in end year as a % of GDP in absence of cohesion policy
HERMIN QUEST
2000-9 2000-11 2000-13 2000-15 2000-09 2000-11 2000-13 2000-15
IE 7.47 8.29 9.01 9.67 1.95 2.97 4.04 5.17
GR 15.89 17.07 17.96 18.74 12.99 17.83 23.10 28.60
ES 16.67 17.77 18.53 19.18 9.50 12.74 16.26 19.98
PT 16.75 18.23 19.54 20.75 15.69 21.33 27.41 33.70
MZ 10.37 10.71 11.41 12.13
GE 5.16 5.51 5.86 6.20
EU14 15.63 16.75 17.58 18.31 9.80 13.30 17.09 21.07
CZ 3.74 4.54 5.20 5.79 1.40 2.20 3.03 3.87
EE 6.63 7.95 9.07 10.07 3.52 5.10 6.73 8.32
CY 0.68 0.77 0.83 0.88 0.13 0.30 0.49 0.69
LV 6.71 7.86 8.79 9.58 11.65 16.98 22.42 27.85
LT 7.58 8.89 9.95 10.88 7.67 11.12 14.83 18.70
HU 6.91 7.70 8.28 8.78 3.08 4.62 6.28 8.02
MT 2.52 3.00 3.44 3.84 0.68 1.31 1.97 2.65
PL 4.46 5.48 6.37 7.17 4.98 8.06 11.31 14.67
SI 1.17 1.35 1.50 1.64 0.84 1.32 1.80 2.27
SK 4.29 5.11 5.83 6.49 2.32 3.49 4.72 5.99
EU10 4.57 5.45 6.19 6.85 3.71 5.79 7.97 10.22 Note: Aggregations are weighted averages of country estimates, using the GDP of countries expressed in EUR as weights. GDP in 2009 has been used to weight the estimates for the subsequent years. Source: Ismeri et al, 2010: 119
The assessment of the importance of EU Cohesion policy in relation to national economic
policies turned out to be an extremely difficult task for national experts. In most cases, the
information given concentrated on the amounts and percentage of EU funding, either in the
state budget or in operational programmes implemented in a given Member State. There
were very few attempts to estimate the influence on national policies. In most new Member
States, this can be explained to a large extent by the very real concentration of attention
on Cohesion policy measures. Another possible explanation is that monitoring and
evaluation instruments are not that widely used outside the Cohesion policy framework and
European Policies Research Centre Euroreg 84

Economic & Social Cohesion in the Economic Policies of Member States: Final Report
European Policies Research Centre Euroreg 85
also, in the case of quite a number of “older” Member States, there is no readily available
recent data. Anyway, the quest for data allowing for the estimation of influence of
Cohesion policy on domestic policies appears to be a challenging one for the national
experts.
Beginning with the EU10, only some countries provided information on relative financial
importance. However, in most cases, the data provided refer to co-financing within
Cohesion policy measures. According to Slovak data, Cohesion policy funding is equal to
17.8 percent of the state budget and the importance of it is the highest in the field of
innovation (88 percent), employment (57 percent) and transport (48.5 percent). In the case
of Latvia, stress was placed on the fact that certain policy areas have received financing
only due to Cohesion policy. Information on the Slovenian case suggests that EU funding
does not have very high profile as in financial terms Cohesion policy and CAP together
amounted to 3.6 percent of all executed expenses. Romania considers EU funding as vital
for domestic policies (clearly including here all measures co-financed by the EU), though
the financial difficulties caused by the crisis might have a negative effect on the ability for
co-financing the EU programmes. In Poland, the data available suggest that EU Cohesion
policy funding represented in 2007 35 percent of all structural32 public spending and were
expected to increase (MRD, Polska, 2010: 22). Bulgaria – as well as Lithuania and Hungary –
provide relatively little information on the structure of financing of Cohesion policy
operational programmes (with almost all priorities co-financed by the EU at 85 percent).
The Czech Republic does not provide any hard data and concentrates attention on “soft”
elements of influence.
Figure 6.1: Relative importance of Cohesion Policy on selected domestic policies. Case of Poland
Policy Key fields of influence
Economic concentrated on innovative measures and entrepreneurship development
Regional allowed significant increase of spending on basic infrastructure and, to a lesser extent, on support to SMEs and human resources
Transport helped prepare and finance national programmes of transport development with particular stress on motorway construction and railway modernisation
Environment concentrated mostly on sewerage and waste water treatment plant construction (with little funding for other waste management problems)
Employment introduction of very large programmes to actively counter unemployment (mostly training)
Source: Own estimations on the basis of MRD 2008, MRD 2009.
The situation is different in the more affluent Member States. In Finland, the share of ERDF
programmes is €534.8 million (covering both EU and State components) of the total of
€1,172.2 million in financing national policies for regional development in 2010. In Sweden,
32 Structural here means funding that can be theoretically supported financially by Structural Funds and the Cohesion Fund.

Economic & Social Cohesion in the Economic Policies of Member States: Final Report
the data presented only for regional policy say that EU funding in 2008 was equal to 36
percent (about 1,782 million sek). In Denmark, nearly one-third of expenditure of the
Regional Growth Fora (statutory bodies) comes from EU sources. In Ireland, the role of EU
funding is decreasing fast (in 2000-2006 the share of Structural Funds and the Cohesion
Fund in the National Development Plan was €3.7 billion compared to €57.1 billion in total).
Subsequent major declines of the role of EU funding led to the decision to separate it from
national programming.
In Belgium, the financing of domestic and EU policies is said to be “closely interlinked”, but
no detailed information was provided other than the structure of EU co-financing in
operational programmes. There was a similar situation for France, Germany, Luxembourg,
Spain, Greece and Malta while no detailed information was provided for Italy or Portugal.
In the Netherlands, the national expert reported that the Cohesion funds financial aid is
seen by authorities as a complementary contribution for the national policy on regional
socioeconomic development. EU Cohesion policy financing to the Netherlands for 2007-2013
is equal to €2 billion, an amount doubled by Dutch co-financing.
Regardless of whether the country in question is an old or new Member State, specific
information on the influence of Cohesion policy funding on domestic policies aimed at
social and economic cohesion was in most instances not available. There were a few
exceptions (such as Poland) where the authorities tried to estimate the importance of
Cohesion policy to overall development expenditure, but even here the data on specific
policies outside Cohesion policy framework are not collected.
6.5 Interrelationships
It is not surprising that the interpretations and implementations of the two major
dimensions of the Cohesion policy (relative importance of the EU funds and policies and the
convergence-competitiveness orientation), as adopted and performed in particular Member
States, are mutually interrelated. These interrelationships are presented in Figure 6.2.
The general observation is the following: there is a strong and direct relationship between
the importance of the EU policies in the formulation of the national objectives of
development policy and the share of EU funds in overall development spending. This is
represented by the general distribution of the Member States along the diagonal of the
graph, and a lack of any entries in the lower-left quarter (i.e. there are virtually no
countries which strongly rely on EU funds and policies and do not follow the convergence
principle which traditionally constitutes the meaning of “cohesion"). This observation
should not be surprising due to the fact that the richer countries of the EU are covered by
the Competitiveness objective of Cohesion policy, while the poorer countries are to a larger
degree (if not exclusively) supported by the Convergence objective.
The group of countries in the upper-left corner of the graph (group A) consists of the highly
developed, rich Member States with relatively weak interregional differentiation and strong
commitment to innovation and productivity as the main driving forces of their development
policies. National competitiveness is the major dimension of these policies, with relative
European Policies Research Centre Euroreg 86

Economic & Social Cohesion in the Economic Policies of Member States: Final Report
neglect of the regional/territorial issues. These countries understand Cohesion policy
according to the essence of Lisbon strategy, and no doubt will be the forerunners of the
“smart growth” principle specified in Europe 2020.
Figure 6.2
B1: Flanders, Brussels; B2: Wallonia
L DK
NL A
F D
S
B1 IRL
CY
M
E
I
B2
EST C Z
SK
SLO
H
PL
RO
FIN
EU
Rel
ativ
e im
port
ance
D
omes
tic
Competitiveness Policy profile Convergence
P GR
UK
BG
A
C B
D
The next group B may be labeled as the Member States for which regional competitiveness
is an important pillar of their development policies. It consists of two (overlapping) subsets:
the one comprising big, strong economies (UK and France), two Nordic countries (Sweden
and Finland) and a set of smaller countries/regions, such as Cyprus, Malta, Ireland and
European Policies Research Centre Euroreg 87

Economic & Social Cohesion in the Economic Policies of Member States: Final Report
Flanders of Belgium. The first four countries definitely orient their development policies in
the same line as the former group, i.e. stressing innovativeness, productivity and
technological progress as the main pillar of economic development – however assigning
more importance to the regional issues than the countries of group A. Besides UK and
France, the countries of the rest of this group display a specific territorial problem: the
geopolitically driven objective to maintain population and economic activity in the
furthermost northern territories of the Nordic counties, the political division of Cyprus and
the dominances of the capital city in Malta.
The set of Member States in which Cohesion policy is driven by the convergence objective is
the most heterogeneous one (groups C and D on Figure 6.2). It consists of all southern and
eastern Member States and Germany. However, the importance of the Cohesion policy
divides this group clearly into richer (group C) and poorer (group D) countries: the former
formulate their own policies, and can finance them from their own resources, which EU
Cohesion policy funds and instruments only supplement (like in Germany), while in the new
Member States as well as in Greece and Portugal the policies are almost totally – at least
according to the strategic documents - formulated and funded according to the principles
and budgets of EU Cohesion policy.
The position of the new Member States is especially instructive. Before their accession, all
conducted their own stronger or weaker regional policies. Beginning in the 2000s, EU
Cohesion policy started to influence them in a substantive way – national strategies of
regional development were structured according to the principles of EU Cohesion policy,
and the financial instruments – as weak as they were at that time – were designed broadly
in line with EU assumptions.
The situation changed dramatically after accession, and especially during the current
financial perspective. Polices have been almost totally subordinated to those agreed with
the Commission, and domestic financial recourses have been used only to fulfill the
additionality principle.
Is this the reason for such a strong subordination to the Convergence objective? Partially
yes, since almost all these countries are being relatively heavily financed by the
Convergence objective, which implies that the funds arriving from the EU have to be spent
on projects related to the operation of Cohesion policy. The richer countries, in which EU
financing plays a much smaller role in comparison to national funds, may be more selective
and may put more stress on projects and actions enhancing their international
competitiveness, with a greater disregard to interregional disparities which may be much
smaller than elsewhere, and therefore less important than the overall growth of the
national economies.
It should be also noticed that there might be some difference between the formal
statements in the official documents related to regional policies and their cohesion
dimension and other policies undertaken in these countries. Nominally devoted to
convergence-driven cohesion some countries (like Poland, where this is clearly pronounced)
support also policies that may have diverse results, like stressing the role of metropolitan
cores or as some of them call “growth poles” for the overall economic success of national
European Policies Research Centre Euroreg 88

Economic & Social Cohesion in the Economic Policies of Member States: Final Report
economies in the global scale, or directly supporting investment projects even if these are
located in major cities and localities already better developed. Also in Latvia and Estonia
the capital cities are privileged in the absolute amount of EU finds directed to them (45 to
50 percent of the total national allocation), though in relative terms (by population or GDP)
poorer regions might appear to receive more. These practices are related to efforts aiming
at increasing the competitiveness of their economies, since there is a growing conviction
that the orientation to low-cost competitiveness meets is limits.
It therefore needs to be checked in the future (after the results of Cohesion policies for
2007-2013 are assessed) to what extent the convergence objectives have been followed in
practice – and if this has been the case, will they be successful – or will the “natural” forces
of concentration and polarization prevail (which had been the case in the past).
6.6 Influence on governance
While it is relatively difficult to assess the financial importance of Cohesion policy on
development policies and, in particular, on domestic policies outside the NSRF framework,
most if not all EU Member States admit its significant influence on widely understood
governance. Even in countries which declare that development policy similar to
contemporary EU Cohesion policy was established before accession, certain elements of the
governance system were either adopted from the EU or significantly strengthened under its
influence. When assessing the impact in different Member States, one may notice that – as
in the case of the previously analysed aspects – countries can be, to some extent, grouped.
It should be stressed, however, that the dimension of governance does not necessarily
follow the trends shown on Figure 6.2.
In Austria, where Cohesion policy funding is considered only a source of additional finance,
undoubtedly the Structural Funds requirements for programming have provided an impetus
for reflection on the co-ordination of institutions and the adjustment and improvement of
existing support schemes. Interesting is the case of Sweden, where the national policy
management system is considered more complex than the EU Cohesion management
system. However, the actors are linked to each other since they often co-finance the same
projects so, at least in these cases, the information flow contributes to improved co-
ordination. As for development goals, these are in line with the Lisbon strategy, which,
however, in Sweden is more vigorously implemented. In other Member States advanced in
Lisbon strategy implementation (except for Ireland which has separated out EU
programming) stress is being placed on co-ordination and thus also on EU governance
principles. In Denmark, decisions about strategies and individual projects are taken at the
regional level, which effectively means that financial decisions are taken by the same
bodies irrespective of the source of funding. Despite some minor differences, regional
partnership bodies are in general simultaneously the central bodies in relation to both
national and European regional policy in Denmark. While overall strategic coordination is
provided by the six priority areas in the 2005 Business Development Act, practical co-
ordination between the two policy streams (national and EU) with regard to
implementation is ensured by the pivotal role of the Regional Growth Fora in both. In
Luxemburg, national and EU Cohesion policy coincide. Rationalisation of administrative
operations is seen as depending on improved inter-ministerial coordination, as the system is
European Policies Research Centre Euroreg 89

Economic & Social Cohesion in the Economic Policies of Member States: Final Report
centralised in Luxembourg. However, plans are being made to bring localities closer to
decision making system and improve also multilevel governance.
In Finland, at the regional level, regional programmes and plans, as well as the Regional
Management Committees as the partnership organizations, are intended to ensure the close
co-ordination of EU and national actions and measures. Also in France, there is a close
relationship between national and Cohesion policy both in terms of policy design and
implementation (through common timescales, fields of intervention, management,
monitoring systems etc.). In Germany, the national system incorporates most of the
available EU support. As a result, there is little or no difference in management terms.
However, EU instruments like the National Strategic Framework or Operational Programmes
are new approaches for Germany. As with Austria, in federal states the very existence of
more complex administrative systems makes it easier to adopt EU Cohesion policy principles
of multi-level governance.
In the case of those Member States discussed earlier, where domestic development
governance systems were to a large extent in place prior to EU Cohesion policy expansion,
EU instruments contributed to improvements in various aspects. In less developed
countries, regardless of the time of accession, it seems to be justified to say that the
impact of Cohesion policy on the national governance systems was major.
In Italy, after a long period of adjustment, since 2007 domestic regional policy has
converged fully with EU Cohesion policy The spheres of action of the domestic strand are in
some instances the same as those for Cohesion policy, thus boosting their intensity; while,
in other instances, they may be different, designed to foster the territorial or thematic
integration of the action. The main novelty in respect of the 2007-13 period is that, for the
first time, domestic policy is also implemented through multiannual programmes.
Greece belongs to group of countries which see Cohesion policy to have had a significant
influence on national policy governance through adoption of elements of reporting,
monitoring, evaluation, the partnership approach, and financial management. Cohesion
policy has opened up opportunities for institutional learning for the public sector. The
specification and standardisation of procedures, (e.g. project appraisal and selection,
financial management, public procurement and tendering procedures, monitoring of
projects etc.) through guidelines issued by the 2000-06 CSF Managing Authority, specialised
manuals and guides and the need to respond to the CSF monitoring and financial
management requirements via sophisticated information systems, have developed a
management culture which has also been transferred to the domestic system.
Spain represents a similar approach which can be depicted concisely as follows: public
national and regional administrations are based on EU requirements for processes regarding
the design, management, implementation, control and evaluation of programmes and
projects. Regarding EU Cohesion policy impact on the implementation of national policies,
Spanish public administrations have adapted not only their objectives and measures but
also their timing and programming rules completely to the EU Cohesion funding framework.
Though, in the Netherlands, the Structural Funds and the major domestic programme
(Peaks in the Delta) are considered separate, Structural Funds are much more closely
European Policies Research Centre Euroreg 90

Economic & Social Cohesion in the Economic Policies of Member States: Final Report
integrated with existing national policies, with funding decisions taken as part of the same
decision-making process (however Cohesion policy management rules are seen often as
overly bureaucratic). The impact is visible in particular in improved partnership, better co-
ordination in programme design, management and implementation.
Despite all the specificities of Belgium, at both national and regional level Cohesion policy
plays a relatively limited role in development policies mainly through similar Lisbon
oriented objectives. In other fields it is mainly in respect of evaluation that Cohesion policy
has brought real innovation.
EU Cohesion Policy plays an important role in developing domestic policy in Malta. The two
are managed and implemented in a closely integrated manner and the funding mechanisms
for EU Cohesion policy and national policy are centralised and, to avoid duplication of
resources, are not distinct.
As in the cases of Greece or Malta, for most CEE countries the impact of EU Cohesion policy
systems is obvious, though its scope differs. From the very beginning of the pre-accession
period, Cohesion policy has had a huge impact on the implementation of national policy -
including policy design, management and evaluation – in Romania. The institutional changes
have been accompanied by operational changes, derived from working with EU funds
procedures. It is expected that some mechanisms will be internalised in national structures
as well. Important cultural changes have also occurred, in relation to much higher
awareness about equity-related issues, about living, working and travelling in the EU space.
In Hungary, domestic regional policy is considered by some to be “inferior” to (dominated
by?) EU Cohesion policy as the institutional structure is almost the same and programming
and implementation are exercised on a residual basis: domestic development priorities are
left uncovered by EU Cohesion policy. Elements of reform of domestic policy are seen as
imported from EU Cohesion policy (multi-annual programming, operational programmes,
objectives-priorities-measures logic, etc.) which leads to a conclusion that there is a
substantial cultural and operational impact.
While formally in Bulgaria there is no integrated system concerning national and EU
Cohesion policy management, implementation and evaluation, it is expected that such a
unified system will be built soon. Despite that, institutional changes, internalisation of
programming approach and cultural change are seen as the main features of the EU impact
on Bulgarian governance.
In the Czech Republic the experts have no doubt that the impact of EU Cohesion policy on
the design and implementation of Czech national policies as well as on changing
institutional culture is clearly discernible. It has had also significant influence on the
institutional culture (seeking a rationale for investment decisions, control, monitoring and
evaluations systems, partnership principle etc.). It is however underlined that the new
approach to spending public money (prioritising value for money) stems directly from the
Cohesion policy framework. Nevertheless, certain doubts are expressed about whether the
impact on domestic financial sources has already been fully proved.
European Policies Research Centre Euroreg 91

Economic & Social Cohesion in the Economic Policies of Member States: Final Report
In Poland, despite all the positive influences that can be observed in public administration
and other institutions involved in administering development policies, it is clear that there
is still a gap between policies (better said: programmes or interventions) made outside the
Cohesion policy framework and those dominated or being a part of EU Cohesion policy. For
instance, in the case of evaluation it is a routine only in the case of EU Cohesion policy.
Decision making is separate, though done mostly by the same institutions, though not
always by the same decision-making body. One should notice, however, a steady
convergence: rules on selecting projects become similar between “domestic” and “EU-
driven” spheres of public policies. Negative and positive experience in management is being
transferred from one to the other sphere. Institutional set-up and decision making
procedures are getting more and more similar. It should be stated that, wherever there is a
direct link and co-financing from the EU, policy design, management and evaluation is
strongly impacted by Cohesion policy. In other policies or activities, which are not directly
linked to Cohesion policy, that influence is limited. One of the best examples is the fact
that almost all evaluations done up to now refer only to measures/documents co-financed
by Cohesion policy. Therefore, one can observe rapid institutional, operational and cultural
changes which are, however, limited to institutions and businesses which are involved as
managing or implementing actors, experts or beneficiaries
Slovakia is an interesting case where the separation of national and EU systems is
undisputable. As a result, the overall impact on domestic policy has been limited, largely
due to the separation of implementation systems and structures. Nevertheless, it is possible
to identify some impacts of Cohesion policy on policy design, management and evaluation
in national policy. What is more, the experience of the state administration and the
regional governments in preparing the operational programmes has been used in policy
design at national and regional levels. There have been efforts to integrate monitoring and
evaluation into the management system of national policies, partly as a result of their
compulsory use in the management of Cohesion policy. In spite of this, more significant
institutional changes and changes in the culture of policy management are seen as slow due
to the short time since accession and the features of the public administration in Slovakia.
In Slovenia domestic funds and the Structural Funds are being allocated through the same
channels. Cohesion policy has played an important role as early as the 2004-2006 period
through the introduction of new management and implementation systems as well as new
forms of intervention. The main innovation was the improvement of inter-ministerial
coordination and sustained efforts to achieve synergies among involved actors.
Also in Latvia the impact of Cohesion policy is seen as positive and considerable. Spillover
effects that have occurred as a result of the establishment and functioning of Cohesion
policy Management and Implementation System (MIS) have become an integral part of the
administrative culture. However, it is said that still more progress is needed in such areas
as “more ‘co-operative’ forms of public governance”. In case of Lithuania, Cohesion policy,
even if formally separated from domestic policy, is largely merged with the latter. Both
have the same objective, social and economic cohesion, and share similar management
schemes. In Estonia, Cohesion policy has had a large impact on Estonian regional
development policy. In particular, the 2005 Regional Development Strategy was specifically
European Policies Research Centre Euroreg 92

Economic & Social Cohesion in the Economic Policies of Member States: Final Report
European Policies Research Centre Euroreg 93
designed to update the previous strategy in order to adjust the parameters of national
regional policy to the needs of EU Cohesion policy.
Bulgaria and Romania still present several deficiencies in institutional capacity and
efficiency of the system managing the EU Cohesion policy. It is being indicated that this
becomes one of the most important barriers for efficient implementation of this policy and
proper spending of the funds earmarked for these countries.
To sum up, the influence of Cohesion policy on domestic institutions and governance is seen
as very important in almost all countries. In most cases, however, there are clearly two
more or less separate systems (national and EU) which to a different extent are interlinked
and coordinated. Undoubtedly even in Member States which see themselves as predecessors
of contemporary Cohesion policy (its Lisbon element in particular) there is no doubt that at
least rules and solutions proposed in Cohesion regulations (like the partnership principle or
evaluation) were adopted for internal practice. Interestingly, only Ireland is discussing the
possibility to re-separate domestic and EU delivery systems.
While better developed countries tend to use Cohesion policy instruments and regulations
instrumentally through coordination with long-established domestic systems, the newer
Member States tend to see Cohesion policy as a powerful instrument to develop and
improve existing institutional systems, operational abilities and institutional culture. It has
to be stressed that two main processes have been strengthened (or even initiated) in these
countries due to their entrance into the EU and implementation of Cohesion policy:
strategic planning and evaluation. These two dimensions have begun to create new
institutional culture and their impact on performance of public administration is clearly
visible.
It is sometimes argued that the evaluation practice of the Commission does not allow for
comprehensive analysis of general impacts of different EU policies that are financed from
different sources, even within the general Cohesion policy (like separate evaluations of the
ERDF with the Cohesion Fund and of ESF, not to mention lacking evaluations on territorial
development of the CAP).
The findings of this report are generally in line with previous reports on similar issues.
Recent ex-post evaluations also stress spillovers to other policy areas in the form of
improved partnership, monitoring and evaluation or transparency (Ismeri et al, 2010: 161)
The question remains, to what extent these processes make a real impact on those parts of
administration which are not directly linked to Cohesion policy. It is most likely that in this
area the process has just started as there is no firm proof yet found in newer Member
States. The allocation of large competences in development planning and management to
the regional level is typical for those countries. This is reflected also in terms of the
responsibility for EU Cohesion policy resources.


Economic & Social Cohesion in the Economic Policies of Member States: Final Report
7. THE CRISIS AND ITS IMPACT ON COHESION POLICY
7.1 Introduction
The aim of this chapter is to provide a brief overview of the implications of the economic
crisis for regional problems and national regional policy responses. This draws on a
comparative study by Davies et al (2009), as well as on the Part II Country Reports.
Following this introductory sector, this chapter considers the impact of the crisis on
regional development (Section 7.2) and goes on to summarise the regional policy responses
(Section 7.3), before seeking to group countries in relation the effect of the crisis on
Member State approaches to regional policy.
One set of factors that has shaped the impact of the crisis on the economic development of
different regions concerns their initial strengths and weaknesses. This includes the size of
their internal market and their access to larger external markets, as well as endowments in
natural resources and in physical, human and knowledge capital. The situation of individual
regions is also conditioned by the broader national context. In a number of countries,
structurally weaker regions are among those which have been most seriously affected by
the crisis. There are also concerns that the longer-term impact of the crisis could be more
serious in these regions, where the loss of even relatively small numbers of firms and jobs
could have significant effects, particularly if these losses lead to reduced demand for goods
and services from other local firms.
A further dimension that has affected the impact of the crisis on specific regions is their
sectoral structure. In general, a region’s vulnerability to adverse economic shocks is seen to
be correlated with its sectoral specialisation, although the degree of regional specialisation
has decreased in Europe since the 1950s, not least due to the expansion of public and some
private services in all regions. In 2008-9, some sectors were directly affected by the first
stages of the downturn, notably financial services, export-oriented manufacturing and the
construction industry, while other sectors have mainly experienced second-wave falls in
demand. Regions which specialise in a narrow range of sectors are particularly vulnerable
to sectoral shocks; a key concern in such regions is that the recession could permanently
reduce the number of firms and jobs in core sectors, leading to a structurally lower level of
output and employment even after the downturn has passed.
Although the main focus of all governments’ response to the crisis has been national rather
than regional – certainly in the first instance - the discretionary fiscal policies introduced by
most governments include some explicit or implicit regional dimension. In some countries,
the crisis has led to the allocation of additional funding or to changes in eligibility rules in
core regional policy instruments. The scale of new measures varies, but most are modest
and take the form of small rises in funding allocations or shifts in eligibility requirements. A
number of countries have also introduced changes in Cohesion policy programmes and have
taken advantage of the changes introduced by the Commission in response to the crisis.
Some countries are also taking steps to improve cooperation and to mobilise all available
resources and information in order to increase the effectiveness of policy responses to local
and regional difficulties. In a minority of countries, the need to release funds to address
European Policies Research Centre Euroreg 95
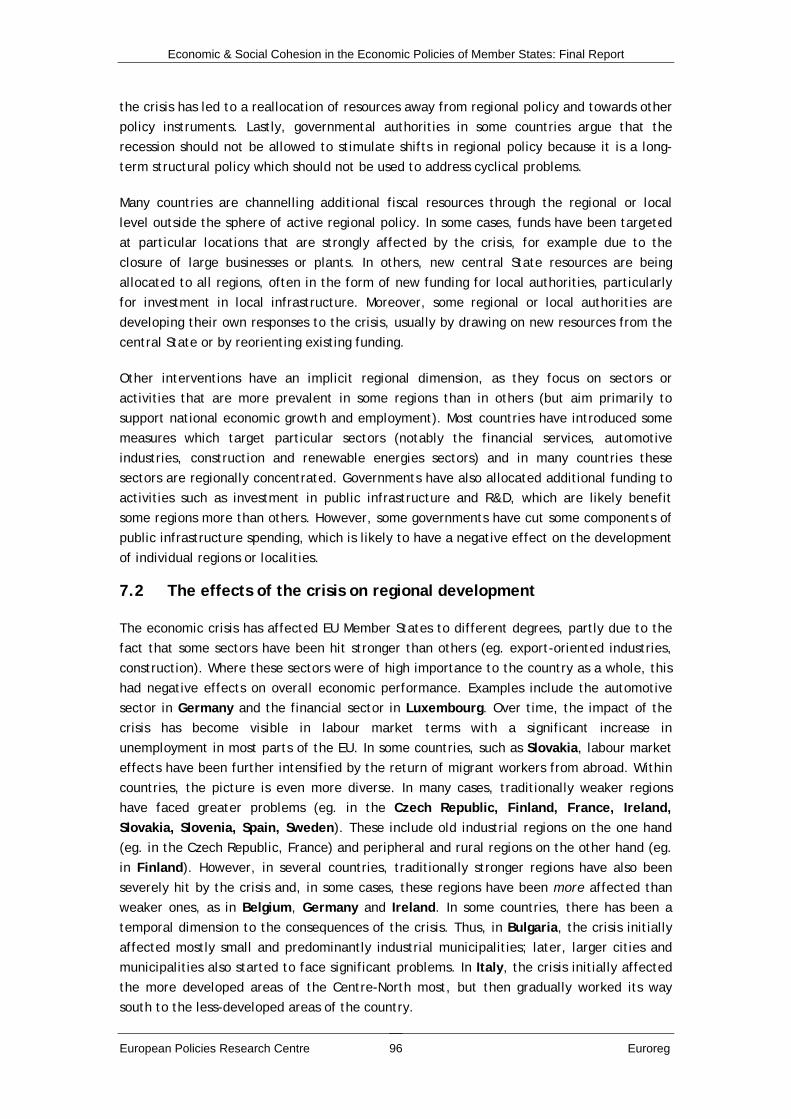
Economic & Social Cohesion in the Economic Policies of Member States: Final Report
the crisis has led to a reallocation of resources away from regional policy and towards other
policy instruments. Lastly, governmental authorities in some countries argue that the
recession should not be allowed to stimulate shifts in regional policy because it is a long-
term structural policy which should not be used to address cyclical problems.
Many countries are channelling additional fiscal resources through the regional or local
level outside the sphere of active regional policy. In some cases, funds have been targeted
at particular locations that are strongly affected by the crisis, for example due to the
closure of large businesses or plants. In others, new central State resources are being
allocated to all regions, often in the form of new funding for local authorities, particularly
for investment in local infrastructure. Moreover, some regional or local authorities are
developing their own responses to the crisis, usually by drawing on new resources from the
central State or by reorienting existing funding.
Other interventions have an implicit regional dimension, as they focus on sectors or
activities that are more prevalent in some regions than in others (but aim primarily to
support national economic growth and employment). Most countries have introduced some
measures which target particular sectors (notably the financial services, automotive
industries, construction and renewable energies sectors) and in many countries these
sectors are regionally concentrated. Governments have also allocated additional funding to
activities such as investment in public infrastructure and R&D, which are likely benefit
some regions more than others. However, some governments have cut some components of
public infrastructure spending, which is likely to have a negative effect on the development
of individual regions or localities.
7.2 The effects of the crisis on regional development
The economic crisis has affected EU Member States to different degrees, partly due to the
fact that some sectors have been hit stronger than others (eg. export-oriented industries,
construction). Where these sectors were of high importance to the country as a whole, this
had negative effects on overall economic performance. Examples include the automotive
sector in Germany and the financial sector in Luxembourg. Over time, the impact of the
crisis has become visible in labour market terms with a significant increase in
unemployment in most parts of the EU. In some countries, such as Slovakia, labour market
effects have been further intensified by the return of migrant workers from abroad. Within
countries, the picture is even more diverse. In many cases, traditionally weaker regions
have faced greater problems (eg. in the Czech Republic, Finland, France, Ireland,
Slovakia, Slovenia, Spain, Sweden). These include old industrial regions on the one hand
(eg. in the Czech Republic, France) and peripheral and rural regions on the other hand (eg.
in Finland). However, in several countries, traditionally stronger regions have also been
severely hit by the crisis and, in some cases, these regions have been more affected than
weaker ones, as in Belgium, Germany and Ireland. In some countries, there has been a
temporal dimension to the consequences of the crisis. Thus, in Bulgaria, the crisis initially
affected mostly small and predominantly industrial municipalities; later, larger cities and
municipalities also started to face significant problems. In Italy, the crisis initially affected
the more developed areas of the Centre-North most, but then gradually worked its way
south to the less-developed areas of the country.
European Policies Research Centre Euroreg 96

Economic & Social Cohesion in the Economic Policies of Member States: Final Report
7.2.1 Regional vulnerability and resilience in the wake of the crisis
Overall, it appears that the high concentration of industrial activities across the EU has led
to a high degree of vulnerability for some European regions. This has been the case for
many traditional industrial regions, such as Limburg and Noord-Brabant in the Netherlands,
the North and Centre regions in Portugal, the western regions of Slovakia, and the North of
England and Midlands in the United Kingdom. More generally, the drop in global demand
has affected regions dependent primarily on export-oriented industries (such as particular
regions in Austria, Germany and Sweden). In addition, lower private household
consumption is expected to affect, in particular, specific regions strongly dependent on the
tourism sector (as in Austria, Cyprus, Greece, Malta and Spain). In Portugal, for example,
tourism in the Algarve has suffered a sharp decline in traditional foreign markets. The
construction sector, which in many cases is closely connected to tourism industries, has
been particularly affected in Cyprus and Spain.
More generally, for regions with economies dominated by one or a limited number of
sectors, it has been difficult to mitigate the repercussions of the crisis (eg. regions in
Finland, Sweden and the United Kingdom). These examples include a range of very diverse
regions. In Finland, economic activity has decreased mainly in rural areas due to their
dependence on a struggling forest industry. In contrast, in the United Kingdom, there has
been a significant impact on the capital region - the South East and London – reflecting the
dominance of the financial service sector. The most pronounced effects have occurred in
areas where the key local employer went bankrupt (eg. in the Czech Republic, Ireland,
Slovenia). In some regions in Ireland, the loss of large-scale manufacturing plants is having
not only a considerable impact on the local economy but also on local communities as a
whole. In contrast, countries characterised by a fairly diversified structure have proved to
be relatively resilient. Their ability to cushion the effects of the crisis is also apparent at
the regional level, eg. in parts of Austria and the Czech Republic. Moreover, regions
mainly relying on comparatively stable sectors such as agriculture, the food industry and
knowledge-intensive business services (eg. Flevoland, Groningen and Utrecht in the
Netherlands) were found to be less affected by the crisis.
7.2.2 Crisis-related changes in regional disparities
Looking more generally at recent developments in regional disparities, the effects of the
crisis have been quite diverse. In some countries, it appears that the key features of the
regional problem have remained broadly unchanged. This is not only the case of countries
where the crisis has had a comparatively low impact, such as in Denmark, but also in other
Member States (eg. Czech Republic, Luxembourg, Poland). Where the crisis has had a
significant impact on regional disparities, two different trends can be noted.
The crisis has further accentuated regional disparities in several cases. In
Romania, for example, there is a growing concern that the already existing
disparities may deepen even further. GDP data shows that differences between the
capital region Bucharest-Ilfov and the North East have increased in recent years. In
other countries (Finland, Germany, Hungary, Ireland, Italy), there are concerns
that, while the more dynamic regions are expected to recover relatively quickly,
European Policies Research Centre Euroreg 97

Economic & Social Cohesion in the Economic Policies of Member States: Final Report
other areas may not be able to benefit from a future upturn to the same extent. In
Italy, for example, the structural weakness of the Mezzogiorno has intensified
during the economic crisis and it may lose out when global trade and international
demand pick up again.
In contrast, some Member States have experienced decreasing disparities, at least
with regard to some indicators, such as regional unemployment rates. However,
this relative catching-up is usually the effect of stronger regions being hit even
harder by the crisis (eg. Belgium, Estonia, Lithuania, Sweden).
Lastly, there is evidence that patterns of regional disparities have become more
differentiated at the sub-regional level in some Member States (eg. Belgium, Czech
Republic).
7.2.3 Reduced public budgets
Regional development has also been affected by a drop in public revenues, while costs have
been increasing (eg. in the Czech Republic, Germany, Ireland). In Germany, this has
affected especially the budgets of local authorities suffering from a fall in corporate and
income tax at the same time as having to ensure welfare payments. A similar situation can
be found with respect to départements in France. In Bulgaria, the crisis has also had a
strong negative effect, especially concerning the budgets of larger municipalities. More
generally, public expenditure has suffered from restrictions in some countries (eg. Estonia,
Finland) or is expected to be affected in the near future (Austria, Greece), entailing lower
levels of public investment. The pressure on public budgets has also meant that some
public investment projects had to be delayed or cancelled (eg. in the Czech Republic).
As a result, regional disparities may become more acute in certain cases. In Germany, it is
feared that the introduction of tighter fiscal policies could have a relatively stronger
impact in the new Länder due to higher levels of public sector employment. In Hungary,
central funding has also been reduced, but the tasks allocated to the municipalities have
remained the same. As a result, municipalities have turned increasingly to their own
revenues, as well as EU funding, and other funding sources. In Poland, pressures on public
budgets have led to tensions between richer and poorer regions and conflicts over the
calculation of fiscal equalisation mechanisms. Regional inequalities in Finland are also
expected to increase further given the reduced ability of some municipalities to invest in
services and knowledge.
7.3 The effects of the crisis on the regional policy response
Most Member States have taken significant steps to tackle the crisis, although this has not
generally involved specific regional policy measures. For instance, dedicated government
packages with a focus on business support and labour market measures (eg. in Austria,
Cyprus, France, Netherlands, Slovakia) have not had a specific regional economic
development orientation.
European Policies Research Centre Euroreg 98

Economic & Social Cohesion in the Economic Policies of Member States: Final Report
7.3.1 General public investment
In many Member States, public investment has been increased or brought forward.
Examples include France, with a focus on the railway and higher education sectors, and the
Netherlands, where investment was targeted at education and knowledge, sustainability,
infrastructure and housing. In Portugal, additional funds were provided for school
infrastructure, urban regeneration, sustainable energy and ICTs. In Sweden, grants to
municipalities and counties have been increased in order to consolidate their financial
situation. Similarly, in France, the reimbursement of VAT payments by local authorities has
been brought forward in order to stimulate investment. In Spain, the lack of public funds,
especially at the local level, led to the introduction of a €8 billion fund for immediate
investment in new public works projects. Funding is distributed across the whole of Spain
and allocated to municipalities in relation to their population.
In most cases, there is no explicit regional orientation to public investments; however,
sectoral investment choices can have implicit regional effects. For instance, the increase in
public investment in construction in Cyprus has a spatial dimension insofar as many of the
projects are located in rural areas. A targeted approach has been taken in Italy where some
investment projects, such as the development of strategic infrastructures, have been
allocated to weaker regions. It appears, however, that government support programmes
may also have perverse effects and lead to an aggravation of disparities. In Portugal, for
instance, most public support to address the crisis was directed at the banking and financial
sectors, largely located in the capital city. In Poland, business support elements of the
government’s crisis response are also found to have an implicit spatial orientation,
favouring larger urban centres.
It needs to be noted that, as a consequence of the crisis, a number of Member States were
granted loans by the IMF (Greece, Hungary, Latvia, Romania), and in Poland an IMF
Flexible Credit Line Arrangement was approved which is intended to be treated as
precautionary (i.e. the Polish authorities do not intend to draw from it). Related to this,
but also in response to a considerable decrease in GDP, the European Commission has
targeted additional advances of €775 million (4 percent from ESF and 2 percent from the
Cohesion Fund) at five Member States under the June 2010 simplification measures
(Estonia, Hungary, Latvia, Lithuania, Romania).
7.3.2 Implementation of existing regional policy instruments
Looking at regional policy more specifically, many Member States have not changed their
approach to regional development policies (eg. Austria, Greece, Hungary, Lithuania,
Netherlands). In these countries, regional policy is seen as a longer-term structural policy
rather than a tool for crisis management. In a number of cases, authorities have improved
the accessibility of regional policy funding (Belgium, Denmark, France, Germany,
Portugal, Spain, United Kingdom). Implementation rules have been simplified or the range
of potential beneficiaries extended. In Belgium and France, award conditions have been
relaxed for some regional aid schemes. In France, this included a relaxation of eligibility
requirements for the PAT regional development grant (prime d’aménagement du territoire)
and the introduction of tax exemptions in newly-designated labour market areas. In the
European Policies Research Centre Euroreg 99

Economic & Social Cohesion in the Economic Policies of Member States: Final Report
United Kingdom, amendments were made to aid eligibility criteria to make support more
widely available, including increased availability of SME support outside assisted areas. In
Portugal, eligibility rules have been relaxed under the various domestic regulations
governing Cohesion policy. Examples are advance payments to firms and efforts to speed up
project approval. The Regional Investment Grant in Spain has also been adjusted; in order
to give more weight to stable job creation, higher rates of award apply to projects that
generate employment. Finally, in Denmark, some Regional Growth Fora have launched new
financial engineering measures.
Nevertheless, in a number of cases, there has been a temporary reduction in the demand
for certain regional investment support; however, this is in line with a decline in
investment more generally (Austria, United Kingdom). In contrast, funding in Hungary has
been insufficient in a situation of growing demand. Bottlenecks linked to a lack of co-
financing have also caused problems with project implementation, such as in the case of
the municipalities in Finland and for innovative projects in the Netherlands.
In a context of budgetary pressures, funding for regional policy has been cut in several
countries (eg. Italy, Ireland, Estonia, Romania, United Kingdom). In Italy, the budget of the
‘Fund for the Underutilised Areas’ was reduced from €63 million to €53 million for the
2007-13 period. This has entailed a concentration of resources on objectives deemed a
priority for the re-launch of the Italian economy. In Ireland, expenditure as part of the
National Development Plan decreased by around 20 percent in 2009. These expenditure
cuts are expected to have a negative effect on the implementation structures for regional
policy since funding for Regional Development Agencies was reduced, and the government
is considering reallocating responsibilities and merging some organisations. In the case of
the United Kingdom, much of the current dismantling of the regional policy framework in
England is being framed within a context of reducing the UK’s budget deficit, involving a
freeze on elements of ‘Single Pot’ spending such as the main regional incentive scheme
with significant implications for ERDF spending under the English programmes. In Wales,
efforts to accelerate economic recovery have included a reallocation of spending under the
main regional incentive scheme (SIF) away from direct business support towards
infrastructure. In both cases, the focus on paying grants and subsidies to companies is
significantly reduced.
In Estonia, cutbacks in the budget have resulted in lower financial resources for regional
development in the 2010 budget. Similarly, in Romania, the crisis has had a considerable
impact on domestic funding sources needed for the implementation of EU Cohesion policy;
the Romanian Convergence Programme was amended, leading to a revision of objectives
and domestic funding contributions to Operational Programmes across the board. As a
result, there are concerns about absorption, and less developed regions have been
experiencing difficulties in securing project co-financing.
In other cases, regional policy instruments have been put on hold or suspended (eg.
Bulgaria, Ireland, Latvia). In Bulgaria, the economic crisis has led to a funding programme
targeted at specific areas being delayed. Originally scheduled for 2010, the scheme could
not be launched because the allocation of funds by the responsible ministry is still
outstanding. In Ireland, the regionally-oriented Gateway Innovation Fund has been
European Policies Research Centre Euroreg 100

Economic & Social Cohesion in the Economic Policies of Member States: Final Report
suspended. Although the Irish government has continued to emphasise the importance of
R&D, much of this type of investment is being delayed or deferred. In Latvia, the
government has suspended a number of Structural Funds activities that were dependent on
pre-financing from the state budget.
7.3.3 New regional policy instruments and bodies
In response to the crisis, several countries have introduced new regional policy instruments
or increased the funding for existing ones. In Germany, an additional €200 million was
allocated to the main German regional policy scheme, the ‘Joint Task for the Improvement
of the Regional Economic Structure’. These funds are being shared evenly between old and
new Länder, unlike mainstream funding, of which six-sevenths are targeted at the new
Länder. In addition, a business support scheme has been awarded an extra €0.9 billion in
2009-10; while it is aimed at the new Länder, firms in the old Länder are also eligible on a
temporary basis. A number of other countries have introduced new instruments that target
at the most affected regions:
In the Czech Republic, a small support programme for economically weak regions
was re-opened in 2010. Interventions under the programme are aimed at the
development of infrastructure to improve accessibility and the business
environment, the reduction of unemployment, and support for tourism
development.
In Slovenia, the most severely hit regions Pomurje and Bela krajina receive special
treatment in 2009 and 2010. A law on support for the Pomurje region was
introduced in late 2009, including a programme to foster regional competitiveness
in 2010–2015, employment incentives, tax relief for investments, as well as priority
treatment for programmes and projects in the region. There are also plans for a
similar programme for Bela krajina.
In France, the National Territorial Renewal Fund (FNRT) was created. It is targeted
at economically-weak areas which, so far, have not benefitted from regional policy
support.
An interesting approach has been taken in France and Sweden, where specific coordinators
have been nominated to oversee the policy response at the sub-national level. In France,
Commissaires à la reindustrialisation were deployed in ten of the worst-affected regions to
coordinate the policy response and ensure it retains momentum. In Sweden, the
government has appointed regional coordinators to report on developments and problems
and to identify cross-regional responses in specific sectors and industries. In addition, a
group of State Secretaries has been set up to facilitate national-regional dialogue.
7.4 Concluding points
To summarise, EU Member States can be divided into the following broad groupings
according to the impact the crisis has had on the implementation of regional policy:
European Policies Research Centre Euroreg 101

Economic & Social Cohesion in the Economic Policies of Member States: Final Report
European Policies Research Centre Euroreg 102
Little or no impact (Austria, Cyprus, Denmark, Finland, Greece, Hungary,
Lithuania, Luxembourg, Malta, Netherlands, Poland, Slovakia). This may be due to
the generally low impact of the crisis (eg. Denmark, Poland) or the explicit long-
term orientation of regional policy (eg. Austria).
More flexibility or funding for regional development policy:
o Increase in accessibility of regional policy funding (Belgium, France,
Germany, Portugal, Spain, United Kingdom). This relates mainly to
extensions of eligibility criteria and simplification measures.
o Additional funds and/or new instruments (Czech Republic, France,
Germany, Slovenia, Sweden), including targeted support at worst-off
regions as well as the introduction of spatially-targeted policy coordinators.
Less flexibility or funding for regional development policy:
o Budget cuts (Italy, Ireland, Estonia, Romania), both relating to domestic
instruments and Cohesion policy co-financing.
o Postponement or suspension of measures (Bulgaria, Ireland, Latvia) with
delays in funding or the withdrawal of instruments.
Looking at the longer-term impact of the crisis on the role of regional policy, negative
impacts on the priority given to cohesion objectives can be observed in some countries (eg.
Ireland, Romania, Slovenia). In Romania, the crisis is seen to have induced a shift in policy
from a focus on convergence and cohesion towards competitiveness. Similarly, in Slovenia,
economic factors have started to take precedence over social and territorial objectives. At
the same time, the importance of regional policy as a means to tackle the crisis has been
emphasised in Finland and in Hungary, the importance of social and employment-related
measures is expected to increase in the future.

Economic & Social Cohesion in the Economic Policies of Member States: Final Report
8. A TYPOLOGY OF NATIONAL APPROACHES TO COHESION
The final task under the terms of reference for this study is to draw up a ‘general typology’
of Member States’ approaches to attaining economic and social cohesion. There are many
pitfalls to this task and any classification is likely to be open to criticisms of arbitrariness or
oversimplification. Moreover, the very absence of a concrete definition of ‘cohesion’
compounds an analysis of how Member States seek to attain this objective. Nevertheless,
the detailed analysis on which this report is based shows that Member States take quite
diverse approaches to addressing economic, social and territorial disadvantages within their
borders. Moreover, the extent to which external benchmarks in levels of economic
development are perceived to be important also varies widely - is cohesion perceived in
relation to the national or the EU situation? Related, a key factor is the role of EU policies
in shaping objectives and expenditure, but also in the extent to which the burden of
cofinancing limits the scope for genuinely domestically-driven policies.
Any typology that seeks to group Member States according to their policy approaches is
likely to be controversial. Nevertheless, in spite of the very wide diversity of the economic
geographies of the Member States and their policy responses, it is possible to establish
groupings where there are arguably more commonalities than differences between
countries. This is the task of this final chapter.
Throughout the report, country groupings have been identified for different policy
dimensions. There are two important points to note about the basis for the typologies
presented here. First, the analysis is primarily qualitative and relies on the interpretation
and understanding of the research team of the comparative assessment of various policy
dimensions and of the country reports. Second, the typology is driven by only some of
elements of policy. These concern, in particular: the objectives of policy; the nature of the
national commitment to addressing internal disparities; the types of instrument and scale
of policy; and, to a more limited extent, the role of EU Cohesion policy in terms of funding
and impact on objectives. In addition, the nature and scale of regional disparities is an
important contextual element. Conversely, although the report identifies country groupings
in relation to the implementation of policy (Chapter 5) this has not been considered in
devising the typologies outlined below. This is largely because governance structures are
determined mainly by wider factors than regional development policy, namely,
constitutional and institutional arrangements. Similarly, the assessment of the impact of
the crisis on regional problems and policy (Chapter 7) has not been taken into account
either. This is justified by the fact that, at present, the longer-term effects of the crisis on
regional problems and policy are unknown.
Against this background, and notwithstanding the cautionary remarks above, five main
types of national policy approach to cohesion can be distinguished, as outlined below.
European Policies Research Centre Euroreg 103

Economic & Social Cohesion in the Economic Policies of Member States: Final Report
Type I: Prominent regional disparities – regional development policy emphasis
Key features A legal (even constitutional) commitment to reducing disparities; this commitment is translated into policy
geographically large countries; around or above average EU prosperity
prominent and acknowledged regional differences that are accepted as the principal focus of spatially-differentiated policies
tendency to operate few (but comparatively large scale) instruments
national policy objectives dominate, although national priorities may be cofinanced though EU cohesion policy and EU funding may have been significant historically
Member States Finland, Germany, Italy, Spain, Sweden
Comments Clearly these countries face quite different types of regional issue – remote sparsely-populated areas in the case of Finland and Sweden; economically less-developed areas in the case of Italy, Germany and Spain. Moreover, the role of EU Cohesion policy in shaping and financing national cohesion policies varies between Italy and Spain, where historically at least, EU policy has been significant in spending terms, and Finland and Sweden, where EU Cohesion policy spending, and influence, has been marginal. However, among the features that unite them are a clarity in the spatial focus of policy (well-defined areas of intervention) and a national consciousness of the need for intervention. Their inclusion in this group does not, however, mean that issues of regional competitiveness or national growth are unimportant.
Type II: Diverse regional differences - regional competitiveness policy emphasis
Key features Diverse regional concerns – old industrial, rural, urban, etc.
national prosperity above EU average (but some regions significantly below)
emphasis on regional competitiveness as contributor to national growth
limited prominence given to addressing regional disadvantage, although some targeted measures remain
many low key instruments addressing diverse objectives
national policy objectives dominate; EU cohesion funding is limited and generally used to co-fund national priorities rather than influence them.
Member States Belgium, France, United Kingdom
Comments There is, in effect no Belgian policy in the field of cohesion (national social protection systems aside), the Flanders and Walloon regions being responsible for the conduct of economic development policies. Taking the two regions together, as in France and the United, policy comprises a mix of instruments, some targeted at specific areas of need, some available throughout the country/region. In all three countries, regional problems have tended to be quite persistent, with the same areas targeted through several generations of policy. These are predominantly, but not exclusively, old industrial areas.
European Policies Research Centre Euroreg 104

Economic & Social Cohesion in the Economic Policies of Member States: Final Report
Type III: Limited regional disparities – national competitiveness policy emphasis
Key features Limited regional disparities
geographically small, but prosperous – significantly above EU average
priority given to maintaining or enhancing national competitiveness, Cohesion policy interpreted in a “Lisbonised” sense
emphasis on social cohesion reflected in high level of social protection
economic development policies characterised by broad, but low-key, support to the business environment
limited role of EU cohesion policy both in funding and influence on objectives; tends to top-up existing national priorities, not set them.
Member States Austria, Denmark, Luxembourg, the Netherlands
Comments There are measures to address particular regional situations (the peripheral regions of Denmark, old industrial areas of Luxembourg, the north of the Netherlands, Burgenland and mountainous regions of Austria) but these are not viewed as serious regional problems. The emphasis is instead on a high level of social protection and the promotion of national competitiveness mainly through support for innovation and favourable business environment.
Type IV: Diverse geographical issues - national advancement policy emphasis
Key features Significant geographical issues either in relation to the EU (insularity/peripherality) or internally (mountain areas, islands, other isolated regions, capital city dominance)
geographically smaller Member States, generally just under EU average prosperity
promoting national competitiveness dominates policy
internal disparities may be significant and receive some domestic attention
EU cohesion policy either is or historically has been very important both in financing terms and in influencing national strategic objectives, but it does not necessarily dominate the national agenda or priorities.
Member States Cyprus, Greece, Ireland, Malta, Portugal, Slovenia
Comments This grouping comprises both EU15 and EU12 Member States. Although in many respects diverse, they are linked in geographical terms (see above) and in the role played by EU Cohesion policy. In the current period, Cohesion policy funding is broadly comparable in Malta, Portugal, Slovenia and Greece (as a percentage of GDP); in Cyprus it is significantly less and in Ireland much lower again, although historically it has been very important. However, EU Cohesion policy has had a significant influence on policy in all these countries, while not completely overshadowing national initiatives.
European Policies Research Centre Euroreg 105

Economic & Social Cohesion in the Economic Policies of Member States: Final Report
European Policies Research Centre Euroreg 106
Type V: Widening regional disparities – national development policy emphasis
Key features National growth accompanied by widening regional disparities –growth essentially driven by development of metropolitan (most often capital) city regions
Less prosperous Member States; recent past dominated by economic and industrial restructuring and institutional reforms
Internal disparities receive attention in strategic documents, but in practice less prosperous regions often receive less than the metropolitan centres
The need to reshape patterns of growth from low-cost economies to more innovation driven models is growing in importance
National cofinancing of EU cohesion policy is significant (sometimes creating a heavy burden on national finances) and leaves limited scope for independent domestic initiatives
Policy agenda is dominated by EU Cohesion policy; significant both in terms of impact on objectives and financing.
Member States Bulgaria, Czech Republic, Estonia, Hungary, Latvia, Lithuania, Poland, Romania, Slovakia
Comments These countries are in many respects very diverse, with significant difference in levels of economic development between, for example, Bulgaria, Romania, Latvia and Lithuania, on the one hand, and the Czech Republic on the other. However, and particularly in contrast with Types I to IV, they share both a similar economic heritage and development trajectory and other traits. Moreover, although there is a degree of national consciousness of internal regional disparities, this is scarcely carried through into policy practice where the agenda is dominated by EU Cohesion policy; at the same time, the scope to operate truly domestic policies is constrained by cofinancing commitments.

Economic & Social Cohesion in the Economic Policies of Member States: Final Report
9. CONCLUSIONS
The purpose of this study is to identify which Member State economic policies are of most
relevance to the EU objectives of economic, social and territorial cohesion, and to describe
how such policies are designed and implemented with a view to determining how and to
what extent they contribute to the achievement of these objectives. The aim of this
concluding chapter is to draw out some of the key themes that emerge from the analysis of
the country reports provided by the national experts (which are synthesised in Part II of this
report) and from the comparative discussion in the main report.
An issue fundamental to the study is that there is no concrete and consistent definition of
the concept of ‘cohesion’. The different dimensions of cohesion (economic, social,
territorial) have been the subject of Commission studies and academic and other analysis,
but there is no agreement on definitions that can be operationalised and the boundaries
between the dimensions are permeable. A key issue is that of benchmarks – cohesion in
relation to what?
More recently a new approach to cohesion has been proposed, related to functional
cohesion. In brief, it indicates that economic development and social progress can take
place when relations between economic entities (economic cohesion), people and social
organisations (social cohesion) are smooth and the transaction costs are low, which calls for
territorial cohesion, ie. such an arrangement of space which makes the economic and social
cohesion possible.
Interestingly, cohesion is not generally part of the domestic policy vocabulary, except in
relation to the cofinancing of EU Cohesion policy. Nevertheless, various types of policy
objective are pursued ‘in the name of’ cohesion. These are essentially fourfold:
the reduction of regional inequalities, where the key consideration is to mitigate
disparities between regions
regional competitiveness, where the principal aim is the exploitation of regional
potential as a contributor to national growth
national competitiveness, where the main focus is on maintaining and enhancing the
competitive advantage of the national economy
national development, where the overriding objective, at least in the short-term, is to
narrow the development gap between national prosperity and the EU average.
Running alongside these, many countries also address specific geographical disadvantages,
notably remoteness and insularity, but also upland and mountainous regions.
Just as ‘cohesion’ lacks a concrete definition, so too does the scope of expenditure on
cohesion. Nevertheless, three key points emerge from the analysis of public spending:
European Policies Research Centre Euroreg 107

Economic & Social Cohesion in the Economic Policies of Member States: Final Report
expenditure on economic development generally appears higher as a percentage of
GDP in poorer countries than in richer ones; this ceases to be the case when the EU
contribution to economic development spending is discounted
spending on social protection is the single largest item of public spending and
dwarfs spend on economic development; it varies widely between countries, but
even in PPS per head, more prosperous countries spend more than less prosperous
ones.
there are wide differences in the scale of national cofinancing of EU cohesion
policy as a percentage of GDP; this is closely correlated with prosperity – poorer
countries commit a significantly greater proportion of GDP to cofinancing Cohesion
policy than do richer countries. Not only may this constitute a significant drain on
national spending, but it also significantly reduces the scope for a genuinely
domestic regional policy.
The main national economic policies aimed at promoting economic and social cohesion
are three-fold: narrow regional policies, often targeted at designated aid areas or locations
with specific characteristics; broader policies for territorial development which, while
generally available across all regions, take a region-specific approach, often via regional
strategies and programmes; and those sectoral policies which have an explicit or implicit
economic cohesion dimension.
The implementation of policy varies considerably across EU Member States in line with the
distribution of competences and resources at different levels. Countries’ approaches can be
placed on a continuum from the quasi-absence of the central state in regional policy-
making, to an oversight role of a central ministry over the actions of relatively independent
regions, to important coordination and budgetary powers retained by the central level, to a
predominance of the central state over sub-national entities which exist mostly for planning
purposes. However, the mapping of countries is not always clear-cut, and there are
elements in some of the more regionalised or federal Member States which reflect quite
strong historical commitments by the central state to regional development issues.
Moreover, positions of the Member States on this continuum are not stable with on-going
decentralisation and regionalisation processes in a number of countries. Vertical
coordination is essential in the different institutional arrangement, although it is less of an
issue in centralised unitary systems. There are increasing efforts to ensure the coherence of
national and regional-level funding and priorities, sometimes also including sectoral funding
commitments, through national-regional contracts or co-financing arrangements. Progress
has also been made with respect to institutional coordination arrangements, including in
some of the EU12.
Regarding the role of EU cohesion policy, the extent of EU influence over the objectives
of policy is variable. In general, Member States reinterpret EU Cohesion policy according to
their own needs and policies, and spend the financial resources obtained under this
framework according to their own choices. Even the less-developed countries that receive
the highest sums under the Convergence objective seem to follow their own preferences in
specifying the strategic choices; in several cases the ‘convergence’ orientation of policy is
European Policies Research Centre Euroreg 108

Economic & Social Cohesion in the Economic Policies of Member States: Final Report
more nominal than real. Institutional change is one of the most visible factors of ‘value
added’ of Cohesion policy, especially in the EU12. There is a growing role for strategic
thinking, greater transparency of public procurement and the emergence of culture and
practice of evaluation – these are the most important institutional and organisational
results of the membership and adoption of procedures and principles of the European
Union.
The impact of the crisis on regional policy has been variable. In some countries, there
has been little or no impact. Others have increased funding for regional policy instruments
or the flexibility in implementation. Elsewhere there may even have been a reduction in
funding or a suspension/postponement of implementation. Looking at the longer-term
impact of the crisis on the role of regional policy, negative effects on the priority given to
cohesion objectives can be observed in some countries, while in others the crisis is seen to
have induced a policy shift from a focus on convergence and cohesion towards
competitiveness, and economic factors have started to take precedence over social and
territorial objectives. On the other hand, the importance of regional policy as a means to
tackle the crisis has been emphasised in some Member States, where the importance of
social and employment-related measures is expected to increase in the future. EU Cohesion
policy has had varied importance during the crisis. Only in countries which receive
substantial resources under this policy can a positive impact on the financial situation be
seen; however, until now, this is only on the demand side, since the longer-term effects are
unclear. In few cases the internal financial difficulties have limited the use of the
Structural Funds and the Cohesion fund, since the capacity to co-finance was reduced.
A key task of the report was to devise a typology of Member State approaches to Cohesion.
The typology presented in this report is driven by several dimensions of policy, in
particular: the objectives of policy; the nature of the national commitment to addressing
internal disparities; the types of instrument and scale of policy; and, to a more limited
extent, the role of EU Cohesion policy in terms of funding and impact on objectives. In
addition, the nature and scale of regional disparities is an important contextual element.
Any typology that seeks to group Member States according to their policy approaches is
likely to be controversial. Nevertheless, and in spite of the very wide diversity of the
economic geographies of the Member States and their policy responses, it is possible to
establish groupings where there are arguably more commonalities than differences between
countries. Against this background, five main types of national policy approach to cohesion
can be distinguished, as outlined below:
Type I: Prominent regional disparities – regional development policy emphasis
Type II: Diverse regional differences - regional competitiveness policy emphasis
Type III: Limited regional disparities – national competitiveness policy emphasis
Type IV: Diverse geographical issues - national advancement policy emphasis
Type V: Widening regional disparities – national development policy emphasis
European Policies Research Centre Euroreg 109

Economic & Social Cohesion in the Economic Policies of Member States: Final Report
European Policies Research Centre Euroreg 110
In most countries, the competitiveness objective seems to prevail over the alleviation of
interregional differences. In the more prosperous countries this is achieved through direct
support for R&D structures and technology advancement. In the less developed ones – the
central and eastern European countries – national competitiveness is being enhanced by
directing large parts of EU funds to major cities (the ‘growth poles’) and major
infrastructure connecting them to other cities and the outside world. Although the EU12 are
supported under the Convergence objective, and they spend a great share of the funds on
infrastructure, there is growing consciousness that the current sources of their
competitiveness – relatively low costs of production – are being exploited, and that there is
a need to shift from the ‘low road’ of development to more ambitious factors, like
innovation and advanced technologies which might allow them to benefit from more
profitable sectors of economic specialisation and more stable competitive advantage. This
change in orientation towards the strategic goals of development will probably be stronger
in the next programming period, thus relating the policies in these countries to the ‘smart
growth’ principle of the Europe 2020 strategy.

Economic & Social Cohesion in the Economic Policies of Member States: Final Report
REFERENCES
Adams, J., Robinson, P. and Vigor, A. (2003) A new regional policy for the UK, Institute of
Public Policy Research, London.
Alexander, E.R. (1993) ‘Interorganizational Coordination: Theory and Practice’, Journal of
Planning Literature, 7(4), 328-343.
Ancien, D. (2005) ‘Local and regional development policy in France: Of changing conditions
and forms, and enduring state centrality’, Space and Polity, (93), December, 217-236.
Arts, W. and Gelissen, J. (2002) ‘Three worlds of welfare capitalism or more? A state-of-
the-art report’, Journal of European Social Policy, 12, pp137.
Assembly of European Regions (undated) Commission V “Infrastructure and regional
development”, Regions and Territories in Europe: The Regions’ View of the Territorial
Effects of European Policies, AER, Strasbourg.
Barca, F. (2009) An Agenda for a Reformed Cohesion Policy, A place-based approach to
meeting European Union challenges and expectations, Independent Report prepared at the
request of Danuta Hübner, Commissioner for Regional Policy.
Begg, I. et al (2003) The Impact of Member State policies on Cohesion, Final report to the
European Commission, at:
http://ec.europa.eu/regional_policy/sources/docgener/studies/pdf/3cr/impact_member.p
df
Bohle, D. (2007) The Great Transformation: Liberalization and Social Protection in Central
Eastern Europe, paper to ESRC second seminar (Re)distribution of Uncertainty, Warwick
Business School, University of Warwick, Coventry, 2 November 2007.
Bradley, J. (2006) ‘Evaluating the impact of European Union Cohesion policy in less-
developed countries and regions’, Regional Studies, 40(2), 189-200.
Cappellen, A., Castellacci, F., Fagerberg, J. and Verspagen, B. (2003) ‘The impact of EU
regional support on growth and convergence in the European Union’, Journal of Common
Market Studies, 41(4), pp621-44.
Cerami, A. (2006) Social Policy in Central and Eastern Europe: the Emergence of a New
Welfare Regime¸ LIT Verlag, Berlin.
Council of Europe (2000) Strategy for Social Cohesion, European Committee for Social
Cohesion, CDCS 43, Strasbourg.
Council of Europe (2005) Concerted development of social cohesion indicators -
Methodological guide, Council of Europe Publishing, Strasbourg.
CPB/SCB (2003) Social Europe, CPB and SCP, The Hague.
European Policies Research Centre Euroreg 111

Economic & Social Cohesion in the Economic Policies of Member States: Final Report
Cuadrado-Roura, J. R., Garrido-Yserte, R. and Marcos-Calvo, M. A. (2004) ‘Economic and
Social Cohesion in the EU: a critical approach’, ERSA conference paper ersa04p657,
European Regional Science Association.
Davies, S., Kah, S. and Woods, C. (2009) Regional dimensions of the financial and economic
crisis, EoRPA Paper 09/01, European Policies Research Centre, University of Strathclyde.
Davoudi, S. (2003) ‘Polycentricity in European Spatial Planning: From an Analytical Tool to a
Normative Agenda’, European Planning Studies, 11(8), 979-99.
De Michelis, N. and Monfort, P. (2008) ‘Some reflections concerning GDP, regional
convergence and European cohesion policy’, DG Regio, European Commission, Regional
Science Policy & Practice, 1(1).
Devos, C., Blomme, W., Boucké, T. and Staelraeve, S. (2005) The opportunities and limits
of regional policymaking: some critical remarks on the Belgian case, Paper to 45th Congress
of the European Regional Science Association, 23-17 August 2005, Amsterdam.
Dieleman, F.M. and Faludi, A. (Eds.) (1998) ‘Special Issue: Polynucleated Metropolitan
Regions in Northwest Europe’, European Planning Studies, 6(4).
Doucet, P. (2007) ‘Cohésion territoriale de l’Union européenne – La gestation ambiguë d’un
ambitieux projet politique’, Les Cahiers de l'Urbanisme, 64, 6-11.
Ederveen, S., de Groot, H. L. F. and Nahuis, R. (2002) Fertile soil for Structural Funds? A
panel data analysis of the conditional effectiveness of European cohesion policy, CPB
Discussion Paper, Netherlands Bureau for Economic Policy Analysis, The Hague.
Esping-Andersen, G. (1990) The Three worlds of Welfare Capitalism, Polity Press, Oxford.
European Commission (1996) First Cohesion Report, OOPEC, Luxembourg.
European Commission (1998) ‘Economic and Social Cohesion in the European Union: the
impact of Member States’ own policies’, Regional Development Studies, 29, OOPEC,
Luxembourg.
European Commission (2001) Second Report on Economic and Social Cohesion, available at
http://ec.europa.eu/regional_policy/sources/docoffic/official/reports/contentpdf_en.htm
European Commission (2004) Third Report on Economic and Social Cohesion, available at
http://ec.europa.eu/regional_policy/sources/docoffic/official/reports/cohesion3/cohesion
3_en.htm
European Commission (2005) Third Progress Report on Economic and Social Cohesion, at:
http://ec.europa.eu/regional_policy/sources/docoffic/official/reports/interim3_en.htm
European Commission (2006) Fourth Progress Report on Economic and Social Cohesion, at:
http://ec.europa.eu/regional_policy/sources/docoffic/official/reports/interim4_en.htm
European Policies Research Centre Euroreg 112

Economic & Social Cohesion in the Economic Policies of Member States: Final Report
European Commission (2007) Fourth Report on Economic and Social Cohesion, available at
http://ec.europa.eu/regional_policy/sources/docoffic/official/reports/cohesion4/index_e
n.htm
European Commission (2009) Territorial cohesion: unleashing the territorial potential,
Background document to the Conference on Cohesion Policy and Territorial Development:
Make Use of the Territorial Potential!, 10-11 December 2009, Kiruna, Sweden.
Eurostat (2007) Manual on sources and methods for the compilation of COFOG Statistics,
OOPEC, Luxembourg.
Eurostat (2009) Net expenditure on social protection benefits, Statistics in focus 102/2009.
Eurostat (2010) Combating poverty and social exclusion – a statistical portrait of the
European Union 2010, Publications Office of the European Union, Luxembourg.
Fabbrini, S. and Brunazzo, M. (2003) ‘Federalizing Italy: The Convergent Effects of
Europeanization and Domestic Mobilization’, Regional & Federal Studies, 13(1) 100-120.
Faludi, A. (2003) ‘Unfinished business: European spatial planning in the 2000s’, Town
Planning Review, 74(1), 121-40.
Faludi, A. (2004) ‘Territorial Cohesion: Old (French) Wine in New Bottles?’, Urban Studies,
41(7), 1349-65.
Faludi, A. (2006) 'From European spatial development to territorial cohesion policy',
Regional Studies, 40(6), 667-78.
Ferrera, M. (1996) ‘The Southern Model of Welfare in Social Europe’, Journal of European
Social Policy, 6(17).
Ferry, M. (2003) ‘Regional governance in the EU: a Comparative Assessment’, paper
presented at the EoRPA Regional Policy Research Consortium held at Ross Priory, October
2003.
Fothergill, S. (2005) ‘A New Regional Policy for Britain’, Regional Studies, 39(5), 659-667.
Fürst, D. (2006) ‘The role of experimental regionalism in rescaling the German State’,
European Planning Studies, 14(7), 923-938.
Gouvernements wallon et Communauté française (2010) Plan de simplification
administrative et d’e-Gouvernement 2010-2014, 25 février 2010.
Government of Finland (2009) Valtioneuvoston asetus alueiden kehittämisestä, 1651/2009,
29 December 2009.
Government of the Netherlands (2007) Coalition agreement between the parliamentary
parties of the Christian Democratic Alliance, Labour Party and Christian Union, 7 February
2007, see: http://www.government.nl/Government/Coalition_agreement#internelink9
European Policies Research Centre Euroreg 113

Economic & Social Cohesion in the Economic Policies of Member States: Final Report
Gren, J. (2002) ‘New regionalism and West Sweden: the factors of change in the
regionalism paradigm’, Regional & Federal Studies, 12(3), 79-101.
Gruppo tecnico centrale di accompagnamento al meccanismo degli obiettivi di servizio
(2010) Obiettivi di servizio. Verifica intermedia. Calcolo delle risorse premiali, dati al 30
novembre 2009, Decisione del Gruppo Tecnico Centrale di accompagnamento al
meccanismo degli Obiettivi di Servizio del 17 dicembre 2009.
Halkier, H. (2001) ‘Regional policy in transitions – a multi-level governance perspective on
the case of Denmark’, European Planning Studies, 9(3), 323-328.
Héritier, A. (2002) ‘New Modes of Governance in Europe: Policy Making Without
Legislating’, Political Science Series, Institute for Advanced Studies, Vienna p19.
Husson, C. (2002) L’Europe sans territoire: Essai sur le concept de cohésion territoriale,
Editions de l’aube/DATER, La Tour d’Aigues.
IBO (2004) Regionaal economisch beleid in de toekomst, IBO 2003-2004, nr5.
Indenrigs- og Socialministeriet (2009) “Regeringen arbejder for, at den danske befolkning
skal sikres gode og ligelige vilkår, uanset hvor i landet man bor”, Regionalpolitisk
redegørelse 2009 - Regeringens redegørelse til folketinget. København.
Ismeri Europa and Applica (2010) Distribution of Competences in Relation to Regional
Development Policies in the Member States of the European Union, final report to the
European Commission under contract No. 2008.CE.16.0.AT.040/2008.ce.16.cat.014.
Jenson, J. (1998) Mapping Social Cohesion: The State of Canadian Research, CPRN Study
No. F3, Canadian Policy Research Networks, Otawa, available at
http://www.cprn.org/documents/15723_en.pdf
Jenson, J. (2002) ‘Identifying the Links: Social Cohesion and Culture’, Canadian Journal of
Communication, 27(2), 141-151, available at
http://www.cjc-online.ca/index.php/journal/article/view/1289/1310
Jones, M., MacLeod, G. and Harrison, J. (2006) In what sense a regional world? Institutional
legacies, territorial fixes, network topologies. Paper presented at the 2006 Annual Meeting
of the Association of American Geographers, Regional Studies Association Session, ‘Whither
Regional Studies’, Chicago.
Jouen, M. (2008) ‘Territorial Cohesion: From theory to practice’, Notre Europe Policy
Paper, 35.
Keating, M. (2003) ‘The Invention of Regions: Political Restructuring and Territorial
Government in Western Europe’, in N. Brenner, B. Jessop, M. Jones and G. MacLeod (eds.)
State/Space: a Reader, pp. 256-77. London: Blackwell.
Kloosterman, R.C. and Musterd, S. (Eds.) (2001) ‘Special Issue: Polycentric Urban Regions’,
Urban Studies, 38(4).
European Policies Research Centre Euroreg 114
Economic & Social Cohesion in the Economic Policies of Member States: Final Report
Kunnunen, J. (2004) The Dynamics of EU Cohesion Policy: The Structural Funds as a Vector
of Change in Finland, OEUE Phase II Occasional Paper 3.4-09.04, Centre for European
Studies, University of Helsinki.
McDowell, M. (2007) Address by An Tánaiste, Michael McDowell TD at the launch of the
National Development Plan 2007-13, Dublin, 23 January 2007, available at
http://www.ndp.ie/docs/Address_by_An_Tánaiste_Michael_McDowell_T.D._at_the_Launch
_o/1901.htm
Ministerie van Algemene Zaken (2007) Samen werken samen leven, Beleidsprogramma
Kabinet Balkenende IV 2007-2011, June 2007, Section 6.2.
Mirwaldt, K., McMaster, I. and Bachtler, J. (2009) ‘Reconsidering Cohesion Policy: The
Contested Debate on Territorial Cohesion’, European Policy Research Papers, 66, European
Policies Research Centre , University of Strathclyde, Glasgow.
Molle, W. (2007) European Cohesion Policy, Routledge: London.
Monfort, P. (2009) ‘Territories with specific geographical features’, DG Regional Policy
Working Papers, 02/2009.
Näringsdepartementet (2009a) Arbetsprogram för Nationellt forum för regional
konkurrenskraft, entreprenörskap och sysselsättning 2009 – 2013, 11 April 2009.
Näringsdepartementet (2009b) Strategisk uppföljning av en nationell strategi för regional
konkurrenskraft, entreprenörskap och sysselsättning 2007–2013, 2009:69.
OECD, DEELSA/ELSA (1999) Social Indicators: A Proposed Framework and Structure, OECD,
Paris.
OECD (2006) The New Rural Paradigm: Policies and Governance, OECD Rural Policy Reviews,
Paris.
OECD (2007) Fiscal equalisation in OECD countries, OECD Network on Fiscal Relations Across
Levels of Government, Working Paper no.4, Paris.
OECD (2009) Society at a Glance 2009 - OECD Social Indicators, OECD, Paris.
Oscarsson, G. (2000) ‘The ‘Revolutions’ from a Swedish Perspective’, North, 11(5/6),
December.
Premier Ministre (2009) Schémas directeurs et concertation régionale sur l’aménagement
numérique du territoire, Circulaire, no 5412/SG, 31.07.2009.
Priemus, H. (2004) ‘Spatial Memorandum 2004: a Turning Point in the Netherlands' Spatial
Development Policy’, Tijdschrift voor Economische en Sociale Geografie, 95(5), 578-583.
Priemus, H., Zonneveld, W. & Faludi, A. (Eds) (2004) ‘Special Issue: Territorial Governance
in Polynuclear Urban Regions in Northwest Europe’, European Planning Studies, 12(3).
European Policies Research Centre Euroreg 115

Economic & Social Cohesion in the Economic Policies of Member States: Final Report
European Policies Research Centre Euroreg 116
Regeringen (2003) Den regionale vækststrategi. København: Regeringen.
Regeringens skrivelse (2010) Strategiskt tillväxtarbete för regional konkurrenskraft,
entreprenörskap och sysselsättning, 27 May 2010, p.11.
Rhodes, R.A.W. (1997) Understanding governance: Policy networks, governance and
accountability, Buckingham: Open University Press.
Rumford, C. (2000) European Cohesion? Contradictions in European Integration, MacMillan,
London.
Schön, P. (2005) ‘Territorial Cohesion in Europe?’, Planning Theory and Practice, 6(3), 389-
400.
Tosics, I. et al (2009) National Spatial Planning Policies and Governance Typology, ESPON
PLUREL deliverable report 2.2.1, December 2009.
Treasury, the Department of Trade and Industry and the Office of the Deputy Prime
Minister (2003) A Modern Regional Policy for the United Kingdom.
Vlaamse Overheid (2009) Een slagkrachtige Overheid in Vlaanderen, Vlaanderen in Actie,
Commissie Efficiënte en Effectieve Overheid.
Wishlade, F. (2009) Competition Policy and Regional Disparities in Europe: Does State Aid
Control thwart, distort or support Regional Policy?, Paper to the Seventh Euro-Latin Study
Network on Integration and Trade (ELSNIT): Trade and Regional Disparities, Kiel, Germany,
23-24 October 2009.
Yuill, D., Ferry, M. and Vironen, H. (2008) New Policy Frameworks, New Policy Approaches:
Recent Regional Policy Developments in the EU and Norway, EoRPA Paper 08/1, University
of Strathclyde, Glasgow.
Zapalski, E. (2010) Faut-il renforcer le rôle économique des régions?, published on
www.localtis.info on 20.04.2010.