THE REPORT - Coldwell Bankerblog.coldwellbankerluxury.com/wp-content/uploads/...Luxury-report... ·...
41
THE REPORT LUXURY IN REVIEW 2017
Transcript of THE REPORT - Coldwell Bankerblog.coldwellbankerluxury.com/wp-content/uploads/...Luxury-report... ·...

THE REPORTL U X U R Y I N R E V I E W 2 0 1 7

TABLE OF CONTENTS
L U X U R Y R E P O R T 2 0 1 8
Foreword
Luxury in Review: 2017
Significant Trends & Insights
Landmark Listings
The Ultra-High-Net-Worth: A Growing Market
Top Luxury Must-Haves
Power Markets
Luxury Buyer Markets to Watch
Luxury Seller Markets to Watch
Domestic Spotlight
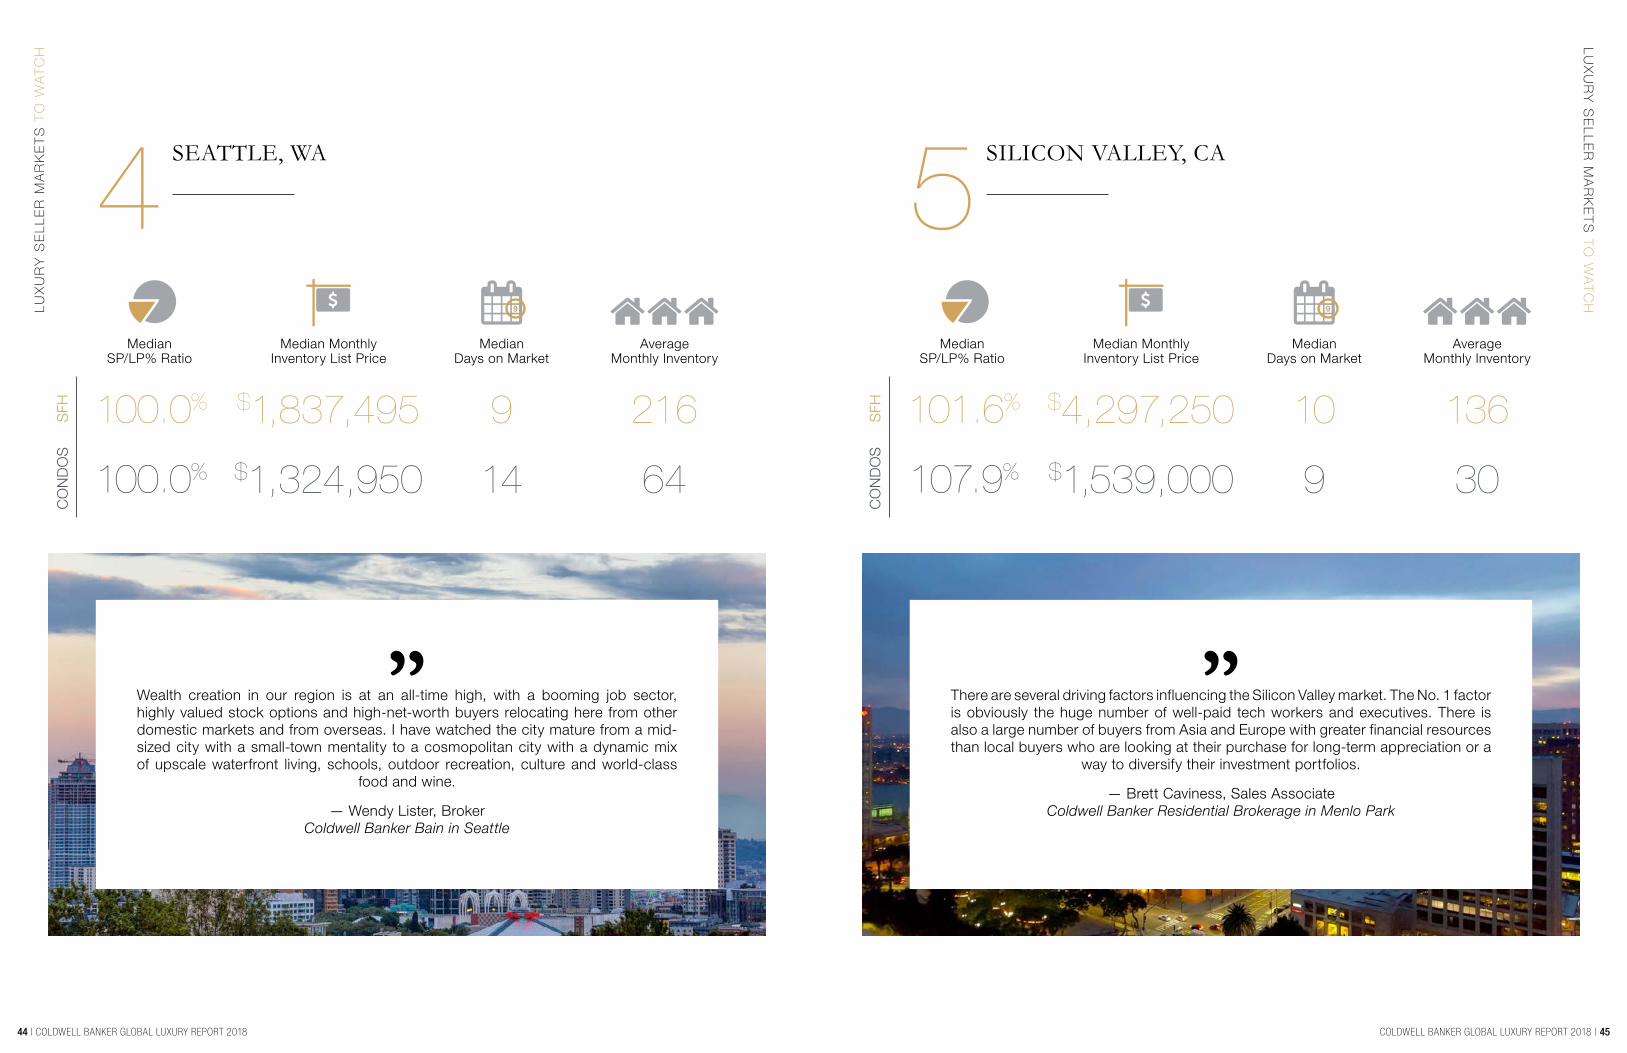
Resort Markets
Vertical Markets
Lifestyle Markets
Evolving Markets
International Spotlight
Top 5 Most Desirable Global Cities for Real Estate
The Index
Luxury by the Numbers
2017 Significant Listings
2017 Significant Sales
Disclaimers
3
4
5
14
16
22
24
34
40
46
48
52
56
60
64
65
71
72
75
76
78
The Coldwell Banker® brand has a tradition of observing the high-end residential real estate sector and providing our agents and clients with the intelligence needed to achieve their goals. That objective remains at the center of our 2017 review.
The overall fundamentals in luxury housing are strong. 2017 numbers remained consistent across many of the U.S. “Power Markets” we tracked (Page 24). New wealth continues to grow (Page 16). At the same time, mobility and a greater focus on lifestyle have created
new opportunities for nontraditional luxury centers like Seattle, Dallas and Sacramento. A shortage of inventory in areas like Silicon Valley and Brooklyn continues to push entry-level affluent buyers to outlying areas. Other high-priced markets may have peaked, as demand began to level off from the records of 2015–2016. Are these trends part of the “new normal,” indicative of a luxury marketplace that is maturing, differentiating and expanding? With over 3,000 offices in 47 countries and territories, the Coldwell Banker brand will be watching the market closely.
To coincide with the new identity for the Coldwell Banker Global Luxury®
program, the Luxury Market Report has a new name. Now simply known as “The Report,” it is a comprehensive guide to U.S. and international high-end property buying and selling.
The Report combines a powerful knowledge base provided by local market experts affiliated with the Coldwell Banker® brand and leading luxury insiders from The Institute for Luxury Home Marketing, Wealth-X, Unique Homes and others. It compiles an incredible amount of data from these sources, so Global Luxury Property Specialists can help
their clients make informed decisions. Knowing that the amount of inbound and outbound movement in major luxury markets is often high, we analyzed nearly 50 “Power Markets” in the U.S. from a variety of perspectives. Where are the buyer markets? Where are the seller markets? How is luxury defined in a resort market like Aspen, and how does it compare to a vertical market like Chicago or a lifestyle market like Malibu?
From annual trends to shifting demographics, The Report offers a comprehensive picture of fine real estate. Enjoy the new view of luxury.
FOREWORD
CHARLIE YOUNG | PRESIDENT AND CEO
CRAIG HOGAN | VICE PRESIDENT OF LUXURY

COLDWELL BANKER GLOBAL LUXURY REPORT 2018 | 54 | COLDWELL BANKER GLOBAL LUXURY REPORT 2018
LUXURY IN REVIEW: 2017
LU
XU
RY
IN R
EV
IEW
20
17
MEDIAN PRICE
MEDIAN DAYS ON MARKET
Single-Family Homes Condos
78
65
56
50
39 4145
5862
5350
6465 66
4143
37
44
31
40 4239 41 43
0
10
20
30
40
50
60
70
80
90
JAN FEB MAR APR MAY JUN JUL AUG SEP OCT NOV DEC
MEDIAN SP/LP%Single-Family Homes Condos
Single-Family Homes Condos
95.80%
96.94% 97.22%
97.20%
97.42%
97.41%
97.26%
97.03%
96.66%
96.80%
96.82%
96.47%
98.01%
97.54%
98.17%
98.13%
98.33%
97.97% 98.27%
97.85%
97.90%
98.11%
98.18%
98.30%
JAN FEB MAR APR MAY JUN JUL AUG SEP OCT NOV DEC
1,85
6
2,05
6
3,16
8
3,31
8
4,25
1
4,56
1
3,61
1
3,51
8
3,05
0
3,15
8
3,02
9
2,92
1
645
711
1,12
3
1,07
4
1,25
9
1,32
6
1,15
6
1,08
9
977
1,08
9
1,00
1
1,07
3
0
1,000
2,000
3,000
4,000
5,000
6,000
7,000
JAN FEB MAR APR MAY JUN JUL AUG SEP OCT NOV DEC
TOTAL HOMES SOLDSingle-Family Homes Condos
“Stable,” “consistent” and “solid” are the buzz words for the 2017 luxury residential market. Annual data* provided by The Institute for Luxury Home Marketing — a partner of the Coldwell Banker Global Luxury® program — shows that luxury home prices leveled off overall as inventory constraints eased last year and demand settled into a “new normal” after an explosive eight-year, post-recession housing boom.
The Institute for Luxury Home Marketing analyzed median sales prices, number of sales, median sales-price-to-list-price ratios, median days on market and price per square foot in the top 5% and 10% of nearly 50 U.S. luxury markets — dubbed “Power Markets” — to identify four key trends coming out of 2017. These trends may provide a preview of what’s ahead for high-end housing in 2018. (A detailed snapshot of all Power Markets starts on page 24 of this report).
SIGNIFICANT TRENDS & INSIGHTS
$1,548
,750
$1,576
,725
$1,556
,250
$1,637
,500
$1,515
,000
$1,585
,250
$1,537
,475
$1,530
,000
$1,562
,500
$1,562
,500
$1,558
,750
$1,598
,130
$999
,900
$951
,289
$980
,848
$907
,995
$872
,500
$924
,995
$947
,500
$884
,500
$966
,500
$963
,500
$920
,000
$881
,250
$0
$500,000
$1,000,000
$1,500,000
$2,000,000
$2,500,000
JAN FEB MAR APR MAY JUN JUL AUG SEP OCT NOV DEC

COLDWELL BANKER GLOBAL LUXURY REPORT 2018 | 76 | COLDWELL BANKER GLOBAL LUXURY REPORT 2018
LU
XU
RY
IN
RE
VIE
W 2
01
7 LU
XU
RY
IN R
EV
IEW
20
171
In many Power Markets, the record-breaking price increases of the last few years leveled off to more historically sustainable rates of growth in 2017. Inventory of single-family detached luxury product rose 30% last year, compared to 2016. However, the traditional build-up of new luxury listings followed expected historical patterns, with the highest inventory available in July and August and a gradual decrease as the year wound down.
The overall median luxury sales price of single-family detached homes decreased slightly from the previous time last year, but the price increased as much as 10% over the median luxury sales price of $1.5 million during 2017. The median luxury sales price of condos remained constant at approximately $700,000 throughout much of 2017. There was also a decrease of sold luxury single-family detached homes in 2017 as compared with 2016. However, the market trend of more sales occurring between the months of April and June remained consistent with historical trends. On the luxury condo side, the number of
sold units notched downward, but only slightly. Median days on market for single-family-detached homes also increased to 40–45 days, from 35–40 in 2016. One area of strength was the sales-price-to-list-price ratios for luxury single-family detached properties, which rose modestly to 98% in 2017 as compared with 97% in 2016. While that may not seem significant, the dollar amount of a 1% price difference can be quite meaningful to a purchaser of a million-dollar home. Diane Hartley, general manager for The Institute for Luxury Home Marketing, views these metrics as an indication that the high-end residential sector is settling into a “new normal.”
“The luxury real estate market led the general housing market out of the global recession, and during that explosive upswing, we saw some of the largest year-over-year price gains ever,” she says. “Now we are simply seeing a return to a more typical pricing and sales paradigm — especially for single-family detached properties.”
In America’s iconic luxury real estate epicenter, New York, the real estate story is a tale of two cities. Boroughs like Brooklyn continued to exhibit robust activity and high demand for much of 2017, while Manhattan saw lower price gains and sales at the end of 2017, thanks to rising inventory of high-priced properties and uncertainty about the Republican tax plan.
“Different things are happening in different areas,” explains Robert Krieger, director of sales for Coldwell Banker Reliable. “For example, if you look at the current absorption rate, Brooklyn has only 2.5 months’ supply, and Manhattan has 5 months’ supply. In the last few years, both Brooklyn and Manhattan have seen exponential increases in sale
THE NEW NORMAL
prices. If you buy in Brooklyn and you’re toward the Manhattan side, you’re going to pay $1,000 to $1,440 per square foot for a luxury condo. If you go into Manhattan, you may pay $2,000 per square foot.”
Now it appears that luxury demand in Manhattan may be leveling off as the market works through its high-end housing stock. Affluent sellers, who are accustomed to seeing the high sale price increases of the last few years, may eventually need to adjust expectations so that they are in line with more balanced market conditions. For the overall New York metro area, Krieger says that “the new normal” means low inventory.
Perhaps that is also why the Brooklyn luxury market is still expanding, as entry-level affluent buyers who have been priced out of Brooklyn are moving to outlying neighborhoods like Bushwick and Lefferts, and even beyond to places like Queens, Richmond Hill, Bay Ridge and Staten Island, according to Krieger. “They’re renovating to get the home they want.”
On the other side of the coast, Los Angeles has been one of the top luxury seller’s markets over the last few years, with record price increases and high demand. That was still true for the vast metropolitan region; however, certain areas are
showing different trends. The northern parts of Los Angeles, which include affluent suburbs such as Calabasas, still posted strong single-family detached numbers in the top 5% of the market: a lower price per square foot ($523), a 97% sales-price-to-list-price ratio and fairly balanced 64 median days on market. Meanwhile, L.A.’s beach cities — which span from Manhattan Beach to Malibu and boast some of the highest prices per square foot in the region — shifted into market conditions more consistent with a buyer’s market, as seen in longer days on market and a 94% sales-price-to-list-price ratio.
The Greater Los Angeles area — anchored by Beverly Hills, Hollywood and Downtown — shifted into more balanced fundamentals last year in higher priced areas with $1,084 per square foot, which played out in a slightly lower sales-price-to-list-price ratio of 96% and 63 days on market. For Steve Frankel, a sales associate affiliated with Coldwell Banker Residential Brokerage in Beverly Hills — one of the leading affluent ZIP codes for L.A. — the new normal has to do with the record high prices this region has posted over the last few years.
“The new normal for Los Angeles is just how expensive property has gotten,” he notes. “The luxury real estate market continues to be robust, and 2017 was a banner year. We had an 11% increase in homes that sold over $5 million from 2016 and a 12% increase in homes sold over $10 million. 2017 saw 51 homes sold on the Westside and Malibu for over $20 million. I anticipate a strong 2018, where ‘the new normal’ are homes commanding premium prices on the Westside of Los Angeles.”
“Because the city has a fixed amount of land mass, there is no expansion left. If you have to build, you are knocking down the old and building new. That’s why property prices in New York have continued to rise about 3%–5% steadily over the last 30 years. Buyers have to fight to get what they want.”

COLDWELL BANKER GLOBAL LUXURY REPORT 2018 | 98 | COLDWELL BANKER GLOBAL LUXURY REPORT 2018
Second-tier Power Markets — which we identified as a trend earlier last year — continued to make a strong showing in 2017. For example, Austin, Dallas, Atlanta and Montgomery County just outside of Washington, D.C. all had shorter median days on market in 2017 than in 2016. Other fast-selling non-traditional luxury marketplaces included Seattle, Silicon Valley, Raleigh-Durham and Fairfax County, also near D.C. While California has dominated the “most expensive” lists for several years, one surprise Golden State market was Sacramento, which posted a sales-price-to-list-price ratio of 104% in 2017. In another surprise, Denver saw median single-family detached home prices rise from $790,000 to $870,000 in 2017. Days on market also remained constant at around 25 to 30 days, and the sales-price-to-list-price ratio remained at 98.5%.
“This makes sense as high-net-worth money moves from more expensive cities to markets with lower luxury median home prices,” says Craig Hogan, vice president of luxury for Coldwell
Banker Real Estate LLC. “Investors are finding greater opportunity for returns. As mobility and accessibility increase, too, affluent buyers are not just making real estate decisions based on location anymore — lifestyle is becoming a bigger factor in their moves.”
Sacramento, just named to the top position of Sunset Magazine’s “20 Game-Changing Places to Live” list, is one city with a maturing luxury market. Long overshadowed by its Bay Area counterparts, the California capital recently shed its image as a sleepy government town, thanks to a nearly 10-year cultural boom with arts, entertainment, trend boutiques, hip cafes and farm-to-fork restaurants. The city’s growth is reflected in heightened luxury sales activity. For example, the sales-price-to-list-price ratio in 2017 was nearly 99% for the very top 5% of the single-family detached marketplace, with only 26 days on market. Could the unprecedented demand be attributed to affluent buyers coming from higher-cost areas who are looking to stretch their dollars in lower-cost Sacramento?
“Total sales for homes priced $1 million and up in the Sacramento, El Dorado and Placer County regions in 2017 was 456 — compared to 354 in 2016,” says Mike James, president of Coldwell Banker Residential Brokerage in the San Francisco Bay Area and Sacramento/Tahoe. “We had multiple reasons for buyers in the marketplace: local residents moving up or changing neighborhoods, out-of-area buyers such as Bay Area looking for a slower-paced lifestyle, more affordable living or a good place to raise a family. We have seen a transfer of doctors to our hospitals and people in pre- or early retirement relocating as well. Sacramento is also the farm-to-fork capital, and our metro area is growing with the new arena, soon to have MLS soccer.”
LU
XU
RY
IN
RE
VIE
W 2
01
7
2POWER MARKETS 2.0 James notes that the hottest luxury price range spanned from $1 million to $1.5 million, with $1.25 million being the sweet spot.
“We had a lot of cash purchases last year,” he acknowledged. “Our normal luxury areas did well; however, there has been increased activity in some more rural areas with acreage.”
St. Louis may be known as the Gateway to the West, but it could also be considered the gateway to luxury. The city continues to lure luxury value hunters, between the relatively affordable median price per square foot of $207, endless entertainment and dining opportunities scattered throughout the city (including the historical Central West End, the Grand Avenue Theater District and the Italian “Hill” neighborhood), the presence of professional baseball and hockey teams and civic attractions such as the world-class zoo and all the Forest Park museums. A friendly business environment has also attracted corporate citizens such as Edward Jones, Wells Fargo Advisors, Anheuser Busch, Nestlé Purina, Monsanto, Energizer and many other public and privately held companies.
In 2017, sales of St. Louis single-family detached homes in the top 5% market remained strong. Heightened demand resulted in only 18 median days on market, with a sales-price-to-list-price ratio of nearly 98%.
"The St. Louis luxury market, which ranges from $750,000 to $10 million, had a very solid 2017,” says Ryan. “Inventory was low with prices rising. Up to $1.2 million, it was very competitive, with multiple contracts on many transactions. The market from $1.2 million to $2.5 million was very active, including a lot of new construction. Over $2.5 million, the majority of activity was in the second half of the year, reflecting a steady increase in consumer confidence at this level of the market. In all cases, properties that sold were in good to very good condition, and location, as always, remained critical. I expect strong activity in our top tier markets, because there is tremendous value in St. Louis right now.”
MEDIAN SOLD PRICES PER MONTH |
LU
XU
RY
IN R
EV
IEW
20
17
$722
,250
$725
,000
$741
,400
$744
,950
$739
,000
$735
,000
$727
,000
$722
,000
$719
,444
$747
,500
$765
,000
$725
,000
$480
,000
$490
,000
$517
,000
$532
,450
$480
,000
$499
,450
$482
,000
$509
,999
$525
,915
$505
,000
$503
,050
$482
,500
$1,548
,750
$1,576
,725
$1,556
,250
$1,637
,500
$1,515
,000
$1,585
,250
$1,537
,475
$1,530
,000
$1,562
,500
$1,562
,500
$1,558
,750
$1,598
,130
$0
$500,000
$1,000,000
$1,500,000
$2,000,000
$2,500,000
JAN FEB MAR APR MAY JUN JUL AUG SEP OCT NOV DEC
Overall Market Price Sacramento St. Louis
“People who relocate to St. Louis say it is the best-kept secret in the country,” explains John Ryan, a broker with Coldwell Banker Gundaker who specializes in the St. Louis central corridor, including Clayton, Ladue, Frontenac, Huntleigh, Creve Coeur and Town and Country. “The luxury housing stock, both private and public school opportunities and country clubs are exceptional. All at very favorable prices compared to the coasts.”

COLDWELL BANKER GLOBAL LUXURY REPORT 2018 | 1110 | COLDWELL BANKER GLOBAL LUXURY REPORT 2018
3
Power Markets with strong tech centers also continued to demonstrate strength last year. Greater Seattle and Greater Tacoma, Portland, Raleigh-Durham, San Francisco and Silicon Valley all had high 2017 sales-price-to-list-price ratios of 99% to 100%. Seattle, in particular, soared. 2016 might have started well for the Emerald City, but luxury home sales doubled in 2017 and prices climbed by a median of $200,000, from $1.3 to $1.5 million. Days on market also decreased from 20 days to 13, while the sales-price-to-list-price ratio rose to nearly 100%. Austin, also a robust
tech hub, saw shorter days on market last year, as compared with 2016. Median prices here rose from $700,000 to about $900,000 in 2017. Days on market decreased 30%, from 90 to 60 days. The median sales-price-to-list-price ratio remained steady at 97%.
“It’s not a secret that the tech sector’s explosive growth has fueled the real estate booms in many cities,” says Hogan. “Austin has Dell. Raleigh has Cisco. Seattle has Microsoft and Amazon. Silicon Valley speaks for itself. All of these companies bring high-paying jobs to these markets, and they naturally lift up the luxury real estate sector.”
Silicon Valley has been one of the hottest markets for high-end housing in the last few years. Home to Google, Facebook, Apple and one of America’s most expensive ZIP codes (Atherton), the tech capital of the world continued to be the nation’s epicenter for high demand and sales activity. For 2017, the sale-price-to-list-price ratio was 100% for single-family detached homes in the top 5% of the market, with only 11 days on market and a median sold price of $4,312,500.
“There are several driving factors influencing the Silicon Valley market,” explains Brett Caviness,
TECH TITANS a sales associate affiliated with the Menlo Park office of Coldwell Banker Residential Brokerage. “The No. 1 factor is obviously the huge number of well-paid tech workers and executives. The tech industry also brings in a large number of buyers who are not originally from the U.S., and often these buyers are receiving financial assistance from their families in Asia or Europe, allowing them to out-bid local buyers with more limited down payment funds. Many of our buyers are looking not only for a place to live, but a way to diversify their significant investment portfolios by investing in Bay Area real estate. They are not as concerned with the idea they may be ‘overpaying’ right now. They are more focused on the long-term appreciation that their significant investment is likely to see in the future.”
The market has shown no signs of slowing down, either. For example, Caviness specifically points to Palo Alto, one of the most expensive cities in Silicon Valley, where the average sales price is $3.6 million.
“Palo Alto saw appreciation in average sales price by about 5% from the beginning of 2017 to the latter half of the year,” he says. “Other cities saw even more significant gains, with Menlo Park increasing by about 12%, and Santa Clara increasing by 16%, just from the first half to the second half of 2017. With supply continuing to plummet and no prospects of a slowing market, we’ve seen buyers willing to pay a premium for their slice of the Silicon Valley pie.”
Further up the Pacific coastline, Seattle is another
booming tech city. The Emerald City was the fastest-growing big city in the country last year, according to the U.S. Census Bureau, as it posted net gain of nearly 21,000 people from July 1, 2015, to July 1, 2016. An economic boom driven by Microsoft and Amazon (the company alone has brought 40,000 jobs to the city), combined with an influx of wealthy Asian buyers settling down in affluent Seattle suburbs like West Bellevue and Medina, has led to record high-end sales activity over the last few years. 2017 was no exception. The Seattle metro area saw its median sale price for single-family detached homes hit $1,845,000 in the top 5% of the market. Like Silicon Valley, the sale-price-to-list-price ratio was 100% and the median days on market was just 11.
“Wealth creation in our region is at an all-time high, with a booming job sector, highly valued stock options and high-net-worth buyers relocating here from other domestic markets and from overseas,” notes Wendy Lister, a broker with Coldwell Banker Bain who has watched the city mature from a mid-sized city with a small town mentality to a cosmopolitan city with a dynamic mix of upscale waterfront living, schools, outdoor recreation, culture and world-class food and wine. “In 2017, single-family detached homes over $1 million shot up 47% compared with the previous year. 2017 sales volume of $1 million homes also rose 46% over 2016. Meanwhile, average days on market actually decreased by 18% from 2016 to 2017. It used to be that a $20 million property listing here would make people gasp — now it doesn’t anymore.”
LU
XU
RY
IN
RE
VIE
W 2
01
7 LU
XU
RY
IN R
EV
IEW
20
17
$1,062
,500
$1,150
,000
$1,005
,000
$1,050
,000
$1,030
,000
$1,055
,000
$1,122
,500
$1,050
,000
$1,112
,500
$1,112
,000
$1,200
,000
$1,042
,000$1
,572
,500
$1,467
,500
$1,537
,500
$1,600
,000
$1,515
,000
$1,547
,500
$1,574
,950
$1,510
,000
$1,497
,000
$1,490
,000
$1,565
,000
$1,510
,000
$3,615
,000
$3,275
,000
$3,325
,000
$3,512
,500
$3,513
,444
$3,400
,000
$3,340
,000
$3,600
,000
$3,437
,500
$3,275
,000
$3,500
,000
$3,487
,500
$1,548,750 $1,576,725 $1,556,250 $1,637,500$1,515,000 $1,585,250 $1,537,475 $1,530,000 $1,562,500 $1,562,500 $1,558,750 $1,598,130
$4,200
,000
$3,380
,000
$4,100
,000
$3,937
,500
$3,844
,000
$3,550
,000
$3,380
,000
$3,200
,000
$3,400
,000
$3,800
,000
$3,547
,500
$3,675
,000
$680
,000
$667
,330
$664
,500
$660
,000
$666
,873
$667
,211
$656
,000
$680
,000
$650
,000
$653
,000
$695
,500
$660
,000
$0
$500,000
$1,000,000
$1,500,000
$2,000,000
$2,500,000
$3,000,000
$3,500,000
$4,000,000
JAN FEB MAR APR MAY JUN JUL AUG SEP OCT NOV DEC
MEDIAN SOLD PRICES PER MONTH | Overall Market Price Austin Seattle Silicon Valley San Francisco Raleigh-Durham

COLDWELL BANKER GLOBAL LUXURY REPORT 2018 | 1312 | COLDWELL BANKER GLOBAL LUXURY REPORT 2018
LU
XU
RY
IN
RE
VIE
W 2
01
7 LU
XU
RY
IN R
EV
IEW
20
174ATTACHED APPEAL
The luxury condo market appears to be having a moment. Median home prices for high-end condos remained constant at $850,000 — not only year-to-year, but throughout 2017. As previously reported, the number of sold luxury condominiums in 2017 only decreased slightly from 2016 — while new listings jumped 20%, comparatively. Average days on market decreased slightly from 35 to 33 in 2017. Significant luxury median markets with shorter days on market than in 2016 were Austin, Boston, Boulder, Denver, Sacramento, St. Louis and Portland. Fast-selling markets included Dallas, Montgomery County, Seattle, Silicon Valley, San Francisco, Raleigh-Durham and Nashville.
“This was an interesting development for us to see, since the high-net-worth money has trended toward single-family detached properties over the last few years,” says Hogan. “We may regard the luxury condo activity as a reflection of where the investment money is going. Now that investors and speculators are not expecting to see large investment gains in the single-family detached
segment, are they moving to find opportunity in the luxury townhouse and condo market?”
Washington, D.C., is in the midst of a major luxury condo sales boom. A lack of good-quality inventory last year led to multiple offer situations and higher prices in desirable areas such as Northwest D.C. — which includes Georgetown, the Westend, Dupont and Logan Circles — an area of prime real estate that extends to the west and north of the White House. In the overall D.C. area, the median sales price for the top 5% of the attached market hit $1,747,500 at $610 per square foot in 2017, with a nearly 99% sales-price-to-list-price ratio and only 12 days on market. That’s a far cry from the D.C. luxury condo market of a few years ago.
“A two to three-bedroom luxury condo in D.C. may cost anywhere between $1 million and $1.5 million today — compared to $850,000 to $900,000 in 2014,” says James Braeu, branch vice president of Coldwell Banker Residential Brokerage in Dupont-Logan. “Back then, people were saying, ‘Who would pay a million for a condo?’ But now they’re doing it. The most remarkable change we saw last year was that prices were increasing so quickly due to lack of inventory. Realtors who are representing buyers are frustrated. Buyers could lose out on one home, and by the time they are ready for the next transaction, they need to increase their price range.”
In some respects, Northwest D.C. has always had a robust market for single-family homes, given the fact that the majority of properties are historic row houses found in neighborhoods like Georgetown, or pre-recession-built condos and lofts found in edgier parts of town like Adams Morgan, U Street and Chinatown. However, developers have not yet responded to the latest real estate cycle with
enough high-rise luxury product to satisfy demand. Instead, says Braeu, they’ve opted for the ease of building luxury rental properties as opposed to luxury residential properties. Not even the promise of a rapid near-sellout in the pre-sell phase — as Woodley Park's Wardman Tower discovered when it debuted its 32 luxury condo residences, priced between $2.7 million and $9 million. Despite being among the most expensive condos in the city, affluent buyers didn’t even flinch.
“The summer was better than expected,” says Braeu. “Fall came, and buyers kind of shrugged. By the time winter rolled around, they were back and willing to pay the price for the home they wanted. Inventory was still selling off.”
Denver also posted strong condo numbers for the top 5% of the market in 2017. The median price for a condo in the top 5% hit $780,000 at $316 per square foot, with 26 days on market and a nearly 99% sale-price-to-list-price ratio. As in D.C., a shortage of quality inventory continued to drive up prices.
Population growth has only intensified the low inventory situation in the Mile High City. Denver has been among America’s fastest-growing cities in recent years and was announced as being one of 20 U.S. cities on the shortlist for Amazon’s second
full-sized headquarters — which could bring $5 billion and 50,000 employees to the city. Adds Risen: “Colorado has seen tremendous population growth over the last few years, with some reports showing annual growth of over 100,000 new residents annually, and most of the population increase is in the Denver metro area. Average rents for a two-bedroom, one-bath downtown are over $1,900 a month, and many would-be tenants are opting to buy instead, to fix a monthly housing expense.” The housing shortage may not last forever, however. After Colorado Governor John Hickenlooper signed a construction defects reform bill into law, “at least 12 affordable condo developments with about 1,200 new units are about to be built or are currently being built in Denver. This may help alleviate some upward pricing trends over time,” says Risen.
Data based on closed and recorded transaction sides of homes sold in the top 10% of 45 luxury metro markets between the periods of 1/1/16 to 12/31/16 and 1/1/17 to 12/31/17, as gathered from the Multiple Listing Service (MLS) databases and from the Real Estate Board of New York (REBNY) and select cooperating brokerage firms, compiled by The Institute for Luxury Home Marketing.
$3,070
,000
$4,270
,000
$2,415
,000
$2,130
,000 $2,625
,000
$2,900
,000
$2,788
,880
$2,575
,000
$2,485
,000
$2,215
,000
$2,300
,000
$2,420
,000
$915
,000
$828
,550
$845
,000
$868
,250
$854
,500
$890
,000
$858
,600
$869
,000
$860
,500
$880
,000
$873
,500
$855
,000
$1,080
,000
$1,317
,500
$1,249
,000
$1,169
,425
$1,225
,000
$1,247
,500
$1,166
,630
$1,235
,000
$1,126
,000
$1,170
,000
$1,273
,000
$1,430
,000
$1,548
,750
$1,576
,725
$1,556
,250
$1,637
,500
$1,515
,000
$1,585
,250
$1,537
,475
$1,530
,000
$1,562
,500
$1,562
,500
$1,558
,750
$1,598
,130
$0
$500,000
$1,000,000
$1,500,000
$2,000,000
$2,500,000
$3,000,000
$3,500,000
$4,000,000
$4,500,000
JAN FEB MAR APR MAY JUN JUL AUG SEP OCT NOV DEC
“Inventory for this market segment continues to be light, even though the active inventory for condos in the $500,000+ range showed an increase of 7.4% through November 2017,” notes Kevin Risen, executive vice president for Coldwell Banker Residential Brokerage in Colorado.
MEDIAN SOLD PRICES PER MONTH | Overall Market Price Washington D.C. Denver Dallas

COLDWELL BANKER GLOBAL LUXURY REPORT 2018 | 1514 | COLDWELL BANKER GLOBAL LUXURY REPORT 2018
$ 3 8 0 M I L L I O NTHE BUBBLE PALACE | Cannes, France
$ 3 3 5 M I L L I O NTOUR ODÉON SKY PENTHOUSE | Monte Carlo, Monaco
$ 4 1 3 M I L L I O NVILLA LES CÈDRES | Saint-Jean-Cap-Ferrat, FranceLANDMARK
LISTINGS
The editors of Unique Homes publish an annual list of the most expensive real estate listings in the country each May, called "Ultimate Homes." Unique Homes has provided us with advanced data on U.S. listings set to be published in the May/June 2018 Ultimate Homes edition, as well as information on international listings.
ULTIMATE U.S. LISTINGS
ULTIMATE GLOBAL LISTINGS
LA
ND
MA
RK
LIS
TIN
GS
$ 5 0 0 M I L L I O NTHE ONE | Bel Air, CA
$ 3 5 0 M I L L I O NCHARTWELL | Bel Air, CA
$ 2 5 0 M I L L I O NBEL AIR MANSION | Bel Air, CA

COLDWELL BANKER GLOBAL LUXURY REPORT 2018 | 1716 | COLDWELL BANKER GLOBAL LUXURY REPORT 2018
THE ULTRA- HIGH-NET -WORTH:A GROWING MARKET
Increasing globalization of business, an unrelenting technological revolution and the continued expansion of supersonic air travel has led to the diversification of property ownership among ultra-high-net-worth individuals, defined as those with $30 million in assets or more, according to Wealth-X. These individuals increasingly own multiple properties; at least 50% own two homes, and approximately 10% are said to own five or more in multiple cities around the world. Several factors come into play in a luxury market said to be diversifying as the number of ultra-high-net-worth individuals continues to rise. Since a high percentage of them have attained their wealth through self-made means or global business endeavors, they are increasingly mobile. They are able to spend extended periods of time in different cities. Perhaps one or more of their children may study there. They are also contributors to many of the world’s emerging markets, and regard property as an important part of their wealth portfolio.
TH
E U
LTR
A-H
IGH
-NE
T-WO
RT
H: A
GR
OW
ING
MA
RK
ET
ULTRA WEALTHY GROWTH FORECAST
( U S $ T R I L L I O N S )
It is anticipated that the global ultra wealthy population and its share of the total asset marketplace will gradually increase by 2020. The Americas have the largest ultra wealthy population with 43%. However, of the three geographic regions reviewed, it is anticipated that the Asia-Pacific countries will see the largest increase in both the number of ultra wealthy individuals and in total net worth, adding an estimated $6.4 trillion (USD) to the global economy by 2020. Europe, the Middle East, Africa and the Americas will also record substantial increases in the worth of their richest citizens, with each region generating around 30% in ultra wealthy net worth growth between 2015 and 2020.
$12.7 $13.4 $14.2 $15.2 $16.4 $17.6
$9.5 $10.3 $11.0$12.1
$13.2$14.5
$7.8$8.7
$9.8$11.0
$12.5
$14.2
2015 2016 2017 2018 2019 2020
THE AMERICAS EUROPE, MIDDLE EAST & AFRICA ASIA-PACIFIC
$30.0$32.4
$34.9$38.2
$42.0$46.2
Source: Wealth-X.

COLDWELL BANKER GLOBAL LUXURY REPORT 2018 | 1918 | COLDWELL BANKER GLOBAL LUXURY REPORT 2018
RANKULTRA WEALTHY
POPULATION 2016% CHANGE
IN POPULATION
1 2 3 4 5 6 7 8 9
10
11
12
13
14
15
+9.0
+4.1
+17.5
+8.0
-14.6
+4.6
+7.6
+8.9
+16.6
+5.4
+6.0
-3.4
-0.5
+8.9
+8.6
8,350 7,650 6,040 4,600 3,630 3,440 3,110 2,570 2,390 2,330 2,310 2,290 2,170 2,090 2,020
RANK CITY RANK CITY
12345678
9101112131415
New York-Newark-Jersey City, NY-NJ-PAHong KongTokyo (Kanto MMA)Los Angeles-Long Beach-Anaheim, CA London - MetroParis - MetroChicago-Naperville-Elgin, IL-IN-WIWashington-Arlington-Alexandria, DC-VA-MD-WV
Osaka-Kyoto (Keihanshin MMA)Dallas-Fort Worth-Arlington, TXSan Francisco-Oakland-Hayward, CAHouston-The Woodlands-Sugar Land, TXSingaporeBoston-Cambridge-Newton, MA-NHPhiladelphia-Camden-Wilmington, PA-NJ-DE-MD
The ultra wealthy are clearly still located in the financial cities of the world, with 9 out of the 15 top locations in the U.S.
TOP LOCATIONS FOR THE ULTRA WEALTHY
TH
E U
LTR
A H
IGH
NE
T W
OR
TH
: A G
RO
WIN
G M
AR
KE
T
Source: Wealth-X.
By 2020, it is anticipated that the number of ultra wealthy individuals
will exceed 318,000, with their cumulative net worth rising 54%
to US$46.2 trillion.Source: Wealth-X.

COLDWELL BANKER GLOBAL LUXURY REPORT 2018 | 2120 | COLDWELL BANKER GLOBAL LUXURY REPORT 2018
TH
E U
LTR
A-H
IGH
-NE
T-W
OR
TH
: A
GR
OW
ING
MA
RK
ET
T R AV E L / H O S P I T A L I T Y
A C C E S S O R I E S
J E W E L R Y / WA T C H E S
F O O D
A U T O M O B I L E S
H O M E
P R I VA T E AV I A T I O N
B E A U T Y
A P PA R E L
A R T
W I N E S / S P I R I T S
Y A C H T S
US$45B
US$12B
US$25B
US$7B
US$15B
US$25B
US$8B
US$22B
US$40B
US$8B
US$23B
US$4B
Source: Wealth-X. Source: Wealth-X.
The distribution of the world’s ultra wealthy combined asset holdings in 2016 was estimated at US$30 trillion, with real estate and luxury assets accounting for 8.9%. Although the majority of their assets are invested in either business or publicly held companies, the sheer magnitude of their disposal cash assets shows the potential spending power of this group. This is significant insomuch as it shows that these individuals control their own decisions on how they choose to spend money, rather than being dictated to by up-and-down swings in the market.
ULTRA WEALTHY ASSET HOLDINGS
34.8%
35.1%
21.2%
8.9% Real Estate & Luxury Assets / US$2.7 Trillion
Cash / US$6.4 Trillion
Public Holdings / US$10.4 Trillion
Private Holdings / US$10.5 Trillion
ULTRA WEALTHY LUXURY SPENDING REACHES $234B IN 2016
TH
E U
LTR
A-H
IGH
-NE
T-WO
RT
H: A
GR
OW
ING
MA
RK
ET

COLDWELL BANKER GLOBAL LUXURY REPORT 2018 | 2322 | COLDWELL BANKER GLOBAL LUXURY REPORT 2018
LUXURY AMENITIES IN DEMAND
SMALLER PROPERTIESOstentatious displays of wealth are seeing a decline as today’s luxury buyers prefer smaller homes over the traditionally larger, luxurious masterpieces. Buyers are instead choosing to spend more money on amenity-rich spaces and sanctuaries that better suit their lifestyle, such as a private gym, IMAX theater or his-and-her master suites.
SMART HOME AUTOMATIONJust as buyers look for smartphones and cars, they want equally smart homes with the ability to control the temperature, security, entertainment
and more with the press of a button or the sound of their voice.
ECO-FRIENDLYConservation and sustainability are not just buzzwords anymore. Today’s buyers seek out solar panels and conservation systems that will help reduce their home’s carbon footprint.
CUSTOM DESIGN AND FEATURESImported, hand-painted, artisan: Buyers want to know the unique nature of all the materials and details so that they can share their home’s story with family and friends.
ENCLOSED SPACES FOR SPORTSEnclosed spaces for large-scale sports such as hockey rinks, basketball and tennis courts and more are in demand for active buyers.
STATEMENT CELLARSWine cellars have been a must-have for years. Now, requests are trending toward finer spaces such as dine-in cellars or glass-enclosed wine rooms that truly highlight the collection.
RESORT-STYLE POOLSInspired by their national and international travels, more buyers are looking for resort-style pools, sometimes multiple pools, in which they can entertain or unwind after a long day.
COLLECTION GARAGESLarge garages are increasingly popular, allowing homeowners to properly showcase their collection of fine automobiles and toys.
SHOWSTOPPING KITCHENSA grand kitchen has always been a favorite, though more buyers are looking for a space where top-of-the-line commercial grade appliances and fine finishes work to support the family chef in creating a fine dining experience.
OUTDOOR LIVINGBackyard retreats with built-in kitchens and BBQs, fire pits and outdoor TVs are in demand as they provide additional space to entertain and enjoy outdoor views.
TOP LUXURYMUST-HAVES
Statement Cellars
Custom Design and
Features
Collection Garages Kitchen Theater
Smaller Properties
Private Gym
Enclosed Spaces for Sports
Smart Home Automation
Eco-Friendly
Outdoor Living
Resort-Style Pool
Source: The Institute for Luxury Home Marketing
Jamie Beckwith Interiors/Kim Sargeant Photography
TO
P L
UX
UR
Y M
US
T-HA
VE
S

COLDWELL BANKER GLOBAL LUXURY REPORT 2018 | 2524 | COLDWELL BANKER GLOBAL LUXURY REPORT 2018
POWER MARKETS
PO
WE
R M
AR
KE
TS
The Coldwell Banker Global Luxury® program partnered with The Institute for Luxury Home Marketing to analyze median list prices, median sold prices, median sales-price-to-list-price ratios, median price per square foot, median days on market and the highest list and sold prices for 2017.
The average monthly inventory and average monthly solds were included to provide quantitative information on the sales ratio percentages, which allows for the determination of the individual status of each market. These parameters were included in the top 5% and 10% of the luxury markets for both single-family homes and condos, and are identified as “Power Markets*.”
A Power Market is where the wealthiest and most powerful players tend to own property. Typically, these areas are destinations in their own right, offering high-net-worth individuals a range of lifestyle opportunities, cultural experiences and educational opportunities. Other key indicators of “Power” status include airport accessibility, ease of doing business, a prestige brand presence and a housing stock that prioritizes privacy, views and exclusivity.
A COMPARISON OF LEADING U.S. LUXURY METROS

COLDWELL BANKER GLOBAL LUXURY REPORT 2018 | 2726 | COLDWELL BANKER GLOBAL LUXURY REPORT 2018
PO
WE
R M
AR
KE
TS
PO
WE
R M
AR
KE
TSSINGLE-FAMILY HOMES | TOP 5%
City State
Median Inventory List Price
Median Monthly
Sold Price
Median SP/LP Ratio
Median Price
Per SqFt
Median Days on Market
Highest List Price
Highest Sold Price
Total Sold Properties
2017
Average Monthly Inventory
Average Monthly
SoldSales Ratio Status
Aspen CO $9,976,250 $9,050,000 93.24% $1,689 300 $58,500,000 $30,000,000 69 136 6 4.23% Buyer’s
Atlanta GA $1,400,000 $1,248,230 96.33% $259 67 $15,800,000 $7,150,000 952 708 79 11.21% Buyer’s
Austin TX $1,625,000 $1,386,875 96.11% $356 56 $42,500,000 $21,794,000 583 293 49 16.58% Balanced
Boca Raton & Delray Beach FL $2,910,000 $2,742,343 91.67% $392 104 $29,950,000 $13,375,000 183 288 15 5.30% Buyer’s
Boston MA $3,995,000 $3,220,000 95.60% $1,006 71 $18,000,000 $13,000,000 48 24 4 18.18% Balanced
Boulder CO $2,295,000 $1,873,750 96.91% $465 84 $9,900,000 $6,700,000 174 109 15 13.30% Buyer’s
Brooklyn NY $2,011,000 $1,950,000 90.56% $628 163 $6,995,000 $5,850,000 31 39 3 7.23% Buyer’s
Chicago IL $1,799,500 $1,532,500 96.29% $349 132 $50,000,000 $7,500,000 467 265 39 14.69% Buyer’s
Dallas TX $1,798,450 $1,601,000 96.42% $311 50 $48,900,000 $9,225,000 424 203 35 17.41% Balanced
Denver CO $1,285,000 $1,099,950 97.87% $229 32 $20,000,000 $8,116,000 1,625 677 135 20.00% Balanced
Fairfax VA $1,897,000 $1,680,386 97.11% $359 61 $29,900,000 $12,500,000 403 303 34 11.08% Buyer’s
Honolulu HI $2,888,666 $2,464,250 95.71% $605 59 $35,000,000 $13,800,000 204 136 17 12.50% Buyer's
Houston TX $1,285,000 $1,175,026 96.57% $304 91 $19,500,000 $8,030,000 1,039 548 87 15.80% Balanced
LA: Beach Cities** CA $10,761,250 $9,662,500 93.76% $2,044 111 $85,000,000 $24,150,950 91 70 8 10.83% Buyer’s
LA: City** CA $5,998,000 $5,337,500 95.66% $1,084 63 $200,000,000 $41,000,000 402 177 34 18.93% Balanced
LA: The Valley** CA $2,649,000 $2,361,500 97.02% $512 68 $27,000,000 $18,200,000 589 213 49 23.04% Seller’s
Las Vegas NV $777,450 $682,500 96.98% $192 54 $30,000,000 $6,500,000 1,830 966 153 15.79% Balanced
Long Island NY $1,786,000 $1,559,750 94.49% $445 89 $55,000,000 $12,200,000 1,354 1222 113 9.23% Buyer’s
Manhattan NY $24,995,000 $20,000,000 97.00% $4,885 346 $80,000,000 $41,000,000 6 5 1 20.00% Balanced
Marin County CA $5,095,000 $4,575,000 97.76% $1,051 57 $25,000,000 $14,460,000 101 55 8 15.30% Balanced
Maui HI $3,997,500 $3,779,500 94.28% $969 191 $28,000,000 $16,000,000 43 98 4 3.66% Buyer’s
Miami FL $1,997,000 $1,549,750 91.92% $465 170 $65,000,000 $39,251,700 437 623 36 5.85% Buyer’s
Montgomery County MD $1,902,500 $1,750,000 97.27% $446 52 $23,000,000 $6,100,000 352 205 29 14.31% Buyer’s
City State
Median Inventory List Price
Median Monthly
Sold Price
Median SP/LP Ratio
Median Price
Per SqFt
Median Days on Market
Highest List Price
Highest Sold Price
Total Sold Properties
2017
Average Monthly Inventory
Average Monthly
SoldSales Ratio Status
Napa County CA $4,311,250 $3,389,294 95.78% $925 122 $33,150,000 $15,000,000 59 44 5 11.17% Buyer’s
Nashville TN $1,412,225 $1,323,375 97.22% $279 29 $17,999,999 $5,000,000 365 162 30 18.78% Balanced
Oakland County MI $975,000 $811,500 95.90% $233 33 $10,550,000 $4,359,993 788 538 66 12.21% Buyer’s
Orange County CA $3,762,500 $3,270,000 95.68% $867 69 $63,500,000 $39,999,999 988 634 82 12.99% Buyer’s
Palm Beach Towns FL $16,408,750 $15,216,838 81.76% $1,288 262 $165,000,000 $49,000,000 26 49 3 5.90% Buyer’s
Palm Springs & Palm Desert CA $2,495,000 $2,050,000 93.75% $480 83 $18,500,000 $8,700,000 230 238 19 8.05% Buyer’s
Park City UT $6,972,000 $6,637,500 94.94% $780 202 $25,000,000 $11,400,000 27 49 3 5.51% Buyer’s
Phoenix AZ $882,225 $786,250 97.29% $248 76 $16,850,000 $4,250,000 856 431 71 16.55% Balanced
Raleigh-Durham NC $825,000 $791,500 98.91% $187 31 $6,500,000 $2,951,000 1,026 545 86 15.69% Balanced
Sacramento CA $949,000 $868,250 98.73% $261 26 $8,700,000 $2,990,000 1,115 328 93 28.33% Seller’s
San Diego CA $2,862,500 $2,244,375 95.95% $612 57 $590,000,000 $12,000,000 1,236 684 103 15.06% Balanced
San Francisco CA $5,736,250 $4,971,250 99.41% $1,279 31 $29,500,000 $15,000,000 136 31 11 36.56% Seller’s
Santa Barbara CA $8,735,000 $6,292,500 92.29% $1,044 136 $85,000,000 $21,750,000 61 101 5 5.03% Buyer’s
Sarasota & Beaches FL $3,500,000 $2,996,500 92.61% $697 153 $26,500,000 $9,000,000 109 138 9 6.58% Buyer’s
Scottsdale AZ $2,850,000 $2,492,500 94.59% $406 124 $27,500,000 $15,650,000 323 455 27 5.92% Buyer’s
Seattle WA $2,200,000 $1,845,000 100.00% $528 11 $15,000,000 $8,850,000 427 146 36 24.37% Seller’s
Silicon Valley CA $5,605,250 $4,312,500 100.00% $1,335 11 $68,000,000 $25,000,000 441 92 37 39.95% Seller’s
St. Louis MO $749,350 $666,250 97.61% $207 18 $3,200,000 $3,050,000 446 170 37 21.86% Seller’s
Staten Island NY $1,450,000 $1,195,000 92.63% $303 116 $6,300,000 $4,235,000 68 85 6 6.67% Buyer’s
Stowe VT $1,900,000 $2,185,250 85.58% $326 353 $4,850,000 $2,950,000 4 7 1 14.29% Buyer’s
Tucson AZ $774,988 $677,375 96.97% $202 52 $12,500,000 $2,200,000 691 573 58 10.05% Buyer’s
Vail CO $6,381,250 $7,792,000 93.95% $871 152 $34,000,000 $23,000,000 24 64 2 3.41% Buyer’s
Washington D.C. DC $4,286,250 $3,537,500 95.10% $540 38 $22,000,000 $14,000,000 81 43 7 15.70% Balanced

COLDWELL BANKER GLOBAL LUXURY REPORT 2018 | 2928 | COLDWELL BANKER GLOBAL LUXURY REPORT 2018
City State
Median Inventory List Price
Median Monthly
Sold Price
Median SP/LP Ratio
Median Price
Per SqFt
Median Days on Market
Highest List Price
Highest Sold Price
Total Sold Properties
2017
Average Monthly Inventory
Average Monthly
SoldSales Ratio Status
Napa County CA $2,608,750 $2,240,000 96.08% $772 108 $33,150,000 $15,000,000 118 72 10 13.66% Buyer’s
Nashville TN $1,087,000 $956,583 98.02% $257 27 $17,999,999 $5,000,000 730 279 61 21.80% Seller’s
Oakland County MI $740,750 $649,975 97.01% $197 33 $10,550,000 $4,359,993 1,586 844 132 15.66% Balanced
Orange County CA $2,699,000 $2,349,343 96.40% $700 57 $63,500,000 $39,999,999 1,977 1017 165 16.20% Balanced
Palm Beach Towns FL $10,600,000 $8,490,000 84.73% $1,140 240 $165,000,000 $49,000,000 52 84 5 5.63% Buyer’s
Palm Springs & Palm Desert CA $1,822,375 $1,578,750 94.67% $394 91 $18,500,000 $8,700,000 460 373 38 10.28% Buyer’s
Park City UT $5,898,750 $5,165,000 94.49% $781 126 $25,000,000 $11,400,000 55 84 5 5.95% Buyer’s
Phoenix AZ $697,000 $636,250 97.49% $216 70 $16,850,000 $4,250,000 1,709 724 142 19.67% Balanced
Raleigh-Durham NC $699,954 $665,686 99.19% $171 27 $6,500,000 $2,951,000 2,052 919 171 18.61% Balanced
Sacramento CA $777,000 $731,000 99.12% $247 21 $8,700,000 $2,990,000 2,247 544 187 34.42% Seller’s
San Diego CA $2,243,750 $1,650,000 96.88% $499 46 $590,000,000 $12,000,000 2,430 989 203 20.48% Balanced
San Francisco CA $4,347,000 $3,612,500 100.01% $1,193 17 $29,500,000 $15,000,000 275 49 23 46.77% Seller’s
Santa Barbara CA $5,995,000 $4,812,875 93.59% $938 95 $85,000,000 $21,750,000 125 142 10 7.34% Buyer’s
Sarasota & Beaches FL $2,325,000 $2,187,500 93.01% $579 170 $26,500,000 $9,000,000 223 241 19 7.71% Buyer’s
Scottsdale AZ $2,200,000 $1,922,500 94.74% $356 142 $27,500,000 $15,650,000 655 755 55 7.23% Buyer’s
Seattle WA $1,837,495 $1,526,250 100.00% $482 9 $15,000,000 $8,850,000 854 216 71 32.95% Seller’s
Silicon Valley CA $4,297,250 $3,462,500 101.62% $1,282 10 $68,000,000 $25,000,000 902 136 75 55.27% Seller’s
St. Louis MO $597,400 $501,250 97.82% $188 19 $3,200,000 $3,050,000 904 276 75 27.29% Seller’s
Staten Island NY $1,283,000 $1,027,500 95.48% $320 93 $6,300,000 $4,235,000 136 113 11 10.03% Buyer’s
Stowe VT $1,525,000 $1,570,250 94.96% $272 206 $4,850,000 $2,950,000 8 12 2 13.33% Buyer’s
Tucson AZ $641,500 $530,863 97.08% $183 43 $12,500,000 $2,200,000 1,375 819 115 13.99% Buyer’s
Vail CO $4,687,500 $4,475,000 93.88% $675 202 $34,000,000 $23,000,000 49 111 4 3.68% Buyer’s
Washington D.C. DC $3,035,500 $2,530,000 96.51% $516 32 $22,000,000 $14,000,000 157 66 13 19.82% Balanced
City State
Median Inventory List Price
Median Monthly
Sold Price
Median SP/LP Ratio
Median Price
Per SqFt
Median Days on Market
Highest List Price
Highest Sold Price
Total Sold Properties
2017
Average Monthly Inventory
Average Monthly
SoldSales Ratio Status
Aspen CO $6,586,250 $5,562,500 93.06% $1,236 287 $58,500,000 $30,000,000 138 236 12 4.87% Buyer’s
Atlanta GA $1,172,500 $962,514 97.11% $237 62 $15,800,000 $7,150,000 1,884 1092 157 14.38% Buyer’s
Austin TX $1,250,000 $1,058,750 97.05% $318 47 $42,500,000 $21,794,000 1,159 463 97 20.86% Balanced
Boca Raton & Delray Beach FL $1,999,500 $1,725,000 92.66% $318 102 $29,950,000 $13,375,000 368 456 31 6.73% Buyer’s
Boston MA $3,003,250 $2,273,750 96.33% $793 24 $18,000,000 $13,000,000 96 34 8 23.53% Seller’s
Boulder CO $1,874,500 $1,540,144 97.30% $392 77 $9,900,000 $6,700,000 345 159 29 18.08% Balanced
Brooklyn NY $1,597,250 $1,550,000 92.60% $647 105 $6,995,000 $5,850,000 63 68 5 7.72% Buyer’s
Chicago IL $1,464,250 $1,199,750 96.55% $322 91 $50,000,000 $7,500,000 922 409 77 18.79% Balanced
Dallas TX $1,375,000 $1,230,000 96.75% $284 45 $48,900,000 $9,225,000 850 342 71 20.71% Balanced
Denver CO $997,498 $864,375 98.42% $203 28 $20,000,000 $8,116,000 3,226 1005 269 26.75% Seller’s
Fairfax VA $1,625,000 $1,405,000 97.38% $338 44 $29,900,000 $12,500,000 810 452 68 14.93% Buyer’s
Honolulu HI $2,226,250 $1,852,500 97.03% $579 37 $35,000,000 $13,800,000 423 206 35 16.99% Balanced
Houston TX $927,000 $852,500 97.20% $266 71 $19,500,000 $8,030,000 2,079 963 173 17.99% Balanced
LA: Beach Cities** CA $8,262,500 $7,175,000 95.90% $1,561 67 $85,000,000 $24,150,950 183 112 15 13.62% Buyer’s
LA: City** CA $4,221,250 $3,723,750 96.80% $922 52 $200,000,000 $41,000,000 804 290 67 23.10% Seller’s
LA: The Valley** CA $1,949,000 $1,805,000 97.69% $479 60 $27,000,000 $18,200,000 1,163 359 97 27.00% Seller’s
Las Vegas NV $619,633 $544,750 97.75% $172 43 $30,000,000 $6,500,000 3,686 1496 307 20.53% Balanced
Long Island NY $1,354,000 $1,212,500 94.91% $396 77 $55,000,000 $12,200,000 2,705 1927 225 11.70% Buyer’s
Manhattan NY $19,400,000 $16,250,000 95.00% $3,312 269 $80,000,000 $41,000,000 13 7 1 20.63% Balanced
Marin County CA $4,271,250 $3,625,000 98.85% $1,007 52 $25,000,000 $14,460,000 201 82 17 20.43% Balanced
Maui HI $3,250,000 $2,439,500 93.37% $823 191 $28,000,000 $16,000,000 87 142 7 5.11% Buyer’s
Miami FL $1,399,450 $1,006,250 93.74% $376 135 $65,000,000 $39,251,700 874 932 73 7.81% Buyer’s
Montgomery County MD $1,624,450 $1,452,500 97.37% $404 39 $23,000,000 $6,100,000 689 314 57 18.29% Balanced
SINGLE-FAMILY HOMES | TOP 10%PO
WE
R M
AR
KE
TS
PO
WE
R M
AR
KE
TS

COLDWELL BANKER GLOBAL LUXURY REPORT 2018 | 3130 | COLDWELL BANKER GLOBAL LUXURY REPORT 2018
CONDOS | TOP 5%
City State
Median Inventory List Price
Median Monthly
Sold Price
Median SP/LP Ratio
Median Price Per
SqFt
Median Days on Market
Highest List Price
Highest Sold Price
Total Sold Properties
2017
Average Monthly Inventory
Average Monthly
SoldSales Ratio Status
Aspen CO $6,811,250 $5,207,500 94.72% $1,660 195 $29,950,000 $11,585,000 34 49 3 6.31% Buyer’s
Atlanta GA $792,000 $712,875 98.08% $281 56 $7,430,000 $3,760,291 452 295 38 12.77% Buyer’s
Austin TX $897,000 $805,821 96.78% $483 46 $6,995,000 $5,150,000 150 77 13 16.23% Balanced
Boca Raton & Delray Beach FL $1,196,000 $945,000 93.46% $397 91 $8,900,000 $3,850,000 192 217 16 7.37% Buyer’s
Boston MA $2,998,750 $2,810,000 96.93% $1,385 51 $18,950,000 $17,200,000 250 115 21 18.12% Balanced
Boulder CO $932,000 $932,250 98.99% $496 57 $5,800,000 $3,200,000 66 21 6 26.19% Seller’s
Brooklyn NY $1,386,500 $1,333,000 96.07% $1,037 73 $5,750,000 $2,800,000 17 12 2 17.71% Balanced
Chicago IL $1,549,500 $1,227,500 95.81% $417 106 $9,990,000 $4,550,000 64 56 5 9.52% Buyer’s
Dallas TX $1,225,000 $1,079,375 95.89% $413 55 $16,500,000 $4,600,000 133 81 11 13.68% Buyer’s
Denver CO $812,500 $780,000 98.90% $316 26 $10,475,000 $5,300,000 725 226 60 26.73% Seller’s
Fairfax VA $779,498 $760,625 99.00% $310 16 $2,100,000 $1,800,000 224 51 19 36.60% Seller’s
Honolulu HI $2,599,500 $3,191,500 100.00% $1,558 34 $36,000,000 $22,000,000 326 113 27 23.89% Seller's
Houston TX $704,749 $681,250 97.28% $231 116 $2,950,000 $2,050,000 176 103 15 14.24% Buyer’s
LA: Beach Cities** CA $3,049,000 $3,124,750 97.10% $1,297 37 $16,500,000 $5,600,000 63 26 6 24.23% Seller’s
LA: City** CA $2,298,000 $2,027,500 96.80% $893 55 $29,900,000 $20,000,000 230 97 19 19.76% Balanced
LA: The Valley** CA $855,000 $832,000 98.94% $453 58 $2,400,000 $1,662,500 219 53 18 34.43% Seller’s
Long Island NY $1,206,250 $1,176,722 96.86% $722 122 $4,900,000 $4,900,000 139 102 12 11.36% Buyer’s
Manhattan NY $46,430,937 $47,578,312 96.00% $6,889 250 $76,000,000 $141,500,000 560 73 51 69.74% Seller's
Marin County CA $1,935,750 $1,747,500 99.10% $848 44 $4,250,000 $3,485,000 50 8 4 52.08% Seller’s
City State
Median Inventory List Price
Median Monthly Sold Price
Median SP/LP Ratio
Median Price Per
SqFt
Median Days on Market
Highest List Price
Highest Sold Price
Total Sold Properties
2017
Average Monthly Inventory
Average Monthly
SoldSales Ratio Status
Maui HI $3,495,000 $3,568,750 95.77% $1,584 120 $25,000,000 $8,575,000 71 46 6 12.86% Buyer’s
Miami FL $1,550,000 $1,421,250 91.38% $786 196 $65,000,000 $13,000,000 394 971 33 3.38% Buyer’s
Montgomery County MD $1,044,500 $830,000 98.77% $408 21 $4,500,000 $4,300,000 294 103 25 23.79% Seller’s
Nashville TN $788,700 $748,000 97.45% $419 42 $5,250,000 $2,350,000 104 53 9 16.35% Balanced
Oakland County MI $568,783 $525,500 97.53% $223 29 $3,500,000 $2,575,000 143 78 12 15.28% Balanced
Orange County CA $1,336,750 $1,273,500 97.85% $654 35 $8,388,000 $8,830,000 535 171 45 26.07% Seller’s
Palm Beach Towns FL $2,995,000 $2,936,250 90.33% $986 152 $16,900,000 $6,850,000 82 53 7 12.89% Buyer’s
Park City UT $3,570,000 $3,362,500 97.32% $1,203 142 $8,750,000 $6,439,689 31 39 3 6.62% Buyer’s
San Diego CA $1,454,250 $1,200,000 97.12% $778 30 $16,000,000 $4,850,000 586 215 49 22.71% Seller’s
San Francisco CA $3,495,000 $3,089,750 100.00% $1,483 24 $24,500,000 $22,000,000 150 39 13 32.05% Seller’s
Santa Barbara CA $2,637,500 $1,972,500 97.62% $977 27 $5,250,000 $4,650,000 22 14 3 19.64% Balanced
Sarasota & Beaches FL $2,175,000 $2,032,094 95.98% $709 121 $6,444,000 $6,444,000 116 74 10 13.06% Buyer’s
Scottsdale AZ $797,750 $786,250 96.66% $322 88 $6,295,000 $2,191,634 115 68 10 14.09% Buyer’s
Seattle WA $1,791,250 $1,366,850 99.51% $908 26 $13,800,000 $7,500,000 144 40 12 30.00% Seller’s
Silicon Valley CA $1,798,000 $1,682,995 105.47% $956 10 $3,850,000 $3,750,000 214 18 18 99.07% Seller’s
Stowe VT $1,600,000 $1,495,980 93.46% $611 108 $3,300,000 $2,990,981 3 5 2 30.00% Seller’s
Vail CO $5,562,500 $4,537,250 96.51% $1,795 122 $15,995,000 $12,600,000 32 56 3 4.76% Buyer’s
Washington D.C. DC $2,188,750 $1,747,500 98.86% $610 12 $8,995,000 $6,750,000 247 71 21 28.99% Seller’s
Note: Not all Power Markets have condo markets in the top 5% of the overall marketplace.
PO
WE
R M
AR
KE
TS
PO
WE
R M
AR
KE
TS

COLDWELL BANKER GLOBAL LUXURY REPORT 2018 | 3332 | COLDWELL BANKER GLOBAL LUXURY REPORT 2018
CONDOS | TOP 10%
City State
Median Inventory List Price
Median Monthly Sold Price
Median SP/LP Ratio
Median Price Per
SqFt
Median Days on Market
Highest List Price
Highest Sold Price
Total Sold Properties
2017
Average Monthly Inventory
Average Monthly
SoldSales Ratio Status
Aspen CO $4,631,250 $3,861,020 95.08% $1,469 192 $29,950,000 $11,585,000 70 81 6 7.20% Buyer’s
Atlanta GA $649,675 $589,500 98.17% $259 53 $7,430,000 $3,760,291 913 457 76 16.65% Balanced
Austin TX $699,000 $653,000 97.84% $357 43 $6,995,000 $5,150,000 301 131 25 19.15% Balanced
Boca Raton & Delray Beach FL $814,750 $667,625 94.85% $337 74 $8,900,000 $3,850,000 383 348 32 9.17% Buyer’s
Boston MA $2,441,125 $2,152,500 97.74% $1,225 48 $18,950,000 $17,200,000 497 189 41 21.91% Seller’s
Boulder CO $832,475 $795,000 99.35% $415 52 $5,800,000 $3,200,000 133 37 11 29.95% Seller’s
Brooklyn NY $934,250 $985,000 95.47% $825 86 $5,750,000 $2,800,000 33 26 3 10.58% Buyer’s
Chicago IL $1,160,000 $898,750 97.56% $383 69 $9,990,000 $4,550,000 129 85 11 12.65% Buyer’s
Dallas TX $775,000 $734,875 96.25% $293 51 $16,500,000 $4,600,000 267 137 22 16.24% Balanced
Denver CO $674,500 $648,500 99.28% $317 24 $10,475,000 $5,300,000 1,440 412 120 29.13% Seller’s
Fairfax VA $694,725 $677,500 99.34% $286 16 $2,100,000 $1,800,000 446 91 37 40.84% Seller’s
Honolulu HI $1,965,000 $1,517,500 97.90% $1,094 41 $36,000,000 $22,000,000 661 201 55 27.36% Seller's
Houston TX $599,945 $592,850 97.27% $214 78 $2,950,000 $2,050,000 352 182 29 16.12% Balanced
LA: Beach Cities** CA $2,735,000 $2,337,500 98.27% $1,118 39 $16,500,000 $5,600,000 127 39 13 32.56% Seller’s
LA: City** CA $1,699,500 $1,521,250 97.60% $762 43 $29,900,000 $20,000,000 458 157 38 24.31% Seller’s
LA: The Valley** CA $739,000 $723,250 99.32% $416 43 $2,400,000 $1,662,500 437 92 36 39.58% Seller’s
Long Island NY $998,888 $958,750 97.13% $603 94 $4,900,000 $4,900,000 284 188 24 12.59% Buyer’s
Manhattan NY $12,500,000 $14,140,487 97.00% $3,331 243 $76,000,000 $141,500,000 833 256 69 27.12% Seller's
Marin County CA $1,488,750 $1,487,500 100.00% $750 35 $4,250,000 $3,485,000 101 15 8 56.11% Seller’s
City State
Median Inventory List Price
Median Monthly
Sold Price
Median SP/LP Ratio
Median Price Per
SqFt
Median Days on Market
Highest List Price
Highest Sold Price
Total Sold Properties
2017
Average Monthly Inventory
Average Monthly
SoldSales Ratio Status
Maui HI $1,786,722 $2,053,750 96.19% $1,420 121 $25,000,000 $8,575,000 149 122 12 10.18% Buyer’s
Miami FL $993,333 $915,000 93.16% $593 179 $65,000,000 $13,000,000 788 1747 66 3.76% Buyer’s
Montgomery County MD $754,950 $683,750 99.22% $360 17 $4,500,000 $4,300,000 586 164 49 29.78% Seller’s
Nashville TN $688,450 $592,500 98.03% $404 31 $5,250,000 $2,350,000 207 76 17 22.70% Seller’s
Oakland County MI $478,700 $429,500 97.87% $196 32 $3,500,000 $2,575,000 277 118 23 19.56% Balanced
Orange County CA $1,043,250 $968,539 98.23% $504 32 $8,388,000 $8,830,000 1,067 288 89 30.87% Seller’s
Palm Beach Towns FL $2,037,000 $2,091,000 90.85% $787 160 $16,900,000 $6,850,000 157 106 13 12.34% Buyer’s
Park City UT $2,950,000 $3,032,500 96.54% $1,115 142 $8,750,000 $6,439,689 63 85 5 6.18% Buyer’s
San Diego CA $1,087,500 $910,000 98.22% $613 26 $16,000,000 $4,850,000 1,169 328 97 29.70% Seller’s
San Francisco CA $2,722,000 $2,505,000 100.00% $1,296 23 $24,500,000 $22,000,000 297 68 25 36.40% Seller’s
Santa Barbara CA $1,698,000 $1,455,500 96.14% $986 60 $5,250,000 $4,650,000 44 24 4 16.67% Balanced
Sarasota & Beaches FL $1,552,500 $1,493,250 94.34% $594 117 $6,444,000 $6,444,000 226 141 19 13.36% Buyer’s
Scottsdale AZ $663,421 $622,875 97.26% $279 84 $6,295,000 $2,191,634 231 119 19 16.18% Balanced
Seattle WA $1,324,950 $998,125 100.00% $760 14 $13,800,000 $7,500,000 290 64 24 37.76% Seller’s
Silicon Valley CA $1,539,000 $1,486,250 107.94% $894 9 $3,850,000 $3,750,000 426 30 36 118.33% Seller’s
Stowe VT $752,000 $778,375 95.54% $477 233 $3,300,000 $2,990,981 6 9 2 16.67% Balanced
Vail CO $3,600,000 $3,312,500 94.14% $1,497 164 $15,995,000 $12,600,000 64 93 5 5.73% Buyer’s
Washington D.C. DC $1,597,000 $1,476,250 99.86% $554 9 $8,995,000 $6,750,000 498 121 42 34.30% Seller’s
Note: Not all Power Markets have condo markets in the top 10% of the overall marketplace.
*Disclaimer: Data is based on closed and recorded transaction sides of homes sold in the top 10% of luxury markets between the periods of December 16, 2016 to December 31, 2017 as gathered by The Institute for Luxury Home Marketing from multiple sources, including, but not limited to, various Multiple Listing Services, local Real Estate Boards and Coldwell Banker co-operating brokerage firms
**L.A. Beaches includes all cities along the coast of the greater Los Angeles area. Cities include Santa Monica, Malibu and Manhattan Beach. L.A. City covers all of inland Los Angeles through the Westside with Ventura Boulevard as the border. Cities include Beverly Hills, West Hollywood and Downtown. L.A. The Valley begins at Ventura Boulevard and edges Ventura County. Cities includes Thousand Oaks, Calabasas and Northridge.
PO
WE
R M
AR
KE
TS
PO
WE
R M
AR
KE
TS

COLDWELL BANKER GLOBAL LUXURY REPORT 2018 | 3534 | COLDWELL BANKER GLOBAL LUXURY REPORT 2018
Average Monthly Inventory
LUXURY BUYERMARKETS TO WATCH
To determine the luxury markets to watch*, The Institute for Luxury Home Marketing provided the following metrics in Power Markets: sales-price-to-list-price ratios, days on market, median list price and inventory. Coldwell Banker Independent Sales Associates provided the local insight, knowledge and understanding of the nuances in each individual marketplace.
Comparatively, the following Power Markets of Boca Raton, Miami, Park City, Santa Barbara and Scottsdale showed lower median sales-price-to-list-price ratio, an increasing number of listings, median higher days on market and a stable or decreasing median list price over the year.
Traditionally, a buyer's market describes conditions in which supply exceeds demand, giving home purchasers an advantage over sellers in price negotiations.
LU
XU
RY
BU
YE
R M
AR
KE
TS
TO
WA
TC
H
1 BOCA RATON & DELRAY BEACH, FL
92.7%
94.9%
102
74
$1,999,500$814,750
456
348
Median SP/LP% Ratio
Median Days on Market
Median MonthlyInventory List Price
9
The Boca Raton/Delray Beach market represents a good value if you look at where the majority of our buyers are moving from — the Northeast and California — where they’re accustomed to paying up to $3,000 to $4,000 per square foot. Here, they can find brand-new construction and fully furnished properties for around $1,000 per square foot. As a general rule, properties situated in the East, closer to beach and waterfront areas, are selling well. For instance, the Royal Palm Country Club area is very hot right now. Boca Raton makes a lot of investment sense when you look at the lifestyle. Miami is fast-paced and Palm Beach is slower paced. Boca
offers a nice middle ground.
— Jonathan Postma, Sales Associate Coldwell Banker Residential Real Estate in Boca Raton
SFH
CO
ND
OS
*Data is based on closed and recorded transaction side of homes sold in the top 10% of Power Markets during 2017.

COLDWELL BANKER GLOBAL LUXURY REPORT 2018 | 3736 | COLDWELL BANKER GLOBAL LUXURY REPORT 2018
SFH
CO
ND
OS
SFH
CO
ND
OS
LU
XU
RY
BU
YE
R M
AR
KE
TS
TO
WA
TC
H
2 MIAMI, FL
93.7%
93.2%
135
179
$ 1,399,450$993,333
932
1747
Median SP/LP% Ratio
Median Days on Market
Median MonthlyInventory List Price
Average Monthly Inventory
9
3 PARK CITY, UT
94.5%
96.5%
126
142
$5,898,750$2,950,000
84
85
Median SP/LP% Ratio
Median Days on Market
Median MonthlyInventory List Price
9
Average Monthly Inventory
During 2017, we saw savvy luxury buyers invest in properties offering that special differentiator, specifically ski-in/ski-out homes and gated golf course communities. Whether these prestigious homes abutted the ski slopes, offered direct ski access through their acreage, as seen in The Colony at White Pine Canyon (a rarity in today’s market), the full amenity accessibility of Park City’s new luxurious townhomes or the privacy and prestige of living within a luxury golfing community, these proved to be the preferred choice. However, with the expansion of Delta Air Line’s hub in Salt Lake City increasing access and more direct flights, coupled with the growth into a four-season resort, Park City is starting to see a new kind of high-net-worth buyer – not just from new locations such as Texas, California, Chicago and New York – but those looking for a year-round playground and the opportunity to view a plethora of luxury properties without
such restrictive criteria.
— Marny Schlopy, Sales Associate Coldwell Banker Residential Brokerage in Park City
Sales from the once-dominant Latin American countries, due to politics, economic and financial issues, have decreased, particularly from first-time buyers for our luxury market, although the Latin Americans who purchased years ago are still very active in the market. In combination with the new foreign tax, this has resulted in an upswing of interest from the domestic market — particularly New York, California, New Jersey and Chicago. Luxury, modern high-tech condominiums are favored by millennials, but juxtaposed is the new or completely renovated single-family home, which is now the hot ticket. Indeed, they are often being bought sight-unseen. These buyers are savvy; they know where they want to live, having done their research previously and online. Viewing therefore takes place virtually, which is indicative of why only new is acceptable.
– Alyssa Morgan, Sales AssociateColdwell Banker Residential Real Estate in Miami
LU
XU
RY
BU
YE
R M
AR
KE
TS
TO
WA
TC
H

COLDWELL BANKER GLOBAL LUXURY REPORT 2018 | 3938 | COLDWELL BANKER GLOBAL LUXURY REPORT 2018
4 SANTA BARBARA, CA
93.6%
96.1%
95
60
$5,995,000$1,698,000
142
24
Median SP/LP% Ratio
Median Days on Market
Median MonthlyInventory List Price
9
Average Monthly Inventory
5 SCOTTSDALE, AZ
94.7%
97.3%
142
84
$ 2,200,000$663,421
755
119
Median SP/LP% Ratio
Median Days on Market
Median MonthlyInventory List Price
Average Monthly Inventory
9
The spiraling house prices of L.A. created a ripple effect, not because the value of our homes are not comparable, but because of the lifestyle that is included in the ‘ticket’ price. Chic but mellow, all year sunshine without city humidity certainly has the L.A. family and retiree market turning their heads in the direction of our idyllic hotspots. While the $2 – $5 million properties are consistently active, it is the $5 million and above that offers the high-powered executive the opportunity, as presently this market is slower. But with international travel an easy option, as well as facilities for private jets, remote working and/or a fast commute to L.A. or San
Francisco, this could change very quickly.
— Erik Wilde, Broker Coldwell Banker Property Shoppe in Ojai
Still popular with the ultra wealthy Baby Boomer from Chicago, California, Milwaukee and Canada, Scottsdale is experiencing the first wave of New Yorkers heading west to discover this playground known for the most golf courses per capita in the world. However, there is a distinct shift in the spending power, with large mansions being torn down and rebuilt with an eye to less living space but more storage for toys and cars, and mid-size luxury homes completely remodeled... the return is often upwards of 2 and 3 times their original investment! Luxurious view properties and full amenity condominium living are proving to be significantly popular – whether of the desert or the city skyline or the new ‘lock and leave’ type condo development.
— Wendy Walker, Sales Associate Coldwell Banker Residential Brokerage in Scottsdale
LU
XU
RY
BU
YE
R M
AR
KE
TS
TO
WA
TC
HL
UX
UR
Y B
UY
ER
MA
RK
ET
S T
O W
AT
CH
SFH
CO
ND
OS
SFH
CO
ND
OS

COLDWELL BANKER GLOBAL LUXURY REPORT 2018 | 4140 | COLDWELL BANKER GLOBAL LUXURY REPORT 2018
To determine the luxury markets to watch*, The Institute for Luxury Home Marketing provided the following metrics in Power Markets: sales-price-to-list-price ratios, days on market, median list price and inventory. Coldwell Banker Independent Sales Associates provided the local insight, knowledge and understanding of the nuances in each individual marketplace.
Comparatively, the following Power Markets of Denver, Nashville, San Francisco, Seattle and Silicon Valley showed higher median sales-price-to-list-price ratio, a decreasing number of listings, lower median days on market and a rising median list price over the year.
A seller's market is traditionally considered to be a situation in which demand exceeds supply, giving homeowners an advantage over buyers in price negotiations.
LUXURY SELLERMARKETS TO WATCH
LU
XU
RY
SE
LL
ER
MA
RK
ET
S T
O W
AT
CH
1 DENVER, CO
98.4%
99.3%
28
24
$997,498$674,500
1005
412
Median SP/LP% Ratio
Median Days on Market
9
Median MonthlyInventory List Price
Average Monthly Inventory
The 2017 market conditions in Denver are directly related to the low inventory available, and the continued high demand due to a robust, consistent population increase. Affluent buyers are attracted to Denver for many of the same reasons that have always existed — the mountains, the climate, the sunshine and an average price appreciation of real estate quoted at 54% since 2012, according to RE
Colorado, the largest MLS provider in Colorado.
— Kevin Risen, Executive Vice President Coldwell Banker Residential Brokerage in Colorado
SFH
CO
ND
OS
*Data is based on closed and recorded transaction side of homes sold in the top 10% of Power Markets during 2017.

COLDWELL BANKER GLOBAL LUXURY REPORT 2018 | 4342 | COLDWELL BANKER GLOBAL LUXURY REPORT 2018
Median MonthlyInventory List Price
Average Monthly Inventory
LU
XU
RY
SE
LL
ER
MA
RK
ET
S T
O W
AT
CH
32 SAN FRANCISCO, CA
100.0%
100.0%
17
23
$4,347,000$2,722,000
49
68
Median SP/LP% Ratio
Median Days on Market
9
San Francisco has fast become an international business destination, and prices have skyrocketed with new businesses being established daily in the heart of the city. This surge has come from the technology and financial sectors, existing and entrepreneurial businesses, as well as Asian investment money. Home purchasers are looking to be in the heart of the city with all its amenities – cultural, shopping, arts, eclectic culinary and proximity to the airport, yet the ability to provide for those
with an active lifestyle within easy reach.
— Joel Goodrich, Sales Associate Coldwell Banker Residential Brokerage in San Francisco
LU
XU
RY
SE
LL
ER
MA
RK
ET
S T
O W
AT
CH
NASHVILLE, TN
98.0%
98.0%
27
31
$1,087,000$688,450
279
76
Median SP/LP% Ratio
Median Days on Market
9
Median MonthlyInventory List Price
Average Monthly Inventory
Today, Nashville is enjoying one of the fastest-growth patterns in the U.S. Many of the ultra wealthy are West Coast buyers taking advantage of the standard of living, investing the equity from their current home and a state with no income tax. Some are simply coming home, tired of their fast-paced lives, and desire a ‘big city’ with a small town feel. They can now enjoy this city’s explosion of amenities from excellent culinary delights and the arts to exceptional health care and the best live music scene in the world. A buyer desiring spacious living tends to gravitate to Williamson County to enjoy mansion-sized homes, while the urban buyer is generally moving
into a three to four-story home offering vertical living with rooftop living spaces.
— Ashley Boykin, Sales Associate Coldwell Banker Barnes in Nashville
SFH
CO
ND
OS
SFH
CO
ND
OS
COLDWELL BANKER GLOBAL LUXURY REPORT 2018 | 4544 | COLDWELL BANKER GLOBAL LUXURY REPORT 2018
LU
XU
RY
SE
LL
ER
MA
RK
ET
S T
O W
AT
CH
LU
XU
RY
SE
LL
ER
MA
RK
ET
S T
O W
AT
CH
Median MonthlyInventory List Price
Average Monthly Inventory
4 SEATTLE, WA
100.0%
100.0%
9
14
$1,837,495$1,324,950
216
64
Median SP/LP% Ratio
Median Days on Market
9
Wealth creation in our region is at an all-time high, with a booming job sector, highly valued stock options and high-net-worth buyers relocating here from other domestic markets and from overseas. I have watched the city mature from a mid-sized city with a small-town mentality to a cosmopolitan city with a dynamic mix of upscale waterfront living, schools, outdoor recreation, culture and world-class
food and wine.
— Wendy Lister, Broker Coldwell Banker Bain in Seattle
5 SILICON VALLEY, CA
101.6%
107.9%
10
9
$4,297,250$1,539,000
136
30
Median SP/LP% Ratio
Median Days on Market
Median MonthlyInventory List Price
9
Average Monthly Inventory
There are several driving factors influencing the Silicon Valley market. The No. 1 factor is obviously the huge number of well-paid tech workers and executives. There is also a large number of buyers from Asia and Europe with greater financial resources than local buyers who are looking at their purchase for long-term appreciation or a
way to diversify their investment portfolios.
— Brett Caviness, Sales Associate Coldwell Banker Residential Brokerage in Menlo Park
SFH
CO
ND
OS
SFH
CO
ND
OS

COLDWELL BANKER GLOBAL LUXURY REPORT 2018 | 4746 | COLDWELL BANKER GLOBAL LUXURY REPORT 2018
DO
ME
ST
IC S
PO
TL
IGH
T
Many wealthy real estate investors in the U.S. have the opportunity to own a luxury property anywhere. When deciding where to purchase their next home, what are the important considerations, both emotionally and financially?
The Institute for Luxury Home Marketing took a closer look at 12 diverse locales across four key luxury market types — resort, vertical, lifestyle and evolving — to determine what really influences an affluent individual's decision to buy in a certain marketplace. Do lifestyle factors, such as activities or culture, ultimately drive their purchase decisions? Is it proximity to amenities like upscale shopping and restaurants? Or does it ultimately come down to geographical advantages like schools and business accessibility?
To obtain a Luxury Desirability Score, each of these key indicators was given a ranking between 1 and 15, based on analysis from local experts in the Coldwell Banker network. These scores were calculated based on a maximum score of 60 for each decision category (Lifestyle, Amenities and Location). The higher the score, the more influential the indicators were in an affluent homebuyer's purchase decision in that particular Power Market.
For a more statistical understanding of the 2017 trends for both single-family and attached homes in the top 10% of these 12 markets, the monthly inventory and sold totals were examined together with the median sold price.
While statistics show trends, it is the Coldwell Banker Independent Sales Associates who provided the local insight, knowledge and understanding of the nuances in each individual marketplace, revealing a more complete picture of the factors that are truly shaping purchase decisions among modern-day luxury homebuyers.
• Activities
• Culture
• Green Footprint
• Peer Networking
• Safe Environment
• Luxury Shopping
• Restaurants
• Spas and Salons
• White Glove Service
• Financial Safe Haven
• Airport
• Business Accessibility
• Privacy
• Security
• Schools/Universities
L I F E S T Y L E A M E N I T I E S L O C A T I O N
DEFINING LUXURY DESIRABILITY IN THE U.S.
DOMESTIC SPOTLIGHT
Source: The Institute for Luxury Home Marketing
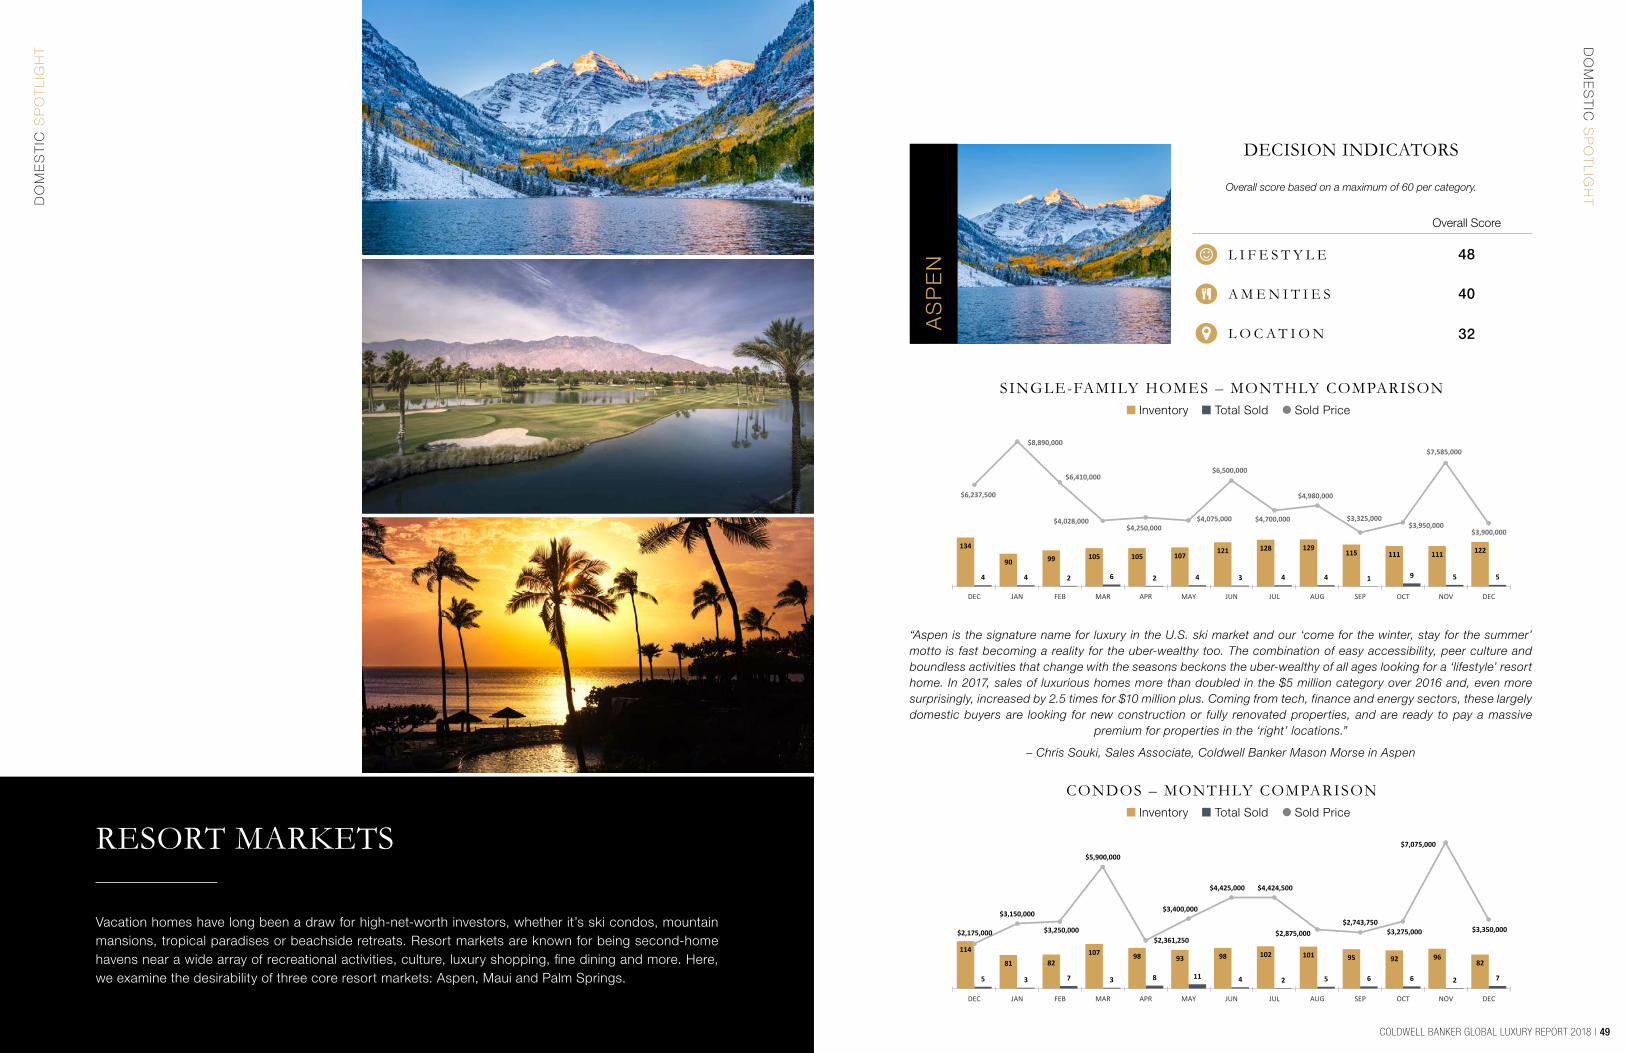
COLDWELL BANKER GLOBAL LUXURY REPORT 2018 | 4948 | COLDWELL BANKER GLOBAL LUXURY REPORT 2018
DO
ME
ST
IC S
PO
TL
IGH
T
RESORT MARKETS
DECISION INDICATORS
Vacation homes have long been a draw for high-net-worth investors, whether it’s ski condos, mountain mansions, tropical paradises or beachside retreats. Resort markets are known for being second-home havens near a wide array of recreational activities, culture, luxury shopping, fine dining and more. Here, we examine the desirability of three core resort markets: Aspen, Maui and Palm Springs.
AS
PE
N 48
40
32
Overall Score
Overall score based on a maximum of 60 per category.
L I F E S T Y L E
A M E N I T I E S
L O C A T I O N
134
90 99 105 105 107121 128 129
115 111 111 122
4 4 2 6 2 4 3 4 4 1 9 5 5
$6,237,500
$8,890,000
$6,410,000
$4,028,000$4,250,000
$4,075,000
$6,500,000
$4,700,000
$4,980,000
$3,325,000$3,950,000
$7,585,000
$3,900,000
0
50
100
150
200
250
300
350
400
$0
$1,000,000
$2,000,000
$3,000,000
$4,000,000
$5,000,000
$6,000,000
$7,000,000
$8,000,000
$9,000,000
DEC JAN FEB MAR APR MAY JUN JUL AUG SEP OCT NOV DEC
114
81 82107 98 93 98 102 101 95 92 96
82
5 3 7 3 8 11 4 2 5 6 6 2 7
$2,175,000
$3,150,000
$3,250,000
$5,900,000
$2,361,250
$3,400,000
$4,425,000 $4,424,500
$2,875,000$2,743,750
$3,275,000
$7,075,000
$3,350,000
0
50
100
150
200
250
300
350
$0
$1,000,000
$2,000,000
$3,000,000
$4,000,000
$5,000,000
$6,000,000
$7,000,000
DEC JAN FEB MAR APR MAY JUN JUL AUG SEP OCT NOV DEC
SINGLE-FAMILY HOMES – MONTHLY COMPARISON
CONDOS – MONTHLY COMPARISON
Inventory Total Sold Sold Price
Inventory Total Sold Sold Price
DO
ME
ST
IC S
PO
TL
IGH
T
“Aspen is the signature name for luxury in the U.S. ski market and our ‘come for the winter, stay for the summer’ motto is fast becoming a reality for the uber-wealthy too. The combination of easy accessibility, peer culture and boundless activities that change with the seasons beckons the uber-wealthy of all ages looking for a ‘lifestyle’ resort home. In 2017, sales of luxurious homes more than doubled in the $5 million category over 2016 and, even more surprisingly, increased by 2.5 times for $10 million plus. Coming from tech, finance and energy sectors, these largely domestic buyers are looking for new construction or fully renovated properties, and are ready to pay a massive
premium for properties in the ‘right’ locations.”
– Chris Souki, Sales Associate, Coldwell Banker Mason Morse in Aspen
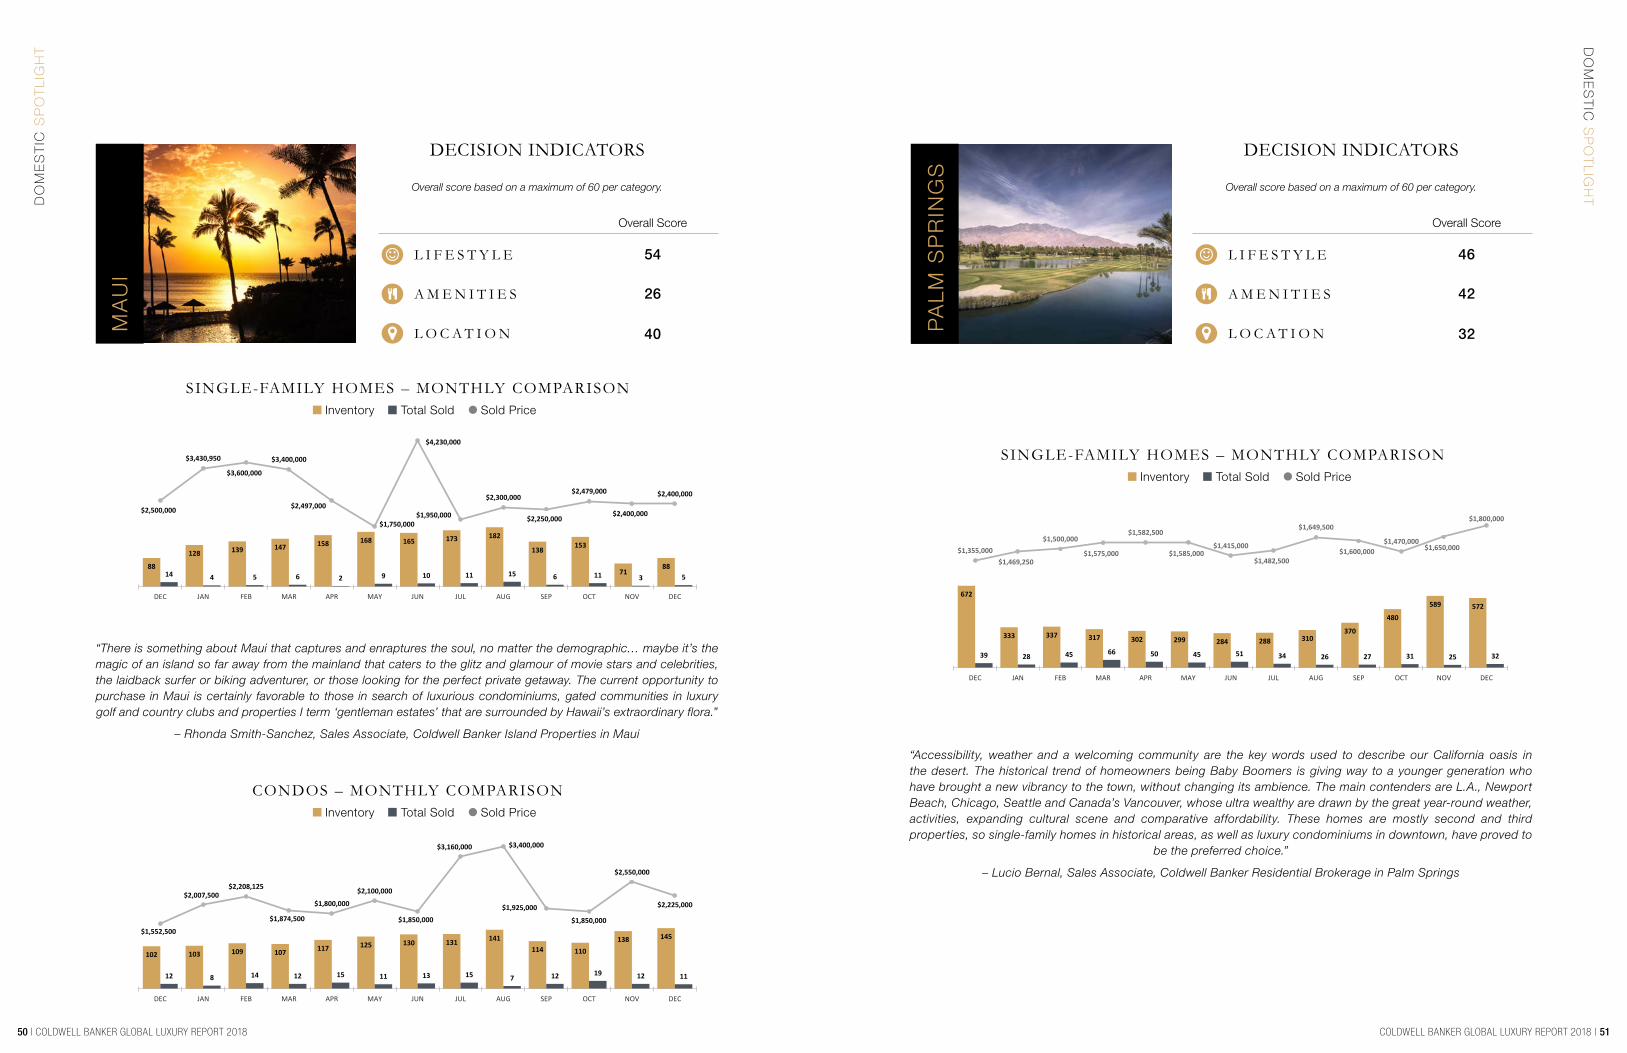
COLDWELL BANKER GLOBAL LUXURY REPORT 2018 | 5150 | COLDWELL BANKER GLOBAL LUXURY REPORT 2018
DO
ME
ST
IC S
PO
TL
IGH
TDO
ME
ST
IC S
PO
TL
IGH
T
MA
UI
PA
LM
SP
RIN
GS
672
333 337 317 302 299 284 288 310370
480
589 572
39 28 45 66 50 45 51 34 26 27 31 25 32
$1,355,000$1,469,250
$1,500,000
$1,575,000
$1,582,500
$1,585,000$1,415,000
$1,482,500
$1,649,500
$1,600,000$1,470,000
$1,650,000
$1,800,000
0
200
400
600
800
1000
1200
$0
$200,000
$400,000
$600,000
$800,000
$1,000,000
$1,200,000
$1,400,000
$1,600,000
$1,800,000
DEC JAN FEB MAR APR MAY JUN JUL AUG SEP OCT NOV DEC
SINGLE-FAMILY HOMES – MONTHLY COMPARISONInventory Total Sold Sold Price
88
128 139 147 158 168 165 173 182
138153
7188
14 4 5 6 2 9 10 11 15 6 11 3 5
$2,500,000
$3,430,950
$3,600,000
$3,400,000
$2,497,000
$1,750,000
$4,230,000
$1,950,000
$2,300,000
$2,250,000
$2,479,000
$2,400,000
$2,400,000
0
50
100
150
200
250
300
350
400
450
$500
$500,500
$1,000,500
$1,500,500
$2,000,500
$2,500,500
$3,000,500
$3,500,500
$4,000,500
DEC JAN FEB MAR APR MAY JUN JUL AUG SEP OCT NOV DEC
102 103 109 107 117 125 130 131 141114 110
138 145
12 8 14 12 15 11 13 15 7 12 19 12 11
$1,552,500
$2,007,500$2,208,125
$1,874,500
$1,800,000
$2,100,000
$1,850,000
$3,160,000 $3,400,000
$1,925,000
$1,850,000
$2,550,000
$2,225,000
0
50
100
150
200
250
300
350
$0
$500,000
$1,000,000
$1,500,000
$2,000,000
$2,500,000
$3,000,000
$3,500,000
DEC JAN FEB MAR APR MAY JUN JUL AUG SEP OCT NOV DEC
SINGLE-FAMILY HOMES – MONTHLY COMPARISON
CONDOS – MONTHLY COMPARISON
Inventory Total Sold Sold Price
Inventory Total Sold Sold Price
DECISION INDICATORSDECISION INDICATORS
4654
4226
3240
Overall ScoreOverall Score
L I F E S T Y L EL I F E S T Y L E
A M E N I T I E SA M E N I T I E S
L O C A T I O NL O C A T I O N
“Accessibility, weather and a welcoming community are the key words used to describe our California oasis in the desert. The historical trend of homeowners being Baby Boomers is giving way to a younger generation who have brought a new vibrancy to the town, without changing its ambience. The main contenders are L.A., Newport Beach, Chicago, Seattle and Canada’s Vancouver, whose ultra wealthy are drawn by the great year-round weather, activities, expanding cultural scene and comparative affordability. These homes are mostly second and third properties, so single-family homes in historical areas, as well as luxury condominiums in downtown, have proved to
be the preferred choice.”
– Lucio Bernal, Sales Associate, Coldwell Banker Residential Brokerage in Palm Springs
“There is something about Maui that captures and enraptures the soul, no matter the demographic… maybe it’s the magic of an island so far away from the mainland that caters to the glitz and glamour of movie stars and celebrities, the laidback surfer or biking adventurer, or those looking for the perfect private getaway. The current opportunity to purchase in Maui is certainly favorable to those in search of luxurious condominiums, gated communities in luxury golf and country clubs and properties I term ‘gentleman estates’ that are surrounded by Hawaii’s extraordinary flora.”
– Rhonda Smith-Sanchez, Sales Associate, Coldwell Banker Island Properties in Maui
Overall score based on a maximum of 60 per category.Overall score based on a maximum of 60 per category.

COLDWELL BANKER GLOBAL LUXURY REPORT 2018 | 5352 | COLDWELL BANKER GLOBAL LUXURY REPORT 2018
DO
ME
ST
IC S
PO
TL
IGH
T
BO
ST
ON
27 27 33 3644 46 41
31 2538 36 36
2511
4 26 8 8
16 1610
5 8 7 6
$1,400,000$1,825,000 $1,750,000
$2,384,000$2,775,000
$2,532,500$2,262,500
$1,662,500$2,119,000
$5,150,000
$2,310,000
$1,525,000
$2,285,000
0
10
20
30
40
50
60
70
80
90
100
$0
$1,000,000
$2,000,000
$3,000,000
$4,000,000
$5,000,000
DEC JAN FEB MAR APR MAY JUN JUL AUG SEP OCT NOV DEC
133 141167 180 176
214 217 208179
203 206 206180
30 35 19 34 45 3455 44 47 45 40 46 53
$1,857,150 $2,155,000
$2,165,000
$2,075,000
$2,150,000
$2,100,000
$2,285,000
$1,948,750
$2,215,000
$2,400,000
$1,918,750
$2,231,000
$1,800,000
0
50
100
150
200
250
300
350
400
450
500
$0
$500,000
$1,000,000
$1,500,000
$2,000,000
$2,500,000
DEC JAN FEB MAR APR MAY JUN JUL AUG SEP OCT NOV DEC
SINGLE-FAMILY HOMES – MONTHLY COMPARISON
CONDOS – MONTHLY COMPARISON
Inventory Total Sold Sold Price
Inventory Total Sold Sold Price
DO
ME
ST
IC S
PO
TL
IGH
T
DECISION INDICATORS
33
35
52
Overall Score
L I F E S T Y L E
A M E N I T I E S
L O C A T I O N
VERTICAL MARKETS
A vertical market is typically located in a high-density urban setting populated by diverse luxury high-rise housing stock and a booming luxury high-rise condo landscape. Here, we study the desirability of three core vertical markets: Boston, Chicago and San Francisco.
“Boston’s historical footprint still has a huge influence over many of its ultra wealthy buyers, both in their choice of luxury locations, including Back Bay, Beacon Hill and South End, and style of vertical living, whether a brownstone, mid-rise or high-rise... with a commonality for luxurious, modern, high-tech interior finishes. The city caters to the well-established industries of finance, education, biotechnology, tourism and creative economy, so the majority of real estate's movement is from within its own market, although relocation from New York, L.A. and San Francisco is common. University education is probably the biggest influencer, with the largest draw of students from China, the UK, France and the Middle East. A new trend in Boston has been the launch of broad lifestyle services and amenities, with
high-rises offering everything from concierge, gyms, private restaurants, and screen rooms to organized activities.”
– Ricardo Rodriguez, Sales Associate, Coldwell Banker Residential Brokerage in Boston
Overall score based on a maximum of 60 per category.

COLDWELL BANKER GLOBAL LUXURY REPORT 2018 | 5554 | COLDWELL BANKER GLOBAL LUXURY REPORT 2018
366
250
338388 403 426 426
462530
446411
467
364
64 46 4190 85
123 12987 73 69 48 54 77
$1,285,000
$1,197,500
$1,100,000
$1,180,000
$1,200,000
$1,235,200
$1,155,000
$1,235,000
$1,199,000
$1,270,000 $1,259,755
$1,199,500
$1,299,000
0
100
200
300
400
500
600
700
800
900
1000
$500,000
$600,000
$700,000
$800,000
$900,000
$1,000,000
$1,100,000
$1,200,000
$1,300,000
$1,400,000
DEC JAN FEB MAR APR MAY JUN JUL AUG SEP OCT NOV DEC
14 13 12 8 13 1018 16
8 6 9 6 103846 53
65 7290 94
103
123106
92 9886
$926,250$999,900
$897,500
$1,077,500
$885,000
$862,000
$826,273
$865,950 $900,000
$1,026,250
$930,000
$1,098,750
$852,000
0
50
100
150
200
$0
$200,000
$400,000
$600,000
$800,000
$1,000,000
$1,200,000
DEC JAN FEB MAR APR MAY JUN JUL AUG SEP OCT NOV DEC
DO
ME
ST
IC S
PO
TL
IGH
T DO
ME
ST
IC S
PO
TL
IGH
T
CH
ICA
GO
SINGLE-FAMILY HOMES – MONTHLY COMPARISON
CONDOS – MONTHLY COMPARISON
Inventory Total Sold Sold Price
Inventory Total Sold Sold Price
SA
N F
RA
NC
ISC
O
16
41
50
60 62 62
53
42 39 40
66 63
15
20
11 12
25 28 2823 25
17 17
41
2622
$3,743,750
$4,200,000
$3,380,000
$4,100,000
$3,937,500
$3,844,000
$3,550,000
$3,380,000
$3,200,000
$3,400,000
$3,800,000
$3,547,500
$3,675,000
0
10
20
30
40
50
60
70
80
90
100
$500
$500,500
$1,000,500
$1,500,500
$2,000,500
$2,500,500
$3,000,500
$3,500,500
$4,000,500
DEC JAN FEB MAR APR MAY JUN JUL AUG SEP OCT NOV DEC
47
6375 80 82
7467 69
62 58
7973
4231
1019
29 2737 41
1622
9
2834
25
$2,395,000
$2,510,000
$2,875,000
$2,350,000
$2,500,000$2,650,000
$2,450,000
$2,482,500
$2,342,000
$2,850,000
$2,594,000
$2,516,250
$2,300,000
0
50
100
150
$0
$500,000
$1,000,000
$1,500,000
$2,000,000
$2,500,000
$3,000,000
DEC JAN FEB MAR APR MAY JUN JUL AUG SEP OCT NOV DEC
SINGLE-FAMILY HOMES – MONTHLY COMPARISON
CONDOS – MONTHLY COMPARISON
Inventory Total Sold Sold Price
Inventory Total Sold Sold Price
“Technology has become quite the disruptor in San Francisco’s real estate market, causing prices to increase dramatically, and it’s not just the ripple effect from Silicon Valley. The necessity of technology in all market sectors has seen a substantial increase of business presence in the Bay Area, from established industry titans to emerging entrepreneurs running the gamut from the younger self-made tech gurus and financial savvy businessmen to retirees returning to enjoy the lifestyle of living surrounded by all the amenities. International influence is still governed by the Asian buyer, and the most favored purchases are for properties offering the new luxury high-rise residences with all
the amenities or, conversely, historical buildings and the large pre-war co-ops.”
– Joel Goodrich, Sales Associate, Coldwell Banker Residential Brokerage in San Francisco
“In the world of fast, easy global travel and high-tech advances allowing for remote working practices, 70% of all of Chicago’s homes are still purchased by the local market. The older generation are moving back from the countryside to avail themselves of urban life and its accessibility to all of Downtown’s amenities. Younger couples with small children are heading away from condo living to attached single-family homes located in safe, prosperous areas with great schools, but still within easy access to the Downtown. Chicago offers a relatively stable market, as it is rarely affected by the financial market fluctuations, so investors, whether homegrown or from as far afield as Russia, Brazil
and China, have a deep trust in the safety of their money’s investment.”
– Chezi Rafaeli, Sales Associate, Coldwell Banker Residential Brokerage in Chicago
DECISION INDICATORSDECISION INDICATORS
3433
3844
4843
Overall ScoreOverall Score
L I F E S T Y L EL I F E S T Y L E
A M E N I T I E SA M E N I T I E S
L O C A T I O NL O C A T I O N
Overall score based on a maximum of 60 per category.Overall score based on a maximum of 60 per category.

COLDWELL BANKER GLOBAL LUXURY REPORT 2018 | 5756 | COLDWELL BANKER GLOBAL LUXURY REPORT 2018
DO
ME
ST
IC S
PO
TL
IGH
TDO
ME
ST
IC S
PO
TL
IGH
T
HO
NO
LULU
DECISION INDICATORS
53
30
37
Overall Score
L I F E S T Y L E
A M E N I T I E S
L O C A T I O N
72 78 82 89 95108
123134 143 149
135156
28 2240
2748 40 30 39 45 37 40
27
$1,950,500
$1,871,056
$1,861,000
$1,800,000
$1,895,000
$1,801,500$1,650,000
$1,855,000
$2,150,000
$1,850,000
$1,745,000
$1,750,000
0
50
100
150
200
250
300
$500
$500,500
$1,000,500
$1,500,500
$2,000,500
DEC JAN FEB MAR APR MAY JUN JUL AUG SEP OCT NOV DEC
141 154 159 175 184 199 213 233 243 251 225 24223 23 27
11135
18 19 67 36 126 96 80
$1,400,000
$1,998,000
$1,260,000
$2,257,500
$1,365,000
$1,245,000 $1,115,000
$4,675,000
$1,525,000
$1,528,500 $1,510,000
$4,023,000
0
50
100
150
200
250
300
350
400
450
-$500
$999,500
$1,999,500
$2,999,500
$3,999,500
DEC JAN FEB MAR APR MAY JUN JUL AUG SEP OCT NOV DEC
SINGLE-FAMILY HOMES – MONTHLY COMPARISON
CONDOS – MONTHLY COMPARISON
Inventory Total Sold Sold Price
Inventory Total Sold Sold Price
LIFESTYLE MARKETS
Recent studies have shown that a rising number of high-net-worth investors are increasingly mobile and frequently base their real estate decisions on lifestyle — rather than location. A lifestyle market is a destination often chosen by an elite set of homebuyers who are moving out of the city and endeavor to lead a certain kind of lifestyle, whether it be beach, golf, wine or simply enjoying more square footage for their money. We identified three core lifestyle markets to explore: Honolulu, Malibu and Martha’s Vineyard.
“Contrary to other Hawaiian resort-based cities, Honolulu is truly cosmopolitan, offering world-class shopping, fine dining, activities and good schools, combined with a beautiful climate and a safe environment. Attracting the ultra wealthy buyer from the U.S. mainland (44%), Japan, China and Singapore (37%), it has become a melting pot of mixed cultures. Moving here is often for business, but equally to be central to children at school in mainland U.S. and family in Asia, and in recent years, older generations have moved from other islands to avail themselves of the superior medical facilities. These ultra wealthy are predominantly choosing single-family detached homes with ocean front or views, increasing sales by 18% in 2017, or they are entering the new high-end condo market in order
to facilitate their requirement for full amenities and concierge-type services.”
– Tracy Allen, Vice President, Coldwell Banker Pacific Properties in Hawaii
Overall score based on a maximum of 60 per category.

COLDWELL BANKER GLOBAL LUXURY REPORT 2018 | 5958 | COLDWELL BANKER GLOBAL LUXURY REPORT 2018
DO
ME
ST
IC S
PO
TL
IGH
TDO
ME
ST
IC S
PO
TL
IGH
T
MA
RT
HA
’S V
INE
YAR
D
“Does Martha’s Vineyard choose you or do you choose it? Indeed, which of the six uniquely charming towns on this affluent summer retreat will steal your heart? This laid-back, private and understated island caters to the ultra wealthy looking to find relaxation, juxtaposed to its more glitzy and noisy counterparts of Nantucket and The Hamptons. Not that Martha’s Vineyard doesn’t attract its fair share of celebrities and legends; indeed, for them, stunning waterfront properties, acreage, luxury post and beam homes and deluxe condominiums in prime locations abound. Martha’s Vineyard is historically the seasonal second home of city dwellers from Boston to Washington, D.C., but more recent interest has grown from L.A., Charlotte, Texas and Chicago. It is still not an international destination, but as tourism increases from the UK and other European countries and with its proximity to so many international airports, as well as a private strip on the island, this may well change in the near future – after all, waterfront properties are always a draw.”
– Sean Federowicz, Owner/Broker, Coldwell Banker Landmarks Real Estate in Vineyard Haven, MA
MA
LIB
U
“In Malibu, we mainly sell high-end beach and bluff properties, and off-the-beach view properties. Buyers are typically either locals who are moving up or moving down, or from the Greater L.A. area who already own a primary residence in places like Beverly Hills, Bel Air, Santa Monica or Brentwood and are looking for a second or third home. A third segment of our buyers comes from the East Coast or the Midwest in search of the beach lifestyle. The initial reason people come to Malibu is our community’s unique rural character; we have mountains, beaches and large, spacious lots and beautiful views. Additional bonuses are all of the newer amenities and luxury shopping, making it
much easier to live here full-time or spend months out of the year here.”
– Sandro Dazzan, Sales Associate, Coldwell Banker Residential Brokerage in Malibu
DECISION INDICATORSDECISION INDICATORS
5350
3732
3038
Overall ScoreOverall Score
L I F E S T Y L EL I F E S T Y L E
A M E N I T I E SA M E N I T I E S
L O C A T I O NL O C A T I O N
17 1519 17 16 16 16 18 20
23
31 3136
2 2 14
1 3 2 1 1 2 N/A 2 N/A
$11,625,000
$19,937,975
$15,850,000
$10,938,500
$9,850,000
$12,025,000
$13,061,523
$20,000,000
$14,150,000
$21,500,000
$18,500,000
0
10
20
30
40
50
60
$500
$5,000,500
$10,000,500
$15,000,500
$20,000,500
DEC JAN FEB MAR APR MAY JUN JUL AUG SEP OCT NOV DEC
32 29 24 23 26 26 29 32 34 34 35 34 291 3 2 3 3 5 3 1 5 5 3 6 7
$5,000,000
$6,225,000
$5,925,000
$4,750,000$4,300,000
$3,639,000
$4,500,000
$2,475,000
$4,088,000
$4,125,000
$8,000,000
$4,762,500
$3,300,000
0
20
40
60
80
100
120
140
$500
$1,000,500
$2,000,500
$3,000,500
$4,000,500
$5,000,500
$6,000,500
$7,000,500
$8,000,500
DEC JAN FEB MAR APR MAY JUN JUL AUG SEP OCT NOV DEC
SINGLE-FAMILY HOMES – MONTHLY COMPARISONInventory Total Sold Sold Price
SINGLE-FAMILY HOMES & CONDOS – MONTHLY COMPARISONInventory Total Sold Sold Price
Overall score based on a maximum of 60 per category.Overall score based on a maximum of 60 per category.

COLDWELL BANKER GLOBAL LUXURY REPORT 2018 | 6160 | COLDWELL BANKER GLOBAL LUXURY REPORT 2018
DO
ME
ST
IC S
PO
TL
IGH
TD
OM
ES
TIC
SP
OT
LIG
HTD
OM
ES
TIC
SP
OT
LIG
HT
621
350 377 393 419 433 455 487538
418
505547 560
33 27 33 41 38 33 35 36 21 19 31 33 21
$1,470,000 $1,725,000
$2,135,000
$1,850,000$1,675,000
$1,725,000$1,900,000
$2,022,500
$1,500,000
$1,450,000$1,625,000
$2,016,000
$1,625,000
0
100
200
300
400
500
600
700
800
900
1000
$500
$500,500
$1,000,500
$1,500,500
$2,000,500
DEC JAN FEB MAR APR MAY JUN JUL AUG SEP OCT NOV DEC
202266 289 311 321 334 338 345
389
296
402450 441
25 13 27 36 36 50 43 33 25 30 28 20 42
$657,530$735,000
$650,000$697,500
$625,000$679,000 $650,000
$800,000
$650,000
$965,000
$779,000 $645,000 $656,250
050100150200250300350400450500550600650700750800
$0
$100,000
$200,000
$300,000
$400,000
$500,000
$600,000
$700,000
$800,000
$900,000
$1,000,000
DEC JAN FEB MAR APR MAY JUN JUL AUG SEP OCT NOV DEC
SINGLE-FAMILY HOMES – MONTHLY COMPARISON
CONDOS – MONTHLY COMPARISON
Inventory Total Sold Sold Price
Inventory Total Sold Sold Price
BO
CA
RA
TO
N
“More than half of our deals are coming from the Northeast — New York, Connecticut and New Jersey. If the buyers are younger, they’re generally coming here because it’s a great place to raise a family, since we have such good schools. Older clientele are generally coming here because it’s a great place to retire, thanks to our favorable tax situation, favorable weather and recreational activities. We’re selling a lot of waterfront condos and golf communities right now. It used to be that Boca Raton was considered a second-home market, but that’s beginning to change as more people are moving here as full-time residents. I would attribute it to a combination of Wall Street being at an
all-time high, Florida’s favorable tax rates and great weather.”
– Jonathan Postma, Sales Associate, Coldwell Banker Residential Real Estate in Boca Raton
DECISION INDICATORS
41
41
38
Overall Score
L I F E S T Y L E
A M E N I T I E S
L O C A T I O N
EVOLVING MARKETS
A new niche of evolving markets is beginning to buck trends and defy traditional categorization as luxury diversification continues. Markets that have been historically known as second-home havens are now becoming magnets for full-time residency, like Boca Raton. Slower-paced markets, such as Dallas and Stowe, VT, are shifting into lock-and-leave meccas or luxury centers as affluent buyers flee from the coasts for a lower price per square foot.
Overall score based on a maximum of 60 per category.

COLDWELL BANKER GLOBAL LUXURY REPORT 2018 | 6362 | COLDWELL BANKER GLOBAL LUXURY REPORT 2018
DO
ME
ST
IC S
PO
TL
IGH
T
DA
LLA
S
364
261297 320
364 345310 331 328
381410 414
345
6421
4891
64103 116
64 72 56 68 61 86
$1,272,500
$1,080,000
$1,317,500
$1,249,000
$1,169,425
$1,225,000
$1,247,500$1,166,630
$1,235,000
$1,126,000
$1,170,000$1,273,000
$1,430,000
0
100
200
300
400
500
600
700
800
$0
$200,000
$400,000
$600,000
$800,000
$1,000,000
$1,200,000
$1,400,000
$1,600,000
DEC JAN FEB MAR APR MAY JUN JUL AUG SEP OCT NOV DEC
1 4 7 79
1316 17 17 18
16 15 16
N/A 1 N/A 1 N/A N/A N/A N/A2 1 N/A
2 2
$2,525,000
$1,212,500
$2,950,000
$1,570,250 $1,467,500
0
5
10
15
20
25
30
35
40
45
50
500
500500
1000500
1500500
2000500
2500500
3000500
DEC JAN FEB MAR APR MAY JUN JUL AUG SEP OCT NOV DEC
86101
119 127 131 131 132 125 133 144167
182153
23 13 15 18 24 31 30 2917 22 16 22 30
$654,000
$810,000
$752,000 $651,500$714,000
$759,000
$799,000 $674,900
$620,800
$747,250$822,500
$663,250$722,500
0
50
100
150
200
250
300
350
$0
$100,000
$200,000
$300,000
$400,000
$500,000
$600,000
$700,000
$800,000
$900,000
DEC JAN FEB MAR APR MAY JUN JUL AUG SEP OCT NOV DEC
SINGLE-FAMILY HOMES – MONTHLY COMPARISON
CONDOS – MONTHLY COMPARISON
Inventory Total Sold Sold Price
Inventory Total Sold Sold Price
DO
ME
ST
IC S
PO
TL
IGH
T
ST
OW
E
DECISION INDICATORSDECISION INDICATORS
3930
4438
3752
Overall ScoreOverall Score
L I F E S T Y L EL I F E S T Y L E
A M E N I T I E SA M E N I T I E S
L O C A T I O NL O C A T I O N
“Stowe, once a sleepy, quaint New England ski town, recently had its ski operations purchased by the Vail Corporation and is fast becoming a recognized ski resort and mecca for those searching for new year-round activity destinations. While our luxury real estate market looks to be quietly steady, don’t be fooled – the ultra wealthy aren’t buying luxury homes, they are building them! Once-vacant lots and land with older homes situated on the ski slopes are now being purchased by the ultra wealthy, whose pockets can afford the cost of constructing their dream home. Stowe is still mostly a local destination for those within driving distance — including cities such as New York, Boston and even Washington, D.C. The Burlington International Airport is only 40 minutes away, but a smaller local airport, only 10 minutes north, could
prove irresistible to those with private jets.”
– McKee Macdonald, Broker, Coldwell Banker Carlson Real Estate in Stowe, VT
“We’re seeing a big resurgence in high-rise properties… downtown Dallas and the surrounding areas have really come into their own. Luxury homes are always in demand in the prestigious neighborhoods of the Park Cities and Preston Hollow. Whether they are lawyers, doctors, venture capitalists, oil and gas professionals, wealth managers or self-made in many other industries – there are a variety of entrepreneurs moving to Dallas. Centrally located, with no state income tax, a business-friendly attitude and an airport offering international accessibility, Dallas is attracting the ultra wealthy from coastal cities in California as well as Chicago, Washington and New York. We are also seeing an influx of overseas buyers. Dallas is continuing to see a transformation as a result of tech growth, corporate relocations, and a booming construction industry, throwing off its cowboy image to become a hot-property market
providing a high-end, multi-residential lifestyle to professionals from around the world.”
– Cody Farris, Sales Associate, Coldwell Banker Apex, Realtors in Dallas
SINGLE-FAMILY HOMES – MONTHLY COMPARISONInventory Total Sold Sold Price
Overall score based on a maximum of 60 per category.Overall score based on a maximum of 60 per category.
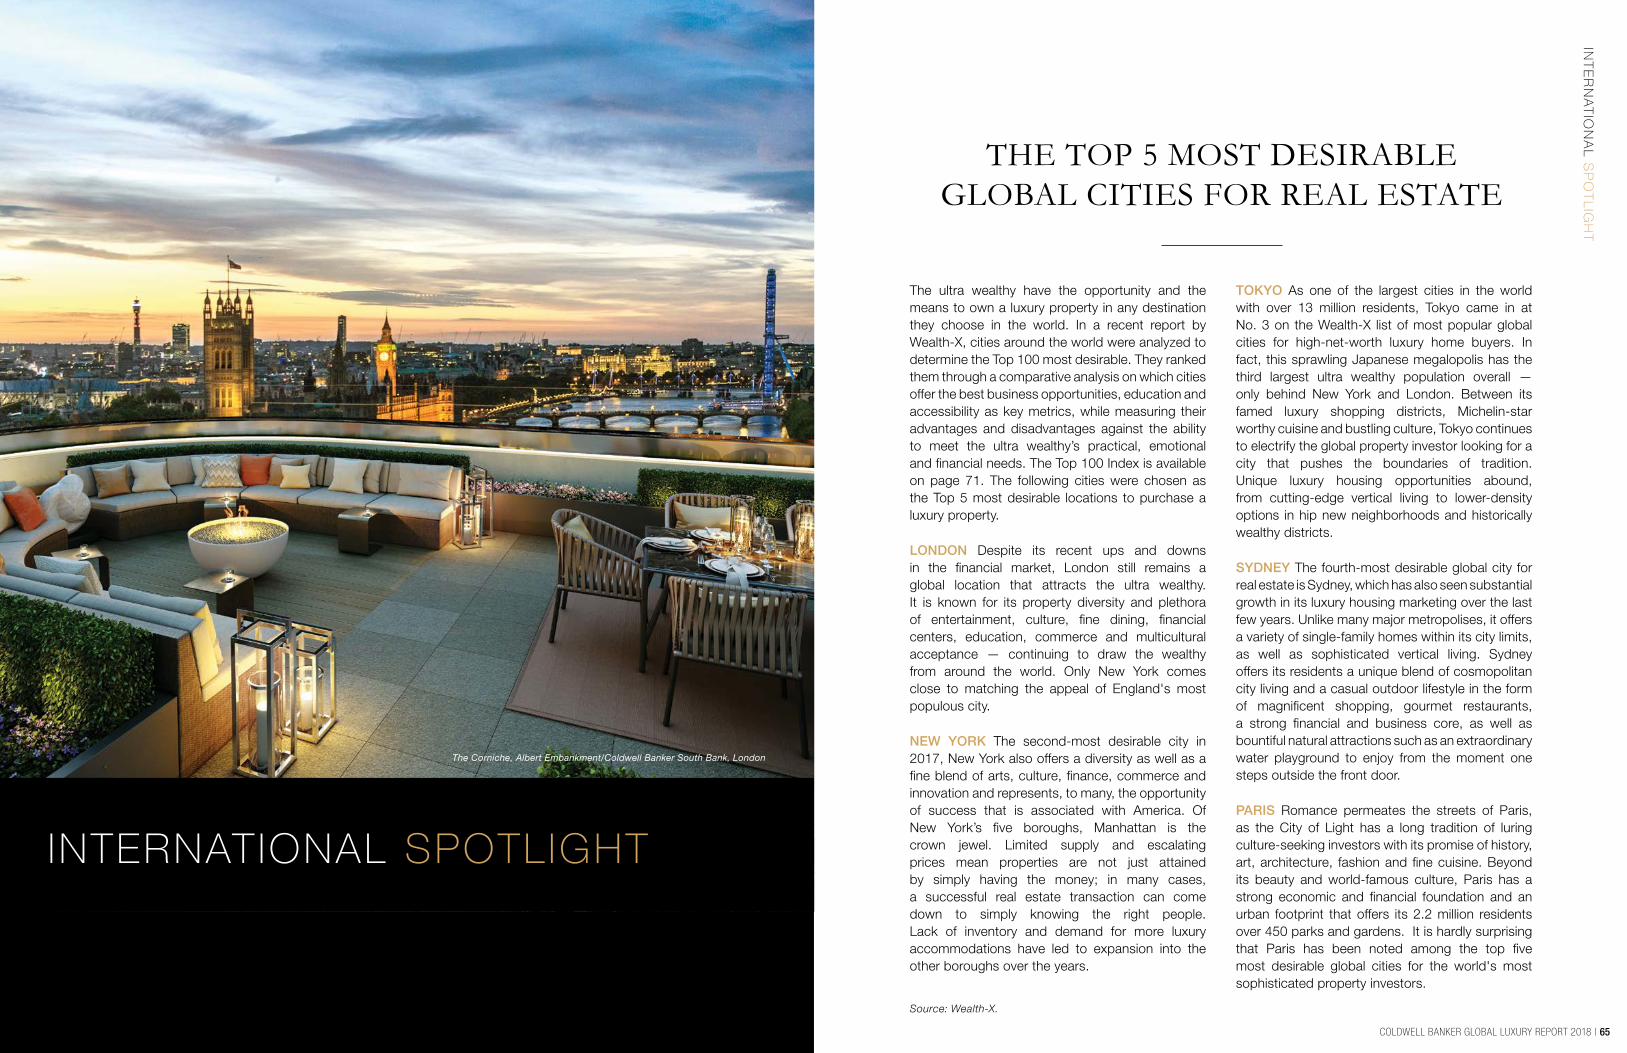
COLDWELL BANKER GLOBAL LUXURY REPORT 2018 | 6564 | COLDWELL BANKER GLOBAL LUXURY REPORT 2018
The ultra wealthy have the opportunity and the means to own a luxury property in any destination they choose in the world. In a recent report by Wealth-X, cities around the world were analyzed to determine the Top 100 most desirable. They ranked them through a comparative analysis on which cities offer the best business opportunities, education and accessibility as key metrics, while measuring their advantages and disadvantages against the ability to meet the ultra wealthy’s practical, emotional and financial needs. The Top 100 Index is available on page 71. The following cities were chosen as the Top 5 most desirable locations to purchase a luxury property.
LONDON Despite its recent ups and downs in the financial market, London still remains a global location that attracts the ultra wealthy. It is known for its property diversity and plethora of entertainment, culture, fine dining, financial centers, education, commerce and multicultural acceptance — continuing to draw the wealthy from around the world. Only New York comes close to matching the appeal of England's most populous city.
NEW YORK The second-most desirable city in 2017, New York also offers a diversity as well as a fine blend of arts, culture, finance, commerce and innovation and represents, to many, the opportunity of success that is associated with America. Of New York’s five boroughs, Manhattan is the crown jewel. Limited supply and escalating prices mean properties are not just attained by simply having the money; in many cases, a successful real estate transaction can come down to simply knowing the right people. Lack of inventory and demand for more luxury accommodations have led to expansion into the other boroughs over the years.
TOKYO As one of the largest cities in the world with over 13 million residents, Tokyo came in at No. 3 on the Wealth-X list of most popular global cities for high-net-worth luxury home buyers. In fact, this sprawling Japanese megalopolis has the third largest ultra wealthy population overall — only behind New York and London. Between its famed luxury shopping districts, Michelin-star worthy cuisine and bustling culture, Tokyo continues to electrify the global property investor looking for a city that pushes the boundaries of tradition. Unique luxury housing opportunities abound, from cutting-edge vertical living to lower-density options in hip new neighborhoods and historically wealthy districts.
SYDNEY The fourth-most desirable global city for real estate is Sydney, which has also seen substantial growth in its luxury housing marketing over the last few years. Unlike many major metropolises, it offers a variety of single-family homes within its city limits, as well as sophisticated vertical living. Sydney offers its residents a unique blend of cosmopolitan city living and a casual outdoor lifestyle in the form of magnificent shopping, gourmet restaurants, a strong financial and business core, as well as bountiful natural attractions such as an extraordinary water playground to enjoy from the moment one steps outside the front door.
PARIS Romance permeates the streets of Paris, as the City of Light has a long tradition of luring culture-seeking investors with its promise of history, art, architecture, fashion and fine cuisine. Beyond its beauty and world-famous culture, Paris has a strong economic and financial foundation and an urban footprint that offers its 2.2 million residents over 450 parks and gardens. It is hardly surprising that Paris has been noted among the top five most desirable global cities for the world's most sophisticated property investors.
THE TOP 5 MOST DESIRABLE GLOBAL CITIES FOR REAL ESTATE
INT
ER
NA
TIO
NA
L S
PO
TL
IGH
T
INTERNATIONAL SPOTLIGHT
The Corniche, Albert Embankment/Coldwell Banker South Bank, London
Source: Wealth-X.

COLDWELL BANKER GLOBAL LUXURY REPORT 2018 | 6766 | COLDWELL BANKER GLOBAL LUXURY REPORT 2018
INT
ER
NA
TIO
NA
L S
PO
TL
IGH
T INT
ER
NA
TIO
NA
L S
PO
TL
IGH
TIN
TE
RN
AT
ION
AL
SP
OT
LIG
HT
THE LUXURY REAL ESTATE MARKET Despite the current uncertainty of Brexit and a slight slowing in the market, the property market in London is rarely considered anything but a sound investment, if you can afford it! Ultra luxury prices were also affected by an additional new tax that increased the amount payable on residential purchases and second homes purchased by an overseas buyer. Reflecting the earlier period of rapid value growth, prices in the London market are among the most expensive in the world, even going up to US$6,000 per square foot for the very best properties.
WHO ARE THE BUYERS? Still highly popular with the British themselves, whose wealthy are numerous, London draws an eclectic crowd from around the world with Russia, China and the Middle East as its dominant buyers and tenants. Seen as a city with endless investment potential, whether it’s for the long term, converting old to new, or a base to visit Europe, it attracts parents looking for excellent schooling. And, of course, London is still one of the largest financial centers in the world. Finally, it is considered by many as the cultural city for arts, entertainment and connectivity to the socially elite. Indeed, a luxury residence in London is widely regarded as a necessity in the lifestyle of the wealthy.
WHAT AND WHERE ARE THEY BUYING? Location is key, as with all luxury properties, and for London no area is more prestigious than the neighborhoods of Mayfair, Knightsbridge and Belgravia. Unique to London is the ability to still purchase a detached family house in these historic communities, as well as attached but elegant
Victorian or Georgian four-story town homes, a name coined during the period when the English dignitaries would come to “town for the season.” Out of reach for even some of the ultra wealthy, neighborhoods such as Chelsea, Notting Hill, Fulham, Hampstead, Kensington and even the Southbank and the City of London saw an increase in the influx of the affluent, coupled with steady price rises, and this still is true in 2017.
1LONDON
Overall Performance:
Strongest Points:
Weakest Points:
Ultra Wealthy Population:
Average Net-Worth:
Population of Ultra Wealthy Foreign Owners:
Median Price of Ultra Luxury Property*:
Median Price of Luxury Property*:
Most Popular Hobbies:
THE LUXURY REAL ESTATE MARKET Due to the steady recovery of the U.S. economy, coupled with the lack of supply, New York’s prices rose at record rates. 2017 has seen a leveling of the ultra wealthy home market with prices at a mere $3,400 per square foot in Manhattan, which is among the highest in the world. Ever innovative, New York’s developers have begun to build in the surrounding suburbs of Brooklyn, Queens, Long Island and the Bronx. Investors with a keen eye have been quick to follow, and supply levels at the end of 2017 were as low as two months.
WHO ARE THE BUYERS? New York is an epitome of a multicultural city – from Asia, Africa, Europe, South America, the Caribbean, Australasia and the Middle East, there isn’t a culture that is not represented. Asia and South America are now the largest buyers, as the increasing U.S. dollar and the weakening euro and British pound have slowed these buyers’ investment opportunity.
WHAT AND WHERE ARE THEY BUYING? While owning a property in Manhattan is still considered to be the most desirable, there is truly something for every taste in New York: from full-floor apartments and luxury cooperatives to townhomes – also, although not always accurately, known as brownstones – but there are few, if any, single-family homes available for purchase.
Some of the prestigious locations in Manhattan are the Upper East Side, which includes the illustrious street names of Park Avenue and Fifth Avenue, the residential areas that surround Central Park and Tribeca, with the 57th Street Corridor a fairly new addition, dubbed Billionaire’s Row. Close proximity
to the best shops, restaurants, theaters and schools are key factors, but the young affluent are looking for inclusive amenities such as concierge services, health clubs and 24/7 security, and therefore are more focused on buying fully equipped, renovated large one-and two-bedroom luxury condos with the “right” view.
During 2017, the emerging new communities for the ultra wealthy moved to Brooklyn’s Downtown, Bedford-Stuyvesant and Prospect Heights. In Manhattan, the Lower East Side and Hudson Yards became the new hot spots.
2NEW YORK
Overall Performance:
Strongest Points:
Weakest Points:
Ultra Wealthy Population:
Average Net-Worth:
Population of Ultra Wealthy Foreign Owners:
Median Price of Ultra Luxury Property*:
Median Price of Luxury Property*:
Most Popular Hobbies:
2nd
Ultra Wealthy population Access to leading universities Financial safe haven
Competitiveness of property tax Property value-for-money
8,375 individuals (1st largest)
US$165 million
26%
US$3,400 per Sq. Ft. in 2016 up 4.5%
US$1,800 per Sq. Ft. in 2016 up 3.5%
Philanthropy, Education, Art
Source: Wealth-X. *Ultra Luxury refers to homes worth over US$8m. Luxury refers to homes valued between US$1.5m and US$8m. Source: Wealth-X. *Ultra Luxury refers to homes worth over US$8m. Luxury refers to homes valued between US$1.5m and US$8m.
1st
Cultural richness Access to leading universities Financial safe haven Connectivity via air travel
Competitiveness of property tax Property value-for-money
6,400 individuals (2nd largest)
US$130 million
37%
US$11.5 million in 2016 up 7.3%
US$2.1 million in 2016 up 1.5%
Philanthropy, Travel, Art

COLDWELL BANKER GLOBAL LUXURY REPORT 2018 | 6968 | COLDWELL BANKER GLOBAL LUXURY REPORT 2018
THE LUXURY REAL ESTATE MARKET Australia’s socio-political stability, strong education system and dynamic mix of outdoor amenities have been a strong attraction for the ultra wealthy as well as its diversity of real estate. Annual prices have seen upwards of double-digit price increases in the last 10 years, created by high demand and a lack of new development in the luxury arena. Even with increasing real estate prices, Sydney still offers great value for the ultra wealthy — especially if they are looking for single-family detached living. Single-family homes are far more popular than apartment-style living. Thus, many Sydney properties offer the opportunity to have more square footage, larger lot sizes, outdoor living spaces and a desirable location near the waterfront or close to beaches.
WHO ARE THE BUYERS? Sydney has experienced a significant increase in foreign buyers over the last few years, particularly from the Chinese, who have a preference for high-rise buildings and long-term investment opportunities. Despite increasing foreign tax duties on purchasing properties (especially for non-resident owners), affluent investors from the UK and Europe are still attracted to owning a luxury detached property that offers all of the advantages of a cosmopolitan city, but with a relaxed outdoor lifestyle not available in their own country.
WHAT AND WHERE ARE THEY BUYING? The Sydney ultra wealthy buyer tends to gravitate towards larger properties. Sydney’s roots are centered around embracing outdoor living, so most luxury properties tend to accommodate pools, tennis courts and garages for "toys." Point Piper, Darling Point and Centennial Park have not allowed
for high-rise apartments to be built; zoning has kept these areas more boutique in nature and therefore has created a demand that has turned these communities into some of the most sought-after real estate. Waterfront properties command premium dollar figures. Properties on the famous beaches of Bondi, Manly and Mosman command high prices, while on the North Shore, prices have soared in communities such as Neutral Bay, Lavender Bay, Milsons Point and Cremorne Point. Those ultra wealthy buyers who wish to lead an urban lifestyle in the center of the action tend to focus on apartments with magnificent views of the city skyline, the Harbour Bridge, Sydney Opera House and the great watery expanse of Sydney Harbour.
INT
ER
NA
TIO
NA
L S
PO
TL
IGH
T INT
ER
NA
TIO
NA
L S
PO
TL
IGH
TINT
ER
NA
TIO
NA
L S
PO
TL
IGH
T INT
ER
NA
TIO
NA
L S
PO
TL
IGH
T
THE LUXURY REAL ESTATE MARKET Despite being known as one of the world’s most expensive cities, Tokyo's real estate prices have yet to rival cities like London and Hong Kong. Rising residential land prices over the last few years have driven up the average price per square foot. An increasing wealthy population, shortage of space and the 2020 Olympic investment have all contributed to prices skyrocketing and several record property sales over the last few years. Foreigners who are looking to purchase real estate in Japan do not face many rules, another contributor to the growing numbers of luxury home purchasers. In such a densely populated city, where luxury apartments abound, square footage comes at a premium. Prestige is also a powerful driver in Tokyo high-end real estate, with the distinctive and bold designs of renowned Japanese architects being highly prized among affluent investors. The perception of prestige is often defined by a building's amenities – such as large garages, spa-like gym facilities, swimming pools and concierge services, to name a few.
WHO ARE THE BUYERS?Although there are signs of increasing interest from the Chinese, Tokyo’s foreign buyers are mainly from the United Kingdom, the United States, Taiwan and South Korea, with a small percentage from Australia. Most foreigners choose to invest in Tokyo real estate because they have business ties or family relationships in Japan, as opposed to lifestyle, education or cultural reasons. About 92% of Tokyo’s ultra wealthy residents are from Japan.
WHAT AND WHERE ARE THEY BUYING?Tokyo is best known for its high-styled vertical
living and many diverse neighborhoods. Azabu and Hiro are two of the most expensive residential neighborhoods, offering a private haven for the rich and famous. Meguro is an established, culturally rich neighborhood, mostly consisting of families who have lived there for generations. Many of Tokyo’s oldest and wealthiest families live in Aoyama-Itchome, where homes are rarely put on the market. Omotesnado, the fashion district of Tokyo, has a posh shopping and entertainment area, as well as much sought-after apartments. Lastly, the Shibuya district has a reputation for entertainment and nightlife, but has been undergoing rapid change with new Japanese tech startups (nicknamed “Bit Valley”) and a regeneration of one of the world’s busiest transport hubs.
3TOKYO
Overall Performance:
Strongest Points:
Weakest Points:
Ultra Wealthy Population:
Average Net-Worth:
Population of Ultra Wealthy Foreign Owners:
Median Price of Ultra Luxury Property*:
Median Price of Luxury Property*:
Most Popular Hobbies:
4SYDNEY
Overall Performance:
Strongest Points:
Weakest Points:
Ultra Wealthy Population:
Average Net-Worth:
Population of Ultra Wealthy Foreign Owners:
Median Price of Ultra Luxury Property*:
Median Price of Luxury Property*:
Most Popular Hobbies:
Source: Wealth-X. *Ultra Luxury refers to homes worth over US$8m. Luxury refers to homes valued between US$1.5m and US$8m. Source: Wealth-X. *Ultra Luxury refers to homes worth over US$8m. Luxury refers to homes valued between US$1.5m and US$8m.
3rd
Luxury shopping Personal safety Ultra wealthy population Cultural richness
Green footprint Property value-for-money
6,050 individuals (3rd largest)
US$265 million
8%
Unknown
Unknown
Sports, Philanthropy, Education
4th
Competitiveness of property tax Property value-for-money Green footprint
Ultra wealthy population Connectivity via air travel
1,075 individuals
US$105 million
17%
Unknown
Unknown
Sports, Philanthropy, Art

COLDWELL BANKER GLOBAL LUXURY REPORT 2018 | 7170 | COLDWELL BANKER GLOBAL LUXURY REPORT 2018
INT
ER
NA
TIO
NA
L S
PO
TL
IGH
TIN
TE
RN
AT
ION
AL
SP
OT
LIG
HT IN
TE
RN
AT
ION
AL
SP
OT
LIG
HTIN
TE
RN
AT
ION
AL
SP
OT
LIG
HT IN
TE
RN
AT
ION
AL
SP
OT
LIG
HT
5PARIS
Overall Performance:
Strongest Points:
Weakest Points:
Ultra Wealthy Population:
Average Net-Worth:
Population of Ultra Wealthy Foreign Owners:
Median Price of Ultra Luxury Property*:
Median Price of Luxury Property*:
Most Popular Hobbies:
1
2
3
4
5
6
6
6
9
9
11
11
13
14
14
16
17
17
17
20
20
20
23
23
25
26
26
26
29
30
30
30
30
30
30
36
37
37
37
37
41
42
42
42
42
46
46
46
49
50
London, UK
New York, US
Tokyo, Japan
Sydney, Australia
Paris, France
Chicago, US
San Francisco, US
Osaka, Japan
Toronto, Canada
Washington, D.C., US
Hong Kong, China
Berlin, Germany
Los Angeles, US
Munich, Germany
Boston, US
Singapore
Miami, US
Houston, US
Stockholm, Sweden
Dallas, US
Atlanta, US
Hamburg, Germany
San Diego, US
Mexico City, Mexico
Seattle, US
Madrid, Spain
Copenhagen, Denmark
Manchester, UK
Shanghai, China
Bangkok, Thailand
Beijing, China
Zurich, Switzerland
Geneva, Switzerland
Vancouver, Canada
Lisbon, Portugal
Dubai, UAE
Cape Town, South Africa
Oslo, Norway
Basel, Switzerland
Moscow, Russia
Rome, Italy
Sao Paulo, Brazil
Dublin, Ireland
Mumbai, India
Kuwait City, Kuwait
Johannesburg, South Africa
Shenzhen, China
Rio de Janeiro, Brazil
Guangzhou, China
Abu Dhabi, UAE
77
75
70
61
60
59
59
59
58
58
57
57
56
55
55
54
53
53
53
52
52
52
51
51
50
47
47
47
46
45
45
45
45
45
45
44
42
42
42
42
41
39
39
39
39
38
38
38
37
35
RANKING RANKINGCITY CITYSCORE
(OUT OF 100)SCORE
(OUT OF 100)
*As provided by Wealth-X, 2016.
THE INDEX
Source: Wealth-X. *Ultra Luxury refers to homes worth over US$8m. Luxury refers to homes valued between US$1.5m and US$8m.
THE LUXURY REAL ESTATE MARKET Since mid-2015, the Parisian luxury real estate market has experienced strong growth. Although the city is not as expensive as London or New York, real estate prices have been relatively stable since there is so little scope for new development within the city. However, luxury developers have begun to see opportunity for growth outside the limits of the central core. A large social project called “Grand Paris," presents one such opportunity, and is anticipated to encompass a fully automated metro line that will encircle Paris and connect the city to outlying communities.
WHO ARE THE BUYERS?Parisians love their city and still account for a significant portion of the luxury real estate market. Whether old money or new, they are great preservers of their city’s joie de vivre. Many of Europe’s ultra wealthy see Paris as a necessity in their portfolio, especially those with a passion for fashion and gourmet food. Brexit has also opened the door to a new group of international buyers. Investors from currency-strong countries, such as the United States, China, Latin America and the Middle East, also continue to see strategic opportunity in Paris. WHAT AND WHERE ARE THEY BUYING?Paris offers 20 unique neighborhoods, called arrondissements, each with its own charm and architecture. Property investors can explore each arrondissement and find niches that reflect their personalities. For fashion, it’s Avenue Montaigne. For history lovers, it’s Invalides. If you want to mingle with the who’s who of Paris, it's Villa Montmorency.For the quintessential Parisian experience, then look no further than Saint-Germain-des-Prés with
its genteel blocks lined with upscale art galleries, storied cafés, designer boutiques, restaurants and museums. The most desirable areas are still found along the River Seine and the immediate areas surrounding Champs-Elysees. For young affluent buyers, areas such as Montmartre and Marais offer one- and two-bedroom apartments with access to lively cafés and nightlife. Wealthy families seeking more space — whether in large apartments or in mansions — as well as proximity to good schools and green space tend to reside in the westerly areas of Paris, including Neuilly-sur-Seine, Boulogne and Saint-Cloud.
5th
Cultural richness Luxury shopping Connectivity via air travel
Competitiveness of property tax Property value-for-money
3,475 individuals
US$315 million (highest of top 5)
21%
US$3,000 per sq. ft. in 2016 up 8%
US$1,100 per sq. ft. in 2016 up 7%
Art, Family, Fashion

COLDWELL BANKER GLOBAL LUXURY REPORT 2018 | 7372 | COLDWELL BANKER GLOBAL LUXURY REPORT 2018
More than 27% of traffic to ColdwellBankerLuxury.com was international, representing
visitors from more than 225 countries, led by Canada,
France, Brazil, Russia, Spain and the United Kingdom.
The Coldwell Banker social accounts geared toward luxury,
including the lifestyle blog, blog.coldwellbankerluxury.com,
saw an 800% increase in social engagements. Overseas web traffic combined for 55% of readership.
The Coldwell Banker® brand has a global reach with offices in 47 countries and territories, including the United States and Canada. There are approximately 3,000 Coldwell Banker offices and over 91,000 Independent Contractor Sales Associates/Representatives worldwide.
Sell $129.6 million in million+ homes each day*
Handled 24,790 transaction sides of $1 million+ homes, with an average sales price of $1.9 million*
COLDWELL BANKER® AFFILIATED AGENTS AND TEAMS:
LUXURY BY THE NUMBERS
*Average daily sales. Data based on closed and recorded transaction sides of homes sold for more than $1 million (USD$) or more as reported by the U.S. Coldwell Banker® franchise system for the calendar year 2016.

COLDWELL BANKER GLOBAL LUXURY REPORT 2018 | 7574 | COLDWELL BANKER GLOBAL LUXURY REPORT 2018
2017 SIGNIFICANT LISTINGS ACROSS THE U.S.
2017 SIGNIFICANT LISTINGS ACROSS THE GLOBE
$ 9 0 M I L L I O NWOODLAND MANOR | Brookline, MA
$ 8 4 M I L L I O NROQUEBRUNE-CAP-MARTIN | Côte D'Azur, France
$ 8 5 M I L L I O NTHE MALIBU CASTLE | Malibu, CA
$ 4 7 M I L L I O NPORTISCO | Olbia-Tempio, Italy
$ 6 5 M I L L I O NPOLO RANCH ESTATE | Summerland, CA
$ 3 9 M I L L I O NBIG DARBY ISLAND | Exumas, Bahamas
$ 3 9 . 7 5 M I L L I O NTHE POND HOUSE | Aspen, CO
$ 2 8 . 9 M I L L I O NELEGANT VILLA | Marbella, Spain
$ 3 9 M I L L I O NSTAR ISLAND ESTATE | Miami, FL
$ 2 5 M I L L I O NSTEELE POINT ESTATE | Tortola, British Virgin Islands
LU
XU
RY
BY
TH
E N
UM
BE
RS
Woodland Manor / Brookline, MA
•
•
•
•
•
•
•
•
•
•

COLDWELL BANKER GLOBAL LUXURY REPORT 2018 | 7776 | COLDWELL BANKER GLOBAL LUXURY REPORT 2018
•
LU
XU
RY
BY
TH
E N
UM
BE
RS
€ 9 . 8 M I L L I O NLA PEDRERA APARTMENT | Barcelona, SpainRepresented by Jayro RodriguezColdwell Banker Prestige, Barcelona (seller and buyer)
•
•
•
•
L I S T P R I C E : $ 4 6 . 5 M I L L I O NEAST COAST TRADITIONAL | Santa Monica, CARepresented by Joyce ReyColdwell Banker Residential Brokerage, Beverly Hills (seller)
$ 2 4 . 4 M I L L I O NASPEN LAKES | Aspen, CORepresented by Chris Souki (buyer) and Bob Bowden (seller)Coldwell Banker Mason Morse, Aspen
$ 2 1 M I L L I O NBELLALAGO | Bellevue, WARepresented by Terry AllenColdwell Banker Bain, Seattle (buyer)
$ 1 6 . 5 M I L L I O NSUNSET ISLANDS | Miami, FLRepresented by Jill Eber and Jill HertzbergColdwell Banker Residential Real Estate, Florida (seller)
2017 SIGNIFICANT SALES
East Coast Traditional / Santa Monica, CA
COLDWELL BANKER GLOBAL LUXURY REPORT 2018 | 7978 | COLDWELL BANKER GLOBAL LUXURY REPORT 2018
DISCLAIMERS
METHODOLOGY FOR DATA REPORTING Top 10% is defined as homes with sold prices (or in terms of inventory, list prices), matching or exceeding the 90th percentile sold price for homes sold in 2017 in the specified city. Top 5% is defined as homes with sold prices (or in terms of inventory, list prices), matching or exceeding the 95th percentile sold price for homes sold in 2017 in the specified city.
Data is calculated monthly from various sources to attain the most accurate set of information pertaining to parameters, as seen throughout this report, such as closed sales, active listings, sold prices, sold-price-to-list-price percentages, days on market and sales ratios. Data is then represented both monthly and yearly throughout the report, using Medians, Averages, Totals, Percentages and Ratios. However, unless otherwise specified, statistics typically presented in this report represent both the monthly median and the median of monthly medians of the respective data. The median was calculated by arranging the data in a sequential order and selecting the middle number of the set, whether that number be a price, volume, number, percentage or ratio. To determine the median of the monthly median, monthly medians are totalled and the same method applied as for the monthly figure. Unless otherwise specified, all statistics are based on property sold. Inventory statistics are based on property available at the end of each month. Average Monthly Inventory and Average Monthly Sold statistics are based on the average of monthly property totals for each month. Sales Ratio is based on the ratio of Average Monthly Sold to Average Monthly Inventory. Market Status is an analysis of Sales Ratio and represents market speed and market type: Buyer’s = less than 15%; Balanced = 15% to less than 21%; Seller’s = 21% or greater. If greater than 100%, MLS® data reported previous month’s sales exceeded remaining inventory pulled at the end of the month.
DATA ON ULTRA-HIGH-NET-WORTH INDIVIDUALS (UHNWIs) Wealth-X’s team of researchers and analysts has access to an unrivaled proprietary database of global UHNWIs that is the largest in existence. UHNWIs are defined as having a net worth of US$30m and above. Wealth-X's databasehighlights their financial profiles, passions and interests, known associates, affiliations, family members, biographies, news, and more. Wealth-X uses a proprietary valuation model to assess all asset holdings including privately and publicly held businesses and investable assets to develop its net worth valuation model.
GLOBAL LUXURY RESIDENTIAL PROPERTY INDEX METHODOLOGY The Global Luxury Residential Property Index focuses exclusively on the top 10% of the residential property market with regards to sales price. It is based on the median selling price of luxury properties across a broad range of the world’s top destinations, including not only cities, but mountain resorts, seafront and countryside properties, to reflect the full nature of the wealthy's real estate holdings. The Index is based on property sales data from Barnes and Perchwell as well as publicly available data for locations including London and Singapore.
© 2018 Coldwell Banker Real Estate LLC. All rights reserved. Coldwell Banker®, the Coldwell Banker Logo, Coldwell Banker Global Luxury® and the Coldwell Banker Global Luxury Logo are registered service marks owned by Coldwell Banker Real Estate LLC in the United States and by Coldwell Banker LLC outside the United States. Coldwell Banker Real Estate LLC fully supports the principles of the Fair Housing Act and the Equal Opportunity Act. Each franchise is independently owned and operated. The statistical information showcased through The Report for Coldwell Banker Global Luxury has been compiled from various sources, including but not limited to Coldwell Banker Global Luxury’s Independent Sales Associates, Brokers, Brokerages and Affiliates, The Institute for Luxury Home Marketing, Wealth-X Pte. Ltd, local MLS boards, local tax records, private and public sources and Realtor.com. The Institute for Luxury Home Marketing publishes the Luxury Market Report on a monthly basis to measure market conditions for luxury real estate around the country and is prepared using statistical representation of the Median Price for each of the markets represented in its report. Information contained herein has been computed by The Institute for Luxury Home Marketing’s data research partner and shared with Coldwell Banker Global Luxury and based on information attained both privately and publicly. The data for this report is based on closed and recorded sides of homes sold during 2017. However, statistical information has been calculated using closed sales activity reported over a 13-month period from December 1, 2016, through December 31, 2017. Closed sales reported significantly later than this analysis period will not be included. All active status listing records were downloaded and processed to the same standards, at the end of each calendar month, during December 2016 through December 2017. Property-specific active and sales records were standardized, inaccurate list and sale prices were corrected when necessary and all duplicate records were manually excluded. As a result, statistics available via the source data providers may not correlate to this analysis.
Although we believe that high standards have been used in the preparation of the information, analysis and views presented, we take no responsibility or liability whatsoever for the contents. As not all private real estate activity is actively reported within its primary marketplaces, it is believed that not all property transfer data is included in this analysis. All the information is provided “as is,” and we make no express, implied, statutory or other warranty of any kind or guarantee as to the accuracy, timeliness, completeness, efficacy, merchantability and fitness for any particular purpose of any of the contents. This data is considered to be reliable but is not guaranteed, either by The Institute for Luxury Home Marketing, its data research partner or any participating MLS, Coldwell Banker Global Luxury Independent Sales Associates, Brokers, Brokerages or Affiliates. The information provided in this report is not a recommendation to buy or sell real estate, and when evaluating a particular property, it is recommended that specific comparable sales data is used in additional to this market trend information.
As far as applicable laws allow, we do not accept responsibility for errors, inaccuracies or omissions, nor for loss or damage that may result directly or indirectly from reliance on or use of its contents. Instead, it is recommended that all homeowners work directly with a licensed real estate agent or broker. Copyright © 2018. All rights reserved.