the rep project State of media report
15
THE REP PROJECT STATE OF MEDiA REPORT 2021
Transcript of the rep project State of media report

the rep project
Stateof mediareport
2021

2021
introduction This report examines the current state of media representations in film, television, advertising, video games, and music. More specifically, we analyze data from the past decade on representations of gender, race, age, disability, body size, and sexuality in different media types. This report establishes benchmarks to measure progress and to promote collaboration in the media research space.
This report was produced for the fifth annual State of Media Summit, co-sponsored by the Provincetown Film Society, The Representation Project, and the Center for Intersectional Media and Entertainment (CIME). Participants of the first Summit1 in 2017 generated a White Paper on Gender Inequality in Film and Television, and we expand upon this earlier report.
This State of Media Report combines publicly available data from a number of excellent research organizations, including:
• The hollywood diversiTy reporT, UcLA
• the GeenA DAvis InstitUte on GenDer in MeDiA
• the AnnenberG IncLUsion InitiAtive, University of soUthern cALiforniA
• the center for the stUDy of WoMen in teLevision & fiLM, sAn DieGo stAte University
• the Writers GUiLD of AMericA West
• the where we are on Tv report, GAy & LesbiAn ALLiAnce AGAinst DefAMAtion (GLAAD)
• the representAtion project
• Directors GUiLD of AMericA
Combining data from these sources provides a more complete picture of the state of media in the US than any single organization or report. For each year, we present the most reliable and valid data point available.2
We begin this report with analysis of representations in content and key decision-making roles in film, followed by sections on television, advertising, video games, and music.
| 1
1. Formerly called the Women’s Media Summit.
2. We recognize that combining reports with different denominators and methodologies into a single chart is not ideal, but given missing data, and a lack of universality in reports, this gives us the best overall snapshot.

film 50%
40%
20%
30%
10%
0%
2010 2011 2012 2013 2014 2015 2016 2017 2018 2019 2020
Baseline — 50.8% of us population
Figure 1: women characters in top films, 2010-2020
50%
40%
20%
30%
10%
0%
2010 2011 2012 2013 2014 2015 2016 2017 2018 2019 2020
Figure 2: Bipoc characters in top films, 2010-2020
5%
4%
2%
3%
1%
0%
2010 2011 2012 2013 2014 2015 2016 2017 2018 2019 2020
Baseline — 4.5% of us population
Figure 3: lgbtq+ characters in top films, 2010-2020
On screen Despite women making up 50.8% of the US population,3 male characters outnumber female characters two-to-one in the top grossing films. This has not improved in the last decade.
For the past decade, Black Indigenous and People Of Color (BIPOC) characters have been underrepresented in the top films. We saw significant progress starting in 2018, but have yet to achieve equitable representation (33.2% in 2020 compared with 39.9% of the US population4).
LGBTQ+ people are 4.5% of the US population5, and while progress has been made in the last three years in film, LGBTQ+ characters remain underrepresented at 1.7%.
3. Howden, L.M. and J.A. Meyer (2011). Age and Sex Composition: 2010, 2010 Census Briefs, United States Census Bureau, https://www.census.gov/prod/ cen2010/briefs/c2010br-03.pdf
4. United States Census (2019). Quick Facts, https://www.census.gov/quickfacts/fact/table/US/PST045219
5. Newport, F. (2018). In U.S., LGBT Rises to 4.5%. Gallup, May 22, https://news.gallup.com/poll/234863/ estimate-lgbt-population-rises.aspx
Baseline — 39.9% of us population
female characterssOurces:
2010-2019 USC Annenberg, Top 100 Films2020 The Rep Project, Top 10 Films
BIPOc characterssOurces:
2010-2019 USC Annenberg, Top 100 Films2020 The Rep Project, Top 10 Films
lgBtQ+ characterssOurce:
2010-2020 The Rep Project, Top 10 Films
| 2

25%
20%
10%
15%
5%
0%
2010 2011 2012 2013 2014 2015 2016 2017 2018 2019 2020
Baseline — 26.0% of us population
Figure 4: characters with disabilities in top films, 2010-2020
50%
40%
20%
30%
10%
0%
2010 2011 2012 2013 2014 2015 2016 2017 2018 2019 2020
Figure 5: characters ages 50+ in top films, 2010-2020
50%
40%
20%
30%
10%
0%
2010 2011 2012 2013 2014 2015 2016 2017 2018 2019 2020
Baseline — 42.5% of us population
Figure 6: fat characters in top films, 2010-2020
Characters with disabilities have remained virtually erased from film for the past decade, even though one-in-four Americans have a physical, cognitive, communication, or mental health disability.6
People ages 50+ make up 34.2% of the US population,7 but characters over 50 are outnumbered three-to-one in top films. We have seen no real improvement in the last decade.
Despite the fact that over 40% of Americans are classified as fat,8 these characters remain vastly underrepresented.9 In fact, we see a decline with half as many fat characters in 2020 as we saw in 2010 (7.3% compared to 14.8%).
characters with disaBilities
sOurces:2010-2014, 2020 The Rep Project, Top 10 Films
2015-2019 USC Annenberg, Top 100 Films
characters ages 50+sOurce:
2010-2020 The Rep Project, Top 10 Films
fat characterssOurce:
2010-2020 The Rep Project, Top 10 Films
Baseline — 34.2% of us population
6. Centers for Disease Control (2020). Disability Impacts All of Us. https://www.cdc.gov/ncbddd/disabilityandhealth/documents/disabilities_impacts_all_of_us.pdf
7. Joint Center for Housing Studies of Harvard University (2014). Demographics of an Aging America, https://www.jchs.harvard.edu/sites/default/files/jchs-housing_americas_older_adults_2014-ch2_0.pdf
8. Centers for Disease Control and Prevention (2018). FastStats: Obesity and Overweight, https://www.cdc.gov/nchs/fastats/obesity-overweight.htm
9. We are intentionally using the word “fat” because it is not an insult. We are part of a growing number of organizations and individuals reclaiming the word “fat.” We celebrate bodies in whatever form they come, with bumps, lumps, stretch marks, and curves.
| 3
20%
30%
10%
0%
2010 2011 2012 2013 2014 2015 2016 2017 2018 2019 2020
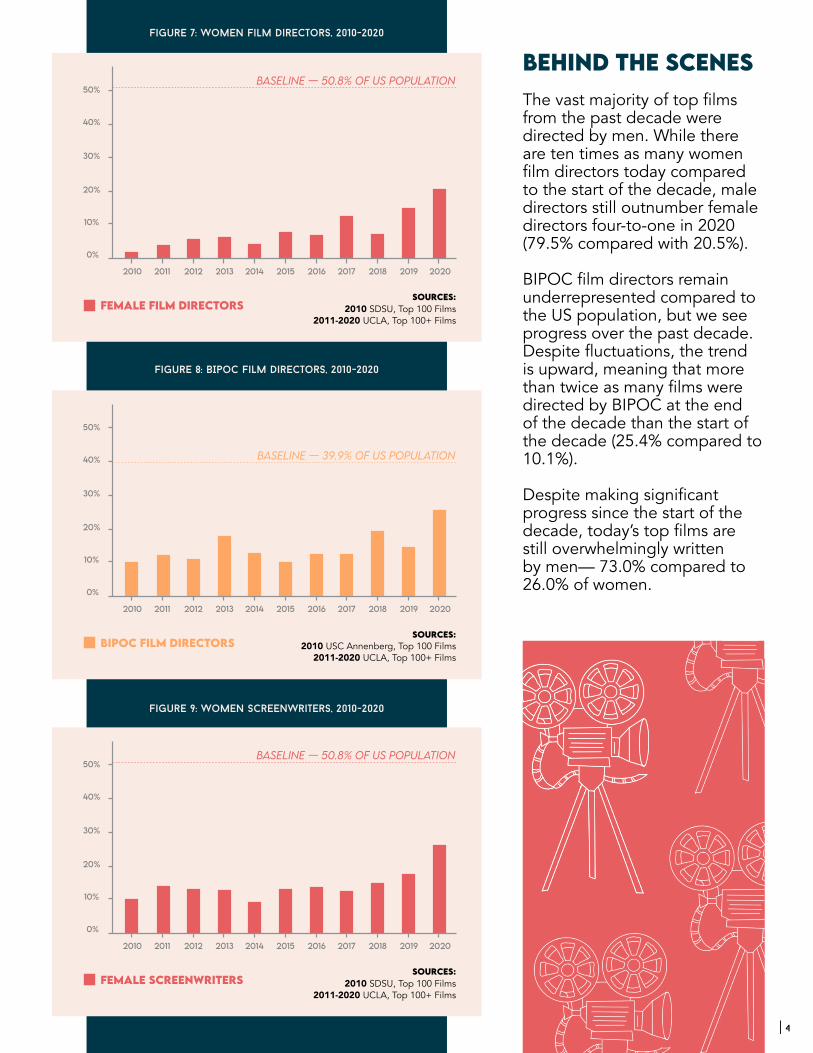
Figure 7: women Film directors, 2010-2020
Figure 8: BIpoC Film directors, 2010-2020
Figure 9: women Screenwriters, 2010-2020
sOurces:2010 SDSU, Top 100 Films
2011-2020 UCLA, Top 100+ Films
Behind the scenesThe vast majority of top films from the past decade were directed by men. While there are ten times as many women film directors today compared to the start of the decade, male directors still outnumber female directors four-to-one in 2020 (79.5% compared with 20.5%).
BIPOC film directors remain underrepresented compared to the US population, but we see progress over the past decade. Despite fluctuations, the trend is upward, meaning that more than twice as many films were directed by BIPOC at the end of the decade than the start of the decade (25.4% compared to 10.1%).
Despite making significant progress since the start of the decade, today’s top films are still overwhelmingly written by men— 73.0% compared to 26.0% of women.
female film directOrs
50%Baseline — 50.8% of us population
40%
20%
30%
10%
0%
2010 2011 2012 2013 2014 2015 2016 2017 2018 2019 2020
female screenwriterssOurces:
2010 SDSU, Top 100 Films2011-2020 UCLA, Top 100+ Films
50%Baseline — 50.8% of us population
40%
20%
30%
10%
0%
2010 2011 2012 2013 2014 2015 2016 2017 2018 2019 2020
sOurces:2010 USC Annenberg, Top 100 Films
2011-2020 UCLA, Top 100+ FilmsBIPOc film directOrs
50%
40% Baseline — 39.9% of us population
| 4

Figure 10: BIpoC Screenwriters, 2010-2020 The vast majority of films from the past decade have been written by white screenwriters, but in the past decade, BIPOC screenwriters increased from 6.0% to 25.9%. Notably, we see a significant increase in BIPOC screenwriters starting in 2018.
When it comes to who produces the top films, men outnumber women four-to-one in the past decade, with no clear trend of progress.
There is no available data on BIPOC producers over the past decade.
40%
20%
30%
10%
0%
2010 2011 2012 2013 2014 2015 2016 2017 2018 2019
Figure 11: women Film producers, 2010-2019
20%
30%
10%
0%
2010 2011 2012 2013 2014 2015 2016 2017 2018 2019 2020
BIPOc screenwriterssOurces:
2010 WGAW, Employed Screenwriters2011-2020 UCLA, Top 100+ Films
female film PrOducerssOurce:
2010-2019 USC Annenberg, Top 100 Films
50%
50%Baseline — 50.8% of us population
40% Baseline — 39.9% of us population
| 5

tv40%
20%
30%
10%
0%
‘10-‘11 ‘11-‘12 ‘12-‘13 ‘13-‘14 ‘14-‘15 ‘15-‘16 ‘16-‘17 ‘17-‘18 ‘18-‘19 ‘19-‘20
Figure 12: women characters in top Tv, 2010-2020
50%
40%
20%
30%
10%
0%
Figure 13: BIpoc characters in top Tv, 2010-2020
10%
8%
4%
6%
2%
0%
Baseline — 4.5% of us population
Figure 14: LGBTq+ characters in top Tv, 2010-2020
On screen We see much higher rates of representation for female characters in television compared to film over the past decade. Even so, female characters remain underrepresented in the most popular television programs (42.0% compared to 50.8% in the US population).
Over the last decade, BIPOC characters have fared much better in television than in film. We see a steady upward trend for BIPOC TV characters in the past decade, and in the 2019/2020 season, we achieved parity (41.2% compared to 39.9% of the US population)! This finding is historic given years of BIPOC erasure in entertainment media, and gives hope that equitable representation can be achieved in film as well.
LGBTQ+ characters have made great gains in popular television in the past decade. We see equitable representation compared to the US population for the first time with the 2016/2017 season and significant increases every year since.
female characterssOurces:
2010-2013 The Rep Project, Top 10 TV Shows2013-2020 SDSU, Top Broadcast TV
BIPOc characterssOurce:
2010-2020 The Rep Project, Top 10 TV Shows
lgBtQ+ characterssOurce:
2010-2020 GLAAD, All Scripted TV Shows
‘10-‘11 ‘11-‘12 ‘12-‘13 ‘13-‘14 ‘14-‘15 ‘15-‘16 ‘16-‘17 ‘17-‘18 ‘18-‘19 ‘19-‘20
‘10-‘11 ‘11-‘12 ‘12-‘13 ‘13-‘14 ‘14-‘15 ‘15-‘16 ‘16-‘17 ‘17-‘18 ‘18-‘19 ‘19-‘20
50%Baseline — 50.8% of us population
Baseline — 39.9% of us population
| 6

25%
20%
10%
15%
5%
0%
Figure 15: characters with disabilities in top Tv, 2010-2020
50%
40%
20%
30%
10%
0%
Figure 16: characters ages 50+ in top Tv, 2010-2020
50%
40%
20%
30%
10%
0%
Figure 17: fat characters in top Tv, 2010-2020
Characters with a physical, cognitive, communication, or mental health disability are virtually nonexistent in popular TV shows in the past decade. The number of characters with disabilities dropped from 3.1% in the 2010/2011 season to 1.6% in the 2019/2020.
For the past decade, characters ages 50+ have been underrepresented in popular television. We saw significant progress in age and representations for overall characters starting in 2015, but in the 2019/2020 season, characters 50+ were still only 19.2% of characters (compared to 34.2% in the US population).
Fat people are vastly underrepresented when it comes to overall characters in popular television. Despite being 42.5% of the US population, non-fat characters outnumbered fat characters twelve-to-one in popular TV (92.3% compared to 7.7% ).
characters with disaBilities
characters ages 50+sOurce:
2010-2020 The Rep Project, Top 10 TV Shows
fat characterssOurce:
2010-2020 The Rep Project, Top 10 TV Shows
‘10-‘11 ‘11-‘12 ‘12-‘13 ‘13-‘14 ‘14-‘15 ‘15-‘16 ‘16-‘17 ‘17-‘18 ‘18-‘19
‘10-‘11 ‘11-‘12 ‘12-‘13 ‘13-‘14 ‘14-‘15 ‘15-‘16 ‘16-‘17 ‘17-‘18 ‘18-‘19 ‘19-‘20
‘10-‘11 ‘11-‘12 ‘12-‘13 ‘13-‘14 ‘14-‘15 ‘15-‘16 ‘16-‘17 ‘17-‘18 ‘18-‘19 ‘19-‘20
sOurce:2010-2020 The Rep Project, Top 10 TV Shows
‘19-‘20
Baseline — 26.0% of us population
Baseline — 34.2% of us population
Baseline — 42.5% of us population
| 7

20%
30%
10%
0%
‘11-‘12 ‘12-‘13 ‘13-‘14 ‘14-‘15 ‘15-‘16 ‘16-‘17 ‘17-‘18 ‘18-‘19
Figure 18: women Tv show creators, 2012-2020
Figure 19: BIpoC Tv show creators, 2012-2019
Figure 20: women tv show directors, 2012-2019
sOurce:2011-2019 UCLA, Top Broadcast TV
2019-2020 SDSU, Top Broadcast, Cable & Streaming TV
Behind the scenesFor the past decade, the top television creators have been overwhelmingly male. From 2011 to 2020 we see little progress, with male TV show creators outnumbering female show creators three-to-one (72.0% compared with 28.0%).
Popular television from 2011 to 2019 has largely been made by white TV show creators, although we see a steady trend toward better BIPOC representation over time. In the past decade, the number of BIPOC writers increased from 4.2% to 10.7%.
The percentage of television episodes directed by women has more than doubled since the 2012/2013 season, but women remain underrepresented in this role compared to the US population. In the 2019/2020 season, male directors outnumbered female directors two-to-one (66.0% compared with 34.0%).
female tv creatOrs
50%Baseline — 50.8% of us population
40%
20%
30%
10%
0%
female tv directOrssOurce:
2012-2020 Directors Guild of America, All Episodes in Season
‘12-‘13 ‘13-‘14 ‘14-‘15 ‘15-‘16 ‘16-‘17 ‘17-‘18 ‘18-‘19 ‘19-‘20
50%Baseline — 50.8% of us population
40%
20%
30%
10%
0%
‘11-‘12 ‘12-‘13 ‘13-‘14 ‘14-‘15 ‘15-‘16 ‘16-‘17 ‘17-‘18 ‘18-‘19
sOurce:2011-2019 UCLA, Top Broadcast TVBIPOc tv creatOrs
50%
40% Baseline — 39.9% of us population
| 8
‘19-‘20

Figure 21: BIpoC tv show directors, 2012-2019
Figure 22: women tv show writers, 2010-2019
20%
30%
10%
0%
Figure 23: Bipoc tv show writers, 2010-2019
We have seen a steady increase in episodes directed by BIPOC directors since the 2012/2013 television season, bringing us closer to equitable representation. In the 2019/2020 season, twice as many episodes were directed by BIPOC people than in 2012/2013 (32.0% compared to 16.0%).
Over the past decade, the TV industry has seen a steady trend toward more women in the writer’s room. While women writers remain underrepresented compared to the US population, they have made significant gains with the 2019/2020 season (44.0%).
Similarly, the TV industry has seen significant progress when it comes to BIPOC writers.There are nearly double the number of BIPOC in the writer’s room in the 2019/2020 season than there were at the start of the decade (35.0% compared to 18.0%). This steady upward trend foreshadows an equitable writer’s room for BIPOC compared to the US population (39.9%) in the near future.
20%
30%
10%
0%
BIPOc tv directOrssOurce:
2012-2020 Directors Guild of America, All Episodes in Season
sOurce:2010-2020 WGAW, Employed TV Writers
‘12-‘13 ‘13-‘14 ‘14-‘15 ‘15-‘16 ‘16-‘17 ‘17-‘18 ‘18-‘19 ‘19-‘20
‘10-‘11 ‘11-‘12 ‘12-‘13 ‘13-‘14 ‘14-‘15 ‘15-‘16 ‘16-‘17 ‘17-‘18 ‘18-‘19 ‘19-‘20
female tv writers
50%Baseline — 50.8% of us population
50%
40% Baseline — 39.9% of us population
40%
20%
30%
10%
0%
sOurce:2010-2020 WGAW, Employed TV Writers
‘10-‘11 ‘11-‘12 ‘12-‘13 ‘13-‘14 ‘14-‘15 ‘15-‘16 ‘16-‘17 ‘17-‘18 ‘18-‘19 ‘19-‘20
BIPOc tv writers
50%
40% Baseline — 39.9% of us population
| 9

adS40%
20%
30%
10%
0%
2010 2011 2012 2013 2014 2015 2016 2017 2018 2019
Figure 24: women characters in advertising, 2010-2019
50%
40%
20%
30%
10%
0%
2010 2011 2012 2013 2014 2015 2016 2017 2018 2019
Figure 25: bipoc characters in advertising, 2010-2019
Figure 26: lgbtq+ characters, characters 50+, characters with disabilities, & fat characters in 2019 advertising
Male characters in advertising outnumber female characters two-to-one (61.4% compared with 38.6%), and this imbalance has not improved in the past decade.
Advertising has witnessed a significant increase in BIPOC character representation over time. BIPOC characters first achieved equitable representation in 2017 (41.4% compared to 39.9% of the US population).
As the tables below indicate, we have little reputable research on representations of sexuality, ability, age, and body size in advertising. One study analyzing advertisements from 2019 finds that only 1.8% of characters were LGBTQ+, 2.2% of characters were shown with a disability, 7.0% of characters were ages 50+, and 7.2% of characters were fat.
female characterssOurce:
2010-2019 GDIGM, Cannes Lions Film/Film Craft Advertisements
BIPOc characterssOurce:
2010-2019 GDIGM, Cannes Lions Film/Film Craft Advertisements
50%Baseline — 50.8% of us population
Baseline — 39.9% of us population
sOurce:2019 GDIGM, Cannes Lions Film/Film Craft Advertisements
1.8% Of characters in 2019 ads were lgBtQ+
2.2% Of characters in 2019 ads had adisaBility
7.0% Of characters in 2019 ads were ages 50+
7.2% Of characters in 2019 ads were fat
| 10

videogameSWhen it comes to gender representation in video games, a 2006 US study and a 2017 UK study both find that male characters vastly outnumber female characters.
White characters in video games outnumber BIPOC characters four-to-one in both the US and UK studies.
20%
30%
10%
0%
2006 Us stUDy 2017 UK stUDy
Figure 27: women video game characters
Figure 28: BIpoc video game characters
sOurces:Williams, D., Martins,
N., Consalvo, M., & Ivory, J. D. (2009).
The virtual census: Representations of
gender, race and age in video games. New Media
& Society, 11(5), 815-834.
Harrisson, A., Jones, S., Marchessault, J., Pedraça, S., & Consalvo, M. (2020). The Virtual Census 2.0: A Continued Investigation On The Representations
of Gender, Race and Age in Videogames.
AoIR Selected Papers of Internet Research, 2020.
14.8%
22.0%
50%Baseline — 50.8% of us population
40%
20%
30%
10%
0%
2006 Us stUDy 2017 UK stUDy
19.9% 19.6%
50%
40% Baseline — 39.9% of us population
female artists
BIPOc characters
sOurces:Williams, D., Martins,
N., Consalvo, M., & Ivory, J. D. (2009).
The virtual census: Representations of
gender, race and age in video games. New Media
& Society, 11(5), 815-834.
Harrisson, A., Jones, S., Marchessault, J., Pedraça, S., & Consalvo, M. (2020). The Virtual Census 2.0: A Continued Investigation On The Representations
of Gender, Race and Age in Videogames.
AoIR Selected Papers of Internet Research, 2020.
| 11

muSIcPerfOrmers Although women make up half of the US population, female artists are underrepresented on the Billboard Hot 100 chart. We’ve seen no progress from 2012 to 2020 toward better gender representations.
BIPOC musical artists have seen equitable representations on the Billboard Hot 100 chart for the majority of the past decade. Furthermore, BIPOC in the top Billboard hits have increased in the past decade.
Figure 29: women Artists in top 100 Chart, 2012-2020
40%
20%
30%
10%
0%
2012 2013 2014 2015 2016 2017 2018 2019 2020
female artists
sOurce:2012-2020 USC Annenberg,
Billboard Hot 100 Year-End Chart
50%Baseline — 50.8% of us population
Figure 30: BIPoc Artists in top 100 Chart, 2012-2020
50%
20%
30%
10%
0%
2012 2013 2014 2015 2016 2017 2018 2019 2020
sOurce:2012-2020 USC Annenberg,
Billboard Hot 100 Year-End ChartBIPOc artists
60%
40%
Baseline — 39.9% of us population
| 12
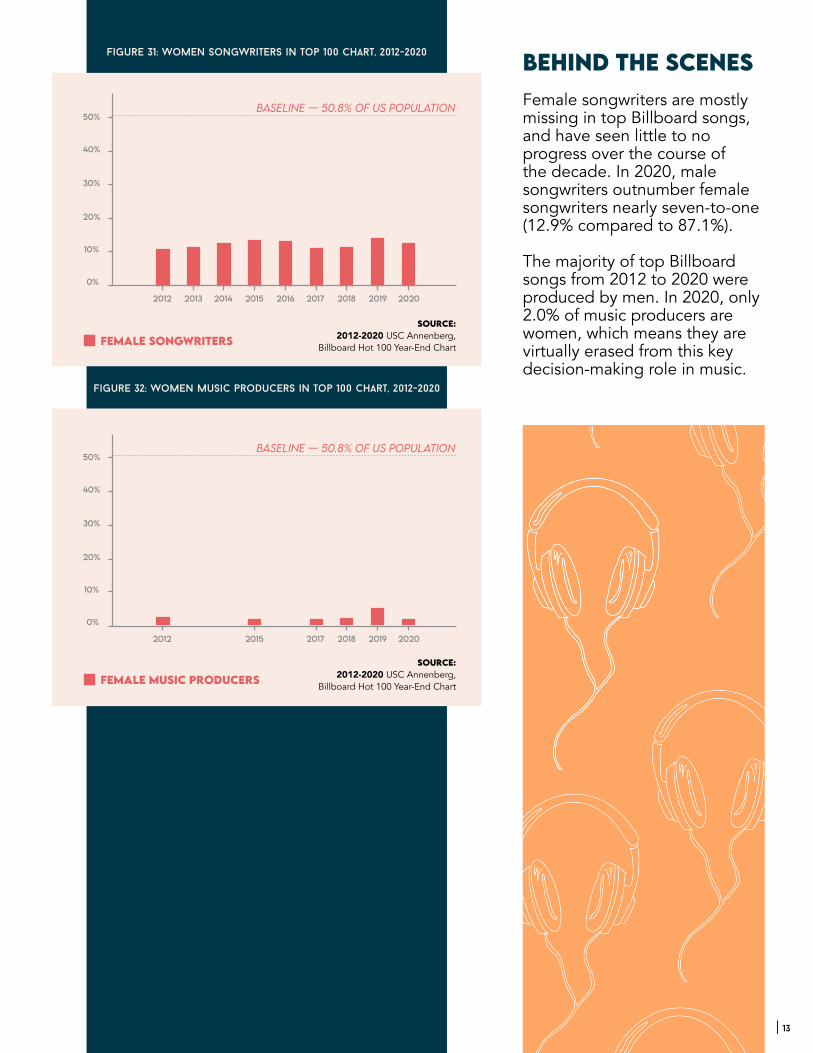
Figure 31: women Songwriters in top 100 Chart, 2012-2020 Behind the scenesFemale songwriters are mostly missing in top Billboard songs, and have seen little to no progress over the course of the decade. In 2020, male songwriters outnumber female songwriters nearly seven-to-one (12.9% compared to 87.1%).
The majority of top Billboard songs from 2012 to 2020 were produced by men. In 2020, only 2.0% of music producers are women, which means they are virtually erased from this key decision-making role in music.
40%
20%
30%
10%
0%
2012 2015 2017 2018 2019 2020
sOurce:2012-2020 USC Annenberg,
Billboard Hot 100 Year-End Chart
40%
20%
30%
10%
0%
2012 2013 2014 2015 2016 2017 2018 2019 2020
female sOngwriters
sOurce:2012-2020 USC Annenberg,
Billboard Hot 100 Year-End Chart
female music PrOducers
50%Baseline — 50.8% of us population
50%Baseline — 50.8% of us population
Figure 26: female music producers in top 100 Chart, 2012-2020
Figure 32: women music producers in top 100 Chart, 2012-2020
| 13

2021 | 14
6.
5.
4.
3.
2.
action StepSPanelists and participants from the 2021 State of Media Summit came up with the following action steps to improve media representations:
pAss LeGisLAtion At the feDerAL LeveL to ADDress persistent DiscriMinAtion in entertAinMent MeDiA hirinG prActices.
IMpLeMent tAx creDits to encoUrAGe the hirinG of More Diverse content creAtors.
creAte A consUMer ActivisM cAMpAiGn to hoLD MeDiA coMpAnies AccoUntAbLe for their LAcK of Diversity.
LitiGAte to hoLD MeDiA coMpAnies AccoUntAbLe for DiscriMinAtory hirinG AnD project seLection prActices.
DeveLop neW finAncinG netWorKs to sUpport Diverse content creAtors.
DeveLop A pUbLic cAMpAiGn to rAise AWAreness AboUt the LAcK of Diversity in entertAinMent MeDiA.
1.