The Remodeling Market - Builders' Show Remodeling Market International Builders Show January 21,...
41
The Remodeling Market International Builders Show January 21, 2010 Paul Emrath VP-Survey and Housing Policy Research
Transcript of The Remodeling Market - Builders' Show Remodeling Market International Builders Show January 21,...

The Remodeling MarketInternational Builders Show January 21, 2010
Paul Emrath
VP-Survey and Housing Policy Research

Outline
• NAHB Remodeling Market Index (RMI)
• NAHB forecasts
• Legislative/regulatory developments
• Impacts of remodeling on income, jobs, taxes

Remodeling Market Index
• Quarterly survey of professional remodelers
• 400+ responses per quarter (500+ for 2009 Q4)
• Series of questions on whether conditions have improved or gotten worse since previous quarter
• Two indices:
– Current conditions (remodeler ratings of major adds &
alterations, minor adds & alterations, maintenance &
repair)
– Indicators of future activity (appointments for proposals,
calls for bids, commitments for work, backlog)

NAHB Remodeling Market Index (Seasonally Adjusted):
Current Market Conditions
0
10
20
30
40
50
60
1st Qtr. 2001
1st Qtr. 2002
1st Qtr. 2003
1st Qtr. 2004
1st Qtr. 2005
1st Qtr. 2006
1st Qtr. 2007
1st Qtr. 2008
1st Qtr. 2009
Ind
ex
better/worse line
Source: NAHB Economics and Housing Policy Group: Remodeling Market Index, Qrtly.
Survey of Remodelers.

NAHB Remodeling Market Index (Seasonally Adjusted):
Indicators of Future Activity
0
10
20
30
40
50
60
1st Qtr. 2001
1st Qtr. 2002
1st Qtr. 2003
1st Qtr. 2004
1st Qtr. 2005
1st Qtr. 2006
1st Qtr. 2007
1st Qtr. 2008
1st Qtr. 2009
Ind
ex
better/worse line
Source: NAHB Economics and Housing Policy Group: Remodeling Market Index, Qrtly.
Survey of Remodelers.

NAHB Remodeling Market Index (Seasonally Adjusted)
2009
Q1 Q2 Q3 Q4(P)
CURRENT MARKET CONDITIONS 34.5 38.1 39.8 36.4
Major Additions And Alterations ($25,000 or more) 32.7 38.2 41.9 40.0
Minor Additions And Alterations
(Less than $25,000)39.1 41.5 43.2 40.7
Maintenance and Repair 30.4 33.6 33.1 27.1
INDICATORS OF FUTURE ACTIVITY 30.0 34.2 38.7 31.4
Calls for Bids 34.2 38.8 46.5 37.5
Amount of Work Committed for next 3 months 21.8 23.3 27.5 21.9
Backlog of Remodeling Jobs 28.5 34.4 37.2 31.9
Appointments for Proposals 35.3 40.3 43.5 34.4
Source: NAHB Economics and Housing Policy Group: Remodeling Market Index, Qrtly.
Survey of Remodelers. P = Preliminary Numbers

NAHB Forecasts
• Residential Fixed Investment (RFI) a component of GDP
• Remodeling a component of RFI
• Less information available due to cutbacks at Census Bureau
– SORAR discontinued
– No maintenance and repairs
– No improvements in rental properties
• Lobbying efforts for new Census remodeling survey ongoing
• NAHB forecasts Census series, integrates into GDP forecast
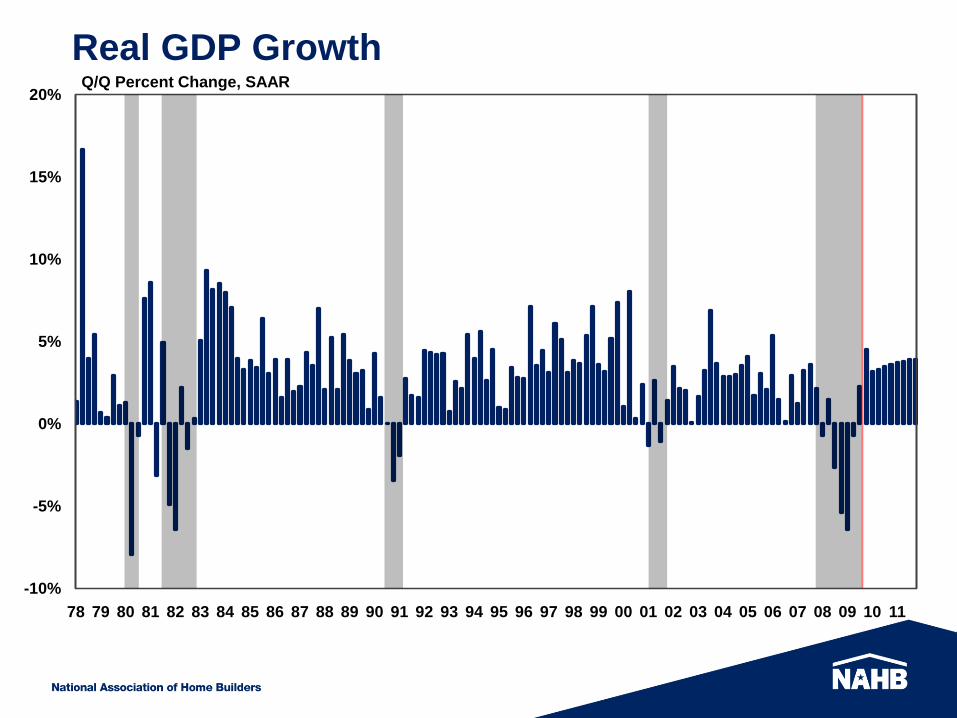
Real GDP Growth
-10%
-5%
0%
5%
10%
15%
20%
78 79 80 81 82 83 84 85 86 87 88 89 90 91 92 93 94 95 96 97 98 99 00 01 02 03 04 05 06 07 08 09 10 11
Q/Q Percent Change, SAAR

Residential Fixed Investment
0
100
200
300
400
500
600
700
800
900
78 79 80 81 82 83 84 85 86 87 88 89 90 91 92 93 94 95 96 97 98 99 00 01 02 03 04 05 06 07 08 09 10 11
Billions 2005$, SAAR

-
20
40
60
80
100
120
140
160
93 94 95 96 97 98 99 00 01 02 03 04 05 06 07 08 09 10 11
Residential Remodeling:
Owner-Occupied ImprovementsBillions 2005 $, SAAR

Influences on Remodeling Markets
• Generally weak economy
– labor markets
– consumer confidence
• Problems with home equity loans
– Values fall, equity reduced
– Sometimes made worse by faulty appraisals
– Even with equity, lenders reluctant
• Competition from builders diversifying into remodeling
• Legislative/regulatory developments
– Lead based paint
– “Green” remodeling
– Remodeling induced by Home Buyer Tax Credit

Employment Change
-8
-6
-4
-2
0
2
4
6
8
10
78 79 80 81 82 83 84 85 86 87 88 89 90 91 92 93 94 95 96 97 98 99 00 01 02 03 04 05 06 07 08 09 10 11
Q/Q Percent Change, SAAR (00,000)

Unemployment Rate
0
2
4
6
8
10
12
78 79 80 81 82 83 84 85 86 87 88 89 90 91 92 93 94 95 96 97 98 99 00 01 02 03 04 05 06 07 08 09 10 11
Percent

Consumer Confidence/Sentiment
0
20
40
60
80
100
120
140
160
78 79 80 81 82 83 84 85 86 87 88 89 90 91 92 93 94 95 96 97 98 99 00 01 02 03 04 05 06 07 08 09
Conference Board
Consumer Confidence
Index
U of Michigan
Consumer Sentiment
Index
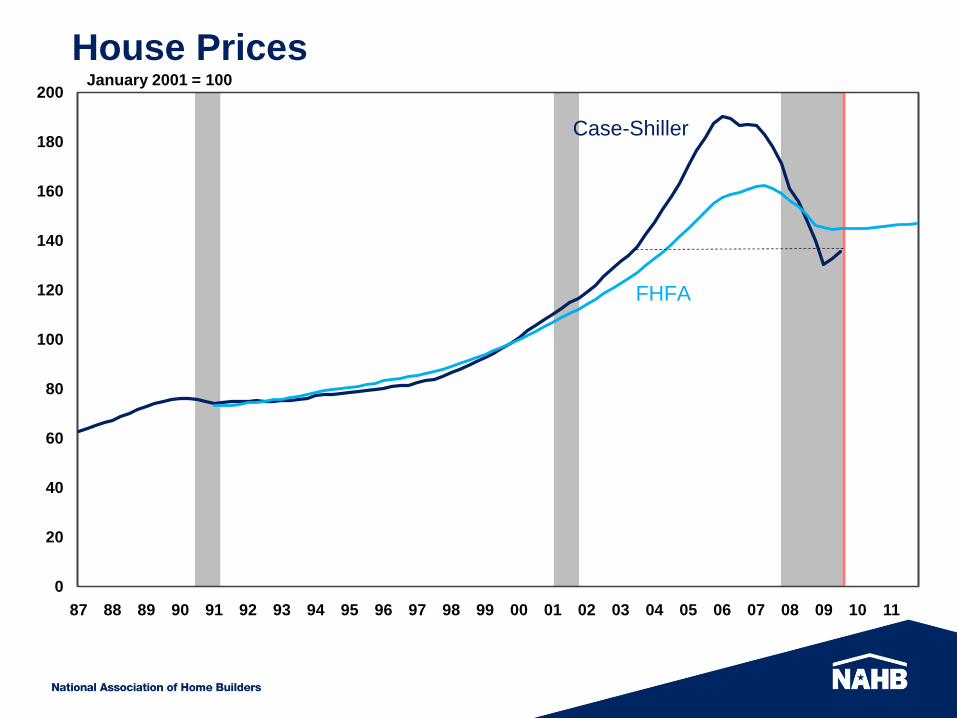
House Prices
0
20
40
60
80
100
120
140
160
180
200
87 88 89 90 91 92 93 94 95 96 97 98 99 00 01 02 03 04 05 06 07 08 09 10 11
January 2001 = 100
Case-Shiller
FHFA

3.28
2.0
2.5
3.0
3.5
4.0
4.5
5.0
90 91 92 93 94 95 96 97 98 99 00 01 02 03 04 05 06 07 08 09
Median House Price / Median Income
Avg = 3.2
House Prices Relative to Income

House Prices and Income – Trend, Peak and Current
0%
20%
40%
60%
80%
100%
120%
140%
160%
180%
200%
220%
240%
U
S
O
H
M
I
N
V
G
A
N
H
I
N
A
R
A
L
N
M
W
Y
A
Z
A
K
C
A
W
V
M
T
M
O
C
O
K
S
I
L
I
D
C
T
M
N
T
N
R
I
M
S
H
I
S
D
K
Y
N
E
N
D
F
L
O
K
M
E
S
C
I
A
U
T
T
X
V
T
D
E
N
C
P
A
M
A
L
A
V
A
W
I
W
A
O
R
D
C
N
Y
M
D
N
J
Percentage of Historical Trend
Source: US Census Bureau, National Association of Realtors
FLCANV
AZ

NAHB HMI Builder Survey:
Have you experienced appraisals…
Yes, 59%
No, 41%
Below sales price? Below cost?
Yes , 56%
No, 44%
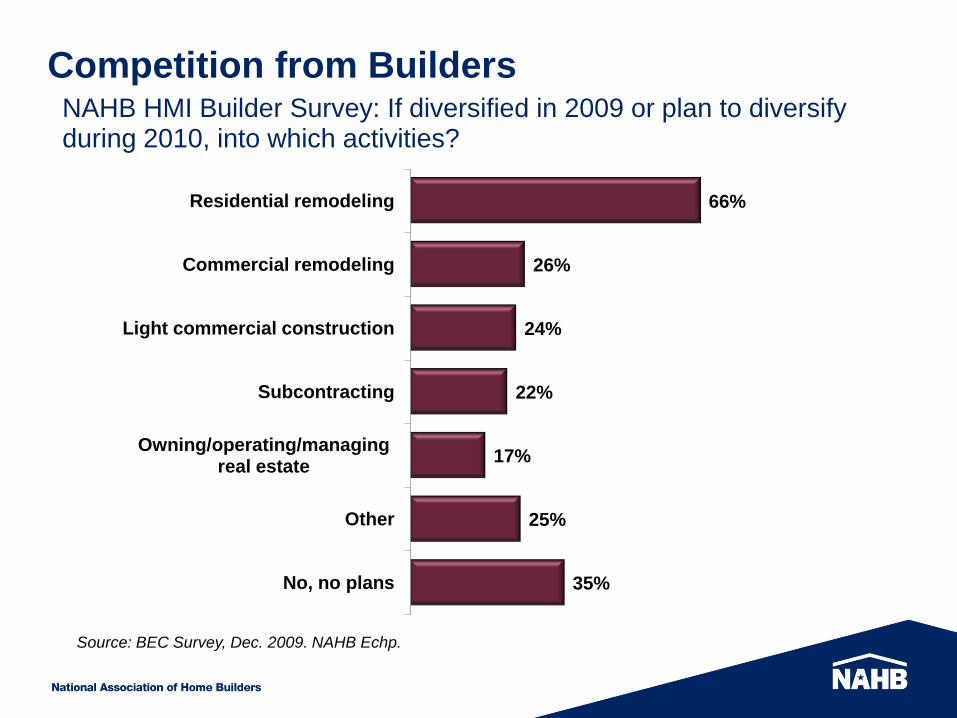
Competition from Builders
Survey of Builders: If diversified in 2009 or plan to diversify during in 2010, into which activities?
35%
25%
17%
22%
24%
26%
66%
No, no plans
Other
Owning/operating/managing real estate
Subcontracting
Light commercial construction
Commercial remodeling
Residential remodeling
Source: BEC Survey, Dec. 2009. NAHB Echp.
Survey of Builders: If diversified in 2009 or plan to diversify during in 2010, into which activities?
Source: BEC Survey, Dec. 2009. NAHB Echp.
NAHB HMI Builder Survey: If diversified in 2009 or plan to diversify during 2010, into which activities?
Source: BEC Survey, Dec. 2009. NAHB Echp.
Source: BEC Survey, Dec. 2009. NAHB Echp.
Source: BEC Survey, Dec. 2009. NAHB Echp.

Lead Based Paint Regulation
• Rule will take effect on April 22, 2010
• As first proposed, mandated lead-safe work practices in pre-1978 homes with pregnant women or children
– work area containment
– prohibited practices
– waste disposal
– clean-up
• In October, EPA proposed extension to cover all pre-1978 housing, irrespective of occupants
• Cost of compliance could discourage home owners from hiring professional remodelers

Professional Remodeling JobsAnd Units Targeted by Lead Paint Regulation
Source: NAHB tabulations of data from the 2007 American
Housing Survey, U.S. Census Bureau and HUD
69%
31%
Jobs in Units Built 1980 or Later
Jobs in Units Built Before 1980

Green Remodeling
• American Existing Home Retrofit Tax Credit (25C)
– Extended through 2010 & increased by ARRA legislation
– 30 percent of cost, up to $1,500
• Wind, Solar, Geothermal and Fuel Cell Tax Credit (25D)
– 30 percent of cost, no cap
– In effect through 2016
• Pending federal legislation (e.g., Home Star Retrofit Bill)
• State programs
• RMI survey periodically contains special green-related questions
– Most recently, Q3 2009

Calls for work to improve the energy efficiency
of the home during the last 3 months
4%
5%
61%
25%
5%
0% 10% 20% 30% 40% 50% 60% 70%
Decreased significantly
Decreased somewhat
No change
Increased somewhat
Increased significantly
Source: Remodelers Market Index Special Questions, 3rd Qtr. 2009, NAHB EcHp.

Calls for work to improve the energy efficiency
of the home during the last 3 months - HISTORY
Source: Remodelers Market Index Special Questions, 3rd Qtr. 2009, NAHB EcHp.
2009 2008 2006 2005
3rd
Quarter
3rd
Quarter
3rd
Quarter
4th
Quarter
Increased Significantly 5% 5% 2% 3%
Increased Somewhat 25 21 22 21
No Change 61 60 70 69
Decreased Somewhat 5 4 2 2
Decreased Significantly 4 10 4 5
Responses 409 497 393 416
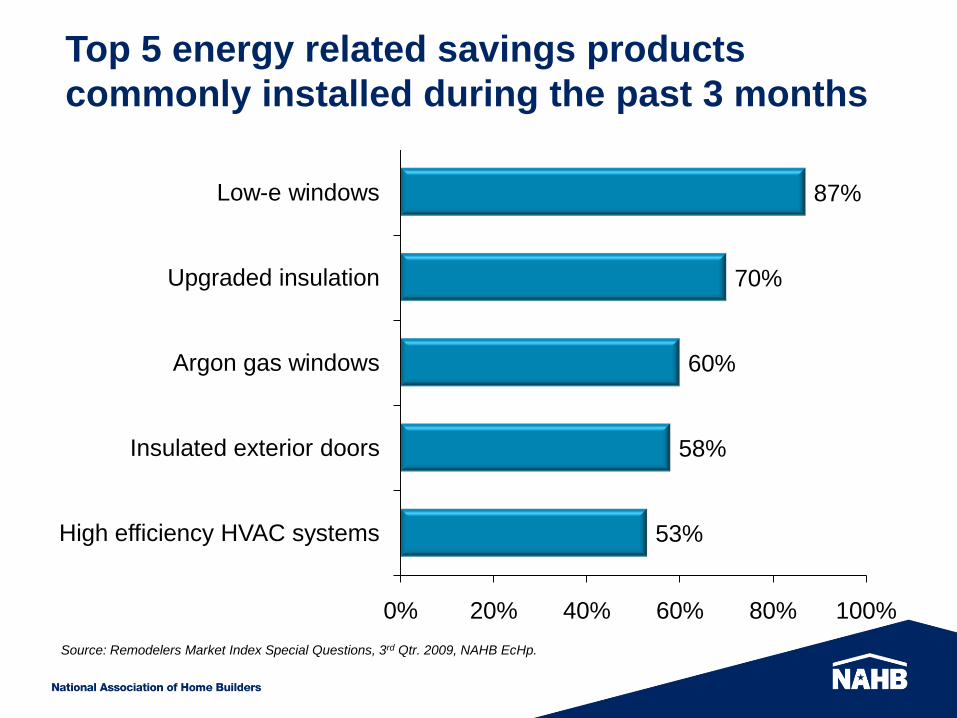
Top 5 energy related savings products
commonly installed during the past 3 months
53%
58%
60%
70%
87%
0% 20% 40% 60% 80% 100%
High efficiency HVAC systems
Insulated exterior doors
Argon gas windows
Upgraded insulation
Low-e windows
Source: Remodelers Market Index Special Questions, 3rd Qtr. 2009, NAHB EcHp.

Top energy related savings materials and
products– Increase in use from 2001
34%
49%
25%
13%
43%
60%
39%
33%
0% 20% 40% 60% 80%
High efficiency kitchen appliances
Argon gas windows
UV coated windows
On demand water heaters
2009 2001
Source: Remodelers Market Index Special Questions, 3rd Qtr. 2009, NAHB EcHp.

Green Practices Adopted by Remodelers
5%
51%
61%
70%
78%
83%
86%
91%
94%
0% 20% 40% 60% 80% 100%
Other
Waste management system
Use water sense fixtures and/or toilets
Use recycled and recyclable products
Use OSB rather than plywood
Use alternative to dimensional lumber
Use energy star appliances
Use energy efficient windows
Use material/products easily available
Source: Remodelers Market Index Special Questions, 3rd Qtr. 2009, NAHB EcHp.

Percent of jobs completed in 2009 using the
federal 25C & 25D energy efficiency tax credits
2%
3%
10%
45%
40%
0% 10% 20% 30% 40% 50%
75% or more
50% to 74%
25% to 49%
1 % to 24%
0%
Median = 5%
Source: Remodelers Market Index Special Questions, 3rd Qtr. 2009, NAHB EcHp.

Home Buyer Tax Credit
• $8,000 credit for first-time buyers expired after Nov 2009
• Worker, Homeownership, and Business Assistance Act
– Extended credit through sales contracts signed by April 30,
closed by June 30, 2010
– Relaxed income limits
– New $6,500 credit for repeat buyers
• Impact on remodeling?

Analyzing a Home Buyer Tax Credit:Buyers spend more than average on remodeling
Source: NAHB tabulations of data from the Consumer Expenditure Survey, U.S. Bureau of
Labor Statistics. See “Spending Patterns of Home Buyers”
http://www.nahb.org/generic.aspx?sectionID=734&genericContentID=106491&channelID=311
New
Home
Existing
Home
Property Alterations & Repairs:
Bathroom/ Kitchen/ Room addition $0 $127 $72
Other addition $0 $220 $117
Bathroom/Kitchen remodeling $231 $695 $325
Other interior remodeling $44 $394 $130
Painting $158 $266 $119
New fence $219 $128 $45
New drivew ay or w alk $339 $80 $51
Other outside addition or alteration $1,377 $410 $179
Total alterations and repairs $4,275 $4,642 $2,413
1st Year After
Buying HomeNon-
Moving
Ow ners
Single-Family Detached Home Owners' Average
Annual Spending on Various Items

Annual Spending on Repairs and Alterations:
Differences persist after statistically controlling for
characteristics of buyers
Source: Results of NAHB statistical model based on data from the Consumer Expenditure
Survey, U.S. Bureau of Labor Statistics. See “Spending Patterns of Home Buyers”
After Buying a
New Home If Not Moving Difference
$4,965 $4,225 $740
After Buying an
Existing Home If Not Moving Difference
$5,965 $3,955 $2,010
Typical New Home Buyer
Typical Existing Home Buyer

Source: NAHB models that estimate the “Economic Effects of a Policy to Stimulate Home Buying”
http://www.nahb.org/generic.aspx?sectionID=734&genericContentID=108465&channelID=311
Number of new first-time buyers as a result of the policy
Number of additional trade-up buyers as a result of the policy
Credit users for whom the incentive was not necessary
1. Changes in sales and acquisitions
A. Initial induced sales and acquistions 116,093 housing units
B. Ripple sales from displaced owners buying homes 63,286 housing units
C. Vacant units absorbed 26,403 housing units
D. Rented units sold to owner-occupiers 20,109 housing units
2. Net changes in new construction
A. Additional single family homes built 38,472 housing units
B. Additional multifamily condominiums built 1,411 housing units
C. Additional manufactured housing produced 2,772 housing units
D. Impact on multifamily rental production -751 housing units
E. Aggregate net change in the value of new construction $9,839 million
3. Impact of additional home transactions
A. Broker services $1,435 million
B. Transaction-related spending $945 million
C. Property alterations $124 million
D. Appliances and furnishings $180 million
E. Aggregate increase in spending $2,684 million
46,437
69,656
5,267,192
Effects of Extended Home Buyer Tax Credit
Summary of Estimated Impacts, First Year After Enactment
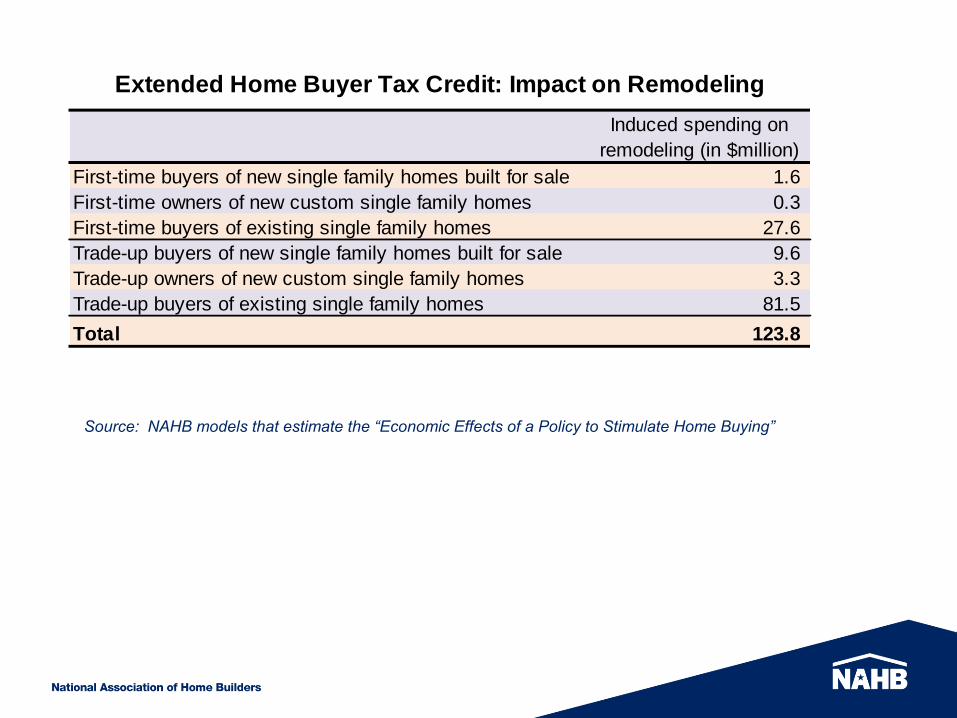
Source: NAHB models that estimate the “Economic Effects of a Policy to Stimulate Home Buying”
Induced spending on
remodeling (in $million)
First-time buyers of new single family homes built for sale 1.6
First-time owners of new custom single family homes 0.3
First-time buyers of existing single family homes 27.6
Trade-up buyers of new single family homes built for sale 9.6
Trade-up owners of new custom single family homes 3.3
Trade-up buyers of existing single family homes 81.5
Total 123.8
Extended Home Buyer Tax Credit: Impact on Remodeling

Economic Impacts of Remodeling
• NAHB has national and local impact estimates
– to avoid confusion, pick one & stick with it
• Key impacts estimated:
– income
– jobs
– taxes
• Lot of interest in jobs recently
• Information available on web site
Presentation Title 35

Presentation Title 36

Presentation Title 37

Direct Impact of Home Building and
Remodeling on the U.S. Economy
Number of
Full-time Jobs
Wages and
Salaries
Proprietors'
Income
Corporate
Profits
Total
Income
All industries 1.11 $52,709 $13,810 $16,147 $82,667
Construction 0.54 $25,573 $6,601 $4,232 $36,406
Manufacturing 0.18 $8,136 $824 $4,529 $13,489
Wholesale and retail,
Transportation and warehousing 0.16 $6,432 $849 $2,307 $9,588
Finance and insurance 0.02 $1,487 $71 $1,459 $3,017
Real estate and rental and leasing 0.01 $315 $1,652 $758 $2,725
Professional, Management,
administrative services 0.12 $6,970 $2,191 $764 $9,924
Other services 0.09 $3,797 $1,623 $2,098 $7,518
Source: NAHB estimates, based primarily on the data from the U.S. Bureau of Economic Analysis.
Table 2. Income and Employment Impacts of New Residential Construction and Remodeling
on the U.S. Economy in 2008
$100,000 Spent on Remodeling
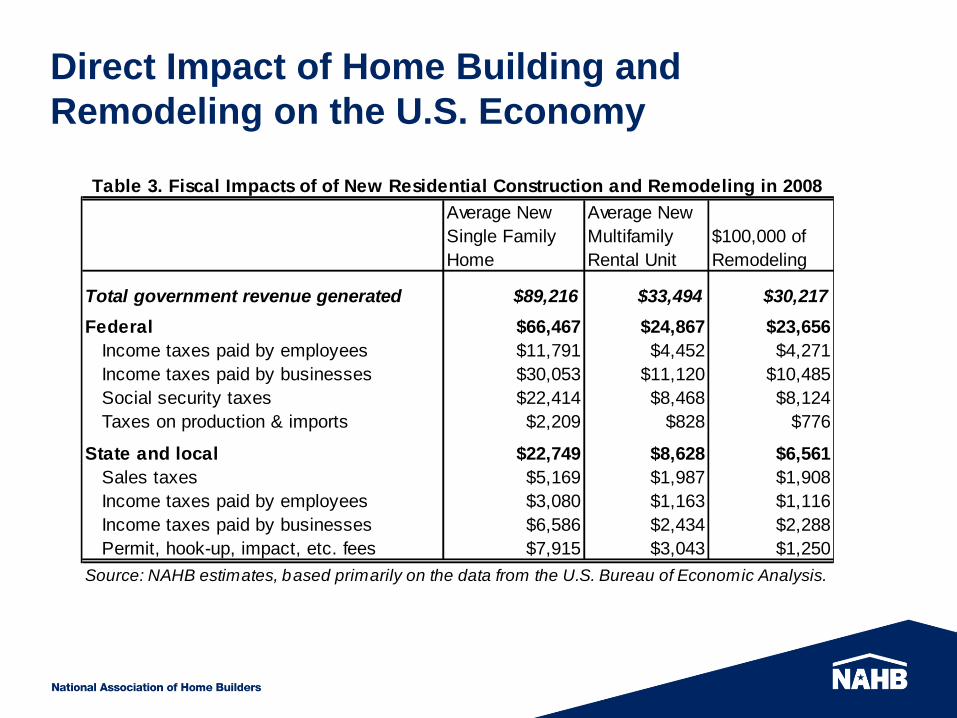
Direct Impact of Home Building and
Remodeling on the U.S. Economy
Average New
Single Family
Home
Average New
Multifamily
Rental Unit
$100,000 of
Remodeling
Total government revenue generated $89,216 $33,494 $30,217
Federal $66,467 $24,867 $23,656
Income taxes paid by employees $11,791 $4,452 $4,271
Income taxes paid by businesses $30,053 $11,120 $10,485
Social security taxes $22,414 $8,468 $8,124
Taxes on production & imports $2,209 $828 $776
State and local $22,749 $8,628 $6,561
Sales taxes $5,169 $1,987 $1,908
Income taxes paid by employees $3,080 $1,163 $1,116
Income taxes paid by businesses $6,586 $2,434 $2,288
Permit, hook-up, impact, etc. fees $7,915 $3,043 $1,250
Source: NAHB estimates, based primarily on the data from the U.S. Bureau of Economic Analysis.
Table 3. Fiscal Impacts of of New Residential Construction and Remodeling in 2008

Source: NAHB models that estimate the “Economic Effects of a Policy to Stimulate Home Buying”
Jobs and Income (in $Million) from Remodeling
Activity Induced by Extended Home Buyer Tax Credit
FTE (full time
equivalent)
workers
Wages and
Salaries
Small
Business
Persons'
income
Corporate
Profits
All industries 1,373 65.3 17.1 20.0
Agriculture, forestry, fishing and hunting 26 0.7 0.5 0.2
Mining 11 0.7 0.5 0.8
Utilities 4 0.3 0.2 0.5
Construction 663 31.7 8.2 5.2
Manufacturing 218 10.1 1.0 5.6
Wholesale trade 41 2.5 0.2 1.0
Retail trade 120 3.6 0.5 1.2
Transportation and warehousing 40 1.8 0.4 0.6
Information 13 0.9 0.3 0.8
Finance, insurance, real estate, rental, leasing 31 2.2 2.1 2.7
Professional and business services 147 8.6 2.7 0.9
Education, health care, and social assistance 1 0.0 0.0 0.0
Arts, entertainment, recreation, food services 22 0.6 0.1 0.1
Other services, except government 27 0.8 0.3 0.1
Government 10 0.6 0.0 0.0

Thank You