The Reliability of Supplies of Electricity Generated in ...q costs are negligible at low levels,...
22
Reliability of Hydroelectricity in the UK Page 1 _____________________________________________________________________ Prepared By Professor John H Gittus F R Eng. D Sc. D Tech Consultant. August 12, 2004 The Reliability of Supplies of Electricity Generated in the UK From Hydro Power. Prepared By Professor John H Gittus. F R Eng. D Sc. D Tech. Consultant. Thursday, August 12, 2004 PDF created with FinePrint pdfFactory trial version www.pdffactory.com
Transcript of The Reliability of Supplies of Electricity Generated in ...q costs are negligible at low levels,...

Reliability of Hydroelectricity in the UK Page 1 _____________________________________________________________________
Prepared By Professor John H Gittus F R Eng. D Sc. D Tech
Consultant. August 12, 2004
The Reliability of Supplies of
Electricity Generated in the UK From Hydro Power.
Prepared By
Professor John H Gittus. F R Eng. D Sc. D Tech. Consultant.
Thursday, August 12, 2004
PDF created with FinePrint pdfFactory trial version www.pdffactory.com

Reliability of Hydroelectricity in the UK Page 2 _____________________________________________________________________
Prepared By Professor John H Gittus F R Eng. D Sc. D Tech
Consultant. August 12, 2004
PROFESSOR JOHN H GITTUS. John Gittus was elected Regents’ Professor at the University of California in Los Angeles in 1990. He is Visiting Professor of Nuclear Engineering at the University of Plymouth, England. He was a Director of the United Kingdom Atomic Energy Authority (later AEA Technology) and is now a Consultant to Governments and private industry on nuclear matters world-wide. His recent clients include BNFL Plc, The UK Government’s Department of Trade and Industry, Serco Plc, The Sumitomo Corporation, the French nuclear company COGEMA, Amersham Plc the radio pharmaceutical company, Cox Insurance Plc, the world’s largest commercial insurer of nuclear risks, Chaucer Insurance Holdings and ESKOM, the South African utility. Professor Gittus is a Fellow of the Royal Academy of Engineering (Britain’s top 1,000 engineers) and has Doctor of Science degrees from the Universities of London and Stockholm. He has held over 30 patents and published over 100 papers in learned Journals describing his personal research. He invented Nimonic 115, the strongest of the early creep-resistant alloys used for the hottest turbine blades in jet engines and went on to develop a theory of creep that forms the basis of many of his papers to the Royal Society and the Philosophical Magazine. He used this theory to develop one of the world’s first computer models of nuclear fuel elements, with which he forecast that some of the fuel element designs then extant would fail as their lives were extended in a quest for cheaper power. He was able to model the failure processes and deduced remedies that have been applied throughout the world. Fuel element failures are now rare, due in part to this early work. He held a series of senior posts in the UKAEA, where he headed the late Lord Marshall’s Task Force at Harwell and produced the UK’s first nuclear-reactor Probabilistic Risk Assessment, for Sizewell B. He became Director of the R&D programme that underpinned the design details of Sizewell B, then Director of Safety and Director of Communications. He left the UKAEA to become the first Director General of the British Nuclear Industry Forum, where he helped with the restructuring of the UK nuclear industry, a process that is still going on. When his term of office there was complete he became a consultant, first to his successor and then, quickly, to other nuclear companies at home and overseas. On the death of Lord Marshall of Goring, Professor Gittus was appointed to succeed him at Cox Insurance Holdings Plc, advising on the insurance of the world’s nuclear power stations and other nuclear installations. Since January 2003 Professor Gittus and Mr Michael Dawson have led Syndicate 1176, the biggest commercial nuclear insurer in the world and Lloyds of London’s most profitable syndicate. Amongst his published papers are two communicated to the Royal Society by P.A.M. Dirac and describing Professor Gittus’s solution of a problem with the structure of matter which Dirac said he himself had been unable to solve.
PDF created with FinePrint pdfFactory trial version www.pdffactory.com

Reliability of Hydroelectricity in the UK Page 3 _____________________________________________________________________
Prepared By Professor John H Gittus F R Eng. D Sc. D Tech
Consultant. August 12, 2004
Entry From Who's Who Name GITTUS, John Henry. Awards DSc. DTech; FREng 1989. Positions Consultant, Amersham Plc, since 1999. Consultant, Cox Power Holdings, since 1997; Consultant, Serco Plc (formerly AEA Technology) since 1993; Senior Partner, NUSYS Consultants, Paris. Personal Details Born 25 July 1930; son of Henry Gittus and Amy Gittus; married 1953, Rosemary Ann Geeves; one son two daughters. Education BSc 1st Honours Mathematics London 1952; DSc Phys London 1976. DTech Metall Stockholm 1975. CEng, FIMechE, FIS, FIM.FREng Work British Cast Iron Res. Assoc., 1947-1955; Mond Nickel Co., R&D Labs, Birmingham, 1955-1960 (develt Nimonic series high temp. super alloys for aircraft gas turbine engines); United Kingdom Atomic Energy Authority, 1960-1989: Research Manager, Springfields; Head, Water Reactor fuel develt; Head, Atomic Energy Tech. Br., Harwell; Director: Water Reactor Safety Research; Safety and Reliability Directorate, Culcheth; Communication and Information; Dir Gen., British Nuclear Forum, 1990-1993. Consultant: Argonne Nat. Lab., USA, 1968; Oak Ridge Nat. Lab., 1969. Visiting Professor: Ecole Polytechnique Fédérale, Lausanne, 1976; Univ. de Nancy, 1984; Regents' Prof., UCLA, 1990-1991; Prof. of Risk Mgt, Plymouth Univ., 1997-. Editor-in-Chief, Res Mechanica, 1980-1991. Publications Uranium, 1962; Creep, Viscoelasticity and Creep-fracture in Solids, 1979; Irradiation Effects in Crystalline Solids, 1979; (with W. Crosbie) Medical Response to Effects of Ionizing Radiation, 1989; numerous articles in learned jls. Recreations Old houses, old motor cars, old friends. Address (office) 22 Buckingham Gate, SW1E 6LB. Telephone: +44 7775 898 449. Clubs Royal Society of Medicine, Institute of Directors.
PDF created with FinePrint pdfFactory trial version www.pdffactory.com

Reliability of Hydroelectricity in the UK Page 4 _____________________________________________________________________
Prepared By Professor John H Gittus F R Eng. D Sc. D Tech
Consultant. August 12, 2004
Contents.
SUMMARY..............................................................................................................6
INTRODUCTION....................................................................................................7 THE NEW RENEWABLES. .........................................................................................7
SEISMIC ACTIVITY. .............................................................................................8 The distribution of British earthquakes in time .................................................11 Seismic hazard calculations..............................................................................13 Seismic hazard results ......................................................................................15
DROUGHT.............................................................................................................19 AIRCRAFT CRASH..............................................................................................19
TERRORIST ACTION..........................................................................................19 WTC AND PENTAGON AS TWO OF THE CLASS OF “WORLD TERRORISM TARGETS”..20
ACCIDENT, MACHINERY BREAKDOWN. .....................................................20
PDF created with FinePrint pdfFactory trial version www.pdffactory.com

Reliability of Hydroelectricity in the UK Page 5 _____________________________________________________________________
Prepared By Professor John H Gittus F R Eng. D Sc. D Tech
Consultant. August 12, 2004
Figures.
FIGURE 1: SUMMARY OF FORECASTS FOR THE RELIABILITY OF UK HYDROPOWER. ......6 FIGURE 2: REGIONS OF RAISED SEISMIC INTENSITY, UK AND CONTINENT, THE DARKER
THE YELLOW COLOUR, THE MORE SEISMICALLY ACTIVE THE ZONE. .......................8 FIGURE 3: EARTHQUAKES IN THE UK AND ITS COASTAL WATERS. ................................9 FIGURE 4:THIS MAP CREATED AT TUESDAY MARCH 25 08:42:25 GMT 2003..............11 FIGURE 5: FREQUENCY OF EXCEEDANCE VERSUS UK EARTHQUAKE INTENSITY. ........12 FIGURE 6 SEISMIC HAZARD MAP OF THE UK. ............................................................15 FIGURE 7: TECTONIC MAP OF THE UK, FOR COMPARISON WITH SEISMIC HAZARD MAP.
.........................................................................................................................16 FIGURE 8: EXCEEDANCE FREQUENCY WITH WHICH UK HYDRO SCHEMES WILL SUFFER
EARTHQUAKES OF STATED INTENSITY IN 2015. ...................................................18 FIGURE 9: EFFECT OF EARTHQUAKES. .......................................................................18 FIGURE 10: INTERRUPTION OF UK HYDROELECTRICITY SUPPLIES DUE TO DROUGHT. .19 FIGURE 11: AIRCRAFT CRASH. ..................................................................................19 FIGURE 12: TERRORIST ACTION.................................................................................20 FIGURE 13: ACCIDENT, MACHINERY BREAKDOWN. ...................................................21
PDF created with FinePrint pdfFactory trial version www.pdffactory.com

Reliability of Hydroelectricity in the UK Page 6 _____________________________________________________________________
Prepared By Professor John H Gittus F R Eng. D Sc. D Tech
Consultant. August 12, 2004
Summary
Figure 1: Summary of Forecasts for the Reliability of UK Hydropower.
Source of Interruption.
Days: Duration of Consequent
Interruption Per Year:
Likelihood
MGBP Maximum Insurable Amount % of Hydro lost
Seismically induced Dam Failure permanent 0.000005 200,000,000 20
Dam failure due to aircraft crash 720 0.000005 200,000,000 20
terrorist action. 720 0.001 0 20 Drought. 30 0.03 10,000,000 50 Accident, Machinery
Breakdown. 60 0.0005 50,000,000 10
PDF created with FinePrint pdfFactory trial version www.pdffactory.com

Reliability of Hydroelectricity in the UK Page 7 _____________________________________________________________________
Prepared By Professor John H Gittus F R Eng. D Sc. D Tech
Consultant. August 12, 2004
Introduction. The New Renewables. Wind, wave-power, tidal power, solar energy are “new, renewable” sources of energy. They are intermittent, as the wind is variable, the sun does not shine at night, the sea is often calm and the tide does not come in continuously but only twice daily. Analysis for the PIU assessed the costs of intermittency on the assumption that system services required to deal with increasing levels of intermittency would be provided using electrolytic storage plants. In practice, lower cost options may be available, such as holding older plant available on stand-by. The analysis suggests that:
q costs are negligible at low levels, indeed small amounts of intermittent generation cannot be detected by the system operator. In this context we note that “the variance of the sum or difference is equal to the sum of the variances”. In the present case it is the difference between supply and demand that we are concerned with. Its variance is clearly going to be mainly dictated by the variance of demand, up to quite large levels of renewable-generation.
q costs are less than 0.1p/kWh for 10% of electricity from intermittents q costs are less than 0.2 p/kWh for 20% of electricity from intermittents.
The analysis also suggests that at large penetrations (45% or more of peak demand) costs of intermittency could rise to 0.3p/kWh or more. However, as such high penetrations are unlikely to be reached for many years, such costs are very uncertain. The PIU concluded that:
q The addition of another 0.5GWe to the existing 1.5 GWe of Hydro is possible.
q Wind energy, photo-voltaics and biomass have good short/medium term prospects.
q Of these wind energy has the most potential and is already being well developed and tested on a world scale, over 14,000MW world wide, including some 9000MW in Europe, and doubling every 3 years.
In 2020, in the UK, wind generators will provide most of the “renewable” energy. On average wind generators supply 30% of their rated capacity. In general, winds exceeding 5 m/s (11 mph) are required for cost-effective application of small grid-connected wind machines, while wind-farms require wind speeds of 6 m/s (13 mph).1. What, though of the variability and reliability of Hydroelectricity? This Report answers that question. 1 American Wind Association,
PDF created with FinePrint pdfFactory trial version www.pdffactory.com

Reliability of Hydroelectricity in the UK Page 8 _____________________________________________________________________
Prepared By Professor John H Gittus F R Eng. D Sc. D Tech
Consultant. August 12, 2004
Seismic Activity. Figure 2 shows that it is in or near to the more mountainous regions of the UK that seismic activity is most pronounced. Significantly it is in these areas that the hydro schemes are located, most of them in Scotland. Figure 2: Regions of Raised Seismic Intensity, UK and Continent, The darker the yellow colour, the more seismically active the zone.
PDF created with FinePrint pdfFactory trial version www.pdffactory.com

Reliability of Hydroelectricity in the UK Page 9 _____________________________________________________________________
Prepared By Professor John H Gittus F R Eng. D Sc. D Tech
Consultant. August 12, 2004
Figure 3: Earthquakes in the UK and its coastal waters.
The spatial distribution of earthquakes in the UK is neither uniform nor random. For example, in Scotland most earthquakes are concentrated on the west coast, between Ullapool and Dunoon, with the addition of centres of activity near the Great Glen at Inverness and Glen Spean, and a small area around Comrie, Perthshire, and extending south to Stirling and Glasgow. The Outer Hebrides, the extreme north and most of the east of Scotland are virtually devoid of earthquakes. For the north-west of Scotland the absence of early written records, the small population, and the recent lack of recording instruments means that there may be a data gap in the context of an apparent event in 1925, possibly near Ullapool, with magnitude probably about 3½ ML, for which there are no first-hand reports. However, many other parts of Scotland, especially south of the Highland line, are quite well-documented, at least since 1600, and therefore the lack of earthquakes is genuine. Further south a similar irregularity is seen. If one draws a quadrilateral from Penzance to Holyhead to Carlisle to Doncaster, most English and Welsh earthquakes will be included within it. The northeast of England seems to be very quiet; almost aseismic. The southeast has a higher rate of activity, with a number of earthquakes which seem to be "one-off" occurrences. The most notable example of these is the 1884 Colchester earthquake, a magnitude 4.6 ML event which was the most damaging British earthquake in at least the last 400 years, and yet which occurred in an area
PDF created with FinePrint pdfFactory trial version www.pdffactory.com

Reliability of Hydroelectricity in the UK Page 10 _____________________________________________________________________
Prepared By Professor John H Gittus F R Eng. D Sc. D Tech
Consultant. August 12, 2004
(Essex) otherwise more or less devoid of earthquakes from the earliest historical period up to the present day (Musson et al 1990). There are also important centres of activity near Chichester and Dover. The former produced a swarm-like series of small, high-intensity earthquakes in the 1830s and was active again in 1963 and 1970. The whole of Ireland is practically free of earthquakes. This is clearly a real phenomenon and not a product of reporting - as Ware, as early as the 17th century, remarks in describing an earthquake (probably Welsh) felt in Dublin in 1534, "... qui casus adeo rarus est in Hibernia, ut quando contingit, inter prodigia habeatur" [loosely, which is such a rare thing in Ireland that when it happens it is considered a wonder]. Certain centres can be identified as showing typical patterns of activity. For example, the Caernarvon area of north-west Wales is one of the most seismically active places in the whole UK. Both large and small earthquakes, usually accompanied by many aftershocks, occur at regular intervals. The most recent of these larger events was the earthquake of 19 July 1984 (5.4 ML), which was one of the largest ever UK earthquakes to have an epicentre on land and had a very protracted aftershock sequence. Two further felt earthquakes have occurred there since, on 29 July 1992 (3.5 ML) and 10 February 1994 (2.9 ML). It is tempting to ascribe several early earthquakes of unknown epicentre (eg that of 20 February 1247) to this area just because it seems to be such a favoured site for large earthquakes. In South Wales, on the other hand, although a line of epicentres of significant events can be traced from Pembroke (an earthquake in 1892) to Newport (active in 1974), only the Swansea area shows consistent recurrence, with significant earthquakes occurring in 1727, 1775, 1832, 1868 and 1906. (Given this periodicity it may be that a further earthquake in this area is due in the near future.) The Hereford-Shropshire area has also produced large earthquakes in 1863, 1896, 1926 and 1990, but none of these share a common epicentre. In the north of England seismic activity occurs over a more or less continuous area from Leicester to Carlisle. The most prominent centres of repeating activity here are the upper end of Wensleydale (with significant earthquakes in 1768, 1780, 1871, 1933 and 1970) and to a lesser extent the Skipton area. What is remarkable is the lack of correlation between this pattern and the structural geology of the UK. The boundaries between areas of moderate or high seismicity and areas of very low seismicity do not correspond to any major structural feature; for instance the sharp dividing line running SE from Inverness. And the major boundaries are not clearly reflected in the pattern of seismicity either as dividing lines between zones of differing rates of seismicity nor as lineations marked by earthquakes. It seems likely that the pattern of seismicity may be influenced by the distribution of ice during the last glaciation - certainly for Scotland this appears to be the case.
PDF created with FinePrint pdfFactory trial version www.pdffactory.com
Reliability of Hydroelectricity in the UK Page 11 _____________________________________________________________________
Prepared By Professor John H Gittus F R Eng. D Sc. D Tech
Consultant. August 12, 2004
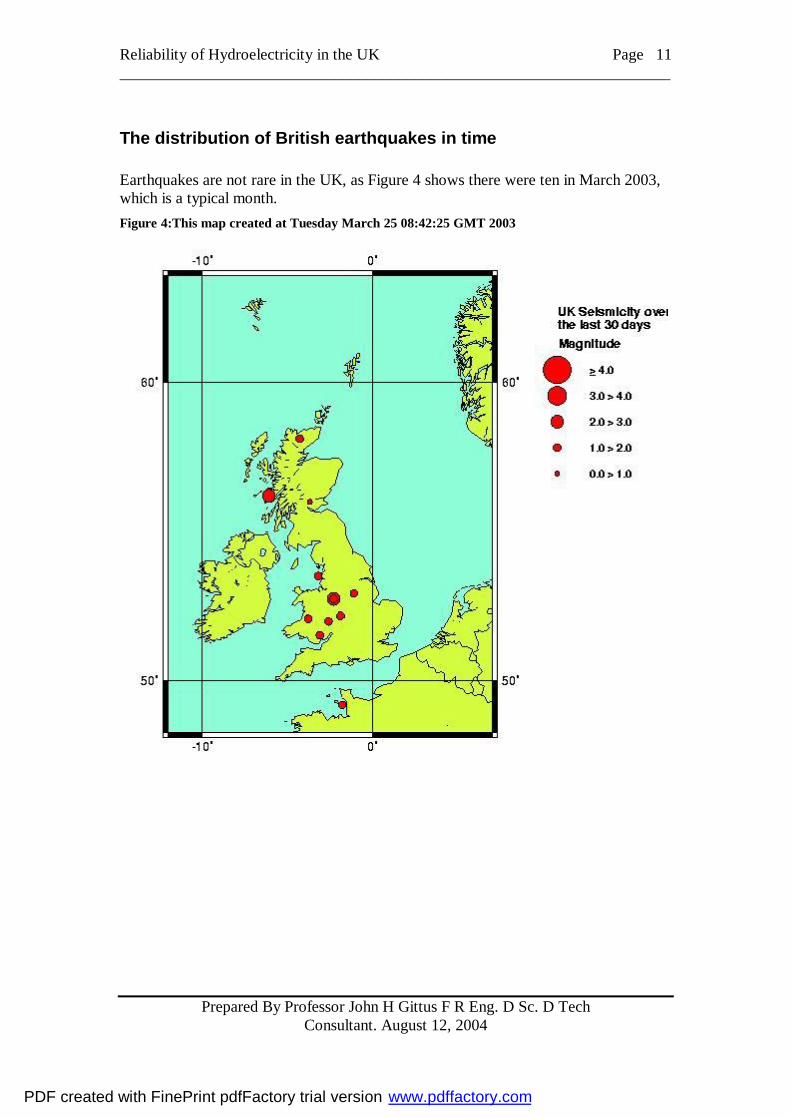
The distribution of British earthquakes in time Earthquakes are not rare in the UK, as Figure 4 shows there were ten in March 2003, which is a typical month. Figure 4:This map created at Tuesday March 25 08:42:25 GMT 2003
PDF created with FinePrint pdfFactory trial version www.pdffactory.com

Reliability of Hydroelectricity in the UK Page 12 _____________________________________________________________________
Prepared By Professor John H Gittus F R Eng. D Sc. D Tech
Consultant. August 12, 2004
Figure 5: Frequency of Exceedance Versus UK Earthquake Intensity.
It has long been realised that larger earthquakes occur less frequently than smaller earthquakes, the relationship being exponential, i.e. roughly ten times as many earthquakes larger than 4 ML occur in a particular time period than earthquakes larger than magnitude 5 ML. This can be expressed by the Gutenberg-Richter formula
log N = a - b M
where N is the number of earthquakes per year exceeding a given magnitude M. The constant a reflects the absolute level of seismicity in an area, and the value of b has generally been found to be consistently close to 1.0. This holds true for the UK for the area 10o W to 2o E and 49o N to 59o N. This deliberately excludes the northern North Sea area that is of high seismicity and completely under-represented in the catalogue before 1970 because of the
PDF created with FinePrint pdfFactory trial version www.pdffactory.com

Reliability of Hydroelectricity in the UK Page 13 _____________________________________________________________________
Prepared By Professor John H Gittus F R Eng. D Sc. D Tech
Consultant. August 12, 2004
impossibility of detecting smaller events in this area before that date. A least-squares regression to the UK data of Figure 5 gives the relationship
log N = 3.82 - 1.03 M
One can therefore draw the following conclusions about average recurrence - the UK may expect:
• an earthquake of 3.7 ML or larger every 1 year • an earthquake of 4.7 ML or larger every 10 years • an earthquake of 5.6 ML or larger every 100 years.
Seismic hazard calculations Seismic hazard calculations in regions of low seismicity, such as the UK, are generally based on probabilistic methodology. Probabilistic seismic hazard assessment (PSHA) uses a combination of interpreted geological and seismological data to calculate the probability that a certain level of ground motion will be exceeded, or not exceeded, in a given period of time. This methodology can be divided into three principal components as follows: (i) Definition of a set of seismic source zones which define the geographical variation of earthquake activity. These source zones are based on the distribution of observed seismic activity together with geological and tectonic factors and represent areas where the seismicity is assumed to be homogenous; i.e. there is an equal chance that a given earthquake will occur at any point in the zone. (ii) An understanding of earthquake recurrence with respect to earthquake magnitude, as described above. iii) An attenuation relationship is required which defines what ground motion should be expected at Location A due to an earthquake of known magnitude at Location B. The rate at which the strength of shaking decreases with distance from an earthquake's epicentre varies regionally and has to be calculated or estimated. Peak ground acceleration (pga) is the measure of earthquake shaking most used by engineers in this country. However, it has two disadvantages - firstly, the attenuation of pga in the UK is very poorly known, and secondly, pga is actually not a particularly good measure of the actual expectation of damage. A useful alternative is intensity, which is an expression of ground shaking in terms of its effects. The attenuation of intensity in the UK is very well documented, and intensity is directly proportional to damage, making it a very meaningful parameter. The intensity attenuation model used here is expressed by the formula
PDF created with FinePrint pdfFactory trial version www.pdffactory.com

Reliability of Hydroelectricity in the UK Page 14 _____________________________________________________________________
Prepared By Professor John H Gittus F R Eng. D Sc. D Tech
Consultant. August 12, 2004
I = 3.32 + 1.44 ML - 3.34 log R
where ML is local magnitude and R is hypocentral distance in kilometres. The data that I have used to produce this formula are found in Musson 2 . Seismic hazard studies in the UK in the past have been mostly single-site studies for particular installations. The first attempt to look at hazard for the UK as a whole using the PSHA methodology was conducted by Ove Arup around 1991. This study calculated hazard at eleven representative sites in the UK. Following this, a study to produce contour maps of UK seismic hazard was commissioned by the Department of Trade and Industry. In this study the computer code SUNMIC was used, which allows a "logic tree" model to be applied to the hazard, by which uncertainty in input parameters can be modelled by the inclusion of multiple choices each with a weighting value). One of the innovations used in this study was the approach taken to source zone modelling. If several significantly different source zone models are included in a logic tree model without regard for their combined effect, the result tends to be that the conflicting source zones smear one another out into a semi-uniform distribution of hazard; meaningfulness is lost. In this study, two mutually supportive zone models were constructed; one consisted of relatively broad zones based chiefly on the general regional trends observed in the seismicity data. The second consisted of much smaller zones closely placed around sites of known large earthquakes, the size of these zones being roughly related to the degree of uncertainty in the epicentral location. The result of the combination of these two models was a hazard map in which the general areas where earthquakes might be expected to occur would have higher hazard, but within these, spots where such earthquakes had occurred in the past were picked out as having locally higher hazard values.
2 Musson, R.M.W., 1994a. A catalogue of British earthquakes, BGS Technical Report No WL/94/04.
PDF created with FinePrint pdfFactory trial version www.pdffactory.com

Reliability of Hydroelectricity in the UK Page 15 _____________________________________________________________________
Prepared By Professor John H Gittus F R Eng. D Sc. D Tech
Consultant. August 12, 2004
Seismic hazard results
Figure 6 Seismic Hazard Map of the UK.
PDF created with FinePrint pdfFactory trial version www.pdffactory.com

Reliability of Hydroelectricity in the UK Page 16 _____________________________________________________________________
Prepared By Professor John H Gittus F R Eng. D Sc. D Tech
Consultant. August 12, 2004
Figure 7: Tectonic Map of the UK, for comparison with Seismic Hazard Map.
A sample hazard map of the UK is shown in Figure 6.
PDF created with FinePrint pdfFactory trial version www.pdffactory.com

Reliability of Hydroelectricity in the UK Page 17 _____________________________________________________________________
Prepared By Professor John H Gittus F R Eng. D Sc. D Tech
Consultant. August 12, 2004
The map shows intensities that are 90% likely not to be exceeded in 50 years - equivalent to a return period of 475 years. As might be expected, the areas of highest hazard parallel the areas where earthquakes have been most common in the past, but particularly those places where repeated earthquake activity has been highly localised - this localisation has a pronounced effect on the hazard calculations compared to areas where the seismicity, while high, is more diffuse and less repetitive. The zones where hazard is higher than average encompass the W Highlands of Scotland, an arc running from Carlisle to Pembroke, NW Wales and W Cornwall. The places in the UK with lowest seismic hazard are Northern Ireland (especially the western counties) and outlying parts of Scotland, including the Orkneys and Outer Hebrides. The actual values of hazard are not particularly high, since the predicted intensity for the higher zones is only 6 EMS. In other words, even in areas of relatively high exposure to earthquakes in the UK, if a dam or other facility has a life of 50 years there is only a 10% chance that it will experience shaking equivalent to intensity 6. Moving briefly from hazard to risk, if we take as a guideline that probably less than 5% of buildings of normal construction (e.g. conventional brick houses) will be damaged in a place when the intensity there is 6, the probability of damage for a single house in 50 years is therefore less than 0.5%. The indices so arrived at are shown in Figure 9: Effect of Earthquakes. and the Exceedance frequency with which windfarms will suffer earthquakes of various intensities, in 2015, is shown in Figure 8.
PDF created with FinePrint pdfFactory trial version www.pdffactory.com

Reliability of Hydroelectricity in the UK Page 18 _____________________________________________________________________
Prepared By Professor John H Gittus F R Eng. D Sc. D Tech
Consultant. August 12, 2004
Figure 8: Exceedance Frequency with which UK Hydro Schemes will suffer earthquakes of stated intensity in 2015.
Frequency, per year, with which UK Hydro Schemes will suffer Earthquakes of stated
intensity.
1.00E-071.00E-061.00E-051.00E-041.00E-031.00E-021.00E-011.00E+001.00E+011.00E+02
0 2 4 6 8 10
Intensity of earthquake.
Exce
edan
ce fr
eque
ncy,
per
ye
ar.
Figure 9: Effect of Earthquakes.
Source of Interruption.
Days: Duration of Consequent
Interruption Per Year:
Likelihood
MGBP Maximum Insurable Amount % of Hydro lost
Seismically induced Dam Failure Permanent 0.000005 200,000,000 20
PDF created with FinePrint pdfFactory trial version www.pdffactory.com

Reliability of Hydroelectricity in the UK Page 19 _____________________________________________________________________
Prepared By Professor John H Gittus F R Eng. D Sc. D Tech
Consultant. August 12, 2004
Drought. The first and most obvious factor is the effect of drought: if it doesn’t rain then eventually the water that has collected behind dams will all run away through the turbines and electricity generation will cease. Statistics reveal the following: Figure 10: Interruption of UK Hydroelectricity Supplies due to Drought.
Source of Interruption.
Days: Duration of Consequent
Interruption Per Year:
Likelihood
MGBP Maximum Insurable Amount
% of Hydro lost
Drought. 30 0.03 10,000,000 50
Aircraft Crash. The case analyzed is one in which an F111 fighter aircraft strikes the dam face near the top, where dam is thinnest, at 500 mph. The engine mainshaft cracks the dam, water pressure causes the crack to propagate leading to major leakage. The methodology used for aircraft crash analysis of nuclear power stations indicates that the probability of such an aircraft crashing into a dam is of order one in a million per year, in the UK. Taking the five largest schemes, therefore, we arrive at the following forecast: Figure 11: Aircraft Crash.
Source of Interruption.
Days: Duration of Consequent
Interruption Per Year:
Likelihood
MGBP Maximum Insurable Amount
% of Hydro lost
Dam failure due to aircraft crash 720 0.000005 200,000,000 20
Terrorist Action. I have recently forecast, under two contracts to the DTI, the frequency and consequences of terrorist attacks on UK nuclear power reactors and the other UK nuclear installations.
PDF created with FinePrint pdfFactory trial version www.pdffactory.com

Reliability of Hydroelectricity in the UK Page 20 _____________________________________________________________________
Prepared By Professor John H Gittus F R Eng. D Sc. D Tech
Consultant. August 12, 2004
The first of these two Reports dealt with the situation immediately after the attack on the World Trade Centre. The second Report added an additional risk, due to the possibility that the (then imminent) war on Iraq would spark terrorist attacks on our nuclear installations.
WTC and Pentagon as Two of the Class of “World Terrorism Targets” The WTC and the Pentagon, together with the White House, which latter was a probable target for the fourth Jumbo on September 11th, are in a class that I have termed “World Terrorism Targets”. The terrorists said as much. They said that the WTC was the symbol of US Capitalism and the Pentagon was the symbol of US Militarism. No doubt the White House would have been described as the symbol of US Political Dominance of the World had it been struck by the fourth Jumbo. Some, but not all of the world’s hydro schemes come in this class: the Hoover Dam is an obvious case, since the name is known throughout the world and its failure is in fact precisely the kind of disaster that terrorists would seek to produce by an explosion, air strike or some other means. It is clear that the small hydro schemes in the UK are not on this list of World Terrorism Targets: some famous buildings in London may qualify, as may some UK nuclear installations, but unknown Scottish hydro-schemes do not since they have absolutely no publicity value on the international stage. That said, there remains the possibility of an attack by UK terrorists, such as groups from Northern Ireland. This seems possible but very unlikely, a view that I have reflected in the following Figure 12. Figure 12: Terrorist Action.
Source of Interruption.
Days: Duration of Consequent
Interruption Per Year:
Likelihood
MGBP Maximum Insurable Amount % of Hydro lost
terrorist action. 720 0.001 0 20
Accident, Machinery Breakdown. The machinery used in hydro schemes is very robust. Nevertheless there are records of failures, some of them due to “loose parts”, which become detached up stream and damage the rotating machinery. The following estimate is based on statistics from Scottish Hydro records and other hydro experience:
PDF created with FinePrint pdfFactory trial version www.pdffactory.com

Reliability of Hydroelectricity in the UK Page 21 _____________________________________________________________________
Prepared By Professor John H Gittus F R Eng. D Sc. D Tech
Consultant. August 12, 2004
Figure 13: Accident, Machinery Breakdown.
Source of Interruption.
Days: Duration of Consequent
Interruption Per Year:
Likelihood
MGBP Maximum Insurable Amount % of Hydro lost
Accident, Machinery Breakdown. 60 0.0005 50,000,000 10
PDF created with FinePrint pdfFactory trial version www.pdffactory.com

Reliability of Hydroelectricity in the UK Page 22 _____________________________________________________________________
Prepared By Professor John H Gittus F R Eng. D Sc. D Tech
Consultant. August 12, 2004
PDF created with FinePrint pdfFactory trial version www.pdffactory.com